Fannett, TX Map & Demographics
Fannett Map
Fannett Overview
$43,253
PER CAPITA INCOME
$115,625
AVG FAMILY INCOME
$80,238
AVG HOUSEHOLD INCOME
5.9%
WAGE / INCOME GAP [ % ]
94.1¢/ $1
WAGE / INCOME GAP [ $ ]
0.46
INEQUALITY / GINI INDEX
1,667
TOTAL POPULATION
900
MALE POPULATION
767
FEMALE POPULATION
117.34
MALES / 100 FEMALES
85.22
FEMALES / 100 MALES
48.2
MEDIAN AGE
2.8
AVG FAMILY SIZE
2.2
AVG HOUSEHOLD SIZE
740
LABOR FORCE [ PEOPLE ]
50.4%
PERCENT IN LABOR FORCE
0.7%
UNEMPLOYMENT RATE
Income in Fannett
Income Overview in Fannett
Per Capita Income in Fannett is $43,253, while median incomes of families and households are $115,625 and $80,238 respectively.
| Characteristic | Number | Measure |
| Per Capita Income | 1,667 | $43,253 |
| Median Family Income | 493 | $115,625 |
| Mean Family Income | 493 | $124,667 |
| Median Household Income | 740 | $80,238 |
| Mean Household Income | 740 | $95,512 |
| Income Deficit | 493 | $0 |
| Wage / Income Gap (%) | 1,667 | 5.86% |
| Wage / Income Gap ($) | 1,667 | 94.14¢ per $1 |
| Gini / Inequality Index | 1,667 | 0.46 |
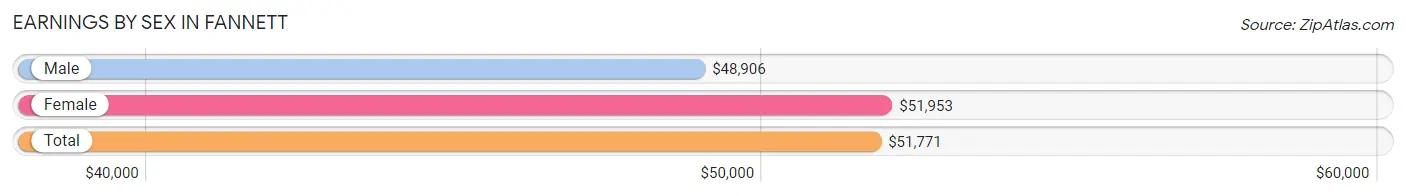
Earnings by Sex in Fannett
Average Earnings in Fannett are $51,771, $48,906 for men and $51,953 for women, a difference of 5.9%.
| Sex | Number | Average Earnings |
| Male | 541 (68.0%) | $48,906 |
| Female | 255 (32.0%) | $51,953 |
| Total | 796 (100.0%) | $51,771 |
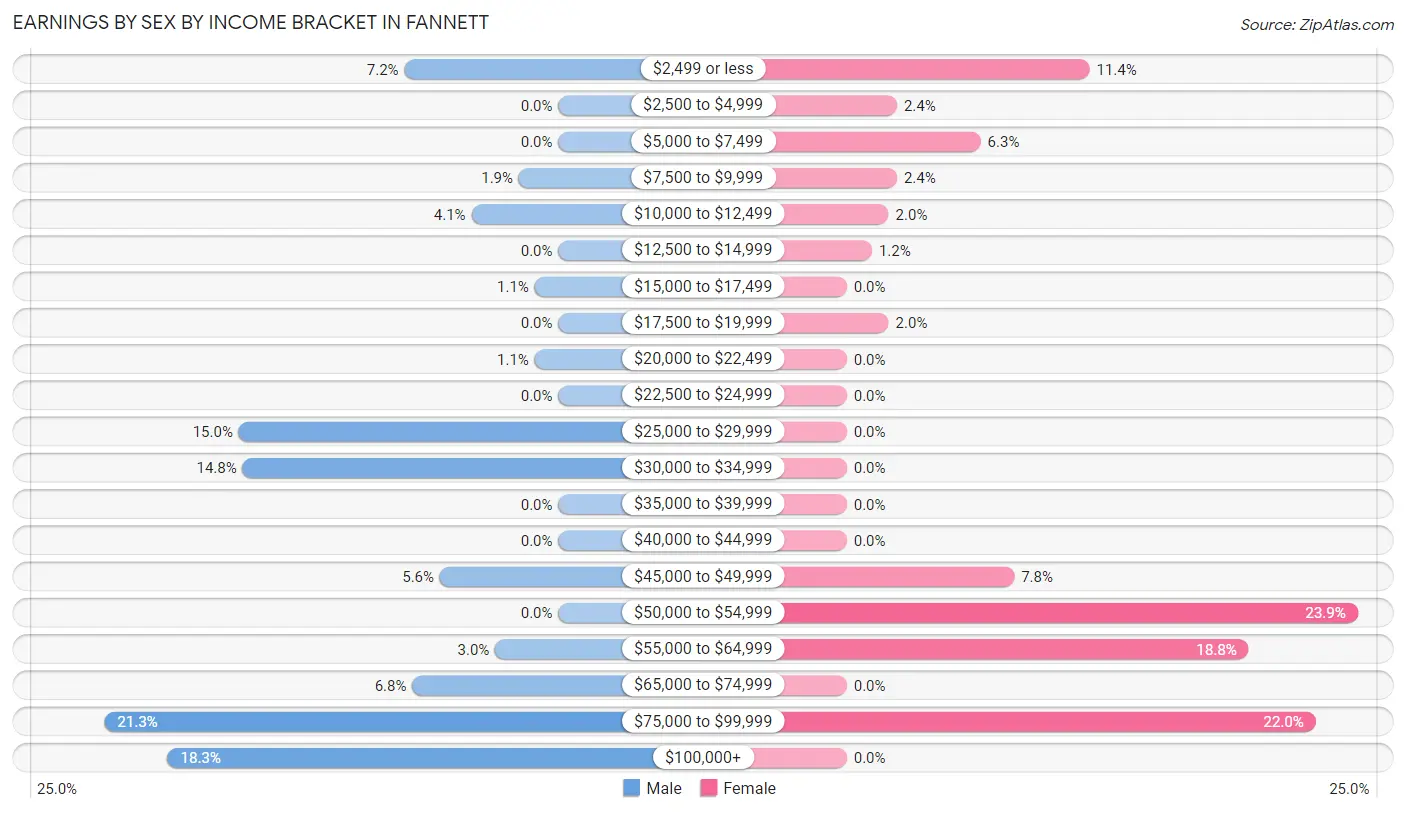
Earnings by Sex by Income Bracket in Fannett
The most common earnings brackets in Fannett are $75,000 to $99,999 for men (115 | 21.3%) and $50,000 to $54,999 for women (61 | 23.9%).
| Income | Male | Female |
| $2,499 or less | 39 (7.2%) | 29 (11.4%) |
| $2,500 to $4,999 | 0 (0.0%) | 6 (2.4%) |
| $5,000 to $7,499 | 0 (0.0%) | 16 (6.3%) |
| $7,500 to $9,999 | 10 (1.8%) | 6 (2.4%) |
| $10,000 to $12,499 | 22 (4.1%) | 5 (2.0%) |
| $12,500 to $14,999 | 0 (0.0%) | 3 (1.2%) |
| $15,000 to $17,499 | 6 (1.1%) | 0 (0.0%) |
| $17,500 to $19,999 | 0 (0.0%) | 5 (2.0%) |
| $20,000 to $22,499 | 6 (1.1%) | 0 (0.0%) |
| $22,500 to $24,999 | 0 (0.0%) | 0 (0.0%) |
| $25,000 to $29,999 | 81 (15.0%) | 0 (0.0%) |
| $30,000 to $34,999 | 80 (14.8%) | 0 (0.0%) |
| $35,000 to $39,999 | 0 (0.0%) | 0 (0.0%) |
| $40,000 to $44,999 | 0 (0.0%) | 0 (0.0%) |
| $45,000 to $49,999 | 30 (5.6%) | 20 (7.8%) |
| $50,000 to $54,999 | 0 (0.0%) | 61 (23.9%) |
| $55,000 to $64,999 | 16 (3.0%) | 48 (18.8%) |
| $65,000 to $74,999 | 37 (6.8%) | 0 (0.0%) |
| $75,000 to $99,999 | 115 (21.3%) | 56 (22.0%) |
| $100,000+ | 99 (18.3%) | 0 (0.0%) |
| Total | 541 (100.0%) | 255 (100.0%) |
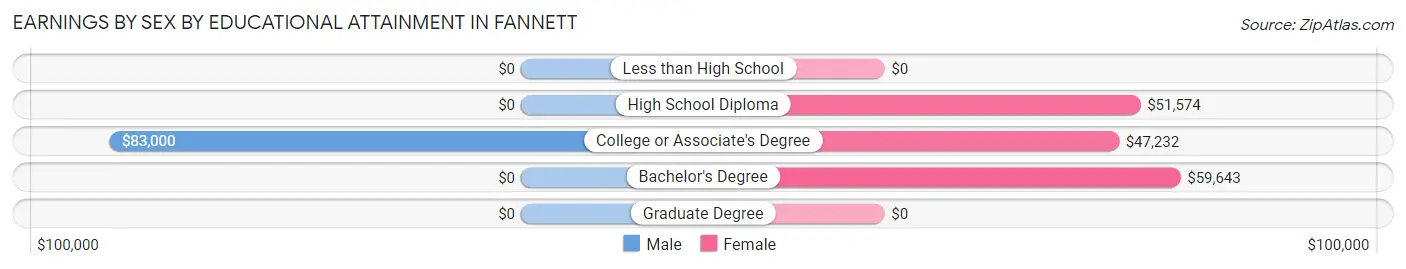
Earnings by Sex by Educational Attainment in Fannett
Average earnings in Fannett are $66,375 for men and $52,214 for women, a difference of 21.3%. Men with an educational attainment of college or associate's degree enjoy the highest average annual earnings of $83,000, while those with college or associate's degree education earn the least with $83,000. Women with an educational attainment of bachelor's degree earn the most with the average annual earnings of $59,643, while those with college or associate's degree education have the smallest earnings of $47,232.
| Educational Attainment | Male Income | Female Income |
| Less than High School | - | - |
| High School Diploma | - | - |
| College or Associate's Degree | $83,000 | $47,232 |
| Bachelor's Degree | - | - |
| Graduate Degree | - | - |
| Total | $66,375 | $52,214 |
Family Income in Fannett
Family Income Brackets in Fannett
According to the Fannett family income data, there are 163 families falling into the $100,000 to $149,999 income range, which is the most common income bracket and makes up 33.1% of all families.
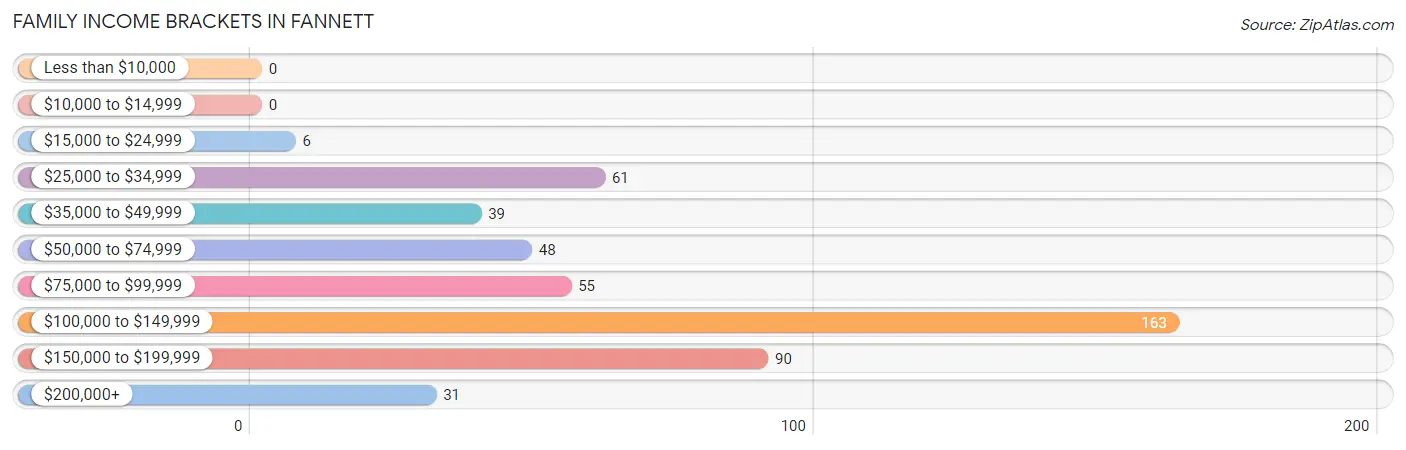
| Income Bracket | # Families | % Families |
| Less than $10,000 | 0 | 0.0% |
| $10,000 to $14,999 | 0 | 0.0% |
| $15,000 to $24,999 | 6 | 1.2% |
| $25,000 to $34,999 | 61 | 12.4% |
| $35,000 to $49,999 | 39 | 7.9% |
| $50,000 to $74,999 | 48 | 9.7% |
| $75,000 to $99,999 | 55 | 11.2% |
| $100,000 to $149,999 | 163 | 33.1% |
| $150,000 to $199,999 | 90 | 18.3% |
| $200,000+ | 31 | 6.3% |
Family Income by Famaliy Size in Fannett
3-person families (142 | 28.8%) account for the highest median family income in Fannett with $126,477 per family, while 2-person families (300 | 60.9%) have the highest median income of $56,334 per family member.
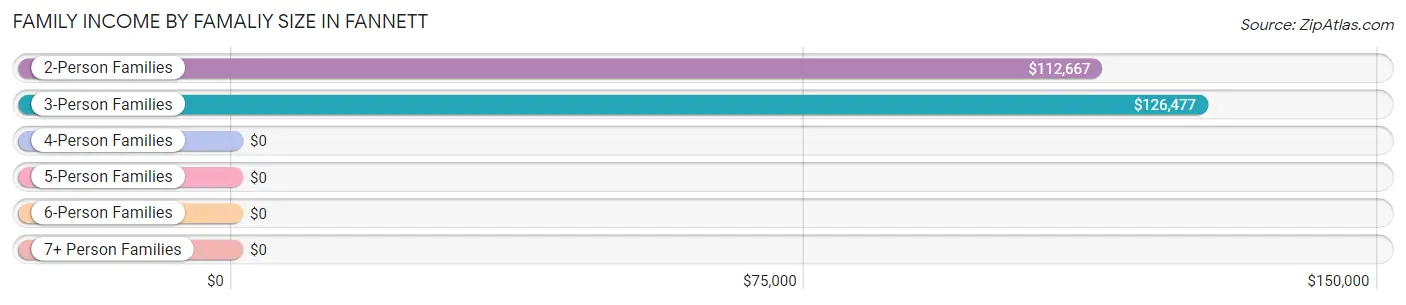
| Income Bracket | # Families | Median Income |
| 2-Person Families | 300 (60.9%) | $112,667 |
| 3-Person Families | 142 (28.8%) | $126,477 |
| 4-Person Families | 23 (4.7%) | $0 |
| 5-Person Families | 7 (1.4%) | $0 |
| 6-Person Families | 16 (3.3%) | $0 |
| 7+ Person Families | 5 (1.0%) | $0 |
| Total | 493 (100.0%) | $115,625 |
Family Income by Number of Earners in Fannett
The median family income in Fannett is $115,625, with families comprising 1 earner (190) having the highest median family income of $143,571, while families with no earners (130) have the lowest median family income of $51,625, accounting for 38.5% and 26.4% of families, respectively.
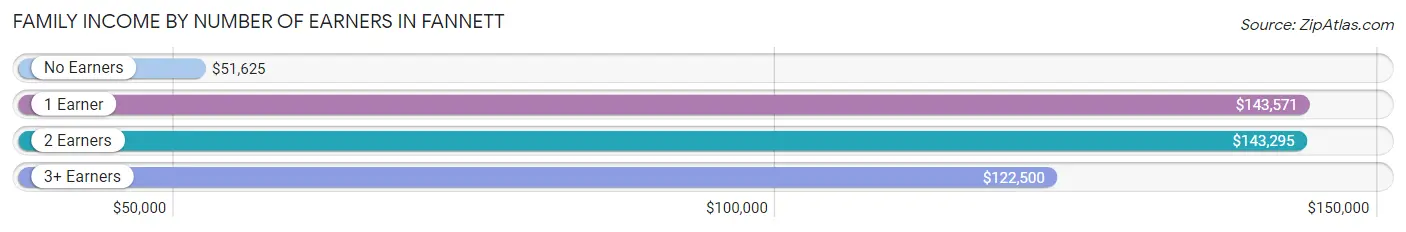
| Number of Earners | # Families | Median Income |
| No Earners | 130 (26.4%) | $51,625 |
| 1 Earner | 190 (38.5%) | $143,571 |
| 2 Earners | 129 (26.2%) | $143,295 |
| 3+ Earners | 44 (8.9%) | $122,500 |
| Total | 493 (100.0%) | $115,625 |
Household Income in Fannett
Household Income Brackets in Fannett
With 163 households falling in the category, the $100,000 to $149,999 income range is the most frequent in Fannett, accounting for 22.0% of all households. In contrast, only 10 households (1.3%) fall into the $10,000 to $14,999 income bracket, making it the least populous group.
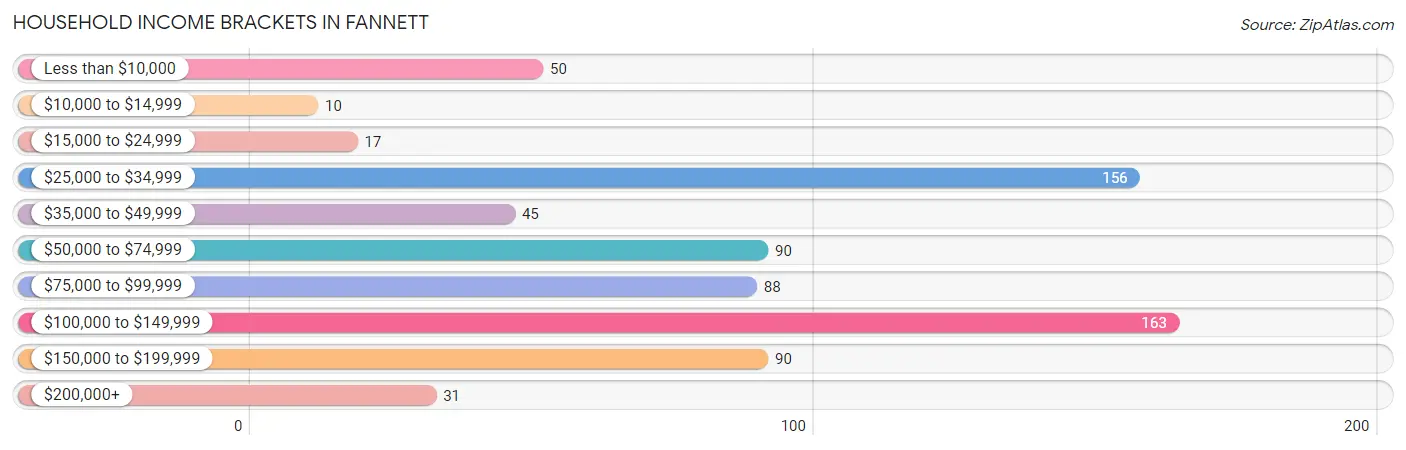
| Income Bracket | # Households | % Households |
| Less than $10,000 | 50 | 6.8% |
| $10,000 to $14,999 | 10 | 1.4% |
| $15,000 to $24,999 | 17 | 2.3% |
| $25,000 to $34,999 | 156 | 21.1% |
| $35,000 to $49,999 | 45 | 6.1% |
| $50,000 to $74,999 | 90 | 12.2% |
| $75,000 to $99,999 | 88 | 11.9% |
| $100,000 to $149,999 | 163 | 22.0% |
| $150,000 to $199,999 | 90 | 12.2% |
| $200,000+ | 31 | 4.2% |
Household Income by Householder Age in Fannett
The median household income in Fannett is $80,238, with the highest median household income of $143,977 found in the 25 to 44 years age bracket for the primary householder. A total of 133 households (18.0%) fall into this category. Meanwhile, the 45 to 64 years age bracket for the primary householder has the lowest median household income of $0, with 330 households (44.6%) in this group.
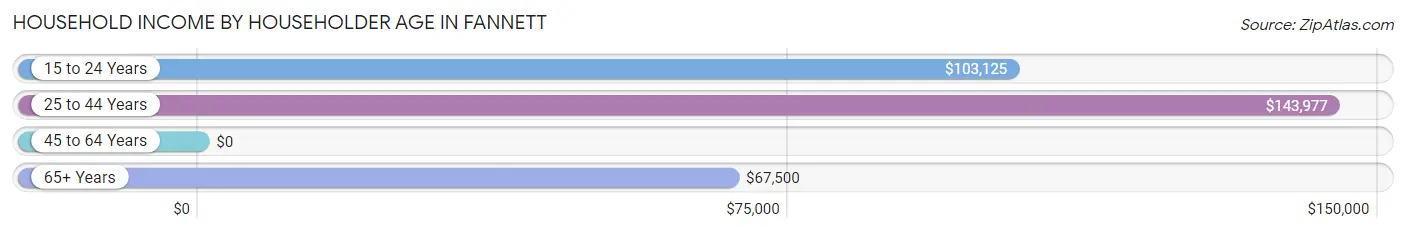
| Income Bracket | # Households | Median Income |
| 15 to 24 Years | 19 (2.6%) | $103,125 |
| 25 to 44 Years | 133 (18.0%) | $143,977 |
| 45 to 64 Years | 330 (44.6%) | $0 |
| 65+ Years | 258 (34.9%) | $67,500 |
| Total | 740 (100.0%) | $80,238 |
Poverty in Fannett
Income Below Poverty by Sex and Age in Fannett
With 3.2% poverty level for males and 7.3% for females among the residents of Fannett, 55 to 64 year old males and 55 to 64 year old females are the most vulnerable to poverty, with 11 males (13.8%) and 41 females (23.4%) in their respective age groups living below the poverty level.
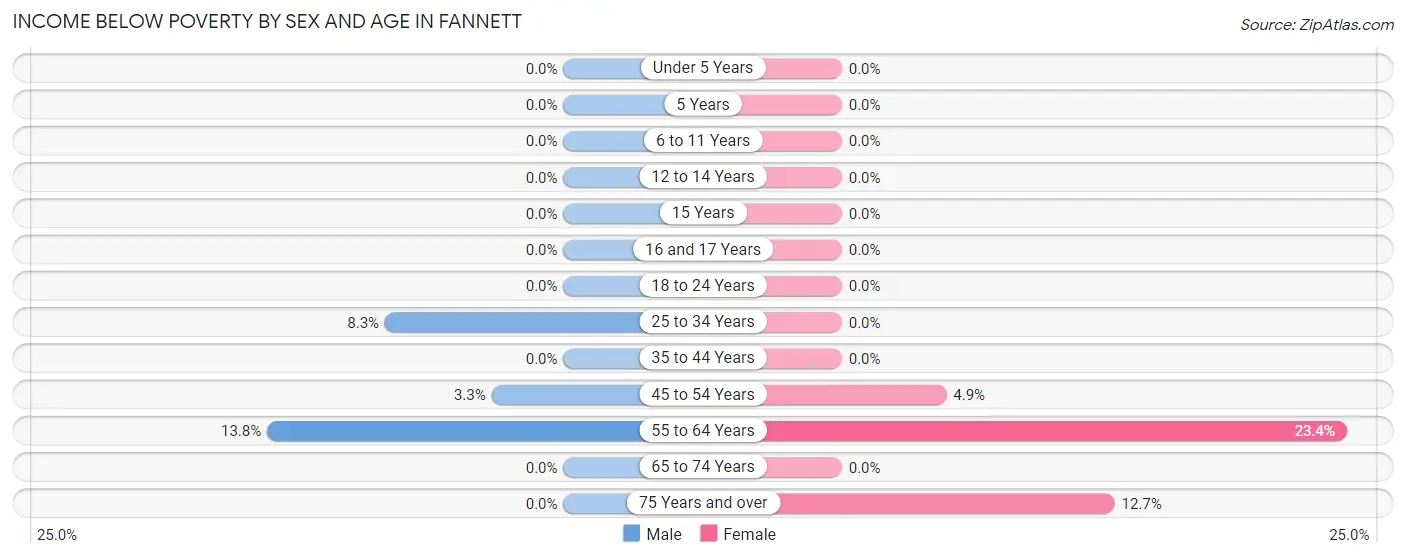
| Age Bracket | Male | Female |
| Under 5 Years | 0 (0.0%) | 0 (0.0%) |
| 5 Years | 0 (0.0%) | 0 (0.0%) |
| 6 to 11 Years | 0 (0.0%) | 0 (0.0%) |
| 12 to 14 Years | 0 (0.0%) | 0 (0.0%) |
| 15 Years | 0 (0.0%) | 0 (0.0%) |
| 16 and 17 Years | 0 (0.0%) | 0 (0.0%) |
| 18 to 24 Years | 0 (0.0%) | 0 (0.0%) |
| 25 to 34 Years | 12 (8.3%) | 0 (0.0%) |
| 35 to 44 Years | 0 (0.0%) | 0 (0.0%) |
| 45 to 54 Years | 6 (3.3%) | 5 (4.9%) |
| 55 to 64 Years | 11 (13.8%) | 41 (23.4%) |
| 65 to 74 Years | 0 (0.0%) | 0 (0.0%) |
| 75 Years and over | 0 (0.0%) | 10 (12.7%) |
| Total | 29 (3.2%) | 56 (7.3%) |
Income Above Poverty by Sex and Age in Fannett
According to the poverty statistics in Fannett, males aged under 5 years and females aged under 5 years are the age groups that are most secure financially, with 100.0% of males and 100.0% of females in these age groups living above the poverty line.
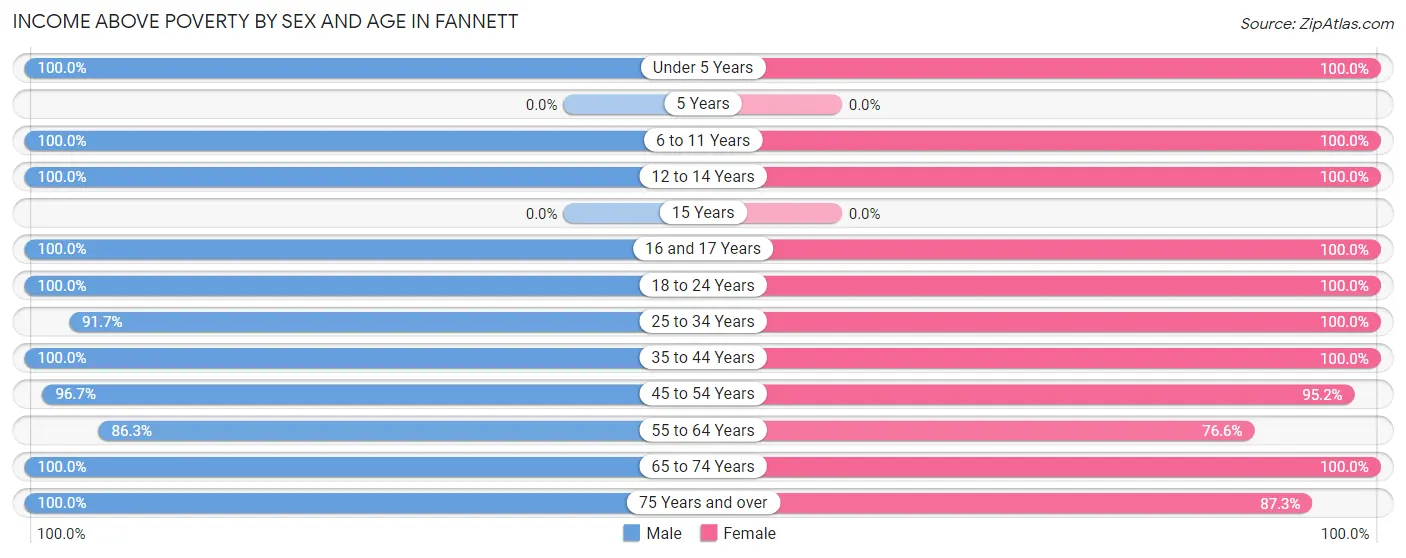
| Age Bracket | Male | Female |
| Under 5 Years | 40 (100.0%) | 14 (100.0%) |
| 5 Years | 0 (0.0%) | 0 (0.0%) |
| 6 to 11 Years | 47 (100.0%) | 70 (100.0%) |
| 12 to 14 Years | 16 (100.0%) | 11 (100.0%) |
| 15 Years | 0 (0.0%) | 0 (0.0%) |
| 16 and 17 Years | 7 (100.0%) | 36 (100.0%) |
| 18 to 24 Years | 43 (100.0%) | 29 (100.0%) |
| 25 to 34 Years | 133 (91.7%) | 143 (100.0%) |
| 35 to 44 Years | 116 (100.0%) | 18 (100.0%) |
| 45 to 54 Years | 174 (96.7%) | 98 (95.2%) |
| 55 to 64 Years | 69 (86.3%) | 134 (76.6%) |
| 65 to 74 Years | 151 (100.0%) | 89 (100.0%) |
| 75 Years and over | 75 (100.0%) | 69 (87.3%) |
| Total | 871 (96.8%) | 711 (92.7%) |
Income Below Poverty Among Married-Couple Families in Fannett
The poverty statistics for married-couple families in Fannett show that 1.3% or 6 of the total 445 families live below the poverty line. Families with no children have the highest poverty rate of 1.8%, comprising of 6 families. On the other hand, families with 1 or 2 children have the lowest poverty rate of 0.0%, which includes 0 families.
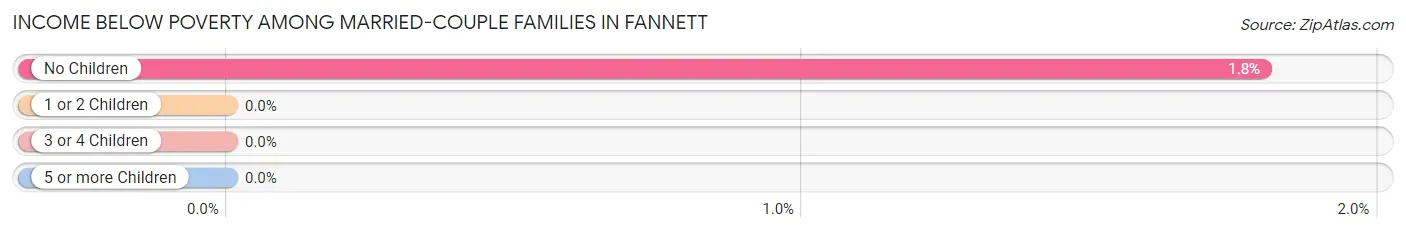
| Children | Above Poverty | Below Poverty |
| No Children | 328 (98.2%) | 6 (1.8%) |
| 1 or 2 Children | 88 (100.0%) | 0 (0.0%) |
| 3 or 4 Children | 23 (100.0%) | 0 (0.0%) |
| 5 or more Children | 0 (0.0%) | 0 (0.0%) |
| Total | 439 (98.7%) | 6 (1.3%) |
Income Below Poverty Among Single-Parent Households in Fannett
| Children | Single Father | Single Mother |
| No Children | 0 (0.0%) | 0 (0.0%) |
| 1 or 2 Children | 0 (0.0%) | 0 (0.0%) |
| 3 or 4 Children | 0 (0.0%) | 0 (0.0%) |
| 5 or more Children | 0 (0.0%) | 0 (0.0%) |
| Total | 0 (0.0%) | 0 (0.0%) |
Income Below Poverty Among Married-Couple vs Single-Parent Households in Fannett
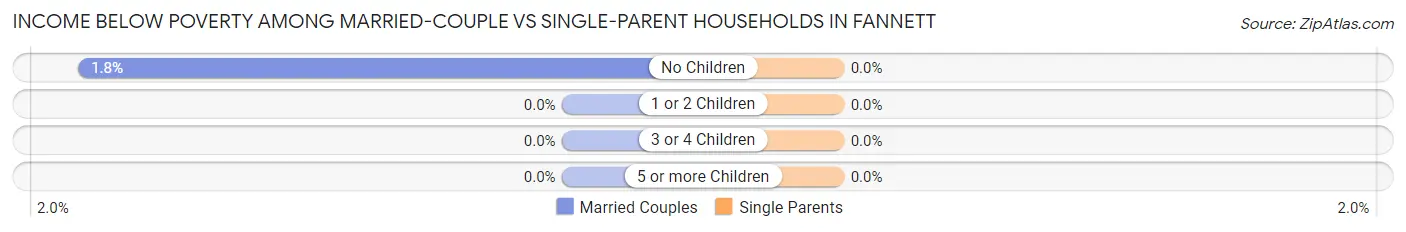
| Children | Married-Couple Families | Single-Parent Households |
| No Children | 6 (1.8%) | 0 (0.0%) |
| 1 or 2 Children | 0 (0.0%) | 0 (0.0%) |
| 3 or 4 Children | 0 (0.0%) | 0 (0.0%) |
| 5 or more Children | 0 (0.0%) | 0 (0.0%) |
| Total | 6 (1.3%) | 0 (0.0%) |
Race in Fannett
The most populous races in Fannett are White / Caucasian (1,347 | 80.8%), Hispanic or Latino (269 | 16.1%), and Asian (156 | 9.4%).
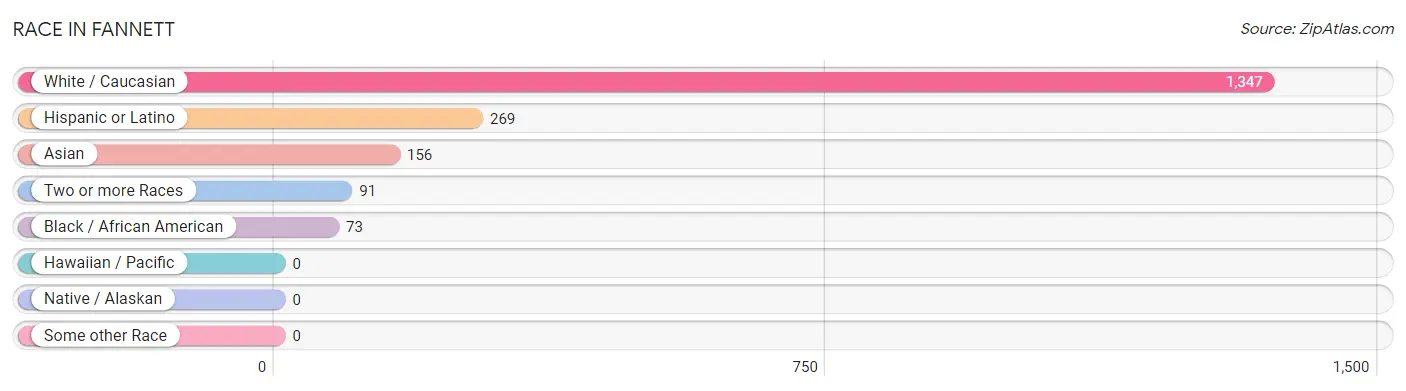
| Race | # Population | % Population |
| Asian | 156 | 9.4% |
| Black / African American | 73 | 4.4% |
| Hawaiian / Pacific | 0 | 0.0% |
| Hispanic or Latino | 269 | 16.1% |
| Native / Alaskan | 0 | 0.0% |
| White / Caucasian | 1,347 | 80.8% |
| Two or more Races | 91 | 5.5% |
| Some other Race | 0 | 0.0% |
| Total | 1,667 | 100.0% |
Ancestry in Fannett
The most populous ancestries reported in Fannett are French (282 | 16.9%), Mexican (257 | 15.4%), English (182 | 10.9%), Irish (162 | 9.7%), and Sri Lankan (128 | 7.7%), together accounting for 60.7% of all Fannett residents.
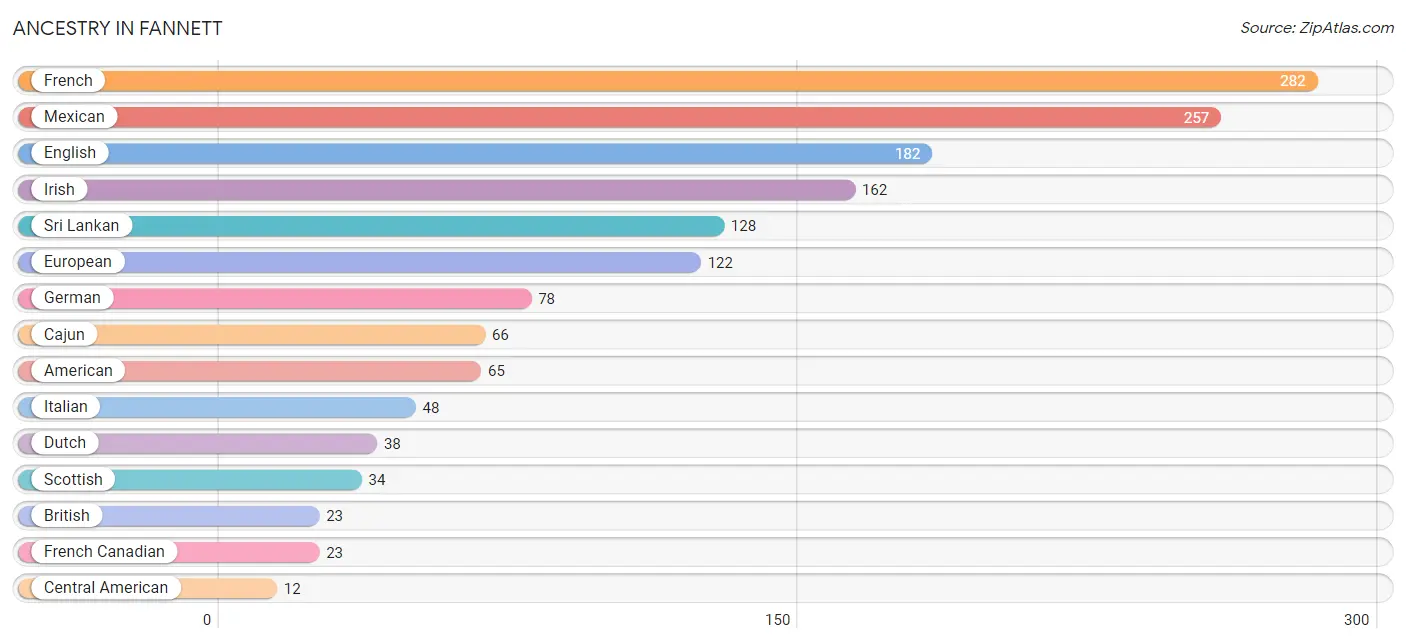
| Ancestry | # Population | % Population |
| American | 65 | 3.9% |
| British | 23 | 1.4% |
| Cajun | 66 | 4.0% |
| Central American | 12 | 0.7% |
| Dutch | 38 | 2.3% |
| English | 182 | 10.9% |
| European | 122 | 7.3% |
| French | 282 | 16.9% |
| French Canadian | 23 | 1.4% |
| German | 78 | 4.7% |
| Honduran | 12 | 0.7% |
| Irish | 162 | 9.7% |
| Italian | 48 | 2.9% |
| Mexican | 257 | 15.4% |
| Norwegian | 4 | 0.2% |
| Scotch-Irish | 2 | 0.1% |
| Scottish | 34 | 2.0% |
| Sri Lankan | 128 | 7.7% |
| Welsh | 10 | 0.6% | View All 19 Rows |
Immigrants in Fannett
The most numerous immigrant groups reported in Fannett came from Central America (184 | 11.0%), Latin America (184 | 11.0%), Mexico (172 | 10.3%), Asia (96 | 5.8%), and South Eastern Asia (79 | 4.7%), together accounting for 42.9% of all Fannett residents.
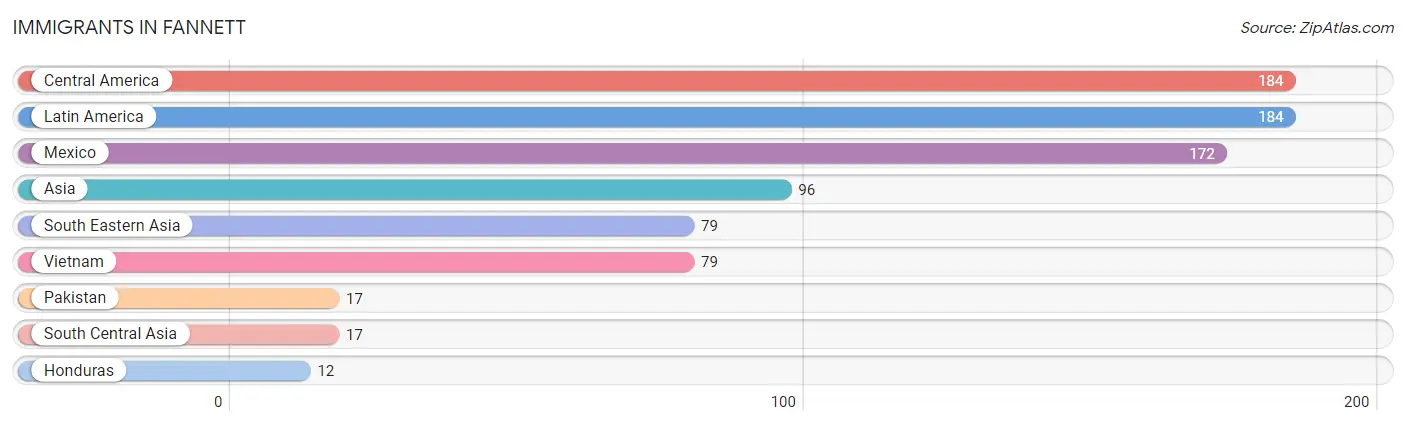
| Immigration Origin | # Population | % Population |
| Asia | 96 | 5.8% |
| Central America | 184 | 11.0% |
| Honduras | 12 | 0.7% |
| Latin America | 184 | 11.0% |
| Mexico | 172 | 10.3% |
| Pakistan | 17 | 1.0% |
| South Central Asia | 17 | 1.0% |
| South Eastern Asia | 79 | 4.7% |
| Vietnam | 79 | 4.7% | View All 9 Rows |
Sex and Age in Fannett
Sex and Age in Fannett
The most populous age groups in Fannett are 45 to 49 Years (108 | 12.0%) for men and 60 to 64 Years (115 | 15.0%) for women.
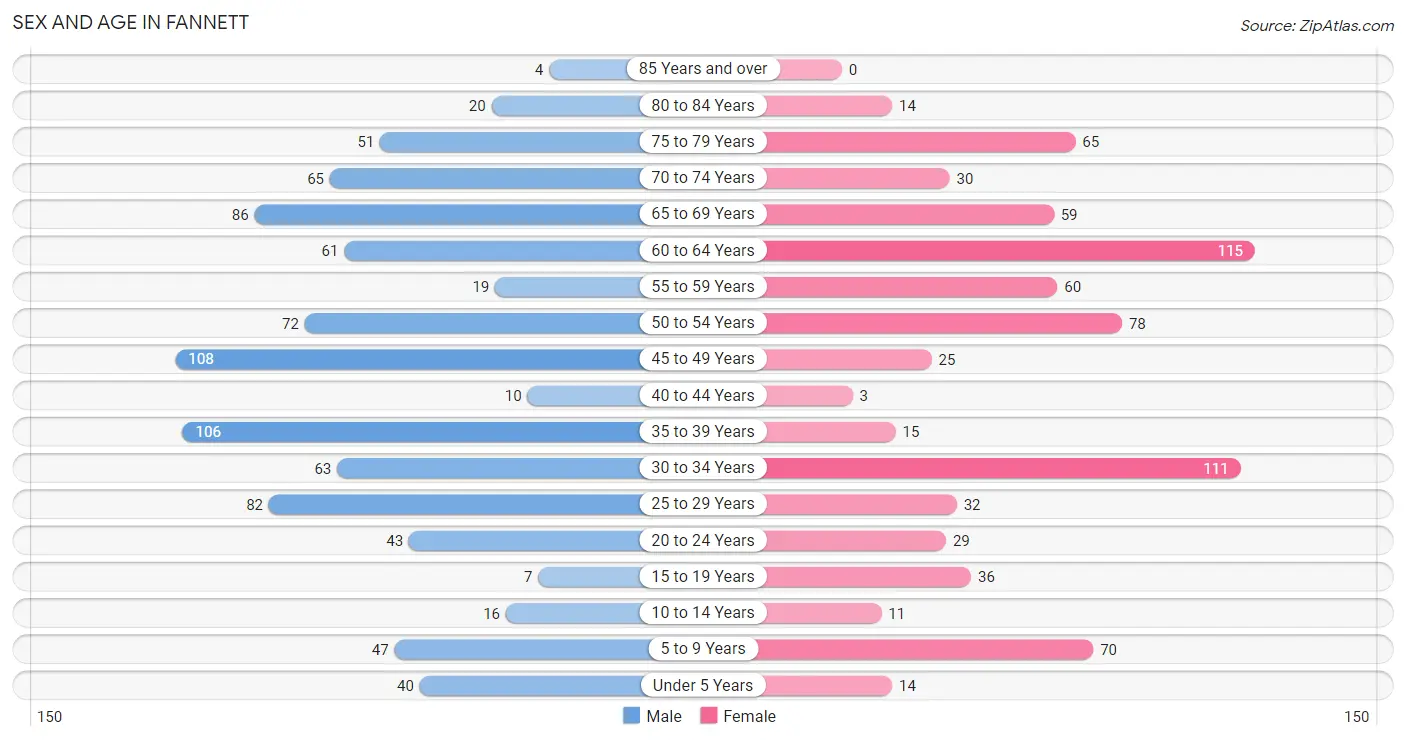
| Age Bracket | Male | Female |
| Under 5 Years | 40 (4.4%) | 14 (1.8%) |
| 5 to 9 Years | 47 (5.2%) | 70 (9.1%) |
| 10 to 14 Years | 16 (1.8%) | 11 (1.4%) |
| 15 to 19 Years | 7 (0.8%) | 36 (4.7%) |
| 20 to 24 Years | 43 (4.8%) | 29 (3.8%) |
| 25 to 29 Years | 82 (9.1%) | 32 (4.2%) |
| 30 to 34 Years | 63 (7.0%) | 111 (14.5%) |
| 35 to 39 Years | 106 (11.8%) | 15 (2.0%) |
| 40 to 44 Years | 10 (1.1%) | 3 (0.4%) |
| 45 to 49 Years | 108 (12.0%) | 25 (3.3%) |
| 50 to 54 Years | 72 (8.0%) | 78 (10.2%) |
| 55 to 59 Years | 19 (2.1%) | 60 (7.8%) |
| 60 to 64 Years | 61 (6.8%) | 115 (15.0%) |
| 65 to 69 Years | 86 (9.6%) | 59 (7.7%) |
| 70 to 74 Years | 65 (7.2%) | 30 (3.9%) |
| 75 to 79 Years | 51 (5.7%) | 65 (8.5%) |
| 80 to 84 Years | 20 (2.2%) | 14 (1.8%) |
| 85 Years and over | 4 (0.4%) | 0 (0.0%) |
| Total | 900 (100.0%) | 767 (100.0%) |
Families and Households in Fannett
Median Family Size in Fannett
The median family size in Fannett is 2.79 persons per family, with married-couple families (445 | 90.3%) accounting for the largest median family size of 2.84 persons per family. On the other hand, single male/father families (17 | 3.5%) represent the smallest median family size with 2.29 persons per family.
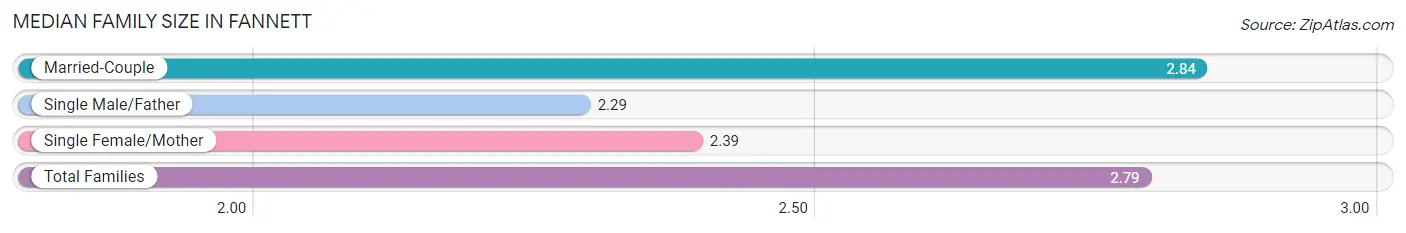
| Family Type | # Families | Family Size |
| Married-Couple | 445 (90.3%) | 2.84 |
| Single Male/Father | 17 (3.5%) | 2.29 |
| Single Female/Mother | 31 (6.3%) | 2.39 |
| Total Families | 493 (100.0%) | 2.79 |
Median Household Size in Fannett
The median household size in Fannett is 2.25 persons per household, with married-couple households (445 | 60.1%) accounting for the largest median household size of 2.84 persons per household. non-family households (247 | 33.4%) represent the smallest median household size with 1.17 persons per household.
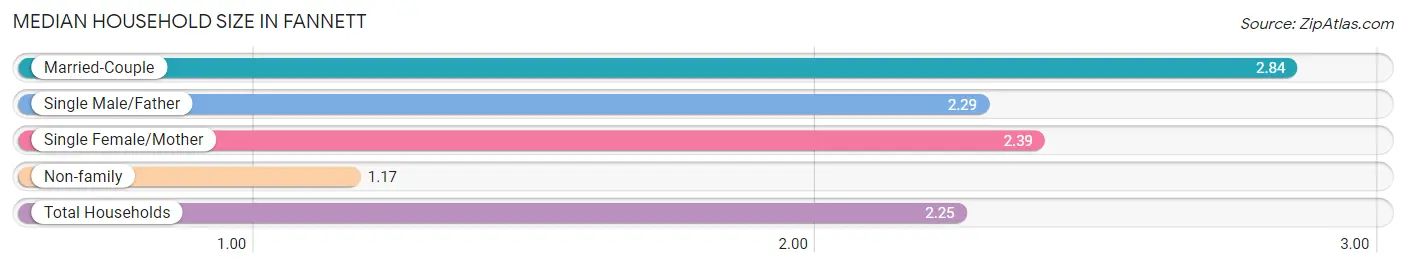
| Household Type | # Households | Household Size |
| Married-Couple | 445 (60.1%) | 2.84 |
| Single Male/Father | 17 (2.3%) | 2.29 |
| Single Female/Mother | 31 (4.2%) | 2.39 |
| Non-family | 247 (33.4%) | 1.17 |
| Total Households | 740 (100.0%) | 2.25 |
Household Size by Marriage Status in Fannett
Out of a total of 740 households in Fannett, 493 (66.6%) are family households, while 247 (33.4%) are nonfamily households. The most numerous type of family households are 2-person households, comprising 300, and the most common type of nonfamily households are 1-person households, comprising 218.
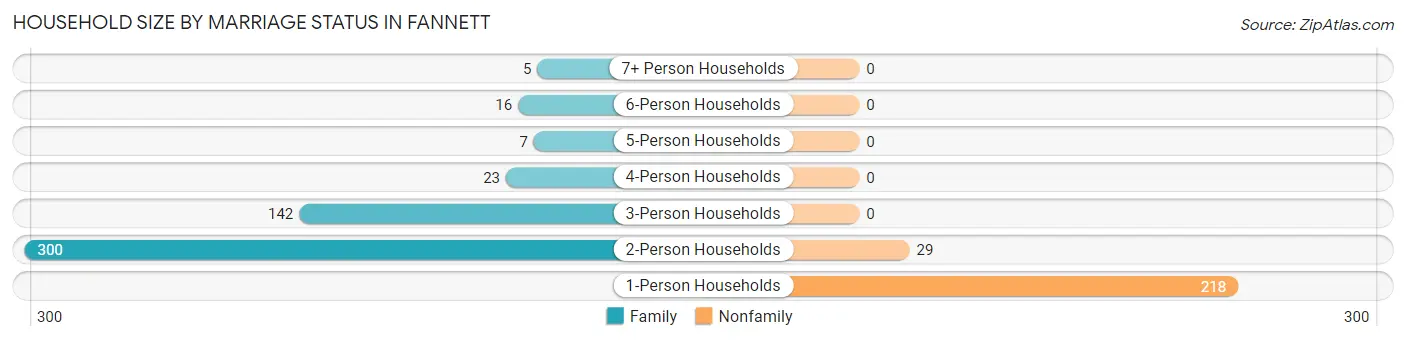
| Household Size | Family Households | Nonfamily Households |
| 1-Person Households | - | 218 (29.5%) |
| 2-Person Households | 300 (40.5%) | 29 (3.9%) |
| 3-Person Households | 142 (19.2%) | 0 (0.0%) |
| 4-Person Households | 23 (3.1%) | 0 (0.0%) |
| 5-Person Households | 7 (0.9%) | 0 (0.0%) |
| 6-Person Households | 16 (2.2%) | 0 (0.0%) |
| 7+ Person Households | 5 (0.7%) | 0 (0.0%) |
| Total | 493 (66.6%) | 247 (33.4%) |
Female Fertility in Fannett
Fertility by Age in Fannett
Average fertility rate in Fannett is 58.0 births per 1,000 women. Women in the age bracket of 35 to 50 years have the highest fertility rate with 300.0 births per 1,000 women. Women in the age bracket of 35 to 50 years acount for 100.0% of all women with births.
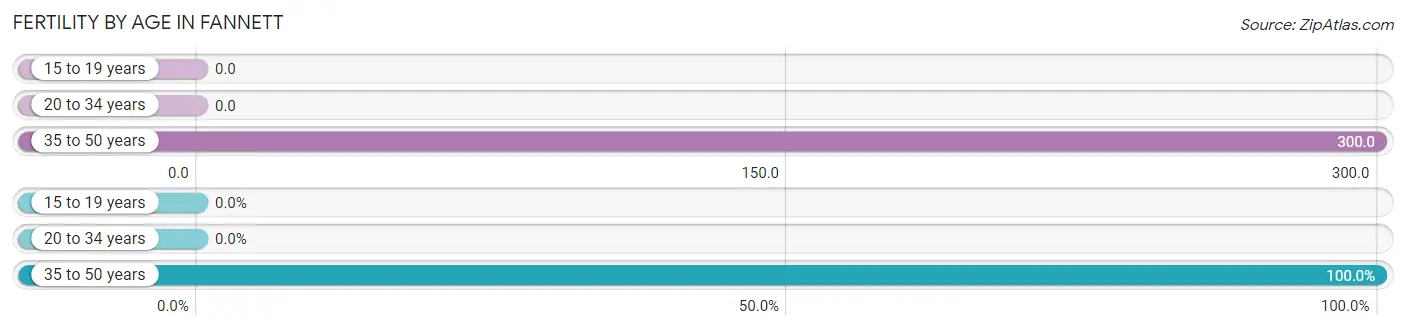
| Age Bracket | Women with Births | Births / 1,000 Women |
| 15 to 19 years | 0 (0.0%) | 0.0 |
| 20 to 34 years | 0 (0.0%) | 0.0 |
| 35 to 50 years | 15 (100.0%) | 300.0 |
| Total | 15 (100.0%) | 58.0 |
Fertility by Age by Marriage Status in Fannett
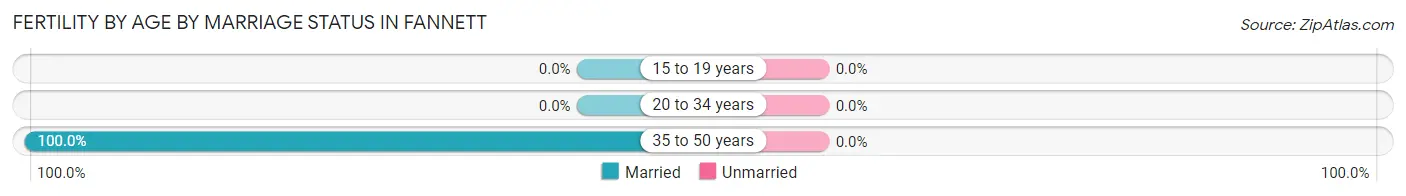
| Age Bracket | Married | Unmarried |
| 15 to 19 years | 0 (0.0%) | 0 (0.0%) |
| 20 to 34 years | 0 (0.0%) | 0 (0.0%) |
| 35 to 50 years | 15 (100.0%) | 0 (0.0%) |
| Total | 15 (100.0%) | 0 (0.0%) |
Fertility by Education in Fannett
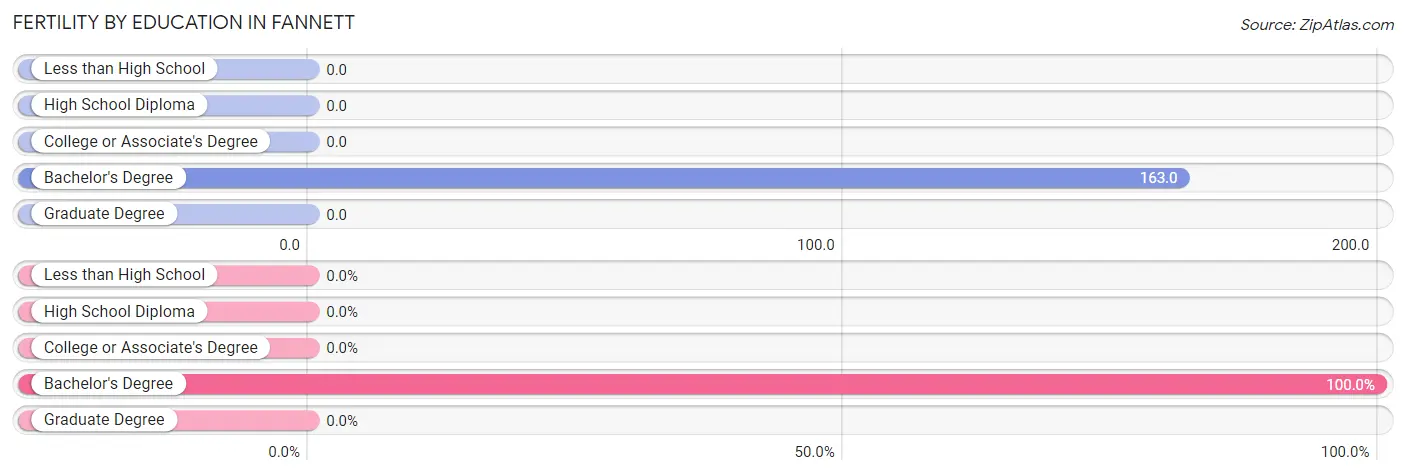
| Educational Attainment | Women with Births | Births / 1,000 Women |
| Less than High School | 0 (0.0%) | 0.0 |
| High School Diploma | 0 (0.0%) | 0.0 |
| College or Associate's Degree | 0 (0.0%) | 0.0 |
| Bachelor's Degree | 15 (100.0%) | 163.0 |
| Graduate Degree | 0 (0.0%) | 0.0 |
| Total | 15 (100.0%) | 58.0 |
Fertility by Education by Marriage Status in Fannett
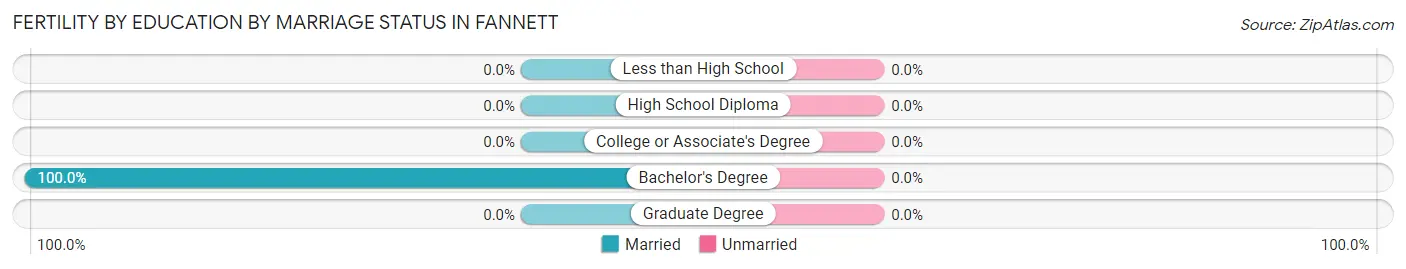
| Educational Attainment | Married | Unmarried |
| Less than High School | 0 (0.0%) | 0 (0.0%) |
| High School Diploma | 0 (0.0%) | 0 (0.0%) |
| College or Associate's Degree | 0 (0.0%) | 0 (0.0%) |
| Bachelor's Degree | 15 (100.0%) | 0 (0.0%) |
| Graduate Degree | 0 (0.0%) | 0 (0.0%) |
| Total | 15 (100.0%) | 0 (0.0%) |
Employment Characteristics in Fannett
Employment by Class of Employer in Fannett
Among the 736 employed individuals in Fannett, private company employees (575 | 78.1%), local government employees (60 | 8.2%), and self-employed (incorporated) (34 | 4.6%) make up the most common classes of employment.
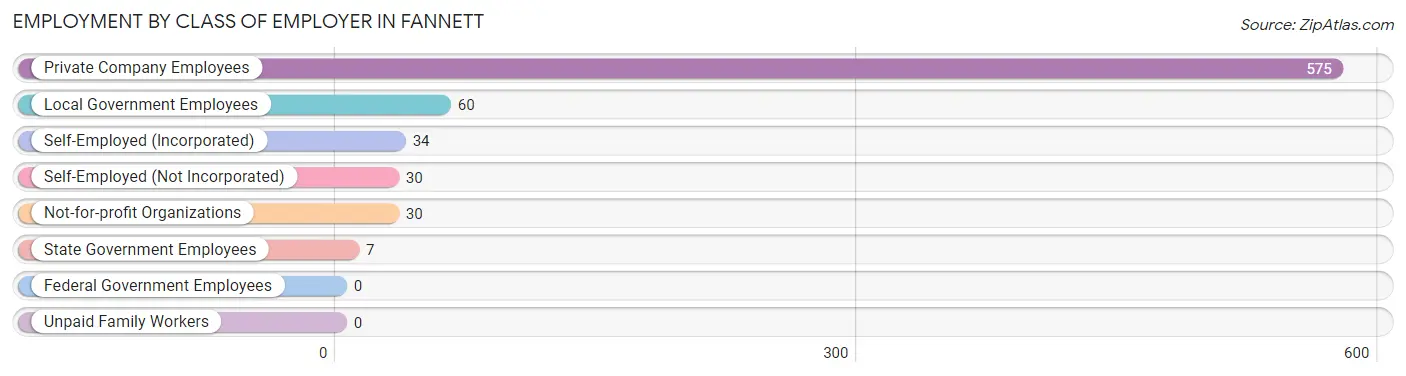
| Employer Class | # Employees | % Employees |
| Private Company Employees | 575 | 78.1% |
| Self-Employed (Incorporated) | 34 | 4.6% |
| Self-Employed (Not Incorporated) | 30 | 4.1% |
| Not-for-profit Organizations | 30 | 4.1% |
| Local Government Employees | 60 | 8.2% |
| State Government Employees | 7 | 0.9% |
| Federal Government Employees | 0 | 0.0% |
| Unpaid Family Workers | 0 | 0.0% |
| Total | 736 | 100.0% |
Employment Status by Age in Fannett
According to the labor force statistics for Fannett, out of the total population over 16 years of age (1,469), 50.4% or 740 individuals are in the labor force, with 0.7% or 5 of them unemployed. The age group with the highest labor force participation rate is 45 to 54 years, with 94.3% or 267 individuals in the labor force. Within the labor force, the 45 to 54 years age range has the highest percentage of unemployed individuals, with 1.9% or 5 of them being unemployed.
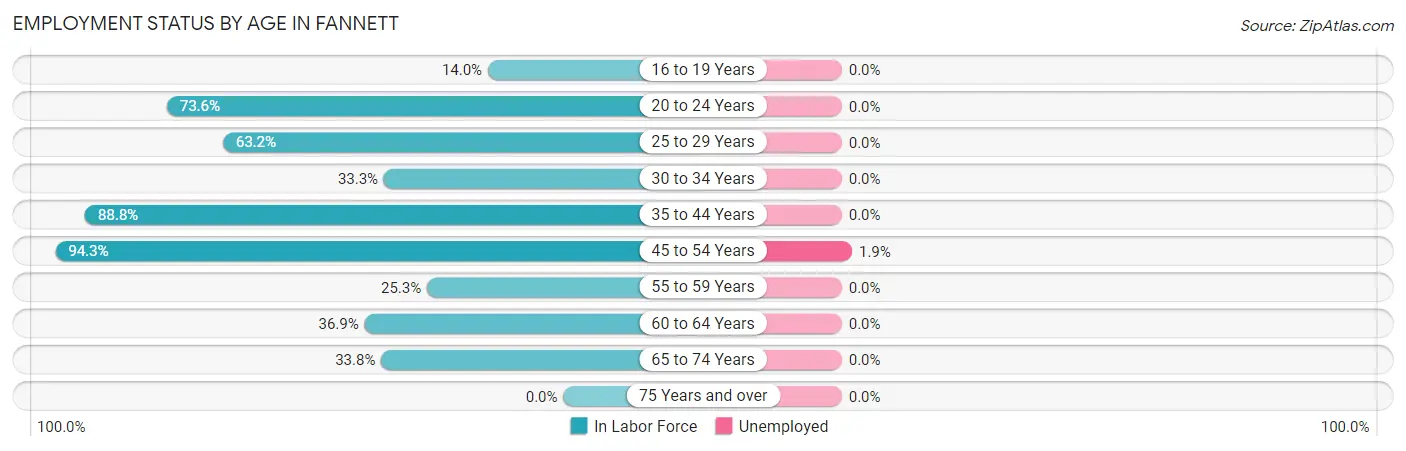
| Age Bracket | In Labor Force | Unemployed |
| 16 to 19 Years | 6 (14.0%) | 0 (0.0%) |
| 20 to 24 Years | 53 (73.6%) | 0 (0.0%) |
| 25 to 29 Years | 72 (63.2%) | 0 (0.0%) |
| 30 to 34 Years | 58 (33.3%) | 0 (0.0%) |
| 35 to 44 Years | 119 (88.8%) | 0 (0.0%) |
| 45 to 54 Years | 267 (94.3%) | 5 (1.9%) |
| 55 to 59 Years | 20 (25.3%) | 0 (0.0%) |
| 60 to 64 Years | 65 (36.9%) | 0 (0.0%) |
| 65 to 74 Years | 81 (33.8%) | 0 (0.0%) |
| 75 Years and over | 0 (0.0%) | 0 (0.0%) |
| Total | 740 (50.4%) | 5 (0.7%) |
Employment Status by Educational Attainment in Fannett
According to labor force statistics for Fannett, 62.6% of individuals (601) out of the total population between 25 and 64 years of age (960) are in the labor force, with 0.8% or 5 of them being unemployed. The group with the highest labor force participation rate are those with the educational attainment of bachelor's degree or higher, with 77.9% or 120 individuals in the labor force. Within the labor force, individuals with college / associate degree education have the highest percentage of unemployment, with 1.8% or 5 of them being unemployed.
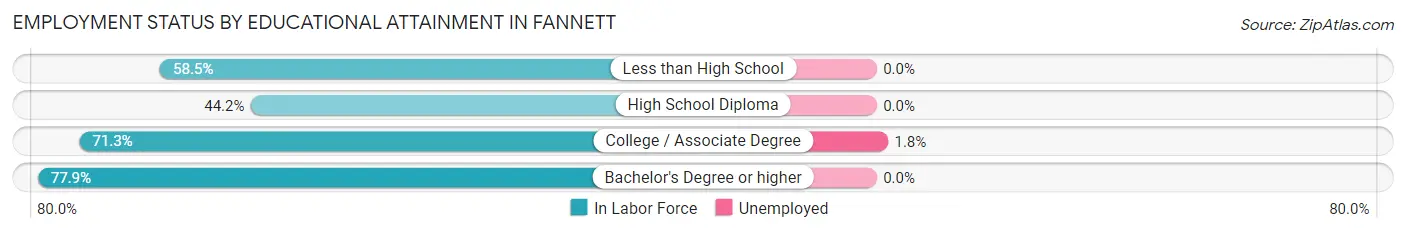
| Educational Attainment | In Labor Force | Unemployed |
| Less than High School | 86 (58.5%) | 0 (0.0%) |
| High School Diploma | 122 (44.2%) | 0 (0.0%) |
| College / Associate Degree | 273 (71.3%) | 7 (1.8%) |
| Bachelor's Degree or higher | 120 (77.9%) | 0 (0.0%) |
| Total | 601 (62.6%) | 8 (0.8%) |
Employment Occupations by Sex in Fannett
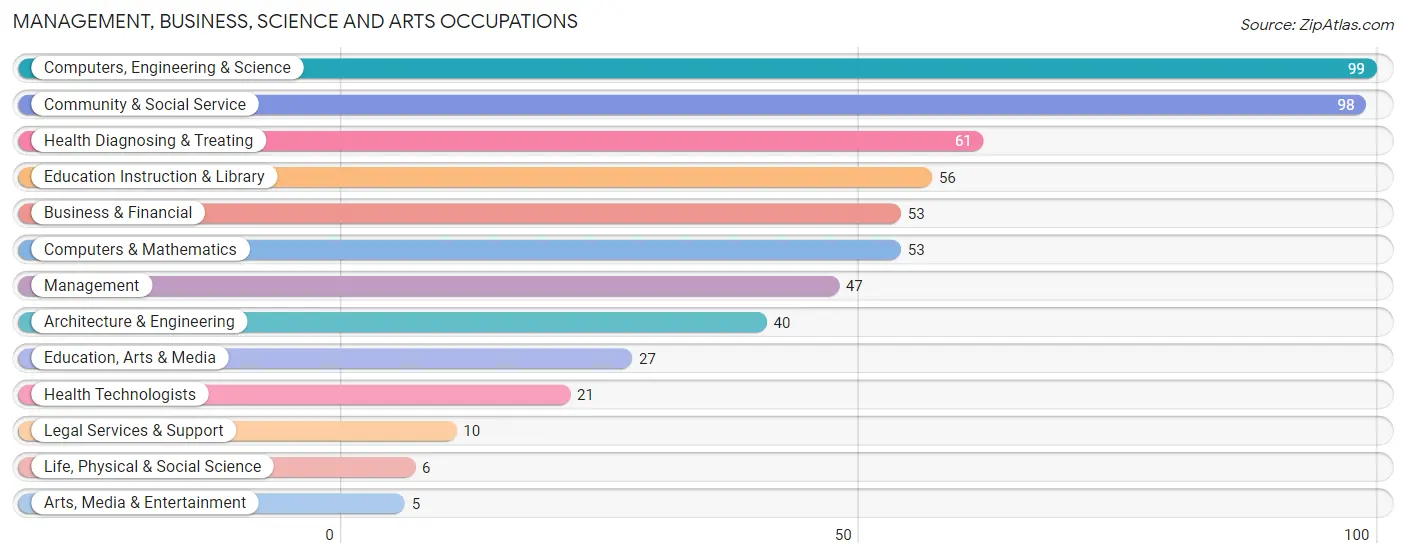
Management, Business, Science and Arts Occupations
The most common Management, Business, Science and Arts occupations in Fannett are Computers, Engineering & Science (99 | 13.5%), Community & Social Service (98 | 13.3%), Health Diagnosing & Treating (61 | 8.3%), Education Instruction & Library (56 | 7.6%), and Business & Financial (53 | 7.2%).
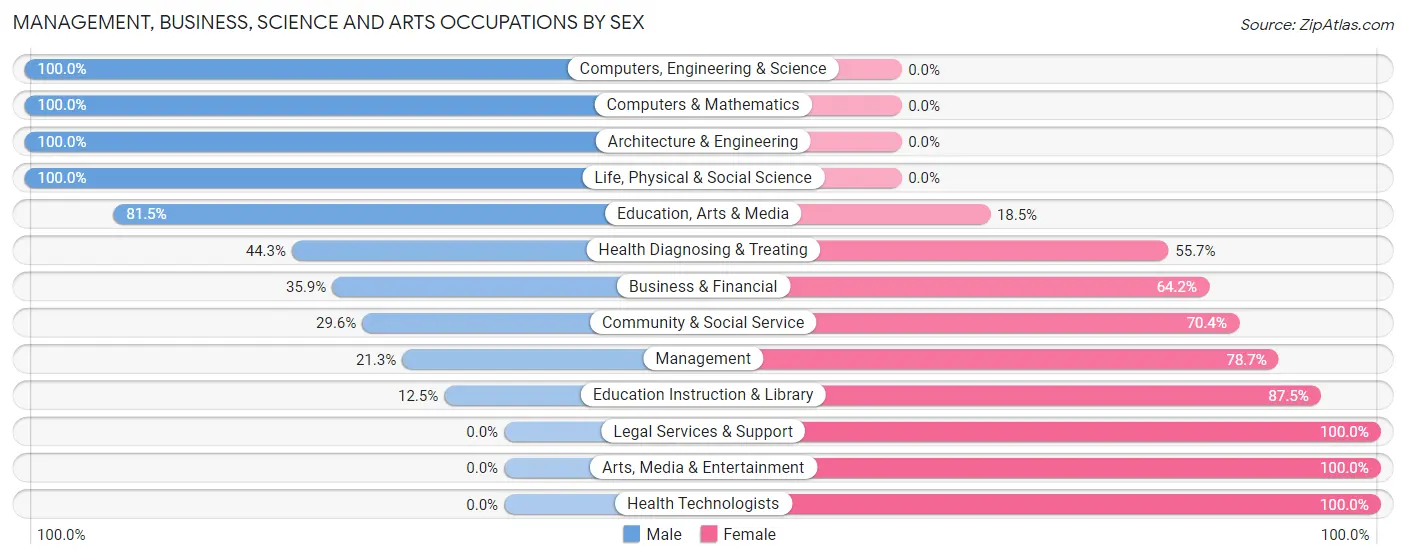
Management, Business, Science and Arts Occupations by Sex
Within the Management, Business, Science and Arts occupations in Fannett, the most male-oriented occupations are Computers, Engineering & Science (100.0%), Computers & Mathematics (100.0%), and Architecture & Engineering (100.0%), while the most female-oriented occupations are Legal Services & Support (100.0%), Arts, Media & Entertainment (100.0%), and Health Technologists (100.0%).
| Occupation | Male | Female |
| Management | 10 (21.3%) | 37 (78.7%) |
| Business & Financial | 19 (35.8%) | 34 (64.1%) |
| Computers, Engineering & Science | 99 (100.0%) | 0 (0.0%) |
| Computers & Mathematics | 53 (100.0%) | 0 (0.0%) |
| Architecture & Engineering | 40 (100.0%) | 0 (0.0%) |
| Life, Physical & Social Science | 6 (100.0%) | 0 (0.0%) |
| Community & Social Service | 29 (29.6%) | 69 (70.4%) |
| Education, Arts & Media | 22 (81.5%) | 5 (18.5%) |
| Legal Services & Support | 0 (0.0%) | 10 (100.0%) |
| Education Instruction & Library | 7 (12.5%) | 49 (87.5%) |
| Arts, Media & Entertainment | 0 (0.0%) | 5 (100.0%) |
| Health Diagnosing & Treating | 27 (44.3%) | 34 (55.7%) |
| Health Technologists | 0 (0.0%) | 21 (100.0%) |
| Total (Category) | 184 (51.4%) | 174 (48.6%) |
| Total (Overall) | 497 (67.5%) | 239 (32.5%) |
Services Occupations
Services Occupations by Sex
| Occupation | Male | Female |
| Healthcare Support | 0 (0.0%) | 0 (0.0%) |
| Security & Protection | 0 (0.0%) | 0 (0.0%) |
| Firefighting & Prevention | 0 (0.0%) | 0 (0.0%) |
| Law Enforcement | 0 (0.0%) | 0 (0.0%) |
| Food Preparation & Serving | 0 (0.0%) | 0 (0.0%) |
| Cleaning & Maintenance | 0 (0.0%) | 0 (0.0%) |
| Personal Care & Service | 0 (0.0%) | 0 (0.0%) |
| Total (Category) | 0 (0.0%) | 0 (0.0%) |
| Total (Overall) | 497 (67.5%) | 239 (32.5%) |
Sales and Office Occupations
The most common Sales and Office occupations in Fannett are Office & Administration (60 | 8.2%), and Sales & Related (19 | 2.6%).
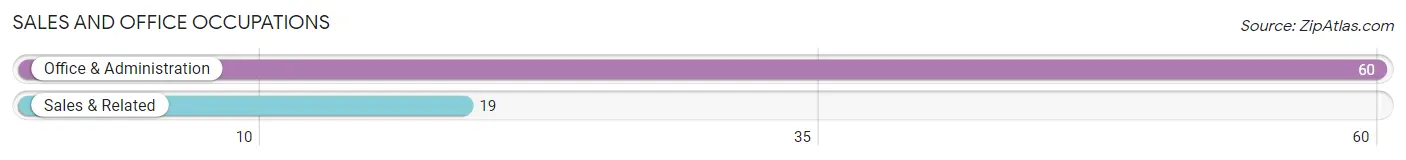
Sales and Office Occupations by Sex
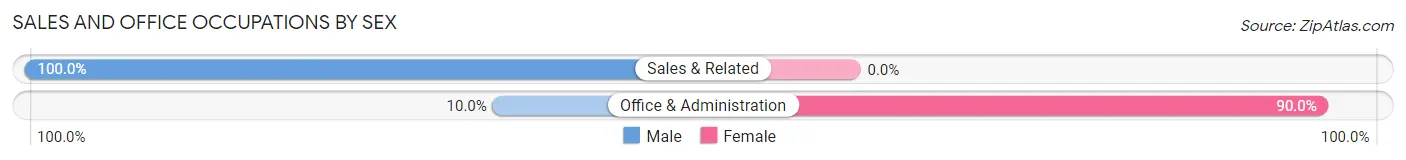
| Occupation | Male | Female |
| Sales & Related | 19 (100.0%) | 0 (0.0%) |
| Office & Administration | 6 (10.0%) | 54 (90.0%) |
| Total (Category) | 25 (31.7%) | 54 (68.3%) |
| Total (Overall) | 497 (67.5%) | 239 (32.5%) |
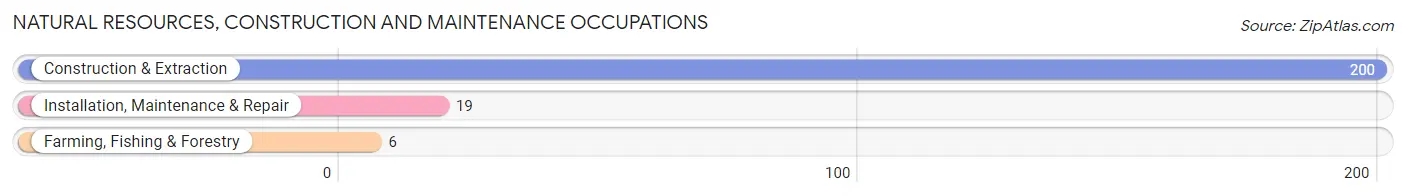
Natural Resources, Construction and Maintenance Occupations
The most common Natural Resources, Construction and Maintenance occupations in Fannett are Construction & Extraction (200 | 27.2%), Installation, Maintenance & Repair (19 | 2.6%), and Farming, Fishing & Forestry (6 | 0.8%).
Natural Resources, Construction and Maintenance Occupations by Sex
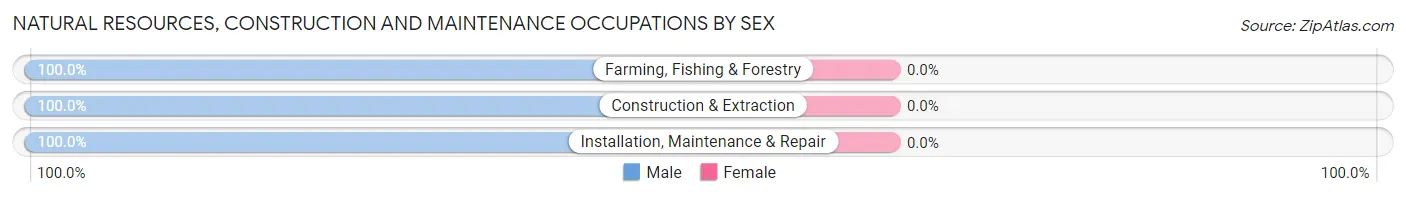
| Occupation | Male | Female |
| Farming, Fishing & Forestry | 6 (100.0%) | 0 (0.0%) |
| Construction & Extraction | 200 (100.0%) | 0 (0.0%) |
| Installation, Maintenance & Repair | 19 (100.0%) | 0 (0.0%) |
| Total (Category) | 225 (100.0%) | 0 (0.0%) |
| Total (Overall) | 497 (67.5%) | 239 (32.5%) |
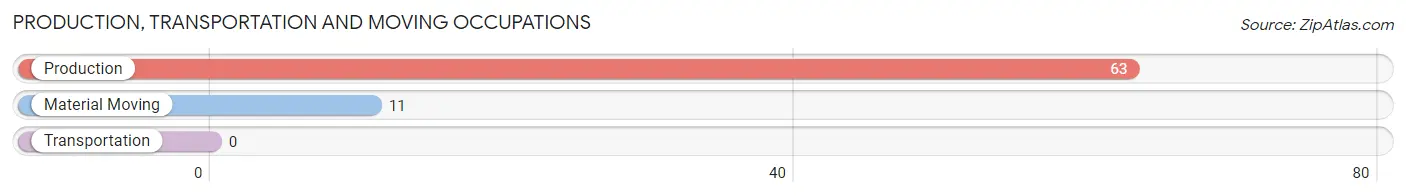
Production, Transportation and Moving Occupations
The most common Production, Transportation and Moving occupations in Fannett are Production (63 | 8.6%), and Material Moving (11 | 1.5%).
Production, Transportation and Moving Occupations by Sex
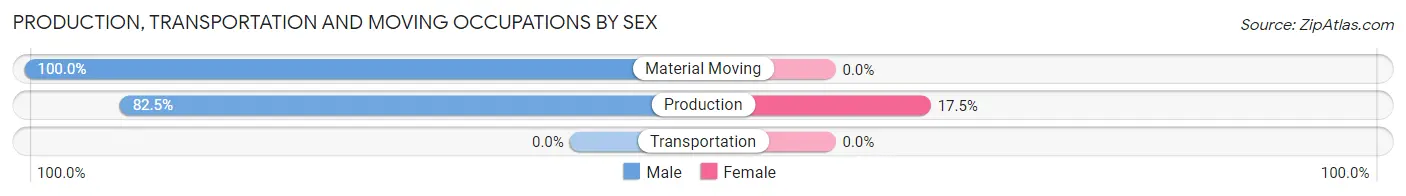
| Occupation | Male | Female |
| Production | 52 (82.5%) | 11 (17.5%) |
| Transportation | 0 (0.0%) | 0 (0.0%) |
| Material Moving | 11 (100.0%) | 0 (0.0%) |
| Total (Category) | 63 (85.1%) | 11 (14.9%) |
| Total (Overall) | 497 (67.5%) | 239 (32.5%) |
Employment Industries by Sex in Fannett
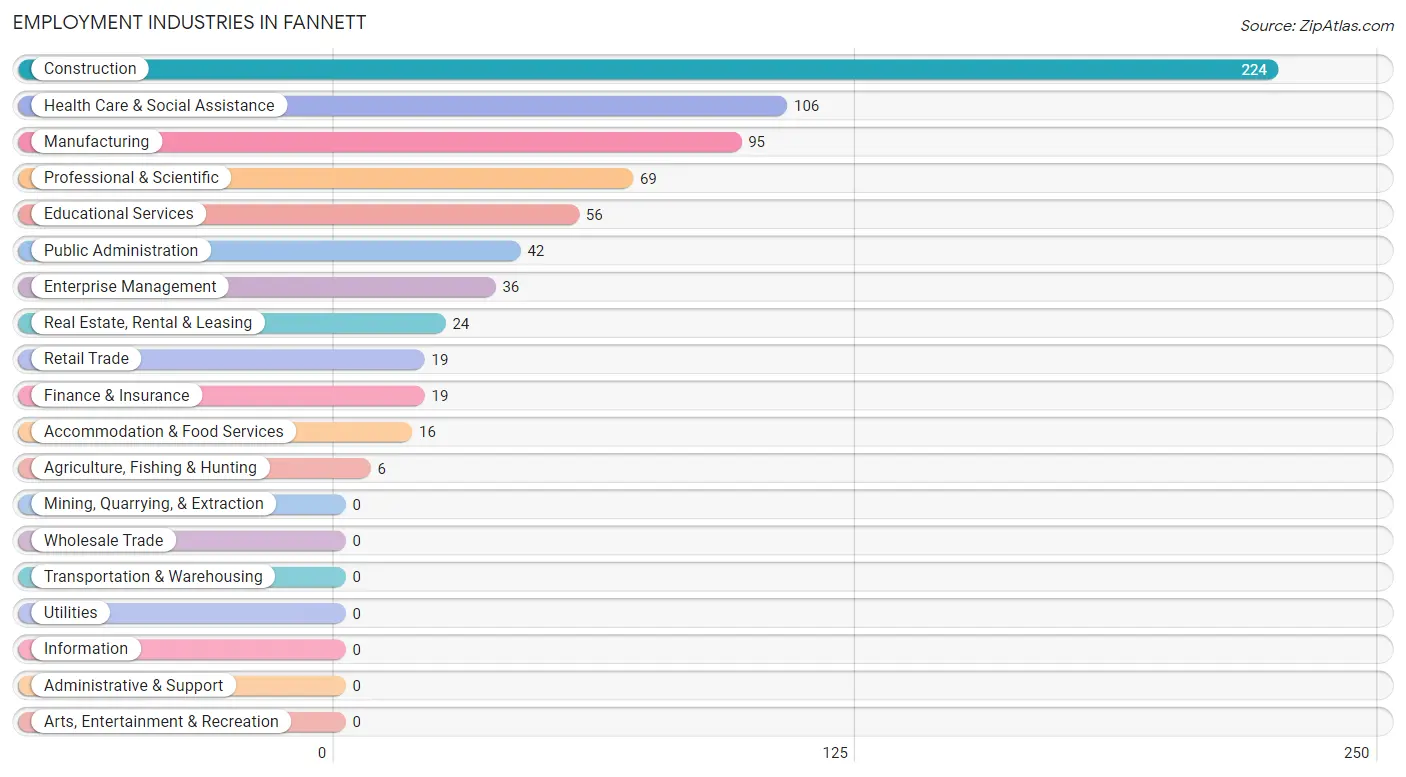
Employment Industries in Fannett
The major employment industries in Fannett include Construction (224 | 30.4%), Health Care & Social Assistance (106 | 14.4%), Manufacturing (95 | 12.9%), Professional & Scientific (69 | 9.4%), and Educational Services (56 | 7.6%).
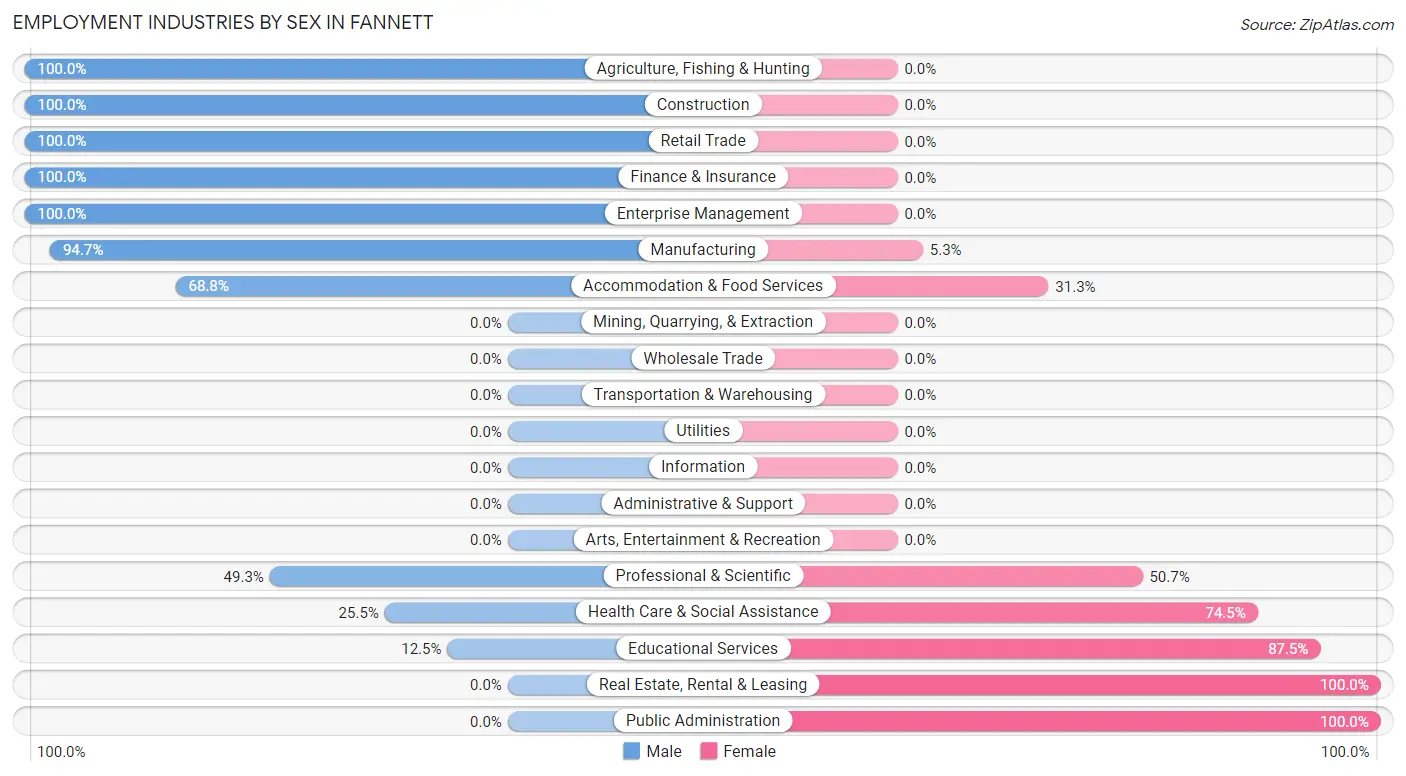
Employment Industries by Sex in Fannett
The Fannett industries that see more men than women are Agriculture, Fishing & Hunting (100.0%), Construction (100.0%), and Retail Trade (100.0%), whereas the industries that tend to have a higher number of women are Real Estate, Rental & Leasing (100.0%), Public Administration (100.0%), and Educational Services (87.5%).
| Industry | Male | Female |
| Agriculture, Fishing & Hunting | 6 (100.0%) | 0 (0.0%) |
| Mining, Quarrying, & Extraction | 0 (0.0%) | 0 (0.0%) |
| Construction | 224 (100.0%) | 0 (0.0%) |
| Manufacturing | 90 (94.7%) | 5 (5.3%) |
| Wholesale Trade | 0 (0.0%) | 0 (0.0%) |
| Retail Trade | 19 (100.0%) | 0 (0.0%) |
| Transportation & Warehousing | 0 (0.0%) | 0 (0.0%) |
| Utilities | 0 (0.0%) | 0 (0.0%) |
| Information | 0 (0.0%) | 0 (0.0%) |
| Finance & Insurance | 19 (100.0%) | 0 (0.0%) |
| Real Estate, Rental & Leasing | 0 (0.0%) | 24 (100.0%) |
| Professional & Scientific | 34 (49.3%) | 35 (50.7%) |
| Enterprise Management | 36 (100.0%) | 0 (0.0%) |
| Administrative & Support | 0 (0.0%) | 0 (0.0%) |
| Educational Services | 7 (12.5%) | 49 (87.5%) |
| Health Care & Social Assistance | 27 (25.5%) | 79 (74.5%) |
| Arts, Entertainment & Recreation | 0 (0.0%) | 0 (0.0%) |
| Accommodation & Food Services | 11 (68.8%) | 5 (31.2%) |
| Public Administration | 0 (0.0%) | 42 (100.0%) |
| Total | 497 (67.5%) | 239 (32.5%) |
Education in Fannett
School Enrollment in Fannett
The most common levels of schooling among the 221 students in Fannett are elementary school (72 | 32.6%), high school (60 | 27.2%), and kindergarten (36 | 16.3%).
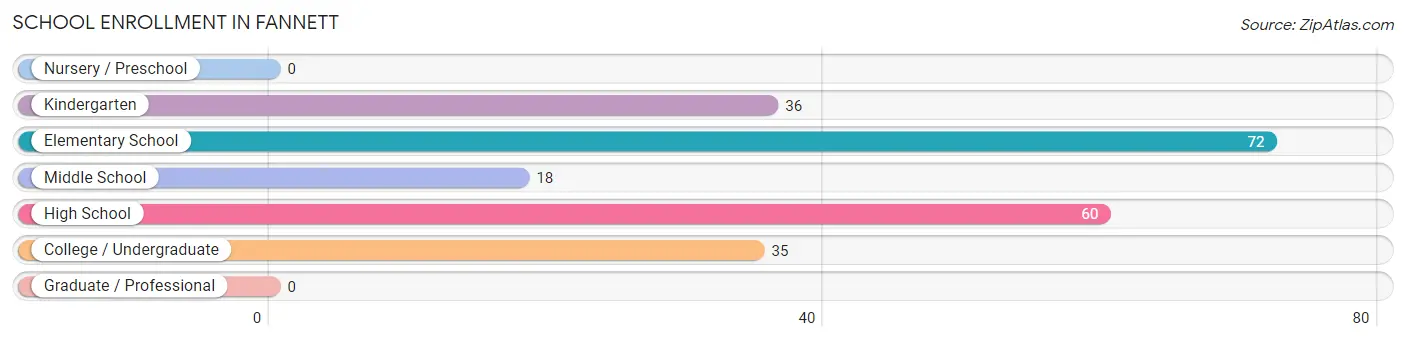
| School Level | # Students | % Students |
| Nursery / Preschool | 0 | 0.0% |
| Kindergarten | 36 | 16.3% |
| Elementary School | 72 | 32.6% |
| Middle School | 18 | 8.1% |
| High School | 60 | 27.2% |
| College / Undergraduate | 35 | 15.8% |
| Graduate / Professional | 0 | 0.0% |
| Total | 221 | 100.0% |
School Enrollment by Age by Funding Source in Fannett
Out of a total of 221 students who are enrolled in schools in Fannett, 55 (24.9%) attend a private institution, while the remaining 166 (75.1%) are enrolled in public schools. The age group of 25 to 34 year olds has the highest likelihood of being enrolled in private schools, with 17 (50.0% in the age bracket) enrolled. Conversely, the age group of 10 to 14 year olds has the lowest likelihood of being enrolled in a private school, with 18 (100.0% in the age bracket) attending a public institution.
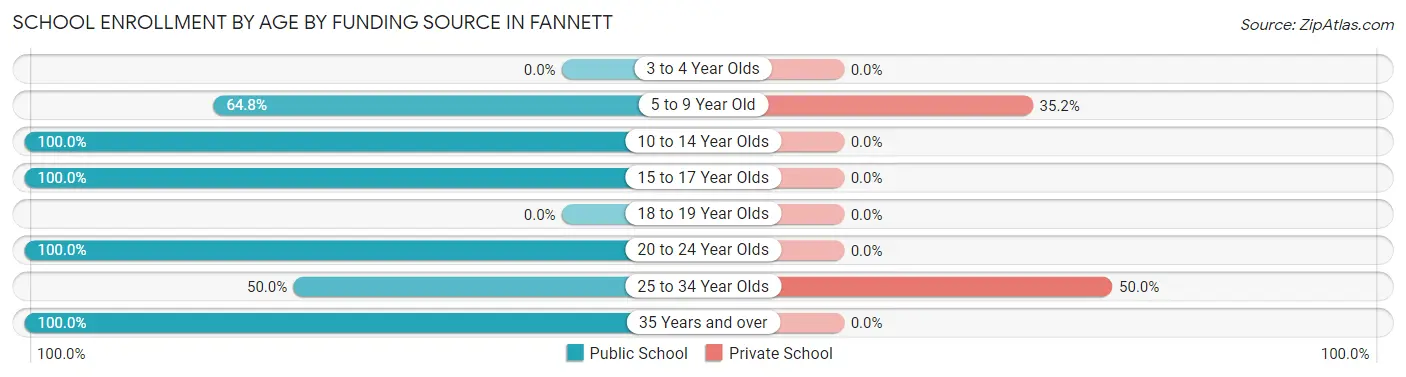
| Age Bracket | Public School | Private School |
| 3 to 4 Year Olds | 0 (0.0%) | 0 (0.0%) |
| 5 to 9 Year Old | 70 (64.8%) | 38 (35.2%) |
| 10 to 14 Year Olds | 18 (100.0%) | 0 (0.0%) |
| 15 to 17 Year Olds | 43 (100.0%) | 0 (0.0%) |
| 18 to 19 Year Olds | 0 (0.0%) | 0 (0.0%) |
| 20 to 24 Year Olds | 5 (100.0%) | 0 (0.0%) |
| 25 to 34 Year Olds | 17 (50.0%) | 17 (50.0%) |
| 35 Years and over | 13 (100.0%) | 0 (0.0%) |
| Total | 166 (75.1%) | 55 (24.9%) |
Educational Attainment by Field of Study in Fannett
Engineering (46 | 20.0%), science & technology (45 | 19.6%), education (37 | 16.1%), business (30 | 13.0%), and multidisciplinary studies (21 | 9.1%) are the most common fields of study among 230 individuals in Fannett who have obtained a bachelor's degree or higher.
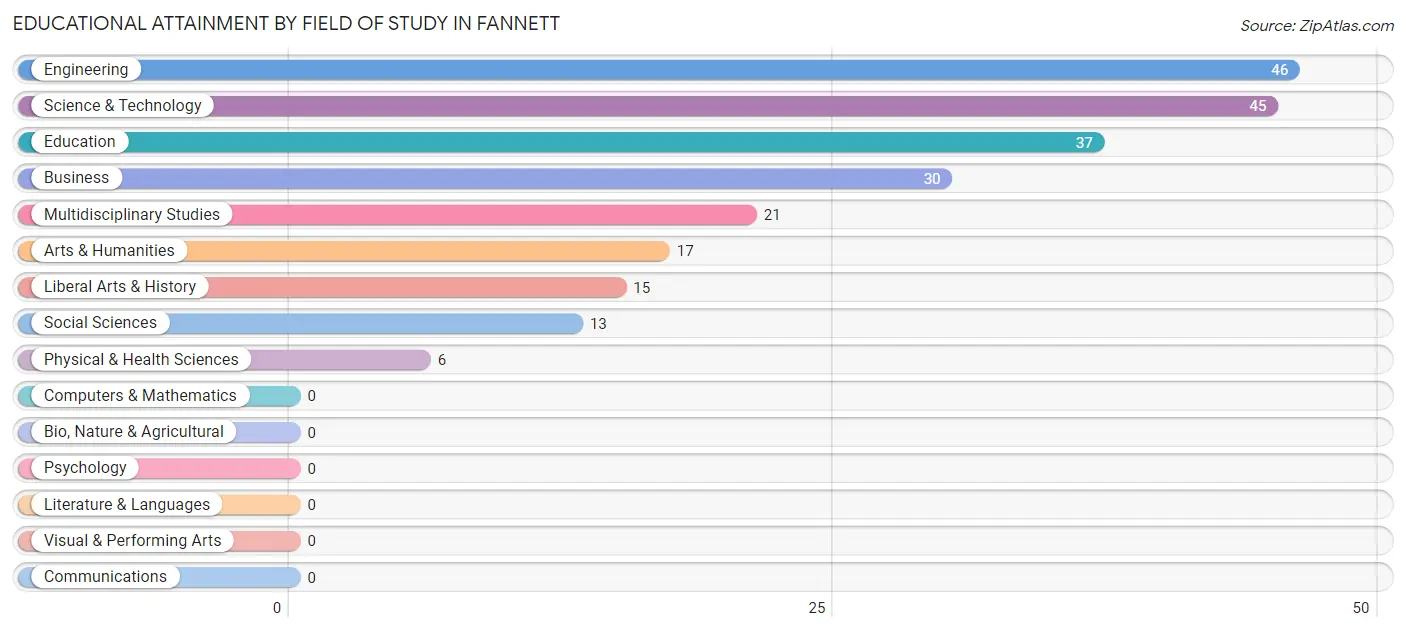
| Field of Study | # Graduates | % Graduates |
| Computers & Mathematics | 0 | 0.0% |
| Bio, Nature & Agricultural | 0 | 0.0% |
| Physical & Health Sciences | 6 | 2.6% |
| Psychology | 0 | 0.0% |
| Social Sciences | 13 | 5.7% |
| Engineering | 46 | 20.0% |
| Multidisciplinary Studies | 21 | 9.1% |
| Science & Technology | 45 | 19.6% |
| Business | 30 | 13.0% |
| Education | 37 | 16.1% |
| Literature & Languages | 0 | 0.0% |
| Liberal Arts & History | 15 | 6.5% |
| Visual & Performing Arts | 0 | 0.0% |
| Communications | 0 | 0.0% |
| Arts & Humanities | 17 | 7.4% |
| Total | 230 | 100.0% |
Transportation & Commute in Fannett
Vehicle Availability by Sex in Fannett
The most prevalent vehicle ownership categories in Fannett are males with 2 vehicles (223, accounting for 45.1%) and females with 2 vehicles (91, making up 93.3%).
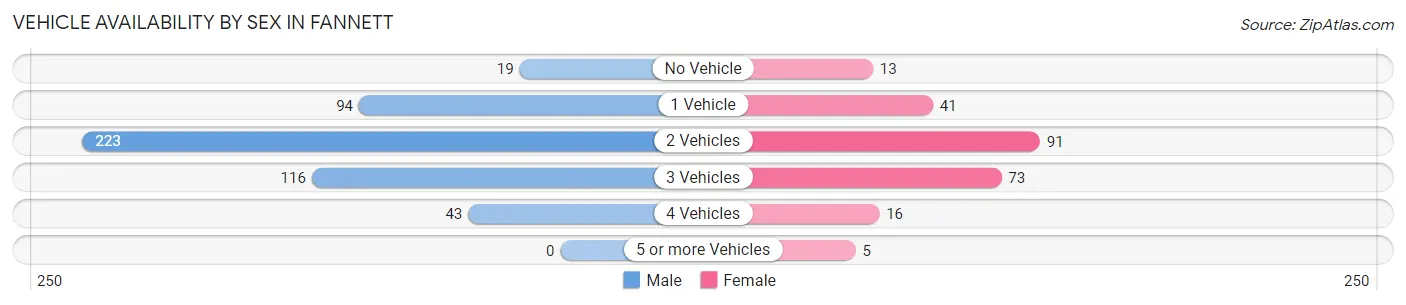
| Vehicles Available | Male | Female |
| No Vehicle | 19 (3.8%) | 13 (5.4%) |
| 1 Vehicle | 94 (19.0%) | 41 (17.2%) |
| 2 Vehicles | 223 (45.1%) | 91 (38.1%) |
| 3 Vehicles | 116 (23.4%) | 73 (30.5%) |
| 4 Vehicles | 43 (8.7%) | 16 (6.7%) |
| 5 or more Vehicles | 0 (0.0%) | 5 (2.1%) |
| Total | 495 (100.0%) | 239 (100.0%) |
Commute Time in Fannett
The most frequently occuring commute durations in Fannett are 20 to 24 minutes (204 commuters, 28.5%), 30 to 34 minutes (115 commuters, 16.1%), and 25 to 29 minutes (80 commuters, 11.2%).
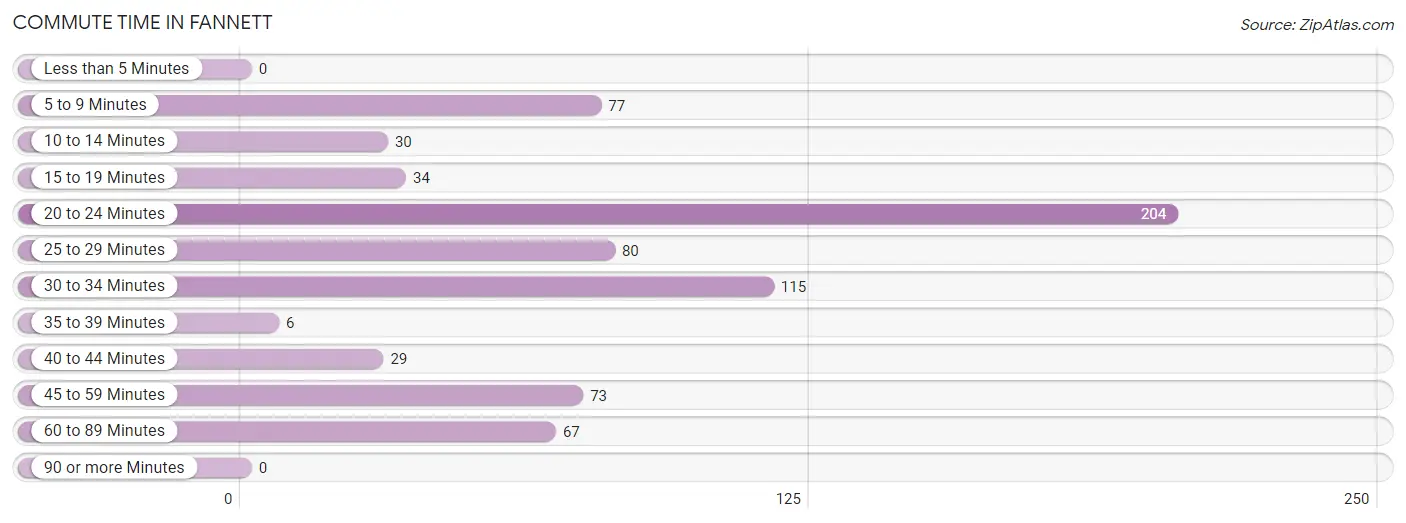
| Commute Time | # Commuters | % Commuters |
| Less than 5 Minutes | 0 | 0.0% |
| 5 to 9 Minutes | 77 | 10.8% |
| 10 to 14 Minutes | 30 | 4.2% |
| 15 to 19 Minutes | 34 | 4.8% |
| 20 to 24 Minutes | 204 | 28.5% |
| 25 to 29 Minutes | 80 | 11.2% |
| 30 to 34 Minutes | 115 | 16.1% |
| 35 to 39 Minutes | 6 | 0.8% |
| 40 to 44 Minutes | 29 | 4.1% |
| 45 to 59 Minutes | 73 | 10.2% |
| 60 to 89 Minutes | 67 | 9.4% |
| 90 or more Minutes | 0 | 0.0% |
Commute Time by Sex in Fannett
The most common commute times in Fannett are 20 to 24 minutes (125 commuters, 26.3%) for males and 20 to 24 minutes (79 commuters, 33.1%) for females.
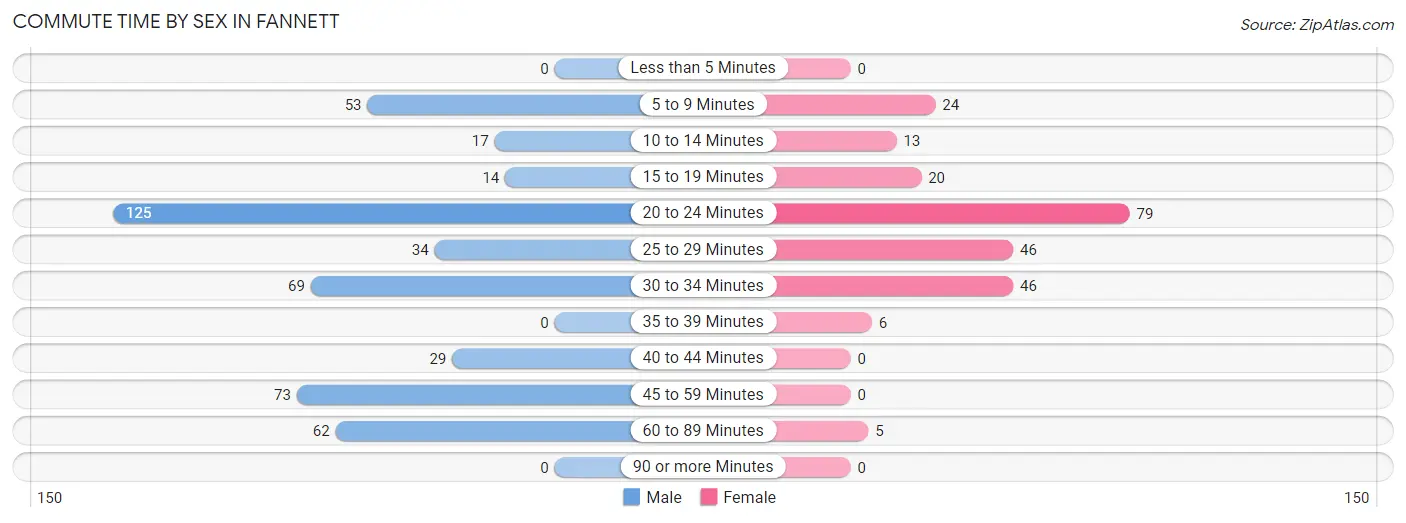
| Commute Time | Male | Female |
| Less than 5 Minutes | 0 (0.0%) | 0 (0.0%) |
| 5 to 9 Minutes | 53 (11.1%) | 24 (10.0%) |
| 10 to 14 Minutes | 17 (3.6%) | 13 (5.4%) |
| 15 to 19 Minutes | 14 (2.9%) | 20 (8.4%) |
| 20 to 24 Minutes | 125 (26.3%) | 79 (33.1%) |
| 25 to 29 Minutes | 34 (7.1%) | 46 (19.3%) |
| 30 to 34 Minutes | 69 (14.5%) | 46 (19.3%) |
| 35 to 39 Minutes | 0 (0.0%) | 6 (2.5%) |
| 40 to 44 Minutes | 29 (6.1%) | 0 (0.0%) |
| 45 to 59 Minutes | 73 (15.3%) | 0 (0.0%) |
| 60 to 89 Minutes | 62 (13.0%) | 5 (2.1%) |
| 90 or more Minutes | 0 (0.0%) | 0 (0.0%) |
Time of Departure to Work by Sex in Fannett
The most frequent times of departure to work in Fannett are 5:00 AM to 5:29 AM (109, 22.9%) for males and 7:00 AM to 7:29 AM (93, 38.9%) for females.
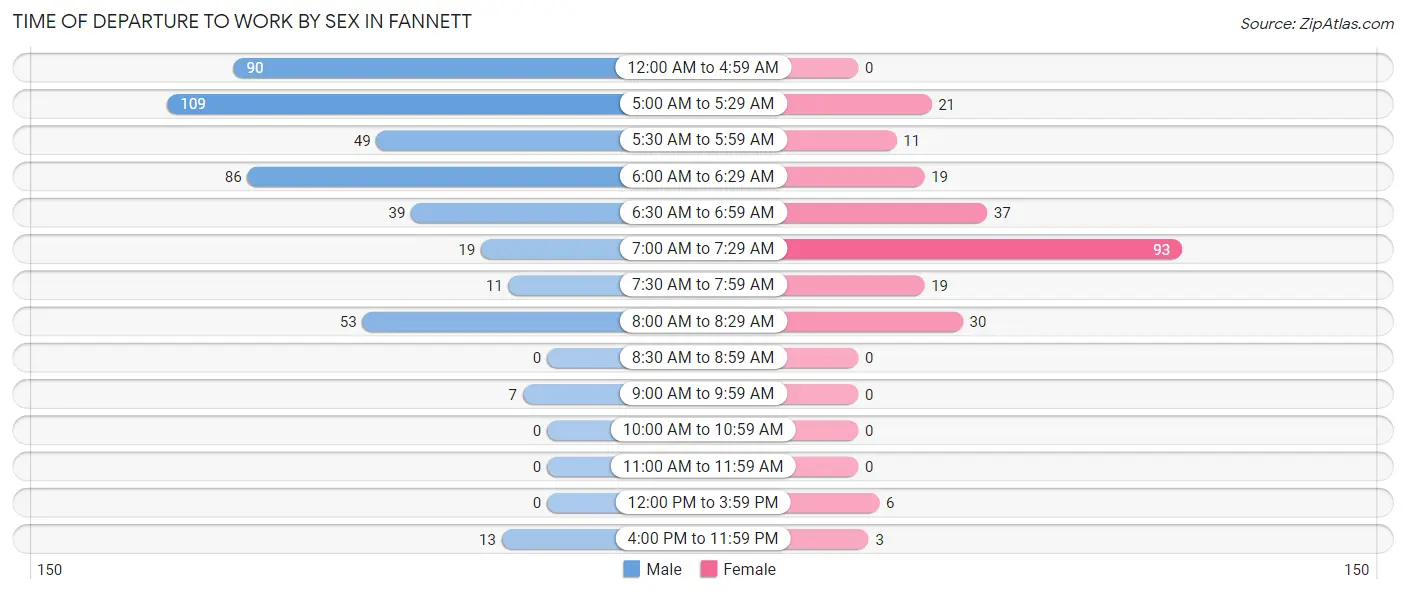
| Time of Departure | Male | Female |
| 12:00 AM to 4:59 AM | 90 (18.9%) | 0 (0.0%) |
| 5:00 AM to 5:29 AM | 109 (22.9%) | 21 (8.8%) |
| 5:30 AM to 5:59 AM | 49 (10.3%) | 11 (4.6%) |
| 6:00 AM to 6:29 AM | 86 (18.1%) | 19 (8.0%) |
| 6:30 AM to 6:59 AM | 39 (8.2%) | 37 (15.5%) |
| 7:00 AM to 7:29 AM | 19 (4.0%) | 93 (38.9%) |
| 7:30 AM to 7:59 AM | 11 (2.3%) | 19 (8.0%) |
| 8:00 AM to 8:29 AM | 53 (11.1%) | 30 (12.6%) |
| 8:30 AM to 8:59 AM | 0 (0.0%) | 0 (0.0%) |
| 9:00 AM to 9:59 AM | 7 (1.5%) | 0 (0.0%) |
| 10:00 AM to 10:59 AM | 0 (0.0%) | 0 (0.0%) |
| 11:00 AM to 11:59 AM | 0 (0.0%) | 0 (0.0%) |
| 12:00 PM to 3:59 PM | 0 (0.0%) | 6 (2.5%) |
| 4:00 PM to 11:59 PM | 13 (2.7%) | 3 (1.3%) |
| Total | 476 (100.0%) | 239 (100.0%) |
Housing Occupancy in Fannett
Occupancy by Ownership in Fannett
Of the total 740 dwellings in Fannett, owner-occupied units account for 590 (79.7%), while renter-occupied units make up 150 (20.3%).
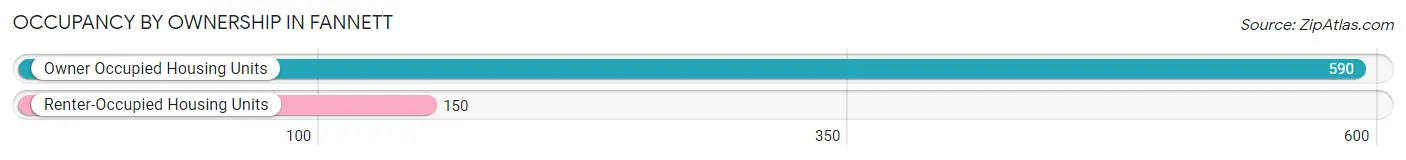
| Occupancy | # Housing Units | % Housing Units |
| Owner Occupied Housing Units | 590 | 79.7% |
| Renter-Occupied Housing Units | 150 | 20.3% |
| Total Occupied Housing Units | 740 | 100.0% |
Occupancy by Household Size in Fannett
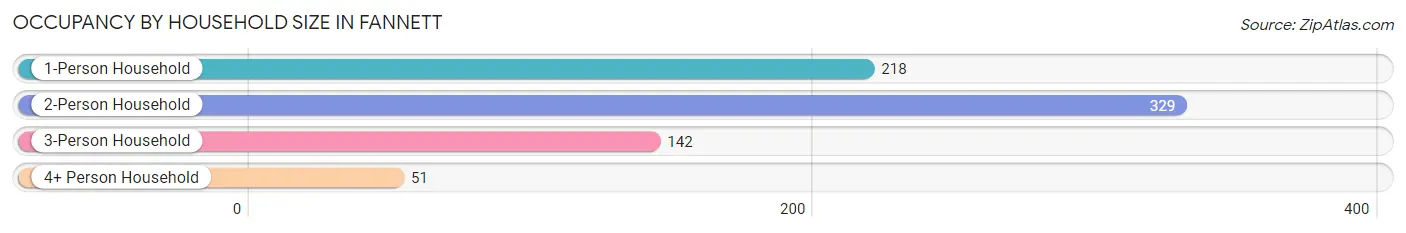
| Household Size | # Housing Units | % Housing Units |
| 1-Person Household | 218 | 29.5% |
| 2-Person Household | 329 | 44.5% |
| 3-Person Household | 142 | 19.2% |
| 4+ Person Household | 51 | 6.9% |
| Total Housing Units | 740 | 100.0% |
Occupancy by Ownership by Household Size in Fannett
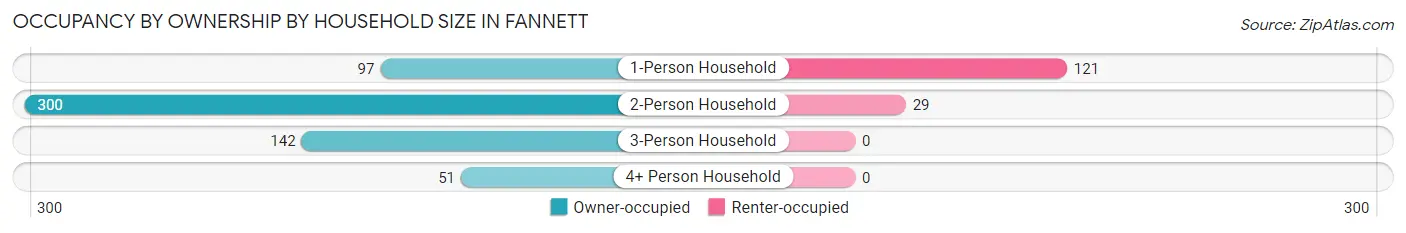
| Household Size | Owner-occupied | Renter-occupied |
| 1-Person Household | 97 (44.5%) | 121 (55.5%) |
| 2-Person Household | 300 (91.2%) | 29 (8.8%) |
| 3-Person Household | 142 (100.0%) | 0 (0.0%) |
| 4+ Person Household | 51 (100.0%) | 0 (0.0%) |
| Total Housing Units | 590 (79.7%) | 150 (20.3%) |
Occupancy by Educational Attainment in Fannett
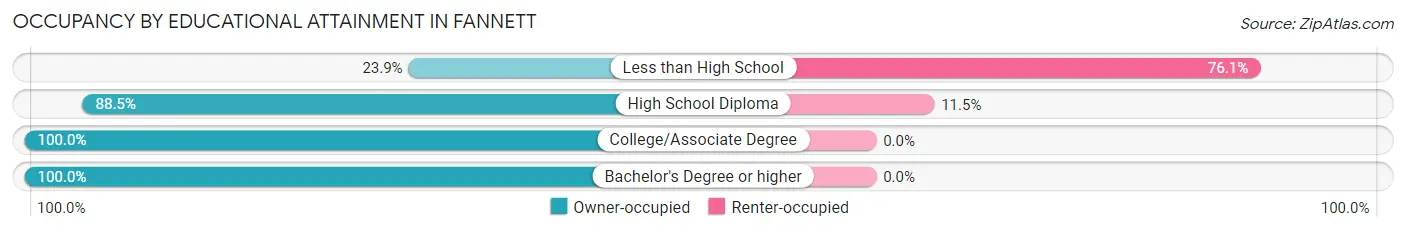
| Household Size | Owner-occupied | Renter-occupied |
| Less than High School | 38 (23.9%) | 121 (76.1%) |
| High School Diploma | 223 (88.5%) | 29 (11.5%) |
| College/Associate Degree | 195 (100.0%) | 0 (0.0%) |
| Bachelor's Degree or higher | 134 (100.0%) | 0 (0.0%) |
Occupancy by Age of Householder in Fannett
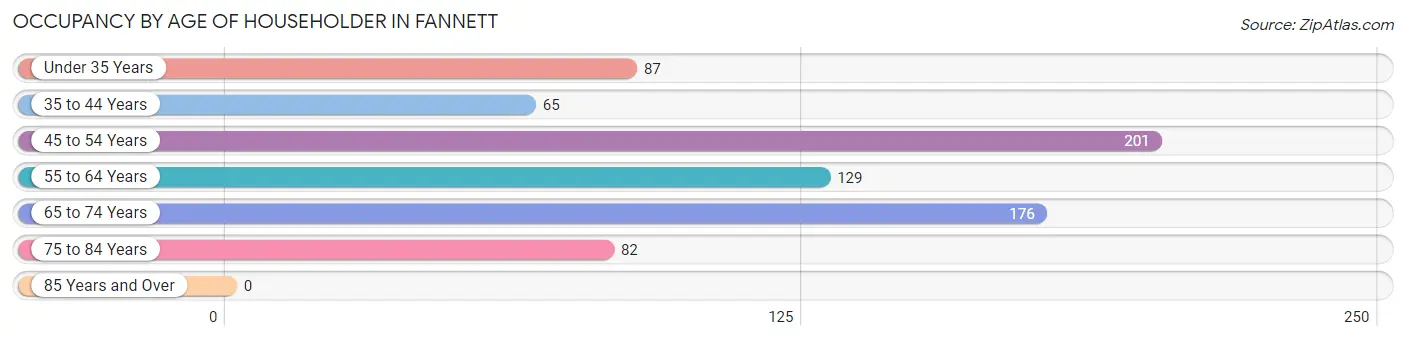
| Age Bracket | # Households | % Households |
| Under 35 Years | 87 | 11.8% |
| 35 to 44 Years | 65 | 8.8% |
| 45 to 54 Years | 201 | 27.2% |
| 55 to 64 Years | 129 | 17.4% |
| 65 to 74 Years | 176 | 23.8% |
| 75 to 84 Years | 82 | 11.1% |
| 85 Years and Over | 0 | 0.0% |
| Total | 740 | 100.0% |
Housing Finances in Fannett
Median Income by Occupancy in Fannett
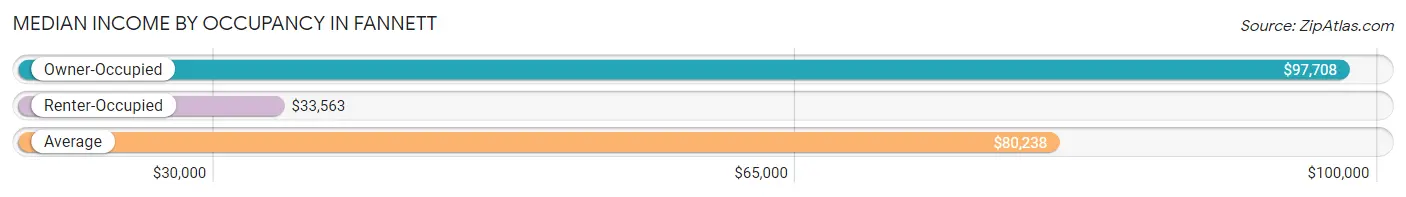
| Occupancy Type | # Households | Median Income |
| Owner-Occupied | 590 (79.7%) | $97,708 |
| Renter-Occupied | 150 (20.3%) | $33,563 |
| Average | 740 (100.0%) | $80,238 |
Occupancy by Householder Income Bracket in Fannett
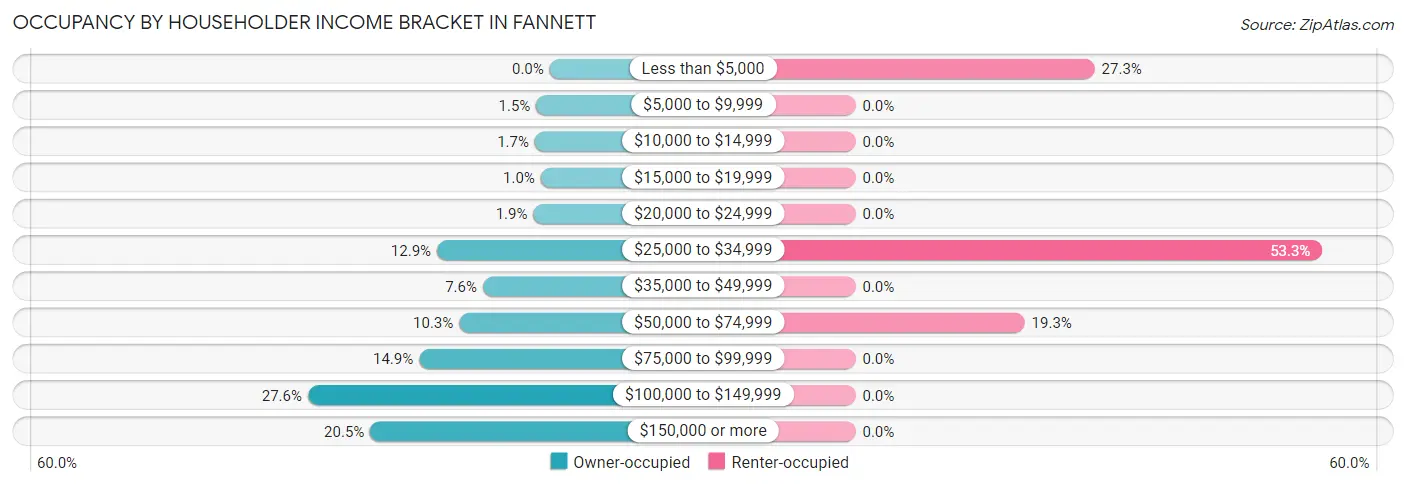
| Income Bracket | Owner-occupied | Renter-occupied |
| Less than $5,000 | 0 (0.0%) | 41 (27.3%) |
| $5,000 to $9,999 | 9 (1.5%) | 0 (0.0%) |
| $10,000 to $14,999 | 10 (1.7%) | 0 (0.0%) |
| $15,000 to $19,999 | 6 (1.0%) | 0 (0.0%) |
| $20,000 to $24,999 | 11 (1.9%) | 0 (0.0%) |
| $25,000 to $34,999 | 76 (12.9%) | 80 (53.3%) |
| $35,000 to $49,999 | 45 (7.6%) | 0 (0.0%) |
| $50,000 to $74,999 | 61 (10.3%) | 29 (19.3%) |
| $75,000 to $99,999 | 88 (14.9%) | 0 (0.0%) |
| $100,000 to $149,999 | 163 (27.6%) | 0 (0.0%) |
| $150,000 or more | 121 (20.5%) | 0 (0.0%) |
| Total | 590 (100.0%) | 150 (100.0%) |
Monthly Housing Cost Tiers in Fannett
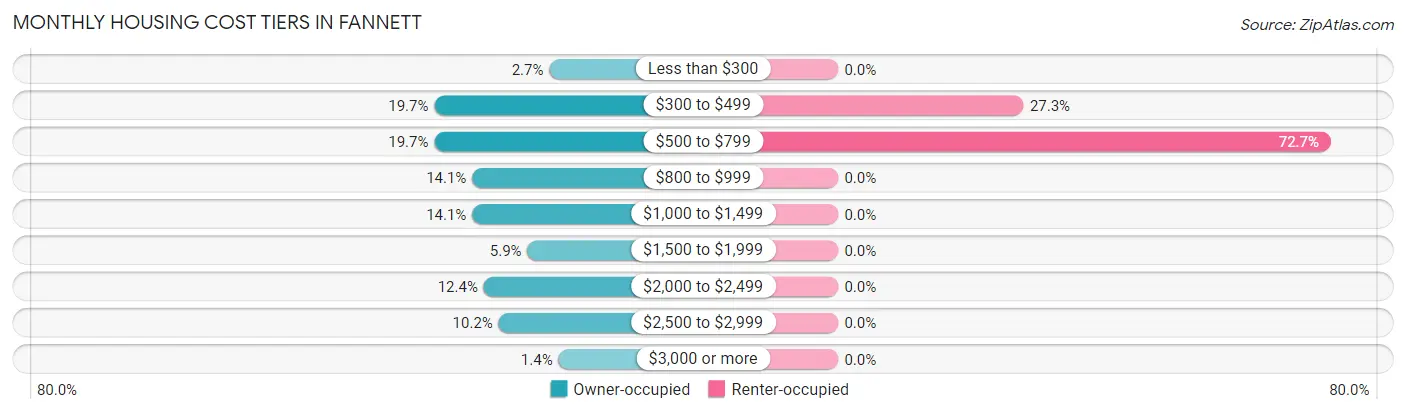
| Monthly Cost | Owner-occupied | Renter-occupied |
| Less than $300 | 16 (2.7%) | 0 (0.0%) |
| $300 to $499 | 116 (19.7%) | 41 (27.3%) |
| $500 to $799 | 116 (19.7%) | 109 (72.7%) |
| $800 to $999 | 83 (14.1%) | 0 (0.0%) |
| $1,000 to $1,499 | 83 (14.1%) | 0 (0.0%) |
| $1,500 to $1,999 | 35 (5.9%) | 0 (0.0%) |
| $2,000 to $2,499 | 73 (12.4%) | 0 (0.0%) |
| $2,500 to $2,999 | 60 (10.2%) | 0 (0.0%) |
| $3,000 or more | 8 (1.4%) | 0 (0.0%) |
| Total | 590 (100.0%) | 150 (100.0%) |
Physical Housing Characteristics in Fannett
Housing Structures in Fannett
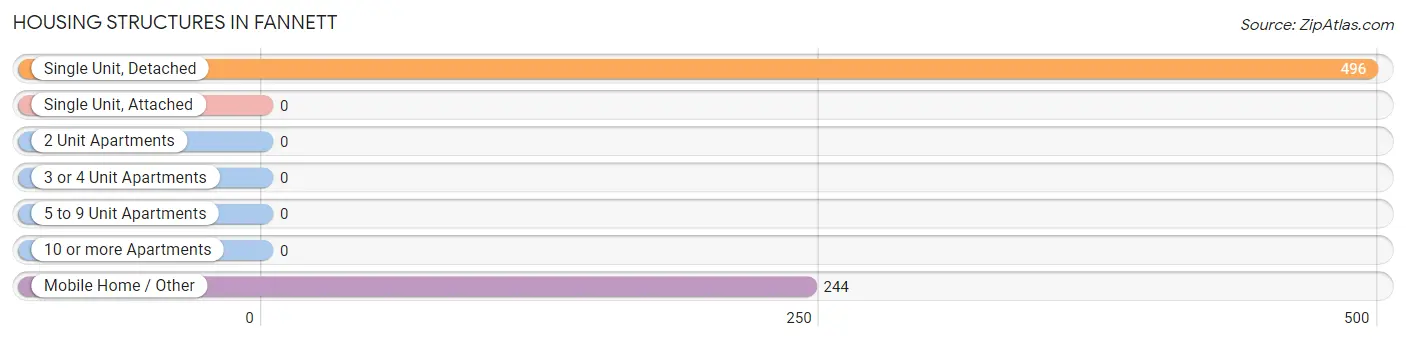
| Structure Type | # Housing Units | % Housing Units |
| Single Unit, Detached | 496 | 67.0% |
| Single Unit, Attached | 0 | 0.0% |
| 2 Unit Apartments | 0 | 0.0% |
| 3 or 4 Unit Apartments | 0 | 0.0% |
| 5 to 9 Unit Apartments | 0 | 0.0% |
| 10 or more Apartments | 0 | 0.0% |
| Mobile Home / Other | 244 | 33.0% |
| Total | 740 | 100.0% |
Housing Structures by Occupancy in Fannett
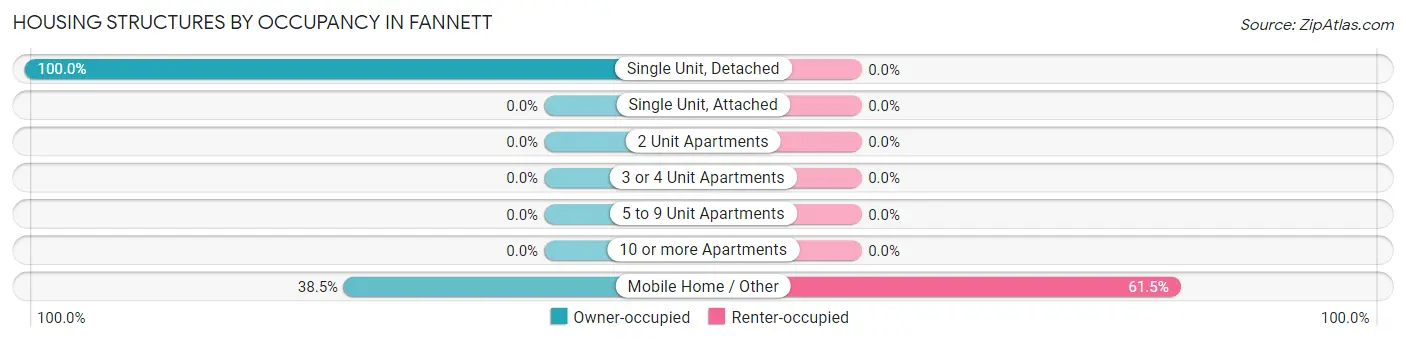
| Structure Type | Owner-occupied | Renter-occupied |
| Single Unit, Detached | 496 (100.0%) | 0 (0.0%) |
| Single Unit, Attached | 0 (0.0%) | 0 (0.0%) |
| 2 Unit Apartments | 0 (0.0%) | 0 (0.0%) |
| 3 or 4 Unit Apartments | 0 (0.0%) | 0 (0.0%) |
| 5 to 9 Unit Apartments | 0 (0.0%) | 0 (0.0%) |
| 10 or more Apartments | 0 (0.0%) | 0 (0.0%) |
| Mobile Home / Other | 94 (38.5%) | 150 (61.5%) |
| Total | 590 (79.7%) | 150 (20.3%) |
Housing Structures by Number of Rooms in Fannett
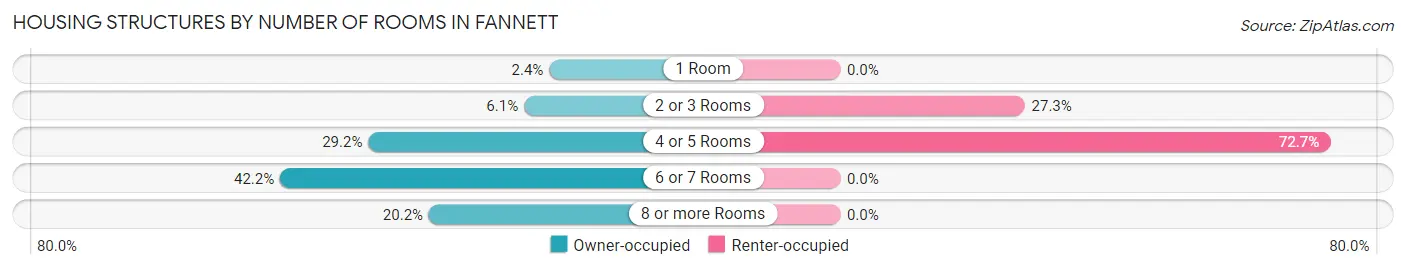
| Number of Rooms | Owner-occupied | Renter-occupied |
| 1 Room | 14 (2.4%) | 0 (0.0%) |
| 2 or 3 Rooms | 36 (6.1%) | 41 (27.3%) |
| 4 or 5 Rooms | 172 (29.1%) | 109 (72.7%) |
| 6 or 7 Rooms | 249 (42.2%) | 0 (0.0%) |
| 8 or more Rooms | 119 (20.2%) | 0 (0.0%) |
| Total | 590 (100.0%) | 150 (100.0%) |
Housing Structure by Heating Type in Fannett
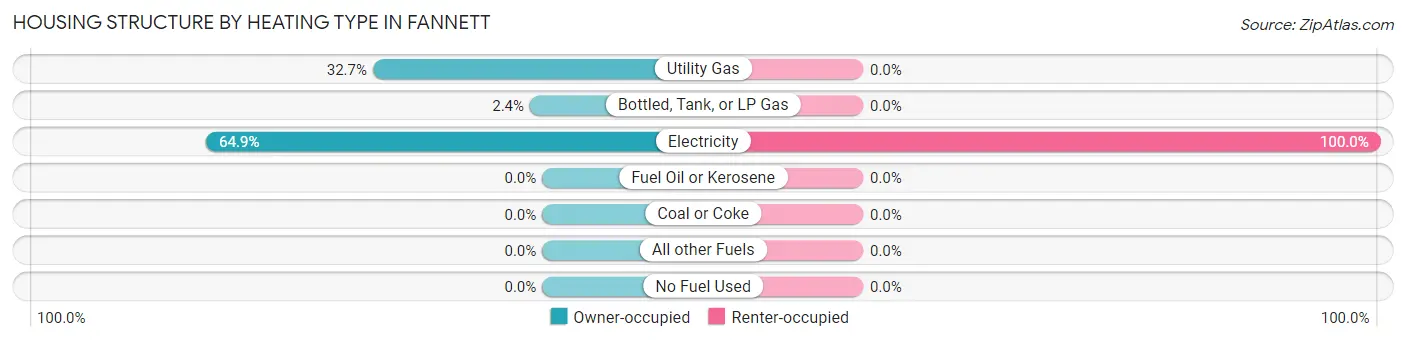
| Heating Type | Owner-occupied | Renter-occupied |
| Utility Gas | 193 (32.7%) | 0 (0.0%) |
| Bottled, Tank, or LP Gas | 14 (2.4%) | 0 (0.0%) |
| Electricity | 383 (64.9%) | 150 (100.0%) |
| Fuel Oil or Kerosene | 0 (0.0%) | 0 (0.0%) |
| Coal or Coke | 0 (0.0%) | 0 (0.0%) |
| All other Fuels | 0 (0.0%) | 0 (0.0%) |
| No Fuel Used | 0 (0.0%) | 0 (0.0%) |
| Total | 590 (100.0%) | 150 (100.0%) |
Household Vehicle Usage in Fannett
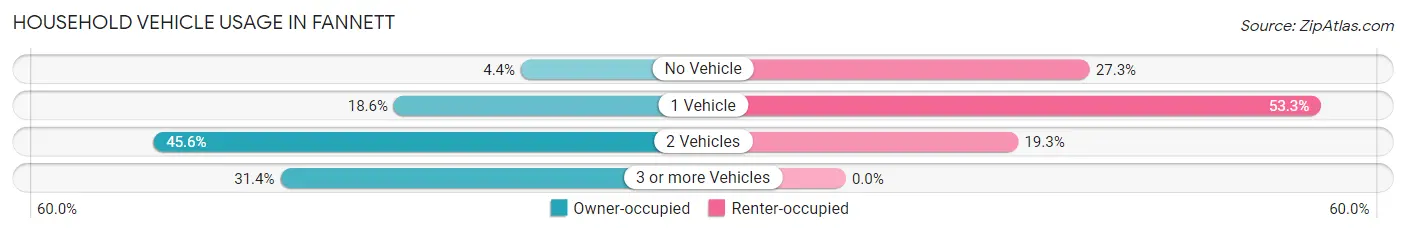
| Vehicles per Household | Owner-occupied | Renter-occupied |
| No Vehicle | 26 (4.4%) | 41 (27.3%) |
| 1 Vehicle | 110 (18.6%) | 80 (53.3%) |
| 2 Vehicles | 269 (45.6%) | 29 (19.3%) |
| 3 or more Vehicles | 185 (31.4%) | 0 (0.0%) |
| Total | 590 (100.0%) | 150 (100.0%) |
Real Estate & Mortgages in Fannett
Real Estate and Mortgage Overview in Fannett
| Characteristic | Without Mortgage | With Mortgage |
| Housing Units | 366 | 224 |
| Median Property Value | $204,600 | $319,600 |
| Median Household Income | $91,750 | $81 |
| Monthly Housing Costs | $600 | $8 |
| Real Estate Taxes | $2,587 | $0 |
Property Value by Mortgage Status in Fannett
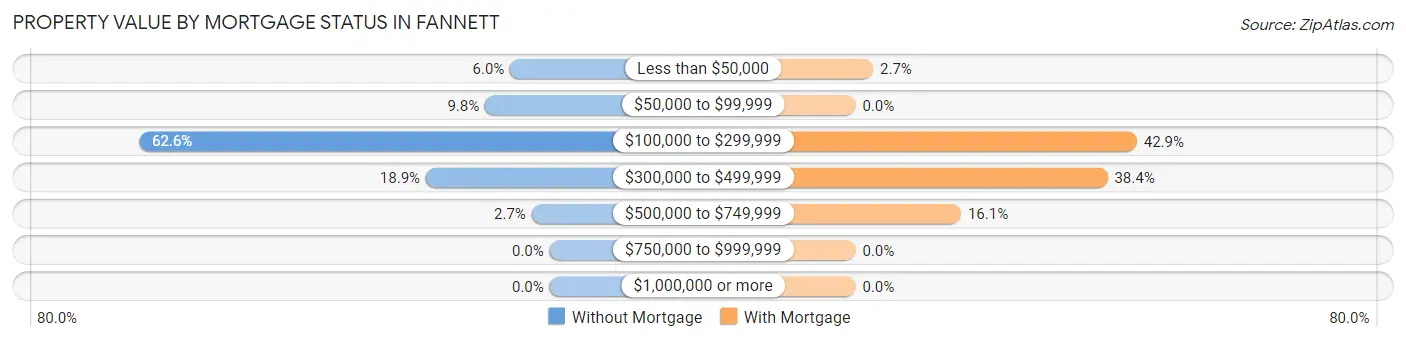
| Property Value | Without Mortgage | With Mortgage |
| Less than $50,000 | 22 (6.0%) | 6 (2.7%) |
| $50,000 to $99,999 | 36 (9.8%) | 0 (0.0%) |
| $100,000 to $299,999 | 229 (62.6%) | 96 (42.9%) |
| $300,000 to $499,999 | 69 (18.9%) | 86 (38.4%) |
| $500,000 to $749,999 | 10 (2.7%) | 36 (16.1%) |
| $750,000 to $999,999 | 0 (0.0%) | 0 (0.0%) |
| $1,000,000 or more | 0 (0.0%) | 0 (0.0%) |
| Total | 366 (100.0%) | 224 (100.0%) |
Household Income by Mortgage Status in Fannett
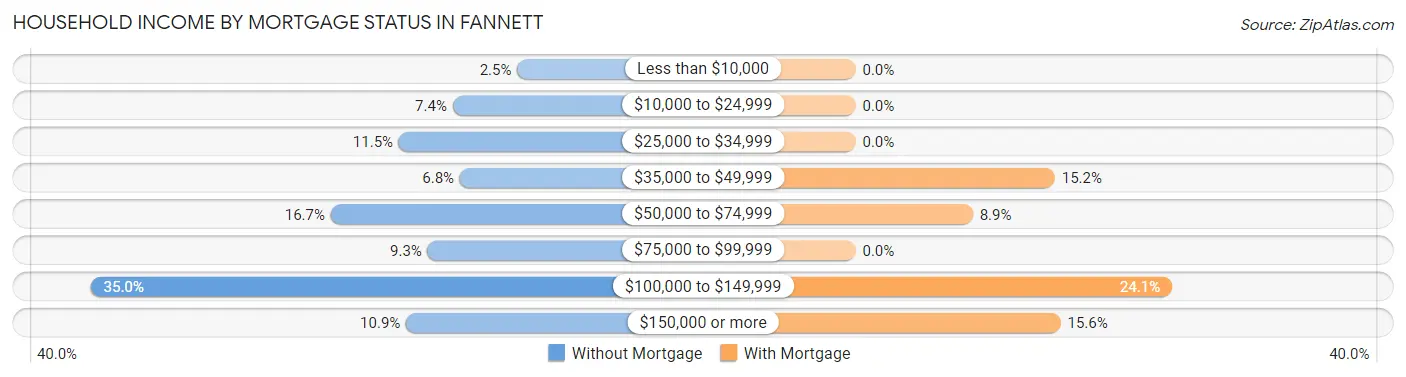
| Household Income | Without Mortgage | With Mortgage |
| Less than $10,000 | 9 (2.5%) | 0 (0.0%) |
| $10,000 to $24,999 | 27 (7.4%) | 0 (0.0%) |
| $25,000 to $34,999 | 42 (11.5%) | 0 (0.0%) |
| $35,000 to $49,999 | 25 (6.8%) | 34 (15.2%) |
| $50,000 to $74,999 | 61 (16.7%) | 20 (8.9%) |
| $75,000 to $99,999 | 34 (9.3%) | 0 (0.0%) |
| $100,000 to $149,999 | 128 (35.0%) | 54 (24.1%) |
| $150,000 or more | 40 (10.9%) | 35 (15.6%) |
| Total | 366 (100.0%) | 224 (100.0%) |
Property Value to Household Income Ratio in Fannett
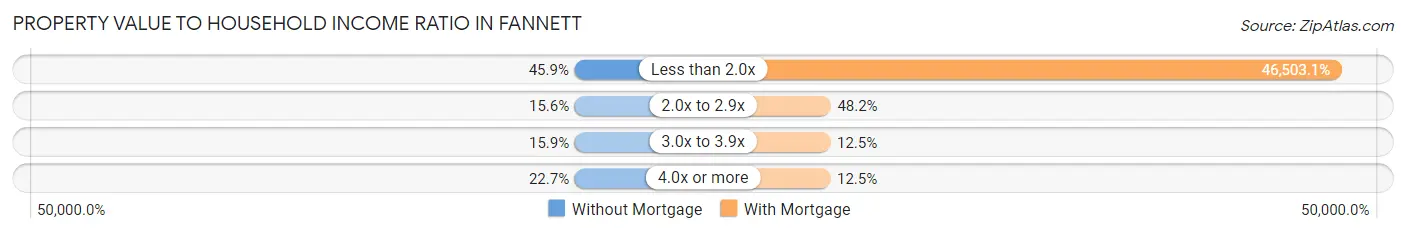
| Value-to-Income Ratio | Without Mortgage | With Mortgage |
| Less than 2.0x | 168 (45.9%) | 104,167 (46,503.1%) |
| 2.0x to 2.9x | 57 (15.6%) | 108 (48.2%) |
| 3.0x to 3.9x | 58 (15.9%) | 28 (12.5%) |
| 4.0x or more | 83 (22.7%) | 28 (12.5%) |
| Total | 366 (100.0%) | 224 (100.0%) |
Real Estate Taxes by Mortgage Status in Fannett
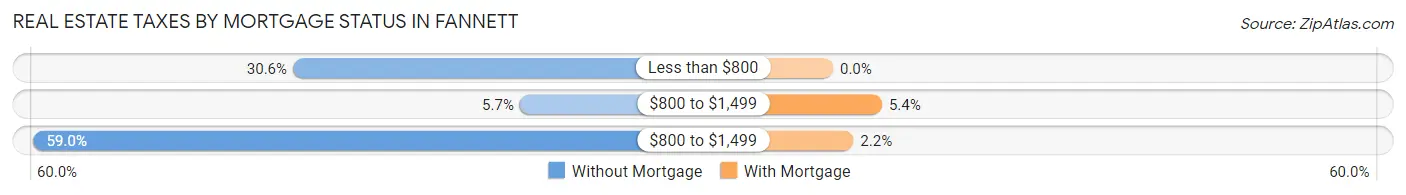
| Property Taxes | Without Mortgage | With Mortgage |
| Less than $800 | 112 (30.6%) | 0 (0.0%) |
| $800 to $1,499 | 21 (5.7%) | 12 (5.4%) |
| $800 to $1,499 | 216 (59.0%) | 5 (2.2%) |
| Total | 366 (100.0%) | 224 (100.0%) |
Health & Disability in Fannett
Health Insurance Coverage by Age in Fannett
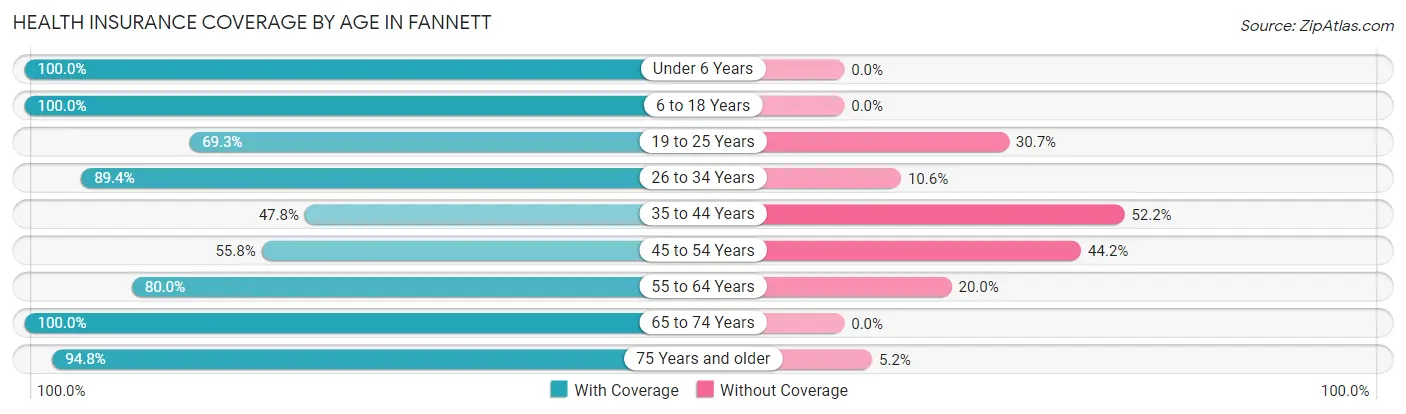
| Age Bracket | With Coverage | Without Coverage |
| Under 6 Years | 54 (100.0%) | 0 (0.0%) |
| 6 to 18 Years | 187 (100.0%) | 0 (0.0%) |
| 19 to 25 Years | 79 (69.3%) | 35 (30.7%) |
| 26 to 34 Years | 220 (89.4%) | 26 (10.6%) |
| 35 to 44 Years | 64 (47.8%) | 70 (52.2%) |
| 45 to 54 Years | 158 (55.8%) | 125 (44.2%) |
| 55 to 64 Years | 204 (80.0%) | 51 (20.0%) |
| 65 to 74 Years | 240 (100.0%) | 0 (0.0%) |
| 75 Years and older | 146 (94.8%) | 8 (5.2%) |
| Total | 1,352 (81.1%) | 315 (18.9%) |
Health Insurance Coverage by Citizenship Status in Fannett
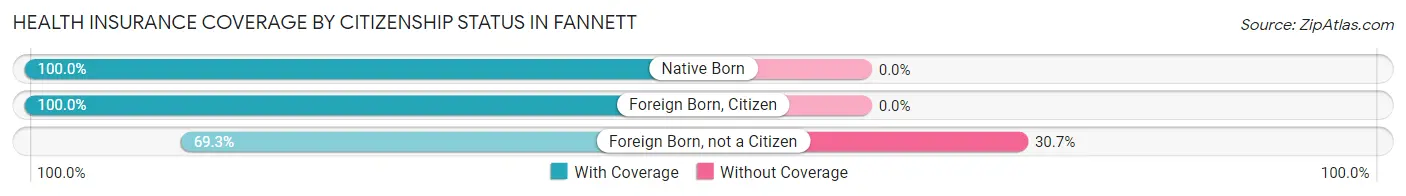
| Citizenship Status | With Coverage | Without Coverage |
| Native Born | 54 (100.0%) | 0 (0.0%) |
| Foreign Born, Citizen | 187 (100.0%) | 0 (0.0%) |
| Foreign Born, not a Citizen | 79 (69.3%) | 35 (30.7%) |
Health Insurance Coverage by Household Income in Fannett
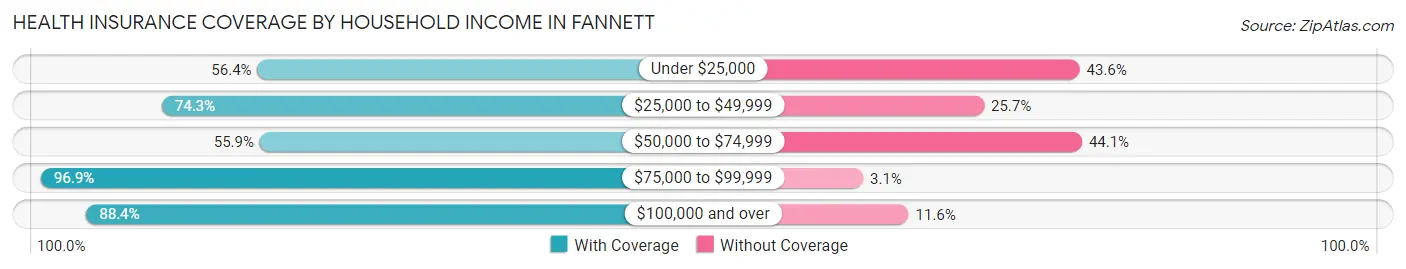
| Household Income | With Coverage | Without Coverage |
| Under $25,000 | 53 (56.4%) | 41 (43.6%) |
| $25,000 to $49,999 | 231 (74.3%) | 80 (25.7%) |
| $50,000 to $74,999 | 113 (55.9%) | 89 (44.1%) |
| $75,000 to $99,999 | 222 (96.9%) | 7 (3.1%) |
| $100,000 and over | 733 (88.4%) | 96 (11.6%) |
Public vs Private Health Insurance Coverage by Age in Fannett
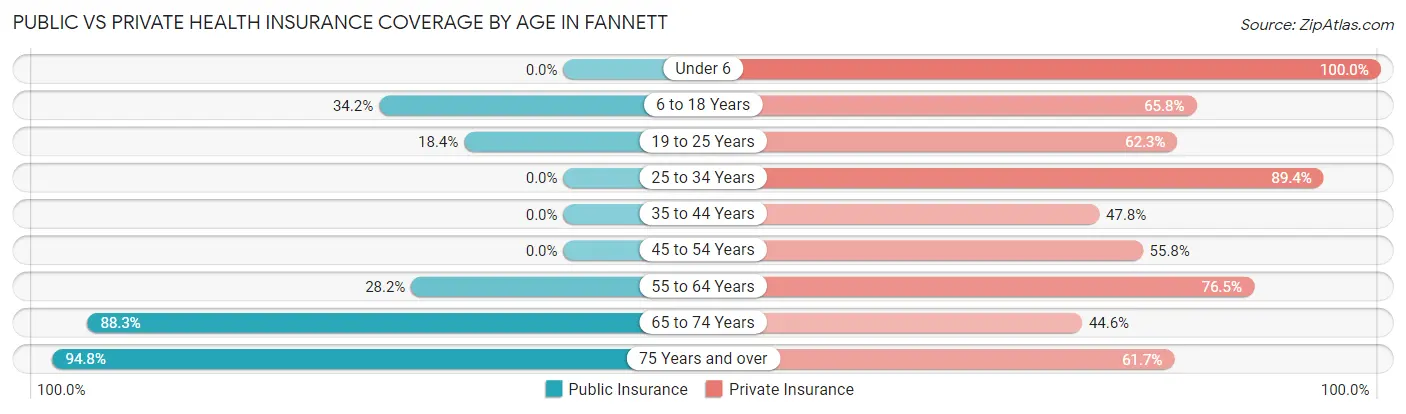
| Age Bracket | Public Insurance | Private Insurance |
| Under 6 | 0 (0.0%) | 54 (100.0%) |
| 6 to 18 Years | 64 (34.2%) | 123 (65.8%) |
| 19 to 25 Years | 21 (18.4%) | 71 (62.3%) |
| 25 to 34 Years | 0 (0.0%) | 220 (89.4%) |
| 35 to 44 Years | 0 (0.0%) | 64 (47.8%) |
| 45 to 54 Years | 0 (0.0%) | 158 (55.8%) |
| 55 to 64 Years | 72 (28.2%) | 195 (76.5%) |
| 65 to 74 Years | 212 (88.3%) | 107 (44.6%) |
| 75 Years and over | 146 (94.8%) | 95 (61.7%) |
| Total | 515 (30.9%) | 1,087 (65.2%) |
Disability Status by Sex by Age in Fannett
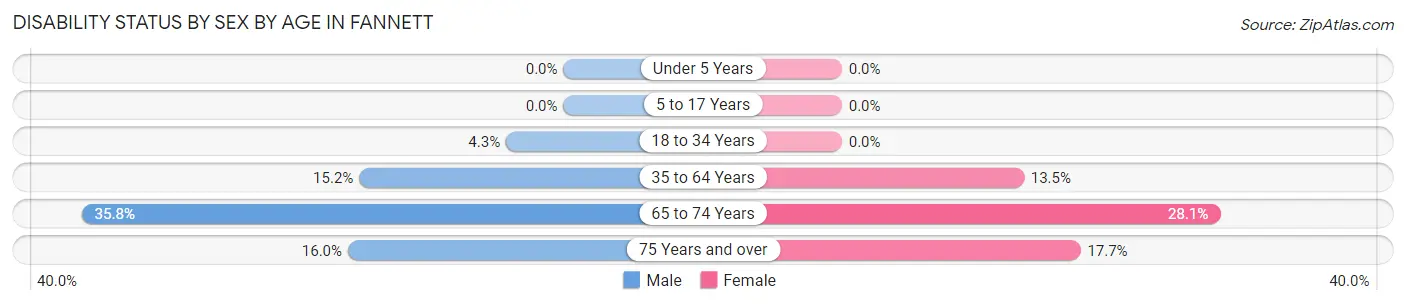
| Age Bracket | Male | Female |
| Under 5 Years | 0 (0.0%) | 0 (0.0%) |
| 5 to 17 Years | 0 (0.0%) | 0 (0.0%) |
| 18 to 34 Years | 8 (4.3%) | 0 (0.0%) |
| 35 to 64 Years | 57 (15.2%) | 40 (13.5%) |
| 65 to 74 Years | 54 (35.8%) | 25 (28.1%) |
| 75 Years and over | 12 (16.0%) | 14 (17.7%) |
Disability Class by Sex by Age in Fannett
Disability Class: Hearing Difficulty
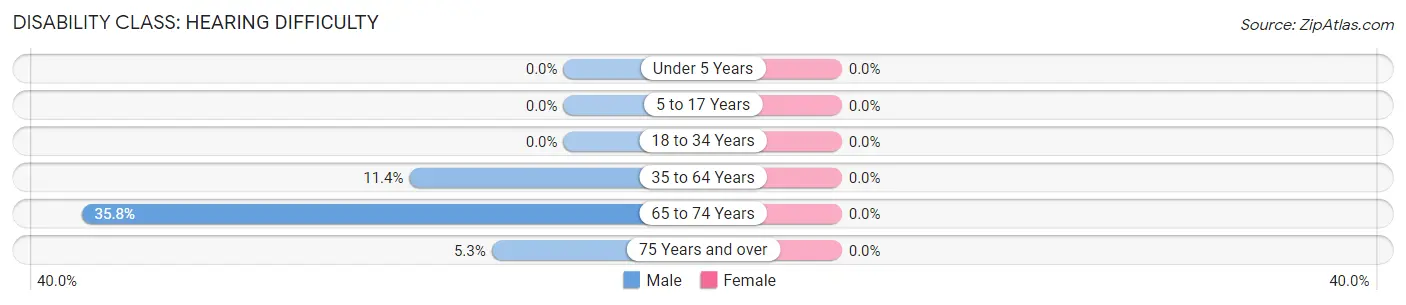
| Age Bracket | Male | Female |
| Under 5 Years | 0 (0.0%) | 0 (0.0%) |
| 5 to 17 Years | 0 (0.0%) | 0 (0.0%) |
| 18 to 34 Years | 0 (0.0%) | 0 (0.0%) |
| 35 to 64 Years | 43 (11.4%) | 0 (0.0%) |
| 65 to 74 Years | 54 (35.8%) | 0 (0.0%) |
| 75 Years and over | 4 (5.3%) | 0 (0.0%) |
Disability Class: Vision Difficulty
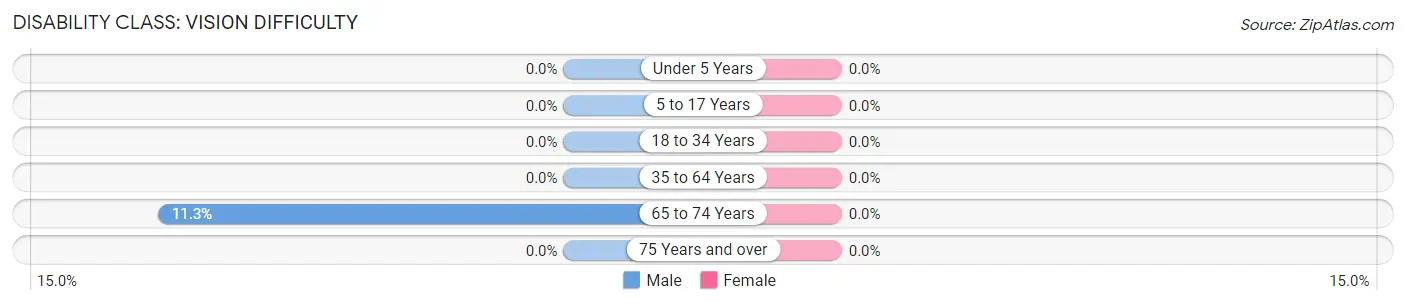
| Age Bracket | Male | Female |
| Under 5 Years | 0 (0.0%) | 0 (0.0%) |
| 5 to 17 Years | 0 (0.0%) | 0 (0.0%) |
| 18 to 34 Years | 0 (0.0%) | 0 (0.0%) |
| 35 to 64 Years | 0 (0.0%) | 0 (0.0%) |
| 65 to 74 Years | 17 (11.3%) | 0 (0.0%) |
| 75 Years and over | 0 (0.0%) | 0 (0.0%) |
Disability Class: Cognitive Difficulty
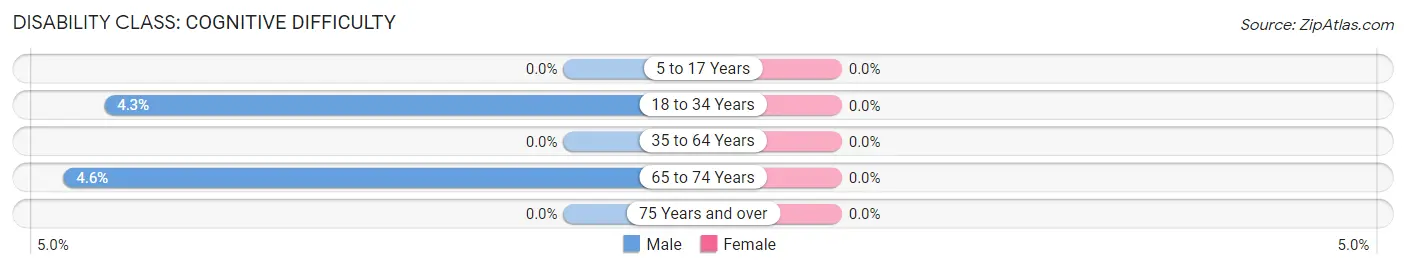
| Age Bracket | Male | Female |
| 5 to 17 Years | 0 (0.0%) | 0 (0.0%) |
| 18 to 34 Years | 8 (4.3%) | 0 (0.0%) |
| 35 to 64 Years | 0 (0.0%) | 0 (0.0%) |
| 65 to 74 Years | 7 (4.6%) | 0 (0.0%) |
| 75 Years and over | 0 (0.0%) | 0 (0.0%) |
Disability Class: Ambulatory Difficulty
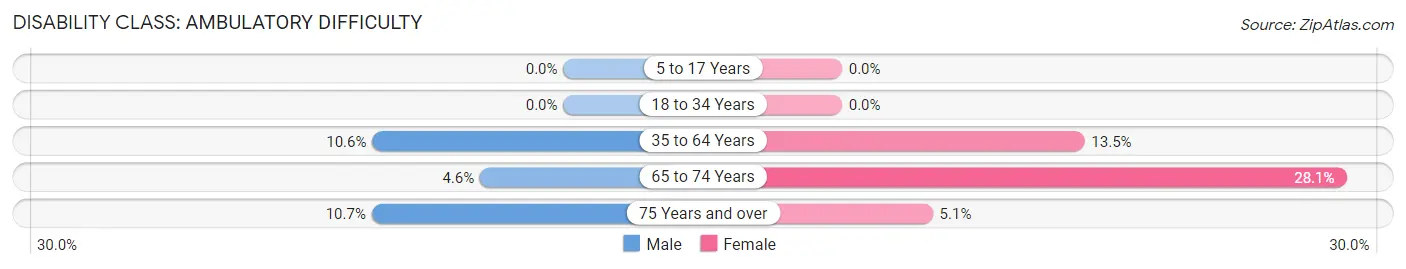
| Age Bracket | Male | Female |
| 5 to 17 Years | 0 (0.0%) | 0 (0.0%) |
| 18 to 34 Years | 0 (0.0%) | 0 (0.0%) |
| 35 to 64 Years | 40 (10.6%) | 40 (13.5%) |
| 65 to 74 Years | 7 (4.6%) | 25 (28.1%) |
| 75 Years and over | 8 (10.7%) | 4 (5.1%) |
Disability Class: Self-Care Difficulty
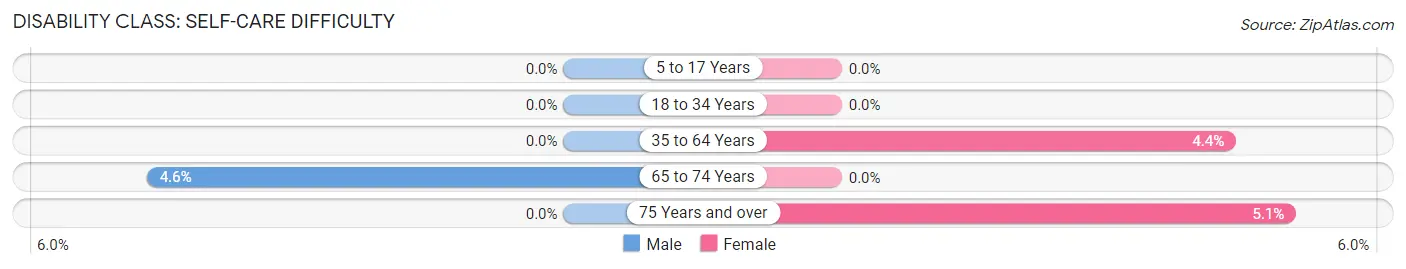
| Age Bracket | Male | Female |
| 5 to 17 Years | 0 (0.0%) | 0 (0.0%) |
| 18 to 34 Years | 0 (0.0%) | 0 (0.0%) |
| 35 to 64 Years | 0 (0.0%) | 13 (4.4%) |
| 65 to 74 Years | 7 (4.6%) | 0 (0.0%) |
| 75 Years and over | 0 (0.0%) | 4 (5.1%) |
Technology Access in Fannett
Computing Device Access in Fannett
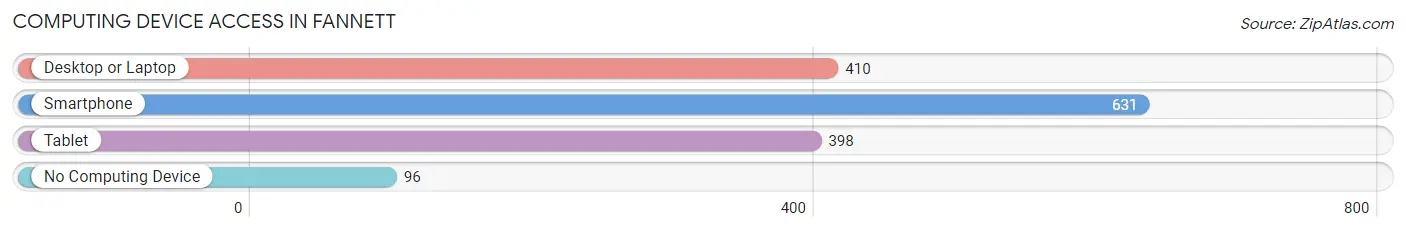
| Device Type | # Households | % Households |
| Desktop or Laptop | 410 | 55.4% |
| Smartphone | 631 | 85.3% |
| Tablet | 398 | 53.8% |
| No Computing Device | 96 | 13.0% |
| Total | 740 | 100.0% |
Internet Access in Fannett
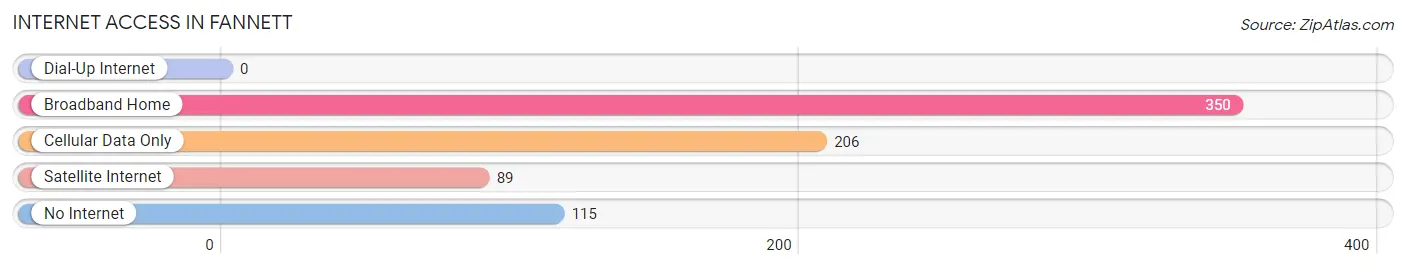
| Internet Type | # Households | % Households |
| Dial-Up Internet | 0 | 0.0% |
| Broadband Home | 350 | 47.3% |
| Cellular Data Only | 206 | 27.8% |
| Satellite Internet | 89 | 12.0% |
| No Internet | 115 | 15.5% |
| Total | 740 | 100.0% |
Fannett Summary
Fannett is an unincorporated community located in Jefferson County, Texas, United States. It is situated about 10 miles west of Beaumont and is part of the Beaumont–Port Arthur Metropolitan Statistical Area. The population of Fannett was estimated to be 1,845 in 2019.
History
Fannett was founded in 1845 by William Fannett, a settler from Tennessee. The town was originally known as Fannettville, but the name was changed to Fannett in 1891. The town was incorporated in 1892 and was the first incorporated town in Jefferson County.
The town was a major center of the lumber industry in the late 19th and early 20th centuries. The lumber industry was so important to the town that it was known as the “Lumber Capital of Texas”. The town also had a thriving agricultural industry, with cotton, corn, and sugar cane being the main crops.
In the early 20th century, Fannett was a popular tourist destination, with many people coming to the town to enjoy its natural beauty. The town was also home to a number of resorts, including the Fannett Hotel, which was built in 1910.
Geography
Fannett is located in southeastern Jefferson County, about 10 miles west of Beaumont. The town is situated on the banks of the Neches River, which flows through the area. The town is surrounded by pine forests and is located in the Piney Woods region of Texas.
The climate in Fannett is humid subtropical, with hot summers and mild winters. The average annual temperature is 68°F, with an average high of 87°F in the summer and an average low of 48°F in the winter. The average annual precipitation is 48 inches.
Economy
The economy of Fannett is largely based on agriculture and forestry. The town is home to several farms, which produce cotton, corn, and sugar cane. The town is also home to several lumber mills, which produce lumber for the construction industry.
The town is also home to several small businesses, including restaurants, convenience stores, and gas stations. The town is also home to a number of churches, which provide services to the local community.
Demographics
As of the 2010 census, the population of Fannett was 1,845. The racial makeup of the town was 79.3% White, 16.2% African American, 0.7% Native American, 0.3% Asian, 0.1% Pacific Islander, and 3.4% from other races. Hispanic or Latino of any race were 6.2% of the population.
The median household income in Fannett was $37,917, and the median family income was $45,625. The per capita income was $17,945. About 17.2% of the population was below the poverty line.
Conclusion
Fannett is a small unincorporated community located in Jefferson County, Texas. It was founded in 1845 and was the first incorporated town in the county. The town was a major center of the lumber industry in the late 19th and early 20th centuries and was also home to a thriving agricultural industry. The town is now home to several small businesses and churches, and the economy is largely based on agriculture and forestry. The population of Fannett was estimated to be 1,845 in 2019.
Common Questions
What is Per Capita Income in Fannett?
Per Capita income in Fannett is $43,253.
What is the Median Family Income in Fannett?
Median Family Income in Fannett is $115,625.
What is the Median Household income in Fannett?
Median Household Income in Fannett is $80,238.
What is Income or Wage Gap in Fannett?
Income or Wage Gap in Fannett is 5.9%.
Women in Fannett earn 94.1 cents for every dollar earned by a man.
What is Inequality or Gini Index in Fannett?
Inequality or Gini Index in Fannett is 0.46.
What is the Total Population of Fannett?
Total Population of Fannett is 1,667.
What is the Total Male Population of Fannett?
Total Male Population of Fannett is 900.
What is the Total Female Population of Fannett?
Total Female Population of Fannett is 767.
What is the Ratio of Males per 100 Females in Fannett?
There are 117.34 Males per 100 Females in Fannett.
What is the Ratio of Females per 100 Males in Fannett?
There are 85.22 Females per 100 Males in Fannett.
What is the Median Population Age in Fannett?
Median Population Age in Fannett is 48.2 Years.
What is the Average Family Size in Fannett
Average Family Size in Fannett is 2.8 People.
What is the Average Household Size in Fannett
Average Household Size in Fannett is 2.2 People.
How Large is the Labor Force in Fannett?
There are 740 People in the Labor Forcein in Fannett.
What is the Percentage of People in the Labor Force in Fannett?
50.4% of People are in the Labor Force in Fannett.
What is the Unemployment Rate in Fannett?
Unemployment Rate in Fannett is 0.7%.