Amelia, LA Map & Demographics
Amelia Map
Amelia Overview
$17,987
PER CAPITA INCOME
$46,537
AVG FAMILY INCOME
$45,333
AVG HOUSEHOLD INCOME
62.5%
WAGE / INCOME GAP [ % ]
37.5¢/ $1
WAGE / INCOME GAP [ $ ]
$13,096
FAMILY INCOME DEFICIT
0.41
INEQUALITY / GINI INDEX
2,000
TOTAL POPULATION
1,044
MALE POPULATION
956
FEMALE POPULATION
109.21
MALES / 100 FEMALES
91.57
FEMALES / 100 MALES
31.7
MEDIAN AGE
3.2
AVG FAMILY SIZE
2.8
AVG HOUSEHOLD SIZE
811
LABOR FORCE [ PEOPLE ]
53.8%
PERCENT IN LABOR FORCE
8.5%
UNEMPLOYMENT RATE
Amelia Zip Codes
Income in Amelia
Income Overview in Amelia
Per Capita Income in Amelia is $17,987, while median incomes of families and households are $46,537 and $45,333 respectively.
| Characteristic | Number | Measure |
| Per Capita Income | 2,000 | $17,987 |
| Median Family Income | 570 | $46,537 |
| Mean Family Income | 570 | $54,385 |
| Median Household Income | 705 | $45,333 |
| Mean Household Income | 705 | $47,871 |
| Income Deficit | 570 | $13,096 |
| Wage / Income Gap (%) | 2,000 | 62.53% |
| Wage / Income Gap ($) | 2,000 | 37.47¢ per $1 |
| Gini / Inequality Index | 2,000 | 0.41 |
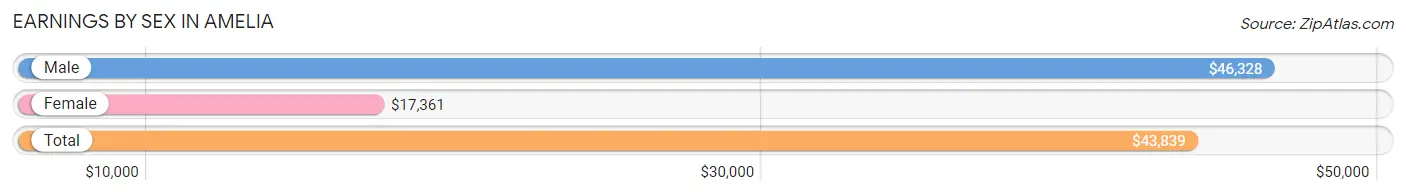
Earnings by Sex in Amelia
Average Earnings in Amelia are $43,839, $46,328 for men and $17,361 for women, a difference of 62.5%.
| Sex | Number | Average Earnings |
| Male | 491 (60.2%) | $46,328 |
| Female | 325 (39.8%) | $17,361 |
| Total | 816 (100.0%) | $43,839 |
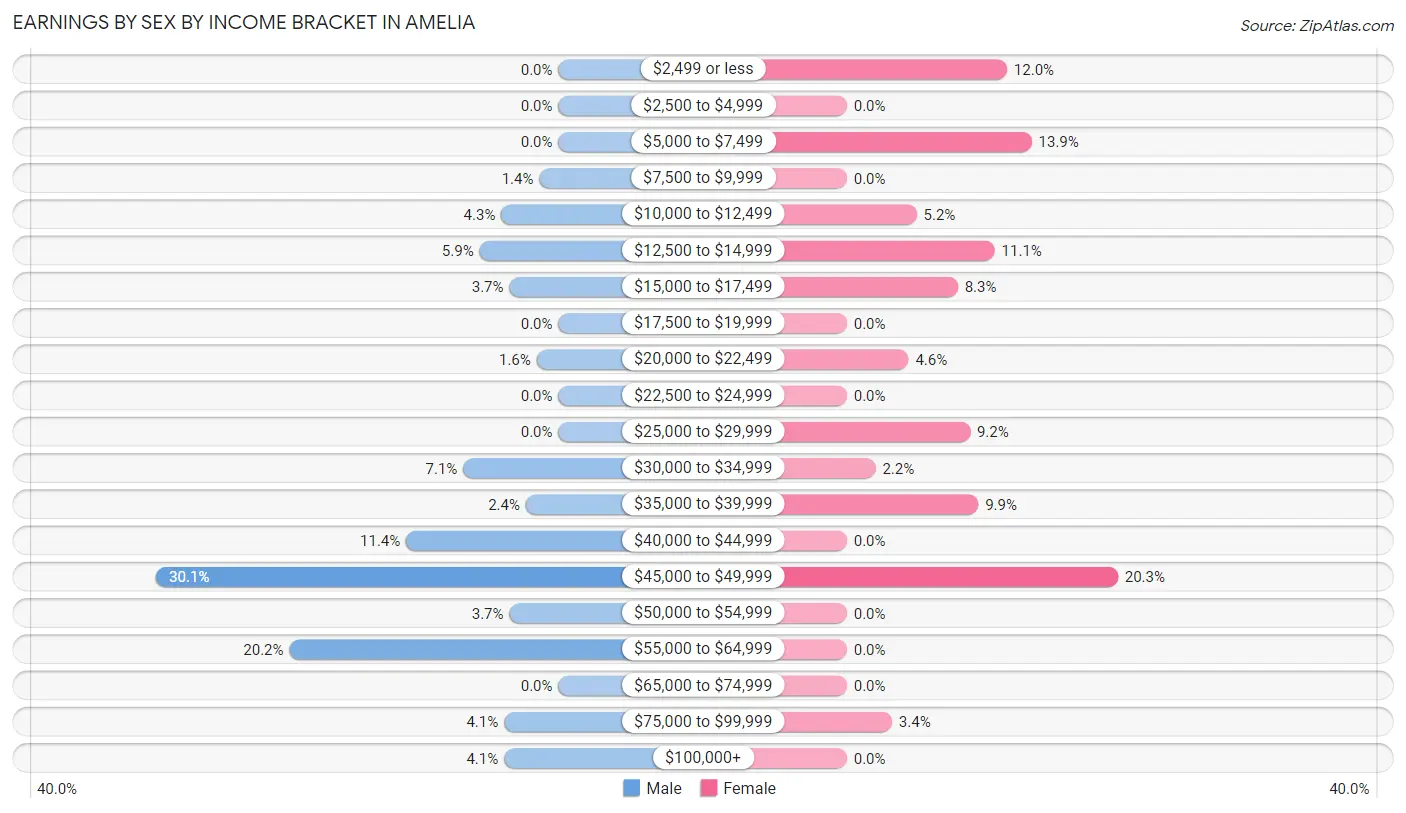
Earnings by Sex by Income Bracket in Amelia
The most common earnings brackets in Amelia are $45,000 to $49,999 for men (148 | 30.1%) and $45,000 to $49,999 for women (66 | 20.3%).
| Income | Male | Female |
| $2,499 or less | 0 (0.0%) | 39 (12.0%) |
| $2,500 to $4,999 | 0 (0.0%) | 0 (0.0%) |
| $5,000 to $7,499 | 0 (0.0%) | 45 (13.9%) |
| $7,500 to $9,999 | 7 (1.4%) | 0 (0.0%) |
| $10,000 to $12,499 | 21 (4.3%) | 17 (5.2%) |
| $12,500 to $14,999 | 29 (5.9%) | 36 (11.1%) |
| $15,000 to $17,499 | 18 (3.7%) | 27 (8.3%) |
| $17,500 to $19,999 | 0 (0.0%) | 0 (0.0%) |
| $20,000 to $22,499 | 8 (1.6%) | 15 (4.6%) |
| $22,500 to $24,999 | 0 (0.0%) | 0 (0.0%) |
| $25,000 to $29,999 | 0 (0.0%) | 30 (9.2%) |
| $30,000 to $34,999 | 35 (7.1%) | 7 (2.1%) |
| $35,000 to $39,999 | 12 (2.4%) | 32 (9.9%) |
| $40,000 to $44,999 | 56 (11.4%) | 0 (0.0%) |
| $45,000 to $49,999 | 148 (30.1%) | 66 (20.3%) |
| $50,000 to $54,999 | 18 (3.7%) | 0 (0.0%) |
| $55,000 to $64,999 | 99 (20.2%) | 0 (0.0%) |
| $65,000 to $74,999 | 0 (0.0%) | 0 (0.0%) |
| $75,000 to $99,999 | 20 (4.1%) | 11 (3.4%) |
| $100,000+ | 20 (4.1%) | 0 (0.0%) |
| Total | 491 (100.0%) | 325 (100.0%) |
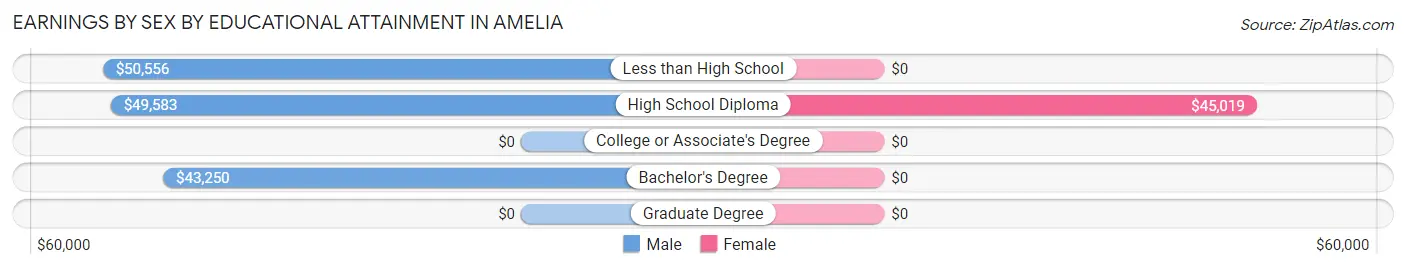
Earnings by Sex by Educational Attainment in Amelia
Average earnings in Amelia are $47,335 for men and $27,361 for women, a difference of 42.2%. Men with an educational attainment of less than high school enjoy the highest average annual earnings of $50,556, while those with bachelor's degree education earn the least with $43,250. Women with an educational attainment of high school diploma earn the most with the average annual earnings of $45,019, while those with high school diploma education have the smallest earnings of $45,019.
| Educational Attainment | Male Income | Female Income |
| Less than High School | $50,556 | $0 |
| High School Diploma | $49,583 | $45,019 |
| College or Associate's Degree | - | - |
| Bachelor's Degree | $43,250 | $0 |
| Graduate Degree | - | - |
| Total | $47,335 | $27,361 |
Family Income in Amelia
Family Income Brackets in Amelia
According to the Amelia family income data, there are 178 families falling into the $35,000 to $49,999 income range, which is the most common income bracket and makes up 31.2% of all families.
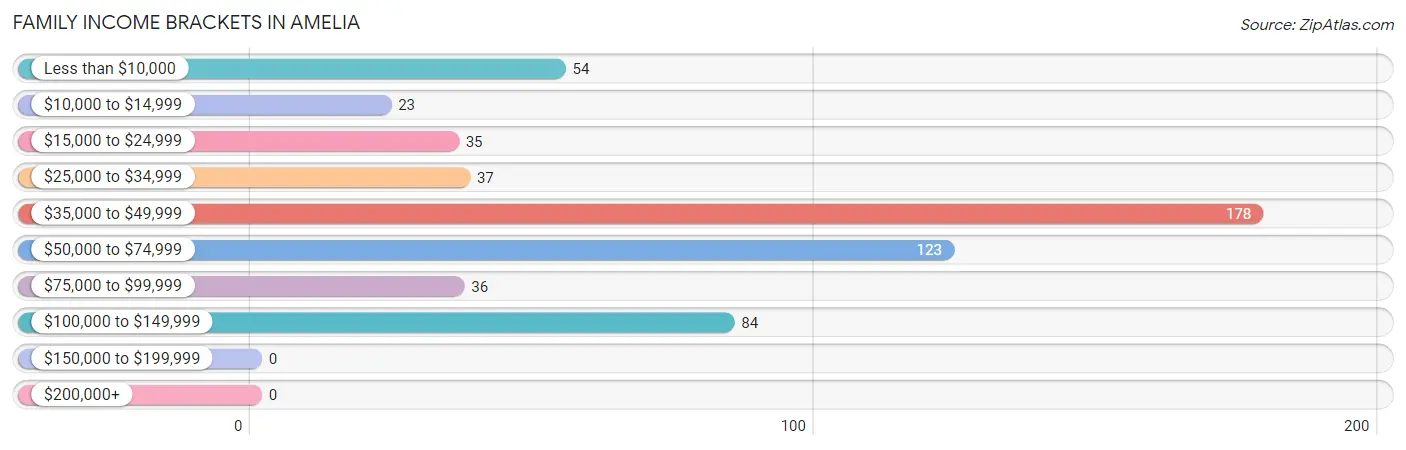
| Income Bracket | # Families | % Families |
| Less than $10,000 | 54 | 9.5% |
| $10,000 to $14,999 | 23 | 4.0% |
| $15,000 to $24,999 | 35 | 6.1% |
| $25,000 to $34,999 | 37 | 6.5% |
| $35,000 to $49,999 | 178 | 31.2% |
| $50,000 to $74,999 | 123 | 21.6% |
| $75,000 to $99,999 | 36 | 6.3% |
| $100,000 to $149,999 | 84 | 14.7% |
| $150,000 to $199,999 | 0 | 0.0% |
| $200,000+ | 0 | 0.0% |
Family Income by Famaliy Size in Amelia
5-person families (60 | 10.5%) account for the highest median family income in Amelia with $68,214 per family, while 2-person families (290 | 50.9%) have the highest median income of $22,730 per family member.
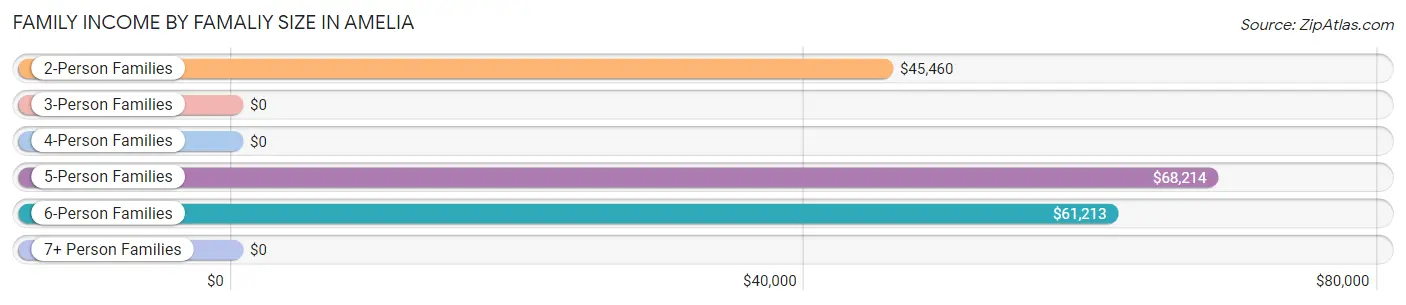
| Income Bracket | # Families | Median Income |
| 2-Person Families | 290 (50.9%) | $45,460 |
| 3-Person Families | 96 (16.8%) | $0 |
| 4-Person Families | 43 (7.5%) | $0 |
| 5-Person Families | 60 (10.5%) | $68,214 |
| 6-Person Families | 81 (14.2%) | $61,213 |
| 7+ Person Families | 0 (0.0%) | $0 |
| Total | 570 (100.0%) | $46,537 |
Family Income by Number of Earners in Amelia
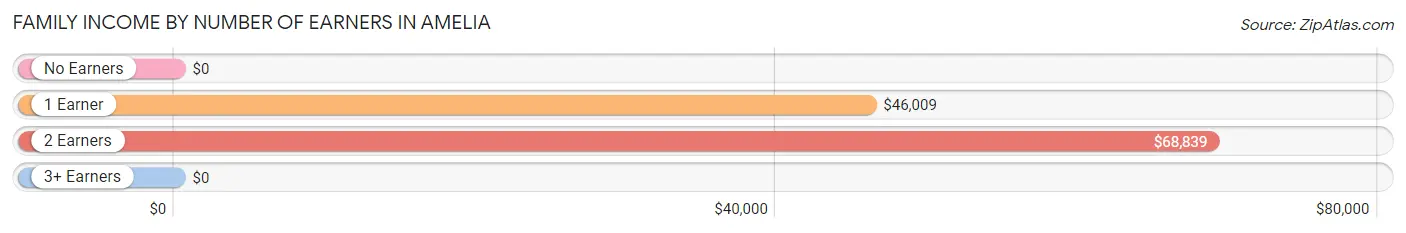
| Number of Earners | # Families | Median Income |
| No Earners | 88 (15.4%) | $0 |
| 1 Earner | 308 (54.0%) | $46,009 |
| 2 Earners | 139 (24.4%) | $68,839 |
| 3+ Earners | 35 (6.1%) | $0 |
| Total | 570 (100.0%) | $46,537 |
Household Income in Amelia
Household Income Brackets in Amelia
With 190 households falling in the category, the $35,000 to $49,999 income range is the most frequent in Amelia, accounting for 27.0% of all households.
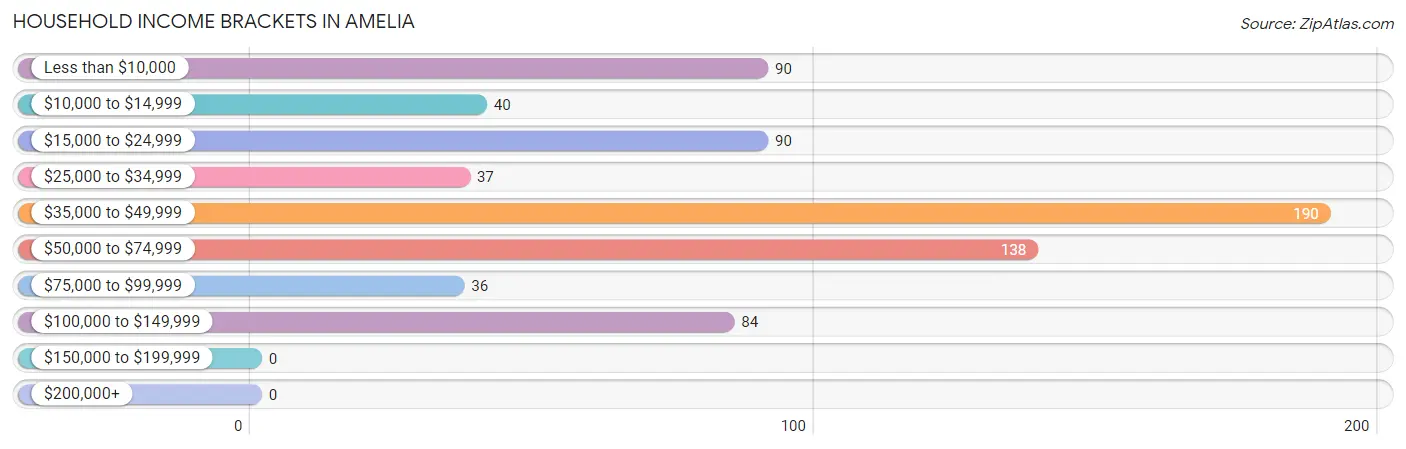
| Income Bracket | # Households | % Households |
| Less than $10,000 | 90 | 12.8% |
| $10,000 to $14,999 | 40 | 5.7% |
| $15,000 to $24,999 | 90 | 12.8% |
| $25,000 to $34,999 | 37 | 5.2% |
| $35,000 to $49,999 | 190 | 27.0% |
| $50,000 to $74,999 | 138 | 19.6% |
| $75,000 to $99,999 | 36 | 5.1% |
| $100,000 to $149,999 | 84 | 11.9% |
| $150,000 to $199,999 | 0 | 0.0% |
| $200,000+ | 0 | 0.0% |
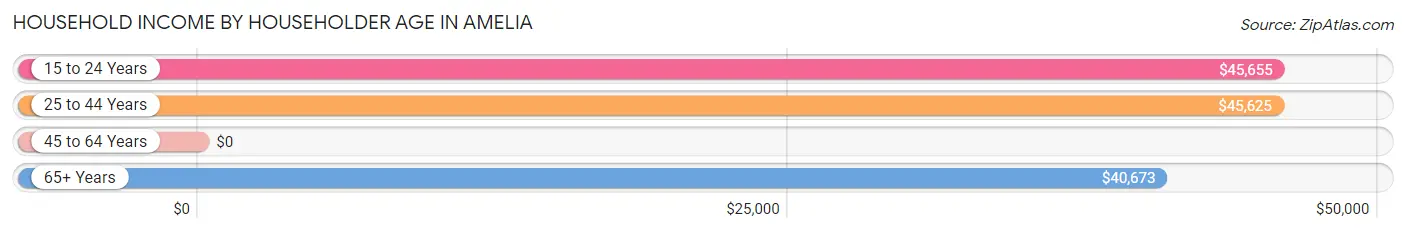
Household Income by Householder Age in Amelia
The median household income in Amelia is $45,333, with the highest median household income of $45,655 found in the 15 to 24 years age bracket for the primary householder. A total of 61 households (8.6%) fall into this category. Meanwhile, the 45 to 64 years age bracket for the primary householder has the lowest median household income of $0, with 172 households (24.4%) in this group.
| Income Bracket | # Households | Median Income |
| 15 to 24 Years | 61 (8.6%) | $45,655 |
| 25 to 44 Years | 306 (43.4%) | $45,625 |
| 45 to 64 Years | 172 (24.4%) | $0 |
| 65+ Years | 166 (23.5%) | $40,673 |
| Total | 705 (100.0%) | $45,333 |
Poverty in Amelia
Income Below Poverty by Sex and Age in Amelia
With 16.0% poverty level for males and 28.2% for females among the residents of Amelia, 15 year old males and 16 and 17 year old females are the most vulnerable to poverty, with 5 males (100.0%) and 20 females (100.0%) in their respective age groups living below the poverty level.
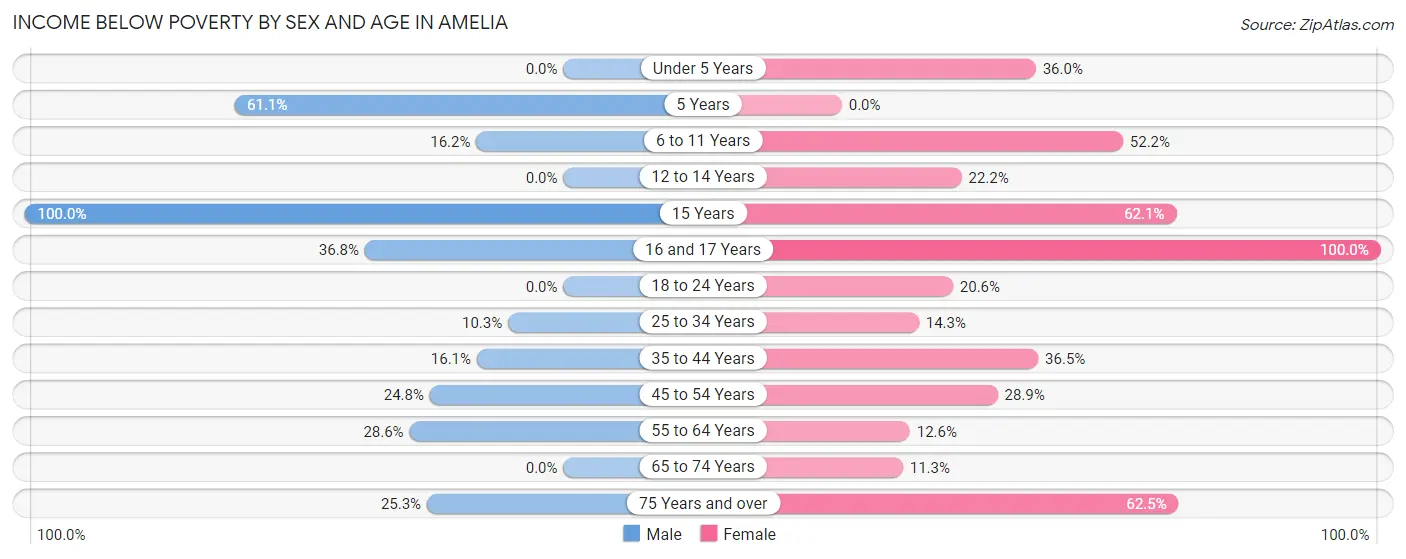
| Age Bracket | Male | Female |
| Under 5 Years | 0 (0.0%) | 36 (36.0%) |
| 5 Years | 11 (61.1%) | 0 (0.0%) |
| 6 to 11 Years | 16 (16.2%) | 12 (52.2%) |
| 12 to 14 Years | 0 (0.0%) | 12 (22.2%) |
| 15 Years | 5 (100.0%) | 18 (62.1%) |
| 16 and 17 Years | 14 (36.8%) | 20 (100.0%) |
| 18 to 24 Years | 0 (0.0%) | 33 (20.6%) |
| 25 to 34 Years | 12 (10.3%) | 10 (14.3%) |
| 35 to 44 Years | 31 (16.1%) | 39 (36.4%) |
| 45 to 54 Years | 30 (24.8%) | 37 (28.9%) |
| 55 to 64 Years | 28 (28.6%) | 12 (12.6%) |
| 65 to 74 Years | 0 (0.0%) | 6 (11.3%) |
| 75 Years and over | 20 (25.3%) | 35 (62.5%) |
| Total | 167 (16.0%) | 270 (28.2%) |
Income Above Poverty by Sex and Age in Amelia
According to the poverty statistics in Amelia, males aged under 5 years and females aged 5 years are the age groups that are most secure financially, with 100.0% of males and 100.0% of females in these age groups living above the poverty line.
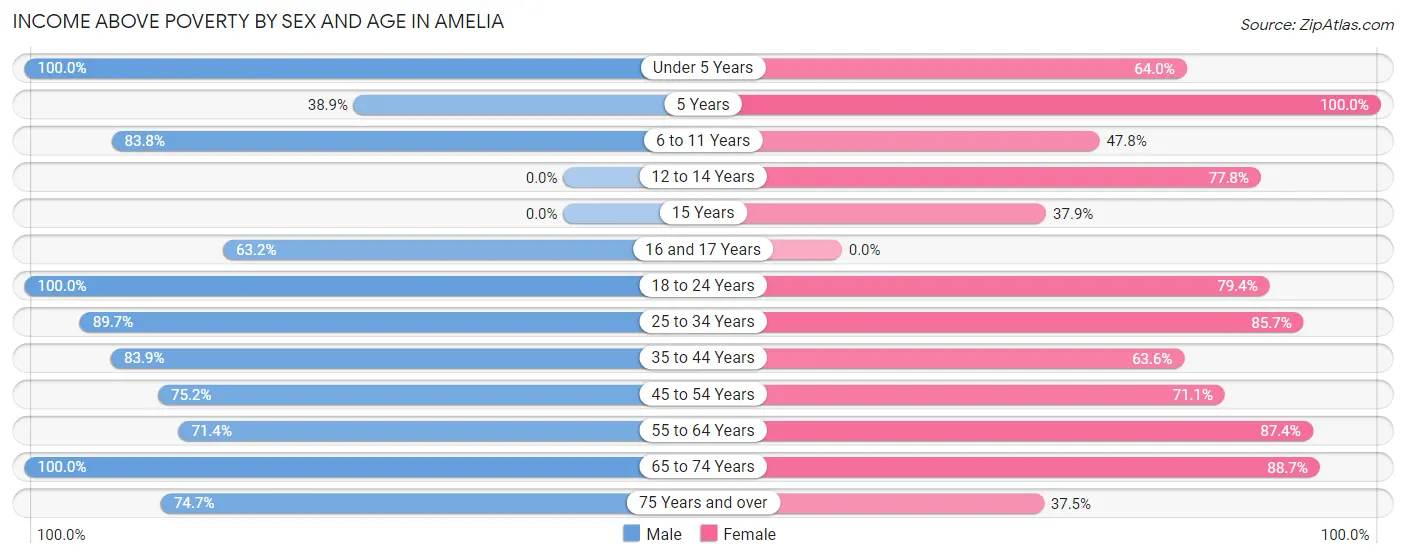
| Age Bracket | Male | Female |
| Under 5 Years | 104 (100.0%) | 64 (64.0%) |
| 5 Years | 7 (38.9%) | 61 (100.0%) |
| 6 to 11 Years | 83 (83.8%) | 11 (47.8%) |
| 12 to 14 Years | 0 (0.0%) | 42 (77.8%) |
| 15 Years | 0 (0.0%) | 11 (37.9%) |
| 16 and 17 Years | 24 (63.2%) | 0 (0.0%) |
| 18 to 24 Years | 125 (100.0%) | 127 (79.4%) |
| 25 to 34 Years | 105 (89.7%) | 60 (85.7%) |
| 35 to 44 Years | 162 (83.9%) | 68 (63.5%) |
| 45 to 54 Years | 91 (75.2%) | 91 (71.1%) |
| 55 to 64 Years | 70 (71.4%) | 83 (87.4%) |
| 65 to 74 Years | 47 (100.0%) | 47 (88.7%) |
| 75 Years and over | 59 (74.7%) | 21 (37.5%) |
| Total | 877 (84.0%) | 686 (71.8%) |
Income Below Poverty Among Married-Couple Families in Amelia
The poverty statistics for married-couple families in Amelia show that 17.9% or 64 of the total 358 families live below the poverty line. Families with 1 or 2 children have the highest poverty rate of 31.2%, comprising of 20 families. On the other hand, families with 3 or 4 children have the lowest poverty rate of 12.2%, which includes 12 families.
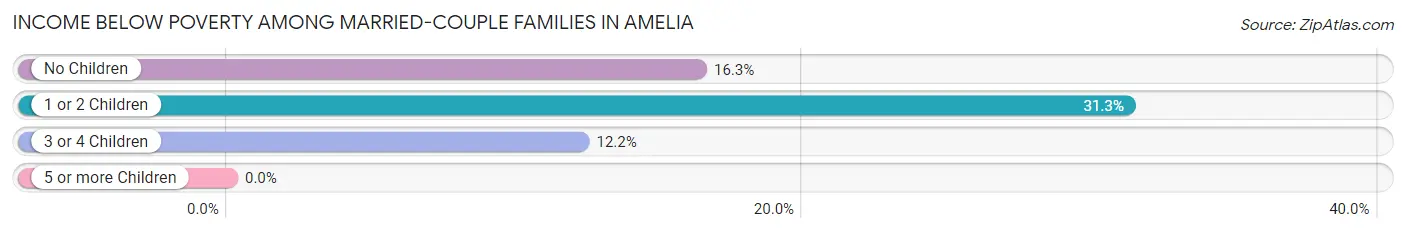
| Children | Above Poverty | Below Poverty |
| No Children | 164 (83.7%) | 32 (16.3%) |
| 1 or 2 Children | 44 (68.8%) | 20 (31.2%) |
| 3 or 4 Children | 86 (87.8%) | 12 (12.2%) |
| 5 or more Children | 0 (0.0%) | 0 (0.0%) |
| Total | 294 (82.1%) | 64 (17.9%) |
Income Below Poverty Among Single-Parent Households in Amelia
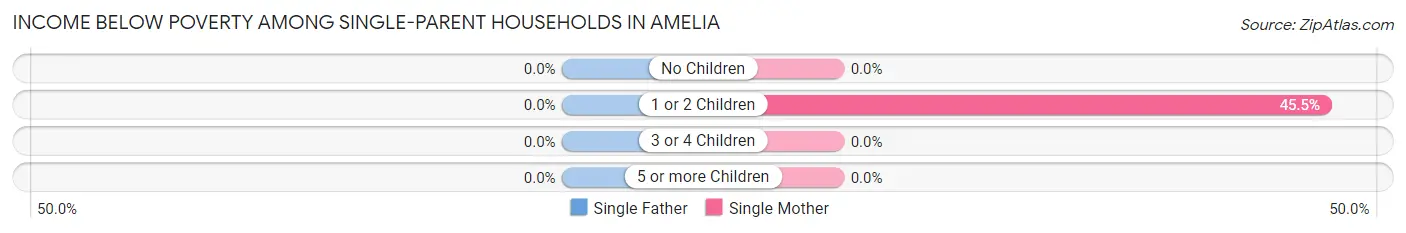
| Children | Single Father | Single Mother |
| No Children | 0 (0.0%) | 0 (0.0%) |
| 1 or 2 Children | 0 (0.0%) | 45 (45.5%) |
| 3 or 4 Children | 0 (0.0%) | 0 (0.0%) |
| 5 or more Children | 0 (0.0%) | 0 (0.0%) |
| Total | 0 (0.0%) | 45 (45.5%) |
Income Below Poverty Among Married-Couple vs Single-Parent Households in Amelia
The poverty data for Amelia shows that 64 of the married-couple family households (17.9%) and 45 of the single-parent households (21.2%) are living below the poverty level. Within the married-couple family households, those with 1 or 2 children have the highest poverty rate, with 20 households (31.2%) falling below the poverty line. Among the single-parent households, those with 1 or 2 children have the highest poverty rate, with 45 household (37.5%) living below poverty.
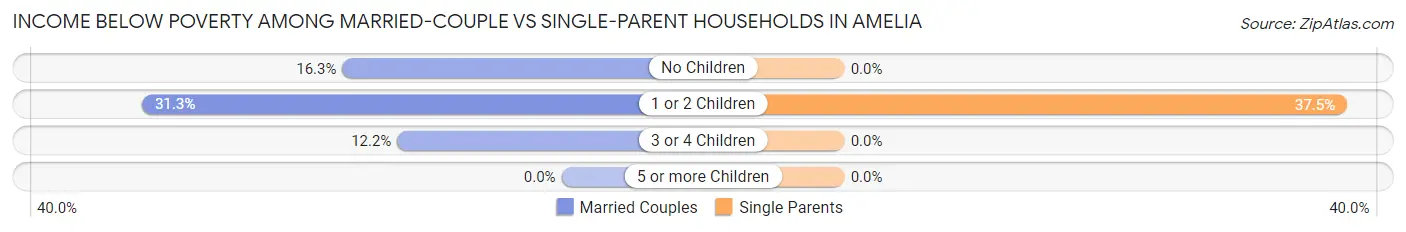
| Children | Married-Couple Families | Single-Parent Households |
| No Children | 32 (16.3%) | 0 (0.0%) |
| 1 or 2 Children | 20 (31.2%) | 45 (37.5%) |
| 3 or 4 Children | 12 (12.2%) | 0 (0.0%) |
| 5 or more Children | 0 (0.0%) | 0 (0.0%) |
| Total | 64 (17.9%) | 45 (21.2%) |
Race in Amelia
The most populous races in Amelia are Hispanic or Latino (1,103 | 55.1%), Some other Race (664 | 33.2%), and White / Caucasian (578 | 28.9%).
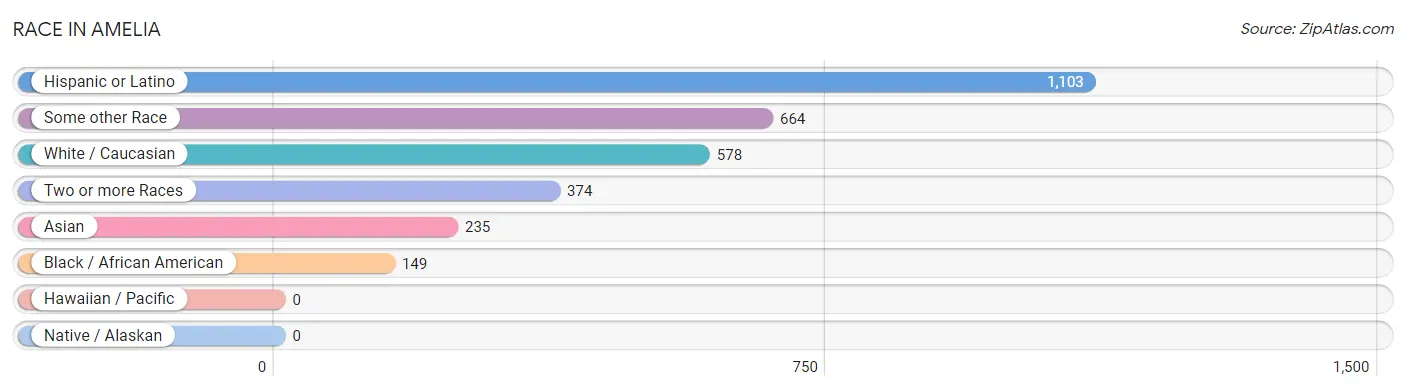
| Race | # Population | % Population |
| Asian | 235 | 11.7% |
| Black / African American | 149 | 7.4% |
| Hawaiian / Pacific | 0 | 0.0% |
| Hispanic or Latino | 1,103 | 55.1% |
| Native / Alaskan | 0 | 0.0% |
| White / Caucasian | 578 | 28.9% |
| Two or more Races | 374 | 18.7% |
| Some other Race | 664 | 33.2% |
| Total | 2,000 | 100.0% |
Ancestry in Amelia
The most populous ancestries reported in Amelia are Mexican (703 | 35.1%), Sri Lankan (237 | 11.8%), Central American (183 | 9.1%), Guatemalan (141 | 7.0%), and Spanish (110 | 5.5%), together accounting for 68.7% of all Amelia residents.
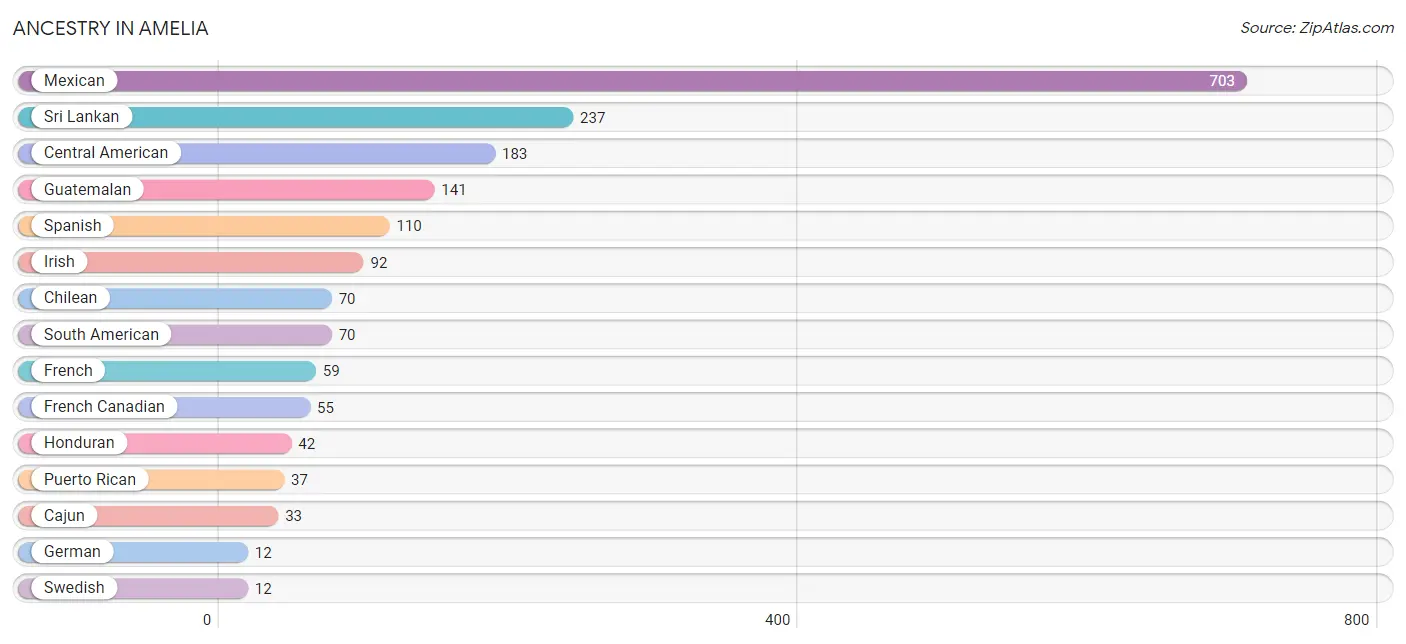
| Ancestry | # Population | % Population |
| Cajun | 33 | 1.7% |
| Central American | 183 | 9.1% |
| Chilean | 70 | 3.5% |
| French | 59 | 2.9% |
| French Canadian | 55 | 2.8% |
| German | 12 | 0.6% |
| Guatemalan | 141 | 7.0% |
| Honduran | 42 | 2.1% |
| Irish | 92 | 4.6% |
| Italian | 9 | 0.4% |
| Mexican | 703 | 35.1% |
| Puerto Rican | 37 | 1.8% |
| South American | 70 | 3.5% |
| Spanish | 110 | 5.5% |
| Sri Lankan | 237 | 11.8% |
| Swedish | 12 | 0.6% | View All 16 Rows |
Immigrants in Amelia
The most numerous immigrant groups reported in Amelia came from Latin America (561 | 28.1%), Central America (518 | 25.9%), Mexico (369 | 18.4%), Asia (167 | 8.4%), and South Eastern Asia (167 | 8.4%), together accounting for 89.1% of all Amelia residents.
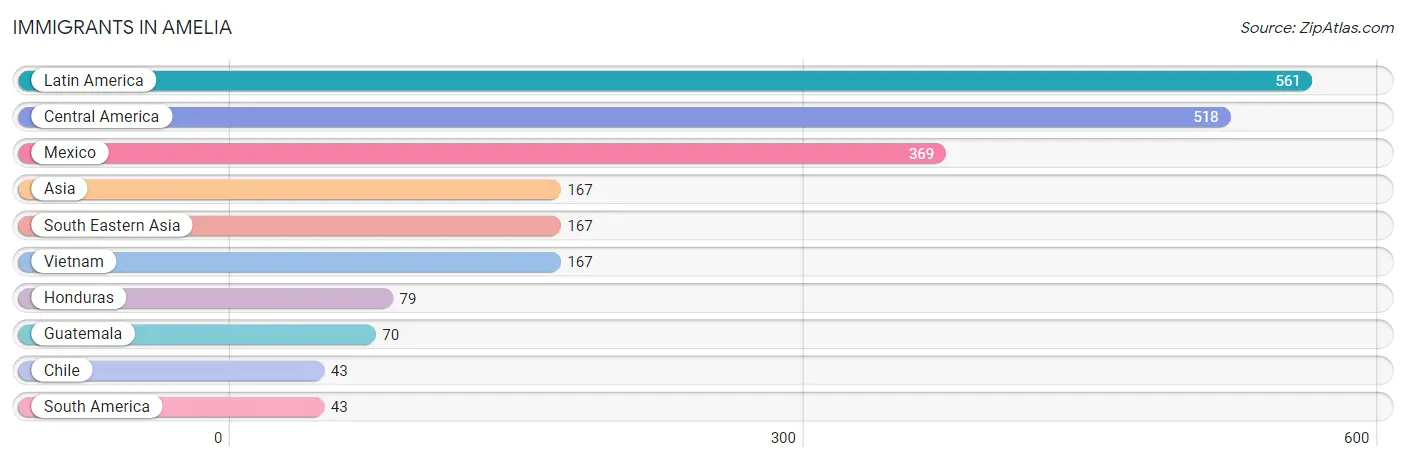
| Immigration Origin | # Population | % Population |
| Asia | 167 | 8.4% |
| Central America | 518 | 25.9% |
| Chile | 43 | 2.1% |
| Guatemala | 70 | 3.5% |
| Honduras | 79 | 4.0% |
| Latin America | 561 | 28.1% |
| Mexico | 369 | 18.4% |
| South America | 43 | 2.1% |
| South Eastern Asia | 167 | 8.4% |
| Vietnam | 167 | 8.4% | View All 10 Rows |
Sex and Age in Amelia
Sex and Age in Amelia
The most populous age groups in Amelia are 40 to 44 Years (124 | 11.9%) for men and 45 to 49 Years (111 | 11.6%) for women.
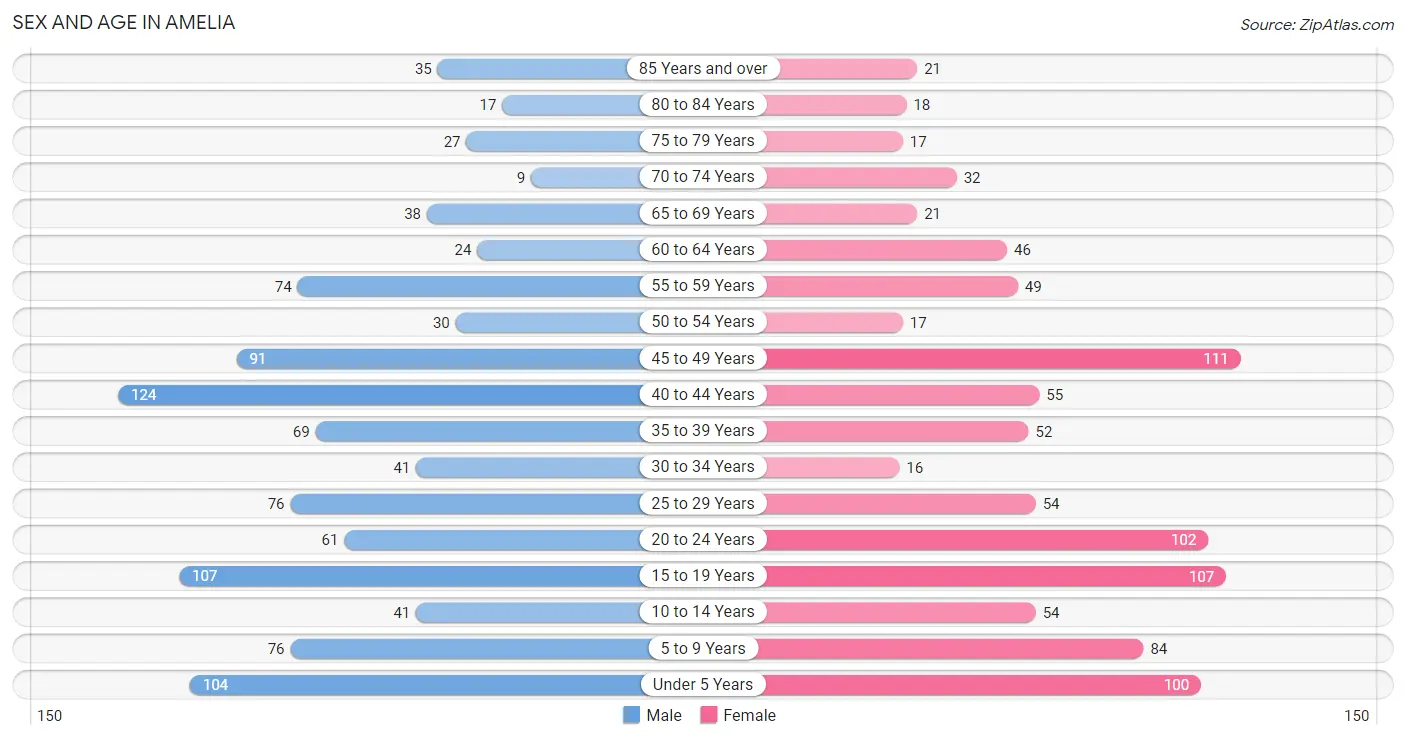
| Age Bracket | Male | Female |
| Under 5 Years | 104 (10.0%) | 100 (10.5%) |
| 5 to 9 Years | 76 (7.3%) | 84 (8.8%) |
| 10 to 14 Years | 41 (3.9%) | 54 (5.7%) |
| 15 to 19 Years | 107 (10.2%) | 107 (11.2%) |
| 20 to 24 Years | 61 (5.8%) | 102 (10.7%) |
| 25 to 29 Years | 76 (7.3%) | 54 (5.7%) |
| 30 to 34 Years | 41 (3.9%) | 16 (1.7%) |
| 35 to 39 Years | 69 (6.6%) | 52 (5.4%) |
| 40 to 44 Years | 124 (11.9%) | 55 (5.8%) |
| 45 to 49 Years | 91 (8.7%) | 111 (11.6%) |
| 50 to 54 Years | 30 (2.9%) | 17 (1.8%) |
| 55 to 59 Years | 74 (7.1%) | 49 (5.1%) |
| 60 to 64 Years | 24 (2.3%) | 46 (4.8%) |
| 65 to 69 Years | 38 (3.6%) | 21 (2.2%) |
| 70 to 74 Years | 9 (0.9%) | 32 (3.4%) |
| 75 to 79 Years | 27 (2.6%) | 17 (1.8%) |
| 80 to 84 Years | 17 (1.6%) | 18 (1.9%) |
| 85 Years and over | 35 (3.4%) | 21 (2.2%) |
| Total | 1,044 (100.0%) | 956 (100.0%) |
Families and Households in Amelia
Median Family Size in Amelia
The median family size in Amelia is 3.21 persons per family, with married-couple families (358 | 62.8%) accounting for the largest median family size of 3.54 persons per family. On the other hand, single male/father families (113 | 19.8%) represent the smallest median family size with 2.24 persons per family.
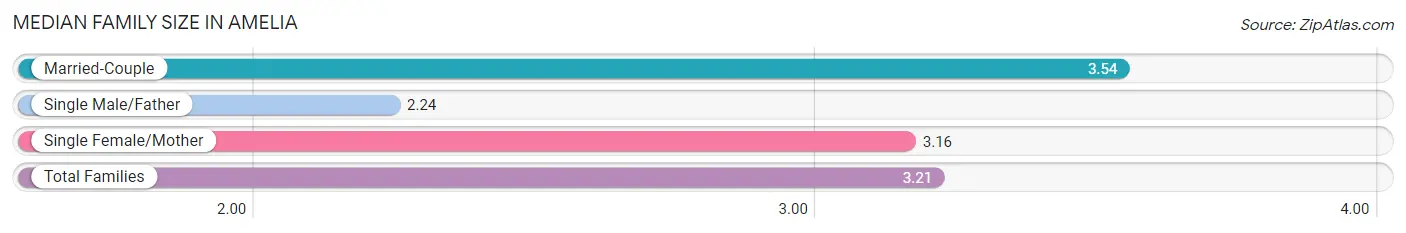
| Family Type | # Families | Family Size |
| Married-Couple | 358 (62.8%) | 3.54 |
| Single Male/Father | 113 (19.8%) | 2.24 |
| Single Female/Mother | 99 (17.4%) | 3.16 |
| Total Families | 570 (100.0%) | 3.21 |
Median Household Size in Amelia
The median household size in Amelia is 2.84 persons per household, with married-couple households (358 | 50.8%) accounting for the largest median household size of 3.54 persons per household. non-family households (135 | 19.2%) represent the smallest median household size with 1.04 persons per household.
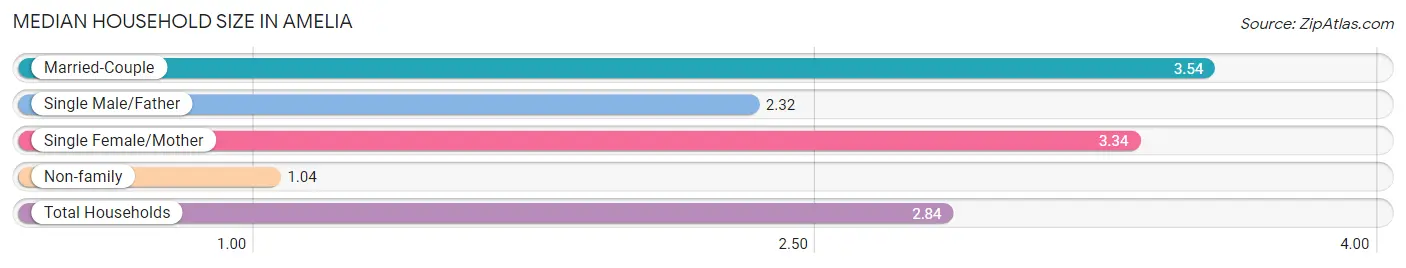
| Household Type | # Households | Household Size |
| Married-Couple | 358 (50.8%) | 3.54 |
| Single Male/Father | 113 (16.0%) | 2.32 |
| Single Female/Mother | 99 (14.0%) | 3.34 |
| Non-family | 135 (19.2%) | 1.04 |
| Total Households | 705 (100.0%) | 2.84 |
Household Size by Marriage Status in Amelia
Out of a total of 705 households in Amelia, 570 (80.8%) are family households, while 135 (19.2%) are nonfamily households. The most numerous type of family households are 2-person households, comprising 269, and the most common type of nonfamily households are 1-person households, comprising 130.
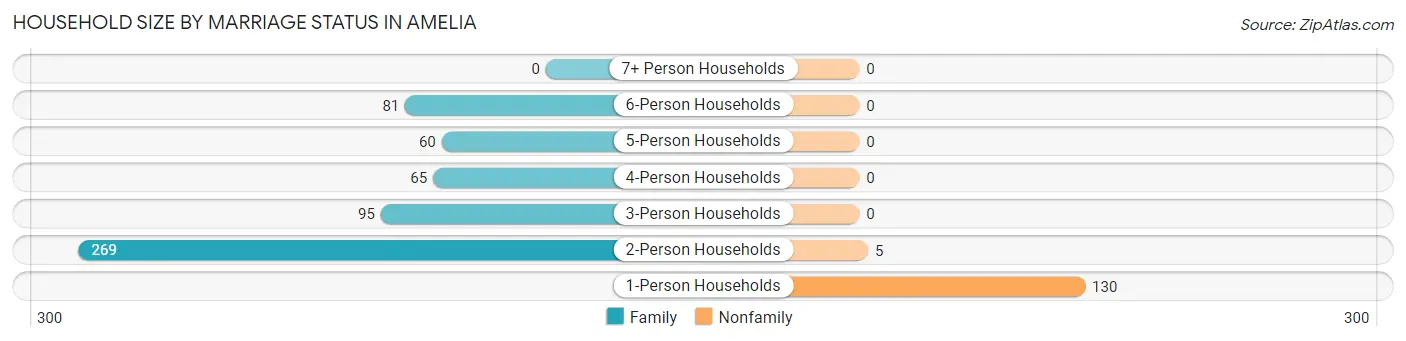
| Household Size | Family Households | Nonfamily Households |
| 1-Person Households | - | 130 (18.4%) |
| 2-Person Households | 269 (38.2%) | 5 (0.7%) |
| 3-Person Households | 95 (13.5%) | 0 (0.0%) |
| 4-Person Households | 65 (9.2%) | 0 (0.0%) |
| 5-Person Households | 60 (8.5%) | 0 (0.0%) |
| 6-Person Households | 81 (11.5%) | 0 (0.0%) |
| 7+ Person Households | 0 (0.0%) | 0 (0.0%) |
| Total | 570 (80.8%) | 135 (19.2%) |
Female Fertility in Amelia
Fertility by Age in Amelia
Average fertility rate in Amelia is 60.0 births per 1,000 women. Women in the age bracket of 20 to 34 years have the highest fertility rate with 174.0 births per 1,000 women. Women in the age bracket of 20 to 34 years acount for 100.0% of all women with births.
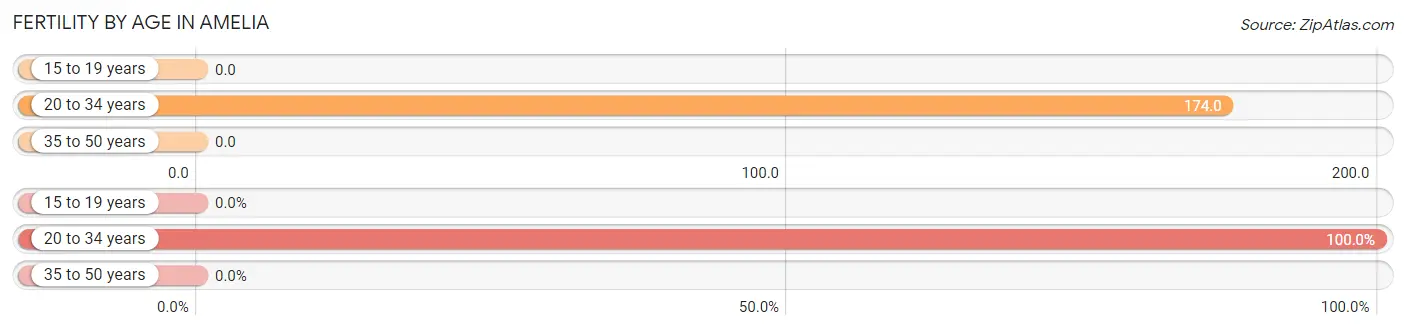
| Age Bracket | Women with Births | Births / 1,000 Women |
| 15 to 19 years | 0 (0.0%) | 0.0 |
| 20 to 34 years | 30 (100.0%) | 174.0 |
| 35 to 50 years | 0 (0.0%) | 0.0 |
| Total | 30 (100.0%) | 60.0 |
Fertility by Age by Marriage Status in Amelia
70.0% of women with births (30) in Amelia are married. The highest percentage of unmarried women with births falls into 20 to 34 years age bracket with 30.0% of them unmarried at the time of birth, while the lowest percentage of unmarried women with births belong to 20 to 34 years age bracket with 30.0% of them unmarried.
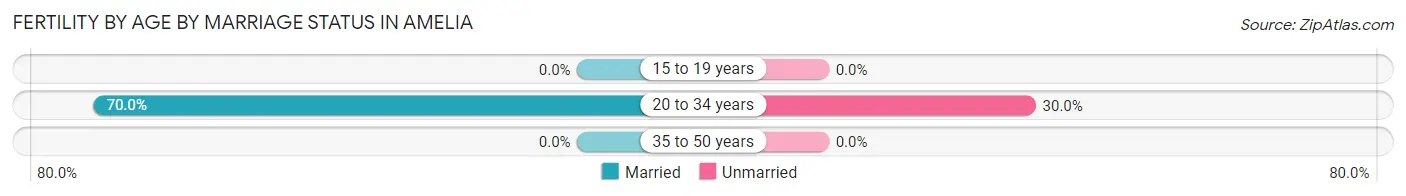
| Age Bracket | Married | Unmarried |
| 15 to 19 years | 0 (0.0%) | 0 (0.0%) |
| 20 to 34 years | 21 (70.0%) | 9 (30.0%) |
| 35 to 50 years | 0 (0.0%) | 0 (0.0%) |
| Total | 21 (70.0%) | 9 (30.0%) |
Fertility by Education in Amelia
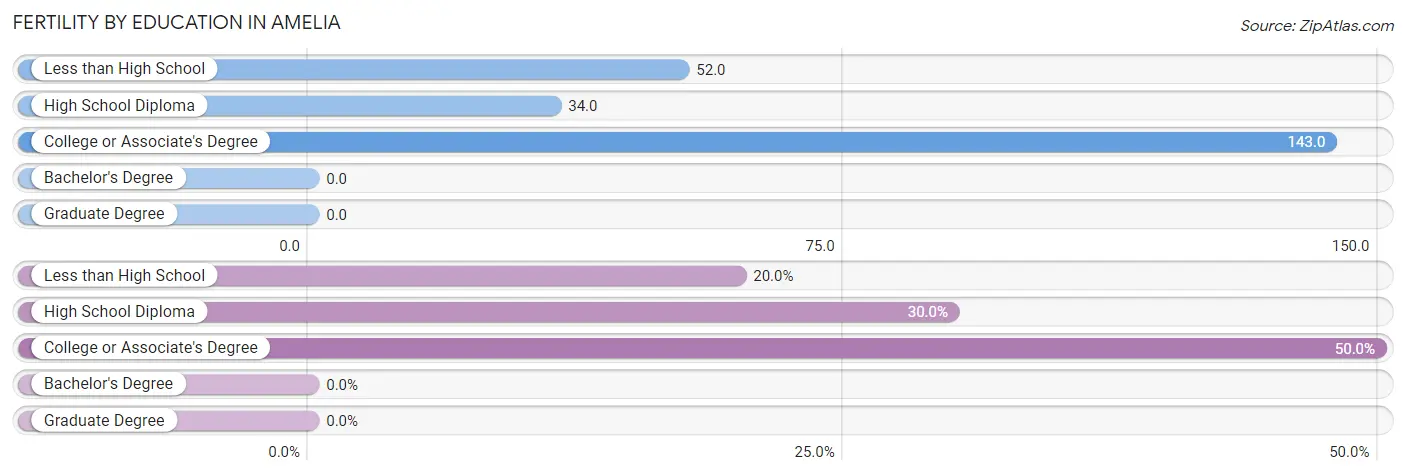
| Educational Attainment | Women with Births | Births / 1,000 Women |
| Less than High School | 6 (20.0%) | 52.0 |
| High School Diploma | 9 (30.0%) | 34.0 |
| College or Associate's Degree | 15 (50.0%) | 143.0 |
| Bachelor's Degree | 0 (0.0%) | 0.0 |
| Graduate Degree | 0 (0.0%) | 0.0 |
| Total | 30 (100.0%) | 60.0 |
Fertility by Education by Marriage Status in Amelia
30.0% of women with births in Amelia are unmarried. Women with the educational attainment of less than high school are most likely to be married with 100.0% of them married at childbirth, while women with the educational attainment of high school diploma are least likely to be married with 100.0% of them unmarried at childbirth.
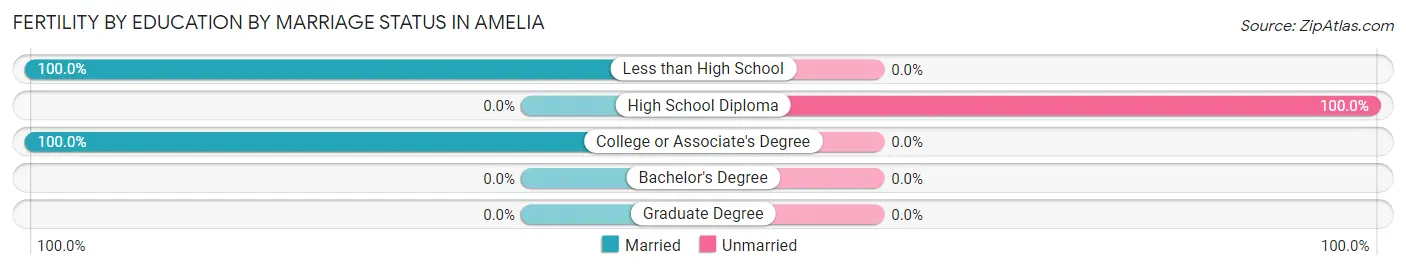
| Educational Attainment | Married | Unmarried |
| Less than High School | 6 (100.0%) | 0 (0.0%) |
| High School Diploma | 0 (0.0%) | 9 (100.0%) |
| College or Associate's Degree | 15 (100.0%) | 0 (0.0%) |
| Bachelor's Degree | 0 (0.0%) | 0 (0.0%) |
| Graduate Degree | 0 (0.0%) | 0 (0.0%) |
| Total | 21 (70.0%) | 9 (30.0%) |
Employment Characteristics in Amelia
Employment by Class of Employer in Amelia
Among the 742 employed individuals in Amelia, private company employees (649 | 87.5%), self-employed (not incorporated) (43 | 5.8%), and local government employees (29 | 3.9%) make up the most common classes of employment.
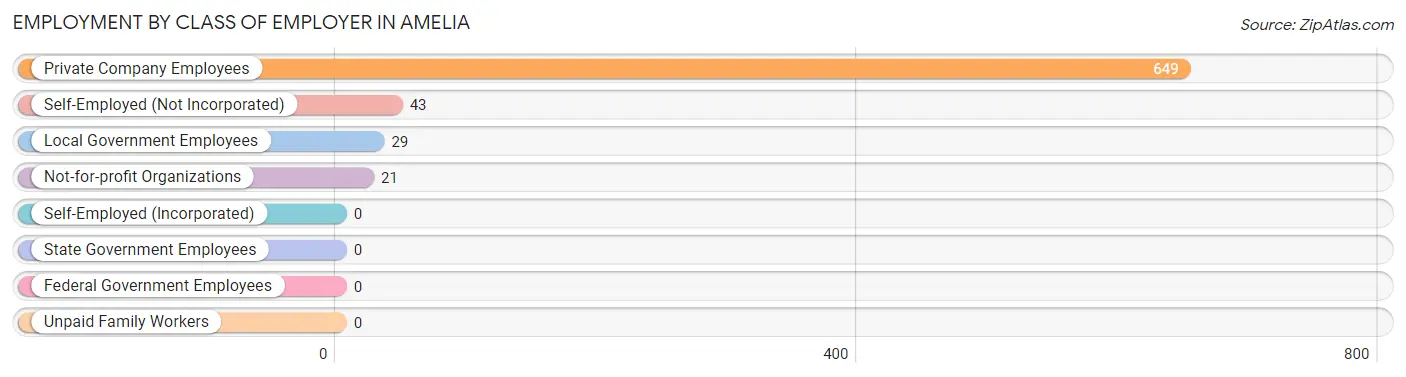
| Employer Class | # Employees | % Employees |
| Private Company Employees | 649 | 87.5% |
| Self-Employed (Incorporated) | 0 | 0.0% |
| Self-Employed (Not Incorporated) | 43 | 5.8% |
| Not-for-profit Organizations | 21 | 2.8% |
| Local Government Employees | 29 | 3.9% |
| State Government Employees | 0 | 0.0% |
| Federal Government Employees | 0 | 0.0% |
| Unpaid Family Workers | 0 | 0.0% |
| Total | 742 | 100.0% |
Employment Status by Age in Amelia
According to the labor force statistics for Amelia, out of the total population over 16 years of age (1,507), 53.8% or 811 individuals are in the labor force, with 8.5% or 69 of them unemployed. The age group with the highest labor force participation rate is 25 to 29 years, with 83.1% or 108 individuals in the labor force. Within the labor force, the 45 to 54 years age range has the highest percentage of unemployed individuals, with 20.1% or 35 of them being unemployed.
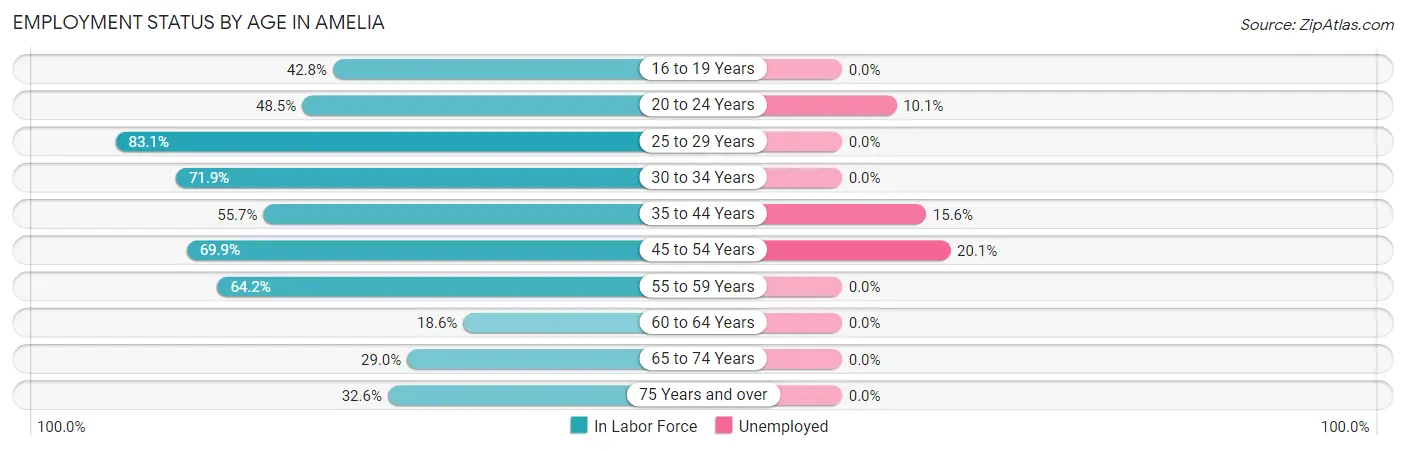
| Age Bracket | In Labor Force | Unemployed |
| 16 to 19 Years | 77 (42.8%) | 0 (0.0%) |
| 20 to 24 Years | 79 (48.5%) | 8 (10.1%) |
| 25 to 29 Years | 108 (83.1%) | 0 (0.0%) |
| 30 to 34 Years | 41 (71.9%) | 0 (0.0%) |
| 35 to 44 Years | 167 (55.7%) | 26 (15.6%) |
| 45 to 54 Years | 174 (69.9%) | 35 (20.1%) |
| 55 to 59 Years | 79 (64.2%) | 0 (0.0%) |
| 60 to 64 Years | 13 (18.6%) | 0 (0.0%) |
| 65 to 74 Years | 29 (29.0%) | 0 (0.0%) |
| 75 Years and over | 44 (32.6%) | 0 (0.0%) |
| Total | 811 (53.8%) | 69 (8.5%) |
Employment Status by Educational Attainment in Amelia
According to labor force statistics for Amelia, 62.6% of individuals (582) out of the total population between 25 and 64 years of age (929) are in the labor force, with 10.5% or 61 of them being unemployed. The group with the highest labor force participation rate are those with the educational attainment of bachelor's degree or higher, with 98.5% or 67 individuals in the labor force. Within the labor force, individuals with college / associate degree education have the highest percentage of unemployment, with 60.3% or 35 of them being unemployed.
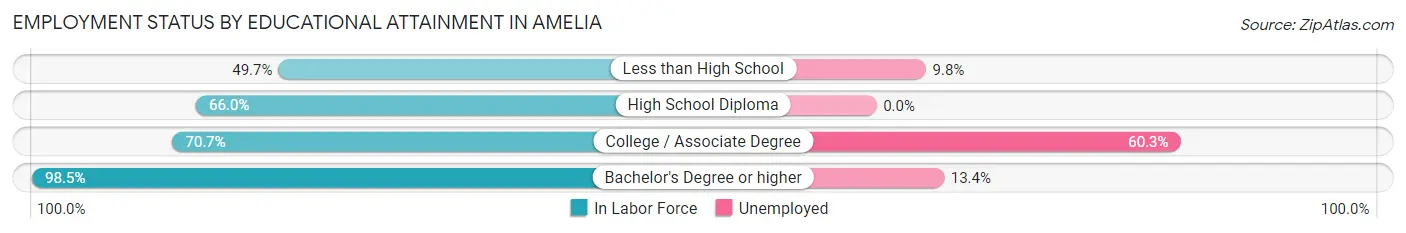
| Educational Attainment | In Labor Force | Unemployed |
| Less than High School | 174 (49.7%) | 34 (9.8%) |
| High School Diploma | 283 (66.0%) | 0 (0.0%) |
| College / Associate Degree | 58 (70.7%) | 49 (60.3%) |
| Bachelor's Degree or higher | 67 (98.5%) | 9 (13.4%) |
| Total | 582 (62.6%) | 98 (10.5%) |
Employment Occupations by Sex in Amelia
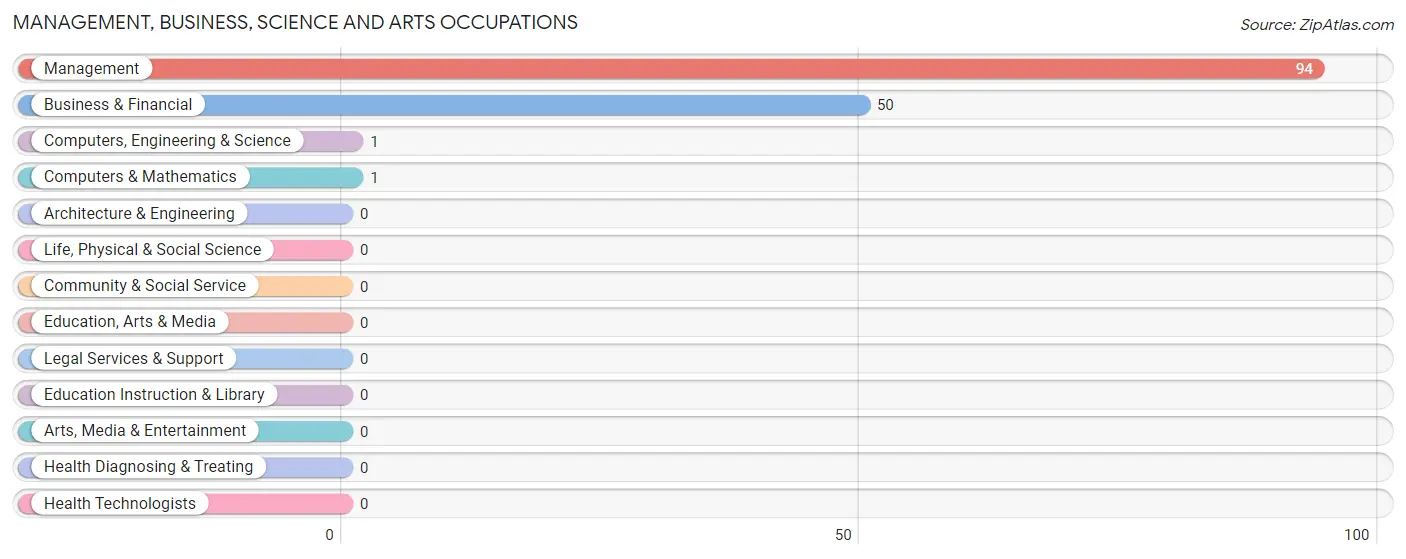
Management, Business, Science and Arts Occupations
The most common Management, Business, Science and Arts occupations in Amelia are Management (94 | 12.7%), Business & Financial (50 | 6.7%), Computers, Engineering & Science (1 | 0.1%), and Computers & Mathematics (1 | 0.1%).
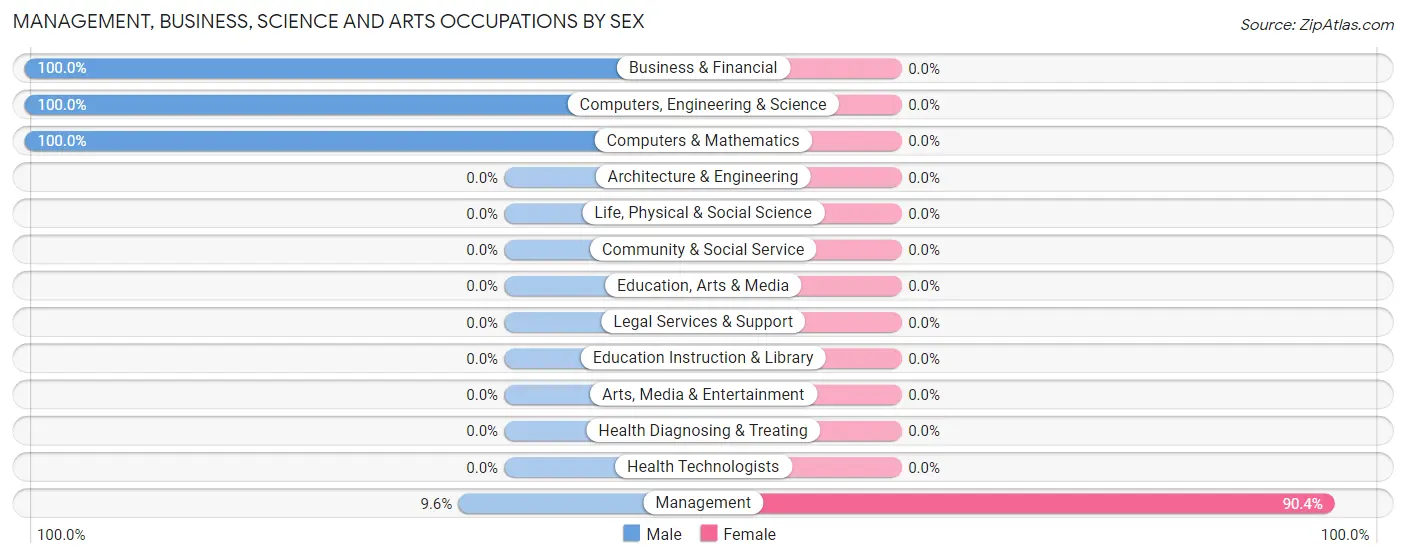
Management, Business, Science and Arts Occupations by Sex
| Occupation | Male | Female |
| Management | 9 (9.6%) | 85 (90.4%) |
| Business & Financial | 50 (100.0%) | 0 (0.0%) |
| Computers, Engineering & Science | 1 (100.0%) | 0 (0.0%) |
| Computers & Mathematics | 1 (100.0%) | 0 (0.0%) |
| Architecture & Engineering | 0 (0.0%) | 0 (0.0%) |
| Life, Physical & Social Science | 0 (0.0%) | 0 (0.0%) |
| Community & Social Service | 0 (0.0%) | 0 (0.0%) |
| Education, Arts & Media | 0 (0.0%) | 0 (0.0%) |
| Legal Services & Support | 0 (0.0%) | 0 (0.0%) |
| Education Instruction & Library | 0 (0.0%) | 0 (0.0%) |
| Arts, Media & Entertainment | 0 (0.0%) | 0 (0.0%) |
| Health Diagnosing & Treating | 0 (0.0%) | 0 (0.0%) |
| Health Technologists | 0 (0.0%) | 0 (0.0%) |
| Total (Category) | 60 (41.4%) | 85 (58.6%) |
| Total (Overall) | 466 (62.8%) | 276 (37.2%) |
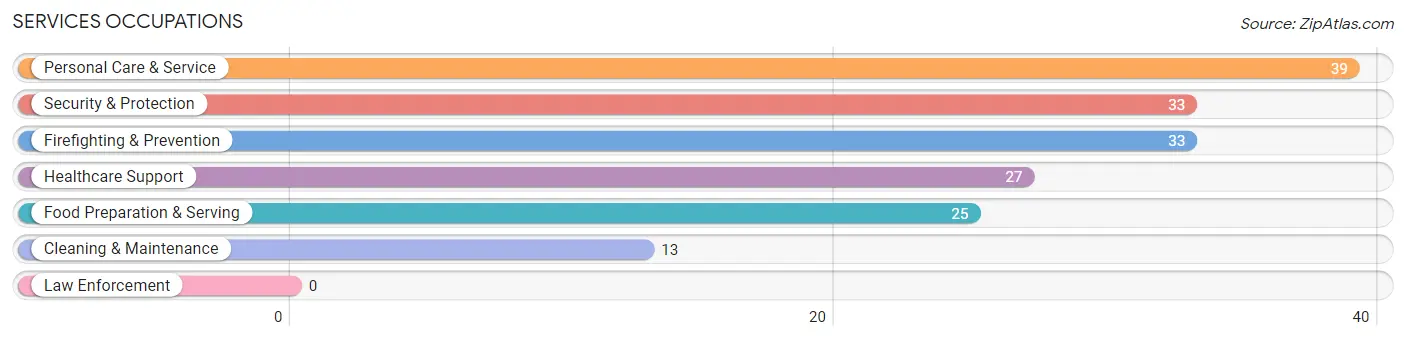
Services Occupations
The most common Services occupations in Amelia are Personal Care & Service (39 | 5.3%), Security & Protection (33 | 4.4%), Firefighting & Prevention (33 | 4.4%), Healthcare Support (27 | 3.6%), and Food Preparation & Serving (25 | 3.4%).
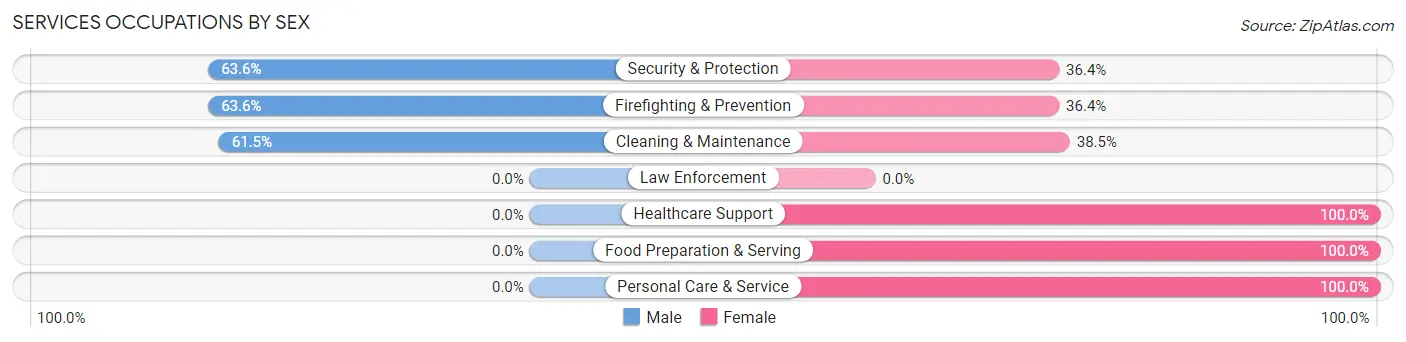
Services Occupations by Sex
Within the Services occupations in Amelia, the most male-oriented occupations are Security & Protection (63.6%), Firefighting & Prevention (63.6%), and Cleaning & Maintenance (61.5%), while the most female-oriented occupations are Healthcare Support (100.0%), Food Preparation & Serving (100.0%), and Personal Care & Service (100.0%).
| Occupation | Male | Female |
| Healthcare Support | 0 (0.0%) | 27 (100.0%) |
| Security & Protection | 21 (63.6%) | 12 (36.4%) |
| Firefighting & Prevention | 21 (63.6%) | 12 (36.4%) |
| Law Enforcement | 0 (0.0%) | 0 (0.0%) |
| Food Preparation & Serving | 0 (0.0%) | 25 (100.0%) |
| Cleaning & Maintenance | 8 (61.5%) | 5 (38.5%) |
| Personal Care & Service | 0 (0.0%) | 39 (100.0%) |
| Total (Category) | 29 (21.2%) | 108 (78.8%) |
| Total (Overall) | 466 (62.8%) | 276 (37.2%) |
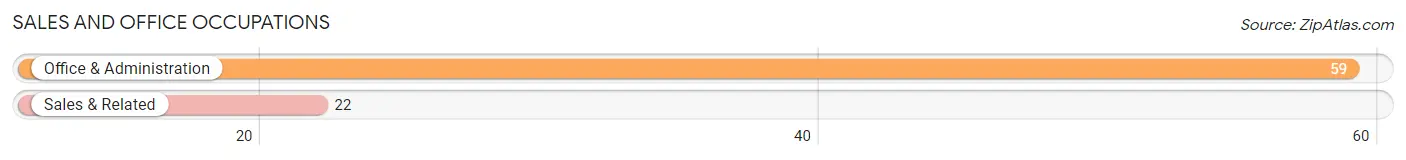
Sales and Office Occupations
The most common Sales and Office occupations in Amelia are Office & Administration (59 | 8.0%), and Sales & Related (22 | 3.0%).
Sales and Office Occupations by Sex
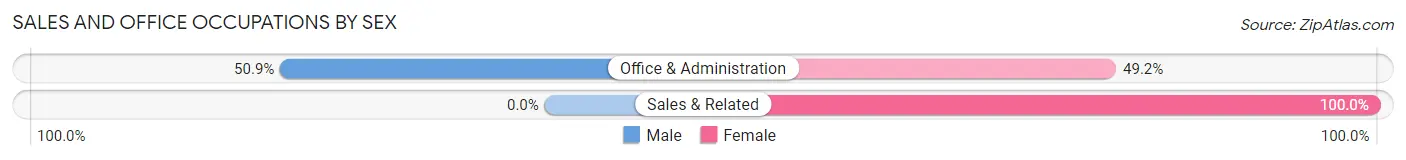
| Occupation | Male | Female |
| Sales & Related | 0 (0.0%) | 22 (100.0%) |
| Office & Administration | 30 (50.8%) | 29 (49.1%) |
| Total (Category) | 30 (37.0%) | 51 (63.0%) |
| Total (Overall) | 466 (62.8%) | 276 (37.2%) |
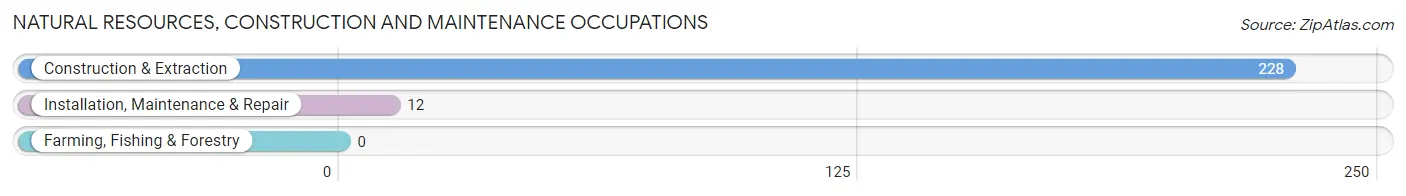
Natural Resources, Construction and Maintenance Occupations
The most common Natural Resources, Construction and Maintenance occupations in Amelia are Construction & Extraction (228 | 30.7%), and Installation, Maintenance & Repair (12 | 1.6%).
Natural Resources, Construction and Maintenance Occupations by Sex
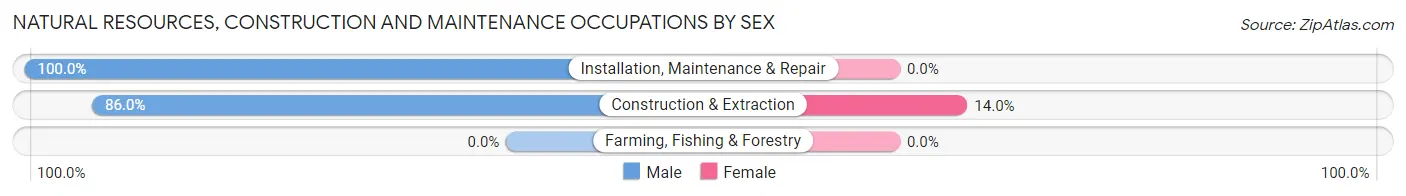
| Occupation | Male | Female |
| Farming, Fishing & Forestry | 0 (0.0%) | 0 (0.0%) |
| Construction & Extraction | 196 (86.0%) | 32 (14.0%) |
| Installation, Maintenance & Repair | 12 (100.0%) | 0 (0.0%) |
| Total (Category) | 208 (86.7%) | 32 (13.3%) |
| Total (Overall) | 466 (62.8%) | 276 (37.2%) |
Production, Transportation and Moving Occupations
The most common Production, Transportation and Moving occupations in Amelia are Production (100 | 13.5%), and Transportation (39 | 5.3%).
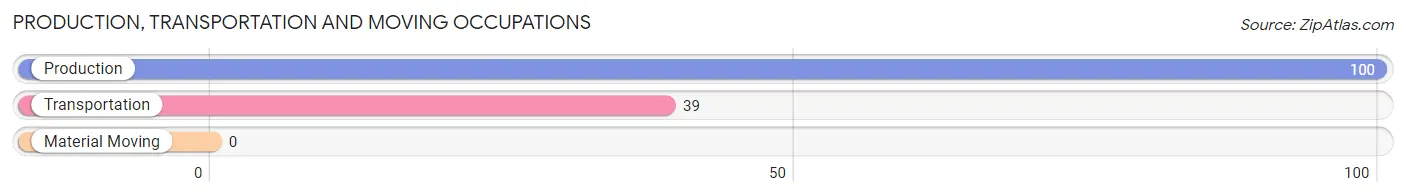
Production, Transportation and Moving Occupations by Sex
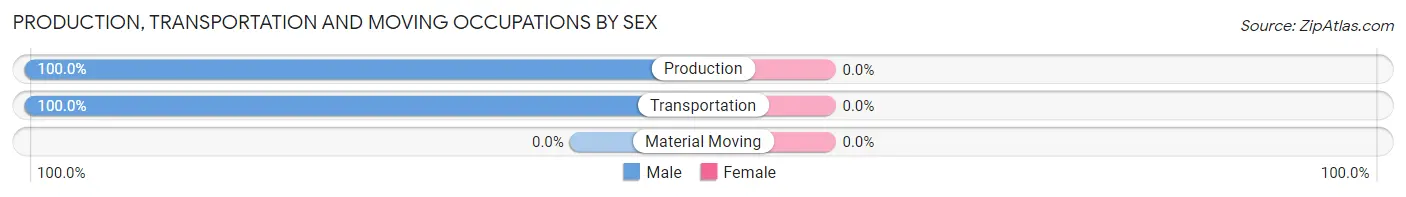
| Occupation | Male | Female |
| Production | 100 (100.0%) | 0 (0.0%) |
| Transportation | 39 (100.0%) | 0 (0.0%) |
| Material Moving | 0 (0.0%) | 0 (0.0%) |
| Total (Category) | 139 (100.0%) | 0 (0.0%) |
| Total (Overall) | 466 (62.8%) | 276 (37.2%) |
Employment Industries by Sex in Amelia
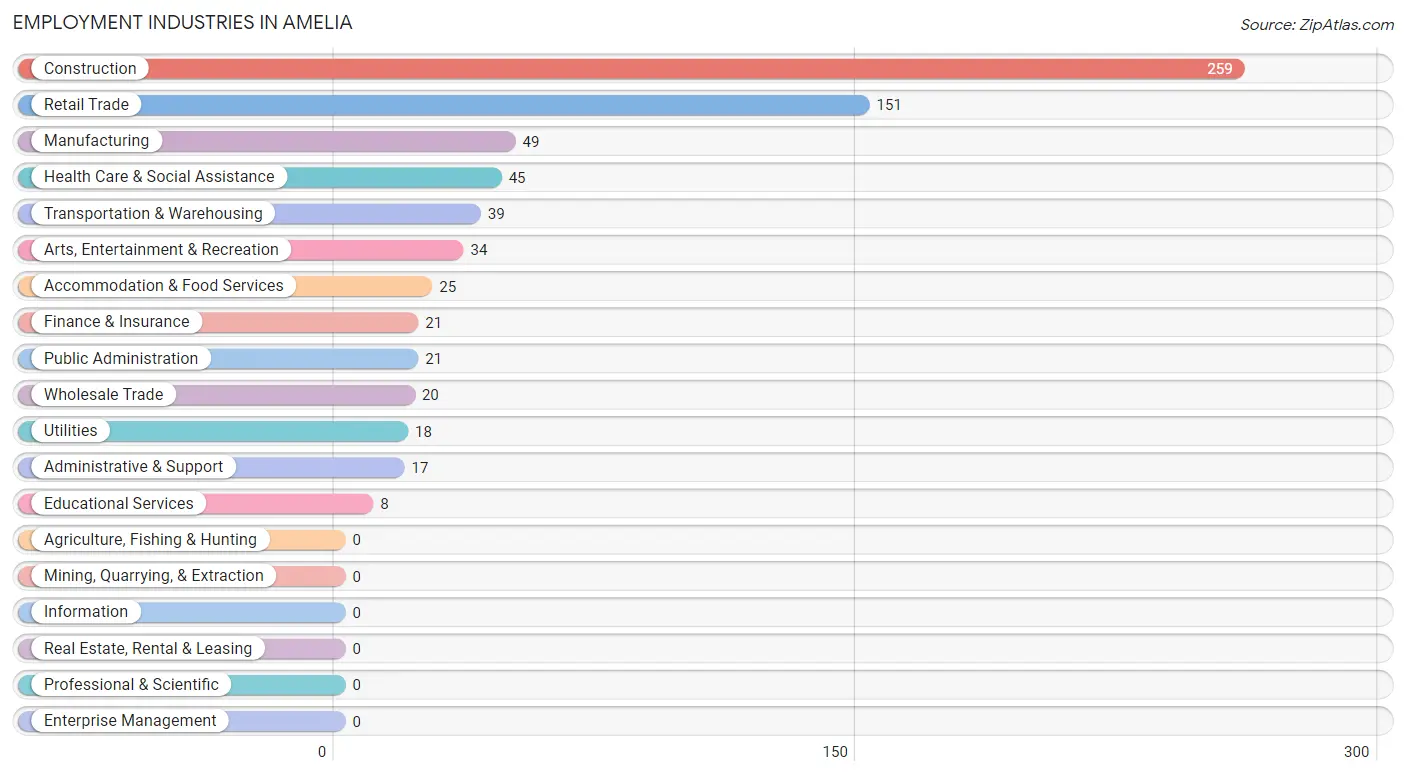
Employment Industries in Amelia
The major employment industries in Amelia include Construction (259 | 34.9%), Retail Trade (151 | 20.3%), Manufacturing (49 | 6.6%), Health Care & Social Assistance (45 | 6.1%), and Transportation & Warehousing (39 | 5.3%).
Employment Industries by Sex in Amelia
The Amelia industries that see more men than women are Manufacturing (100.0%), Wholesale Trade (100.0%), and Transportation & Warehousing (100.0%), whereas the industries that tend to have a higher number of women are Utilities (100.0%), Administrative & Support (100.0%), and Arts, Entertainment & Recreation (100.0%).
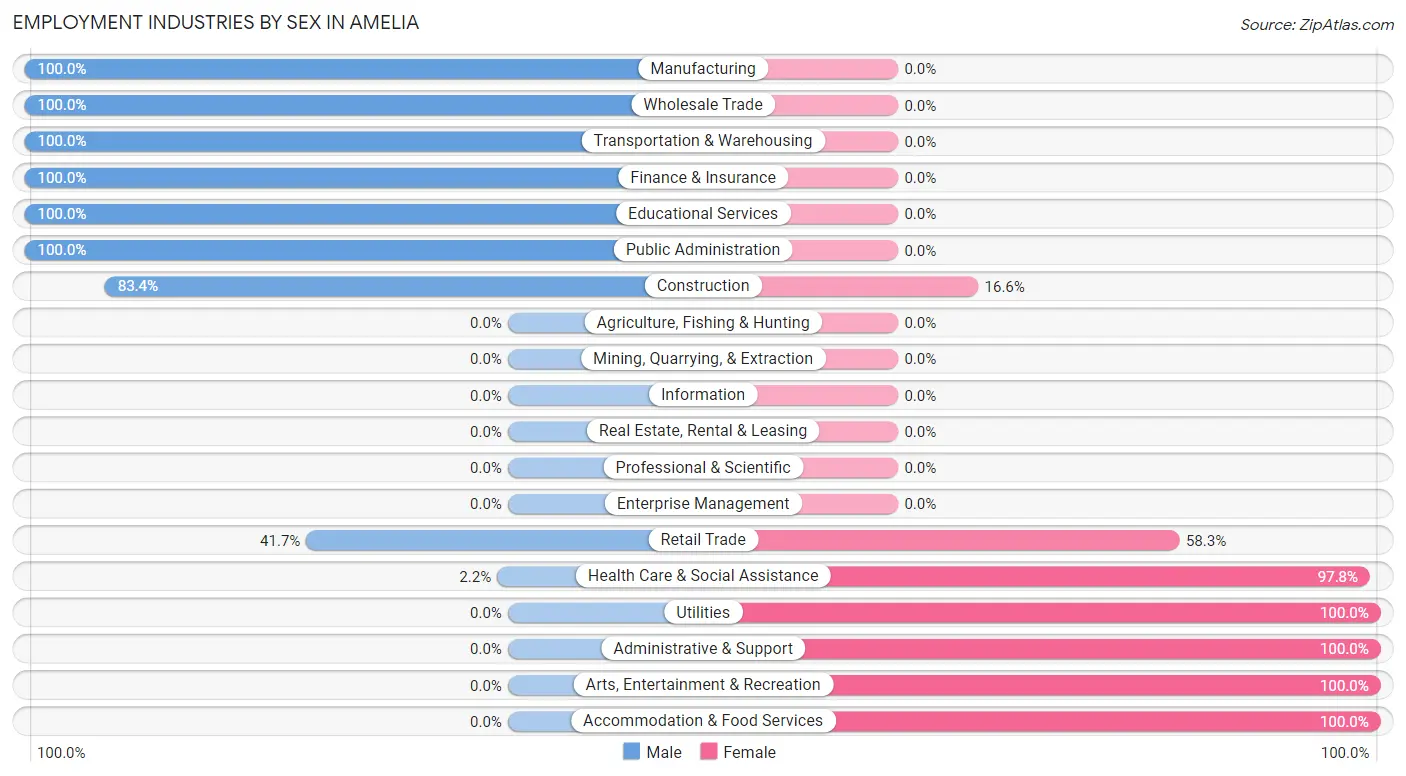
| Industry | Male | Female |
| Agriculture, Fishing & Hunting | 0 (0.0%) | 0 (0.0%) |
| Mining, Quarrying, & Extraction | 0 (0.0%) | 0 (0.0%) |
| Construction | 216 (83.4%) | 43 (16.6%) |
| Manufacturing | 49 (100.0%) | 0 (0.0%) |
| Wholesale Trade | 20 (100.0%) | 0 (0.0%) |
| Retail Trade | 63 (41.7%) | 88 (58.3%) |
| Transportation & Warehousing | 39 (100.0%) | 0 (0.0%) |
| Utilities | 0 (0.0%) | 18 (100.0%) |
| Information | 0 (0.0%) | 0 (0.0%) |
| Finance & Insurance | 21 (100.0%) | 0 (0.0%) |
| Real Estate, Rental & Leasing | 0 (0.0%) | 0 (0.0%) |
| Professional & Scientific | 0 (0.0%) | 0 (0.0%) |
| Enterprise Management | 0 (0.0%) | 0 (0.0%) |
| Administrative & Support | 0 (0.0%) | 17 (100.0%) |
| Educational Services | 8 (100.0%) | 0 (0.0%) |
| Health Care & Social Assistance | 1 (2.2%) | 44 (97.8%) |
| Arts, Entertainment & Recreation | 0 (0.0%) | 34 (100.0%) |
| Accommodation & Food Services | 0 (0.0%) | 25 (100.0%) |
| Public Administration | 21 (100.0%) | 0 (0.0%) |
| Total | 466 (62.8%) | 276 (37.2%) |
Education in Amelia
School Enrollment in Amelia
The most common levels of schooling among the 519 students in Amelia are college / undergraduate (127 | 24.5%), elementary school (102 | 19.7%), and high school (101 | 19.5%).
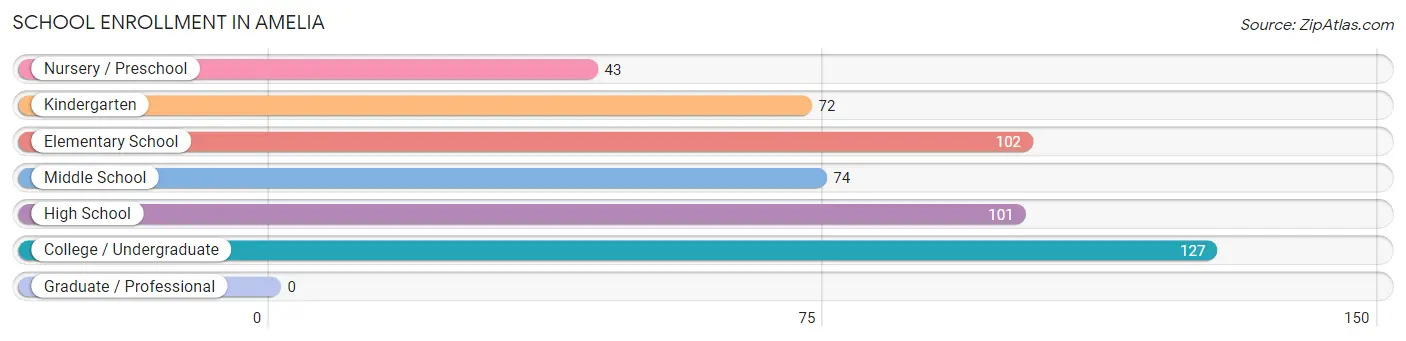
| School Level | # Students | % Students |
| Nursery / Preschool | 43 | 8.3% |
| Kindergarten | 72 | 13.9% |
| Elementary School | 102 | 19.7% |
| Middle School | 74 | 14.3% |
| High School | 101 | 19.5% |
| College / Undergraduate | 127 | 24.5% |
| Graduate / Professional | 0 | 0.0% |
| Total | 519 | 100.0% |
School Enrollment by Age by Funding Source in Amelia
Out of a total of 519 students who are enrolled in schools in Amelia, 65 (12.5%) attend a private institution, while the remaining 454 (87.5%) are enrolled in public schools. The age group of 35 years and over has the highest likelihood of being enrolled in private schools, with 14 (100.0% in the age bracket) enrolled. Conversely, the age group of 3 to 4 year olds has the lowest likelihood of being enrolled in a private school, with 36 (100.0% in the age bracket) attending a public institution.
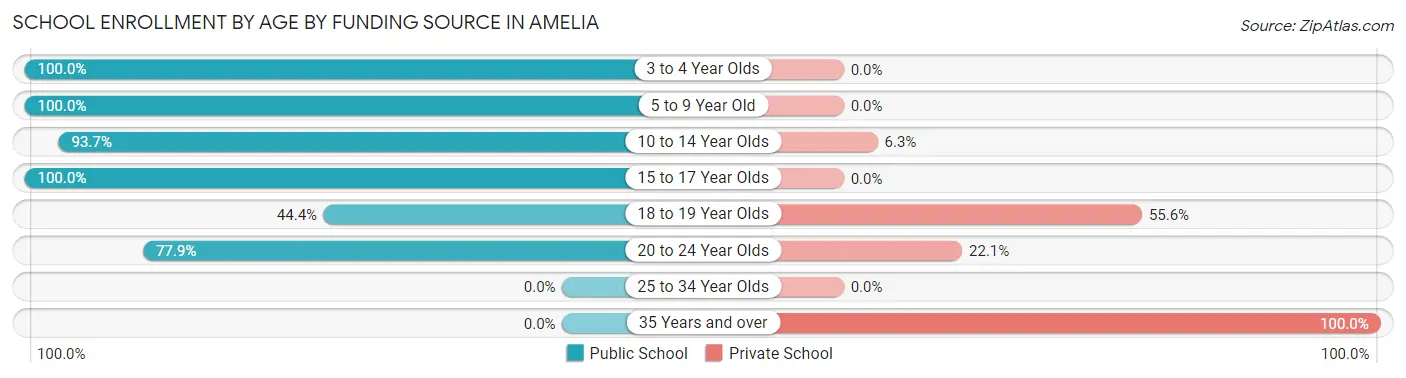
| Age Bracket | Public School | Private School |
| 3 to 4 Year Olds | 36 (100.0%) | 0 (0.0%) |
| 5 to 9 Year Old | 160 (100.0%) | 0 (0.0%) |
| 10 to 14 Year Olds | 89 (93.7%) | 6 (6.3%) |
| 15 to 17 Year Olds | 92 (100.0%) | 0 (0.0%) |
| 18 to 19 Year Olds | 24 (44.4%) | 30 (55.6%) |
| 20 to 24 Year Olds | 53 (77.9%) | 15 (22.1%) |
| 25 to 34 Year Olds | 0 (0.0%) | 0 (0.0%) |
| 35 Years and over | 0 (0.0%) | 14 (100.0%) |
| Total | 454 (87.5%) | 65 (12.5%) |
Educational Attainment by Field of Study in Amelia
Business (39 | 46.4%), physical & health sciences (28 | 33.3%), education (16 | 19.1%), and social sciences (1 | 1.2%) are the most common fields of study among 84 individuals in Amelia who have obtained a bachelor's degree or higher.
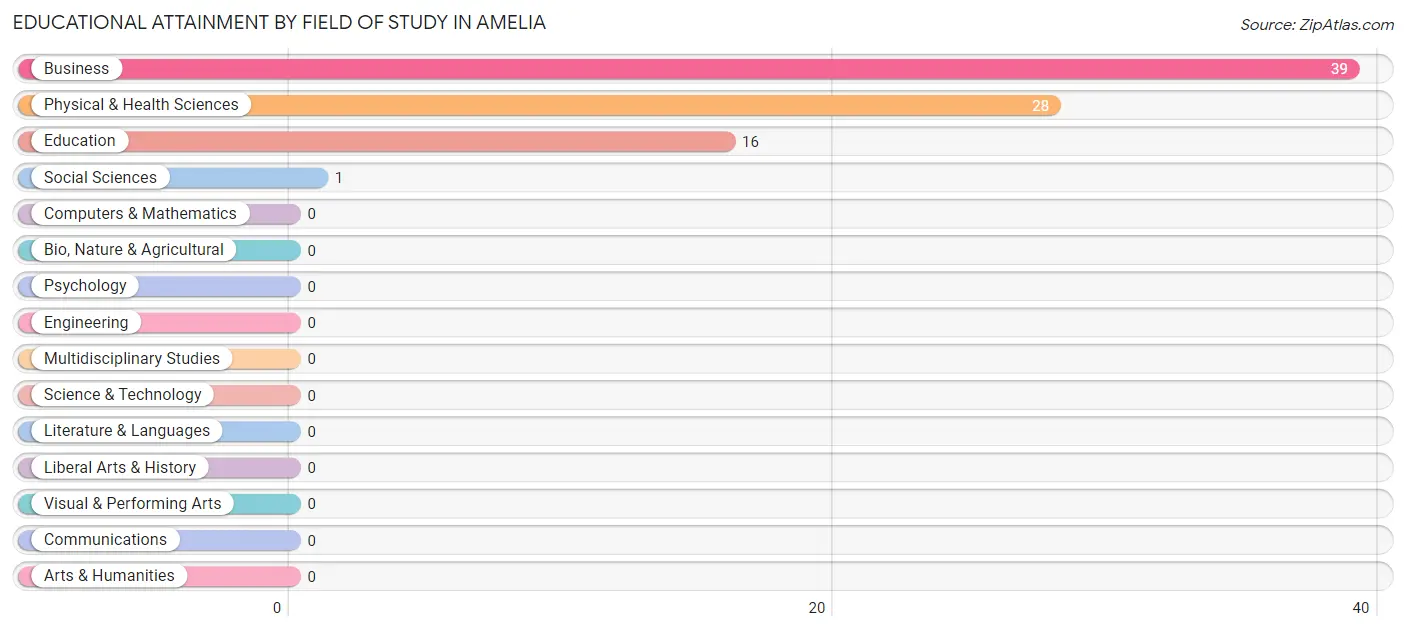
| Field of Study | # Graduates | % Graduates |
| Computers & Mathematics | 0 | 0.0% |
| Bio, Nature & Agricultural | 0 | 0.0% |
| Physical & Health Sciences | 28 | 33.3% |
| Psychology | 0 | 0.0% |
| Social Sciences | 1 | 1.2% |
| Engineering | 0 | 0.0% |
| Multidisciplinary Studies | 0 | 0.0% |
| Science & Technology | 0 | 0.0% |
| Business | 39 | 46.4% |
| Education | 16 | 19.1% |
| Literature & Languages | 0 | 0.0% |
| Liberal Arts & History | 0 | 0.0% |
| Visual & Performing Arts | 0 | 0.0% |
| Communications | 0 | 0.0% |
| Arts & Humanities | 0 | 0.0% |
| Total | 84 | 100.0% |
Transportation & Commute in Amelia
Vehicle Availability by Sex in Amelia
The most prevalent vehicle ownership categories in Amelia are males with 2 vehicles (211, accounting for 45.3%) and females with 2 vehicles (179, making up 76.4%).
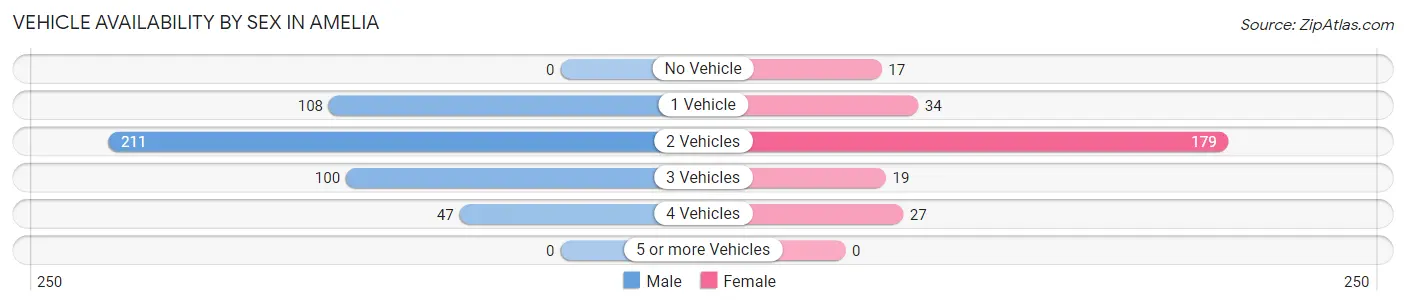
| Vehicles Available | Male | Female |
| No Vehicle | 0 (0.0%) | 17 (6.2%) |
| 1 Vehicle | 108 (23.2%) | 34 (12.3%) |
| 2 Vehicles | 211 (45.3%) | 179 (64.9%) |
| 3 Vehicles | 100 (21.5%) | 19 (6.9%) |
| 4 Vehicles | 47 (10.1%) | 27 (9.8%) |
| 5 or more Vehicles | 0 (0.0%) | 0 (0.0%) |
| Total | 466 (100.0%) | 276 (100.0%) |
Commute Time in Amelia
The most frequently occuring commute durations in Amelia are 10 to 14 minutes (214 commuters, 29.6%), 15 to 19 minutes (134 commuters, 18.5%), and less than 5 minutes (117 commuters, 16.2%).
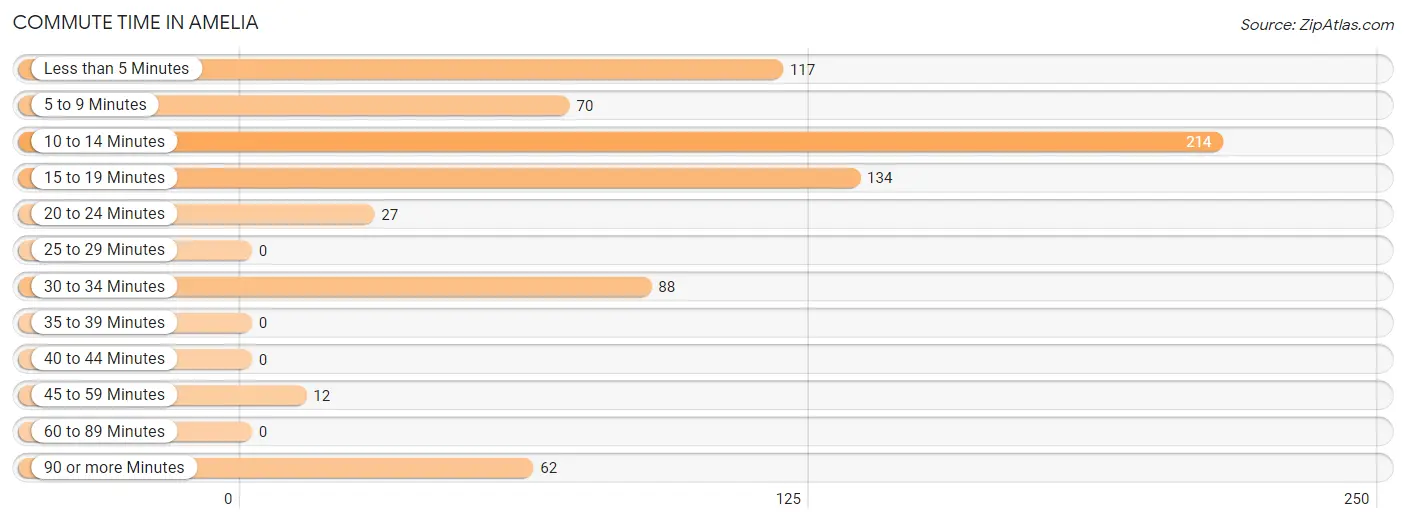
| Commute Time | # Commuters | % Commuters |
| Less than 5 Minutes | 117 | 16.2% |
| 5 to 9 Minutes | 70 | 9.7% |
| 10 to 14 Minutes | 214 | 29.6% |
| 15 to 19 Minutes | 134 | 18.5% |
| 20 to 24 Minutes | 27 | 3.7% |
| 25 to 29 Minutes | 0 | 0.0% |
| 30 to 34 Minutes | 88 | 12.1% |
| 35 to 39 Minutes | 0 | 0.0% |
| 40 to 44 Minutes | 0 | 0.0% |
| 45 to 59 Minutes | 12 | 1.7% |
| 60 to 89 Minutes | 0 | 0.0% |
| 90 or more Minutes | 62 | 8.6% |
Commute Time by Sex in Amelia
The most common commute times in Amelia are 15 to 19 minutes (129 commuters, 27.7%) for males and 10 to 14 minutes (100 commuters, 38.8%) for females.
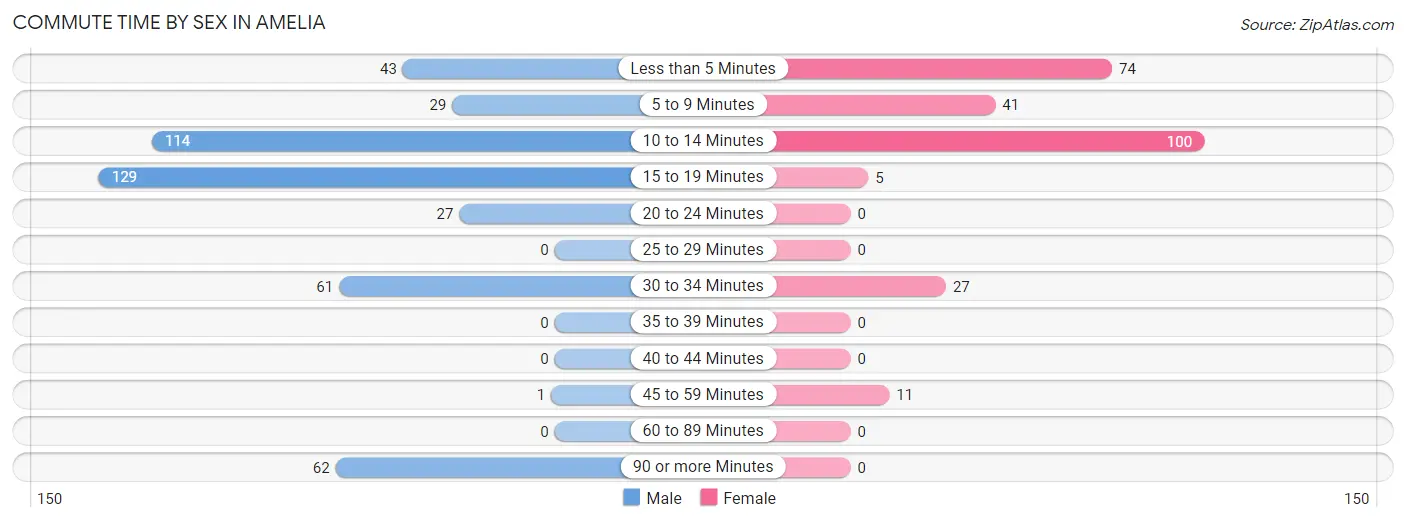
| Commute Time | Male | Female |
| Less than 5 Minutes | 43 (9.2%) | 74 (28.7%) |
| 5 to 9 Minutes | 29 (6.2%) | 41 (15.9%) |
| 10 to 14 Minutes | 114 (24.5%) | 100 (38.8%) |
| 15 to 19 Minutes | 129 (27.7%) | 5 (1.9%) |
| 20 to 24 Minutes | 27 (5.8%) | 0 (0.0%) |
| 25 to 29 Minutes | 0 (0.0%) | 0 (0.0%) |
| 30 to 34 Minutes | 61 (13.1%) | 27 (10.5%) |
| 35 to 39 Minutes | 0 (0.0%) | 0 (0.0%) |
| 40 to 44 Minutes | 0 (0.0%) | 0 (0.0%) |
| 45 to 59 Minutes | 1 (0.2%) | 11 (4.3%) |
| 60 to 89 Minutes | 0 (0.0%) | 0 (0.0%) |
| 90 or more Minutes | 62 (13.3%) | 0 (0.0%) |
Time of Departure to Work by Sex in Amelia
The most frequent times of departure to work in Amelia are 6:00 AM to 6:29 AM (109, 23.4%) for males and 8:00 AM to 8:29 AM (68, 26.4%) for females.
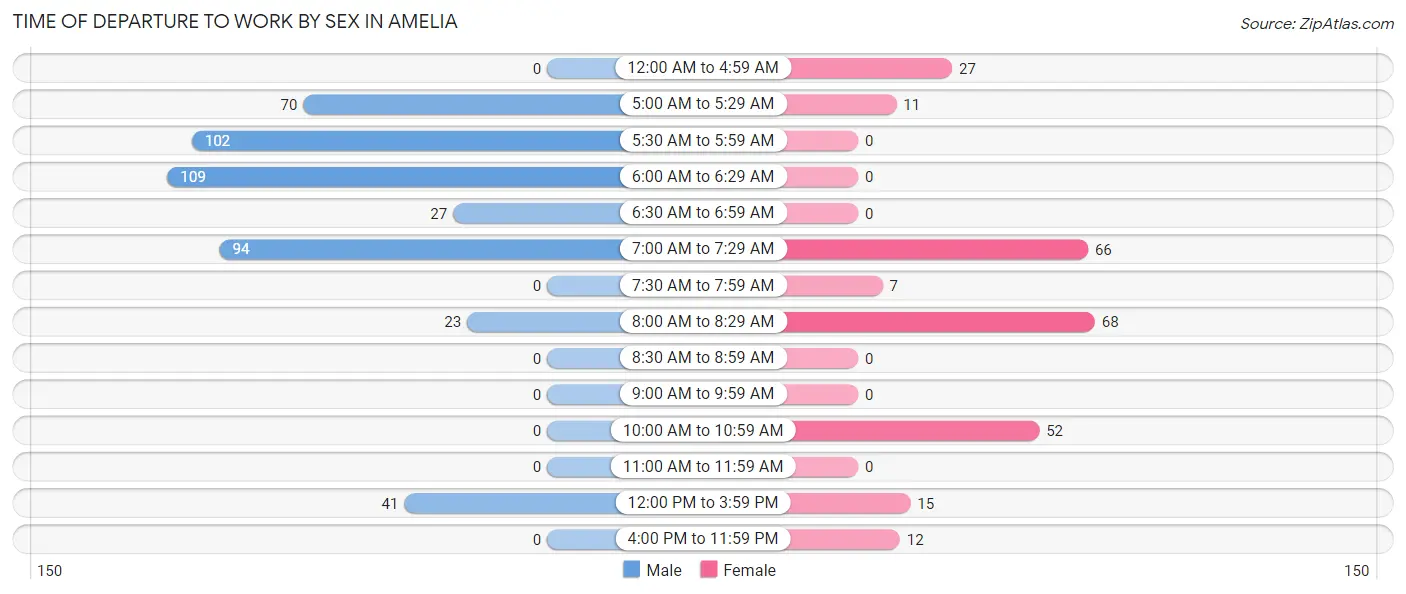
| Time of Departure | Male | Female |
| 12:00 AM to 4:59 AM | 0 (0.0%) | 27 (10.5%) |
| 5:00 AM to 5:29 AM | 70 (15.0%) | 11 (4.3%) |
| 5:30 AM to 5:59 AM | 102 (21.9%) | 0 (0.0%) |
| 6:00 AM to 6:29 AM | 109 (23.4%) | 0 (0.0%) |
| 6:30 AM to 6:59 AM | 27 (5.8%) | 0 (0.0%) |
| 7:00 AM to 7:29 AM | 94 (20.2%) | 66 (25.6%) |
| 7:30 AM to 7:59 AM | 0 (0.0%) | 7 (2.7%) |
| 8:00 AM to 8:29 AM | 23 (4.9%) | 68 (26.4%) |
| 8:30 AM to 8:59 AM | 0 (0.0%) | 0 (0.0%) |
| 9:00 AM to 9:59 AM | 0 (0.0%) | 0 (0.0%) |
| 10:00 AM to 10:59 AM | 0 (0.0%) | 52 (20.2%) |
| 11:00 AM to 11:59 AM | 0 (0.0%) | 0 (0.0%) |
| 12:00 PM to 3:59 PM | 41 (8.8%) | 15 (5.8%) |
| 4:00 PM to 11:59 PM | 0 (0.0%) | 12 (4.6%) |
| Total | 466 (100.0%) | 258 (100.0%) |
Housing Occupancy in Amelia
Occupancy by Ownership in Amelia
Of the total 705 dwellings in Amelia, owner-occupied units account for 468 (66.4%), while renter-occupied units make up 237 (33.6%).
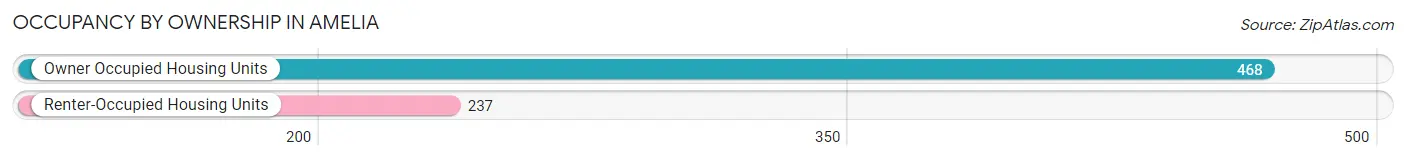
| Occupancy | # Housing Units | % Housing Units |
| Owner Occupied Housing Units | 468 | 66.4% |
| Renter-Occupied Housing Units | 237 | 33.6% |
| Total Occupied Housing Units | 705 | 100.0% |
Occupancy by Household Size in Amelia
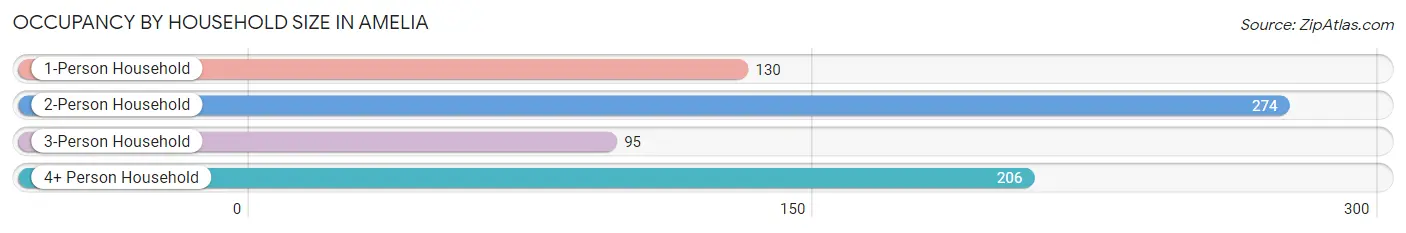
| Household Size | # Housing Units | % Housing Units |
| 1-Person Household | 130 | 18.4% |
| 2-Person Household | 274 | 38.9% |
| 3-Person Household | 95 | 13.5% |
| 4+ Person Household | 206 | 29.2% |
| Total Housing Units | 705 | 100.0% |
Occupancy by Ownership by Household Size in Amelia
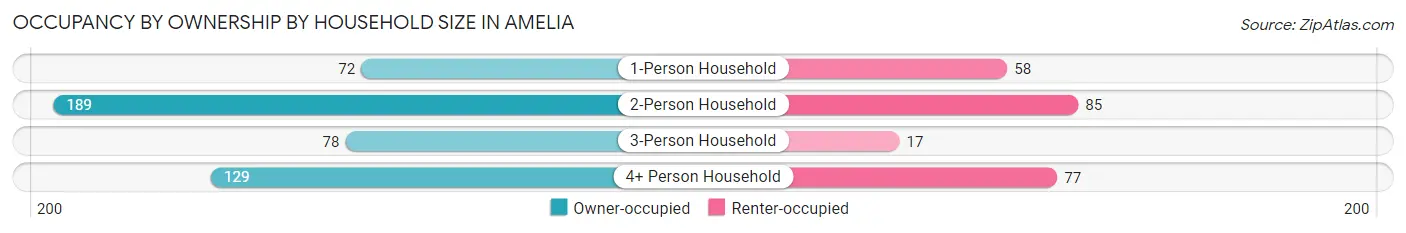
| Household Size | Owner-occupied | Renter-occupied |
| 1-Person Household | 72 (55.4%) | 58 (44.6%) |
| 2-Person Household | 189 (69.0%) | 85 (31.0%) |
| 3-Person Household | 78 (82.1%) | 17 (17.9%) |
| 4+ Person Household | 129 (62.6%) | 77 (37.4%) |
| Total Housing Units | 468 (66.4%) | 237 (33.6%) |
Occupancy by Educational Attainment in Amelia
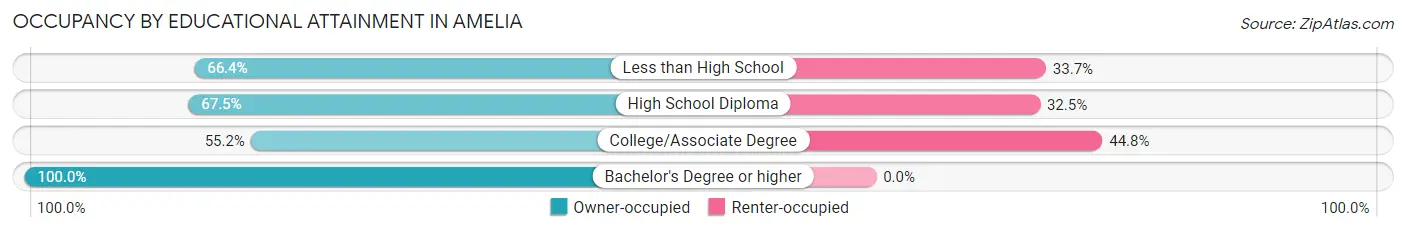
| Household Size | Owner-occupied | Renter-occupied |
| Less than High School | 138 (66.3%) | 70 (33.7%) |
| High School Diploma | 212 (67.5%) | 102 (32.5%) |
| College/Associate Degree | 80 (55.2%) | 65 (44.8%) |
| Bachelor's Degree or higher | 38 (100.0%) | 0 (0.0%) |
Occupancy by Age of Householder in Amelia
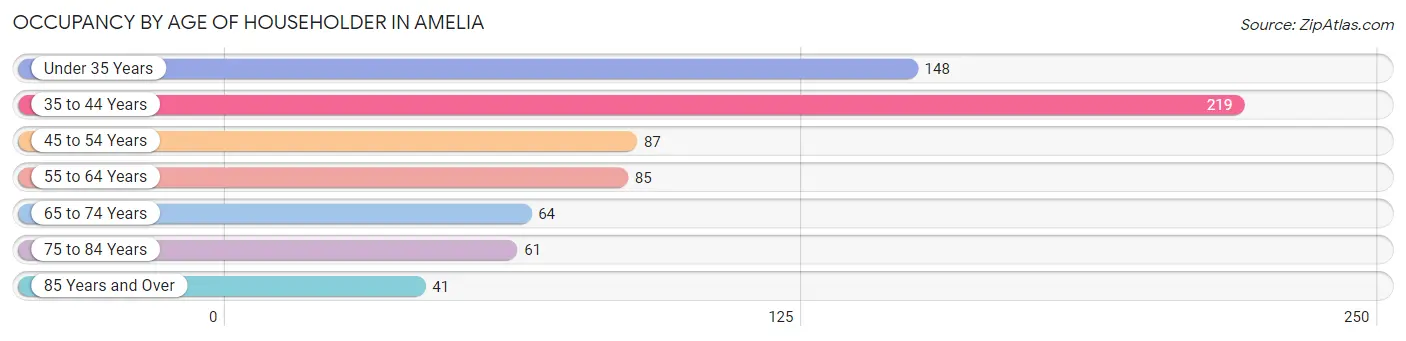
| Age Bracket | # Households | % Households |
| Under 35 Years | 148 | 21.0% |
| 35 to 44 Years | 219 | 31.1% |
| 45 to 54 Years | 87 | 12.3% |
| 55 to 64 Years | 85 | 12.1% |
| 65 to 74 Years | 64 | 9.1% |
| 75 to 84 Years | 61 | 8.6% |
| 85 Years and Over | 41 | 5.8% |
| Total | 705 | 100.0% |
Housing Finances in Amelia
Median Income by Occupancy in Amelia
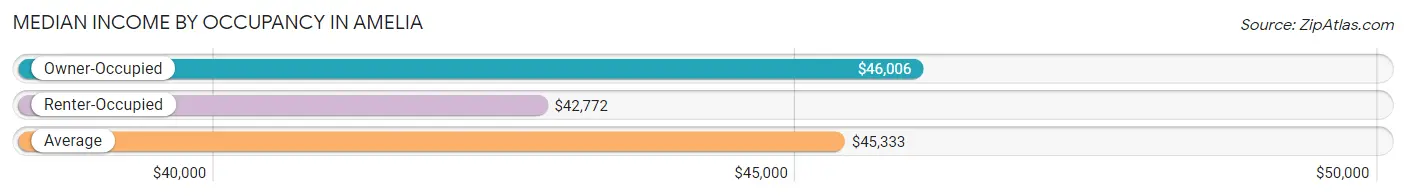
| Occupancy Type | # Households | Median Income |
| Owner-Occupied | 468 (66.4%) | $46,006 |
| Renter-Occupied | 237 (33.6%) | $42,772 |
| Average | 705 (100.0%) | $45,333 |
Occupancy by Householder Income Bracket in Amelia
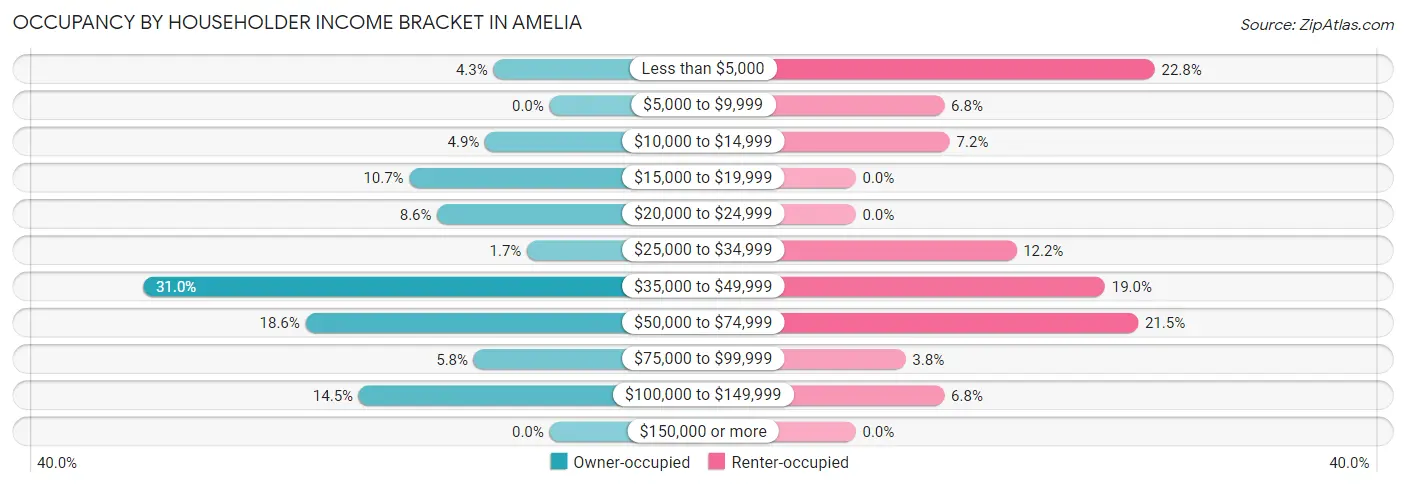
| Income Bracket | Owner-occupied | Renter-occupied |
| Less than $5,000 | 20 (4.3%) | 54 (22.8%) |
| $5,000 to $9,999 | 0 (0.0%) | 16 (6.8%) |
| $10,000 to $14,999 | 23 (4.9%) | 17 (7.2%) |
| $15,000 to $19,999 | 50 (10.7%) | 0 (0.0%) |
| $20,000 to $24,999 | 40 (8.6%) | 0 (0.0%) |
| $25,000 to $34,999 | 8 (1.7%) | 29 (12.2%) |
| $35,000 to $49,999 | 145 (31.0%) | 45 (19.0%) |
| $50,000 to $74,999 | 87 (18.6%) | 51 (21.5%) |
| $75,000 to $99,999 | 27 (5.8%) | 9 (3.8%) |
| $100,000 to $149,999 | 68 (14.5%) | 16 (6.8%) |
| $150,000 or more | 0 (0.0%) | 0 (0.0%) |
| Total | 468 (100.0%) | 237 (100.0%) |
Monthly Housing Cost Tiers in Amelia
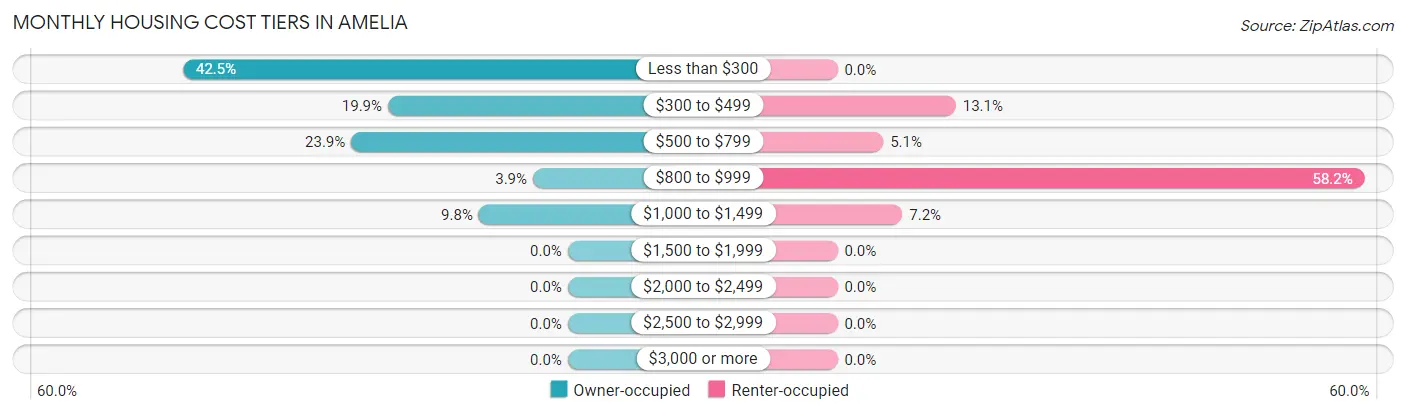
| Monthly Cost | Owner-occupied | Renter-occupied |
| Less than $300 | 199 (42.5%) | 0 (0.0%) |
| $300 to $499 | 93 (19.9%) | 31 (13.1%) |
| $500 to $799 | 112 (23.9%) | 12 (5.1%) |
| $800 to $999 | 18 (3.8%) | 138 (58.2%) |
| $1,000 to $1,499 | 46 (9.8%) | 17 (7.2%) |
| $1,500 to $1,999 | 0 (0.0%) | 0 (0.0%) |
| $2,000 to $2,499 | 0 (0.0%) | 0 (0.0%) |
| $2,500 to $2,999 | 0 (0.0%) | 0 (0.0%) |
| $3,000 or more | 0 (0.0%) | 0 (0.0%) |
| Total | 468 (100.0%) | 237 (100.0%) |
Physical Housing Characteristics in Amelia
Housing Structures in Amelia
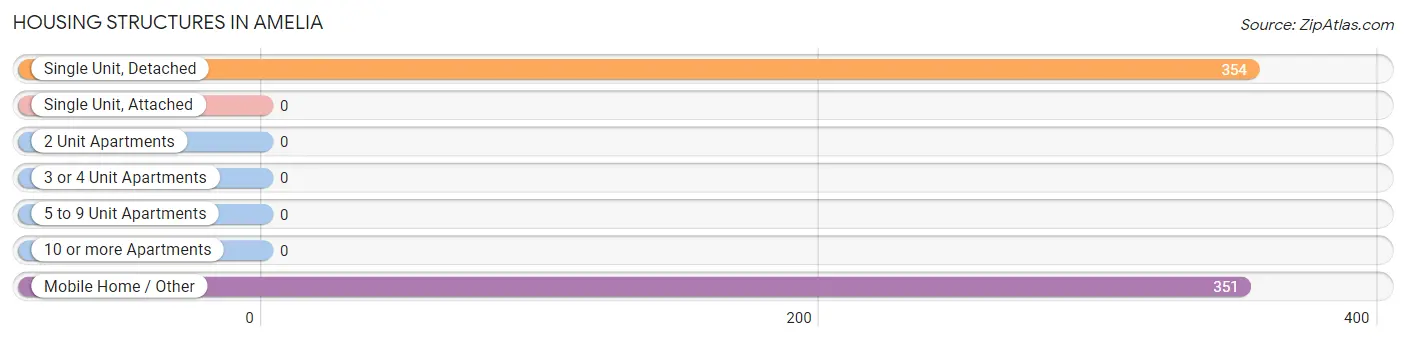
| Structure Type | # Housing Units | % Housing Units |
| Single Unit, Detached | 354 | 50.2% |
| Single Unit, Attached | 0 | 0.0% |
| 2 Unit Apartments | 0 | 0.0% |
| 3 or 4 Unit Apartments | 0 | 0.0% |
| 5 to 9 Unit Apartments | 0 | 0.0% |
| 10 or more Apartments | 0 | 0.0% |
| Mobile Home / Other | 351 | 49.8% |
| Total | 705 | 100.0% |
Housing Structures by Occupancy in Amelia
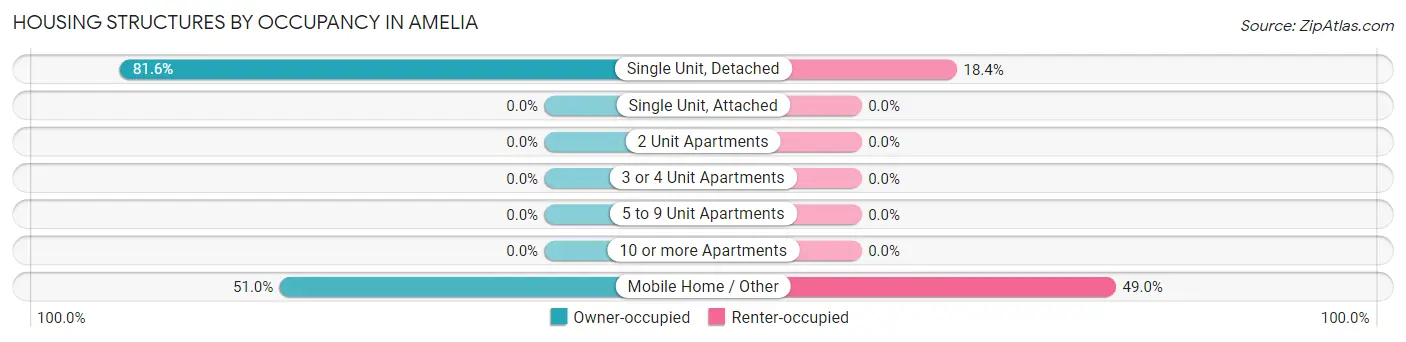
| Structure Type | Owner-occupied | Renter-occupied |
| Single Unit, Detached | 289 (81.6%) | 65 (18.4%) |
| Single Unit, Attached | 0 (0.0%) | 0 (0.0%) |
| 2 Unit Apartments | 0 (0.0%) | 0 (0.0%) |
| 3 or 4 Unit Apartments | 0 (0.0%) | 0 (0.0%) |
| 5 to 9 Unit Apartments | 0 (0.0%) | 0 (0.0%) |
| 10 or more Apartments | 0 (0.0%) | 0 (0.0%) |
| Mobile Home / Other | 179 (51.0%) | 172 (49.0%) |
| Total | 468 (66.4%) | 237 (33.6%) |
Housing Structures by Number of Rooms in Amelia
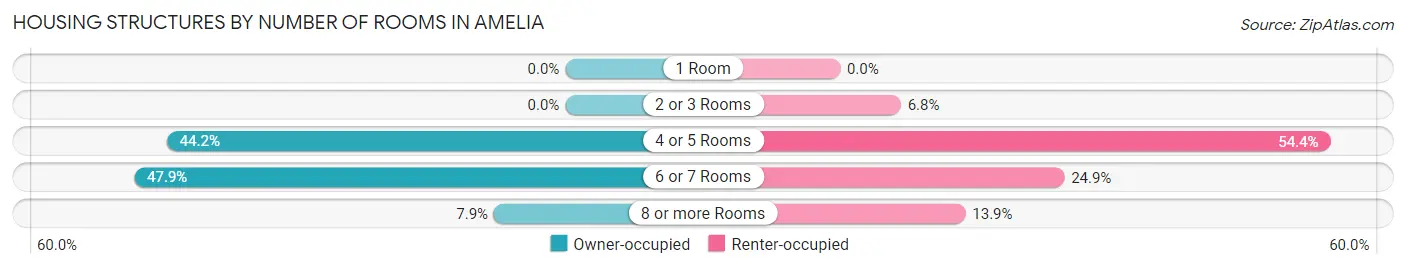
| Number of Rooms | Owner-occupied | Renter-occupied |
| 1 Room | 0 (0.0%) | 0 (0.0%) |
| 2 or 3 Rooms | 0 (0.0%) | 16 (6.8%) |
| 4 or 5 Rooms | 207 (44.2%) | 129 (54.4%) |
| 6 or 7 Rooms | 224 (47.9%) | 59 (24.9%) |
| 8 or more Rooms | 37 (7.9%) | 33 (13.9%) |
| Total | 468 (100.0%) | 237 (100.0%) |
Housing Structure by Heating Type in Amelia
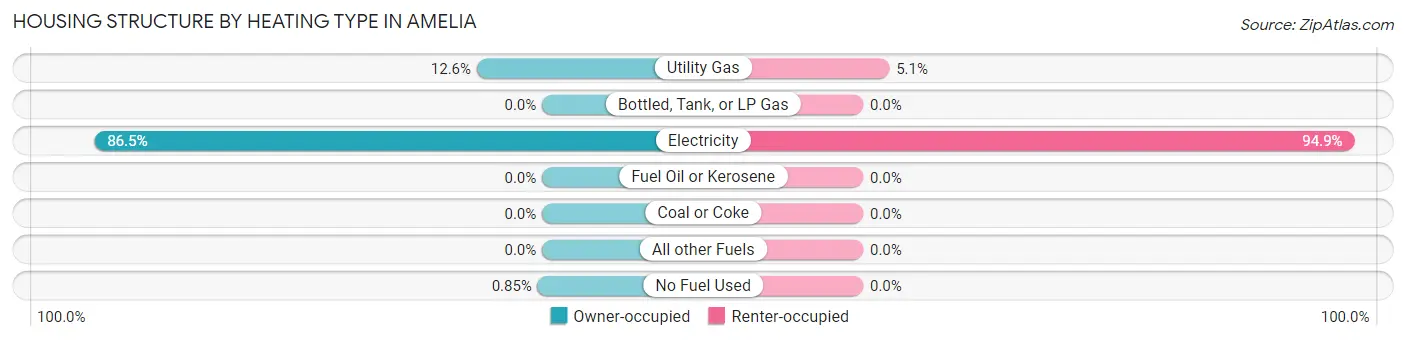
| Heating Type | Owner-occupied | Renter-occupied |
| Utility Gas | 59 (12.6%) | 12 (5.1%) |
| Bottled, Tank, or LP Gas | 0 (0.0%) | 0 (0.0%) |
| Electricity | 405 (86.5%) | 225 (94.9%) |
| Fuel Oil or Kerosene | 0 (0.0%) | 0 (0.0%) |
| Coal or Coke | 0 (0.0%) | 0 (0.0%) |
| All other Fuels | 0 (0.0%) | 0 (0.0%) |
| No Fuel Used | 4 (0.9%) | 0 (0.0%) |
| Total | 468 (100.0%) | 237 (100.0%) |
Household Vehicle Usage in Amelia
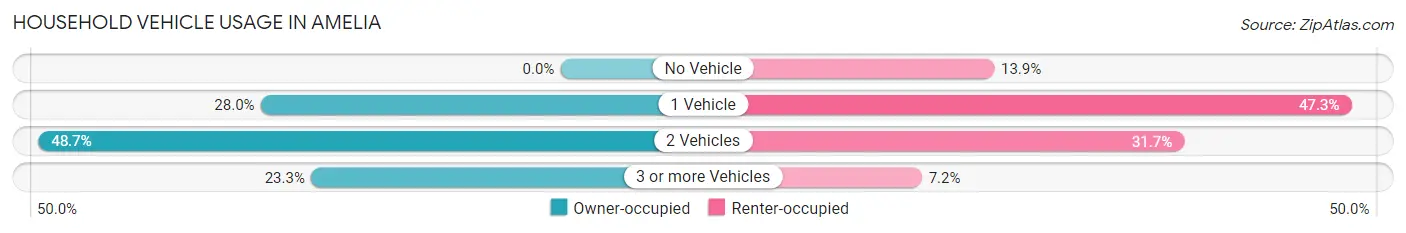
| Vehicles per Household | Owner-occupied | Renter-occupied |
| No Vehicle | 0 (0.0%) | 33 (13.9%) |
| 1 Vehicle | 131 (28.0%) | 112 (47.3%) |
| 2 Vehicles | 228 (48.7%) | 75 (31.7%) |
| 3 or more Vehicles | 109 (23.3%) | 17 (7.2%) |
| Total | 468 (100.0%) | 237 (100.0%) |
Real Estate & Mortgages in Amelia
Real Estate and Mortgage Overview in Amelia
| Characteristic | Without Mortgage | With Mortgage |
| Housing Units | 380 | 88 |
| Median Property Value | - | - |
| Median Household Income | $45,227 | $0 |
| Monthly Housing Costs | $297 | $0 |
| Real Estate Taxes | $346 | $45 |
Property Value by Mortgage Status in Amelia
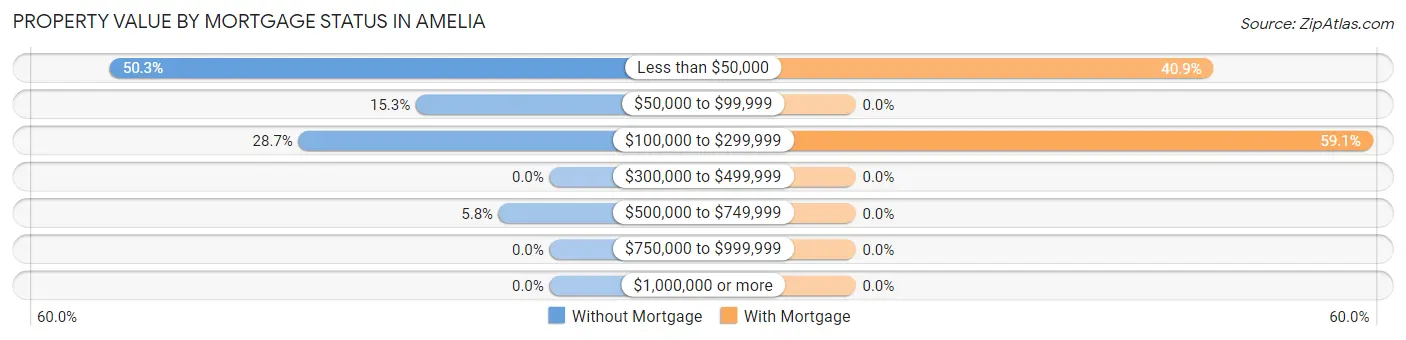
| Property Value | Without Mortgage | With Mortgage |
| Less than $50,000 | 191 (50.3%) | 36 (40.9%) |
| $50,000 to $99,999 | 58 (15.3%) | 0 (0.0%) |
| $100,000 to $299,999 | 109 (28.7%) | 52 (59.1%) |
| $300,000 to $499,999 | 0 (0.0%) | 0 (0.0%) |
| $500,000 to $749,999 | 22 (5.8%) | 0 (0.0%) |
| $750,000 to $999,999 | 0 (0.0%) | 0 (0.0%) |
| $1,000,000 or more | 0 (0.0%) | 0 (0.0%) |
| Total | 380 (100.0%) | 88 (100.0%) |
Household Income by Mortgage Status in Amelia
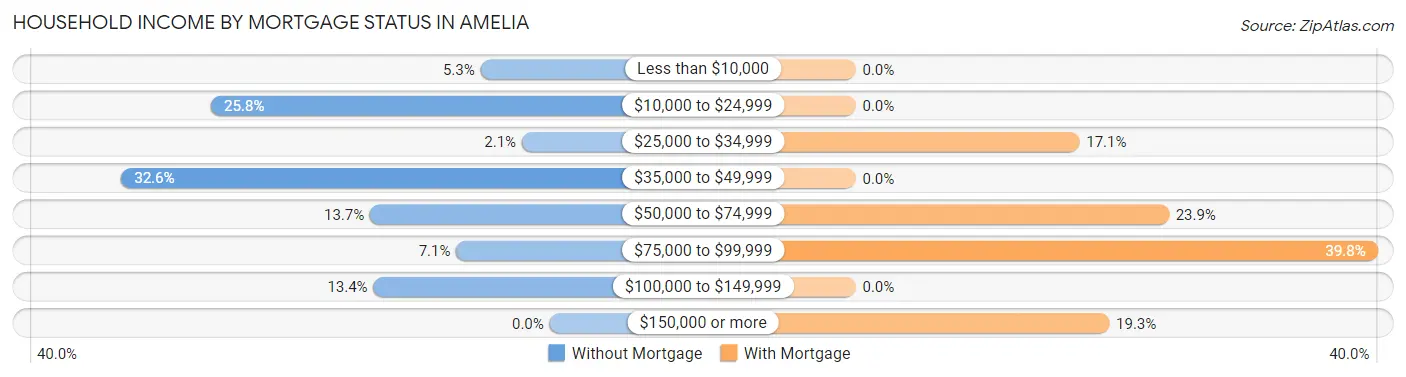
| Household Income | Without Mortgage | With Mortgage |
| Less than $10,000 | 20 (5.3%) | 0 (0.0%) |
| $10,000 to $24,999 | 98 (25.8%) | 0 (0.0%) |
| $25,000 to $34,999 | 8 (2.1%) | 15 (17.1%) |
| $35,000 to $49,999 | 124 (32.6%) | 0 (0.0%) |
| $50,000 to $74,999 | 52 (13.7%) | 21 (23.9%) |
| $75,000 to $99,999 | 27 (7.1%) | 35 (39.8%) |
| $100,000 to $149,999 | 51 (13.4%) | 0 (0.0%) |
| $150,000 or more | 0 (0.0%) | 17 (19.3%) |
| Total | 380 (100.0%) | 88 (100.0%) |
Property Value to Household Income Ratio in Amelia
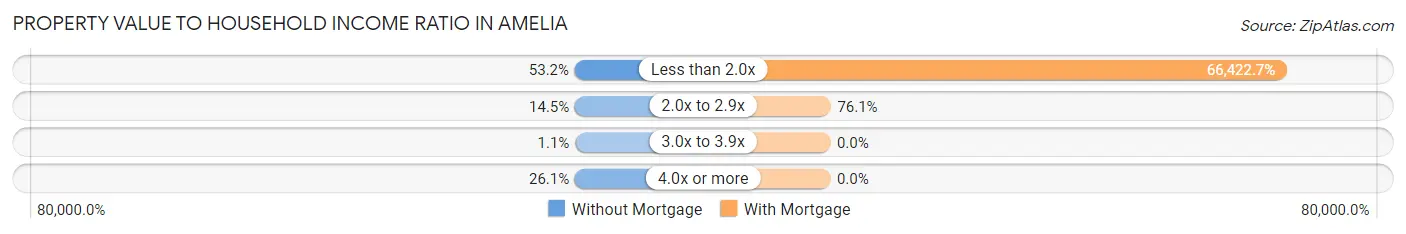
| Value-to-Income Ratio | Without Mortgage | With Mortgage |
| Less than 2.0x | 202 (53.2%) | 58,452 (66,422.7%) |
| 2.0x to 2.9x | 55 (14.5%) | 67 (76.1%) |
| 3.0x to 3.9x | 4 (1.1%) | 0 (0.0%) |
| 4.0x or more | 99 (26.1%) | 0 (0.0%) |
| Total | 380 (100.0%) | 88 (100.0%) |
Real Estate Taxes by Mortgage Status in Amelia
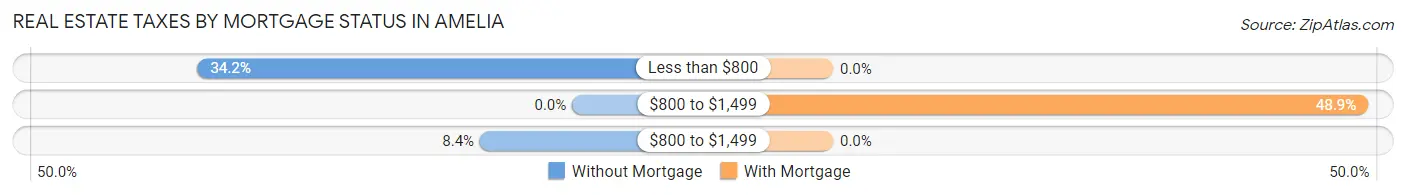
| Property Taxes | Without Mortgage | With Mortgage |
| Less than $800 | 130 (34.2%) | 0 (0.0%) |
| $800 to $1,499 | 0 (0.0%) | 43 (48.9%) |
| $800 to $1,499 | 32 (8.4%) | 0 (0.0%) |
| Total | 380 (100.0%) | 88 (100.0%) |
Health & Disability in Amelia
Health Insurance Coverage by Age in Amelia
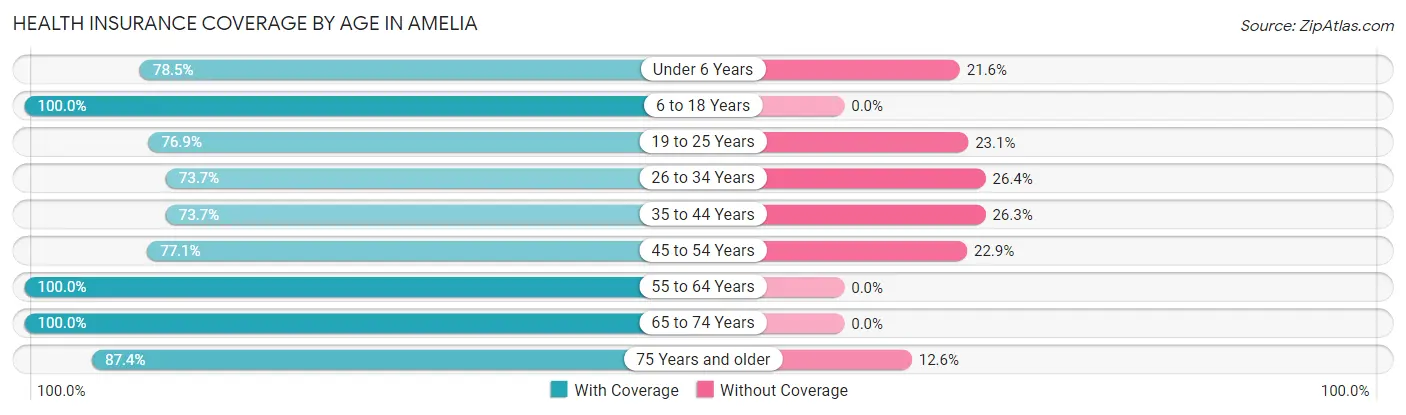
| Age Bracket | With Coverage | Without Coverage |
| Under 6 Years | 222 (78.4%) | 61 (21.5%) |
| 6 to 18 Years | 361 (100.0%) | 0 (0.0%) |
| 19 to 25 Years | 163 (76.9%) | 49 (23.1%) |
| 26 to 34 Years | 123 (73.7%) | 44 (26.4%) |
| 35 to 44 Years | 221 (73.7%) | 79 (26.3%) |
| 45 to 54 Years | 192 (77.1%) | 57 (22.9%) |
| 55 to 64 Years | 193 (100.0%) | 0 (0.0%) |
| 65 to 74 Years | 100 (100.0%) | 0 (0.0%) |
| 75 Years and older | 118 (87.4%) | 17 (12.6%) |
| Total | 1,693 (84.7%) | 307 (15.3%) |
Health Insurance Coverage by Citizenship Status in Amelia
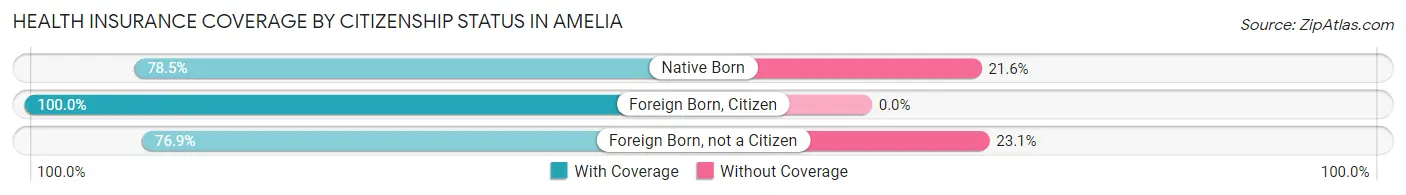
| Citizenship Status | With Coverage | Without Coverage |
| Native Born | 222 (78.4%) | 61 (21.5%) |
| Foreign Born, Citizen | 361 (100.0%) | 0 (0.0%) |
| Foreign Born, not a Citizen | 163 (76.9%) | 49 (23.1%) |
Health Insurance Coverage by Household Income in Amelia
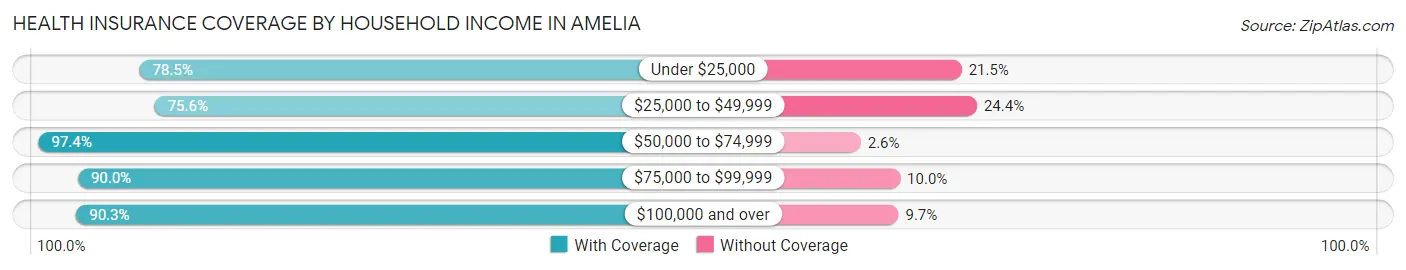
| Household Income | With Coverage | Without Coverage |
| Under $25,000 | 328 (78.5%) | 90 (21.5%) |
| $25,000 to $49,999 | 493 (75.6%) | 159 (24.4%) |
| $50,000 to $74,999 | 446 (97.4%) | 12 (2.6%) |
| $75,000 to $99,999 | 81 (90.0%) | 9 (10.0%) |
| $100,000 and over | 345 (90.3%) | 37 (9.7%) |
Public vs Private Health Insurance Coverage by Age in Amelia
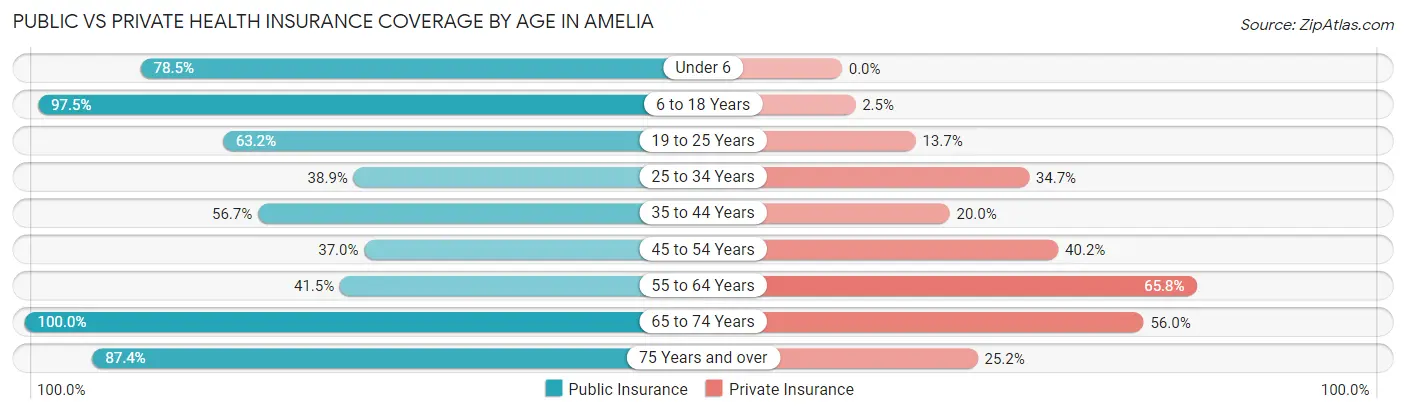
| Age Bracket | Public Insurance | Private Insurance |
| Under 6 | 222 (78.4%) | 0 (0.0%) |
| 6 to 18 Years | 352 (97.5%) | 9 (2.5%) |
| 19 to 25 Years | 134 (63.2%) | 29 (13.7%) |
| 25 to 34 Years | 65 (38.9%) | 58 (34.7%) |
| 35 to 44 Years | 170 (56.7%) | 60 (20.0%) |
| 45 to 54 Years | 92 (36.9%) | 100 (40.2%) |
| 55 to 64 Years | 80 (41.4%) | 127 (65.8%) |
| 65 to 74 Years | 100 (100.0%) | 56 (56.0%) |
| 75 Years and over | 118 (87.4%) | 34 (25.2%) |
| Total | 1,333 (66.6%) | 473 (23.6%) |
Disability Status by Sex by Age in Amelia
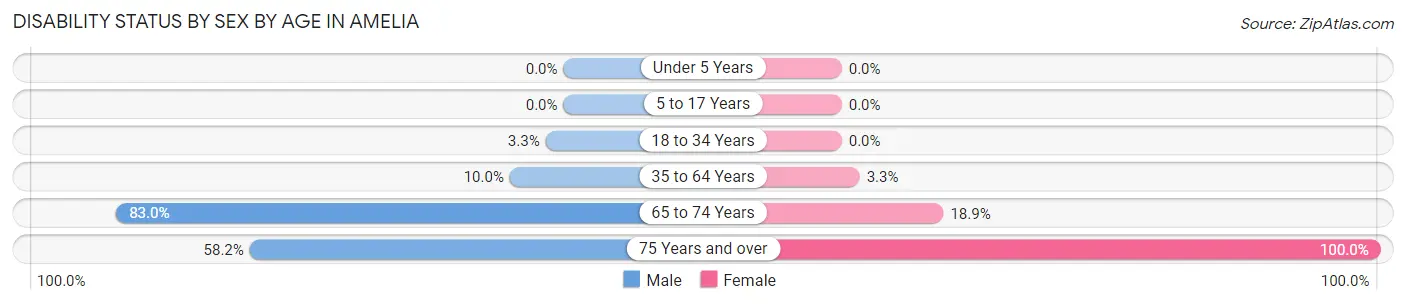
| Age Bracket | Male | Female |
| Under 5 Years | 0 (0.0%) | 0 (0.0%) |
| 5 to 17 Years | 0 (0.0%) | 0 (0.0%) |
| 18 to 34 Years | 8 (3.3%) | 0 (0.0%) |
| 35 to 64 Years | 41 (10.0%) | 11 (3.3%) |
| 65 to 74 Years | 39 (83.0%) | 10 (18.9%) |
| 75 Years and over | 46 (58.2%) | 56 (100.0%) |
Disability Class by Sex by Age in Amelia
Disability Class: Hearing Difficulty
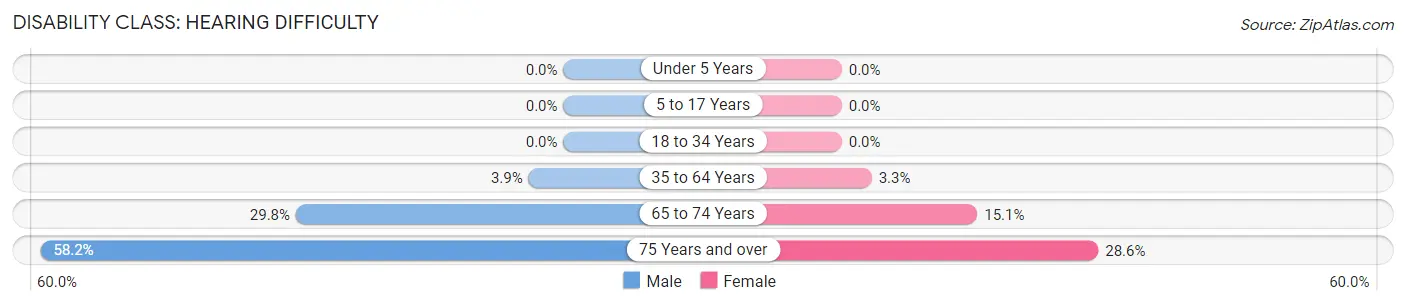
| Age Bracket | Male | Female |
| Under 5 Years | 0 (0.0%) | 0 (0.0%) |
| 5 to 17 Years | 0 (0.0%) | 0 (0.0%) |
| 18 to 34 Years | 0 (0.0%) | 0 (0.0%) |
| 35 to 64 Years | 16 (3.9%) | 11 (3.3%) |
| 65 to 74 Years | 14 (29.8%) | 8 (15.1%) |
| 75 Years and over | 46 (58.2%) | 16 (28.6%) |
Disability Class: Vision Difficulty
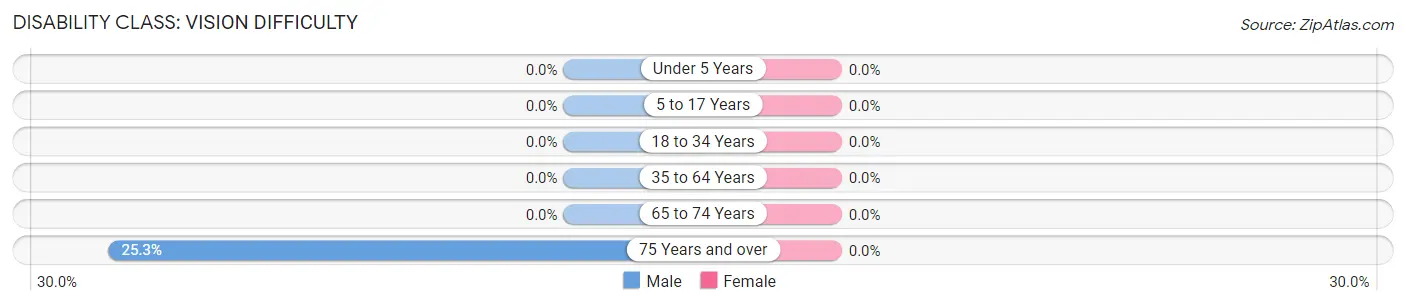
| Age Bracket | Male | Female |
| Under 5 Years | 0 (0.0%) | 0 (0.0%) |
| 5 to 17 Years | 0 (0.0%) | 0 (0.0%) |
| 18 to 34 Years | 0 (0.0%) | 0 (0.0%) |
| 35 to 64 Years | 0 (0.0%) | 0 (0.0%) |
| 65 to 74 Years | 0 (0.0%) | 0 (0.0%) |
| 75 Years and over | 20 (25.3%) | 0 (0.0%) |
Disability Class: Cognitive Difficulty
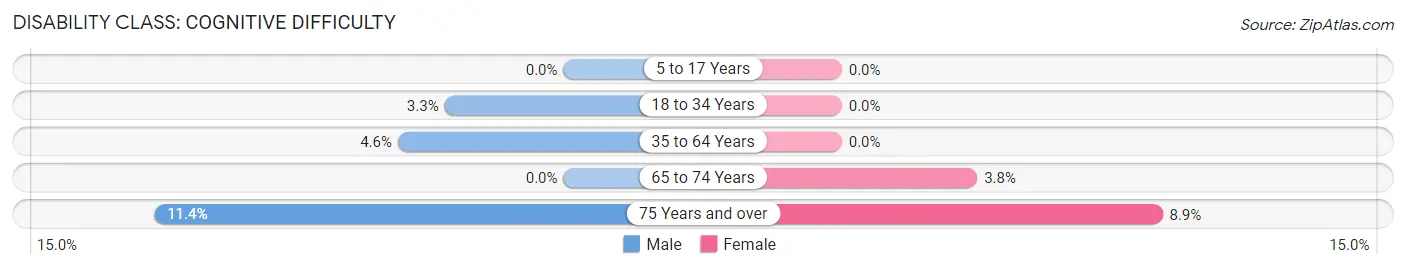
| Age Bracket | Male | Female |
| 5 to 17 Years | 0 (0.0%) | 0 (0.0%) |
| 18 to 34 Years | 8 (3.3%) | 0 (0.0%) |
| 35 to 64 Years | 19 (4.6%) | 0 (0.0%) |
| 65 to 74 Years | 0 (0.0%) | 2 (3.8%) |
| 75 Years and over | 9 (11.4%) | 5 (8.9%) |
Disability Class: Ambulatory Difficulty
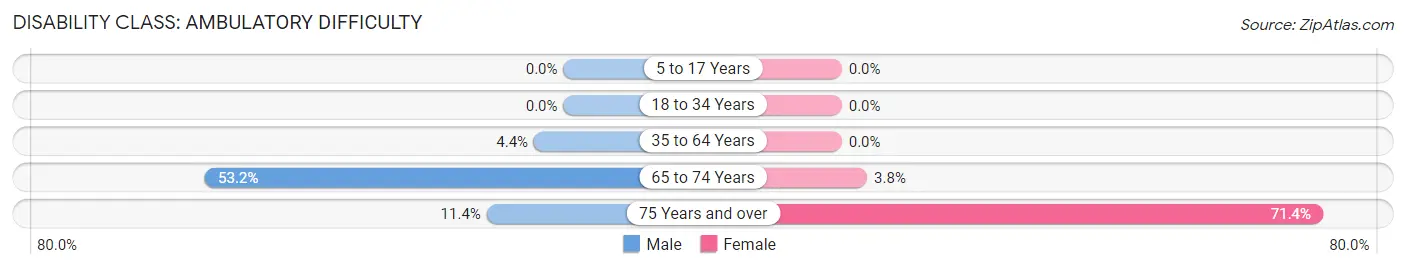
| Age Bracket | Male | Female |
| 5 to 17 Years | 0 (0.0%) | 0 (0.0%) |
| 18 to 34 Years | 0 (0.0%) | 0 (0.0%) |
| 35 to 64 Years | 18 (4.4%) | 0 (0.0%) |
| 65 to 74 Years | 25 (53.2%) | 2 (3.8%) |
| 75 Years and over | 9 (11.4%) | 40 (71.4%) |
Disability Class: Self-Care Difficulty
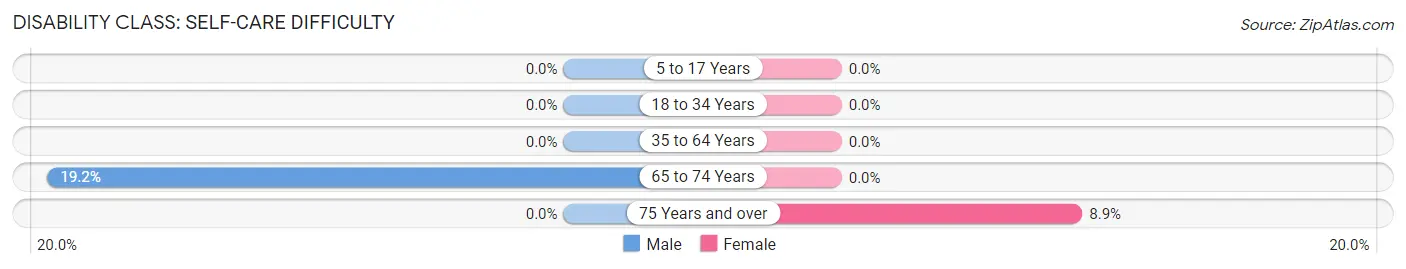
| Age Bracket | Male | Female |
| 5 to 17 Years | 0 (0.0%) | 0 (0.0%) |
| 18 to 34 Years | 0 (0.0%) | 0 (0.0%) |
| 35 to 64 Years | 0 (0.0%) | 0 (0.0%) |
| 65 to 74 Years | 9 (19.2%) | 0 (0.0%) |
| 75 Years and over | 0 (0.0%) | 5 (8.9%) |
Technology Access in Amelia
Computing Device Access in Amelia
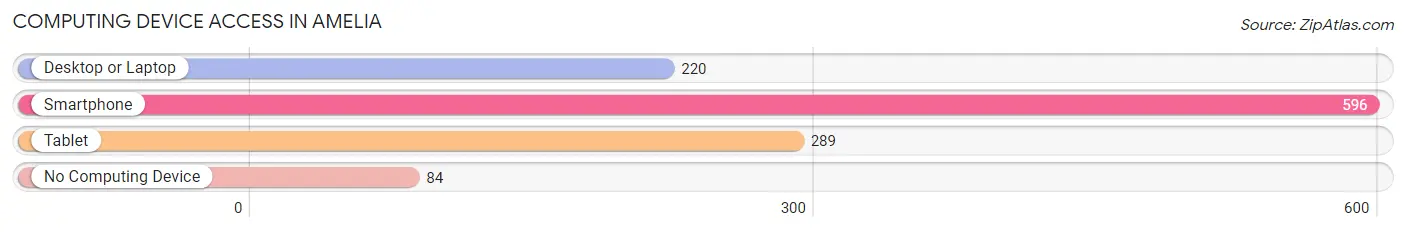
| Device Type | # Households | % Households |
| Desktop or Laptop | 220 | 31.2% |
| Smartphone | 596 | 84.5% |
| Tablet | 289 | 41.0% |
| No Computing Device | 84 | 11.9% |
| Total | 705 | 100.0% |
Internet Access in Amelia
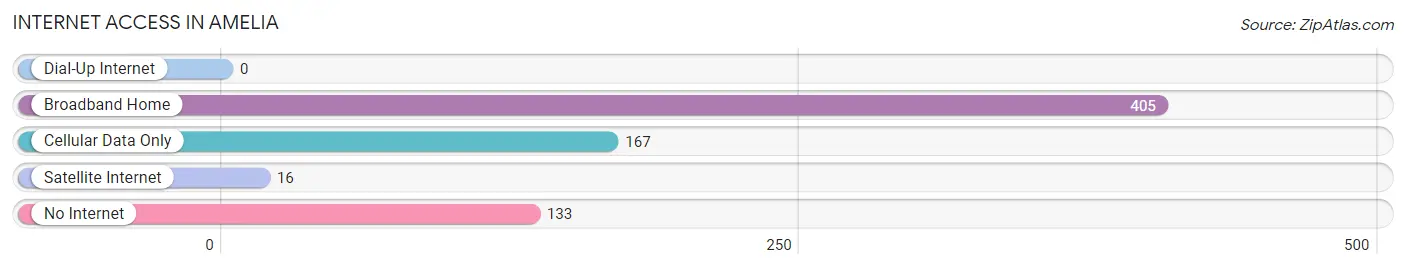
| Internet Type | # Households | % Households |
| Dial-Up Internet | 0 | 0.0% |
| Broadband Home | 405 | 57.5% |
| Cellular Data Only | 167 | 23.7% |
| Satellite Internet | 16 | 2.3% |
| No Internet | 133 | 18.9% |
| Total | 705 | 100.0% |
Amelia Summary
Amelia is a small town located in St. Mary Parish, Louisiana. It is situated on the banks of the Atchafalaya River, approximately 25 miles south of Morgan City. The town has a population of 1,845 people, according to the 2010 census.
Geography
Amelia is located in the southeastern part of St. Mary Parish, Louisiana. It is situated on the banks of the Atchafalaya River, approximately 25 miles south of Morgan City. The town is surrounded by marshland and is bordered by the Atchafalaya River to the east and the Gulf of Mexico to the south. The town is located in the humid subtropical climate zone, with hot, humid summers and mild winters. The average annual temperature is 73°F (23°C).
History
Amelia was founded in 1845 by a group of French settlers. The town was named after the daughter of one of the settlers, Amelia Broussard. The town was originally a small fishing village, but it grew rapidly in the late 19th century due to the development of the sugar cane industry. The town was incorporated in 1891 and by the early 20th century, it had become a major port for the sugar cane industry.
In the 1950s, Amelia began to experience a decline in the sugar cane industry, and the town began to focus on other industries such as fishing, shrimping, and oil and gas. The town has also become a popular tourist destination, with many visitors coming to enjoy the town’s natural beauty and its proximity to the Atchafalaya River.
Economy
The economy of Amelia is largely based on the oil and gas industry, fishing, and tourism. The town is home to several oil and gas companies, including Chevron, Shell, and ExxonMobil. Fishing and shrimping are also important industries in the town, with many of the local fishermen selling their catch to local restaurants and markets.
Tourism is also an important part of the local economy. The town is home to several popular attractions, including the Atchafalaya River, the Amelia Wildlife Refuge, and the Amelia Nature Center. The town also hosts several festivals throughout the year, including the Amelia Mardi Gras Festival and the Amelia Seafood Festival.
Demographics
According to the 2010 census, Amelia has a population of 1,845 people. The town is predominantly white, with a population that is 77.3% white, 19.2% African American, and 2.5% Hispanic or Latino. The median household income in Amelia is $37,917, and the median age is 38.7 years.
Conclusion
Amelia is a small town located in St. Mary Parish, Louisiana. It is situated on the banks of the Atchafalaya River, approximately 25 miles south of Morgan City. The town has a population of 1,845 people, according to the 2010 census. The economy of Amelia is largely based on the oil and gas industry, fishing, and tourism. The town is predominantly white, with a population that is 77.3% white, 19.2% African American, and 2.5% Hispanic or Latino. Amelia is a popular tourist destination, with many visitors coming to enjoy the town’s natural beauty and its proximity to the Atchafalaya River.
Common Questions
What is Per Capita Income in Amelia?
Per Capita income in Amelia is $17,987.
What is the Median Family Income in Amelia?
Median Family Income in Amelia is $46,537.
What is the Median Household income in Amelia?
Median Household Income in Amelia is $45,333.
What is Income or Wage Gap in Amelia?
Income or Wage Gap in Amelia is 62.5%.
Women in Amelia earn 37.5 cents for every dollar earned by a man.
What is Family Income Deficit in Amelia?
Family Income Deficit in Amelia is $13,096.
Families that are below poverty line in Amelia earn $13,096 less on average than the poverty threshold level.
What is Inequality or Gini Index in Amelia?
Inequality or Gini Index in Amelia is 0.41.
What is the Total Population of Amelia?
Total Population of Amelia is 2,000.
What is the Total Male Population of Amelia?
Total Male Population of Amelia is 1,044.
What is the Total Female Population of Amelia?
Total Female Population of Amelia is 956.
What is the Ratio of Males per 100 Females in Amelia?
There are 109.21 Males per 100 Females in Amelia.
What is the Ratio of Females per 100 Males in Amelia?
There are 91.57 Females per 100 Males in Amelia.
What is the Median Population Age in Amelia?
Median Population Age in Amelia is 31.7 Years.
What is the Average Family Size in Amelia
Average Family Size in Amelia is 3.2 People.
What is the Average Household Size in Amelia
Average Household Size in Amelia is 2.8 People.
How Large is the Labor Force in Amelia?
There are 811 People in the Labor Forcein in Amelia.
What is the Percentage of People in the Labor Force in Amelia?
53.8% of People are in the Labor Force in Amelia.
What is the Unemployment Rate in Amelia?
Unemployment Rate in Amelia is 8.5%.