Olowalu, HI Map & Demographics
Olowalu Map
Olowalu Overview
$50,106
PER CAPITA INCOME
$100,313
AVG FAMILY INCOME
$101,250
AVG HOUSEHOLD INCOME
0.51
INEQUALITY / GINI INDEX
88
TOTAL POPULATION
41
MALE POPULATION
47
FEMALE POPULATION
87.23
MALES / 100 FEMALES
114.63
FEMALES / 100 MALES
42.2
MEDIAN AGE
3.2
AVG FAMILY SIZE
3.1
AVG HOUSEHOLD SIZE
51
LABOR FORCE [ PEOPLE ]
81.0%
PERCENT IN LABOR FORCE
Income in Olowalu
Income Overview in Olowalu
Per Capita Income in Olowalu is $50,106, while median incomes of families and households are $100,313 and $101,250 respectively.
| Characteristic | Number | Measure |
| Per Capita Income | 88 | $50,106 |
| Median Family Income | 23 | $100,313 |
| Mean Family Income | 23 | $166,448 |
| Median Household Income | 28 | $101,250 |
| Mean Household Income | 28 | $144,736 |
| Income Deficit | 23 | $0 |
| Wage / Income Gap (%) | 88 | 0.00% |
| Wage / Income Gap ($) | 88 | 100.00¢ per $1 |
| Gini / Inequality Index | 88 | 0.51 |
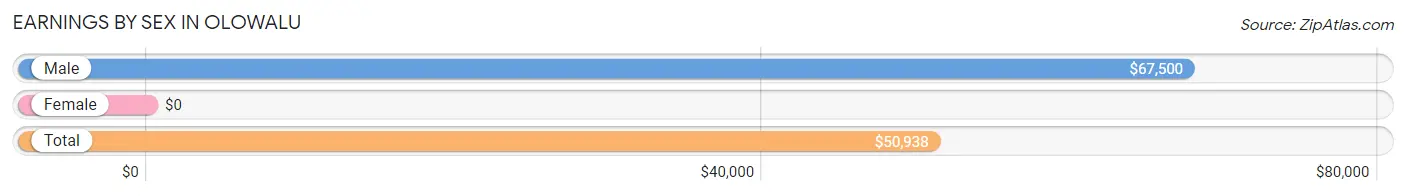
Earnings by Sex in Olowalu
| Sex | Number | Average Earnings |
| Male | 28 (54.9%) | $67,500 |
| Female | 23 (45.1%) | $0 |
| Total | 51 (100.0%) | $50,938 |
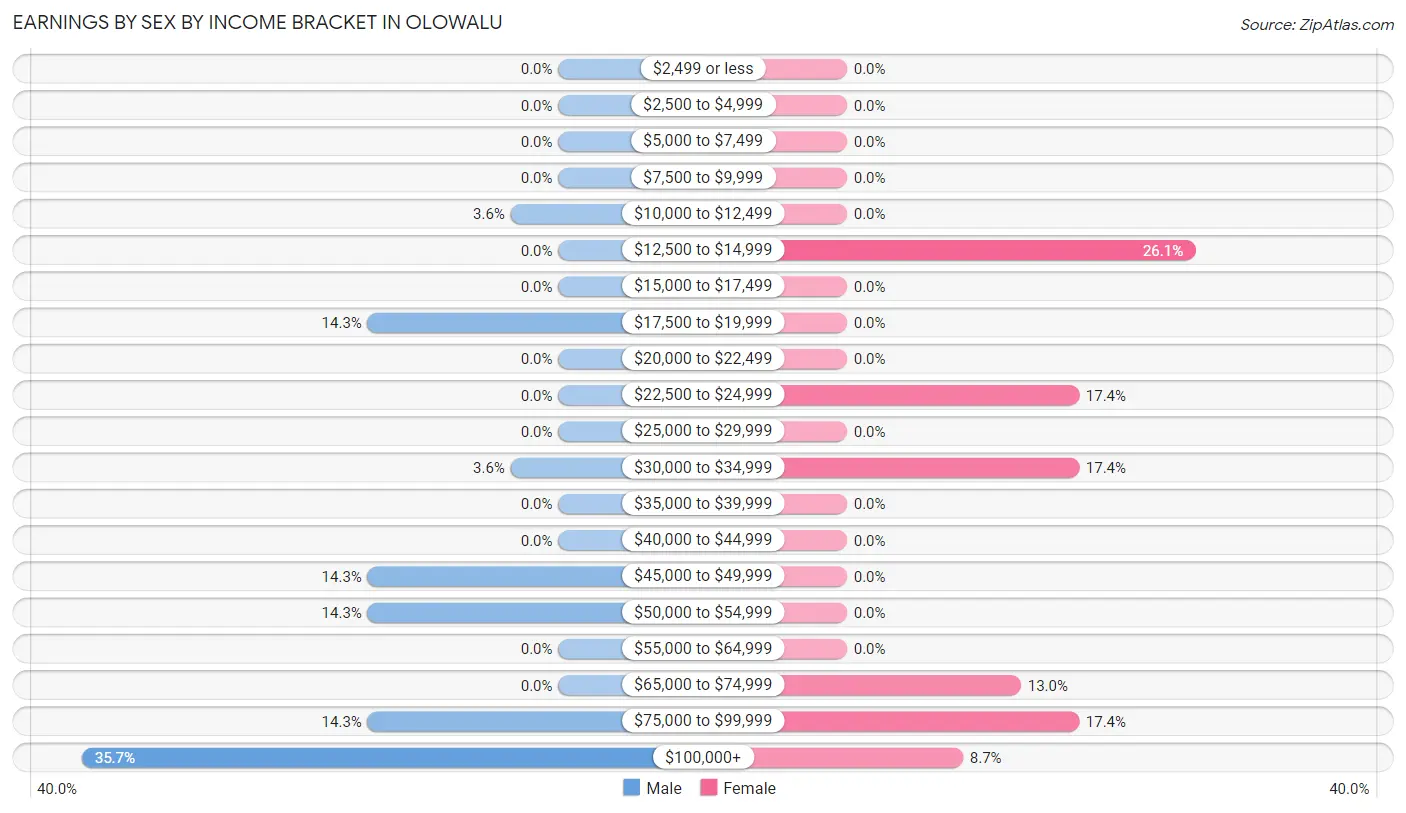
Earnings by Sex by Income Bracket in Olowalu
The most common earnings brackets in Olowalu are $100,000+ for men (10 | 35.7%) and $12,500 to $14,999 for women (6 | 26.1%).
| Income | Male | Female |
| $2,499 or less | 0 (0.0%) | 0 (0.0%) |
| $2,500 to $4,999 | 0 (0.0%) | 0 (0.0%) |
| $5,000 to $7,499 | 0 (0.0%) | 0 (0.0%) |
| $7,500 to $9,999 | 0 (0.0%) | 0 (0.0%) |
| $10,000 to $12,499 | 1 (3.6%) | 0 (0.0%) |
| $12,500 to $14,999 | 0 (0.0%) | 6 (26.1%) |
| $15,000 to $17,499 | 0 (0.0%) | 0 (0.0%) |
| $17,500 to $19,999 | 4 (14.3%) | 0 (0.0%) |
| $20,000 to $22,499 | 0 (0.0%) | 0 (0.0%) |
| $22,500 to $24,999 | 0 (0.0%) | 4 (17.4%) |
| $25,000 to $29,999 | 0 (0.0%) | 0 (0.0%) |
| $30,000 to $34,999 | 1 (3.6%) | 4 (17.4%) |
| $35,000 to $39,999 | 0 (0.0%) | 0 (0.0%) |
| $40,000 to $44,999 | 0 (0.0%) | 0 (0.0%) |
| $45,000 to $49,999 | 4 (14.3%) | 0 (0.0%) |
| $50,000 to $54,999 | 4 (14.3%) | 0 (0.0%) |
| $55,000 to $64,999 | 0 (0.0%) | 0 (0.0%) |
| $65,000 to $74,999 | 0 (0.0%) | 3 (13.0%) |
| $75,000 to $99,999 | 4 (14.3%) | 4 (17.4%) |
| $100,000+ | 10 (35.7%) | 2 (8.7%) |
| Total | 28 (100.0%) | 23 (100.0%) |
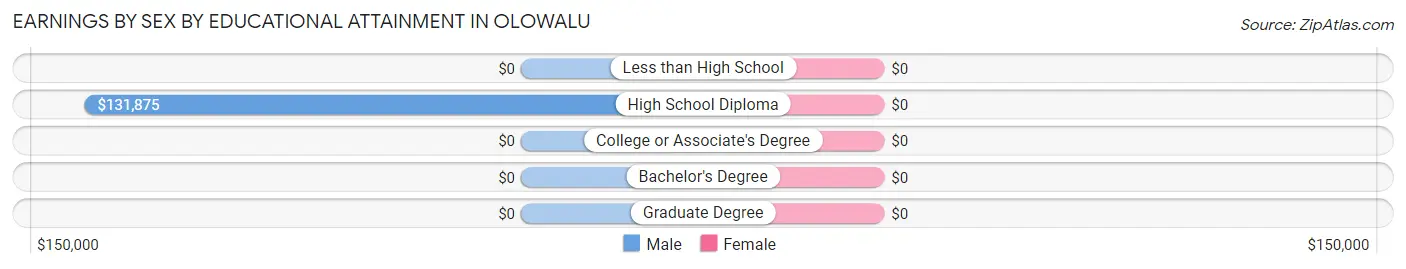
Earnings by Sex by Educational Attainment in Olowalu
| Educational Attainment | Male Income | Female Income |
| Less than High School | - | - |
| High School Diploma | $131,875 | $0 |
| College or Associate's Degree | - | - |
| Bachelor's Degree | - | - |
| Graduate Degree | - | - |
| Total | $67,500 | $0 |
Family Income in Olowalu
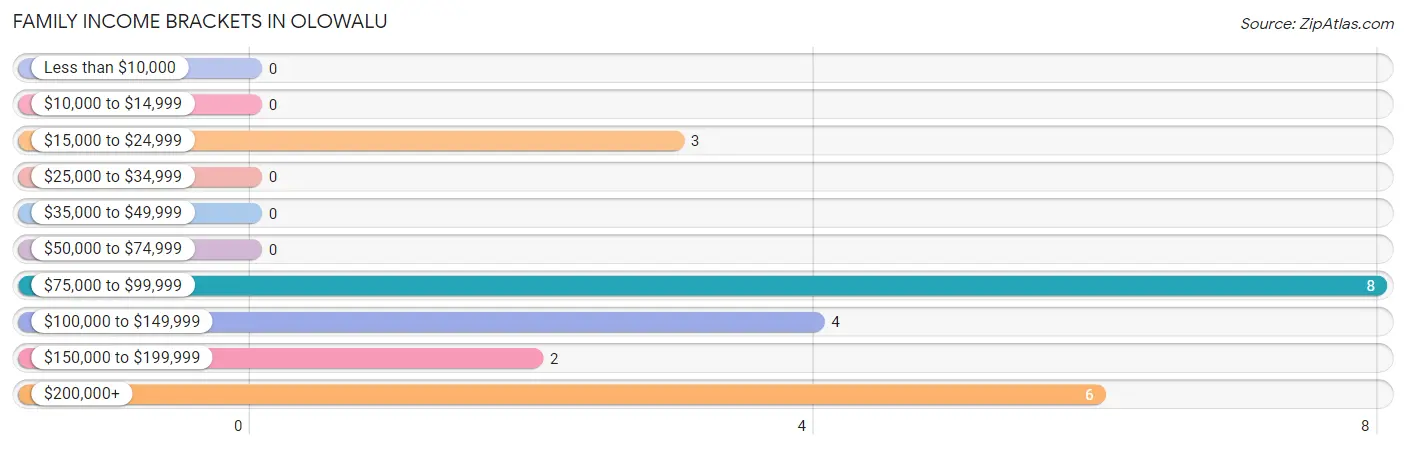
Family Income Brackets in Olowalu
According to the Olowalu family income data, there are 8 families falling into the $75,000 to $99,999 income range, which is the most common income bracket and makes up 34.8% of all families.
| Income Bracket | # Families | % Families |
| Less than $10,000 | 0 | 0.0% |
| $10,000 to $14,999 | 0 | 0.0% |
| $15,000 to $24,999 | 3 | 13.0% |
| $25,000 to $34,999 | 0 | 0.0% |
| $35,000 to $49,999 | 0 | 0.0% |
| $50,000 to $74,999 | 0 | 0.0% |
| $75,000 to $99,999 | 8 | 34.8% |
| $100,000 to $149,999 | 4 | 17.4% |
| $150,000 to $199,999 | 2 | 8.7% |
| $200,000+ | 6 | 26.1% |
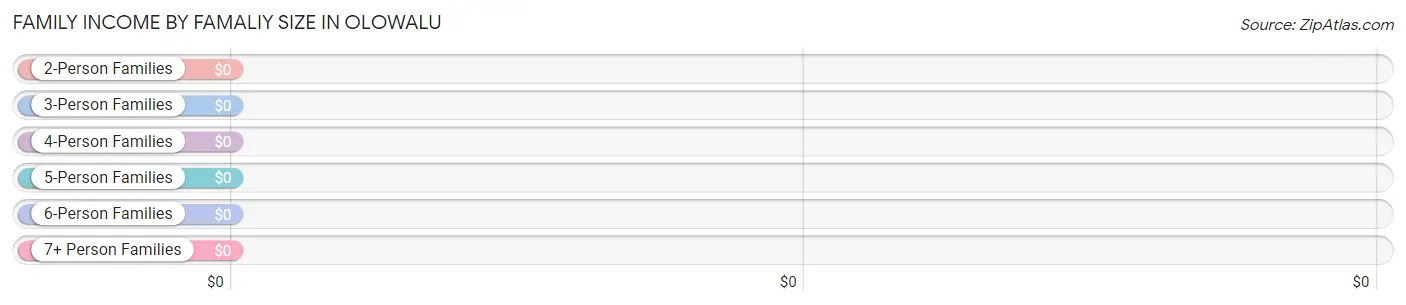
Family Income by Famaliy Size in Olowalu
| Income Bracket | # Families | Median Income |
| 2-Person Families | 6 (26.1%) | $0 |
| 3-Person Families | 11 (47.8%) | $0 |
| 4-Person Families | 6 (26.1%) | $0 |
| 5-Person Families | 0 (0.0%) | $0 |
| 6-Person Families | 0 (0.0%) | $0 |
| 7+ Person Families | 0 (0.0%) | $0 |
| Total | 23 (100.0%) | $100,313 |
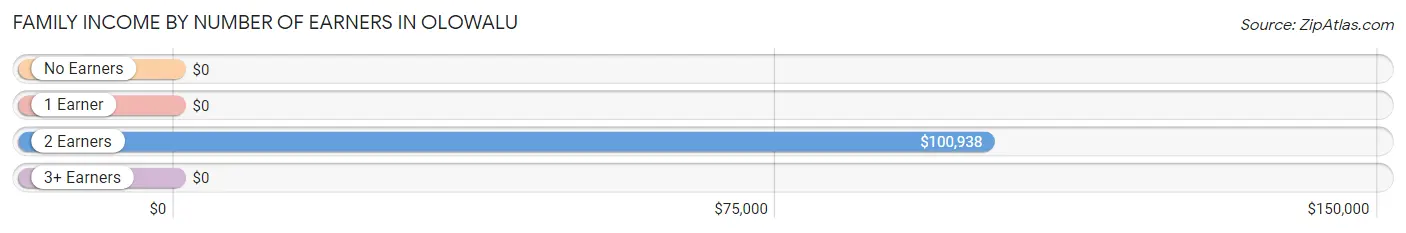
Family Income by Number of Earners in Olowalu
| Number of Earners | # Families | Median Income |
| No Earners | 2 (8.7%) | $0 |
| 1 Earner | 0 (0.0%) | $0 |
| 2 Earners | 21 (91.3%) | $100,938 |
| 3+ Earners | 0 (0.0%) | $0 |
| Total | 23 (100.0%) | $100,313 |
Household Income in Olowalu
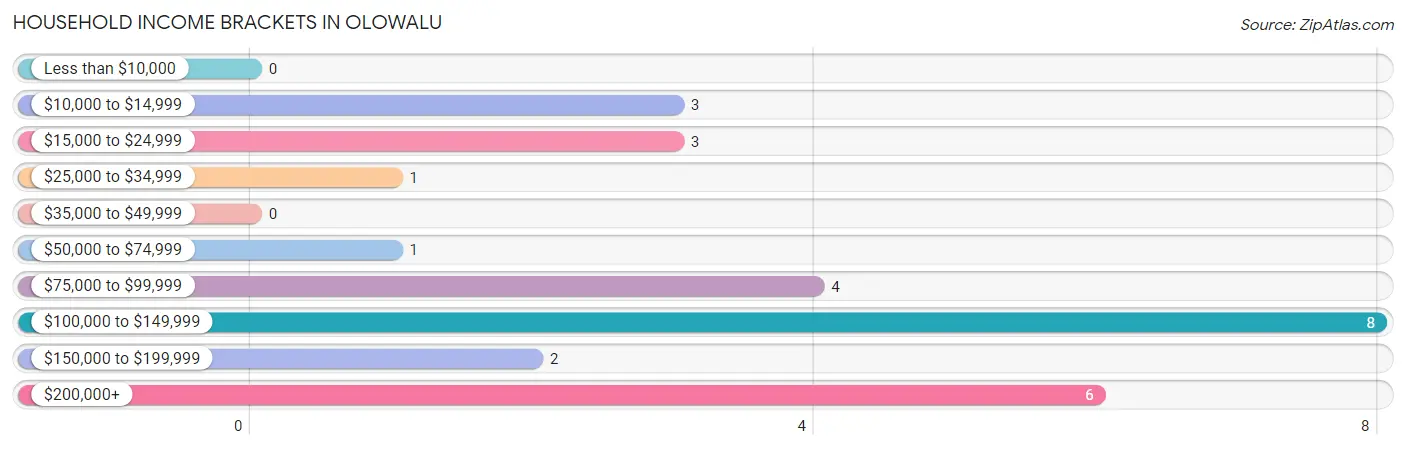
Household Income Brackets in Olowalu
With 8 households falling in the category, the $100,000 to $149,999 income range is the most frequent in Olowalu, accounting for 28.6% of all households.
| Income Bracket | # Households | % Households |
| Less than $10,000 | 0 | 0.0% |
| $10,000 to $14,999 | 3 | 10.7% |
| $15,000 to $24,999 | 3 | 10.7% |
| $25,000 to $34,999 | 1 | 3.6% |
| $35,000 to $49,999 | 0 | 0.0% |
| $50,000 to $74,999 | 1 | 3.6% |
| $75,000 to $99,999 | 4 | 14.3% |
| $100,000 to $149,999 | 8 | 28.6% |
| $150,000 to $199,999 | 2 | 7.1% |
| $200,000+ | 6 | 21.4% |
Household Income by Householder Age in Olowalu
The median household income in Olowalu is $101,250, with the highest median household income of $250,001 found in the 45 to 64 years age bracket for the primary householder. A total of 6 households (21.4%) fall into this category.
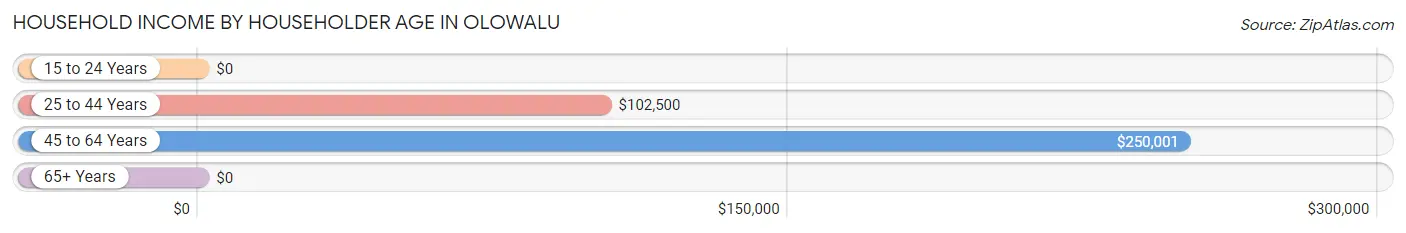
| Income Bracket | # Households | Median Income |
| 15 to 24 Years | 0 (0.0%) | $0 |
| 25 to 44 Years | 16 (57.1%) | $102,500 |
| 45 to 64 Years | 6 (21.4%) | $250,001 |
| 65+ Years | 6 (21.4%) | $0 |
| Total | 28 (100.0%) | $101,250 |
Poverty in Olowalu
Income Below Poverty by Sex and Age in Olowalu
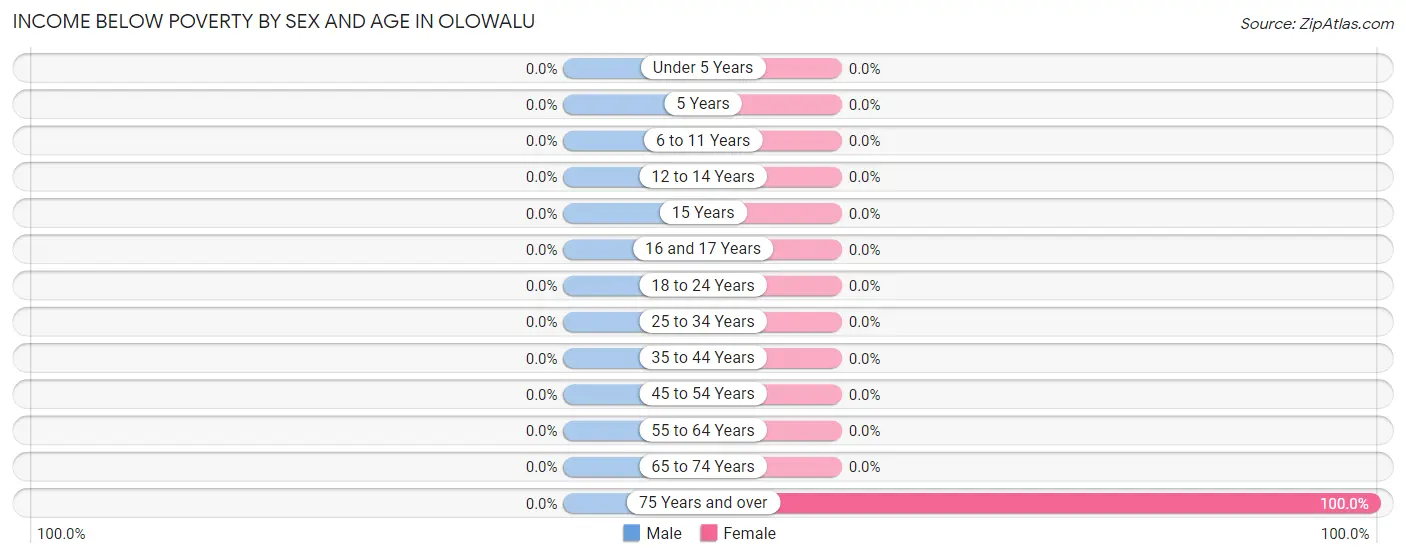
| Age Bracket | Male | Female |
| Under 5 Years | 0 (0.0%) | 0 (0.0%) |
| 5 Years | 0 (0.0%) | 0 (0.0%) |
| 6 to 11 Years | 0 (0.0%) | 0 (0.0%) |
| 12 to 14 Years | 0 (0.0%) | 0 (0.0%) |
| 15 Years | 0 (0.0%) | 0 (0.0%) |
| 16 and 17 Years | 0 (0.0%) | 0 (0.0%) |
| 18 to 24 Years | 0 (0.0%) | 0 (0.0%) |
| 25 to 34 Years | 0 (0.0%) | 0 (0.0%) |
| 35 to 44 Years | 0 (0.0%) | 0 (0.0%) |
| 45 to 54 Years | 0 (0.0%) | 0 (0.0%) |
| 55 to 64 Years | 0 (0.0%) | 0 (0.0%) |
| 65 to 74 Years | 0 (0.0%) | 0 (0.0%) |
| 75 Years and over | 0 (0.0%) | 3 (100.0%) |
| Total | 0 (0.0%) | 3 (7.1%) |
Income Above Poverty by Sex and Age in Olowalu
According to the poverty statistics in Olowalu, males aged 5 years and females aged under 5 years are the age groups that are most secure financially, with 100.0% of males and 100.0% of females in these age groups living above the poverty line.
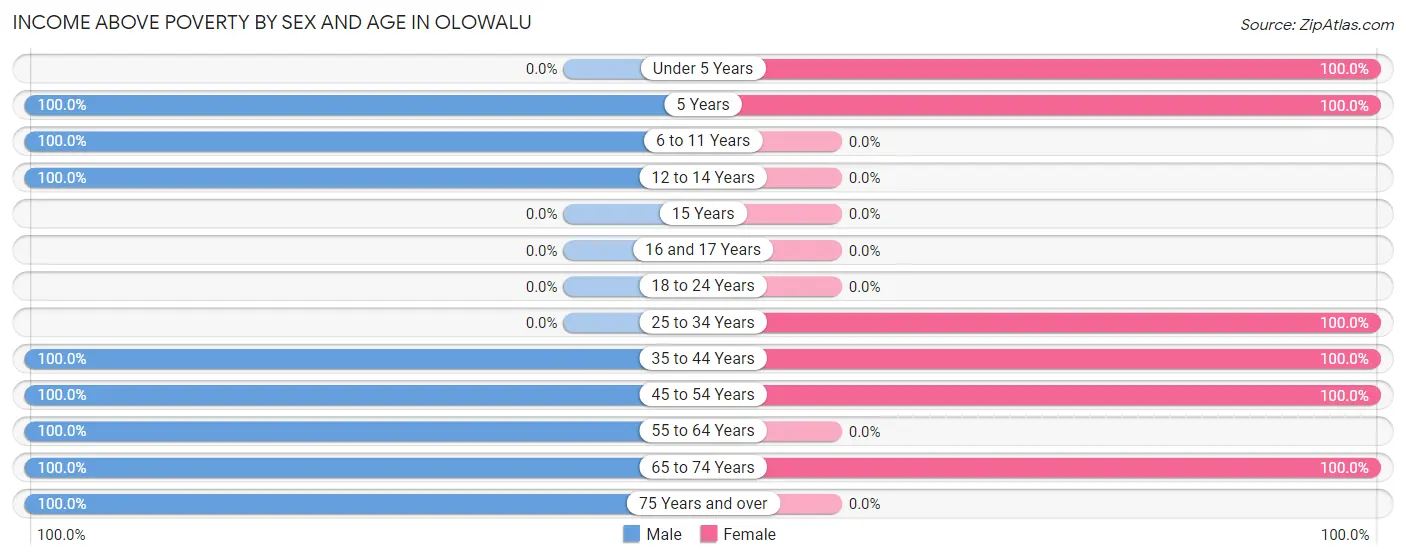
| Age Bracket | Male | Female |
| Under 5 Years | 0 (0.0%) | 5 (100.0%) |
| 5 Years | 2 (100.0%) | 5 (100.0%) |
| 6 to 11 Years | 4 (100.0%) | 0 (0.0%) |
| 12 to 14 Years | 4 (100.0%) | 0 (0.0%) |
| 15 Years | 0 (0.0%) | 0 (0.0%) |
| 16 and 17 Years | 0 (0.0%) | 0 (0.0%) |
| 18 to 24 Years | 0 (0.0%) | 0 (0.0%) |
| 25 to 34 Years | 0 (0.0%) | 4 (100.0%) |
| 35 to 44 Years | 10 (100.0%) | 14 (100.0%) |
| 45 to 54 Years | 14 (100.0%) | 5 (100.0%) |
| 55 to 64 Years | 4 (100.0%) | 0 (0.0%) |
| 65 to 74 Years | 1 (100.0%) | 6 (100.0%) |
| 75 Years and over | 2 (100.0%) | 0 (0.0%) |
| Total | 41 (100.0%) | 39 (92.9%) |
Income Below Poverty Among Married-Couple Families in Olowalu
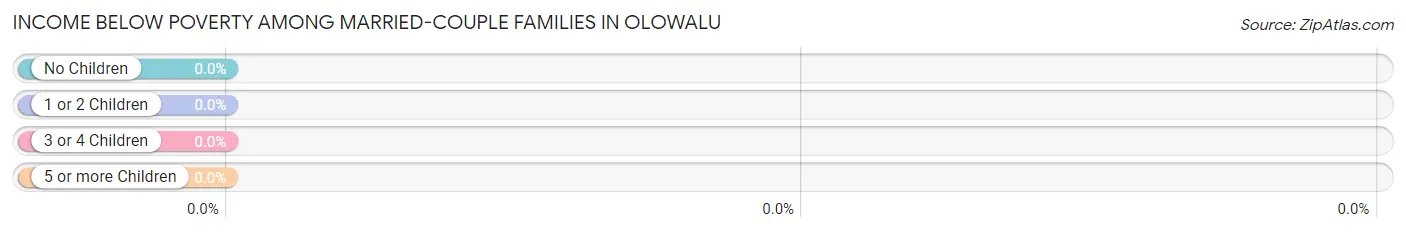
| Children | Above Poverty | Below Poverty |
| No Children | 6 (100.0%) | 0 (0.0%) |
| 1 or 2 Children | 13 (100.0%) | 0 (0.0%) |
| 3 or 4 Children | 0 (0.0%) | 0 (0.0%) |
| 5 or more Children | 0 (0.0%) | 0 (0.0%) |
| Total | 19 (100.0%) | 0 (0.0%) |
Income Below Poverty Among Single-Parent Households in Olowalu
| Children | Single Father | Single Mother |
| No Children | 0 (0.0%) | 0 (0.0%) |
| 1 or 2 Children | 0 (0.0%) | 0 (0.0%) |
| 3 or 4 Children | 0 (0.0%) | 0 (0.0%) |
| 5 or more Children | 0 (0.0%) | 0 (0.0%) |
| Total | 0 (0.0%) | 0 (0.0%) |
Income Below Poverty Among Married-Couple vs Single-Parent Households in Olowalu
| Children | Married-Couple Families | Single-Parent Households |
| No Children | 0 (0.0%) | 0 (0.0%) |
| 1 or 2 Children | 0 (0.0%) | 0 (0.0%) |
| 3 or 4 Children | 0 (0.0%) | 0 (0.0%) |
| 5 or more Children | 0 (0.0%) | 0 (0.0%) |
| Total | 0 (0.0%) | 0 (0.0%) |
Race in Olowalu
The most populous races in Olowalu are White / Caucasian (44 | 50.0%), Asian (16 | 18.2%), and Hispanic or Latino (15 | 17.1%).
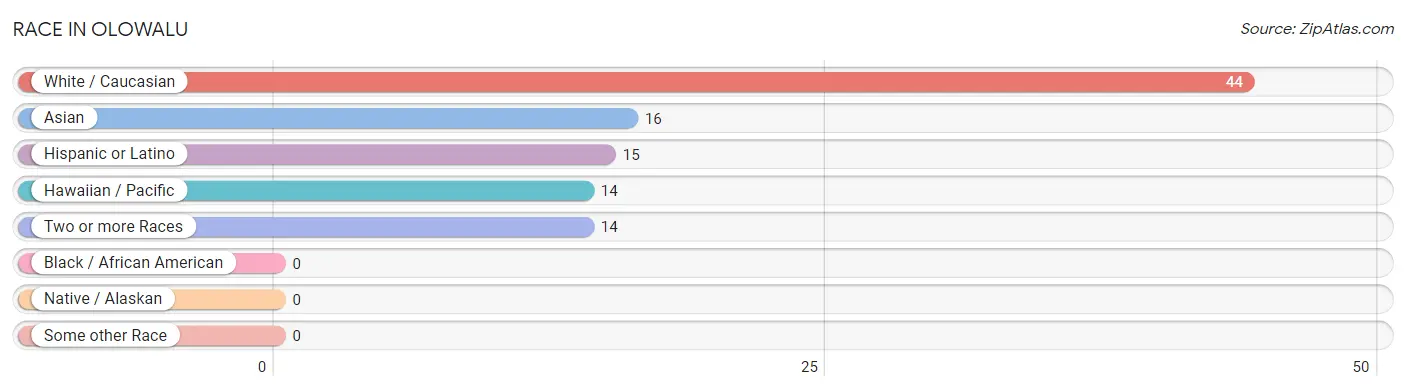
| Race | # Population | % Population |
| Asian | 16 | 18.2% |
| Black / African American | 0 | 0.0% |
| Hawaiian / Pacific | 14 | 15.9% |
| Hispanic or Latino | 15 | 17.1% |
| Native / Alaskan | 0 | 0.0% |
| White / Caucasian | 44 | 50.0% |
| Two or more Races | 14 | 15.9% |
| Some other Race | 0 | 0.0% |
| Total | 88 | 100.0% |
Ancestry in Olowalu
The most populous ancestries reported in Olowalu are English (18 | 20.4%), Sri Lankan (16 | 18.2%), Native Hawaiian (14 | 15.9%), Norwegian (12 | 13.6%), and Mexican (9 | 10.2%), together accounting for 78.4% of all Olowalu residents.
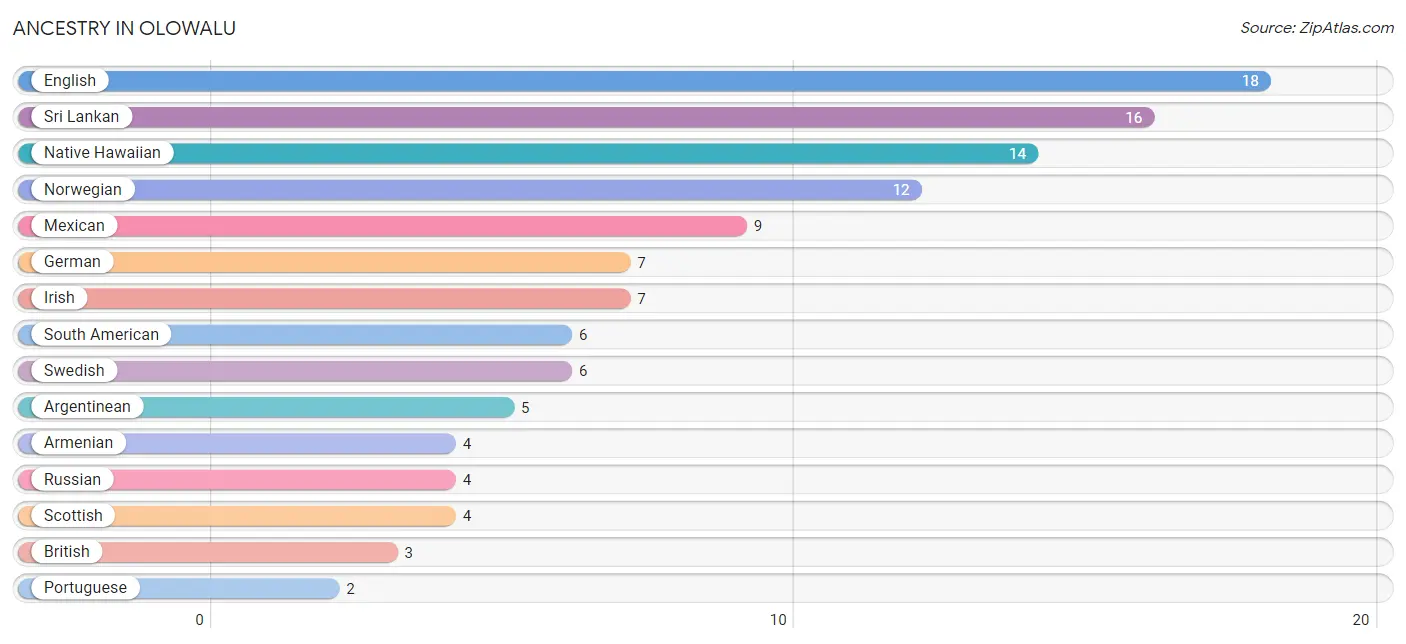
| Ancestry | # Population | % Population |
| Argentinean | 5 | 5.7% |
| Armenian | 4 | 4.5% |
| Bhutanese | 1 | 1.1% |
| British | 3 | 3.4% |
| Colombian | 1 | 1.1% |
| English | 18 | 20.4% |
| German | 7 | 8.0% |
| Indian (Asian) | 1 | 1.1% |
| Irish | 7 | 8.0% |
| Mexican | 9 | 10.2% |
| Native Hawaiian | 14 | 15.9% |
| Norwegian | 12 | 13.6% |
| Portuguese | 2 | 2.3% |
| Russian | 4 | 4.5% |
| Scotch-Irish | 2 | 2.3% |
| Scottish | 4 | 4.5% |
| South American | 6 | 6.8% |
| Sri Lankan | 16 | 18.2% |
| Swedish | 6 | 6.8% | View All 19 Rows |
Immigrants in Olowalu
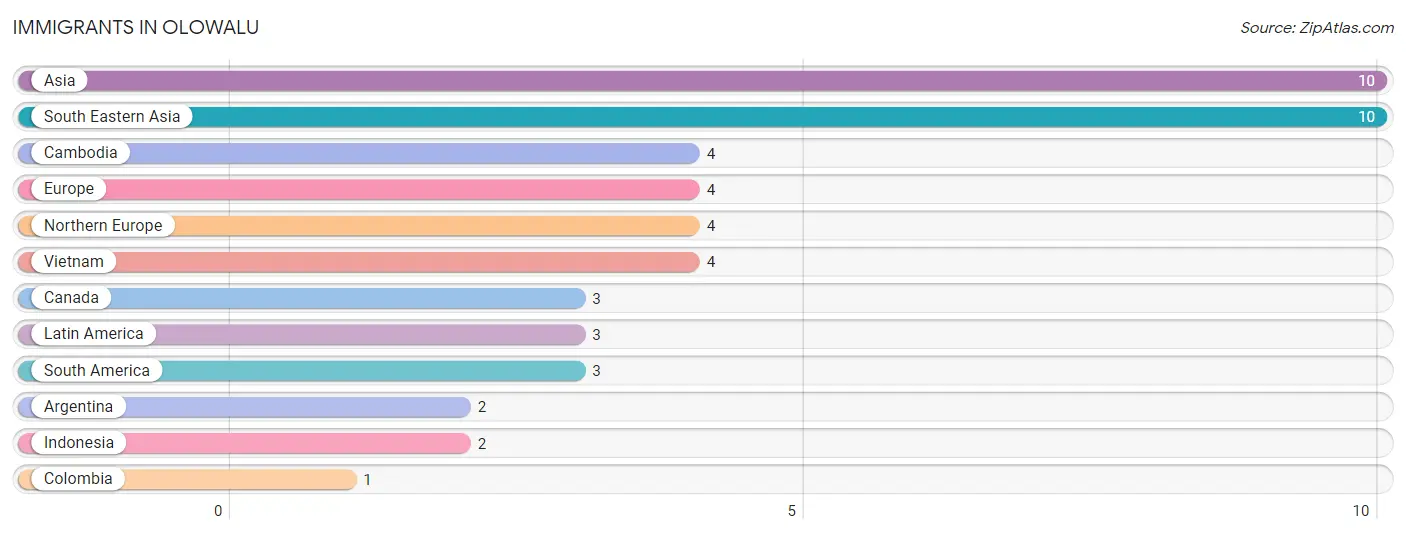
The most numerous immigrant groups reported in Olowalu came from Asia (10 | 11.4%), South Eastern Asia (10 | 11.4%), Cambodia (4 | 4.5%), Europe (4 | 4.5%), and Northern Europe (4 | 4.5%), together accounting for 36.4% of all Olowalu residents.
| Immigration Origin | # Population | % Population |
| Argentina | 2 | 2.3% |
| Asia | 10 | 11.4% |
| Cambodia | 4 | 4.5% |
| Canada | 3 | 3.4% |
| Colombia | 1 | 1.1% |
| Europe | 4 | 4.5% |
| Indonesia | 2 | 2.3% |
| Latin America | 3 | 3.4% |
| Northern Europe | 4 | 4.5% |
| South America | 3 | 3.4% |
| South Eastern Asia | 10 | 11.4% |
| Vietnam | 4 | 4.5% | View All 12 Rows |
Sex and Age in Olowalu
Sex and Age in Olowalu
The most populous age groups in Olowalu are 40 to 44 Years (10 | 24.4%) for men and 5 to 9 Years (10 | 21.3%) for women.
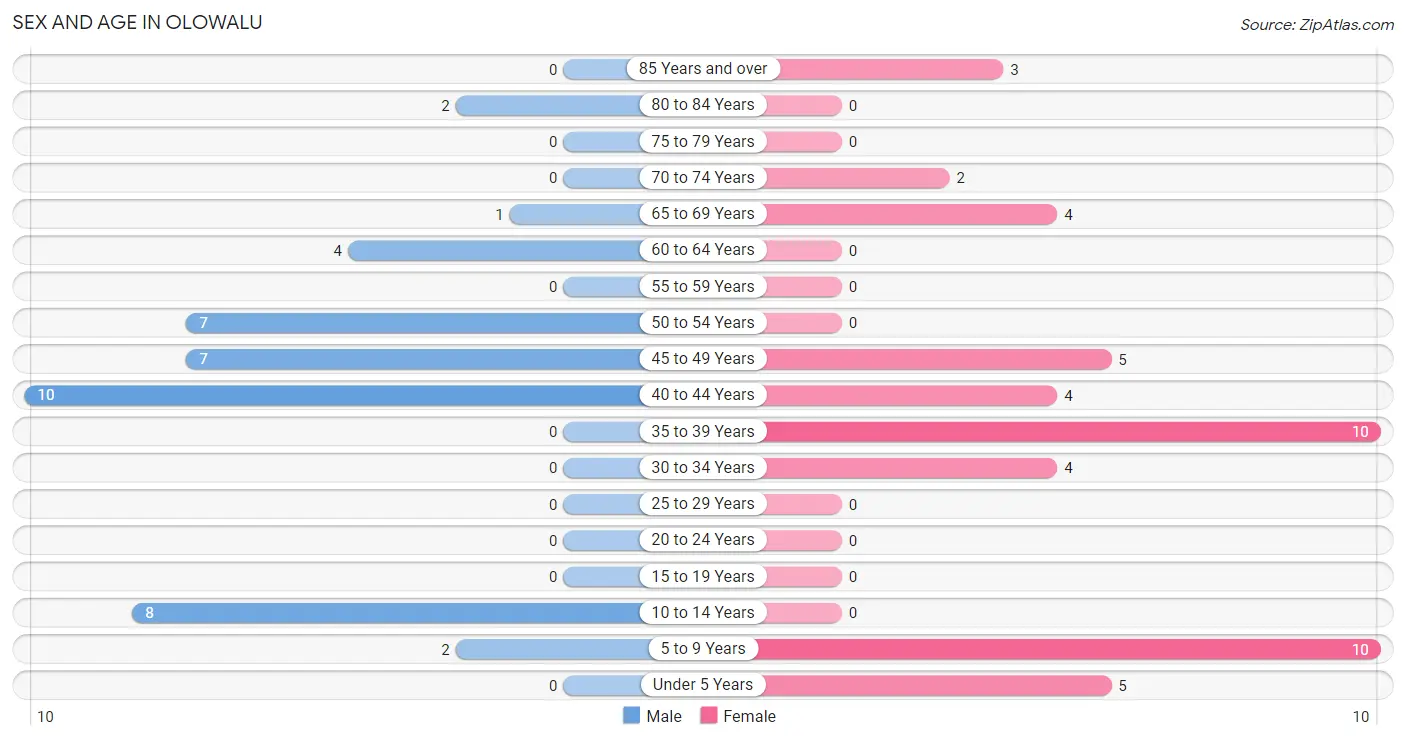
| Age Bracket | Male | Female |
| Under 5 Years | 0 (0.0%) | 5 (10.6%) |
| 5 to 9 Years | 2 (4.9%) | 10 (21.3%) |
| 10 to 14 Years | 8 (19.5%) | 0 (0.0%) |
| 15 to 19 Years | 0 (0.0%) | 0 (0.0%) |
| 20 to 24 Years | 0 (0.0%) | 0 (0.0%) |
| 25 to 29 Years | 0 (0.0%) | 0 (0.0%) |
| 30 to 34 Years | 0 (0.0%) | 4 (8.5%) |
| 35 to 39 Years | 0 (0.0%) | 10 (21.3%) |
| 40 to 44 Years | 10 (24.4%) | 4 (8.5%) |
| 45 to 49 Years | 7 (17.1%) | 5 (10.6%) |
| 50 to 54 Years | 7 (17.1%) | 0 (0.0%) |
| 55 to 59 Years | 0 (0.0%) | 0 (0.0%) |
| 60 to 64 Years | 4 (9.8%) | 0 (0.0%) |
| 65 to 69 Years | 1 (2.4%) | 4 (8.5%) |
| 70 to 74 Years | 0 (0.0%) | 2 (4.3%) |
| 75 to 79 Years | 0 (0.0%) | 0 (0.0%) |
| 80 to 84 Years | 2 (4.9%) | 0 (0.0%) |
| 85 Years and over | 0 (0.0%) | 3 (6.4%) |
| Total | 41 (100.0%) | 47 (100.0%) |
Families and Households in Olowalu
Median Family Size in Olowalu
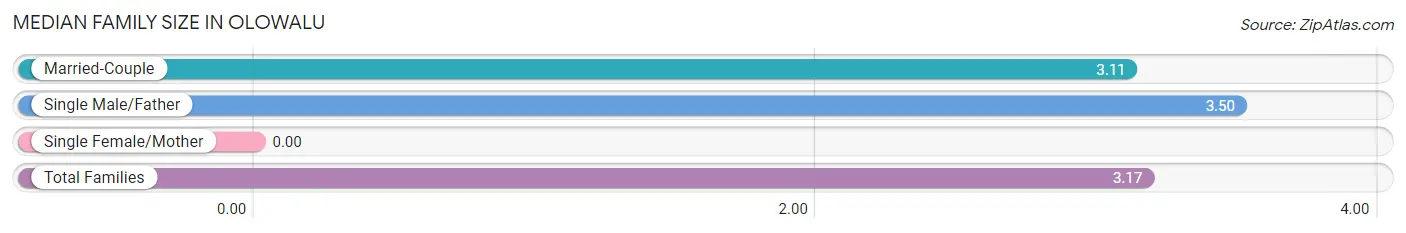
| Family Type | # Families | Family Size |
| Married-Couple | 19 (82.6%) | 3.11 |
| Single Male/Father | 4 (17.4%) | 3.50 |
| Single Female/Mother | 0 (0.0%) | - |
| Total Families | 23 (100.0%) | 3.17 |
Median Household Size in Olowalu
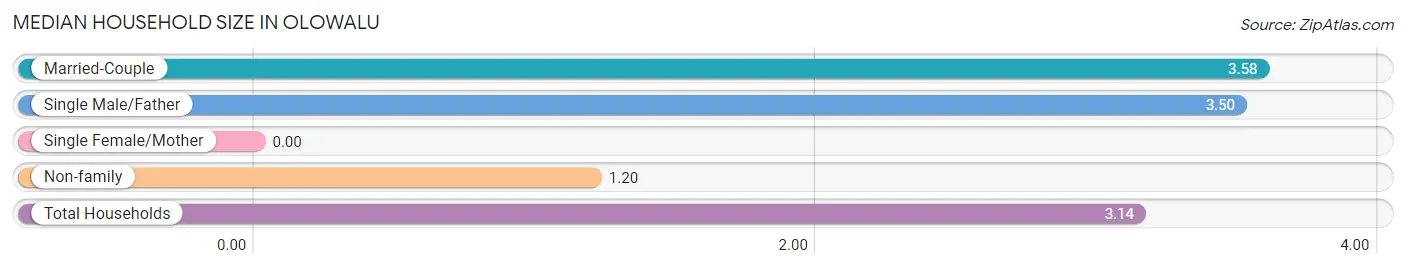
| Household Type | # Households | Household Size |
| Married-Couple | 19 (67.9%) | 3.58 |
| Single Male/Father | 4 (14.3%) | 3.50 |
| Single Female/Mother | 0 (0.0%) | - |
| Non-family | 5 (17.9%) | 1.20 |
| Total Households | 28 (100.0%) | 3.14 |
Household Size by Marriage Status in Olowalu
Out of a total of 28 households in Olowalu, 23 (82.1%) are family households, while 5 (17.9%) are nonfamily households. The most numerous type of family households are 3-person households, comprising 7, and the most common type of nonfamily households are 1-person households, comprising 4.
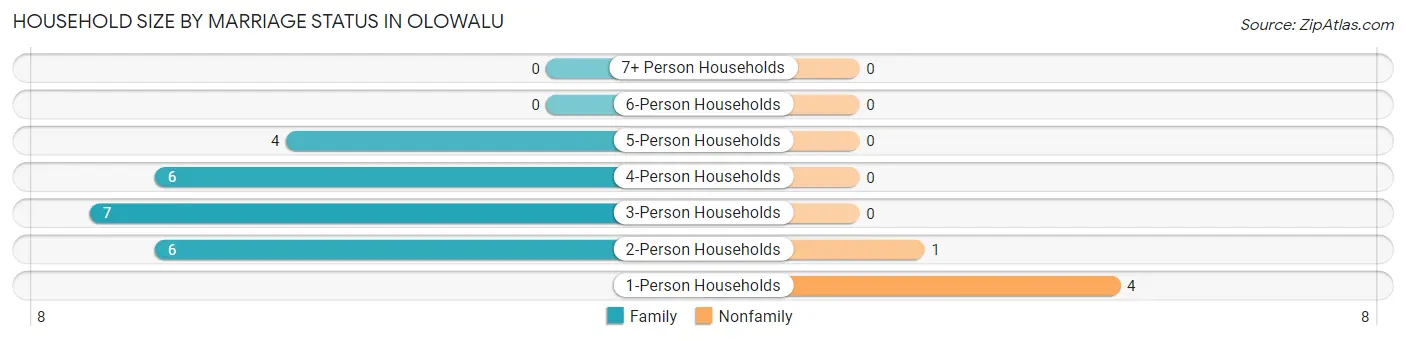
| Household Size | Family Households | Nonfamily Households |
| 1-Person Households | - | 4 (14.3%) |
| 2-Person Households | 6 (21.4%) | 1 (3.6%) |
| 3-Person Households | 7 (25.0%) | 0 (0.0%) |
| 4-Person Households | 6 (21.4%) | 0 (0.0%) |
| 5-Person Households | 4 (14.3%) | 0 (0.0%) |
| 6-Person Households | 0 (0.0%) | 0 (0.0%) |
| 7+ Person Households | 0 (0.0%) | 0 (0.0%) |
| Total | 23 (82.1%) | 5 (17.9%) |
Female Fertility in Olowalu
Fertility by Age in Olowalu
Average fertility rate in Olowalu is 87.0 births per 1,000 women. Women in the age bracket of 35 to 50 years have the highest fertility rate with 105.0 births per 1,000 women. Women in the age bracket of 35 to 50 years acount for 100.0% of all women with births.
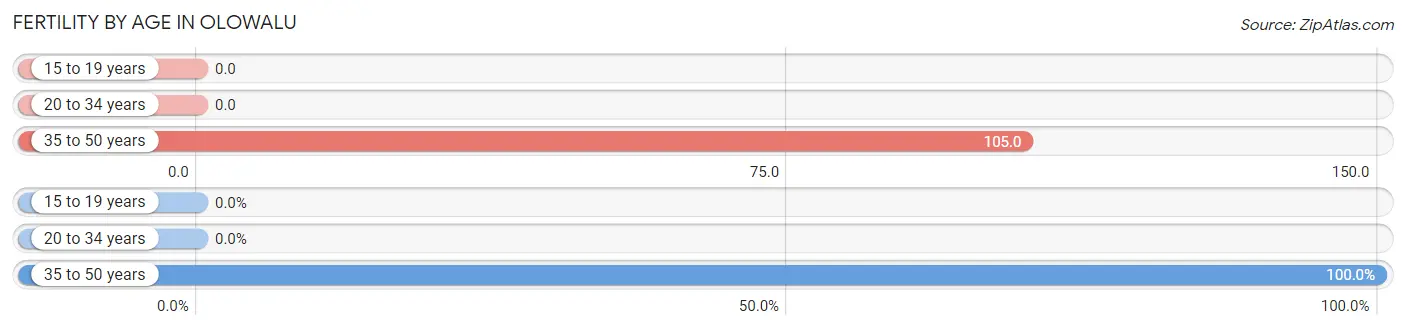
| Age Bracket | Women with Births | Births / 1,000 Women |
| 15 to 19 years | 0 (0.0%) | 0.0 |
| 20 to 34 years | 0 (0.0%) | 0.0 |
| 35 to 50 years | 2 (100.0%) | 105.0 |
| Total | 2 (100.0%) | 87.0 |
Fertility by Age by Marriage Status in Olowalu
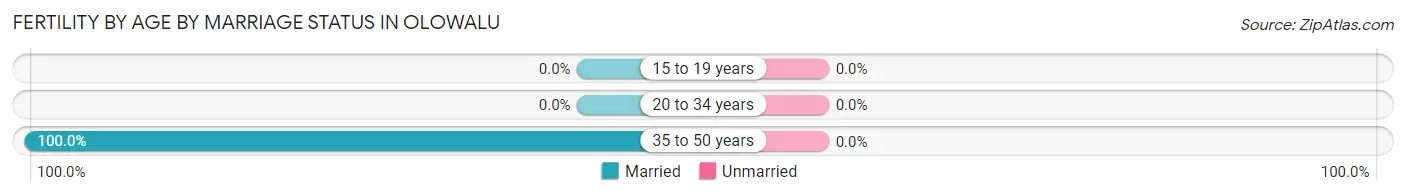
| Age Bracket | Married | Unmarried |
| 15 to 19 years | 0 (0.0%) | 0 (0.0%) |
| 20 to 34 years | 0 (0.0%) | 0 (0.0%) |
| 35 to 50 years | 2 (100.0%) | 0 (0.0%) |
| Total | 2 (100.0%) | 0 (0.0%) |
Fertility by Education in Olowalu
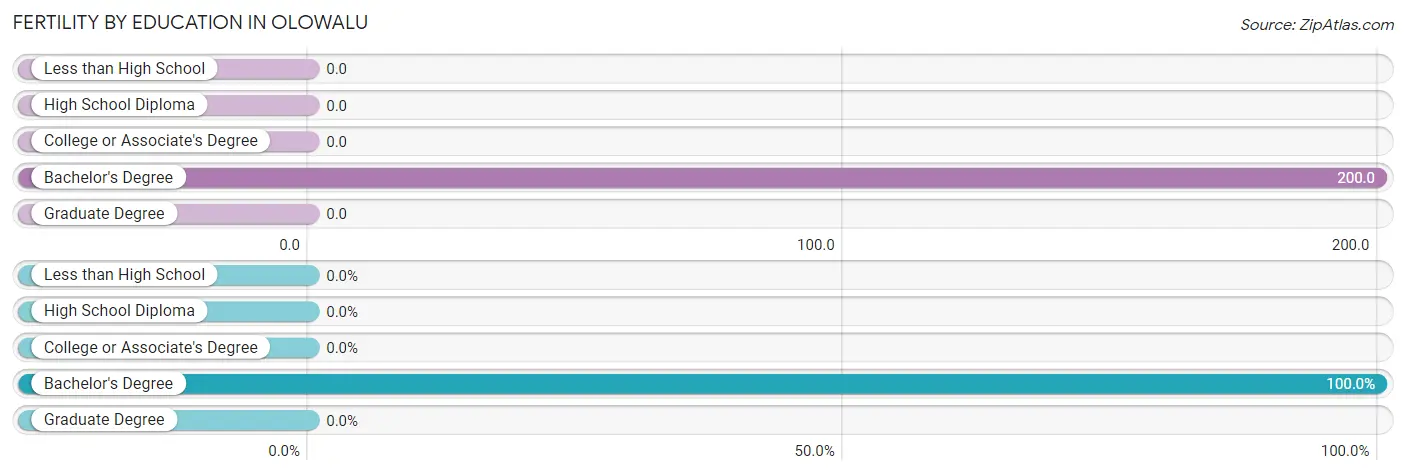
| Educational Attainment | Women with Births | Births / 1,000 Women |
| Less than High School | 0 (0.0%) | 0.0 |
| High School Diploma | 0 (0.0%) | 0.0 |
| College or Associate's Degree | 0 (0.0%) | 0.0 |
| Bachelor's Degree | 2 (100.0%) | 200.0 |
| Graduate Degree | 0 (0.0%) | 0.0 |
| Total | 2 (100.0%) | 87.0 |
Fertility by Education by Marriage Status in Olowalu
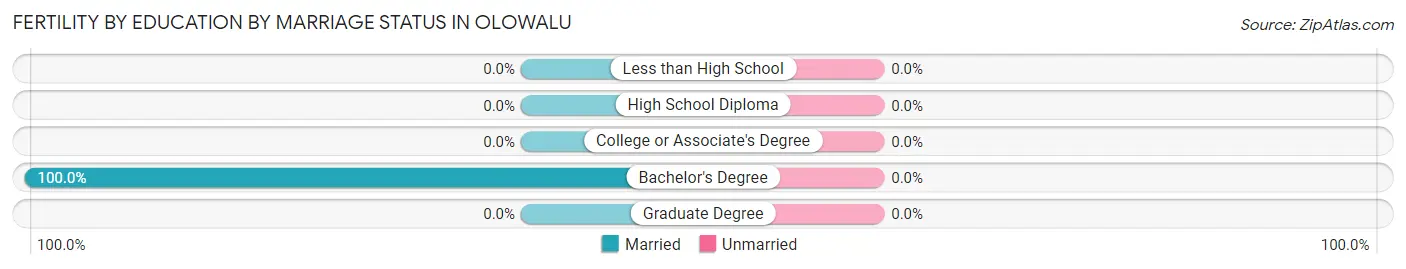
| Educational Attainment | Married | Unmarried |
| Less than High School | 0 (0.0%) | 0 (0.0%) |
| High School Diploma | 0 (0.0%) | 0 (0.0%) |
| College or Associate's Degree | 0 (0.0%) | 0 (0.0%) |
| Bachelor's Degree | 2 (100.0%) | 0 (0.0%) |
| Graduate Degree | 0 (0.0%) | 0 (0.0%) |
| Total | 2 (100.0%) | 0 (0.0%) |
Employment Characteristics in Olowalu
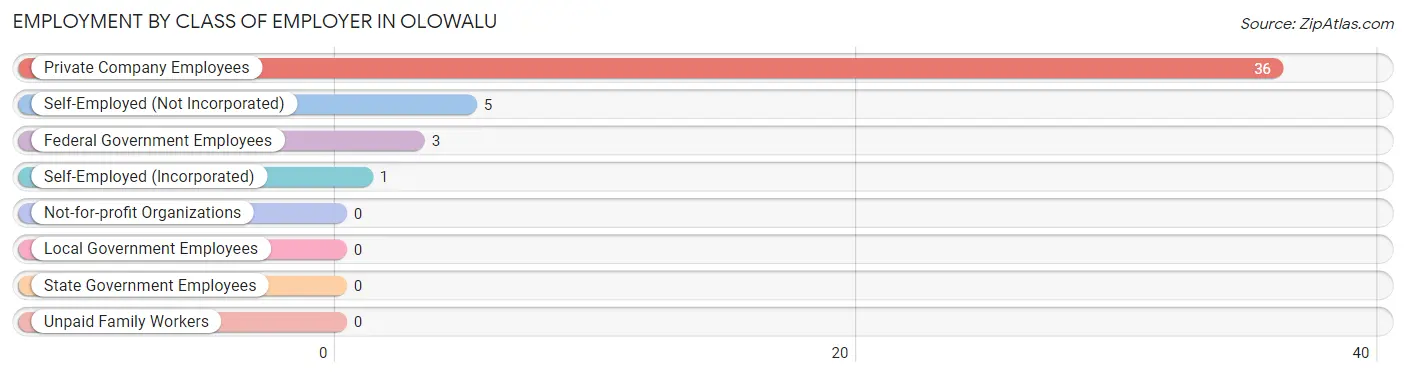
Employment by Class of Employer in Olowalu
Among the 45 employed individuals in Olowalu, private company employees (36 | 80.0%), self-employed (not incorporated) (5 | 11.1%), and federal government employees (3 | 6.7%) make up the most common classes of employment.
| Employer Class | # Employees | % Employees |
| Private Company Employees | 36 | 80.0% |
| Self-Employed (Incorporated) | 1 | 2.2% |
| Self-Employed (Not Incorporated) | 5 | 11.1% |
| Not-for-profit Organizations | 0 | 0.0% |
| Local Government Employees | 0 | 0.0% |
| State Government Employees | 0 | 0.0% |
| Federal Government Employees | 3 | 6.7% |
| Unpaid Family Workers | 0 | 0.0% |
| Total | 45 | 100.0% |
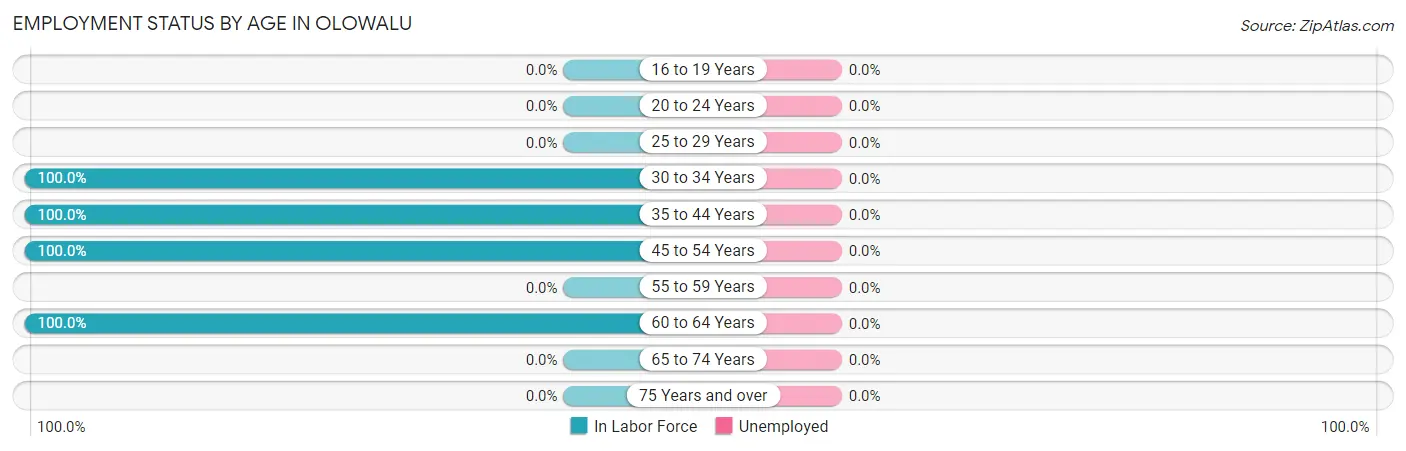
Employment Status by Age in Olowalu
| Age Bracket | In Labor Force | Unemployed |
| 16 to 19 Years | 0 (0.0%) | 0 (0.0%) |
| 20 to 24 Years | 0 (0.0%) | 0 (0.0%) |
| 25 to 29 Years | 0 (0.0%) | 0 (0.0%) |
| 30 to 34 Years | 4 (100.0%) | 0 (0.0%) |
| 35 to 44 Years | 24 (100.0%) | 0 (0.0%) |
| 45 to 54 Years | 19 (100.0%) | 0 (0.0%) |
| 55 to 59 Years | 0 (0.0%) | 0 (0.0%) |
| 60 to 64 Years | 4 (100.0%) | 0 (0.0%) |
| 65 to 74 Years | 0 (0.0%) | 0 (0.0%) |
| 75 Years and over | 0 (0.0%) | 0 (0.0%) |
| Total | 51 (81.0%) | 0 (0.0%) |
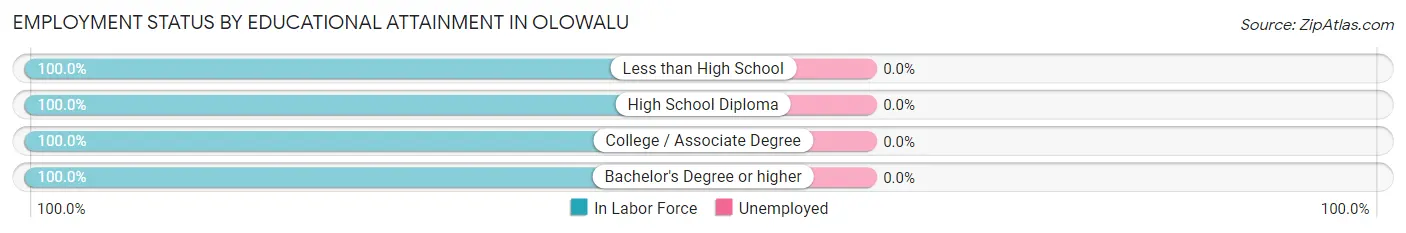
Employment Status by Educational Attainment in Olowalu
| Educational Attainment | In Labor Force | Unemployed |
| Less than High School | 4 (100.0%) | 0 (0.0%) |
| High School Diploma | 18 (100.0%) | 0 (0.0%) |
| College / Associate Degree | 15 (100.0%) | 0 (0.0%) |
| Bachelor's Degree or higher | 14 (100.0%) | 0 (0.0%) |
| Total | 51 (100.0%) | 0 (0.0%) |
Employment Occupations by Sex in Olowalu
Management, Business, Science and Arts Occupations
The most common Management, Business, Science and Arts occupations in Olowalu are Management (9 | 17.6%), Community & Social Service (6 | 11.8%), and Arts, Media & Entertainment (6 | 11.8%).
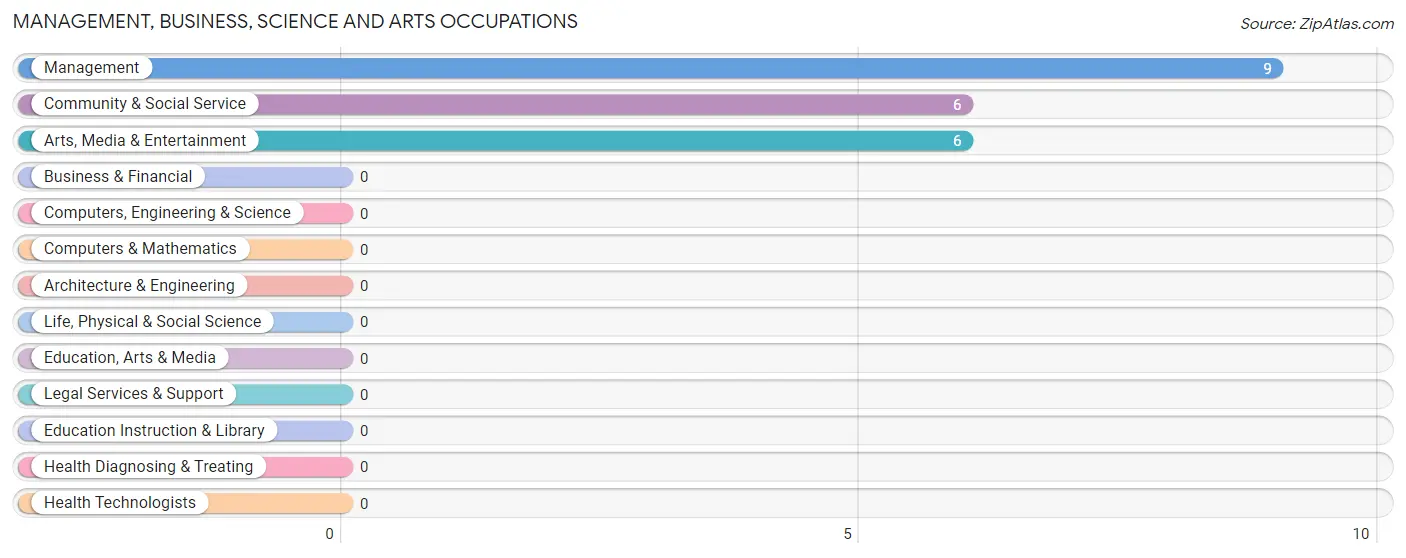
Management, Business, Science and Arts Occupations by Sex
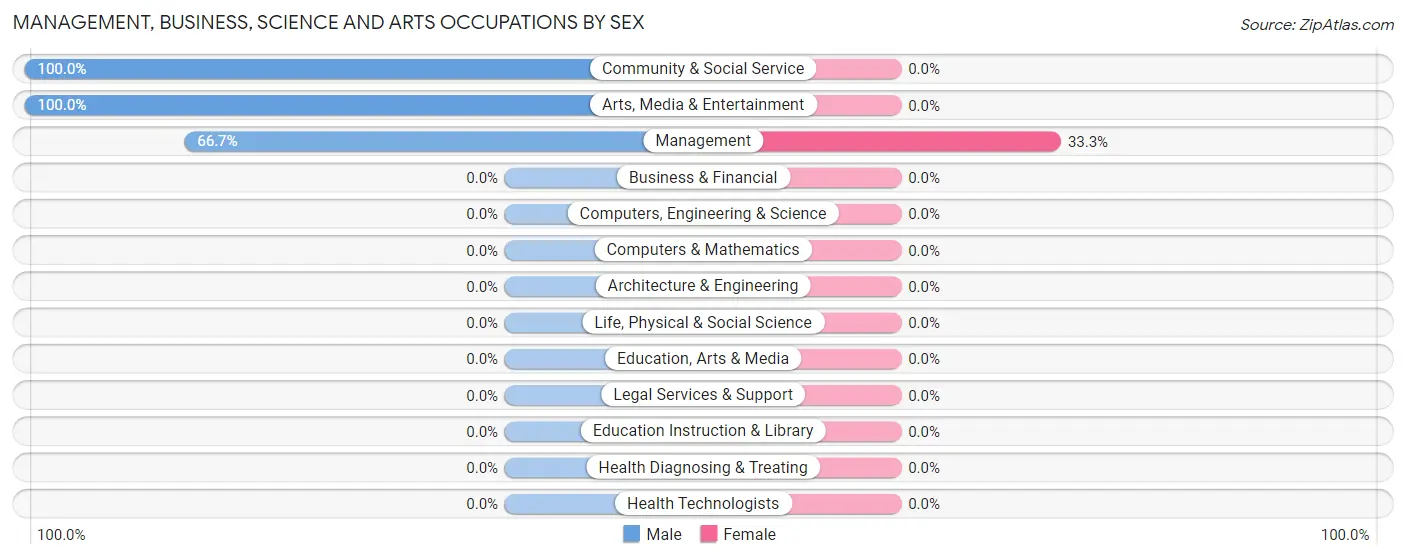
| Occupation | Male | Female |
| Management | 6 (66.7%) | 3 (33.3%) |
| Business & Financial | 0 (0.0%) | 0 (0.0%) |
| Computers, Engineering & Science | 0 (0.0%) | 0 (0.0%) |
| Computers & Mathematics | 0 (0.0%) | 0 (0.0%) |
| Architecture & Engineering | 0 (0.0%) | 0 (0.0%) |
| Life, Physical & Social Science | 0 (0.0%) | 0 (0.0%) |
| Community & Social Service | 6 (100.0%) | 0 (0.0%) |
| Education, Arts & Media | 0 (0.0%) | 0 (0.0%) |
| Legal Services & Support | 0 (0.0%) | 0 (0.0%) |
| Education Instruction & Library | 0 (0.0%) | 0 (0.0%) |
| Arts, Media & Entertainment | 6 (100.0%) | 0 (0.0%) |
| Health Diagnosing & Treating | 0 (0.0%) | 0 (0.0%) |
| Health Technologists | 0 (0.0%) | 0 (0.0%) |
| Total (Category) | 12 (80.0%) | 3 (20.0%) |
| Total (Overall) | 28 (54.9%) | 23 (45.1%) |
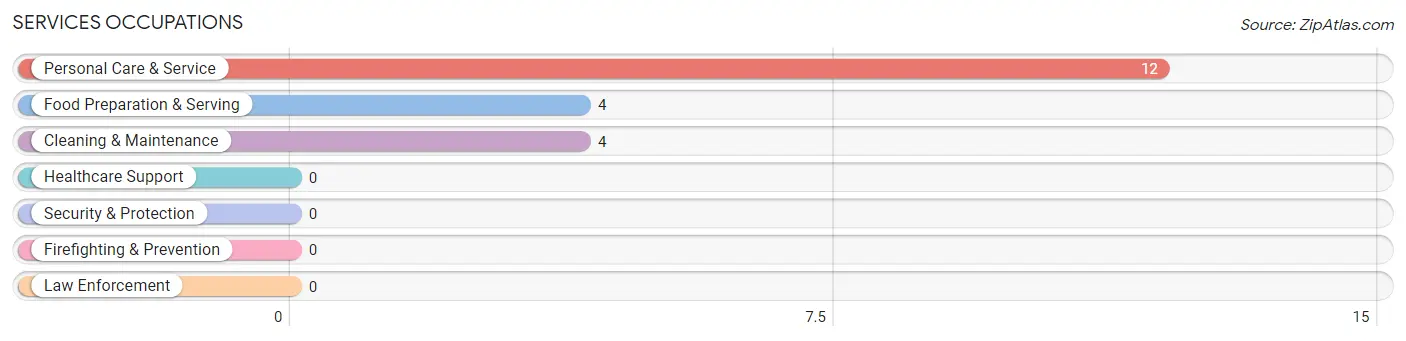
Services Occupations
The most common Services occupations in Olowalu are Personal Care & Service (12 | 23.5%), Food Preparation & Serving (4 | 7.8%), and Cleaning & Maintenance (4 | 7.8%).
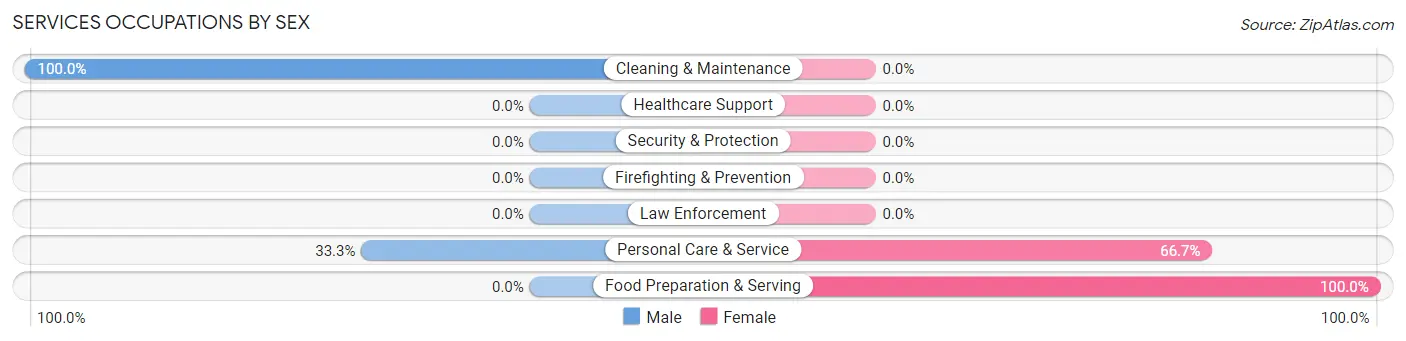
Services Occupations by Sex
Within the Services occupations in Olowalu, the most male-oriented occupations are Cleaning & Maintenance (100.0%), and Personal Care & Service (33.3%), while the most female-oriented occupations are Food Preparation & Serving (100.0%), and Personal Care & Service (66.7%).
| Occupation | Male | Female |
| Healthcare Support | 0 (0.0%) | 0 (0.0%) |
| Security & Protection | 0 (0.0%) | 0 (0.0%) |
| Firefighting & Prevention | 0 (0.0%) | 0 (0.0%) |
| Law Enforcement | 0 (0.0%) | 0 (0.0%) |
| Food Preparation & Serving | 0 (0.0%) | 4 (100.0%) |
| Cleaning & Maintenance | 4 (100.0%) | 0 (0.0%) |
| Personal Care & Service | 4 (33.3%) | 8 (66.7%) |
| Total (Category) | 8 (40.0%) | 12 (60.0%) |
| Total (Overall) | 28 (54.9%) | 23 (45.1%) |
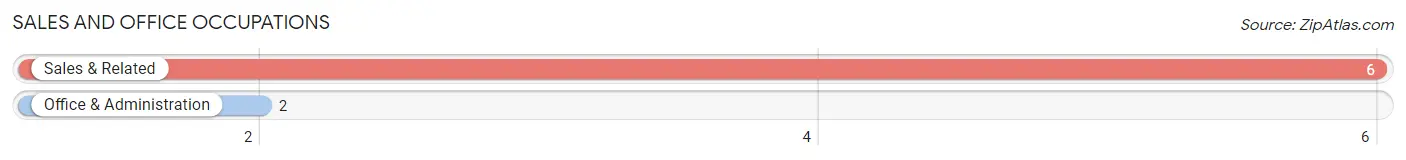
Sales and Office Occupations
The most common Sales and Office occupations in Olowalu are Sales & Related (6 | 11.8%), and Office & Administration (2 | 3.9%).
Sales and Office Occupations by Sex
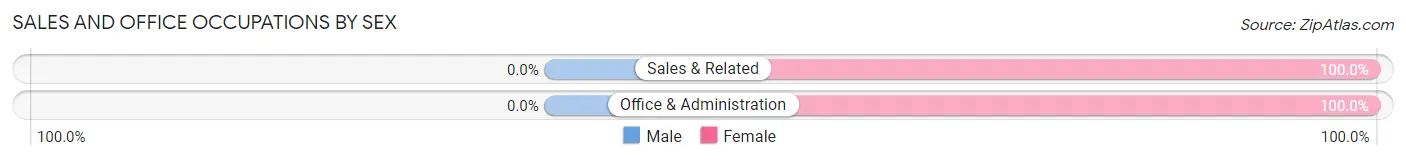
| Occupation | Male | Female |
| Sales & Related | 0 (0.0%) | 6 (100.0%) |
| Office & Administration | 0 (0.0%) | 2 (100.0%) |
| Total (Category) | 0 (0.0%) | 8 (100.0%) |
| Total (Overall) | 28 (54.9%) | 23 (45.1%) |
Natural Resources, Construction and Maintenance Occupations
Natural Resources, Construction and Maintenance Occupations by Sex
| Occupation | Male | Female |
| Farming, Fishing & Forestry | 0 (0.0%) | 0 (0.0%) |
| Construction & Extraction | 0 (0.0%) | 0 (0.0%) |
| Installation, Maintenance & Repair | 0 (0.0%) | 0 (0.0%) |
| Total (Category) | 0 (0.0%) | 0 (0.0%) |
| Total (Overall) | 28 (54.9%) | 23 (45.1%) |
Production, Transportation and Moving Occupations
The most common Production, Transportation and Moving occupations in Olowalu are , and Transportation (8 | 15.7%).
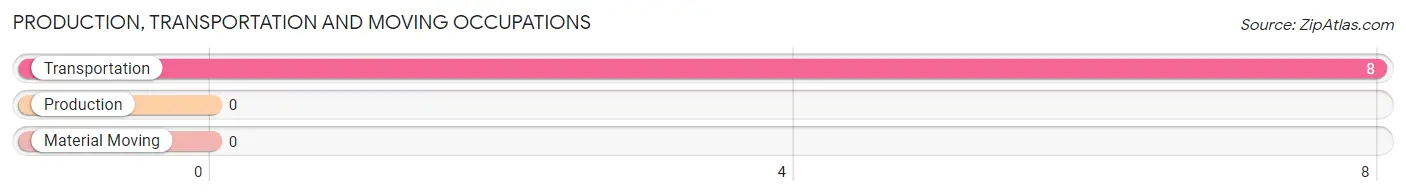
Production, Transportation and Moving Occupations by Sex
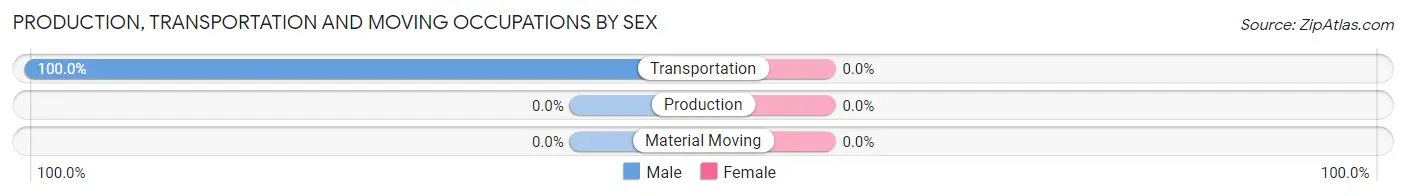
| Occupation | Male | Female |
| Production | 0 (0.0%) | 0 (0.0%) |
| Transportation | 8 (100.0%) | 0 (0.0%) |
| Material Moving | 0 (0.0%) | 0 (0.0%) |
| Total (Category) | 8 (100.0%) | 0 (0.0%) |
| Total (Overall) | 28 (54.9%) | 23 (45.1%) |
Employment Industries by Sex in Olowalu
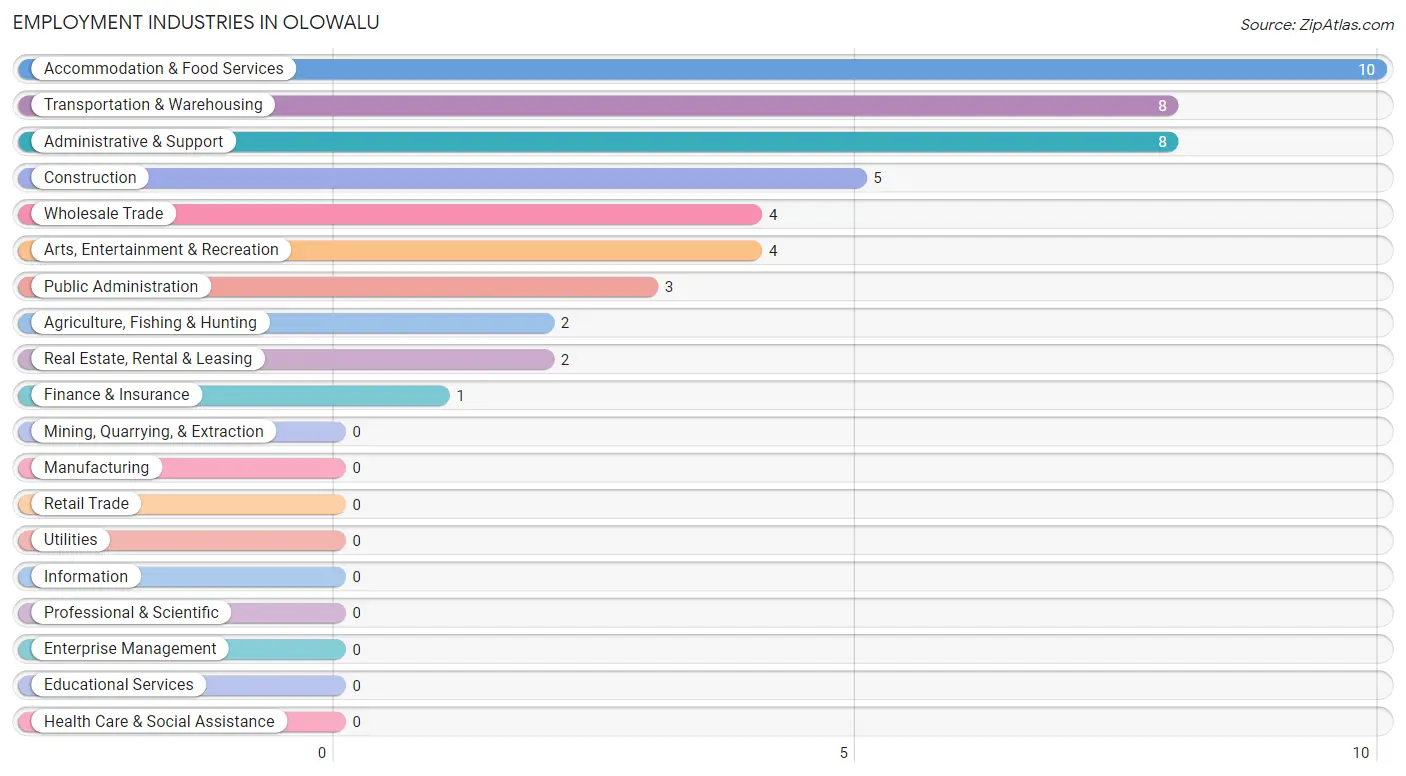
Employment Industries in Olowalu
The major employment industries in Olowalu include Accommodation & Food Services (10 | 19.6%), Transportation & Warehousing (8 | 15.7%), Administrative & Support (8 | 15.7%), Construction (5 | 9.8%), and Wholesale Trade (4 | 7.8%).
Employment Industries by Sex in Olowalu
The Olowalu industries that see more men than women are Agriculture, Fishing & Hunting (100.0%), Transportation & Warehousing (100.0%), and Finance & Insurance (100.0%), whereas the industries that tend to have a higher number of women are Wholesale Trade (100.0%), Real Estate, Rental & Leasing (100.0%), and Arts, Entertainment & Recreation (100.0%).
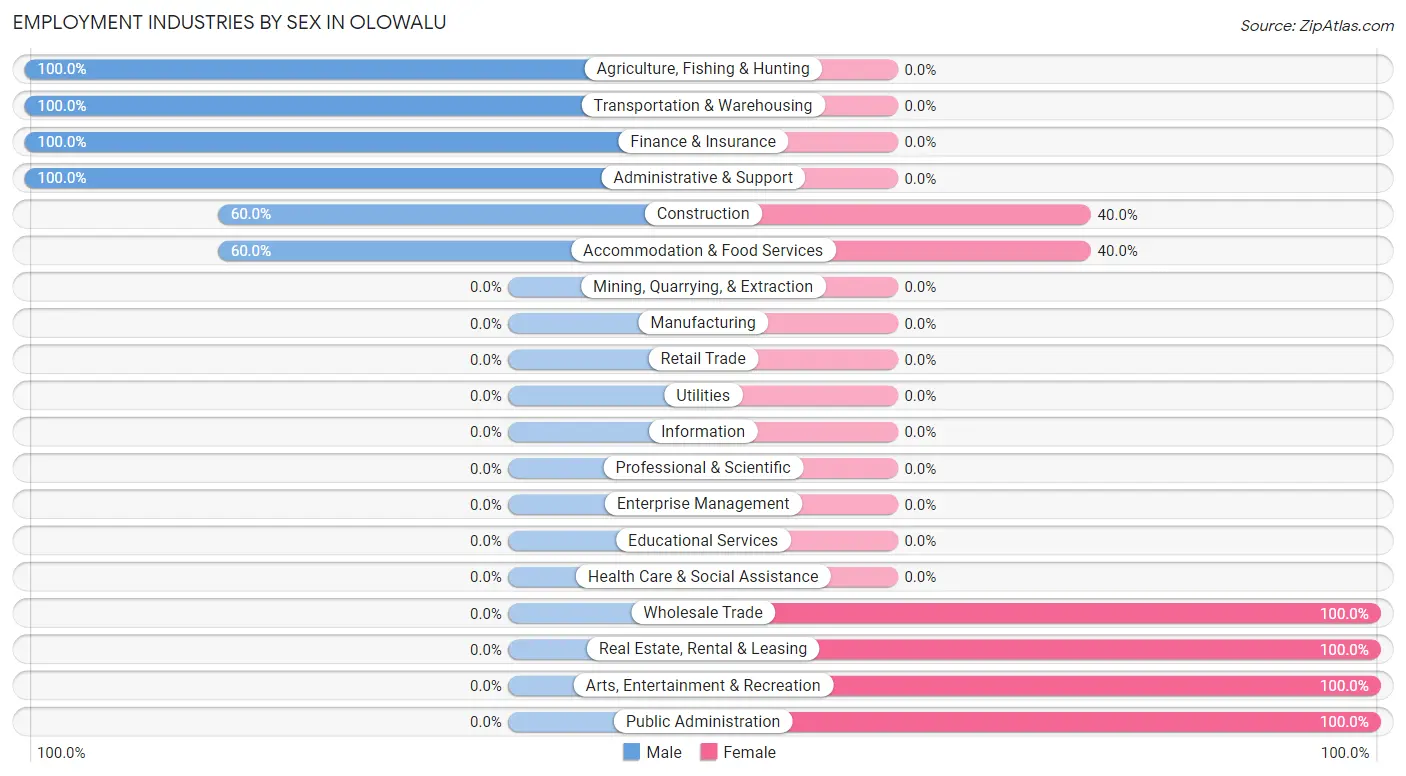
| Industry | Male | Female |
| Agriculture, Fishing & Hunting | 2 (100.0%) | 0 (0.0%) |
| Mining, Quarrying, & Extraction | 0 (0.0%) | 0 (0.0%) |
| Construction | 3 (60.0%) | 2 (40.0%) |
| Manufacturing | 0 (0.0%) | 0 (0.0%) |
| Wholesale Trade | 0 (0.0%) | 4 (100.0%) |
| Retail Trade | 0 (0.0%) | 0 (0.0%) |
| Transportation & Warehousing | 8 (100.0%) | 0 (0.0%) |
| Utilities | 0 (0.0%) | 0 (0.0%) |
| Information | 0 (0.0%) | 0 (0.0%) |
| Finance & Insurance | 1 (100.0%) | 0 (0.0%) |
| Real Estate, Rental & Leasing | 0 (0.0%) | 2 (100.0%) |
| Professional & Scientific | 0 (0.0%) | 0 (0.0%) |
| Enterprise Management | 0 (0.0%) | 0 (0.0%) |
| Administrative & Support | 8 (100.0%) | 0 (0.0%) |
| Educational Services | 0 (0.0%) | 0 (0.0%) |
| Health Care & Social Assistance | 0 (0.0%) | 0 (0.0%) |
| Arts, Entertainment & Recreation | 0 (0.0%) | 4 (100.0%) |
| Accommodation & Food Services | 6 (60.0%) | 4 (40.0%) |
| Public Administration | 0 (0.0%) | 3 (100.0%) |
| Total | 28 (54.9%) | 23 (45.1%) |
Education in Olowalu
School Enrollment in Olowalu
The most common levels of schooling among the 21 students in Olowalu are middle school (8 | 38.1%), kindergarten (7 | 33.3%), and nursery / preschool (6 | 28.6%).
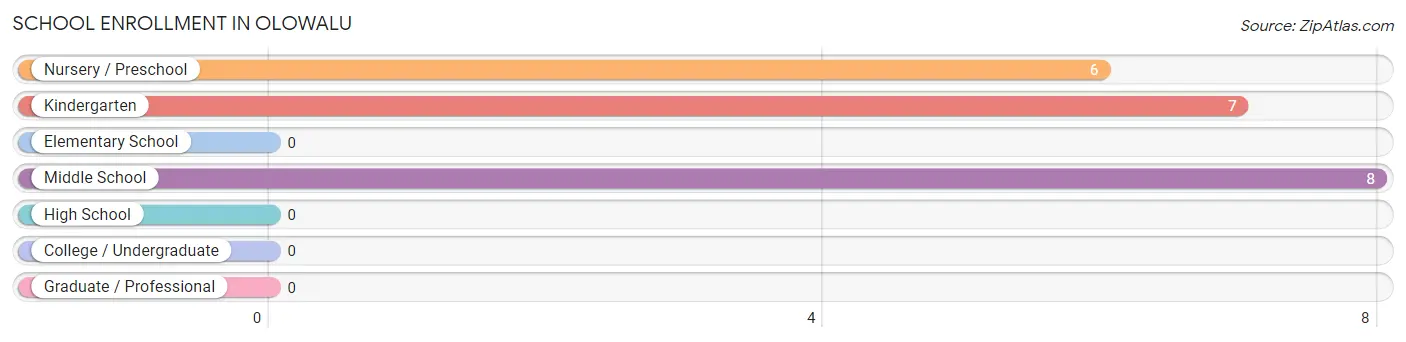
| School Level | # Students | % Students |
| Nursery / Preschool | 6 | 28.6% |
| Kindergarten | 7 | 33.3% |
| Elementary School | 0 | 0.0% |
| Middle School | 8 | 38.1% |
| High School | 0 | 0.0% |
| College / Undergraduate | 0 | 0.0% |
| Graduate / Professional | 0 | 0.0% |
| Total | 21 | 100.0% |
School Enrollment by Age by Funding Source in Olowalu
Out of a total of 21 students who are enrolled in schools in Olowalu, 6 (28.6%) attend a private institution, while the remaining 15 (71.4%) are enrolled in public schools. The age group of 3 to 4 year olds has the highest likelihood of being enrolled in private schools, with 1 (100.0% in the age bracket) enrolled. Conversely, the age group of 10 to 14 year olds has the lowest likelihood of being enrolled in a private school, with 8 (100.0% in the age bracket) attending a public institution.
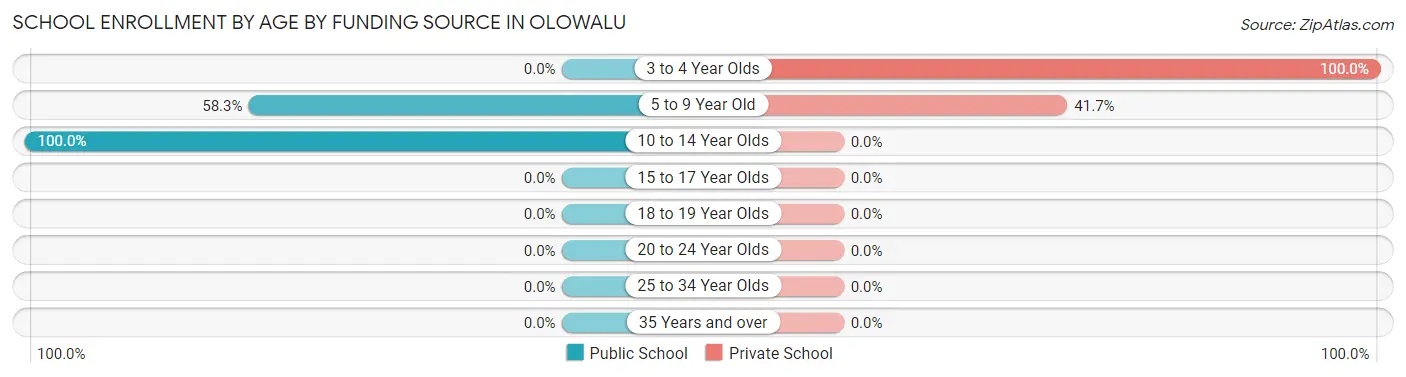
| Age Bracket | Public School | Private School |
| 3 to 4 Year Olds | 0 (0.0%) | 1 (100.0%) |
| 5 to 9 Year Old | 7 (58.3%) | 5 (41.7%) |
| 10 to 14 Year Olds | 8 (100.0%) | 0 (0.0%) |
| 15 to 17 Year Olds | 0 (0.0%) | 0 (0.0%) |
| 18 to 19 Year Olds | 0 (0.0%) | 0 (0.0%) |
| 20 to 24 Year Olds | 0 (0.0%) | 0 (0.0%) |
| 25 to 34 Year Olds | 0 (0.0%) | 0 (0.0%) |
| 35 Years and over | 0 (0.0%) | 0 (0.0%) |
| Total | 15 (71.4%) | 6 (28.6%) |
Educational Attainment by Field of Study in Olowalu
Psychology (4 | 22.2%), visual & performing arts (4 | 22.2%), bio, nature & agricultural (3 | 16.7%), social sciences (3 | 16.7%), and engineering (3 | 16.7%) are the most common fields of study among 18 individuals in Olowalu who have obtained a bachelor's degree or higher.
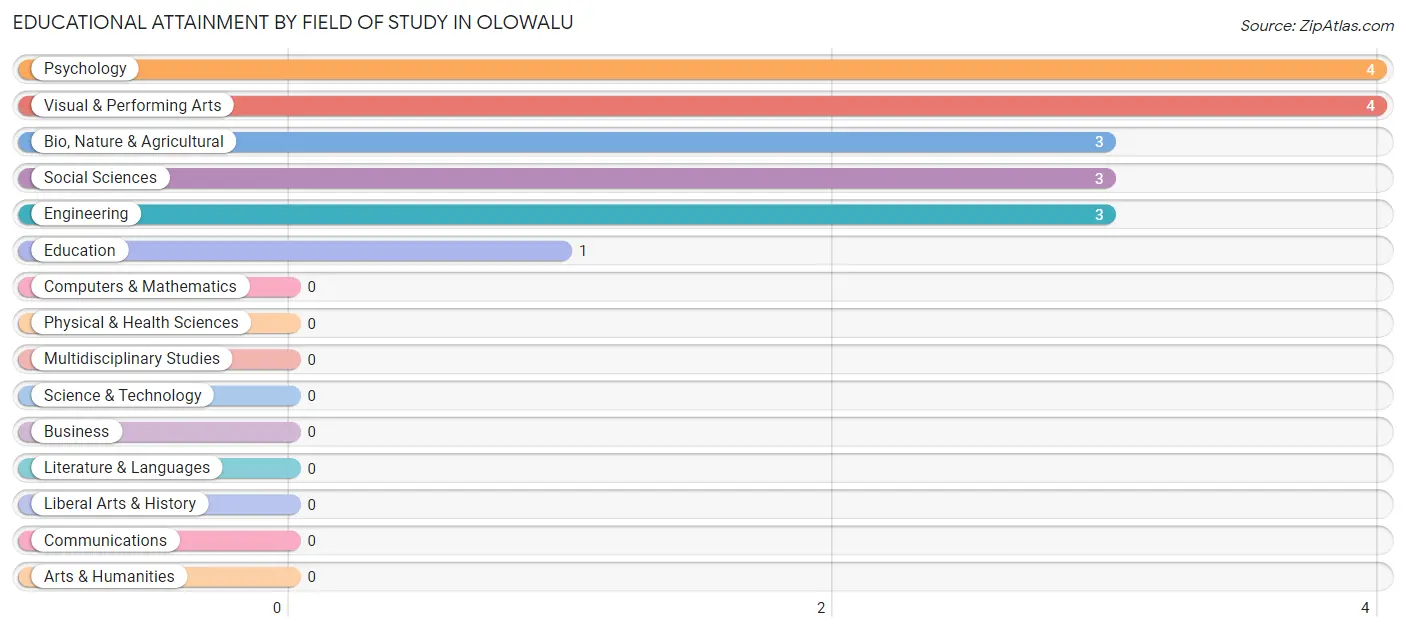
| Field of Study | # Graduates | % Graduates |
| Computers & Mathematics | 0 | 0.0% |
| Bio, Nature & Agricultural | 3 | 16.7% |
| Physical & Health Sciences | 0 | 0.0% |
| Psychology | 4 | 22.2% |
| Social Sciences | 3 | 16.7% |
| Engineering | 3 | 16.7% |
| Multidisciplinary Studies | 0 | 0.0% |
| Science & Technology | 0 | 0.0% |
| Business | 0 | 0.0% |
| Education | 1 | 5.6% |
| Literature & Languages | 0 | 0.0% |
| Liberal Arts & History | 0 | 0.0% |
| Visual & Performing Arts | 4 | 22.2% |
| Communications | 0 | 0.0% |
| Arts & Humanities | 0 | 0.0% |
| Total | 18 | 100.0% |
Transportation & Commute in Olowalu
Vehicle Availability by Sex in Olowalu
The most prevalent vehicle ownership categories in Olowalu are males with 2 vehicles (15, accounting for 62.5%) and females with 2 vehicles (10, making up 71.4%).
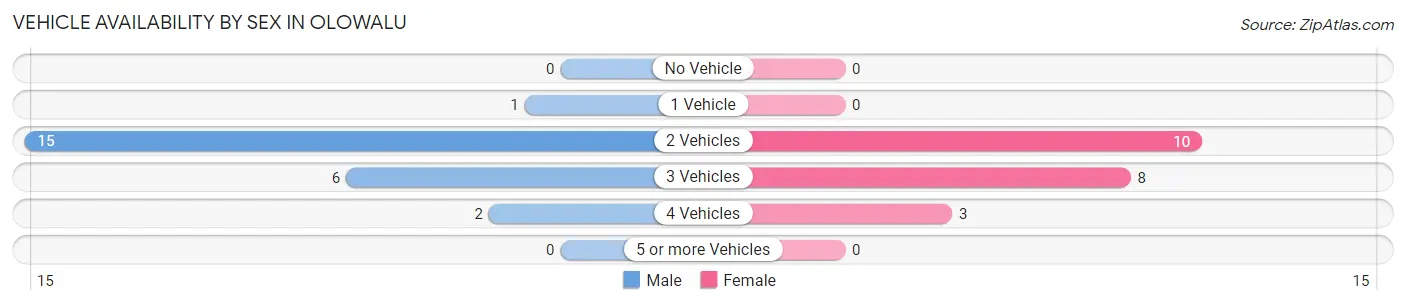
| Vehicles Available | Male | Female |
| No Vehicle | 0 (0.0%) | 0 (0.0%) |
| 1 Vehicle | 1 (4.2%) | 0 (0.0%) |
| 2 Vehicles | 15 (62.5%) | 10 (47.6%) |
| 3 Vehicles | 6 (25.0%) | 8 (38.1%) |
| 4 Vehicles | 2 (8.3%) | 3 (14.3%) |
| 5 or more Vehicles | 0 (0.0%) | 0 (0.0%) |
| Total | 24 (100.0%) | 21 (100.0%) |
Commute Time in Olowalu
The most frequently occuring commute durations in Olowalu are 30 to 34 minutes (17 commuters, 40.5%), 10 to 14 minutes (8 commuters, 19.1%), and 5 to 9 minutes (7 commuters, 16.7%).
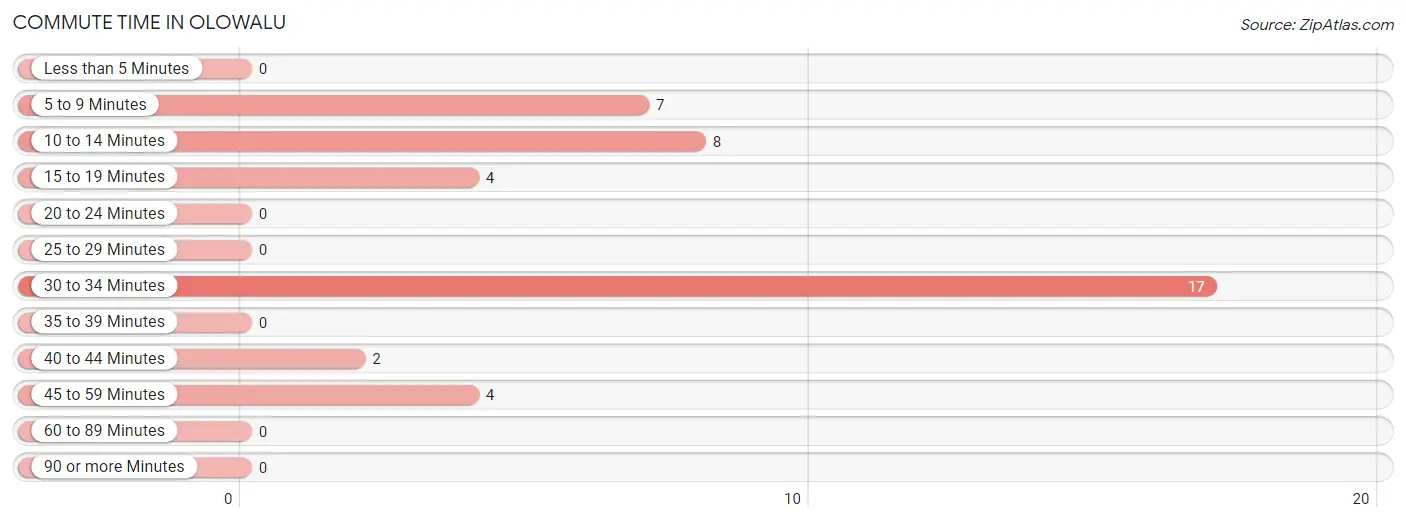
| Commute Time | # Commuters | % Commuters |
| Less than 5 Minutes | 0 | 0.0% |
| 5 to 9 Minutes | 7 | 16.7% |
| 10 to 14 Minutes | 8 | 19.1% |
| 15 to 19 Minutes | 4 | 9.5% |
| 20 to 24 Minutes | 0 | 0.0% |
| 25 to 29 Minutes | 0 | 0.0% |
| 30 to 34 Minutes | 17 | 40.5% |
| 35 to 39 Minutes | 0 | 0.0% |
| 40 to 44 Minutes | 2 | 4.8% |
| 45 to 59 Minutes | 4 | 9.5% |
| 60 to 89 Minutes | 0 | 0.0% |
| 90 or more Minutes | 0 | 0.0% |
Commute Time by Sex in Olowalu
The most common commute times in Olowalu are 30 to 34 minutes (9 commuters, 39.1%) for males and 30 to 34 minutes (8 commuters, 42.1%) for females.
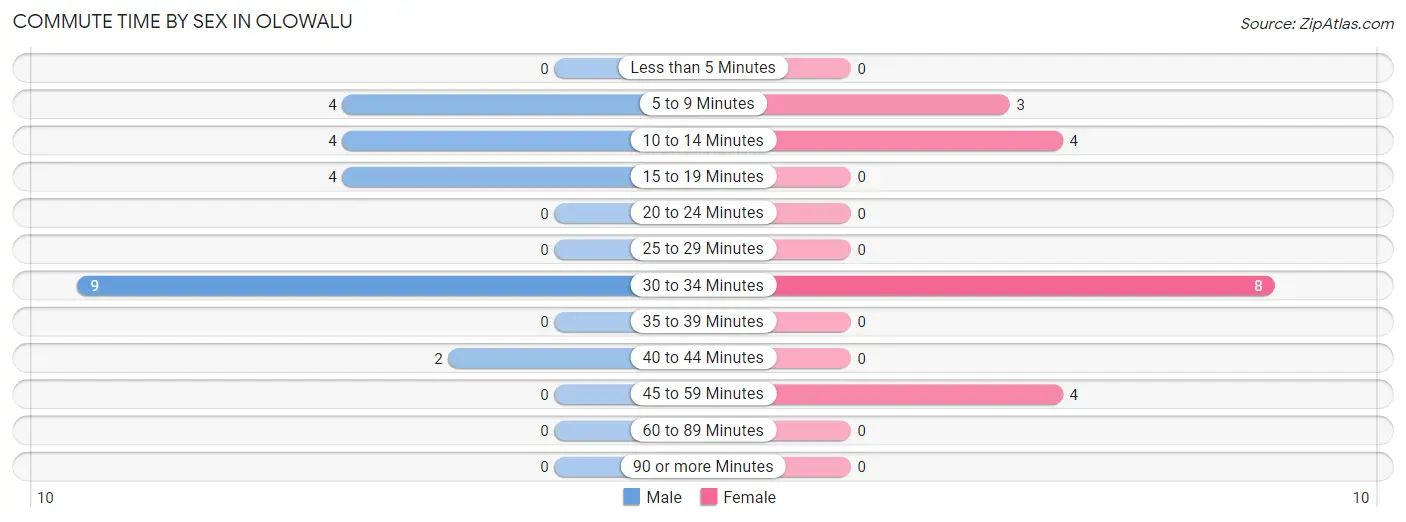
| Commute Time | Male | Female |
| Less than 5 Minutes | 0 (0.0%) | 0 (0.0%) |
| 5 to 9 Minutes | 4 (17.4%) | 3 (15.8%) |
| 10 to 14 Minutes | 4 (17.4%) | 4 (21.0%) |
| 15 to 19 Minutes | 4 (17.4%) | 0 (0.0%) |
| 20 to 24 Minutes | 0 (0.0%) | 0 (0.0%) |
| 25 to 29 Minutes | 0 (0.0%) | 0 (0.0%) |
| 30 to 34 Minutes | 9 (39.1%) | 8 (42.1%) |
| 35 to 39 Minutes | 0 (0.0%) | 0 (0.0%) |
| 40 to 44 Minutes | 2 (8.7%) | 0 (0.0%) |
| 45 to 59 Minutes | 0 (0.0%) | 4 (21.0%) |
| 60 to 89 Minutes | 0 (0.0%) | 0 (0.0%) |
| 90 or more Minutes | 0 (0.0%) | 0 (0.0%) |
Time of Departure to Work by Sex in Olowalu
The most frequent times of departure to work in Olowalu are 7:00 AM to 7:29 AM (8, 34.8%) for males and 7:00 AM to 7:29 AM (15, 78.9%) for females.
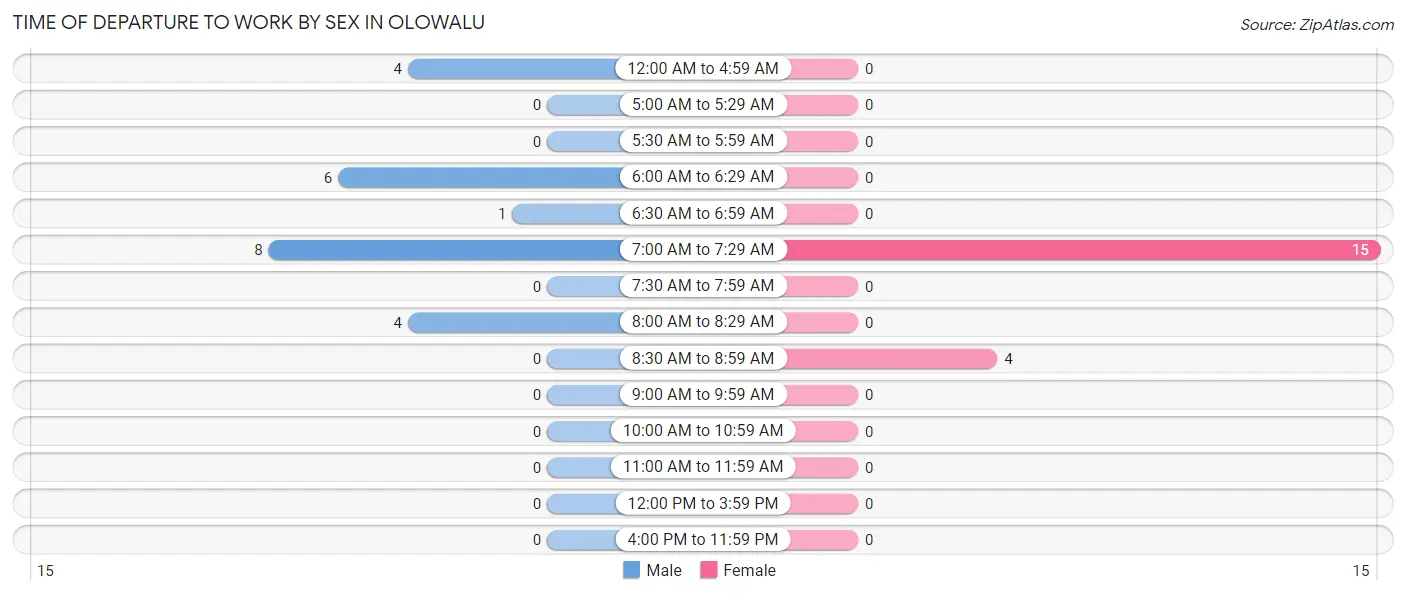
| Time of Departure | Male | Female |
| 12:00 AM to 4:59 AM | 4 (17.4%) | 0 (0.0%) |
| 5:00 AM to 5:29 AM | 0 (0.0%) | 0 (0.0%) |
| 5:30 AM to 5:59 AM | 0 (0.0%) | 0 (0.0%) |
| 6:00 AM to 6:29 AM | 6 (26.1%) | 0 (0.0%) |
| 6:30 AM to 6:59 AM | 1 (4.3%) | 0 (0.0%) |
| 7:00 AM to 7:29 AM | 8 (34.8%) | 15 (78.9%) |
| 7:30 AM to 7:59 AM | 0 (0.0%) | 0 (0.0%) |
| 8:00 AM to 8:29 AM | 4 (17.4%) | 0 (0.0%) |
| 8:30 AM to 8:59 AM | 0 (0.0%) | 4 (21.0%) |
| 9:00 AM to 9:59 AM | 0 (0.0%) | 0 (0.0%) |
| 10:00 AM to 10:59 AM | 0 (0.0%) | 0 (0.0%) |
| 11:00 AM to 11:59 AM | 0 (0.0%) | 0 (0.0%) |
| 12:00 PM to 3:59 PM | 0 (0.0%) | 0 (0.0%) |
| 4:00 PM to 11:59 PM | 0 (0.0%) | 0 (0.0%) |
| Total | 23 (100.0%) | 19 (100.0%) |
Housing Occupancy in Olowalu
Occupancy by Ownership in Olowalu
Of the total 28 dwellings in Olowalu, owner-occupied units account for 13 (46.4%), while renter-occupied units make up 15 (53.6%).
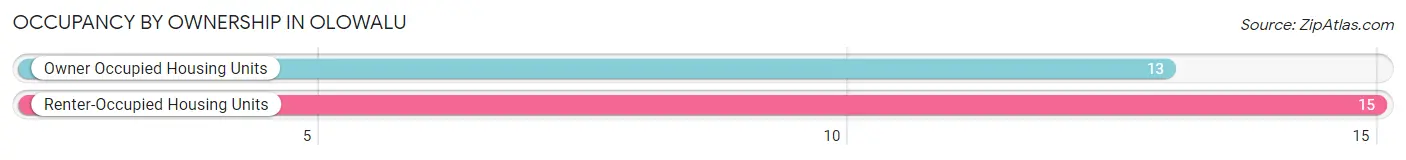
| Occupancy | # Housing Units | % Housing Units |
| Owner Occupied Housing Units | 13 | 46.4% |
| Renter-Occupied Housing Units | 15 | 53.6% |
| Total Occupied Housing Units | 28 | 100.0% |
Occupancy by Household Size in Olowalu
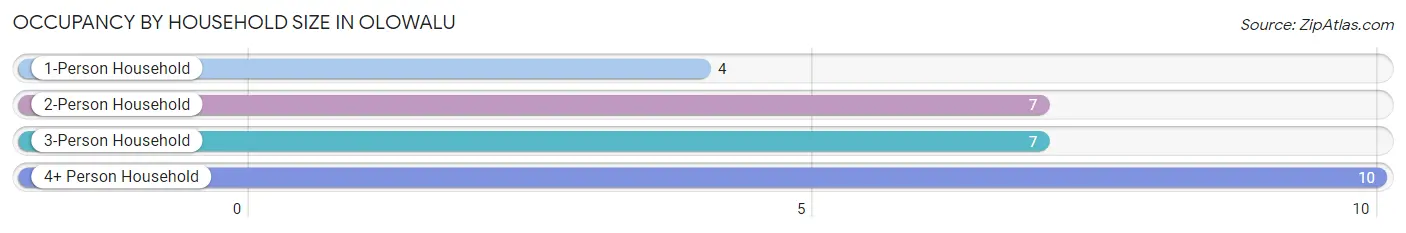
| Household Size | # Housing Units | % Housing Units |
| 1-Person Household | 4 | 14.3% |
| 2-Person Household | 7 | 25.0% |
| 3-Person Household | 7 | 25.0% |
| 4+ Person Household | 10 | 35.7% |
| Total Housing Units | 28 | 100.0% |
Occupancy by Ownership by Household Size in Olowalu
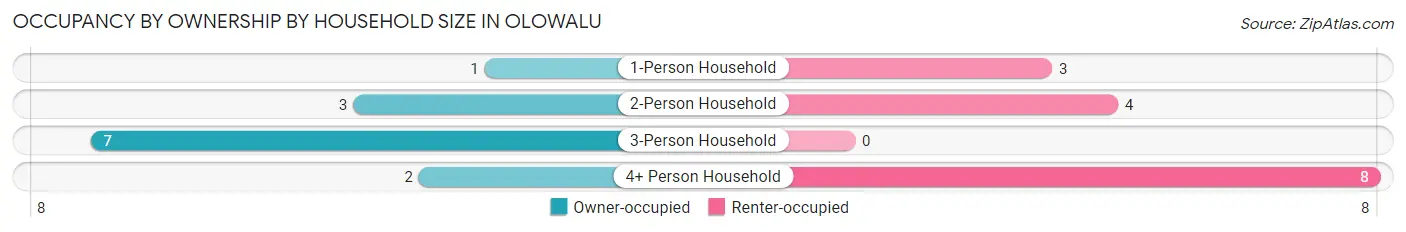
| Household Size | Owner-occupied | Renter-occupied |
| 1-Person Household | 1 (25.0%) | 3 (75.0%) |
| 2-Person Household | 3 (42.9%) | 4 (57.1%) |
| 3-Person Household | 7 (100.0%) | 0 (0.0%) |
| 4+ Person Household | 2 (20.0%) | 8 (80.0%) |
| Total Housing Units | 13 (46.4%) | 15 (53.6%) |
Occupancy by Educational Attainment in Olowalu
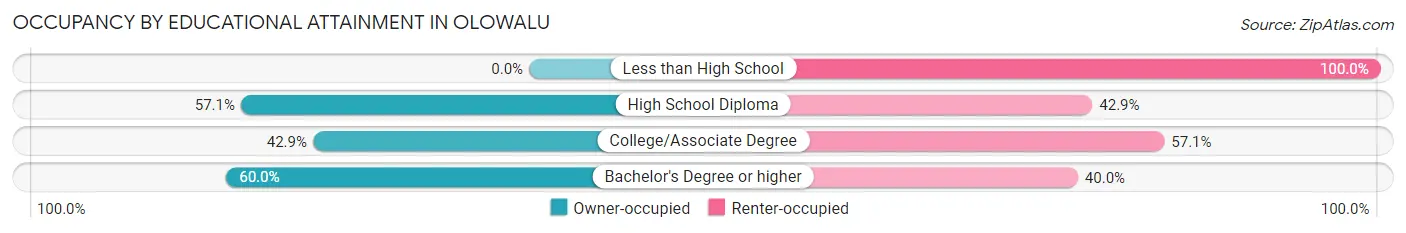
| Household Size | Owner-occupied | Renter-occupied |
| Less than High School | 0 (0.0%) | 4 (100.0%) |
| High School Diploma | 4 (57.1%) | 3 (42.9%) |
| College/Associate Degree | 3 (42.9%) | 4 (57.1%) |
| Bachelor's Degree or higher | 6 (60.0%) | 4 (40.0%) |
Occupancy by Age of Householder in Olowalu
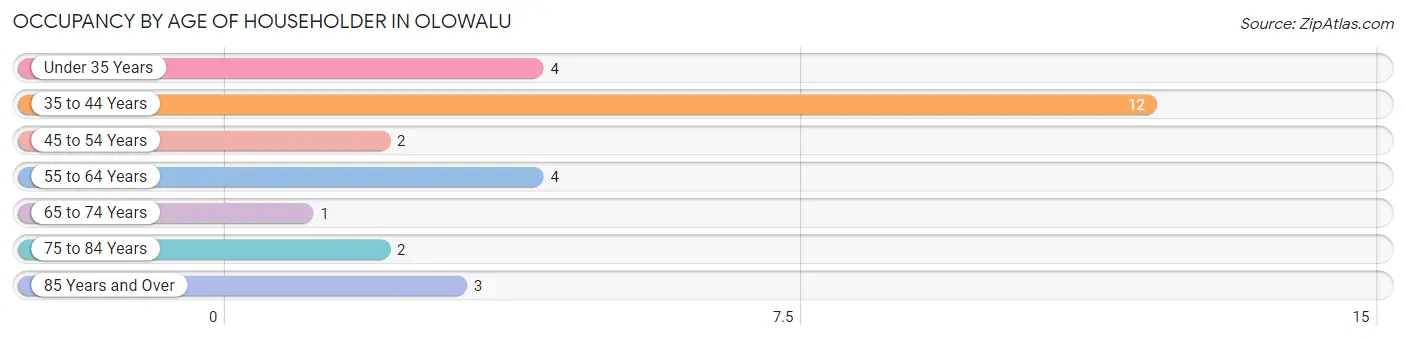
| Age Bracket | # Households | % Households |
| Under 35 Years | 4 | 14.3% |
| 35 to 44 Years | 12 | 42.9% |
| 45 to 54 Years | 2 | 7.1% |
| 55 to 64 Years | 4 | 14.3% |
| 65 to 74 Years | 1 | 3.6% |
| 75 to 84 Years | 2 | 7.1% |
| 85 Years and Over | 3 | 10.7% |
| Total | 28 | 100.0% |
Housing Finances in Olowalu
Median Income by Occupancy in Olowalu
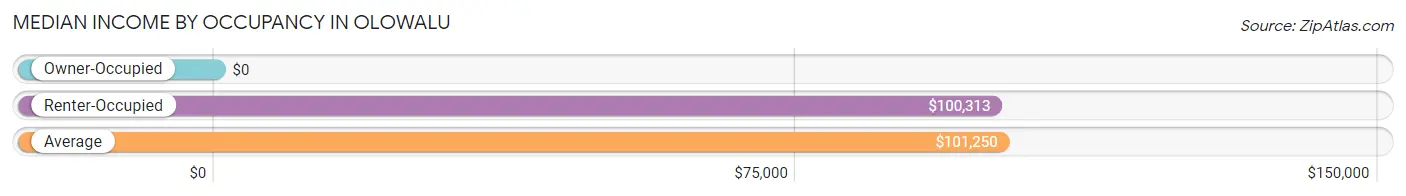
| Occupancy Type | # Households | Median Income |
| Owner-Occupied | 13 (46.4%) | $0 |
| Renter-Occupied | 15 (53.6%) | $100,313 |
| Average | 28 (100.0%) | $101,250 |
Occupancy by Householder Income Bracket in Olowalu
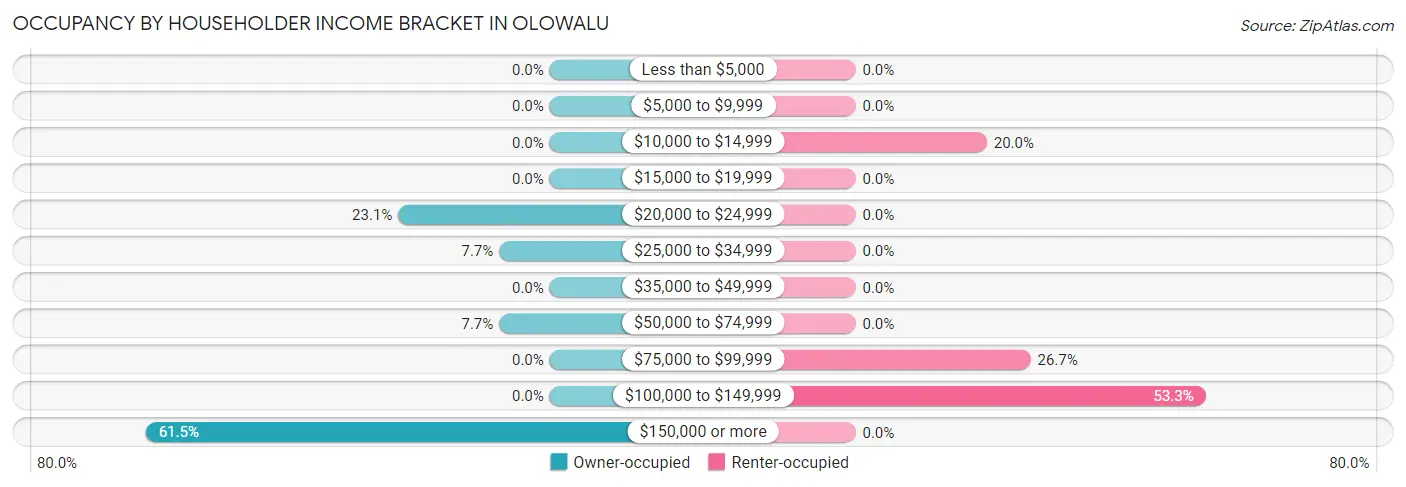
| Income Bracket | Owner-occupied | Renter-occupied |
| Less than $5,000 | 0 (0.0%) | 0 (0.0%) |
| $5,000 to $9,999 | 0 (0.0%) | 0 (0.0%) |
| $10,000 to $14,999 | 0 (0.0%) | 3 (20.0%) |
| $15,000 to $19,999 | 0 (0.0%) | 0 (0.0%) |
| $20,000 to $24,999 | 3 (23.1%) | 0 (0.0%) |
| $25,000 to $34,999 | 1 (7.7%) | 0 (0.0%) |
| $35,000 to $49,999 | 0 (0.0%) | 0 (0.0%) |
| $50,000 to $74,999 | 1 (7.7%) | 0 (0.0%) |
| $75,000 to $99,999 | 0 (0.0%) | 4 (26.7%) |
| $100,000 to $149,999 | 0 (0.0%) | 8 (53.3%) |
| $150,000 or more | 8 (61.5%) | 0 (0.0%) |
| Total | 13 (100.0%) | 15 (100.0%) |
Monthly Housing Cost Tiers in Olowalu
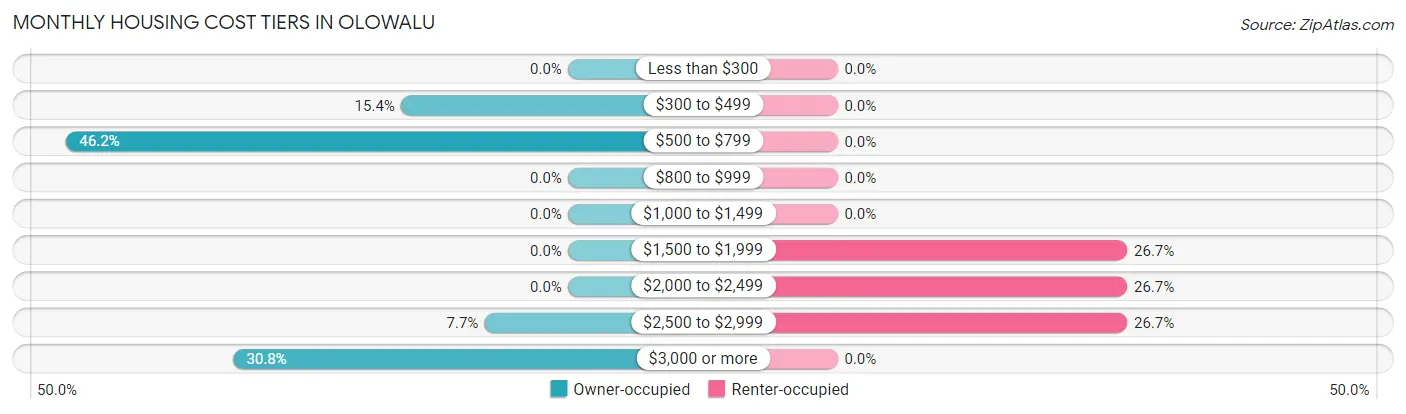
| Monthly Cost | Owner-occupied | Renter-occupied |
| Less than $300 | 0 (0.0%) | 0 (0.0%) |
| $300 to $499 | 2 (15.4%) | 0 (0.0%) |
| $500 to $799 | 6 (46.2%) | 0 (0.0%) |
| $800 to $999 | 0 (0.0%) | 0 (0.0%) |
| $1,000 to $1,499 | 0 (0.0%) | 0 (0.0%) |
| $1,500 to $1,999 | 0 (0.0%) | 4 (26.7%) |
| $2,000 to $2,499 | 0 (0.0%) | 4 (26.7%) |
| $2,500 to $2,999 | 1 (7.7%) | 4 (26.7%) |
| $3,000 or more | 4 (30.8%) | 0 (0.0%) |
| Total | 13 (100.0%) | 15 (100.0%) |
Physical Housing Characteristics in Olowalu
Housing Structures in Olowalu
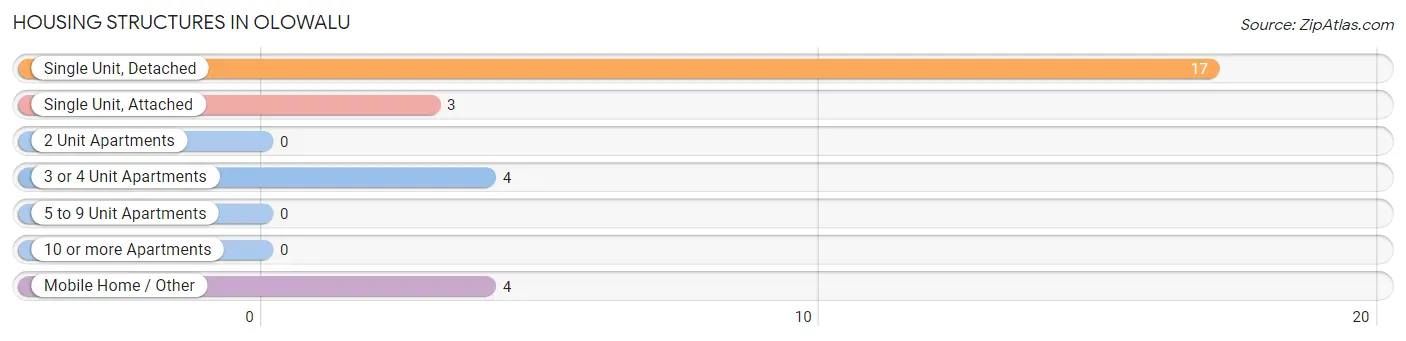
| Structure Type | # Housing Units | % Housing Units |
| Single Unit, Detached | 17 | 60.7% |
| Single Unit, Attached | 3 | 10.7% |
| 2 Unit Apartments | 0 | 0.0% |
| 3 or 4 Unit Apartments | 4 | 14.3% |
| 5 to 9 Unit Apartments | 0 | 0.0% |
| 10 or more Apartments | 0 | 0.0% |
| Mobile Home / Other | 4 | 14.3% |
| Total | 28 | 100.0% |
Housing Structures by Occupancy in Olowalu
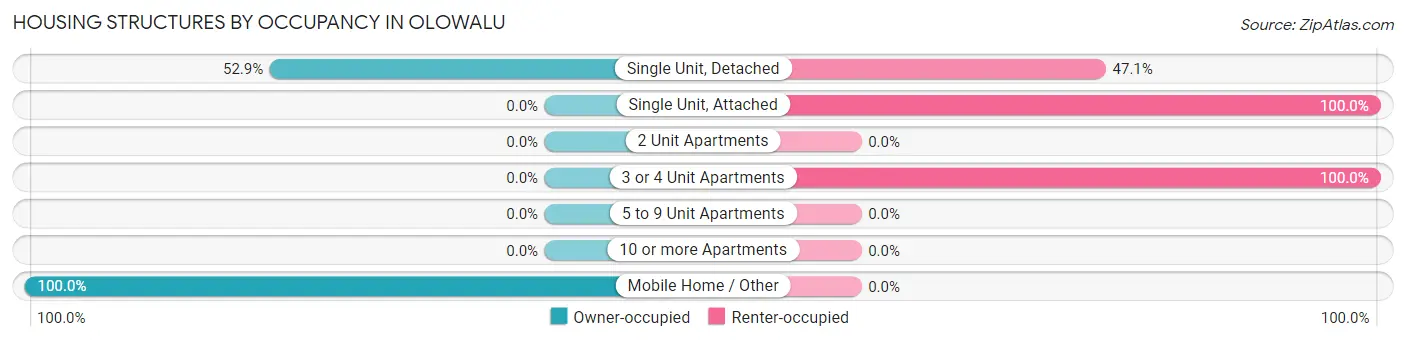
| Structure Type | Owner-occupied | Renter-occupied |
| Single Unit, Detached | 9 (52.9%) | 8 (47.1%) |
| Single Unit, Attached | 0 (0.0%) | 3 (100.0%) |
| 2 Unit Apartments | 0 (0.0%) | 0 (0.0%) |
| 3 or 4 Unit Apartments | 0 (0.0%) | 4 (100.0%) |
| 5 to 9 Unit Apartments | 0 (0.0%) | 0 (0.0%) |
| 10 or more Apartments | 0 (0.0%) | 0 (0.0%) |
| Mobile Home / Other | 4 (100.0%) | 0 (0.0%) |
| Total | 13 (46.4%) | 15 (53.6%) |
Housing Structures by Number of Rooms in Olowalu
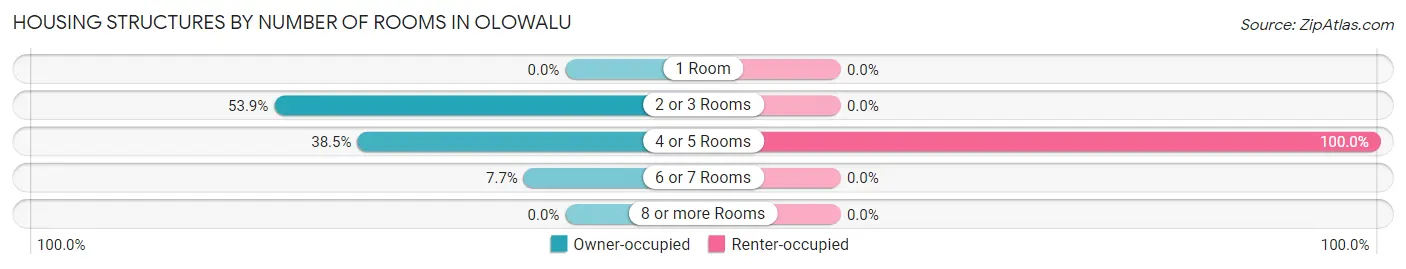
| Number of Rooms | Owner-occupied | Renter-occupied |
| 1 Room | 0 (0.0%) | 0 (0.0%) |
| 2 or 3 Rooms | 7 (53.8%) | 0 (0.0%) |
| 4 or 5 Rooms | 5 (38.5%) | 15 (100.0%) |
| 6 or 7 Rooms | 1 (7.7%) | 0 (0.0%) |
| 8 or more Rooms | 0 (0.0%) | 0 (0.0%) |
| Total | 13 (100.0%) | 15 (100.0%) |
Housing Structure by Heating Type in Olowalu
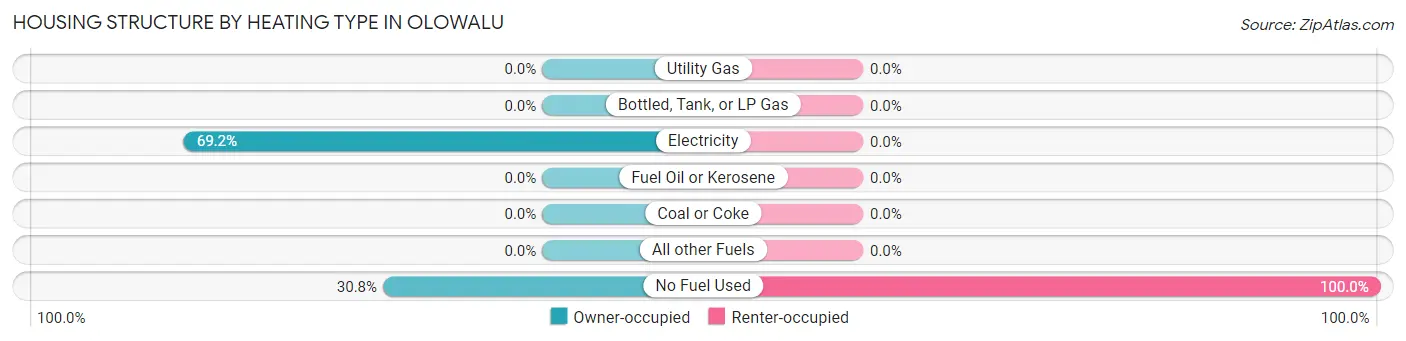
| Heating Type | Owner-occupied | Renter-occupied |
| Utility Gas | 0 (0.0%) | 0 (0.0%) |
| Bottled, Tank, or LP Gas | 0 (0.0%) | 0 (0.0%) |
| Electricity | 9 (69.2%) | 0 (0.0%) |
| Fuel Oil or Kerosene | 0 (0.0%) | 0 (0.0%) |
| Coal or Coke | 0 (0.0%) | 0 (0.0%) |
| All other Fuels | 0 (0.0%) | 0 (0.0%) |
| No Fuel Used | 4 (30.8%) | 15 (100.0%) |
| Total | 13 (100.0%) | 15 (100.0%) |
Household Vehicle Usage in Olowalu
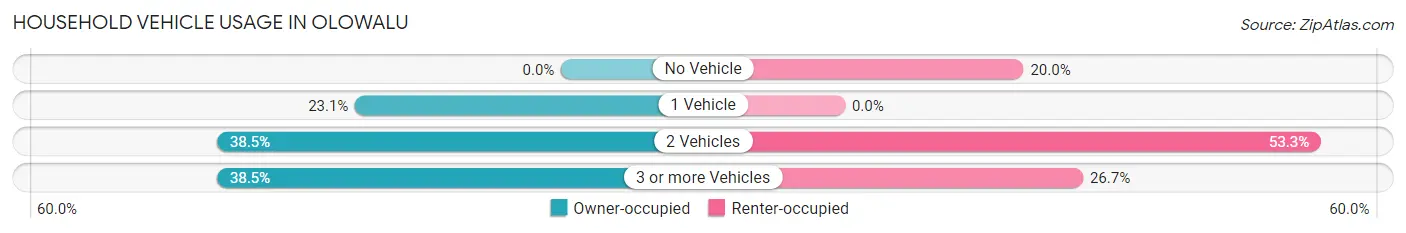
| Vehicles per Household | Owner-occupied | Renter-occupied |
| No Vehicle | 0 (0.0%) | 3 (20.0%) |
| 1 Vehicle | 3 (23.1%) | 0 (0.0%) |
| 2 Vehicles | 5 (38.5%) | 8 (53.3%) |
| 3 or more Vehicles | 5 (38.5%) | 4 (26.7%) |
| Total | 13 (100.0%) | 15 (100.0%) |
Real Estate & Mortgages in Olowalu
Real Estate and Mortgage Overview in Olowalu
| Characteristic | Without Mortgage | With Mortgage |
| Housing Units | 8 | 5 |
| Median Property Value | $916,700 | $1,312,500 |
| Median Household Income | - | - |
| Monthly Housing Costs | $633 | $4 |
| Real Estate Taxes | - | - |
Property Value by Mortgage Status in Olowalu
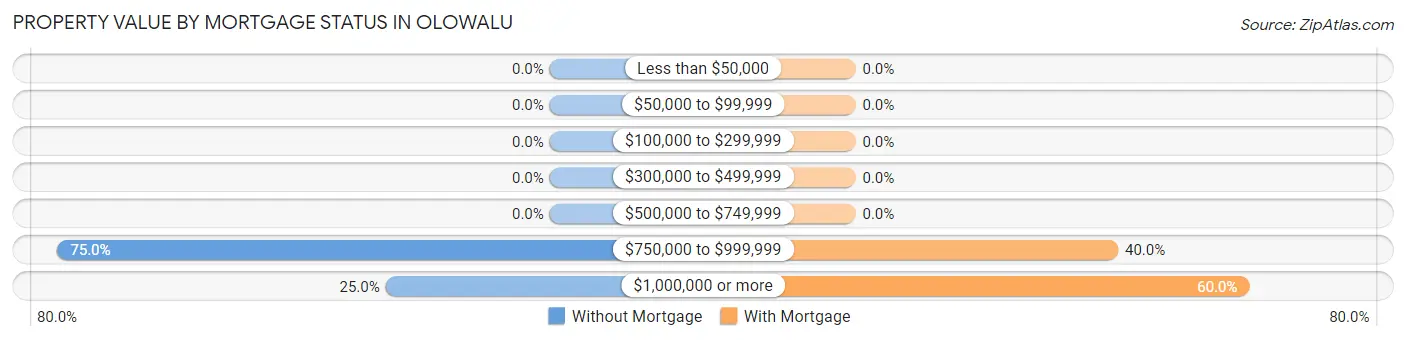
| Property Value | Without Mortgage | With Mortgage |
| Less than $50,000 | 0 (0.0%) | 0 (0.0%) |
| $50,000 to $99,999 | 0 (0.0%) | 0 (0.0%) |
| $100,000 to $299,999 | 0 (0.0%) | 0 (0.0%) |
| $300,000 to $499,999 | 0 (0.0%) | 0 (0.0%) |
| $500,000 to $749,999 | 0 (0.0%) | 0 (0.0%) |
| $750,000 to $999,999 | 6 (75.0%) | 2 (40.0%) |
| $1,000,000 or more | 2 (25.0%) | 3 (60.0%) |
| Total | 8 (100.0%) | 5 (100.0%) |
Household Income by Mortgage Status in Olowalu
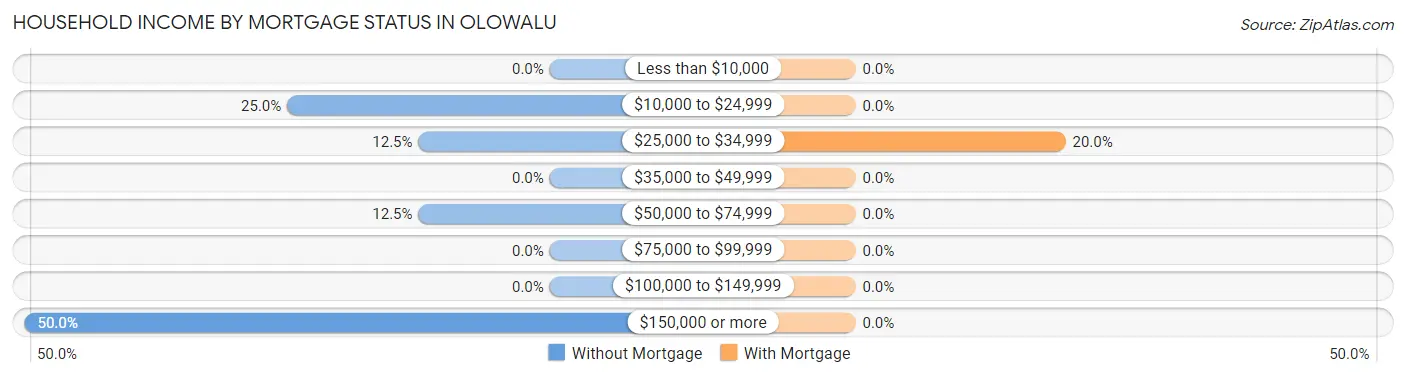
| Household Income | Without Mortgage | With Mortgage |
| Less than $10,000 | 0 (0.0%) | 0 (0.0%) |
| $10,000 to $24,999 | 2 (25.0%) | 0 (0.0%) |
| $25,000 to $34,999 | 1 (12.5%) | 1 (20.0%) |
| $35,000 to $49,999 | 0 (0.0%) | 0 (0.0%) |
| $50,000 to $74,999 | 1 (12.5%) | 0 (0.0%) |
| $75,000 to $99,999 | 0 (0.0%) | 0 (0.0%) |
| $100,000 to $149,999 | 0 (0.0%) | 0 (0.0%) |
| $150,000 or more | 4 (50.0%) | 0 (0.0%) |
| Total | 8 (100.0%) | 5 (100.0%) |
Property Value to Household Income Ratio in Olowalu
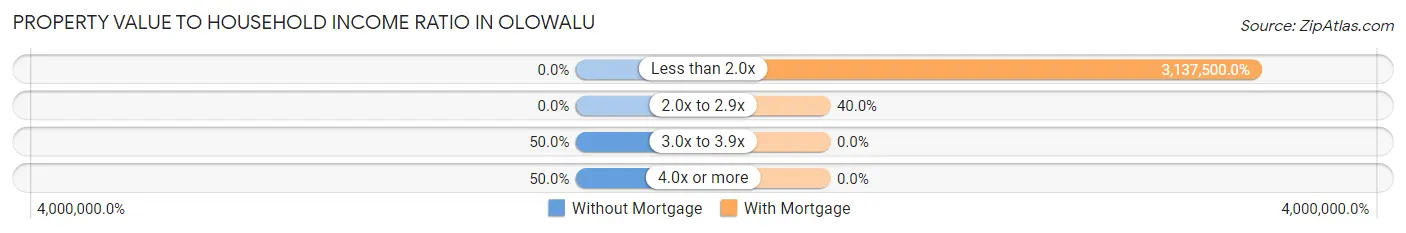
| Value-to-Income Ratio | Without Mortgage | With Mortgage |
| Less than 2.0x | 0 (0.0%) | 156,875 (3,137,500.0%) |
| 2.0x to 2.9x | 0 (0.0%) | 2 (40.0%) |
| 3.0x to 3.9x | 4 (50.0%) | 0 (0.0%) |
| 4.0x or more | 4 (50.0%) | 0 (0.0%) |
| Total | 8 (100.0%) | 5 (100.0%) |
Real Estate Taxes by Mortgage Status in Olowalu
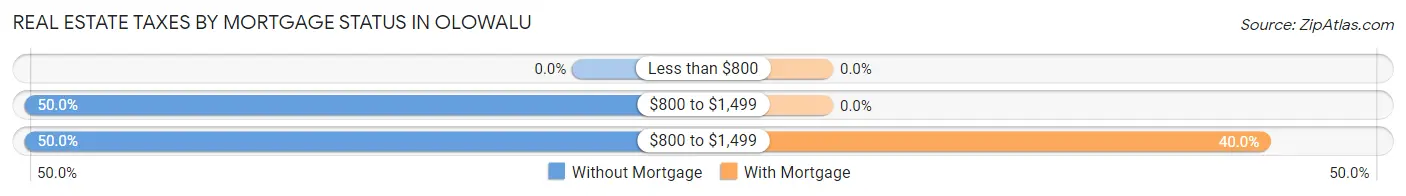
| Property Taxes | Without Mortgage | With Mortgage |
| Less than $800 | 0 (0.0%) | 0 (0.0%) |
| $800 to $1,499 | 4 (50.0%) | 0 (0.0%) |
| $800 to $1,499 | 4 (50.0%) | 2 (40.0%) |
| Total | 8 (100.0%) | 5 (100.0%) |
Health & Disability in Olowalu
Health Insurance Coverage by Age in Olowalu
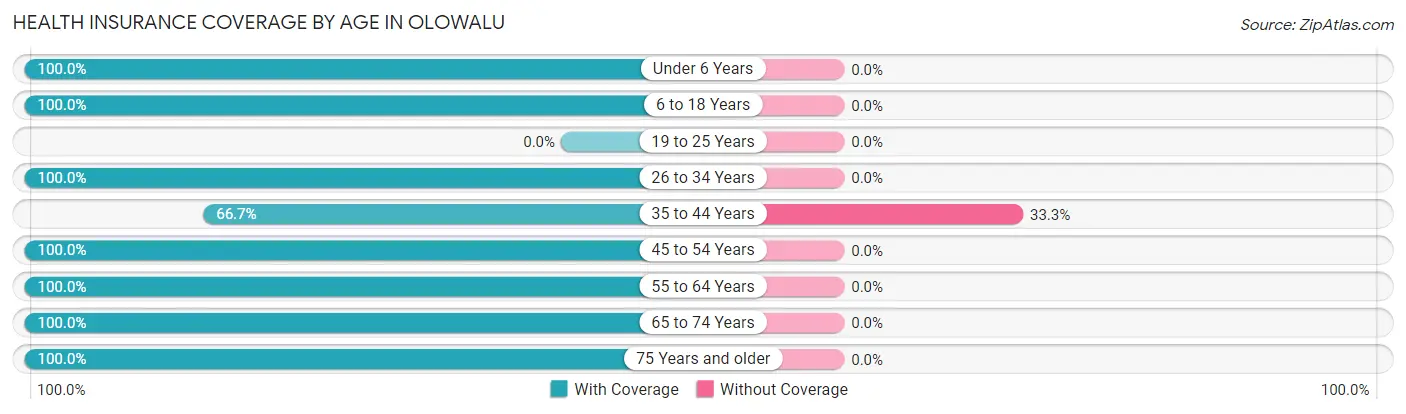
| Age Bracket | With Coverage | Without Coverage |
| Under 6 Years | 17 (100.0%) | 0 (0.0%) |
| 6 to 18 Years | 8 (100.0%) | 0 (0.0%) |
| 19 to 25 Years | 0 (0.0%) | 0 (0.0%) |
| 26 to 34 Years | 4 (100.0%) | 0 (0.0%) |
| 35 to 44 Years | 16 (66.7%) | 8 (33.3%) |
| 45 to 54 Years | 19 (100.0%) | 0 (0.0%) |
| 55 to 64 Years | 4 (100.0%) | 0 (0.0%) |
| 65 to 74 Years | 7 (100.0%) | 0 (0.0%) |
| 75 Years and older | 5 (100.0%) | 0 (0.0%) |
| Total | 80 (90.9%) | 8 (9.1%) |
Health Insurance Coverage by Citizenship Status in Olowalu
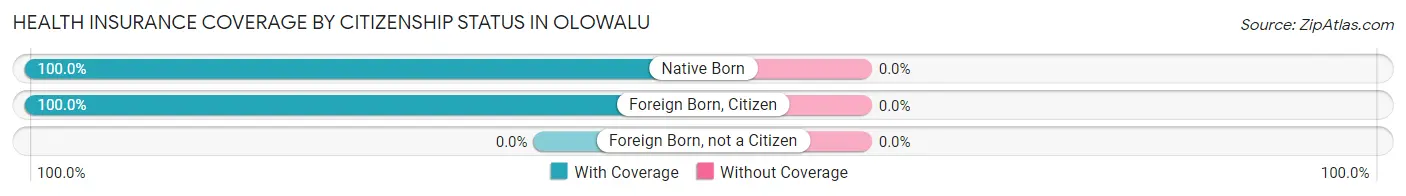
| Citizenship Status | With Coverage | Without Coverage |
| Native Born | 17 (100.0%) | 0 (0.0%) |
| Foreign Born, Citizen | 8 (100.0%) | 0 (0.0%) |
| Foreign Born, not a Citizen | 0 (0.0%) | 0 (0.0%) |
Health Insurance Coverage by Household Income in Olowalu
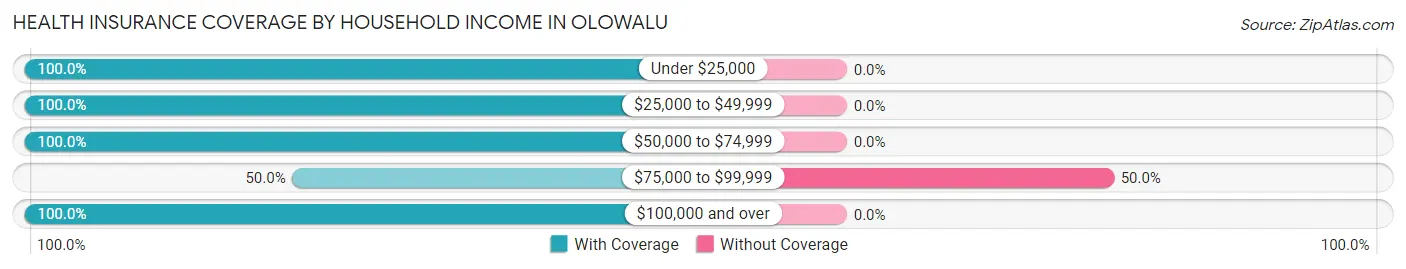
| Household Income | With Coverage | Without Coverage |
| Under $25,000 | 12 (100.0%) | 0 (0.0%) |
| $25,000 to $49,999 | 1 (100.0%) | 0 (0.0%) |
| $50,000 to $74,999 | 2 (100.0%) | 0 (0.0%) |
| $75,000 to $99,999 | 8 (50.0%) | 8 (50.0%) |
| $100,000 and over | 57 (100.0%) | 0 (0.0%) |
Public vs Private Health Insurance Coverage by Age in Olowalu
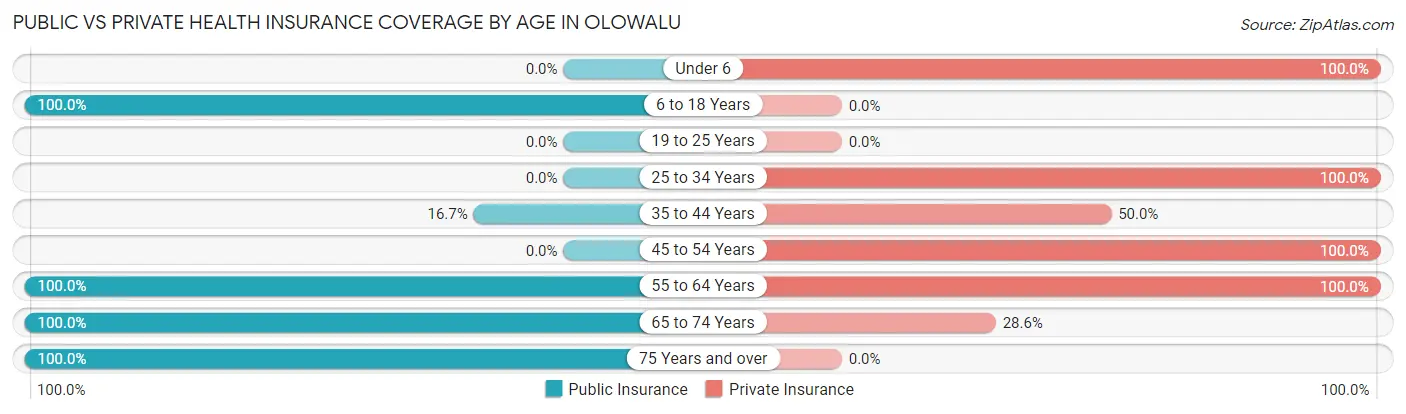
| Age Bracket | Public Insurance | Private Insurance |
| Under 6 | 0 (0.0%) | 17 (100.0%) |
| 6 to 18 Years | 8 (100.0%) | 0 (0.0%) |
| 19 to 25 Years | 0 (0.0%) | 0 (0.0%) |
| 25 to 34 Years | 0 (0.0%) | 4 (100.0%) |
| 35 to 44 Years | 4 (16.7%) | 12 (50.0%) |
| 45 to 54 Years | 0 (0.0%) | 19 (100.0%) |
| 55 to 64 Years | 4 (100.0%) | 4 (100.0%) |
| 65 to 74 Years | 7 (100.0%) | 2 (28.6%) |
| 75 Years and over | 5 (100.0%) | 0 (0.0%) |
| Total | 28 (31.8%) | 58 (65.9%) |
Disability Status by Sex by Age in Olowalu
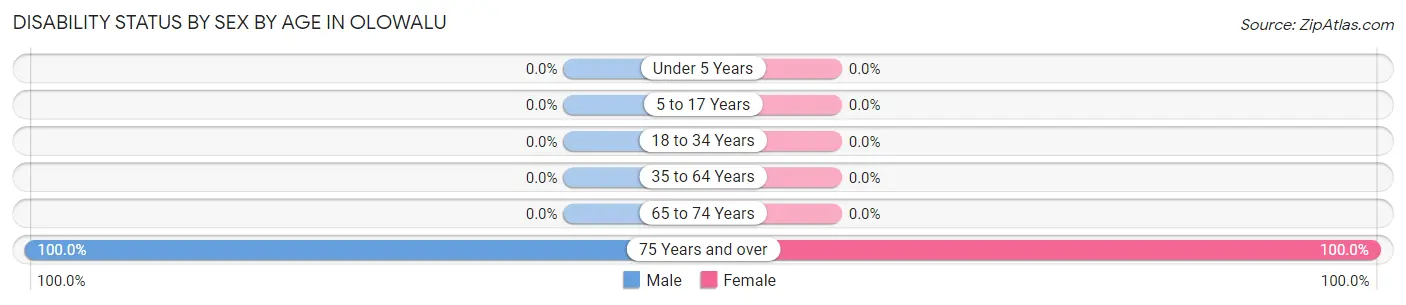
| Age Bracket | Male | Female |
| Under 5 Years | 0 (0.0%) | 0 (0.0%) |
| 5 to 17 Years | 0 (0.0%) | 0 (0.0%) |
| 18 to 34 Years | 0 (0.0%) | 0 (0.0%) |
| 35 to 64 Years | 0 (0.0%) | 0 (0.0%) |
| 65 to 74 Years | 0 (0.0%) | 0 (0.0%) |
| 75 Years and over | 2 (100.0%) | 3 (100.0%) |
Disability Class by Sex by Age in Olowalu
Disability Class: Hearing Difficulty
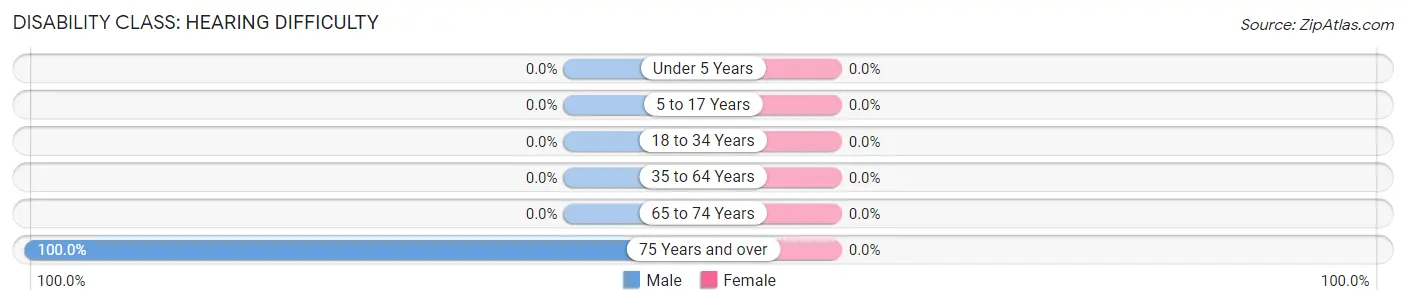
| Age Bracket | Male | Female |
| Under 5 Years | 0 (0.0%) | 0 (0.0%) |
| 5 to 17 Years | 0 (0.0%) | 0 (0.0%) |
| 18 to 34 Years | 0 (0.0%) | 0 (0.0%) |
| 35 to 64 Years | 0 (0.0%) | 0 (0.0%) |
| 65 to 74 Years | 0 (0.0%) | 0 (0.0%) |
| 75 Years and over | 2 (100.0%) | 0 (0.0%) |
Disability Class: Vision Difficulty
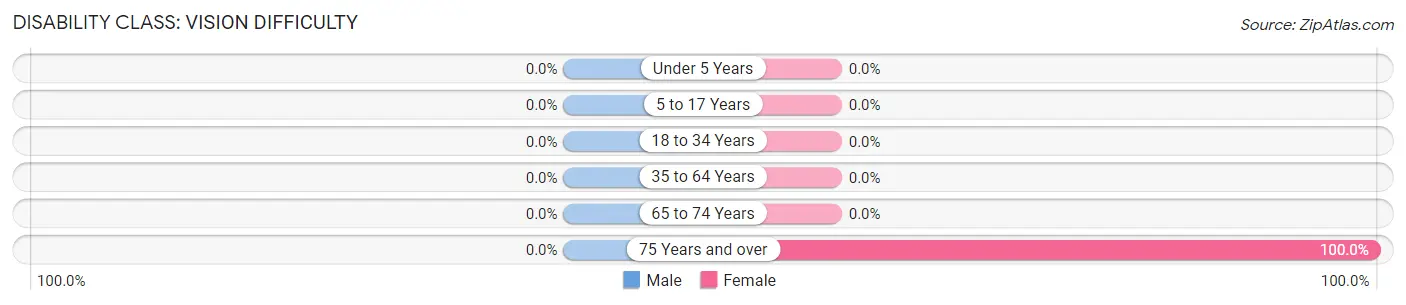
| Age Bracket | Male | Female |
| Under 5 Years | 0 (0.0%) | 0 (0.0%) |
| 5 to 17 Years | 0 (0.0%) | 0 (0.0%) |
| 18 to 34 Years | 0 (0.0%) | 0 (0.0%) |
| 35 to 64 Years | 0 (0.0%) | 0 (0.0%) |
| 65 to 74 Years | 0 (0.0%) | 0 (0.0%) |
| 75 Years and over | 0 (0.0%) | 3 (100.0%) |
Disability Class: Cognitive Difficulty
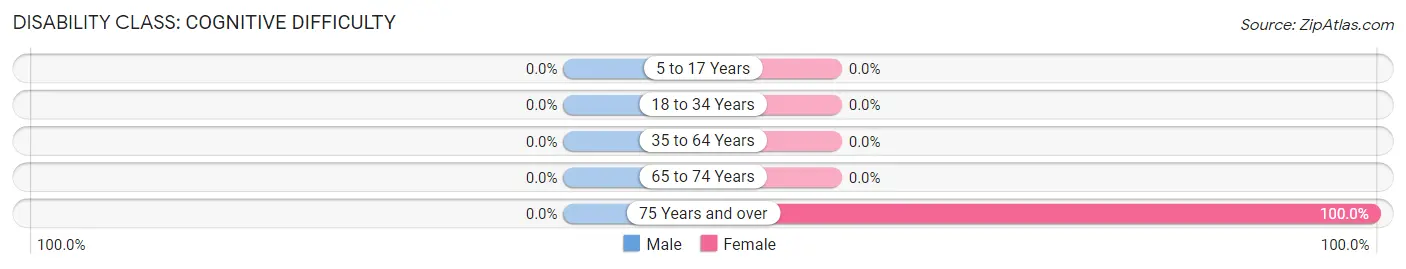
| Age Bracket | Male | Female |
| 5 to 17 Years | 0 (0.0%) | 0 (0.0%) |
| 18 to 34 Years | 0 (0.0%) | 0 (0.0%) |
| 35 to 64 Years | 0 (0.0%) | 0 (0.0%) |
| 65 to 74 Years | 0 (0.0%) | 0 (0.0%) |
| 75 Years and over | 0 (0.0%) | 3 (100.0%) |
Disability Class: Ambulatory Difficulty
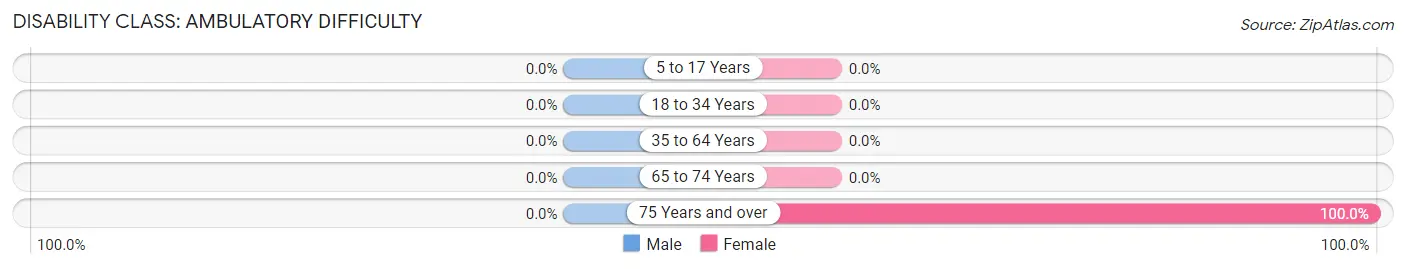
| Age Bracket | Male | Female |
| 5 to 17 Years | 0 (0.0%) | 0 (0.0%) |
| 18 to 34 Years | 0 (0.0%) | 0 (0.0%) |
| 35 to 64 Years | 0 (0.0%) | 0 (0.0%) |
| 65 to 74 Years | 0 (0.0%) | 0 (0.0%) |
| 75 Years and over | 0 (0.0%) | 3 (100.0%) |
Disability Class: Self-Care Difficulty
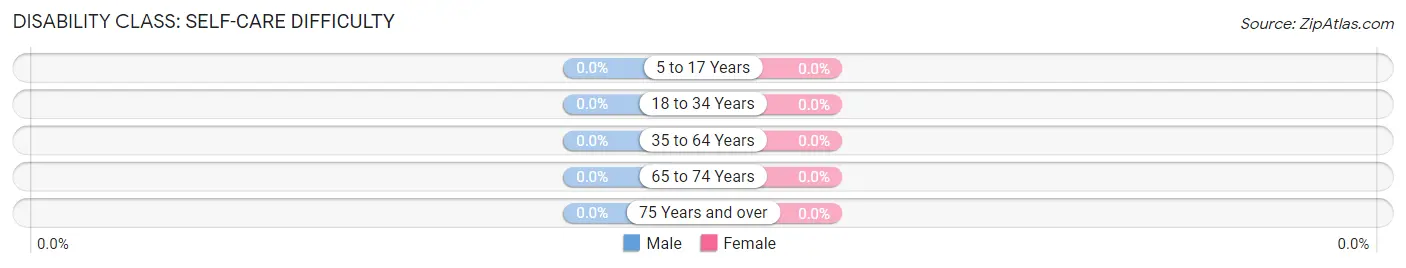
| Age Bracket | Male | Female |
| 5 to 17 Years | 0 (0.0%) | 0 (0.0%) |
| 18 to 34 Years | 0 (0.0%) | 0 (0.0%) |
| 35 to 64 Years | 0 (0.0%) | 0 (0.0%) |
| 65 to 74 Years | 0 (0.0%) | 0 (0.0%) |
| 75 Years and over | 0 (0.0%) | 0 (0.0%) |
Technology Access in Olowalu
Computing Device Access in Olowalu
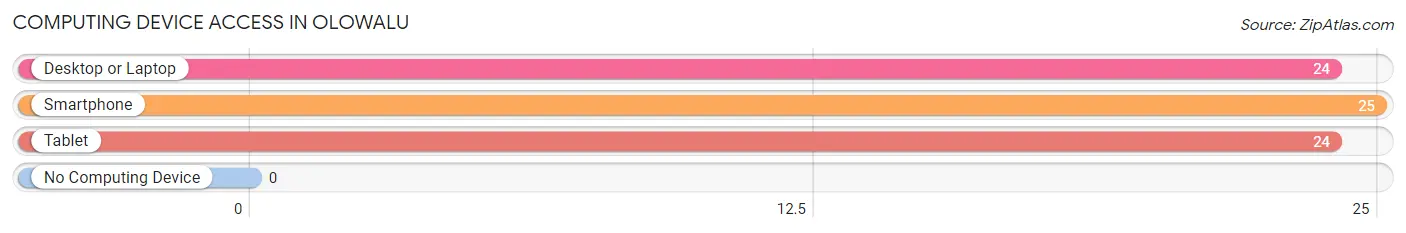
| Device Type | # Households | % Households |
| Desktop or Laptop | 24 | 85.7% |
| Smartphone | 25 | 89.3% |
| Tablet | 24 | 85.7% |
| No Computing Device | 0 | 0.0% |
| Total | 28 | 100.0% |
Internet Access in Olowalu
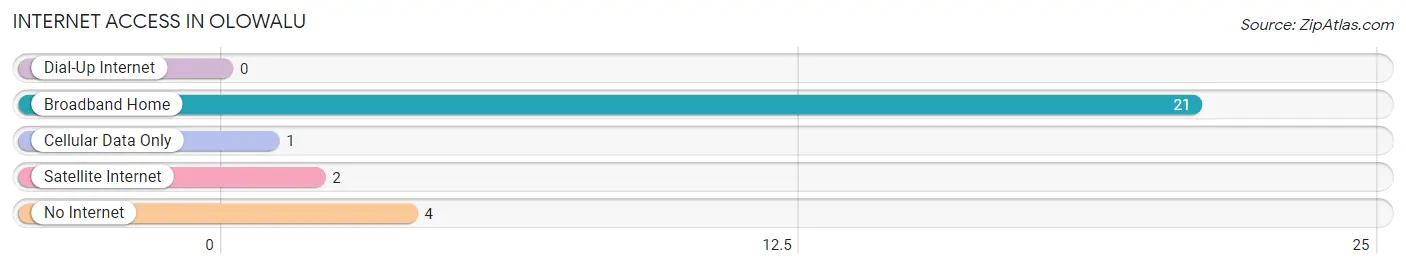
| Internet Type | # Households | % Households |
| Dial-Up Internet | 0 | 0.0% |
| Broadband Home | 21 | 75.0% |
| Cellular Data Only | 1 | 3.6% |
| Satellite Internet | 2 | 7.1% |
| No Internet | 4 | 14.3% |
| Total | 28 | 100.0% |
Olowalu Summary
Olowalu is a small unincorporated community located on the western coast of Maui, Hawaii. It is situated between the towns of Lahaina and Kaanapali, and is known for its beautiful beaches, lush tropical vegetation, and rich cultural history.
History
Olowalu has a long and rich history that dates back to the early 1800s. The area was originally inhabited by Native Hawaiians, who used the area for fishing and farming. In 1823, the first European settlers arrived in Olowalu and established a sugar plantation. The plantation was successful and the area soon became a thriving community.
In the late 1800s, Olowalu was a popular destination for whalers and traders. The whalers would often stop in Olowalu to rest and resupply before continuing on their journey. The traders would bring goods from around the world, including fabrics, spices, and other items.
In the early 1900s, Olowalu became a popular tourist destination. Tourists from around the world would come to Olowalu to enjoy the beautiful beaches and lush tropical vegetation. The area was also known for its excellent fishing and diving.
In the late 1900s, Olowalu began to experience a decline in tourism due to the development of nearby resorts. Despite this, Olowalu remains a popular destination for locals and visitors alike.
Geography
Olowalu is located on the western coast of Maui, Hawaii. It is situated between the towns of Lahaina and Kaanapali. The area is known for its beautiful beaches, lush tropical vegetation, and rich cultural history.
The area is home to a variety of wildlife, including dolphins, whales, sea turtles, and a variety of fish species. The area is also home to a variety of plants, including coconut palms, hibiscus, and other tropical vegetation.
Economy
Olowalu is primarily a tourist destination. The area is known for its beautiful beaches, lush tropical vegetation, and rich cultural history. Tourists come to Olowalu to enjoy the beaches, snorkel, and explore the area.
The area is also home to a variety of businesses, including restaurants, hotels, and shops. These businesses cater to the needs of tourists and locals alike.
Demographics
As of the 2010 census, the population of Olowalu was 1,845. The population is primarily Native Hawaiian, with a small percentage of other ethnicities. The median age of the population is 44.
The median household income in Olowalu is $50,000. The median home value is $400,000. The area has a high cost of living, with the median rent being $2,000 per month.
Conclusion
Olowalu is a small unincorporated community located on the western coast of Maui, Hawaii. It is known for its beautiful beaches, lush tropical vegetation, and rich cultural history. The area is primarily a tourist destination, with a variety of businesses catering to the needs of tourists and locals alike. The population of Olowalu is primarily Native Hawaiian, with a median age of 44 and a median household income of $50,000. The area has a high cost of living, with the median rent being $2,000 per month.
Common Questions
What is Per Capita Income in Olowalu?
Per Capita income in Olowalu is $50,106.
What is the Median Family Income in Olowalu?
Median Family Income in Olowalu is $100,313.
What is the Median Household income in Olowalu?
Median Household Income in Olowalu is $101,250.
What is Inequality or Gini Index in Olowalu?
Inequality or Gini Index in Olowalu is 0.51.
What is the Total Population of Olowalu?
Total Population of Olowalu is 88.
What is the Total Male Population of Olowalu?
Total Male Population of Olowalu is 41.
What is the Total Female Population of Olowalu?
Total Female Population of Olowalu is 47.
What is the Ratio of Males per 100 Females in Olowalu?
There are 87.23 Males per 100 Females in Olowalu.
What is the Ratio of Females per 100 Males in Olowalu?
There are 114.63 Females per 100 Males in Olowalu.
What is the Median Population Age in Olowalu?
Median Population Age in Olowalu is 42.2 Years.
What is the Average Family Size in Olowalu
Average Family Size in Olowalu is 3.2 People.
What is the Average Household Size in Olowalu
Average Household Size in Olowalu is 3.1 People.
How Large is the Labor Force in Olowalu?
There are 51 People in the Labor Forcein in Olowalu.
What is the Percentage of People in the Labor Force in Olowalu?
81.0% of People are in the Labor Force in Olowalu.