Turkey Creek, AZ Map & Demographics
Turkey Creek Map
Turkey Creek Overview
$9,031
PER CAPITA INCOME
$36,094
AVG FAMILY INCOME
$24,583
AVG HOUSEHOLD INCOME
0.48
INEQUALITY / GINI INDEX
457
TOTAL POPULATION
273
MALE POPULATION
184
FEMALE POPULATION
148.37
MALES / 100 FEMALES
67.40
FEMALES / 100 MALES
24.8
MEDIAN AGE
4.7
AVG FAMILY SIZE
3.8
AVG HOUSEHOLD SIZE
118
LABOR FORCE [ PEOPLE ]
37.0%
PERCENT IN LABOR FORCE
10.2%
UNEMPLOYMENT RATE
Income in Turkey Creek
Income Overview in Turkey Creek
Per Capita Income in Turkey Creek is $9,031, while median incomes of families and households are $36,094 and $24,583 respectively.
| Characteristic | Number | Measure |
| Per Capita Income | 457 | $9,031 |
| Median Family Income | 85 | $36,094 |
| Mean Family Income | 85 | $38,512 |
| Median Household Income | 121 | $24,583 |
| Mean Household Income | 121 | $30,155 |
| Income Deficit | 85 | $0 |
| Wage / Income Gap (%) | 457 | 0.00% |
| Wage / Income Gap ($) | 457 | 100.00¢ per $1 |
| Gini / Inequality Index | 457 | 0.48 |
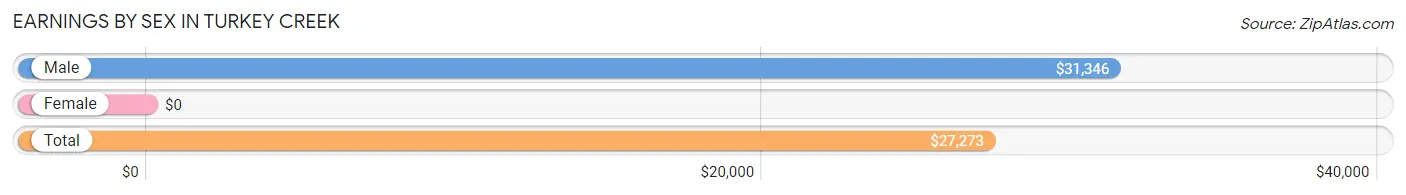
Earnings by Sex in Turkey Creek
| Sex | Number | Average Earnings |
| Male | 52 (44.1%) | $31,346 |
| Female | 66 (55.9%) | $0 |
| Total | 118 (100.0%) | $27,273 |
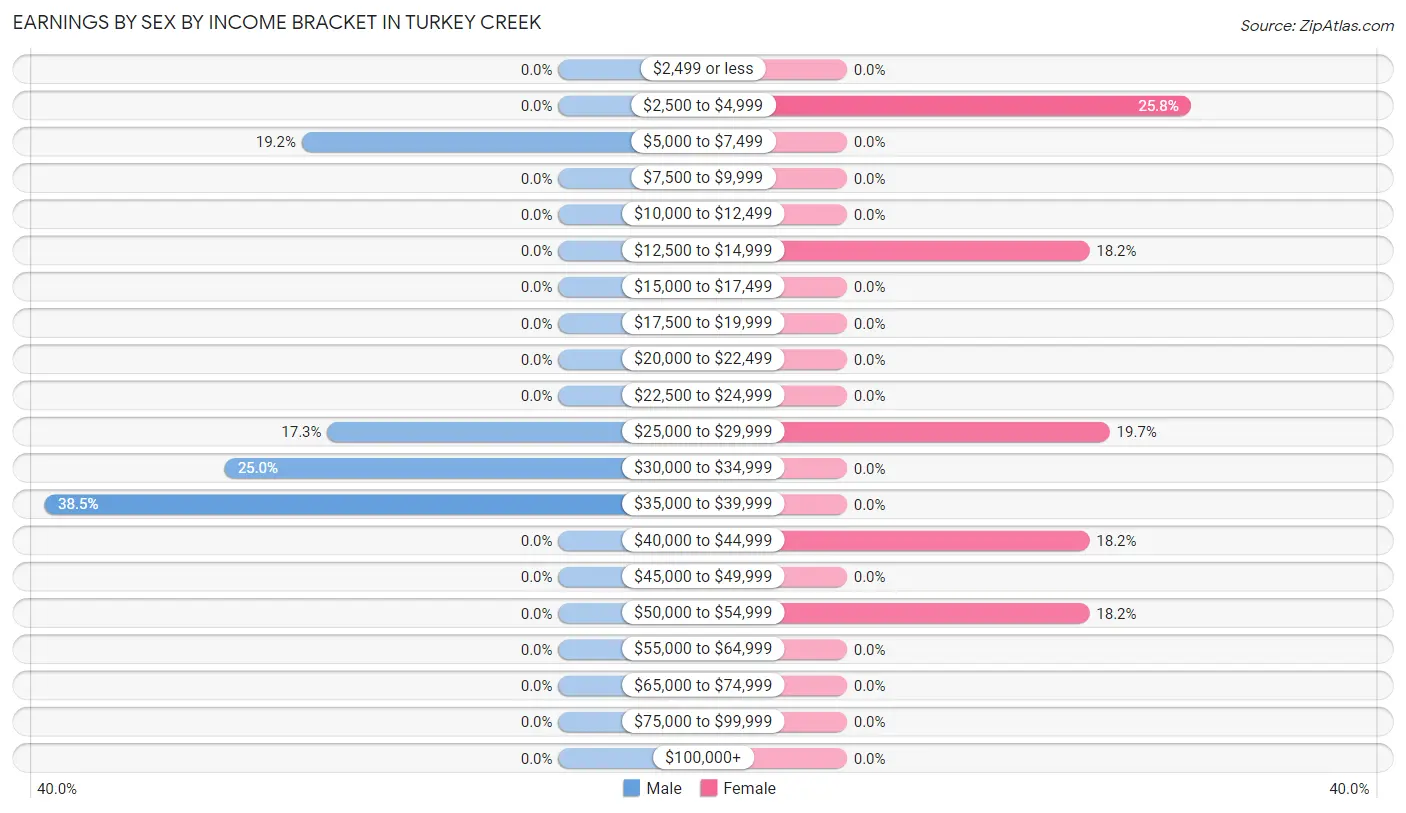
Earnings by Sex by Income Bracket in Turkey Creek
The most common earnings brackets in Turkey Creek are $35,000 to $39,999 for men (20 | 38.5%) and $2,500 to $4,999 for women (17 | 25.8%).
| Income | Male | Female |
| $2,499 or less | 0 (0.0%) | 0 (0.0%) |
| $2,500 to $4,999 | 0 (0.0%) | 17 (25.8%) |
| $5,000 to $7,499 | 10 (19.2%) | 0 (0.0%) |
| $7,500 to $9,999 | 0 (0.0%) | 0 (0.0%) |
| $10,000 to $12,499 | 0 (0.0%) | 0 (0.0%) |
| $12,500 to $14,999 | 0 (0.0%) | 12 (18.2%) |
| $15,000 to $17,499 | 0 (0.0%) | 0 (0.0%) |
| $17,500 to $19,999 | 0 (0.0%) | 0 (0.0%) |
| $20,000 to $22,499 | 0 (0.0%) | 0 (0.0%) |
| $22,500 to $24,999 | 0 (0.0%) | 0 (0.0%) |
| $25,000 to $29,999 | 9 (17.3%) | 13 (19.7%) |
| $30,000 to $34,999 | 13 (25.0%) | 0 (0.0%) |
| $35,000 to $39,999 | 20 (38.5%) | 0 (0.0%) |
| $40,000 to $44,999 | 0 (0.0%) | 12 (18.2%) |
| $45,000 to $49,999 | 0 (0.0%) | 0 (0.0%) |
| $50,000 to $54,999 | 0 (0.0%) | 12 (18.2%) |
| $55,000 to $64,999 | 0 (0.0%) | 0 (0.0%) |
| $65,000 to $74,999 | 0 (0.0%) | 0 (0.0%) |
| $75,000 to $99,999 | 0 (0.0%) | 0 (0.0%) |
| $100,000+ | 0 (0.0%) | 0 (0.0%) |
| Total | 52 (100.0%) | 66 (100.0%) |
Earnings by Sex by Educational Attainment in Turkey Creek
| Educational Attainment | Male Income | Female Income |
| Less than High School | - | - |
| High School Diploma | - | - |
| College or Associate's Degree | - | - |
| Bachelor's Degree | - | - |
| Graduate Degree | - | - |
| Total | $32,308 | $0 |
Family Income in Turkey Creek
Family Income Brackets in Turkey Creek
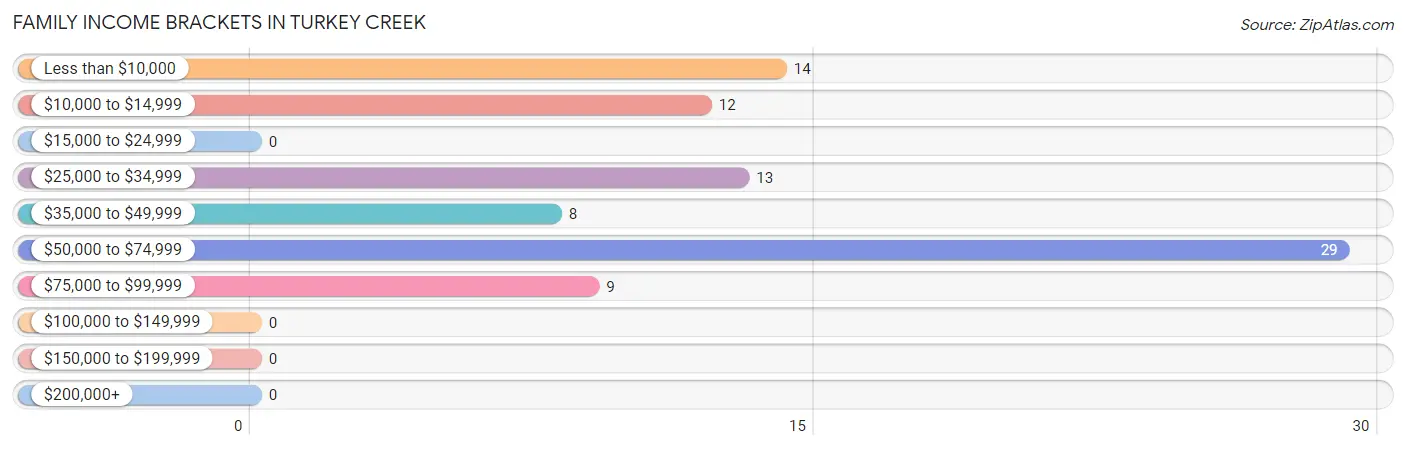
According to the Turkey Creek family income data, there are 29 families falling into the $50,000 to $74,999 income range, which is the most common income bracket and makes up 34.1% of all families.
| Income Bracket | # Families | % Families |
| Less than $10,000 | 14 | 16.5% |
| $10,000 to $14,999 | 12 | 14.1% |
| $15,000 to $24,999 | 0 | 0.0% |
| $25,000 to $34,999 | 13 | 15.3% |
| $35,000 to $49,999 | 8 | 9.4% |
| $50,000 to $74,999 | 29 | 34.1% |
| $75,000 to $99,999 | 9 | 10.6% |
| $100,000 to $149,999 | 0 | 0.0% |
| $150,000 to $199,999 | 0 | 0.0% |
| $200,000+ | 0 | 0.0% |
Family Income by Famaliy Size in Turkey Creek
| Income Bracket | # Families | Median Income |
| 2-Person Families | 8 (9.4%) | $0 |
| 3-Person Families | 37 (43.5%) | $0 |
| 4-Person Families | 18 (21.2%) | $0 |
| 5-Person Families | 8 (9.4%) | $0 |
| 6-Person Families | 14 (16.5%) | $0 |
| 7+ Person Families | 0 (0.0%) | $0 |
| Total | 85 (100.0%) | $36,094 |
Family Income by Number of Earners in Turkey Creek
| Number of Earners | # Families | Median Income |
| No Earners | 22 (25.9%) | $0 |
| 1 Earner | 37 (43.5%) | $0 |
| 2 Earners | 17 (20.0%) | $0 |
| 3+ Earners | 9 (10.6%) | $0 |
| Total | 85 (100.0%) | $36,094 |
Household Income in Turkey Creek
Household Income Brackets in Turkey Creek
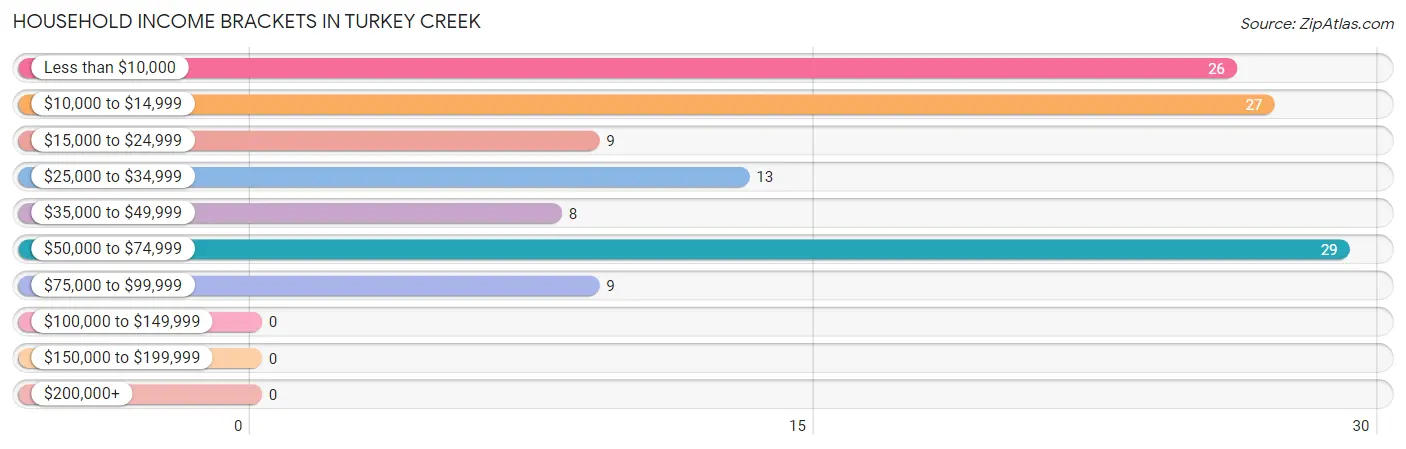
With 29 households falling in the category, the $50,000 to $74,999 income range is the most frequent in Turkey Creek, accounting for 24.0% of all households.
| Income Bracket | # Households | % Households |
| Less than $10,000 | 26 | 21.5% |
| $10,000 to $14,999 | 27 | 22.3% |
| $15,000 to $24,999 | 9 | 7.4% |
| $25,000 to $34,999 | 13 | 10.7% |
| $35,000 to $49,999 | 8 | 6.6% |
| $50,000 to $74,999 | 29 | 24.0% |
| $75,000 to $99,999 | 9 | 7.4% |
| $100,000 to $149,999 | 0 | 0.0% |
| $150,000 to $199,999 | 0 | 0.0% |
| $200,000+ | 0 | 0.0% |
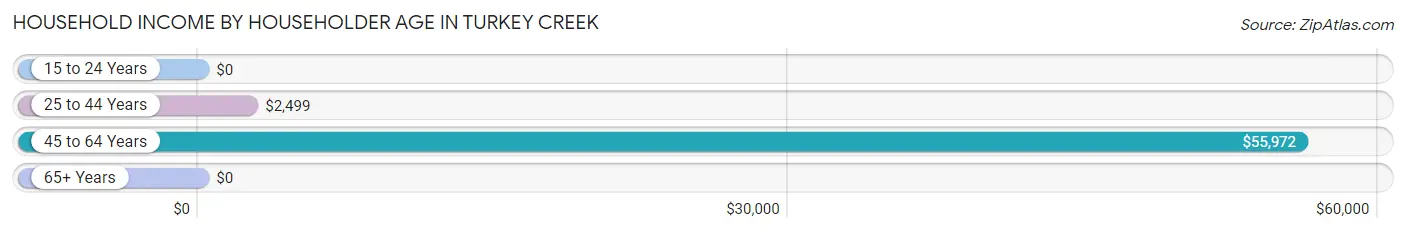
Household Income by Householder Age in Turkey Creek
The median household income in Turkey Creek is $24,583, with the highest median household income of $55,972 found in the 45 to 64 years age bracket for the primary householder. A total of 53 households (43.8%) fall into this category.
| Income Bracket | # Households | Median Income |
| 15 to 24 Years | 0 (0.0%) | $0 |
| 25 to 44 Years | 51 (42.1%) | $2,499 |
| 45 to 64 Years | 53 (43.8%) | $55,972 |
| 65+ Years | 17 (14.1%) | $0 |
| Total | 121 (100.0%) | $24,583 |
Poverty in Turkey Creek
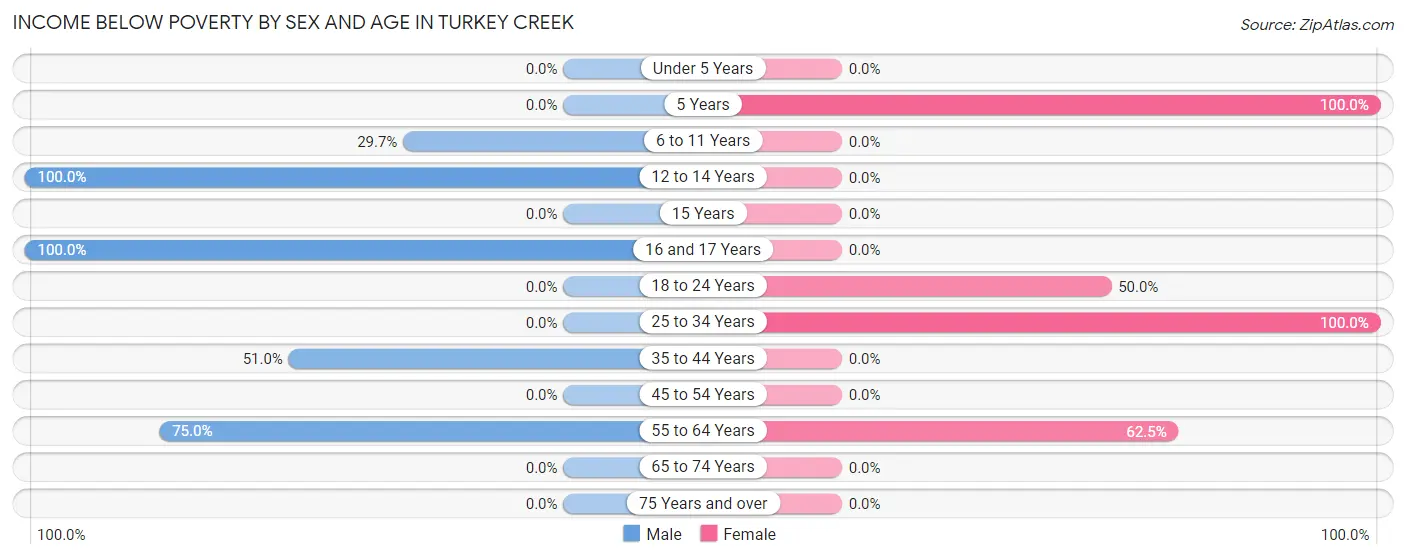
Income Below Poverty by Sex and Age in Turkey Creek
With 33.3% poverty level for males and 35.9% for females among the residents of Turkey Creek, 12 to 14 year old males and 5 year old females are the most vulnerable to poverty, with 20 males (100.0%) and 11 females (100.0%) in their respective age groups living below the poverty level.
| Age Bracket | Male | Female |
| Under 5 Years | 0 (0.0%) | 0 (0.0%) |
| 5 Years | 0 (0.0%) | 11 (100.0%) |
| 6 to 11 Years | 11 (29.7%) | 0 (0.0%) |
| 12 to 14 Years | 20 (100.0%) | 0 (0.0%) |
| 15 Years | 0 (0.0%) | 0 (0.0%) |
| 16 and 17 Years | 10 (100.0%) | 0 (0.0%) |
| 18 to 24 Years | 0 (0.0%) | 28 (50.0%) |
| 25 to 34 Years | 0 (0.0%) | 12 (100.0%) |
| 35 to 44 Years | 26 (51.0%) | 0 (0.0%) |
| 45 to 54 Years | 0 (0.0%) | 0 (0.0%) |
| 55 to 64 Years | 24 (75.0%) | 15 (62.5%) |
| 65 to 74 Years | 0 (0.0%) | 0 (0.0%) |
| 75 Years and over | 0 (0.0%) | 0 (0.0%) |
| Total | 91 (33.3%) | 66 (35.9%) |
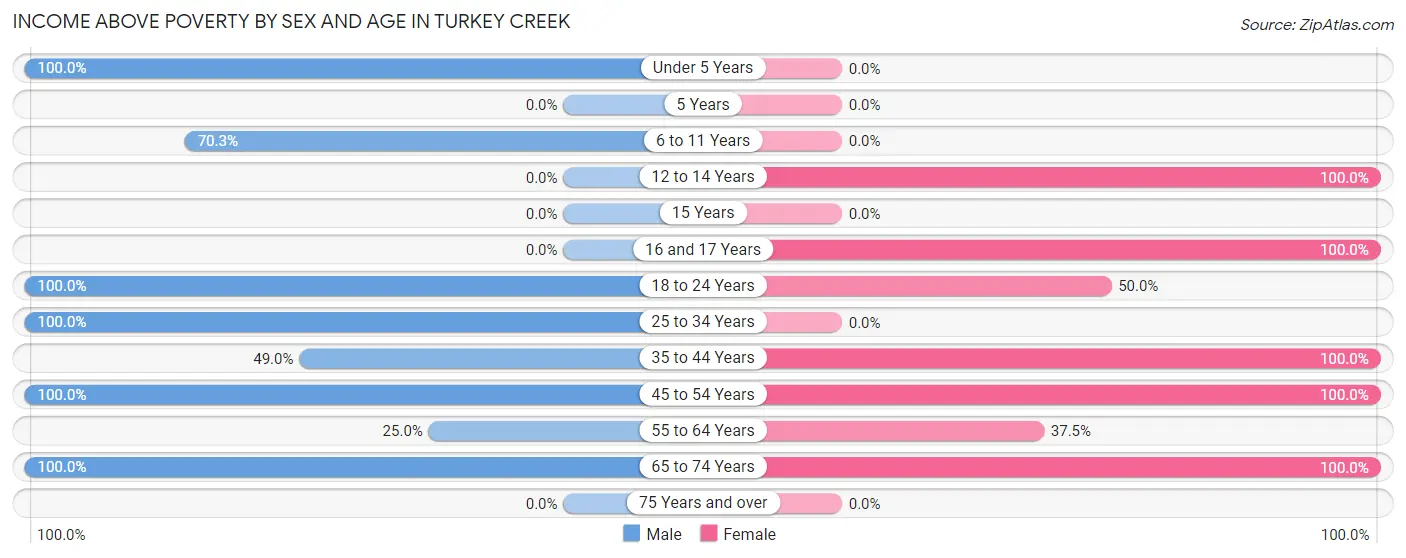
Income Above Poverty by Sex and Age in Turkey Creek
According to the poverty statistics in Turkey Creek, males aged under 5 years and females aged 12 to 14 years are the age groups that are most secure financially, with 100.0% of males and 100.0% of females in these age groups living above the poverty line.
| Age Bracket | Male | Female |
| Under 5 Years | 59 (100.0%) | 0 (0.0%) |
| 5 Years | 0 (0.0%) | 0 (0.0%) |
| 6 to 11 Years | 26 (70.3%) | 0 (0.0%) |
| 12 to 14 Years | 0 (0.0%) | 11 (100.0%) |
| 15 Years | 0 (0.0%) | 0 (0.0%) |
| 16 and 17 Years | 0 (0.0%) | 17 (100.0%) |
| 18 to 24 Years | 10 (100.0%) | 28 (50.0%) |
| 25 to 34 Years | 21 (100.0%) | 0 (0.0%) |
| 35 to 44 Years | 25 (49.0%) | 25 (100.0%) |
| 45 to 54 Years | 15 (100.0%) | 20 (100.0%) |
| 55 to 64 Years | 8 (25.0%) | 9 (37.5%) |
| 65 to 74 Years | 18 (100.0%) | 8 (100.0%) |
| 75 Years and over | 0 (0.0%) | 0 (0.0%) |
| Total | 182 (66.7%) | 118 (64.1%) |
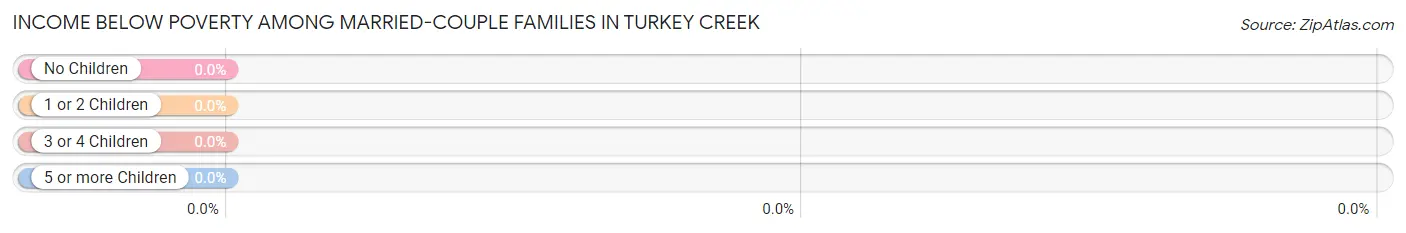
Income Below Poverty Among Married-Couple Families in Turkey Creek
| Children | Above Poverty | Below Poverty |
| No Children | 16 (100.0%) | 0 (0.0%) |
| 1 or 2 Children | 9 (100.0%) | 0 (0.0%) |
| 3 or 4 Children | 0 (0.0%) | 0 (0.0%) |
| 5 or more Children | 0 (0.0%) | 0 (0.0%) |
| Total | 25 (100.0%) | 0 (0.0%) |
Income Below Poverty Among Single-Parent Households in Turkey Creek
According to the poverty data in Turkey Creek, 51.8% or 14 single-father households and 36.4% or 12 single-mother households are living below the poverty line. Among single-father households, those with 3 or 4 children have the highest poverty rate, with 14 households (100.0%) experiencing poverty. Likewise, among single-mother households, those with 1 or 2 children have the highest poverty rate, with 12 households (36.4%) falling below the poverty line.
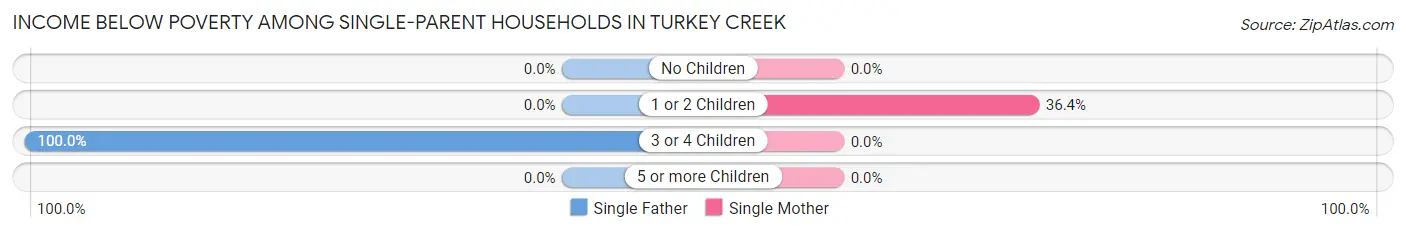
| Children | Single Father | Single Mother |
| No Children | 0 (0.0%) | 0 (0.0%) |
| 1 or 2 Children | 0 (0.0%) | 12 (36.4%) |
| 3 or 4 Children | 14 (100.0%) | 0 (0.0%) |
| 5 or more Children | 0 (0.0%) | 0 (0.0%) |
| Total | 14 (51.8%) | 12 (36.4%) |
Income Below Poverty Among Married-Couple vs Single-Parent Households in Turkey Creek
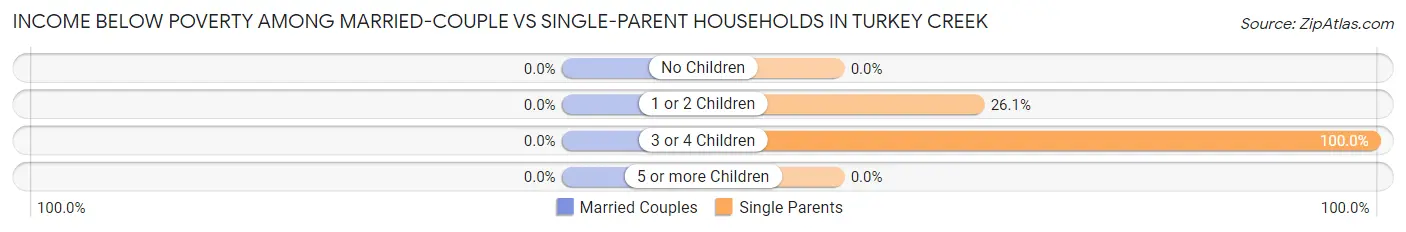
| Children | Married-Couple Families | Single-Parent Households |
| No Children | 0 (0.0%) | 0 (0.0%) |
| 1 or 2 Children | 0 (0.0%) | 12 (26.1%) |
| 3 or 4 Children | 0 (0.0%) | 14 (100.0%) |
| 5 or more Children | 0 (0.0%) | 0 (0.0%) |
| Total | 0 (0.0%) | 26 (43.3%) |
Race in Turkey Creek
The most populous races in Turkey Creek are Native / Alaskan (342 | 74.8%), White / Caucasian (59 | 12.9%), and Two or more Races (43 | 9.4%).
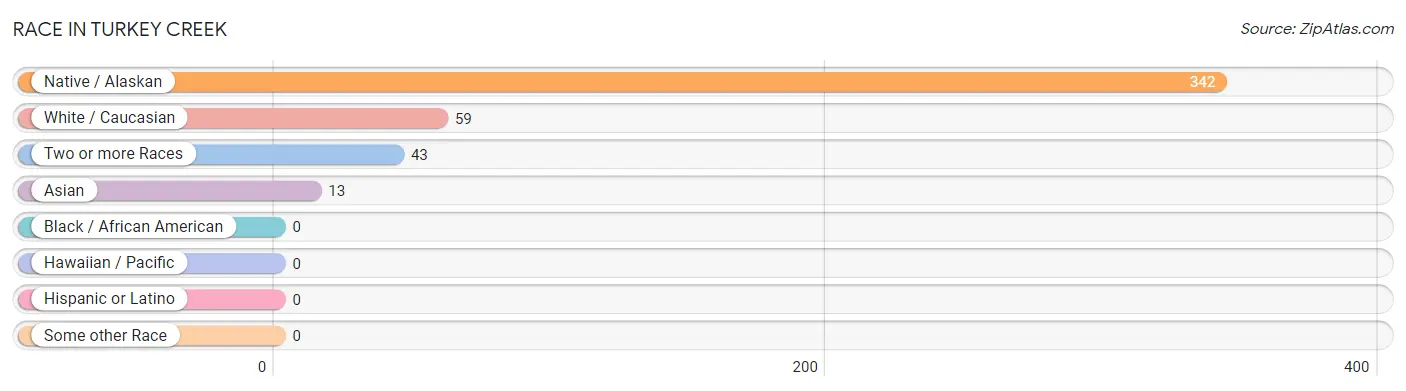
| Race | # Population | % Population |
| Asian | 13 | 2.8% |
| Black / African American | 0 | 0.0% |
| Hawaiian / Pacific | 0 | 0.0% |
| Hispanic or Latino | 0 | 0.0% |
| Native / Alaskan | 342 | 74.8% |
| White / Caucasian | 59 | 12.9% |
| Two or more Races | 43 | 9.4% |
| Some other Race | 0 | 0.0% |
| Total | 457 | 100.0% |
Ancestry in Turkey Creek
The most populous ancestries reported in Turkey Creek are Apache (296 | 64.8%), Sri Lankan (56 | 12.2%), Indian (Asian) (47 | 10.3%), German (26 | 5.7%), and Pueblo (15 | 3.3%), together accounting for 96.3% of all Turkey Creek residents.
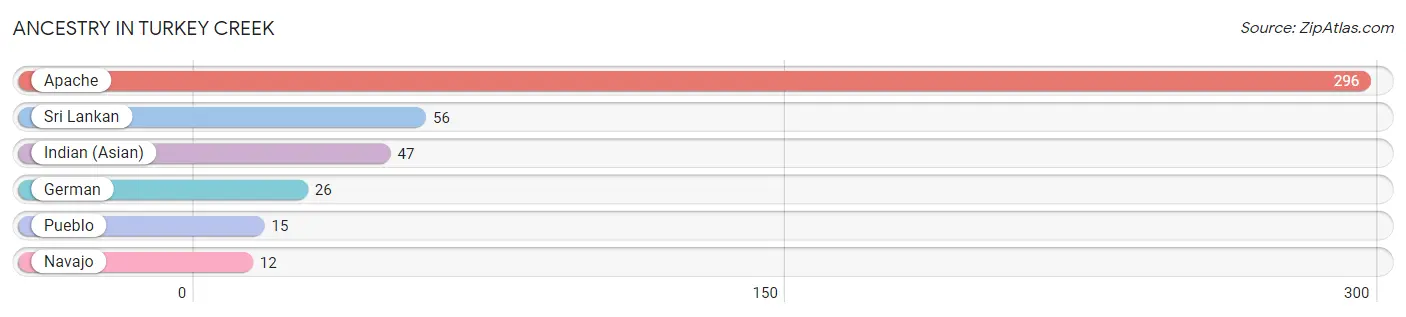
| Ancestry | # Population | % Population |
| Apache | 296 | 64.8% |
| German | 26 | 5.7% |
| Indian (Asian) | 47 | 10.3% |
| Navajo | 12 | 2.6% |
| Pueblo | 15 | 3.3% |
| Sri Lankan | 56 | 12.2% | View All 6 Rows |
Immigrants in Turkey Creek
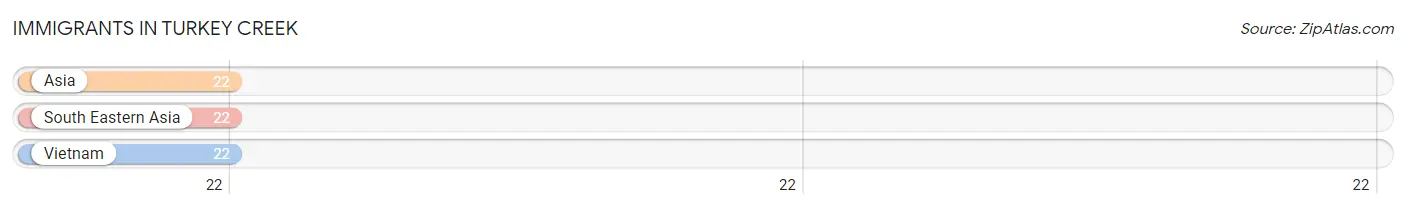
The most numerous immigrant groups reported in Turkey Creek came from Asia (22 | 4.8%), South Eastern Asia (22 | 4.8%), and Vietnam (22 | 4.8%), together accounting for 14.4% of all Turkey Creek residents.
| Immigration Origin | # Population | % Population |
| Asia | 22 | 4.8% |
| South Eastern Asia | 22 | 4.8% |
| Vietnam | 22 | 4.8% | View All 3 Rows |
Sex and Age in Turkey Creek
Sex and Age in Turkey Creek
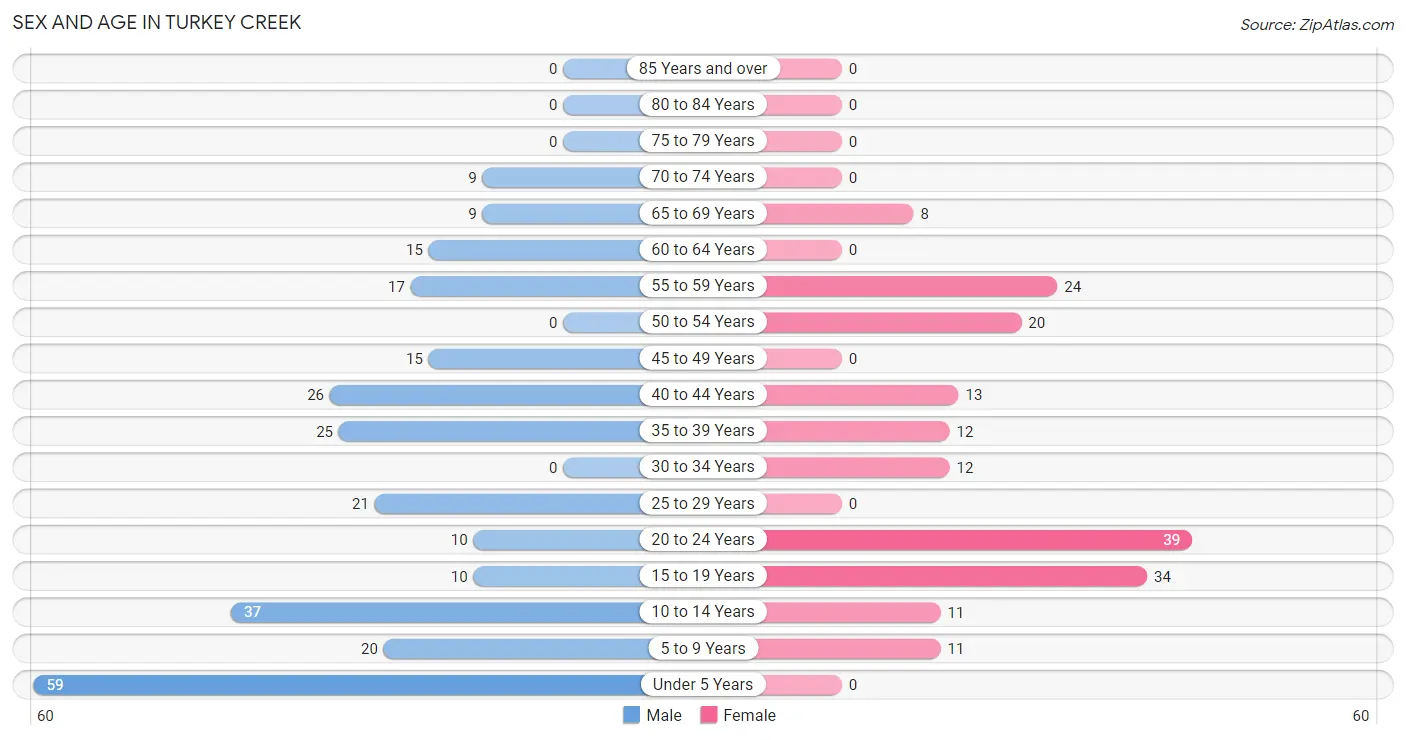
The most populous age groups in Turkey Creek are Under 5 Years (59 | 21.6%) for men and 20 to 24 Years (39 | 21.2%) for women.
| Age Bracket | Male | Female |
| Under 5 Years | 59 (21.6%) | 0 (0.0%) |
| 5 to 9 Years | 20 (7.3%) | 11 (6.0%) |
| 10 to 14 Years | 37 (13.6%) | 11 (6.0%) |
| 15 to 19 Years | 10 (3.7%) | 34 (18.5%) |
| 20 to 24 Years | 10 (3.7%) | 39 (21.2%) |
| 25 to 29 Years | 21 (7.7%) | 0 (0.0%) |
| 30 to 34 Years | 0 (0.0%) | 12 (6.5%) |
| 35 to 39 Years | 25 (9.2%) | 12 (6.5%) |
| 40 to 44 Years | 26 (9.5%) | 13 (7.1%) |
| 45 to 49 Years | 15 (5.5%) | 0 (0.0%) |
| 50 to 54 Years | 0 (0.0%) | 20 (10.9%) |
| 55 to 59 Years | 17 (6.2%) | 24 (13.0%) |
| 60 to 64 Years | 15 (5.5%) | 0 (0.0%) |
| 65 to 69 Years | 9 (3.3%) | 8 (4.3%) |
| 70 to 74 Years | 9 (3.3%) | 0 (0.0%) |
| 75 to 79 Years | 0 (0.0%) | 0 (0.0%) |
| 80 to 84 Years | 0 (0.0%) | 0 (0.0%) |
| 85 Years and over | 0 (0.0%) | 0 (0.0%) |
| Total | 273 (100.0%) | 184 (100.0%) |
Families and Households in Turkey Creek
Median Family Size in Turkey Creek
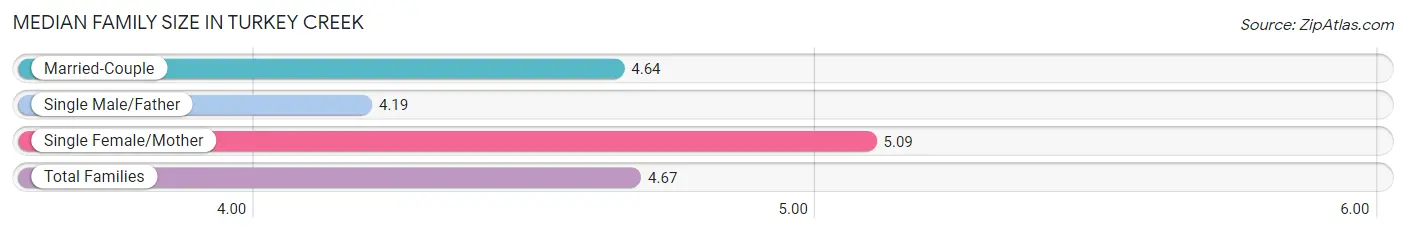
The median family size in Turkey Creek is 4.67 persons per family, with single female/mother families (33 | 38.8%) accounting for the largest median family size of 5.09 persons per family. On the other hand, single male/father families (27 | 31.8%) represent the smallest median family size with 4.19 persons per family.
| Family Type | # Families | Family Size |
| Married-Couple | 25 (29.4%) | 4.64 |
| Single Male/Father | 27 (31.8%) | 4.19 |
| Single Female/Mother | 33 (38.8%) | 5.09 |
| Total Families | 85 (100.0%) | 4.67 |
Median Household Size in Turkey Creek
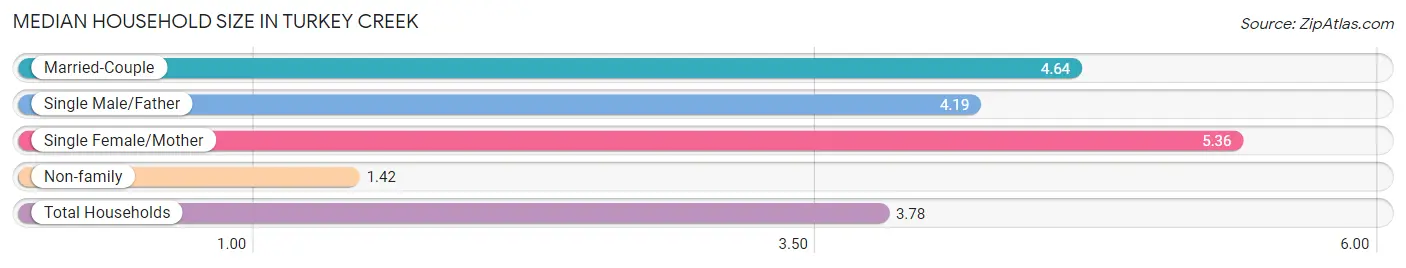
The median household size in Turkey Creek is 3.78 persons per household, with single female/mother households (33 | 27.3%) accounting for the largest median household size of 5.36 persons per household. non-family households (36 | 29.7%) represent the smallest median household size with 1.42 persons per household.
| Household Type | # Households | Household Size |
| Married-Couple | 25 (20.7%) | 4.64 |
| Single Male/Father | 27 (22.3%) | 4.19 |
| Single Female/Mother | 33 (27.3%) | 5.36 |
| Non-family | 36 (29.7%) | 1.42 |
| Total Households | 121 (100.0%) | 3.78 |
Household Size by Marriage Status in Turkey Creek
Out of a total of 121 households in Turkey Creek, 85 (70.3%) are family households, while 36 (29.7%) are nonfamily households. The most numerous type of family households are 3-person households, comprising 37, and the most common type of nonfamily households are 1-person households, comprising 21.
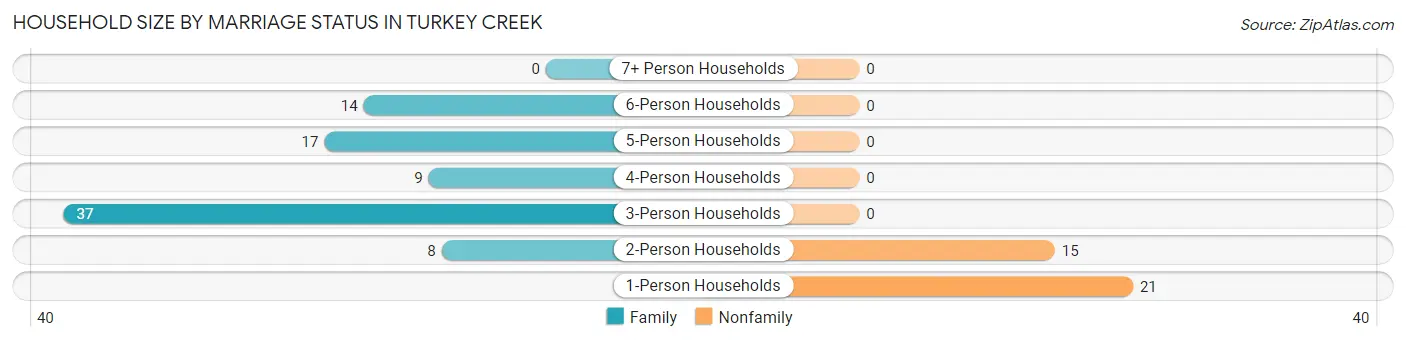
| Household Size | Family Households | Nonfamily Households |
| 1-Person Households | - | 21 (17.4%) |
| 2-Person Households | 8 (6.6%) | 15 (12.4%) |
| 3-Person Households | 37 (30.6%) | 0 (0.0%) |
| 4-Person Households | 9 (7.4%) | 0 (0.0%) |
| 5-Person Households | 17 (14.1%) | 0 (0.0%) |
| 6-Person Households | 14 (11.6%) | 0 (0.0%) |
| 7+ Person Households | 0 (0.0%) | 0 (0.0%) |
| Total | 85 (70.3%) | 36 (29.7%) |
Female Fertility in Turkey Creek
Fertility by Age in Turkey Creek
| Age Bracket | Women with Births | Births / 1,000 Women |
| 15 to 19 years | 0 (0.0%) | 0.0 |
| 20 to 34 years | 0 (0.0%) | 0.0 |
| 35 to 50 years | 0 (0.0%) | 0.0 |
| Total | 0 (0.0%) | 0.0 |
Fertility by Age by Marriage Status in Turkey Creek
| Age Bracket | Married | Unmarried |
| 15 to 19 years | 0 (0.0%) | 0 (0.0%) |
| 20 to 34 years | 0 (0.0%) | 0 (0.0%) |
| 35 to 50 years | 0 (0.0%) | 0 (0.0%) |
| Total | 0 (0.0%) | 0 (0.0%) |
Fertility by Education in Turkey Creek
| Educational Attainment | Women with Births | Births / 1,000 Women |
| Less than High School | 0 (0.0%) | 0.0 |
| High School Diploma | 0 (0.0%) | 0.0 |
| College or Associate's Degree | 0 (0.0%) | 0.0 |
| Bachelor's Degree | 0 (0.0%) | 0.0 |
| Graduate Degree | 0 (0.0%) | 0.0 |
| Total | 0 (0.0%) | 0.0 |
Fertility by Education by Marriage Status in Turkey Creek
| Educational Attainment | Married | Unmarried |
| Less than High School | 0 (0.0%) | 0 (0.0%) |
| High School Diploma | 0 (0.0%) | 0 (0.0%) |
| College or Associate's Degree | 0 (0.0%) | 0 (0.0%) |
| Bachelor's Degree | 0 (0.0%) | 0 (0.0%) |
| Graduate Degree | 0 (0.0%) | 0 (0.0%) |
| Total | 0 (0.0%) | 0 (0.0%) |
Employment Characteristics in Turkey Creek
Employment by Class of Employer in Turkey Creek
Among the 106 employed individuals in Turkey Creek, state government employees (37 | 34.9%), private company employees (25 | 23.6%), and self-employed (not incorporated) (22 | 20.7%) make up the most common classes of employment.
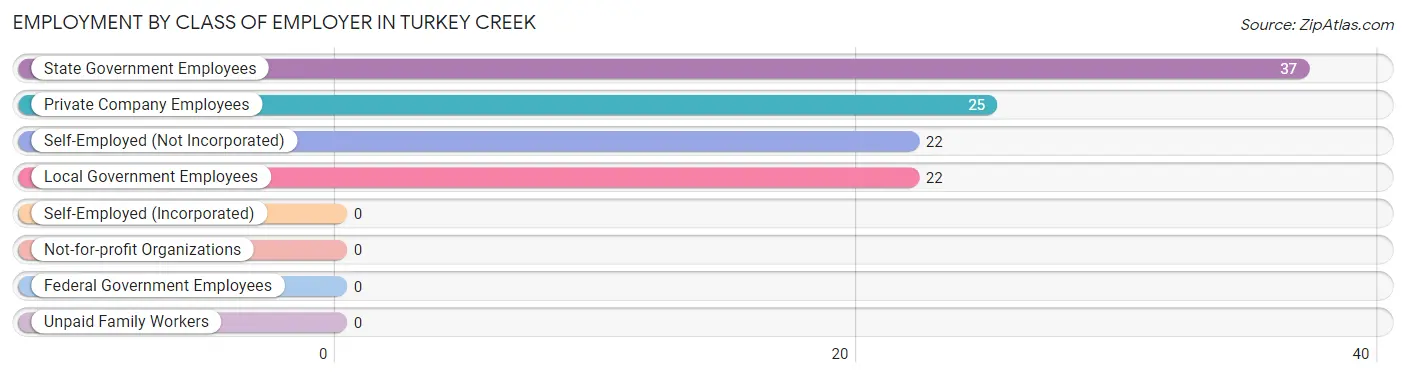
| Employer Class | # Employees | % Employees |
| Private Company Employees | 25 | 23.6% |
| Self-Employed (Incorporated) | 0 | 0.0% |
| Self-Employed (Not Incorporated) | 22 | 20.7% |
| Not-for-profit Organizations | 0 | 0.0% |
| Local Government Employees | 22 | 20.7% |
| State Government Employees | 37 | 34.9% |
| Federal Government Employees | 0 | 0.0% |
| Unpaid Family Workers | 0 | 0.0% |
| Total | 106 | 100.0% |
Employment Status by Age in Turkey Creek
According to the labor force statistics for Turkey Creek, out of the total population over 16 years of age (319), 37.0% or 118 individuals are in the labor force, with 10.2% or 12 of them unemployed. The age group with the highest labor force participation rate is 30 to 34 years, with 100.0% or 12 individuals in the labor force. Within the labor force, the 35 to 44 years age range has the highest percentage of unemployed individuals, with 24.0% or 12 of them being unemployed.
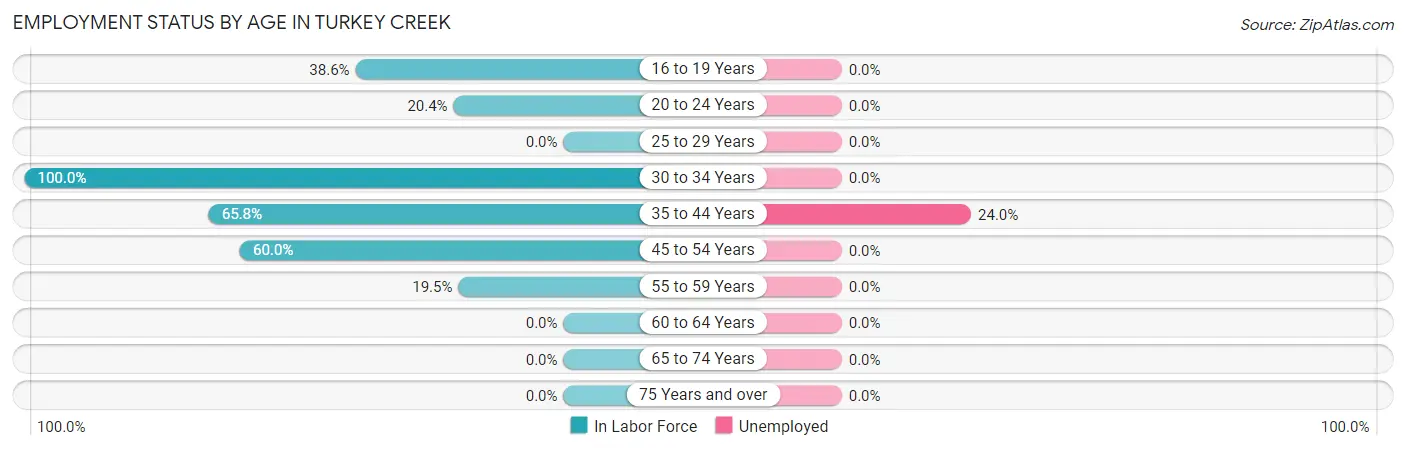
| Age Bracket | In Labor Force | Unemployed |
| 16 to 19 Years | 17 (38.6%) | 0 (0.0%) |
| 20 to 24 Years | 10 (20.4%) | 0 (0.0%) |
| 25 to 29 Years | 0 (0.0%) | 0 (0.0%) |
| 30 to 34 Years | 12 (100.0%) | 0 (0.0%) |
| 35 to 44 Years | 50 (65.8%) | 12 (24.0%) |
| 45 to 54 Years | 21 (60.0%) | 0 (0.0%) |
| 55 to 59 Years | 8 (19.5%) | 0 (0.0%) |
| 60 to 64 Years | 0 (0.0%) | 0 (0.0%) |
| 65 to 74 Years | 0 (0.0%) | 0 (0.0%) |
| 75 Years and over | 0 (0.0%) | 0 (0.0%) |
| Total | 118 (37.0%) | 12 (10.2%) |
Employment Status by Educational Attainment in Turkey Creek
According to labor force statistics for Turkey Creek, 45.5% of individuals (91) out of the total population between 25 and 64 years of age (200) are in the labor force, with 13.2% or 12 of them being unemployed. The group with the highest labor force participation rate are those with the educational attainment of bachelor's degree or higher, with 100.0% or 12 individuals in the labor force. Within the labor force, individuals with less than high school education have the highest percentage of unemployment, with 35.3% or 12 of them being unemployed.
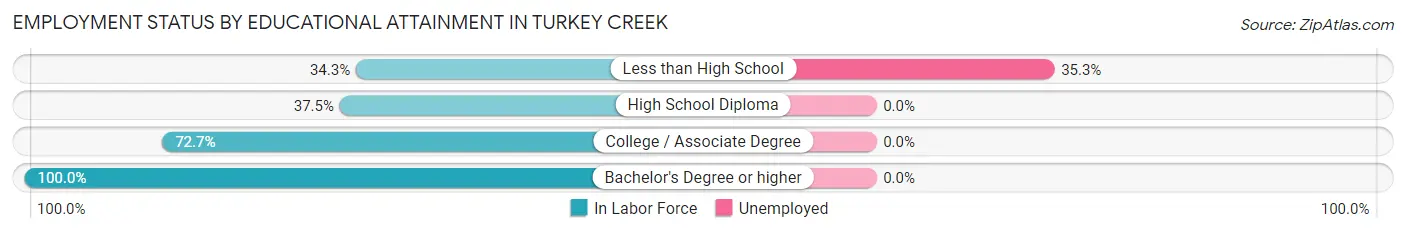
| Educational Attainment | In Labor Force | Unemployed |
| Less than High School | 34 (34.3%) | 35 (35.3%) |
| High School Diploma | 21 (37.5%) | 0 (0.0%) |
| College / Associate Degree | 24 (72.7%) | 0 (0.0%) |
| Bachelor's Degree or higher | 12 (100.0%) | 0 (0.0%) |
| Total | 91 (45.5%) | 26 (13.2%) |
Employment Occupations by Sex in Turkey Creek
Management, Business, Science and Arts Occupations
The most common Management, Business, Science and Arts occupations in Turkey Creek are Community & Social Service (12 | 11.3%), and Education Instruction & Library (12 | 11.3%).
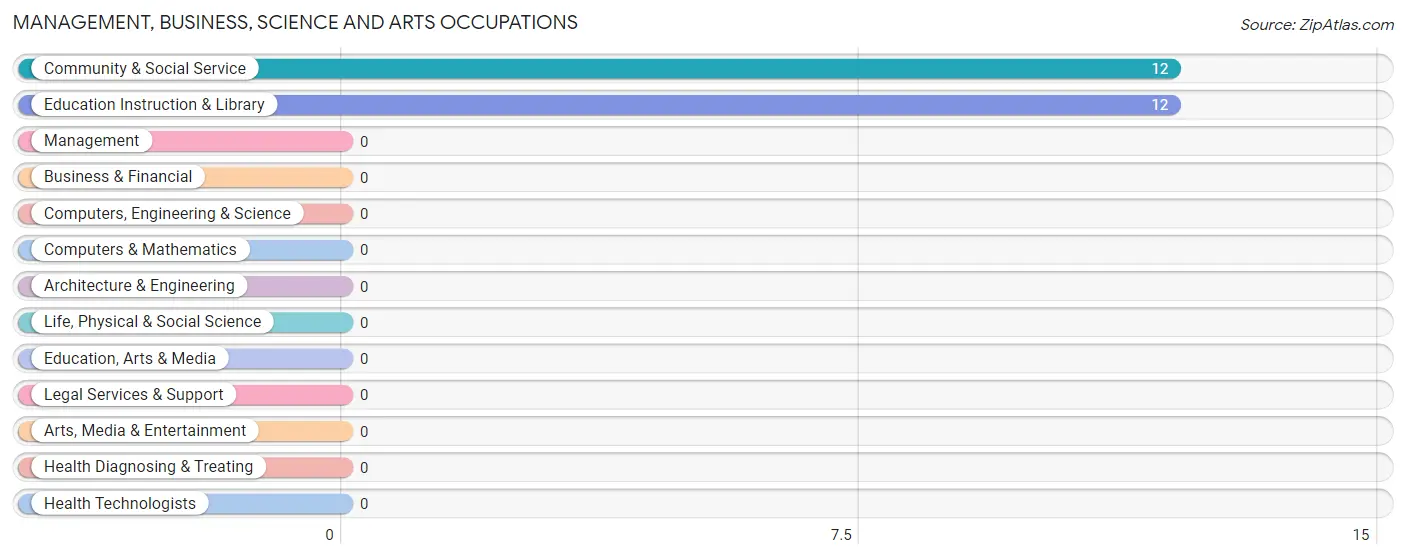
Management, Business, Science and Arts Occupations by Sex
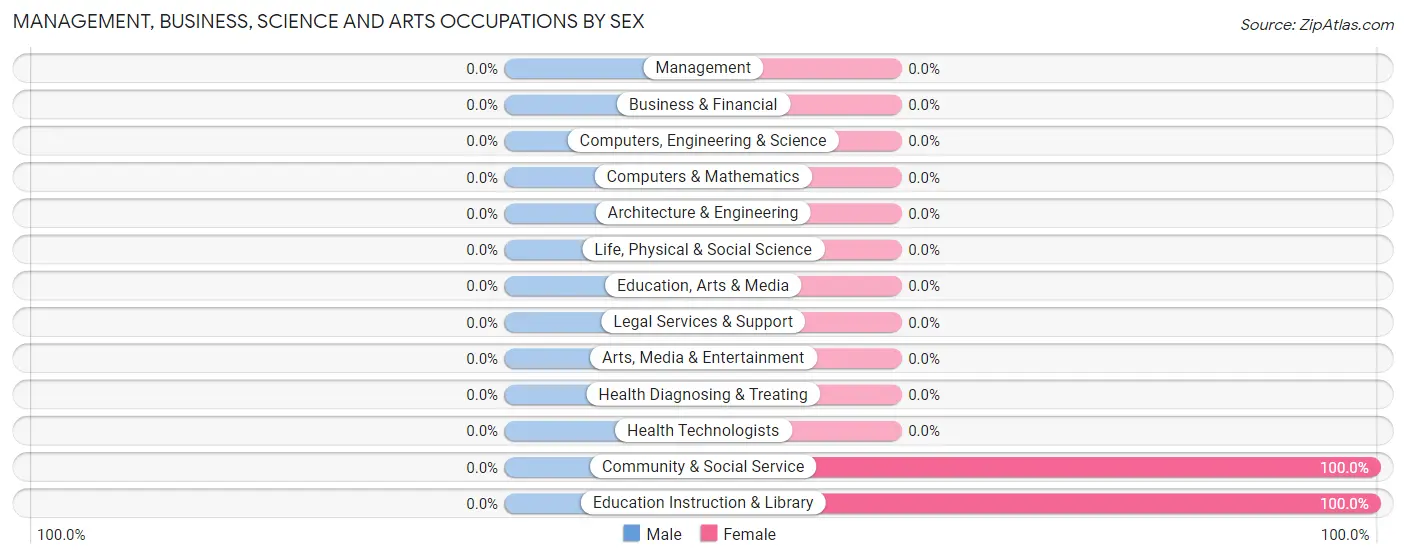
| Occupation | Male | Female |
| Management | 0 (0.0%) | 0 (0.0%) |
| Business & Financial | 0 (0.0%) | 0 (0.0%) |
| Computers, Engineering & Science | 0 (0.0%) | 0 (0.0%) |
| Computers & Mathematics | 0 (0.0%) | 0 (0.0%) |
| Architecture & Engineering | 0 (0.0%) | 0 (0.0%) |
| Life, Physical & Social Science | 0 (0.0%) | 0 (0.0%) |
| Community & Social Service | 0 (0.0%) | 12 (100.0%) |
| Education, Arts & Media | 0 (0.0%) | 0 (0.0%) |
| Legal Services & Support | 0 (0.0%) | 0 (0.0%) |
| Education Instruction & Library | 0 (0.0%) | 12 (100.0%) |
| Arts, Media & Entertainment | 0 (0.0%) | 0 (0.0%) |
| Health Diagnosing & Treating | 0 (0.0%) | 0 (0.0%) |
| Health Technologists | 0 (0.0%) | 0 (0.0%) |
| Total (Category) | 0 (0.0%) | 12 (100.0%) |
| Total (Overall) | 40 (37.7%) | 66 (62.3%) |
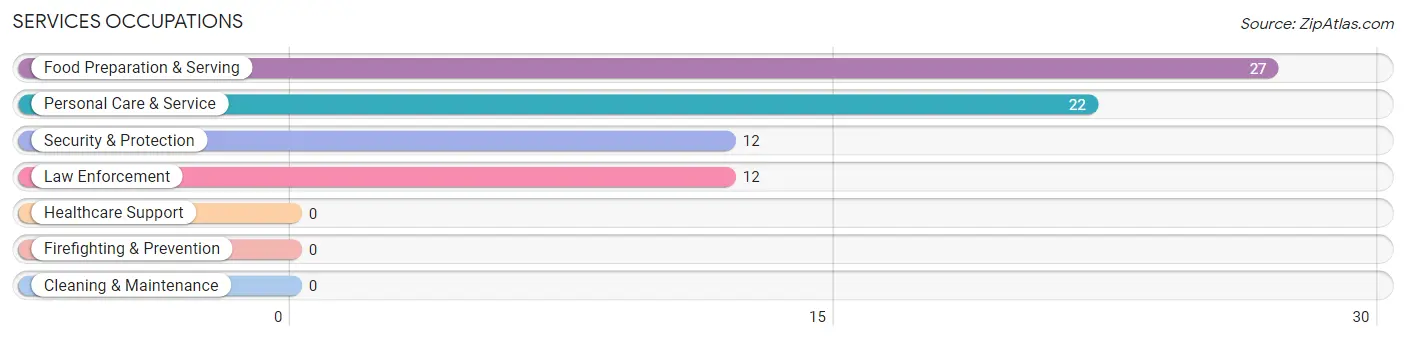
Services Occupations
The most common Services occupations in Turkey Creek are Food Preparation & Serving (27 | 25.5%), Personal Care & Service (22 | 20.7%), Security & Protection (12 | 11.3%), and Law Enforcement (12 | 11.3%).
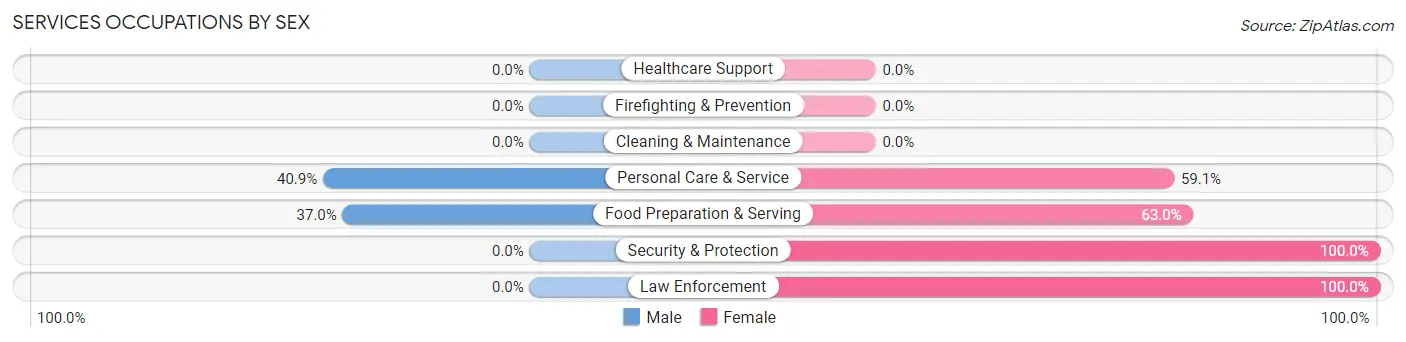
Services Occupations by Sex
Within the Services occupations in Turkey Creek, the most male-oriented occupations are Personal Care & Service (40.9%), and Food Preparation & Serving (37.0%), while the most female-oriented occupations are Security & Protection (100.0%), Law Enforcement (100.0%), and Food Preparation & Serving (63.0%).
| Occupation | Male | Female |
| Healthcare Support | 0 (0.0%) | 0 (0.0%) |
| Security & Protection | 0 (0.0%) | 12 (100.0%) |
| Firefighting & Prevention | 0 (0.0%) | 0 (0.0%) |
| Law Enforcement | 0 (0.0%) | 12 (100.0%) |
| Food Preparation & Serving | 10 (37.0%) | 17 (63.0%) |
| Cleaning & Maintenance | 0 (0.0%) | 0 (0.0%) |
| Personal Care & Service | 9 (40.9%) | 13 (59.1%) |
| Total (Category) | 19 (31.1%) | 42 (68.9%) |
| Total (Overall) | 40 (37.7%) | 66 (62.3%) |
Sales and Office Occupations
The most common Sales and Office occupations in Turkey Creek are , and Office & Administration (25 | 23.6%).

Sales and Office Occupations by Sex

| Occupation | Male | Female |
| Sales & Related | 0 (0.0%) | 0 (0.0%) |
| Office & Administration | 13 (52.0%) | 12 (48.0%) |
| Total (Category) | 13 (52.0%) | 12 (48.0%) |
| Total (Overall) | 40 (37.7%) | 66 (62.3%) |
Natural Resources, Construction and Maintenance Occupations
Natural Resources, Construction and Maintenance Occupations by Sex
| Occupation | Male | Female |
| Farming, Fishing & Forestry | 0 (0.0%) | 0 (0.0%) |
| Construction & Extraction | 0 (0.0%) | 0 (0.0%) |
| Installation, Maintenance & Repair | 0 (0.0%) | 0 (0.0%) |
| Total (Category) | 0 (0.0%) | 0 (0.0%) |
| Total (Overall) | 40 (37.7%) | 66 (62.3%) |
Production, Transportation and Moving Occupations
The most common Production, Transportation and Moving occupations in Turkey Creek are , and Production (8 | 7.5%).
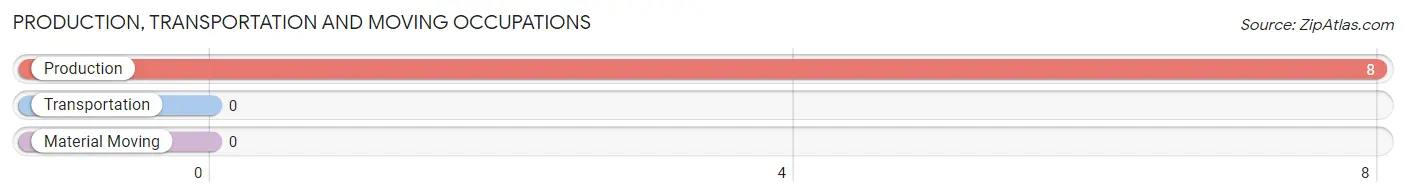
Production, Transportation and Moving Occupations by Sex
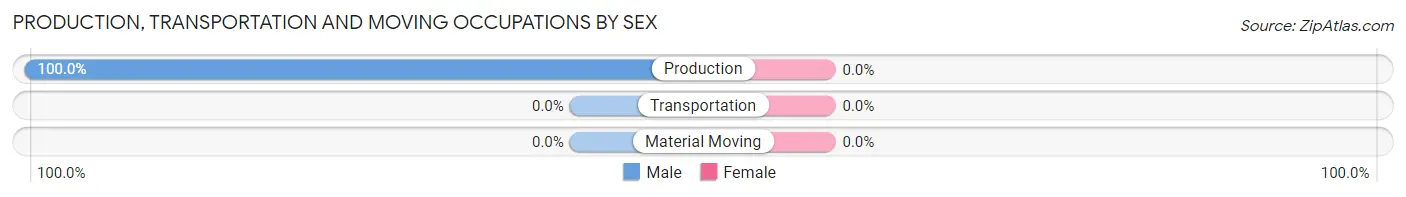
| Occupation | Male | Female |
| Production | 8 (100.0%) | 0 (0.0%) |
| Transportation | 0 (0.0%) | 0 (0.0%) |
| Material Moving | 0 (0.0%) | 0 (0.0%) |
| Total (Category) | 8 (100.0%) | 0 (0.0%) |
| Total (Overall) | 40 (37.7%) | 66 (62.3%) |
Employment Industries by Sex in Turkey Creek
Employment Industries in Turkey Creek
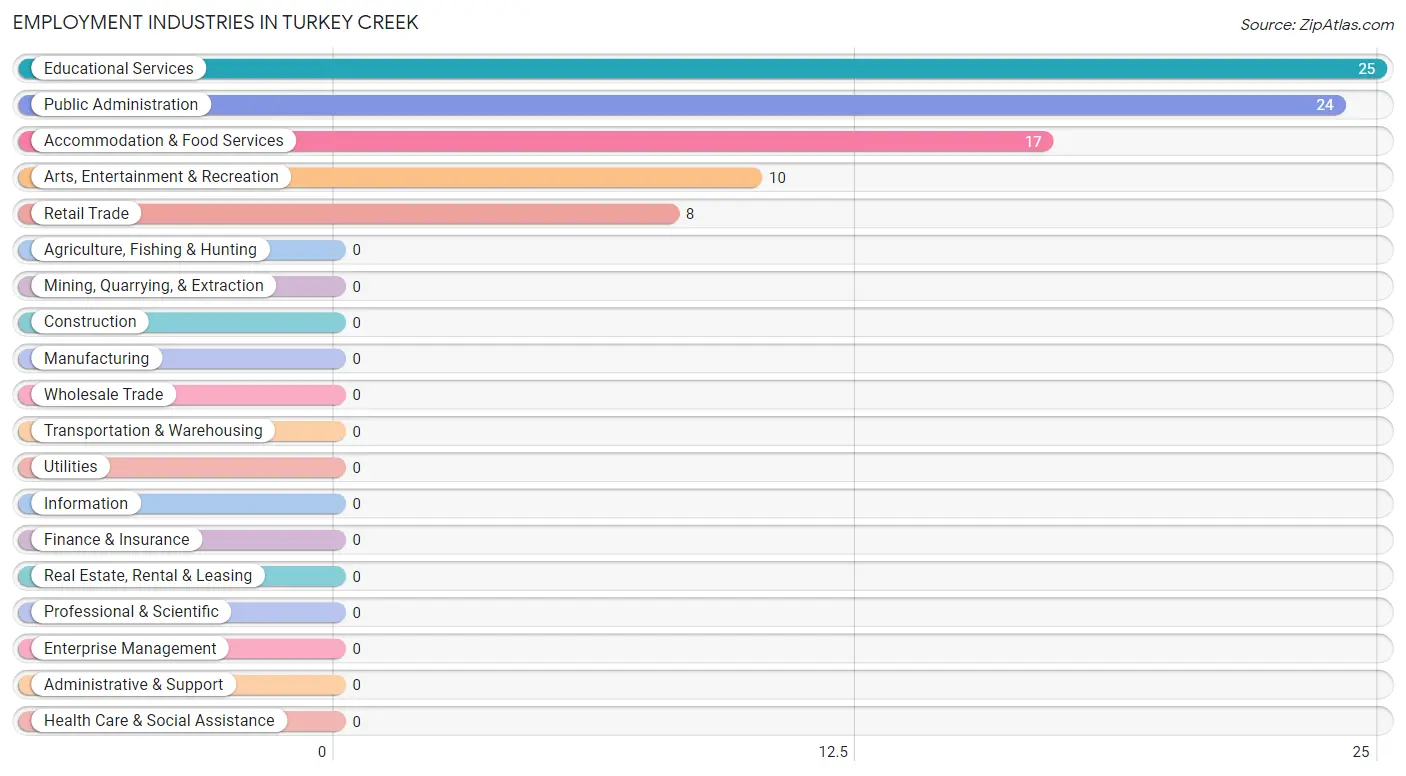
The major employment industries in Turkey Creek include Educational Services (25 | 23.6%), Public Administration (24 | 22.6%), Accommodation & Food Services (17 | 16.0%), Arts, Entertainment & Recreation (10 | 9.4%), and Retail Trade (8 | 7.5%).
Employment Industries by Sex in Turkey Creek
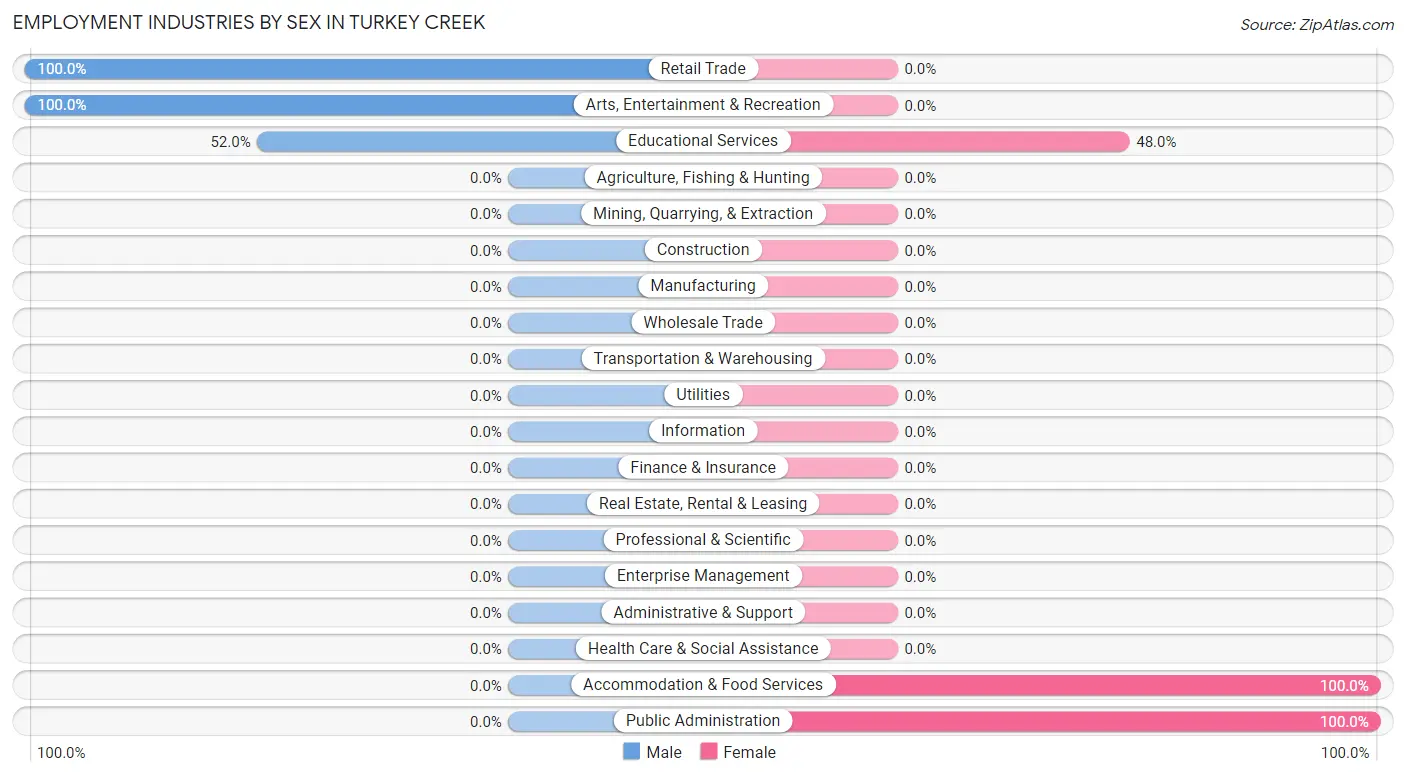
The Turkey Creek industries that see more men than women are Retail Trade (100.0%), Arts, Entertainment & Recreation (100.0%), and Educational Services (52.0%), whereas the industries that tend to have a higher number of women are Accommodation & Food Services (100.0%), Public Administration (100.0%), and Educational Services (48.0%).
| Industry | Male | Female |
| Agriculture, Fishing & Hunting | 0 (0.0%) | 0 (0.0%) |
| Mining, Quarrying, & Extraction | 0 (0.0%) | 0 (0.0%) |
| Construction | 0 (0.0%) | 0 (0.0%) |
| Manufacturing | 0 (0.0%) | 0 (0.0%) |
| Wholesale Trade | 0 (0.0%) | 0 (0.0%) |
| Retail Trade | 8 (100.0%) | 0 (0.0%) |
| Transportation & Warehousing | 0 (0.0%) | 0 (0.0%) |
| Utilities | 0 (0.0%) | 0 (0.0%) |
| Information | 0 (0.0%) | 0 (0.0%) |
| Finance & Insurance | 0 (0.0%) | 0 (0.0%) |
| Real Estate, Rental & Leasing | 0 (0.0%) | 0 (0.0%) |
| Professional & Scientific | 0 (0.0%) | 0 (0.0%) |
| Enterprise Management | 0 (0.0%) | 0 (0.0%) |
| Administrative & Support | 0 (0.0%) | 0 (0.0%) |
| Educational Services | 13 (52.0%) | 12 (48.0%) |
| Health Care & Social Assistance | 0 (0.0%) | 0 (0.0%) |
| Arts, Entertainment & Recreation | 10 (100.0%) | 0 (0.0%) |
| Accommodation & Food Services | 0 (0.0%) | 17 (100.0%) |
| Public Administration | 0 (0.0%) | 24 (100.0%) |
| Total | 40 (37.7%) | 66 (62.3%) |
Education in Turkey Creek
School Enrollment in Turkey Creek
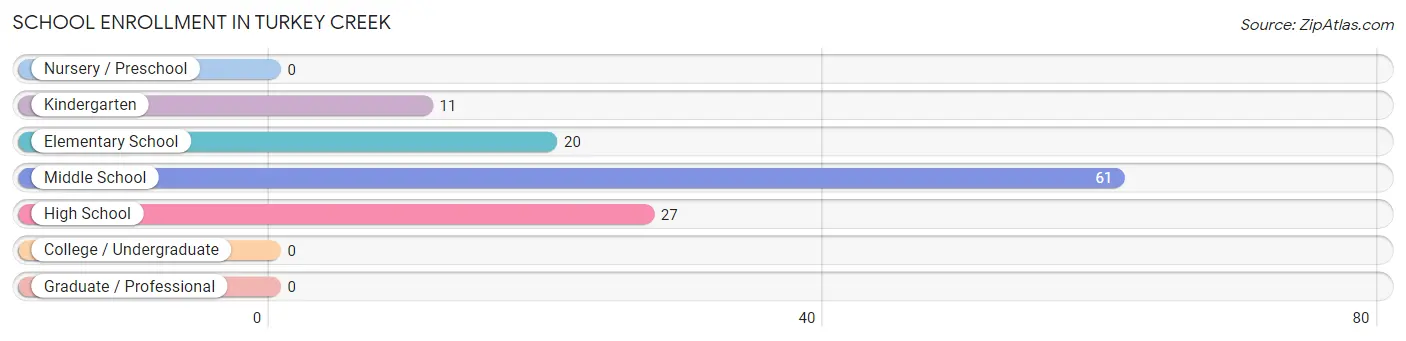
The most common levels of schooling among the 119 students in Turkey Creek are middle school (61 | 51.3%), high school (27 | 22.7%), and elementary school (20 | 16.8%).
| School Level | # Students | % Students |
| Nursery / Preschool | 0 | 0.0% |
| Kindergarten | 11 | 9.2% |
| Elementary School | 20 | 16.8% |
| Middle School | 61 | 51.3% |
| High School | 27 | 22.7% |
| College / Undergraduate | 0 | 0.0% |
| Graduate / Professional | 0 | 0.0% |
| Total | 119 | 100.0% |
School Enrollment by Age by Funding Source in Turkey Creek
| Age Bracket | Public School | Private School |
| 3 to 4 Year Olds | 0 (0.0%) | 0 (0.0%) |
| 5 to 9 Year Old | 31 (100.0%) | 0 (0.0%) |
| 10 to 14 Year Olds | 48 (100.0%) | 0 (0.0%) |
| 15 to 17 Year Olds | 27 (100.0%) | 0 (0.0%) |
| 18 to 19 Year Olds | 0 (0.0%) | 0 (0.0%) |
| 20 to 24 Year Olds | 0 (0.0%) | 0 (0.0%) |
| 25 to 34 Year Olds | 0 (0.0%) | 0 (0.0%) |
| 35 Years and over | 13 (100.0%) | 0 (0.0%) |
| Total | 119 (100.0%) | 0 (0.0%) |
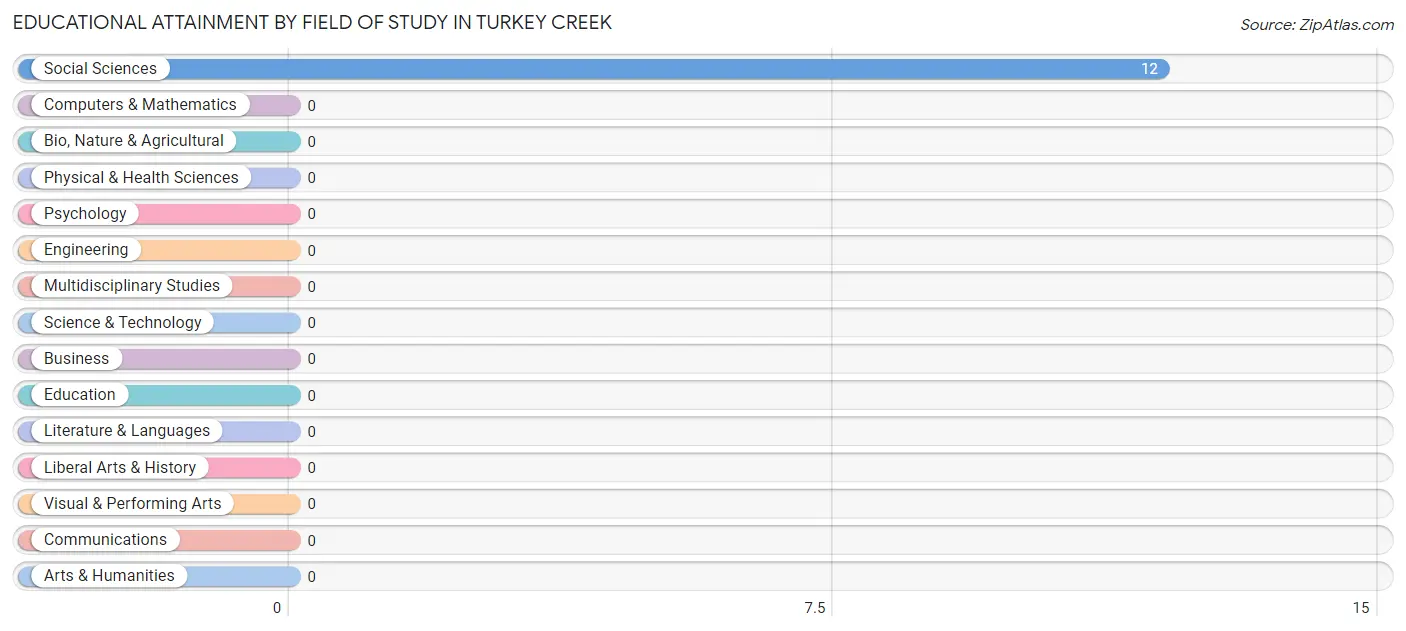
Educational Attainment by Field of Study in Turkey Creek
, and social sciences (12 | 100.0%) are the most common fields of study among 12 individuals in Turkey Creek who have obtained a bachelor's degree or higher.
| Field of Study | # Graduates | % Graduates |
| Computers & Mathematics | 0 | 0.0% |
| Bio, Nature & Agricultural | 0 | 0.0% |
| Physical & Health Sciences | 0 | 0.0% |
| Psychology | 0 | 0.0% |
| Social Sciences | 12 | 100.0% |
| Engineering | 0 | 0.0% |
| Multidisciplinary Studies | 0 | 0.0% |
| Science & Technology | 0 | 0.0% |
| Business | 0 | 0.0% |
| Education | 0 | 0.0% |
| Literature & Languages | 0 | 0.0% |
| Liberal Arts & History | 0 | 0.0% |
| Visual & Performing Arts | 0 | 0.0% |
| Communications | 0 | 0.0% |
| Arts & Humanities | 0 | 0.0% |
| Total | 12 | 100.0% |
Transportation & Commute in Turkey Creek
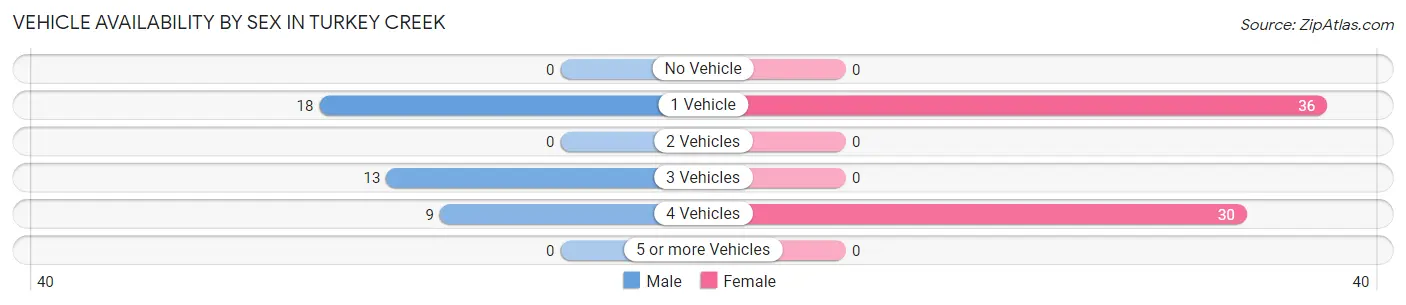
Vehicle Availability by Sex in Turkey Creek
The most prevalent vehicle ownership categories in Turkey Creek are males with 1 vehicle (18, accounting for 45.0%) and females with 1 vehicle (36, making up 27.3%).
| Vehicles Available | Male | Female |
| No Vehicle | 0 (0.0%) | 0 (0.0%) |
| 1 Vehicle | 18 (45.0%) | 36 (54.5%) |
| 2 Vehicles | 0 (0.0%) | 0 (0.0%) |
| 3 Vehicles | 13 (32.5%) | 0 (0.0%) |
| 4 Vehicles | 9 (22.5%) | 30 (45.5%) |
| 5 or more Vehicles | 0 (0.0%) | 0 (0.0%) |
| Total | 40 (100.0%) | 66 (100.0%) |
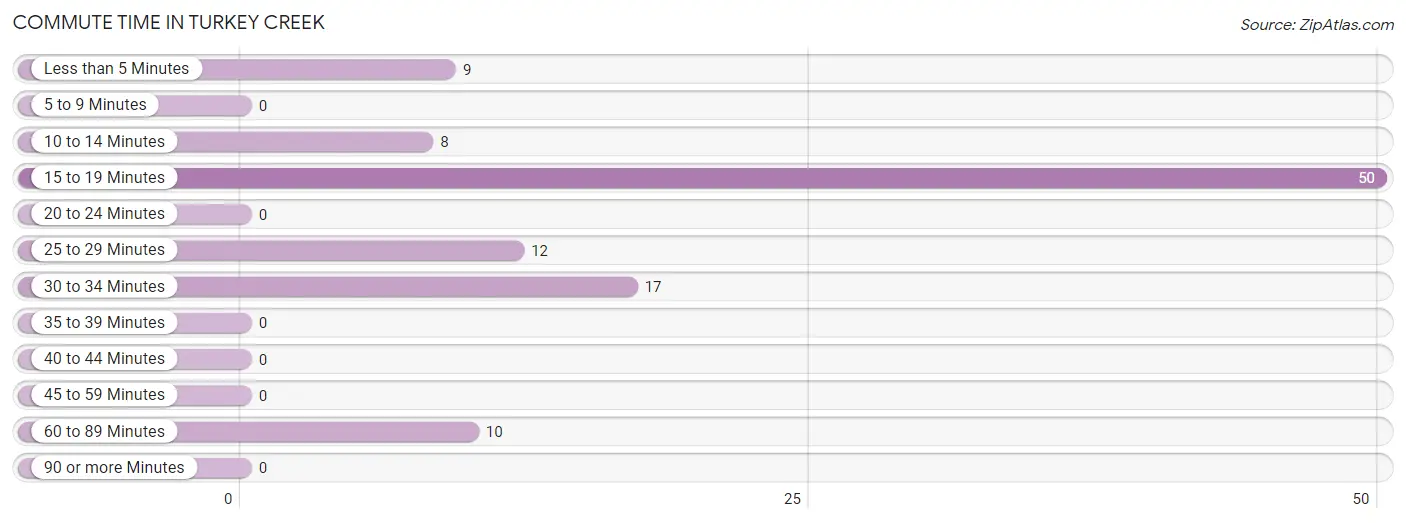
Commute Time in Turkey Creek
The most frequently occuring commute durations in Turkey Creek are 15 to 19 minutes (50 commuters, 47.2%), 30 to 34 minutes (17 commuters, 16.0%), and 25 to 29 minutes (12 commuters, 11.3%).
| Commute Time | # Commuters | % Commuters |
| Less than 5 Minutes | 9 | 8.5% |
| 5 to 9 Minutes | 0 | 0.0% |
| 10 to 14 Minutes | 8 | 7.5% |
| 15 to 19 Minutes | 50 | 47.2% |
| 20 to 24 Minutes | 0 | 0.0% |
| 25 to 29 Minutes | 12 | 11.3% |
| 30 to 34 Minutes | 17 | 16.0% |
| 35 to 39 Minutes | 0 | 0.0% |
| 40 to 44 Minutes | 0 | 0.0% |
| 45 to 59 Minutes | 0 | 0.0% |
| 60 to 89 Minutes | 10 | 9.4% |
| 90 or more Minutes | 0 | 0.0% |
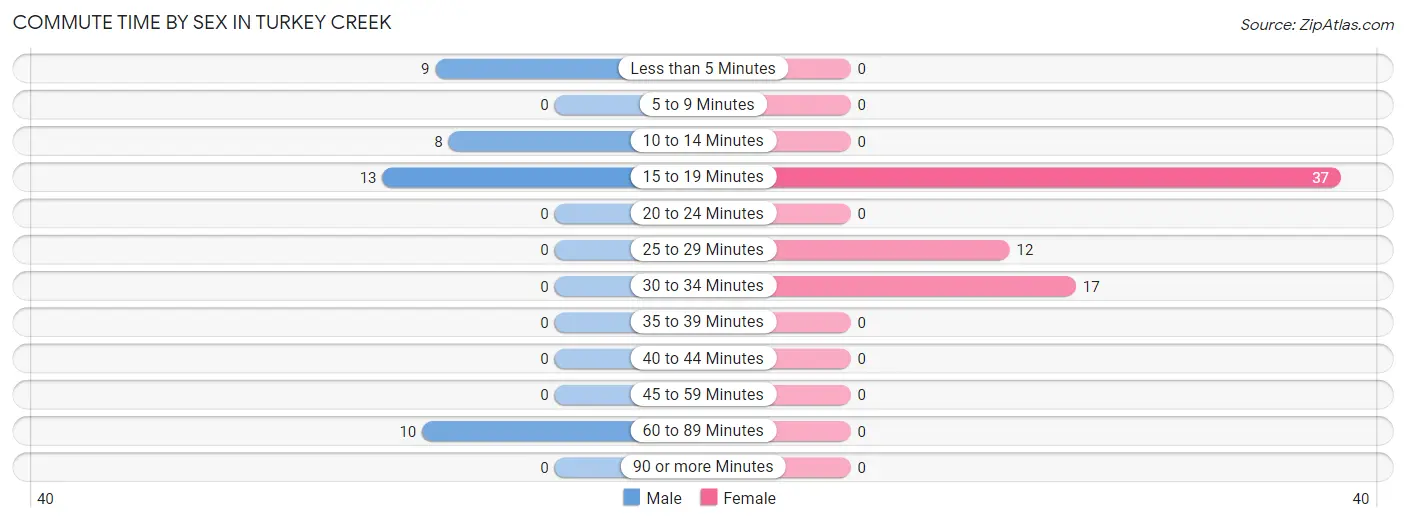
Commute Time by Sex in Turkey Creek
The most common commute times in Turkey Creek are 15 to 19 minutes (13 commuters, 32.5%) for males and 15 to 19 minutes (37 commuters, 56.1%) for females.
| Commute Time | Male | Female |
| Less than 5 Minutes | 9 (22.5%) | 0 (0.0%) |
| 5 to 9 Minutes | 0 (0.0%) | 0 (0.0%) |
| 10 to 14 Minutes | 8 (20.0%) | 0 (0.0%) |
| 15 to 19 Minutes | 13 (32.5%) | 37 (56.1%) |
| 20 to 24 Minutes | 0 (0.0%) | 0 (0.0%) |
| 25 to 29 Minutes | 0 (0.0%) | 12 (18.2%) |
| 30 to 34 Minutes | 0 (0.0%) | 17 (25.8%) |
| 35 to 39 Minutes | 0 (0.0%) | 0 (0.0%) |
| 40 to 44 Minutes | 0 (0.0%) | 0 (0.0%) |
| 45 to 59 Minutes | 0 (0.0%) | 0 (0.0%) |
| 60 to 89 Minutes | 10 (25.0%) | 0 (0.0%) |
| 90 or more Minutes | 0 (0.0%) | 0 (0.0%) |
Time of Departure to Work by Sex in Turkey Creek
The most frequent times of departure to work in Turkey Creek are 6:30 AM to 6:59 AM (17, 42.5%) for males and 7:30 AM to 7:59 AM (42, 63.6%) for females.
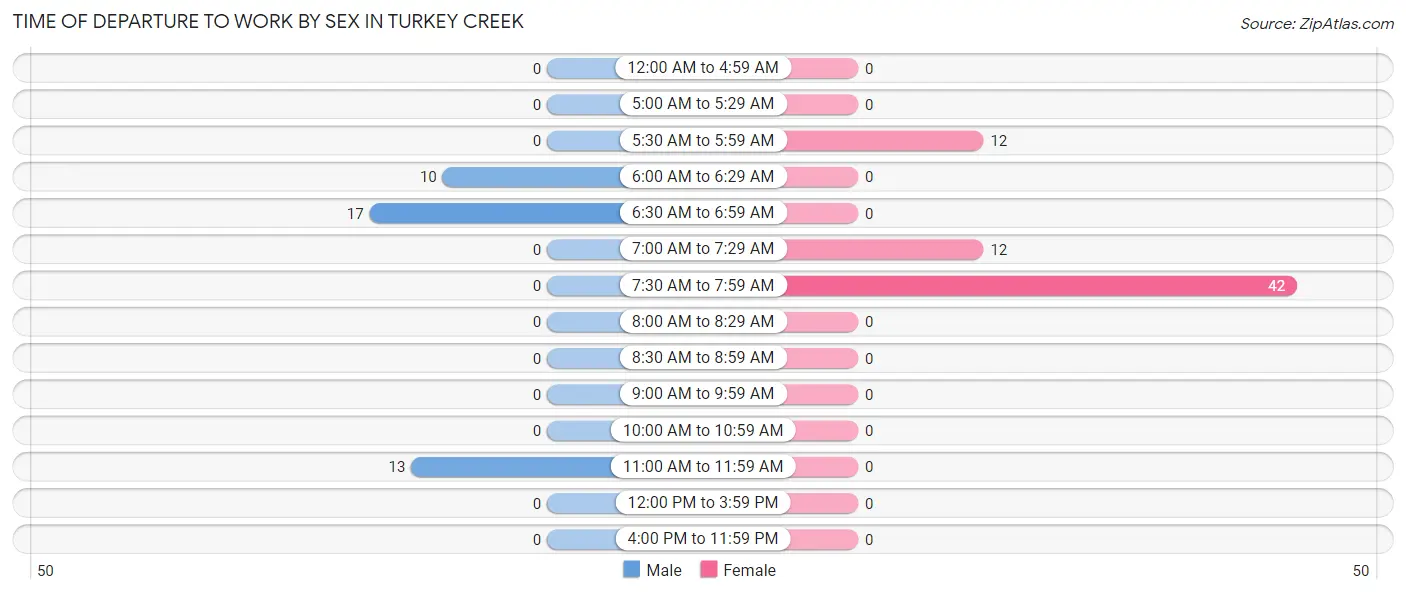
| Time of Departure | Male | Female |
| 12:00 AM to 4:59 AM | 0 (0.0%) | 0 (0.0%) |
| 5:00 AM to 5:29 AM | 0 (0.0%) | 0 (0.0%) |
| 5:30 AM to 5:59 AM | 0 (0.0%) | 12 (18.2%) |
| 6:00 AM to 6:29 AM | 10 (25.0%) | 0 (0.0%) |
| 6:30 AM to 6:59 AM | 17 (42.5%) | 0 (0.0%) |
| 7:00 AM to 7:29 AM | 0 (0.0%) | 12 (18.2%) |
| 7:30 AM to 7:59 AM | 0 (0.0%) | 42 (63.6%) |
| 8:00 AM to 8:29 AM | 0 (0.0%) | 0 (0.0%) |
| 8:30 AM to 8:59 AM | 0 (0.0%) | 0 (0.0%) |
| 9:00 AM to 9:59 AM | 0 (0.0%) | 0 (0.0%) |
| 10:00 AM to 10:59 AM | 0 (0.0%) | 0 (0.0%) |
| 11:00 AM to 11:59 AM | 13 (32.5%) | 0 (0.0%) |
| 12:00 PM to 3:59 PM | 0 (0.0%) | 0 (0.0%) |
| 4:00 PM to 11:59 PM | 0 (0.0%) | 0 (0.0%) |
| Total | 40 (100.0%) | 66 (100.0%) |
Housing Occupancy in Turkey Creek
Occupancy by Ownership in Turkey Creek
Of the total 121 dwellings in Turkey Creek, owner-occupied units account for 93 (76.9%), while renter-occupied units make up 28 (23.1%).
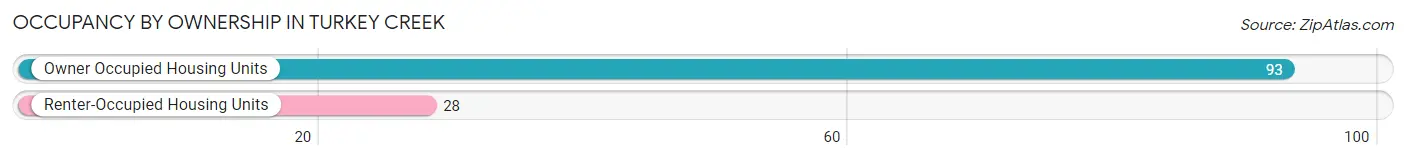
| Occupancy | # Housing Units | % Housing Units |
| Owner Occupied Housing Units | 93 | 76.9% |
| Renter-Occupied Housing Units | 28 | 23.1% |
| Total Occupied Housing Units | 121 | 100.0% |
Occupancy by Household Size in Turkey Creek
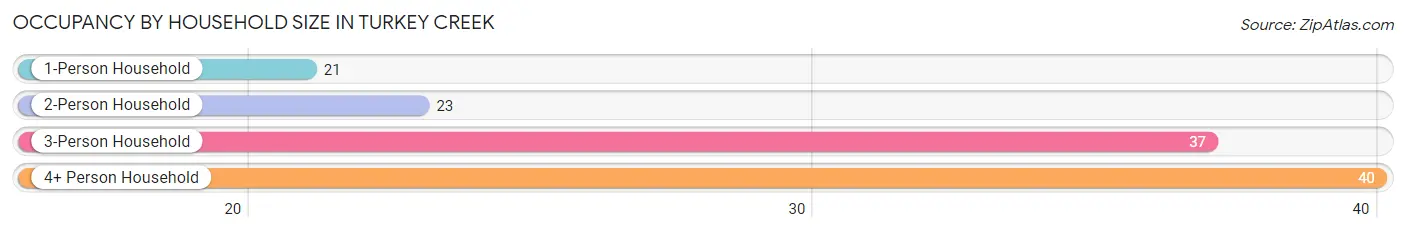
| Household Size | # Housing Units | % Housing Units |
| 1-Person Household | 21 | 17.4% |
| 2-Person Household | 23 | 19.0% |
| 3-Person Household | 37 | 30.6% |
| 4+ Person Household | 40 | 33.1% |
| Total Housing Units | 121 | 100.0% |
Occupancy by Ownership by Household Size in Turkey Creek
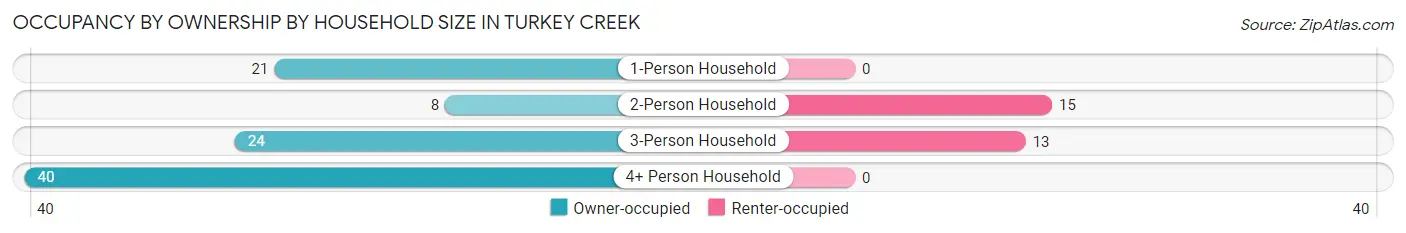
| Household Size | Owner-occupied | Renter-occupied |
| 1-Person Household | 21 (100.0%) | 0 (0.0%) |
| 2-Person Household | 8 (34.8%) | 15 (65.2%) |
| 3-Person Household | 24 (64.9%) | 13 (35.1%) |
| 4+ Person Household | 40 (100.0%) | 0 (0.0%) |
| Total Housing Units | 93 (76.9%) | 28 (23.1%) |
Occupancy by Educational Attainment in Turkey Creek
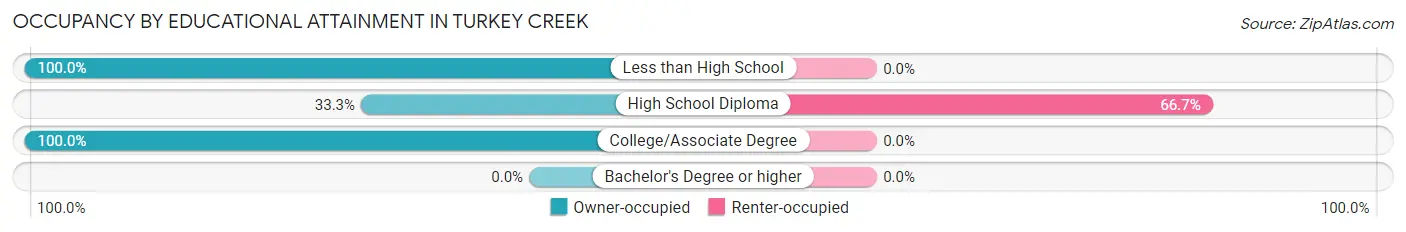
| Household Size | Owner-occupied | Renter-occupied |
| Less than High School | 38 (100.0%) | 0 (0.0%) |
| High School Diploma | 14 (33.3%) | 28 (66.7%) |
| College/Associate Degree | 41 (100.0%) | 0 (0.0%) |
| Bachelor's Degree or higher | 0 (0.0%) | 0 (0.0%) |
Occupancy by Age of Householder in Turkey Creek
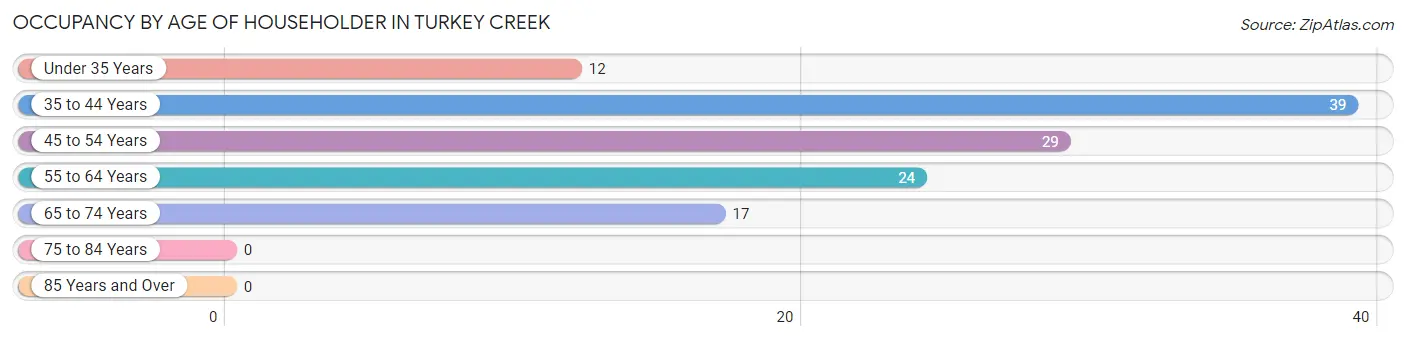
| Age Bracket | # Households | % Households |
| Under 35 Years | 12 | 9.9% |
| 35 to 44 Years | 39 | 32.2% |
| 45 to 54 Years | 29 | 24.0% |
| 55 to 64 Years | 24 | 19.8% |
| 65 to 74 Years | 17 | 14.1% |
| 75 to 84 Years | 0 | 0.0% |
| 85 Years and Over | 0 | 0.0% |
| Total | 121 | 100.0% |
Housing Finances in Turkey Creek
Median Income by Occupancy in Turkey Creek
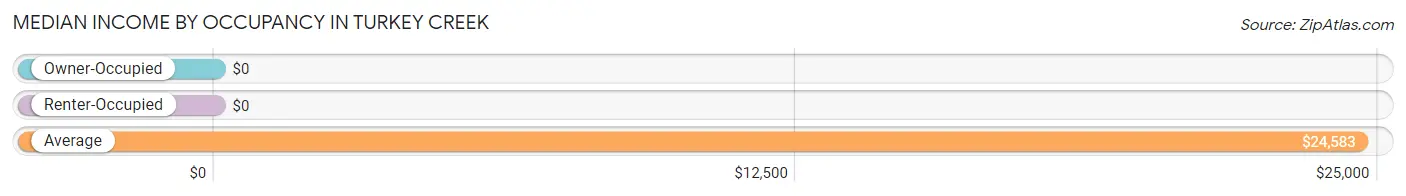
| Occupancy Type | # Households | Median Income |
| Owner-Occupied | 93 (76.9%) | $0 |
| Renter-Occupied | 28 (23.1%) | $0 |
| Average | 121 (100.0%) | $24,583 |
Occupancy by Householder Income Bracket in Turkey Creek
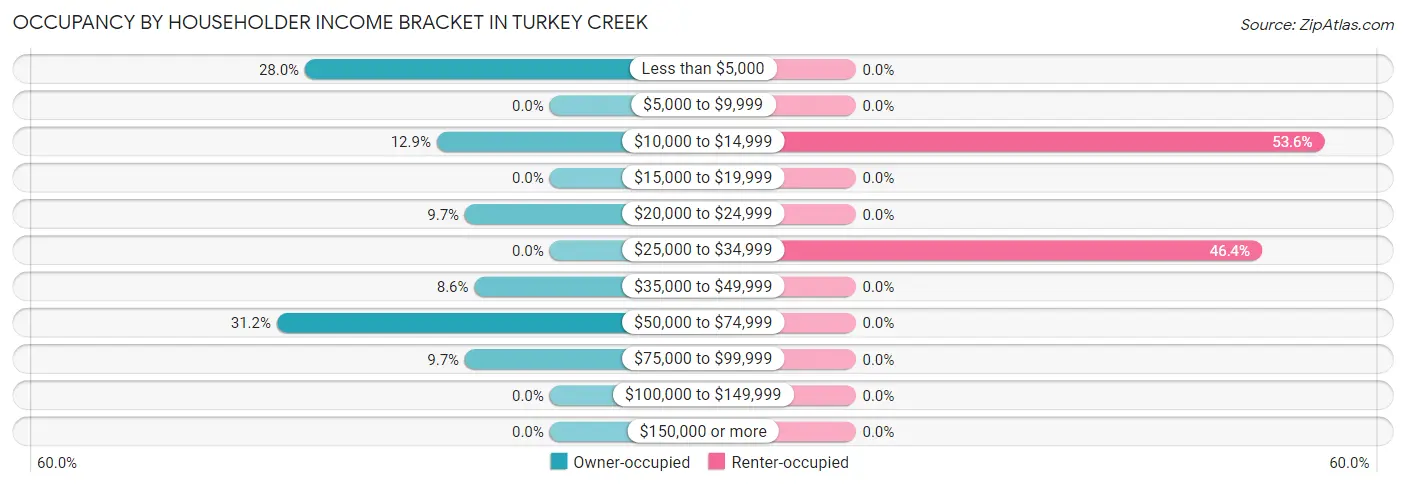
| Income Bracket | Owner-occupied | Renter-occupied |
| Less than $5,000 | 26 (28.0%) | 0 (0.0%) |
| $5,000 to $9,999 | 0 (0.0%) | 0 (0.0%) |
| $10,000 to $14,999 | 12 (12.9%) | 15 (53.6%) |
| $15,000 to $19,999 | 0 (0.0%) | 0 (0.0%) |
| $20,000 to $24,999 | 9 (9.7%) | 0 (0.0%) |
| $25,000 to $34,999 | 0 (0.0%) | 13 (46.4%) |
| $35,000 to $49,999 | 8 (8.6%) | 0 (0.0%) |
| $50,000 to $74,999 | 29 (31.2%) | 0 (0.0%) |
| $75,000 to $99,999 | 9 (9.7%) | 0 (0.0%) |
| $100,000 to $149,999 | 0 (0.0%) | 0 (0.0%) |
| $150,000 or more | 0 (0.0%) | 0 (0.0%) |
| Total | 93 (100.0%) | 28 (100.0%) |
Monthly Housing Cost Tiers in Turkey Creek
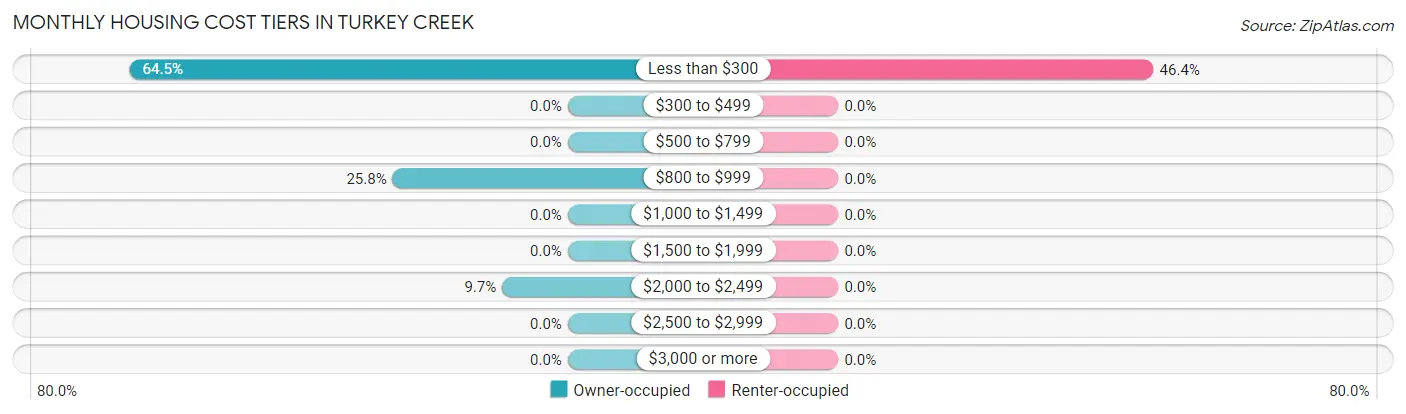
| Monthly Cost | Owner-occupied | Renter-occupied |
| Less than $300 | 60 (64.5%) | 13 (46.4%) |
| $300 to $499 | 0 (0.0%) | 0 (0.0%) |
| $500 to $799 | 0 (0.0%) | 0 (0.0%) |
| $800 to $999 | 24 (25.8%) | 0 (0.0%) |
| $1,000 to $1,499 | 0 (0.0%) | 0 (0.0%) |
| $1,500 to $1,999 | 0 (0.0%) | 0 (0.0%) |
| $2,000 to $2,499 | 9 (9.7%) | 0 (0.0%) |
| $2,500 to $2,999 | 0 (0.0%) | 0 (0.0%) |
| $3,000 or more | 0 (0.0%) | 0 (0.0%) |
| Total | 93 (100.0%) | 28 (100.0%) |
Physical Housing Characteristics in Turkey Creek
Housing Structures in Turkey Creek
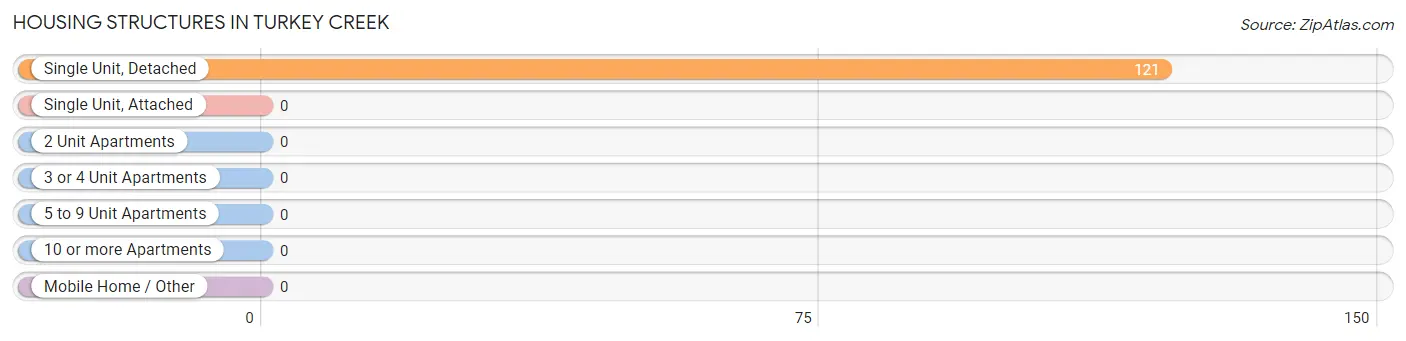
| Structure Type | # Housing Units | % Housing Units |
| Single Unit, Detached | 121 | 100.0% |
| Single Unit, Attached | 0 | 0.0% |
| 2 Unit Apartments | 0 | 0.0% |
| 3 or 4 Unit Apartments | 0 | 0.0% |
| 5 to 9 Unit Apartments | 0 | 0.0% |
| 10 or more Apartments | 0 | 0.0% |
| Mobile Home / Other | 0 | 0.0% |
| Total | 121 | 100.0% |
Housing Structures by Occupancy in Turkey Creek
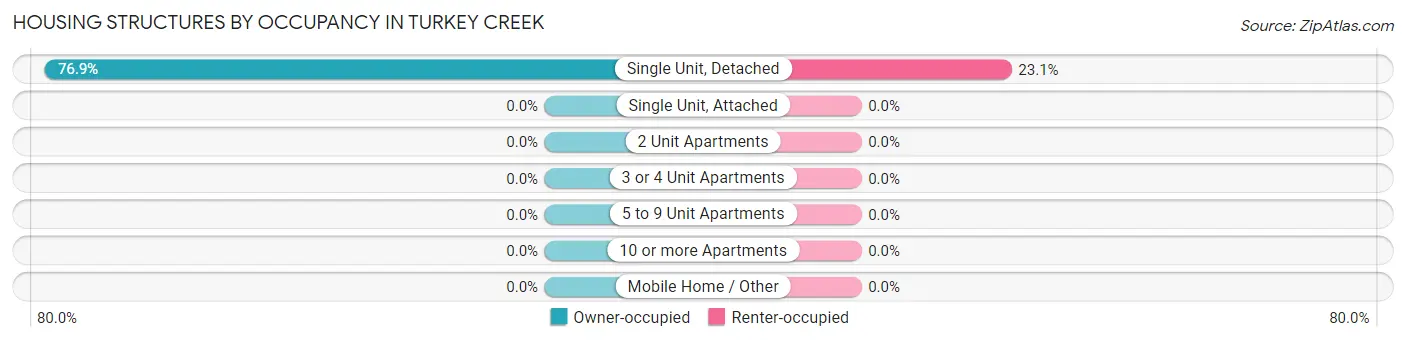
| Structure Type | Owner-occupied | Renter-occupied |
| Single Unit, Detached | 93 (76.9%) | 28 (23.1%) |
| Single Unit, Attached | 0 (0.0%) | 0 (0.0%) |
| 2 Unit Apartments | 0 (0.0%) | 0 (0.0%) |
| 3 or 4 Unit Apartments | 0 (0.0%) | 0 (0.0%) |
| 5 to 9 Unit Apartments | 0 (0.0%) | 0 (0.0%) |
| 10 or more Apartments | 0 (0.0%) | 0 (0.0%) |
| Mobile Home / Other | 0 (0.0%) | 0 (0.0%) |
| Total | 93 (76.9%) | 28 (23.1%) |
Housing Structures by Number of Rooms in Turkey Creek
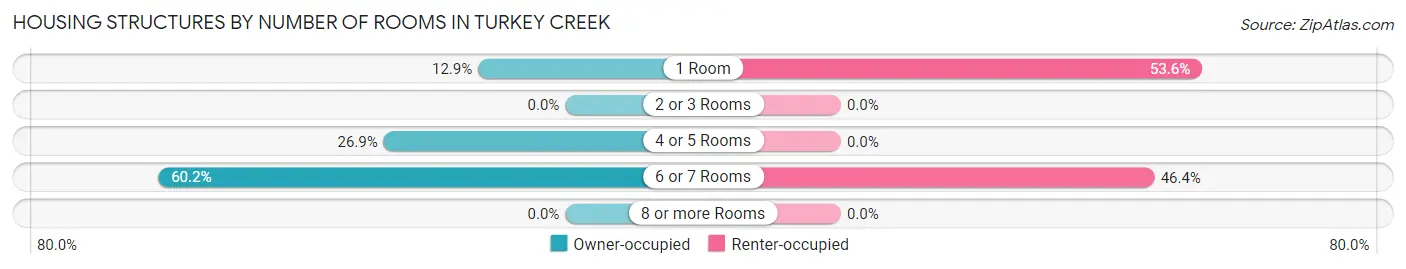
| Number of Rooms | Owner-occupied | Renter-occupied |
| 1 Room | 12 (12.9%) | 15 (53.6%) |
| 2 or 3 Rooms | 0 (0.0%) | 0 (0.0%) |
| 4 or 5 Rooms | 25 (26.9%) | 0 (0.0%) |
| 6 or 7 Rooms | 56 (60.2%) | 13 (46.4%) |
| 8 or more Rooms | 0 (0.0%) | 0 (0.0%) |
| Total | 93 (100.0%) | 28 (100.0%) |
Housing Structure by Heating Type in Turkey Creek
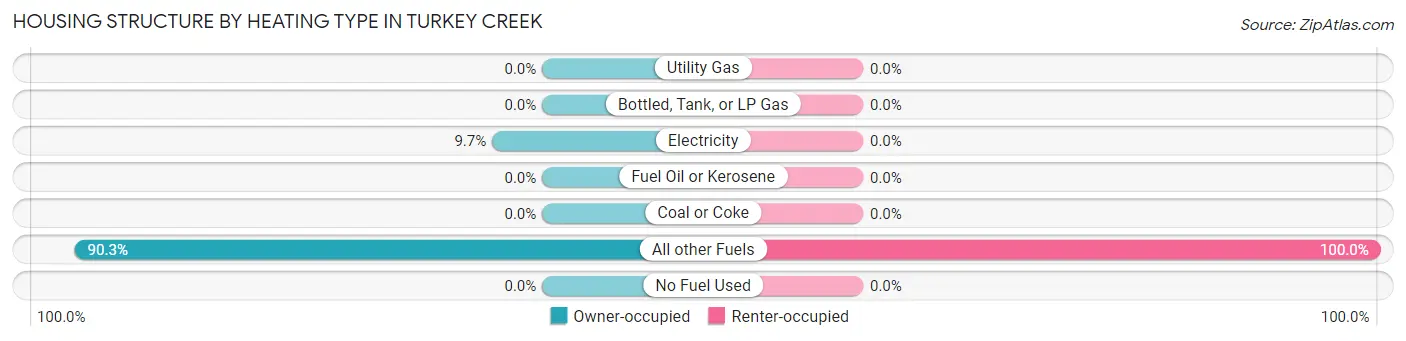
| Heating Type | Owner-occupied | Renter-occupied |
| Utility Gas | 0 (0.0%) | 0 (0.0%) |
| Bottled, Tank, or LP Gas | 0 (0.0%) | 0 (0.0%) |
| Electricity | 9 (9.7%) | 0 (0.0%) |
| Fuel Oil or Kerosene | 0 (0.0%) | 0 (0.0%) |
| Coal or Coke | 0 (0.0%) | 0 (0.0%) |
| All other Fuels | 84 (90.3%) | 28 (100.0%) |
| No Fuel Used | 0 (0.0%) | 0 (0.0%) |
| Total | 93 (100.0%) | 28 (100.0%) |
Household Vehicle Usage in Turkey Creek
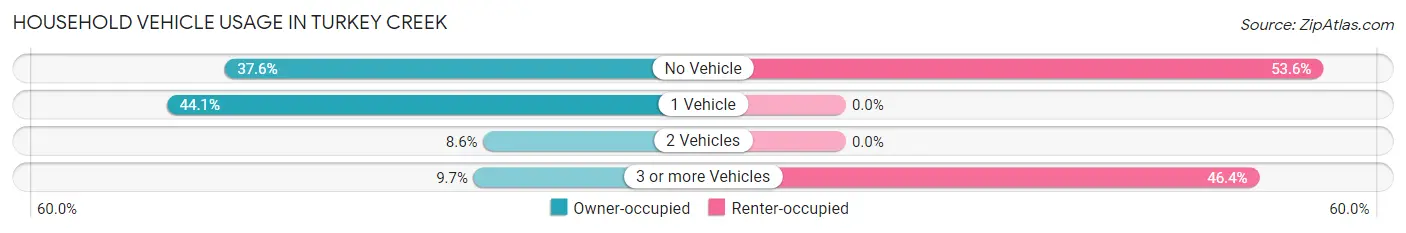
| Vehicles per Household | Owner-occupied | Renter-occupied |
| No Vehicle | 35 (37.6%) | 15 (53.6%) |
| 1 Vehicle | 41 (44.1%) | 0 (0.0%) |
| 2 Vehicles | 8 (8.6%) | 0 (0.0%) |
| 3 or more Vehicles | 9 (9.7%) | 13 (46.4%) |
| Total | 93 (100.0%) | 28 (100.0%) |
Real Estate & Mortgages in Turkey Creek
Real Estate and Mortgage Overview in Turkey Creek
| Characteristic | Without Mortgage | With Mortgage |
| Housing Units | 60 | 33 |
| Median Property Value | $77,100 | $0 |
| Median Household Income | - | - |
| Monthly Housing Costs | $129 | $0 |
| Real Estate Taxes | - | - |
Property Value by Mortgage Status in Turkey Creek
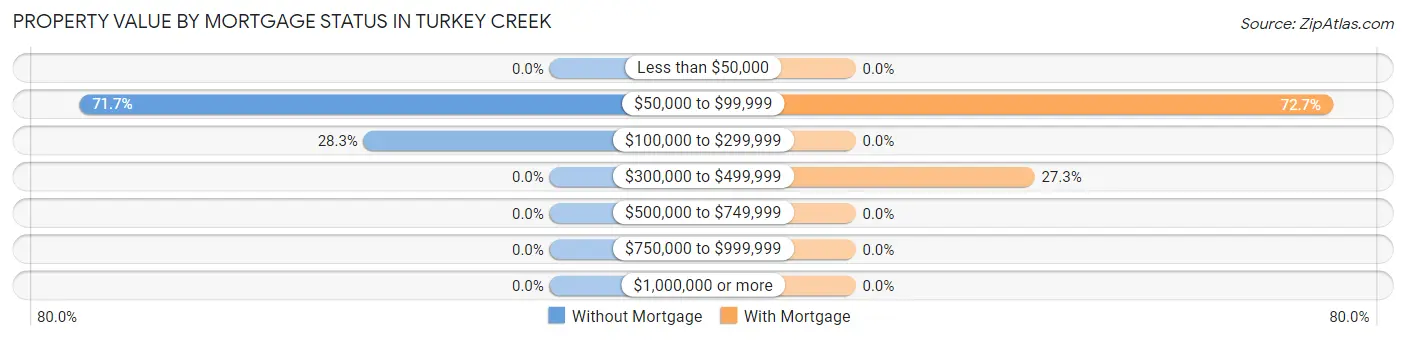
| Property Value | Without Mortgage | With Mortgage |
| Less than $50,000 | 0 (0.0%) | 0 (0.0%) |
| $50,000 to $99,999 | 43 (71.7%) | 24 (72.7%) |
| $100,000 to $299,999 | 17 (28.3%) | 0 (0.0%) |
| $300,000 to $499,999 | 0 (0.0%) | 9 (27.3%) |
| $500,000 to $749,999 | 0 (0.0%) | 0 (0.0%) |
| $750,000 to $999,999 | 0 (0.0%) | 0 (0.0%) |
| $1,000,000 or more | 0 (0.0%) | 0 (0.0%) |
| Total | 60 (100.0%) | 33 (100.0%) |
Household Income by Mortgage Status in Turkey Creek
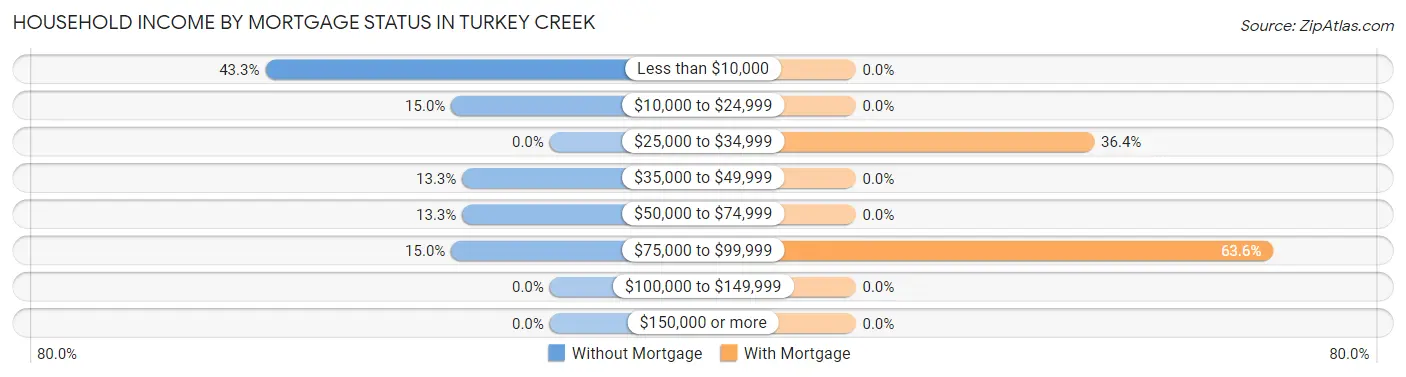
| Household Income | Without Mortgage | With Mortgage |
| Less than $10,000 | 26 (43.3%) | 0 (0.0%) |
| $10,000 to $24,999 | 9 (15.0%) | 0 (0.0%) |
| $25,000 to $34,999 | 0 (0.0%) | 12 (36.4%) |
| $35,000 to $49,999 | 8 (13.3%) | 0 (0.0%) |
| $50,000 to $74,999 | 8 (13.3%) | 0 (0.0%) |
| $75,000 to $99,999 | 9 (15.0%) | 21 (63.6%) |
| $100,000 to $149,999 | 0 (0.0%) | 0 (0.0%) |
| $150,000 or more | 0 (0.0%) | 0 (0.0%) |
| Total | 60 (100.0%) | 33 (100.0%) |
Property Value to Household Income Ratio in Turkey Creek
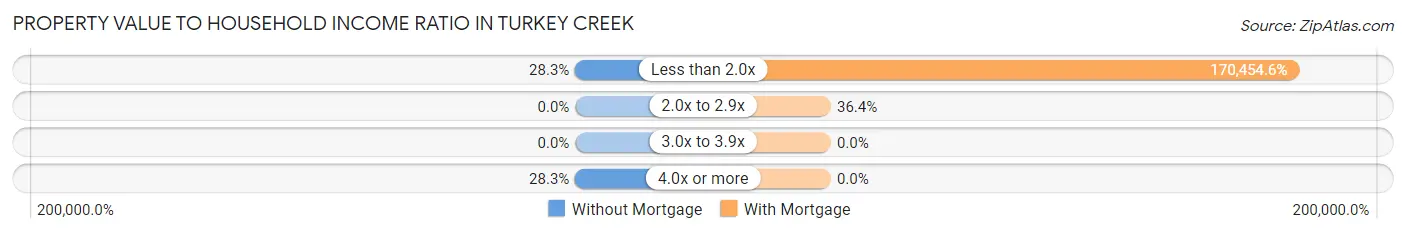
| Value-to-Income Ratio | Without Mortgage | With Mortgage |
| Less than 2.0x | 17 (28.3%) | 56,250 (170,454.5%) |
| 2.0x to 2.9x | 0 (0.0%) | 12 (36.4%) |
| 3.0x to 3.9x | 0 (0.0%) | 0 (0.0%) |
| 4.0x or more | 17 (28.3%) | 0 (0.0%) |
| Total | 60 (100.0%) | 33 (100.0%) |
Real Estate Taxes by Mortgage Status in Turkey Creek
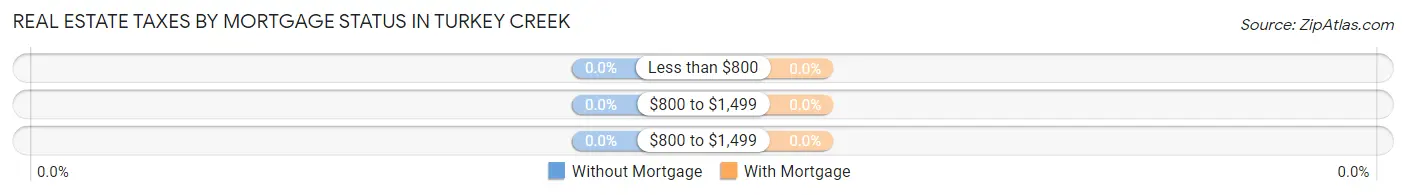
| Property Taxes | Without Mortgage | With Mortgage |
| Less than $800 | 0 (0.0%) | 0 (0.0%) |
| $800 to $1,499 | 0 (0.0%) | 0 (0.0%) |
| $800 to $1,499 | 0 (0.0%) | 0 (0.0%) |
| Total | 60 (100.0%) | 33 (100.0%) |
Health & Disability in Turkey Creek
Health Insurance Coverage by Age in Turkey Creek
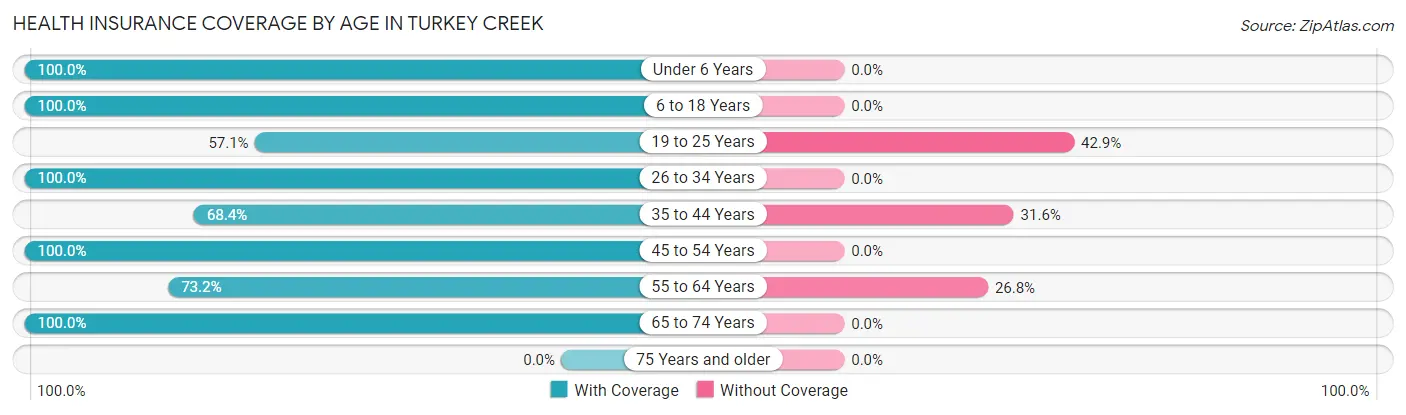
| Age Bracket | With Coverage | Without Coverage |
| Under 6 Years | 70 (100.0%) | 0 (0.0%) |
| 6 to 18 Years | 112 (100.0%) | 0 (0.0%) |
| 19 to 25 Years | 28 (57.1%) | 21 (42.9%) |
| 26 to 34 Years | 33 (100.0%) | 0 (0.0%) |
| 35 to 44 Years | 52 (68.4%) | 24 (31.6%) |
| 45 to 54 Years | 35 (100.0%) | 0 (0.0%) |
| 55 to 64 Years | 41 (73.2%) | 15 (26.8%) |
| 65 to 74 Years | 26 (100.0%) | 0 (0.0%) |
| 75 Years and older | 0 (0.0%) | 0 (0.0%) |
| Total | 397 (86.9%) | 60 (13.1%) |
Health Insurance Coverage by Citizenship Status in Turkey Creek
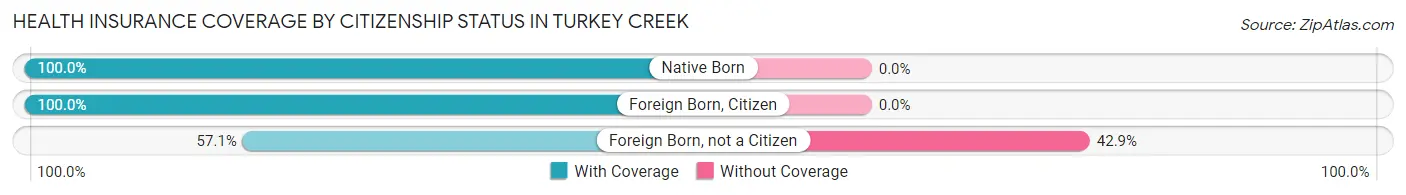
| Citizenship Status | With Coverage | Without Coverage |
| Native Born | 70 (100.0%) | 0 (0.0%) |
| Foreign Born, Citizen | 112 (100.0%) | 0 (0.0%) |
| Foreign Born, not a Citizen | 28 (57.1%) | 21 (42.9%) |
Health Insurance Coverage by Household Income in Turkey Creek
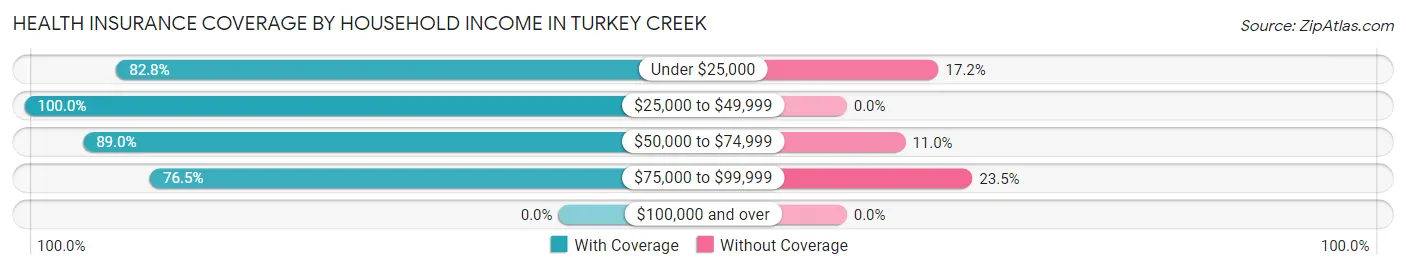
| Household Income | With Coverage | Without Coverage |
| Under $25,000 | 130 (82.8%) | 27 (17.2%) |
| $25,000 to $49,999 | 58 (100.0%) | 0 (0.0%) |
| $50,000 to $74,999 | 170 (89.0%) | 21 (11.0%) |
| $75,000 to $99,999 | 39 (76.5%) | 12 (23.5%) |
| $100,000 and over | 0 (0.0%) | 0 (0.0%) |
Public vs Private Health Insurance Coverage by Age in Turkey Creek
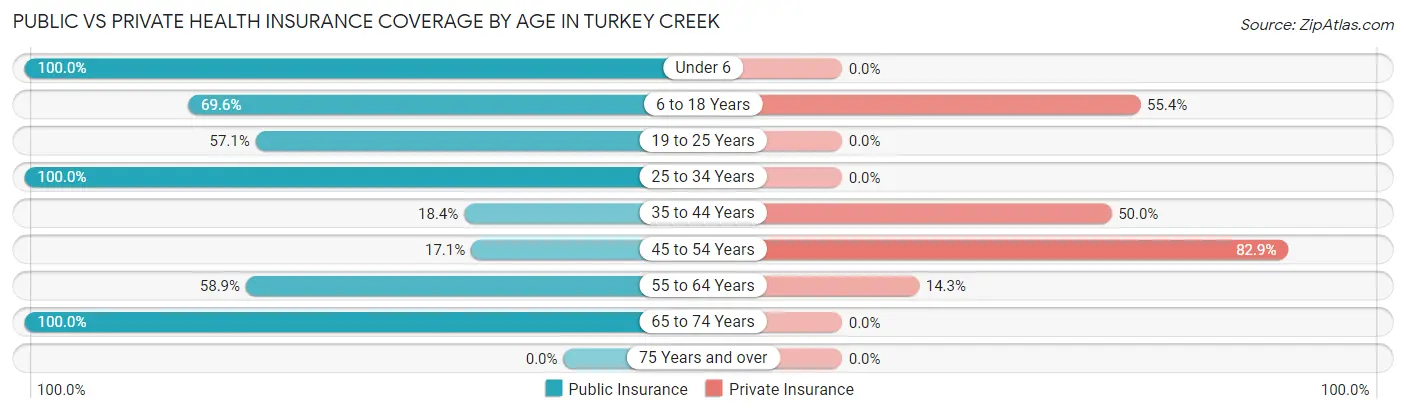
| Age Bracket | Public Insurance | Private Insurance |
| Under 6 | 70 (100.0%) | 0 (0.0%) |
| 6 to 18 Years | 78 (69.6%) | 62 (55.4%) |
| 19 to 25 Years | 28 (57.1%) | 0 (0.0%) |
| 25 to 34 Years | 33 (100.0%) | 0 (0.0%) |
| 35 to 44 Years | 14 (18.4%) | 38 (50.0%) |
| 45 to 54 Years | 6 (17.1%) | 29 (82.9%) |
| 55 to 64 Years | 33 (58.9%) | 8 (14.3%) |
| 65 to 74 Years | 26 (100.0%) | 0 (0.0%) |
| 75 Years and over | 0 (0.0%) | 0 (0.0%) |
| Total | 288 (63.0%) | 137 (30.0%) |
Disability Status by Sex by Age in Turkey Creek
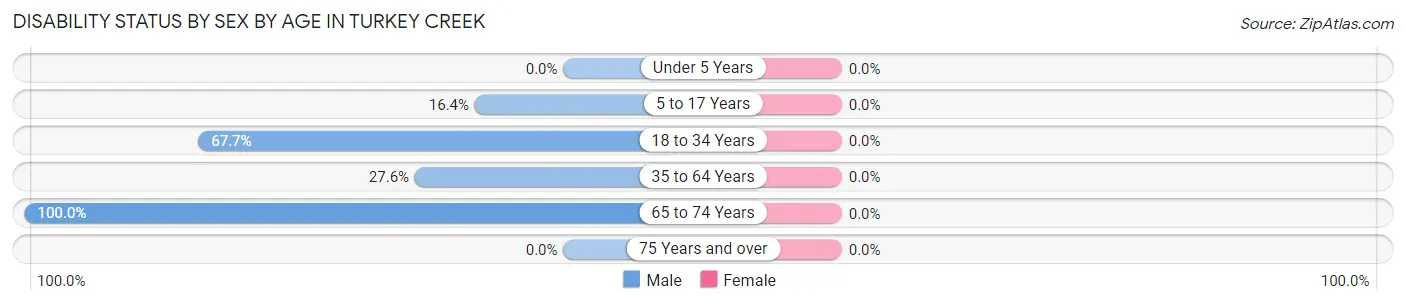
| Age Bracket | Male | Female |
| Under 5 Years | 0 (0.0%) | 0 (0.0%) |
| 5 to 17 Years | 11 (16.4%) | 0 (0.0%) |
| 18 to 34 Years | 21 (67.7%) | 0 (0.0%) |
| 35 to 64 Years | 27 (27.6%) | 0 (0.0%) |
| 65 to 74 Years | 18 (100.0%) | 0 (0.0%) |
| 75 Years and over | 0 (0.0%) | 0 (0.0%) |
Disability Class by Sex by Age in Turkey Creek
Disability Class: Hearing Difficulty
| Age Bracket | Male | Female |
| Under 5 Years | 0 (0.0%) | 0 (0.0%) |
| 5 to 17 Years | 0 (0.0%) | 0 (0.0%) |
| 18 to 34 Years | 0 (0.0%) | 0 (0.0%) |
| 35 to 64 Years | 0 (0.0%) | 0 (0.0%) |
| 65 to 74 Years | 0 (0.0%) | 0 (0.0%) |
| 75 Years and over | 0 (0.0%) | 0 (0.0%) |
Disability Class: Vision Difficulty
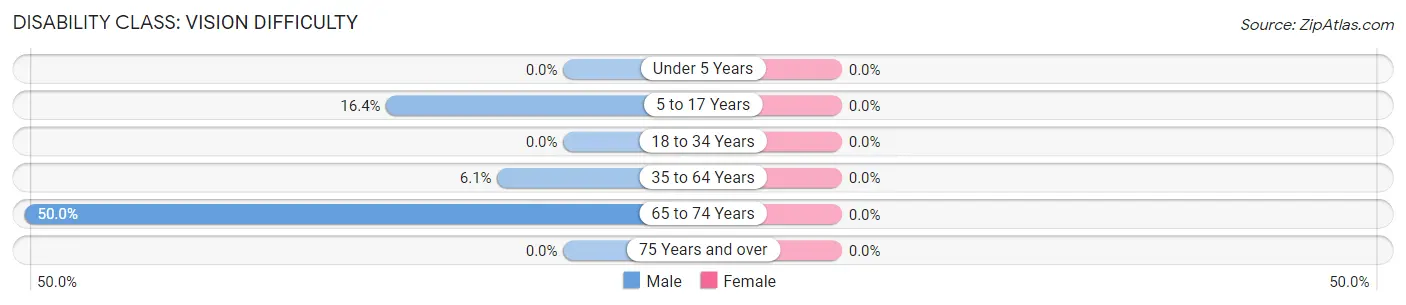
| Age Bracket | Male | Female |
| Under 5 Years | 0 (0.0%) | 0 (0.0%) |
| 5 to 17 Years | 11 (16.4%) | 0 (0.0%) |
| 18 to 34 Years | 0 (0.0%) | 0 (0.0%) |
| 35 to 64 Years | 6 (6.1%) | 0 (0.0%) |
| 65 to 74 Years | 9 (50.0%) | 0 (0.0%) |
| 75 Years and over | 0 (0.0%) | 0 (0.0%) |
Disability Class: Cognitive Difficulty
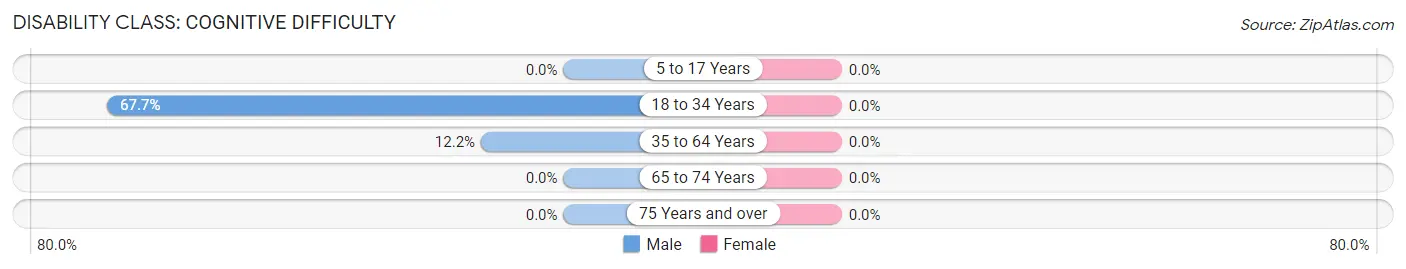
| Age Bracket | Male | Female |
| 5 to 17 Years | 0 (0.0%) | 0 (0.0%) |
| 18 to 34 Years | 21 (67.7%) | 0 (0.0%) |
| 35 to 64 Years | 12 (12.2%) | 0 (0.0%) |
| 65 to 74 Years | 0 (0.0%) | 0 (0.0%) |
| 75 Years and over | 0 (0.0%) | 0 (0.0%) |
Disability Class: Ambulatory Difficulty
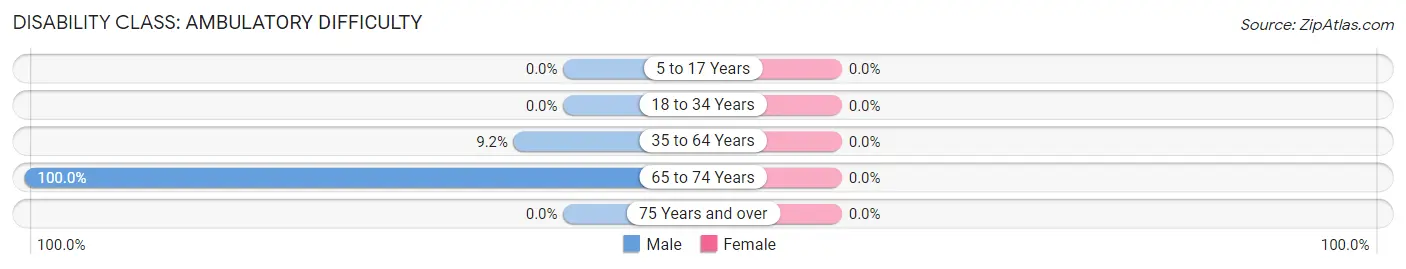
| Age Bracket | Male | Female |
| 5 to 17 Years | 0 (0.0%) | 0 (0.0%) |
| 18 to 34 Years | 0 (0.0%) | 0 (0.0%) |
| 35 to 64 Years | 9 (9.2%) | 0 (0.0%) |
| 65 to 74 Years | 18 (100.0%) | 0 (0.0%) |
| 75 Years and over | 0 (0.0%) | 0 (0.0%) |
Disability Class: Self-Care Difficulty
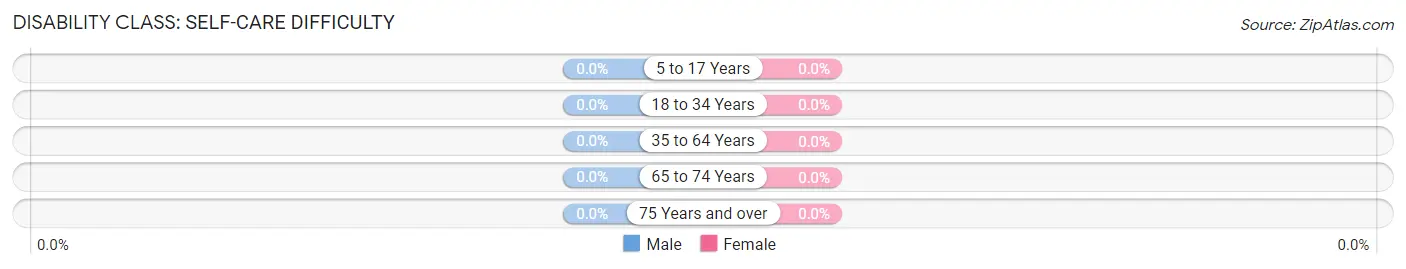
| Age Bracket | Male | Female |
| 5 to 17 Years | 0 (0.0%) | 0 (0.0%) |
| 18 to 34 Years | 0 (0.0%) | 0 (0.0%) |
| 35 to 64 Years | 0 (0.0%) | 0 (0.0%) |
| 65 to 74 Years | 0 (0.0%) | 0 (0.0%) |
| 75 Years and over | 0 (0.0%) | 0 (0.0%) |
Technology Access in Turkey Creek
Computing Device Access in Turkey Creek
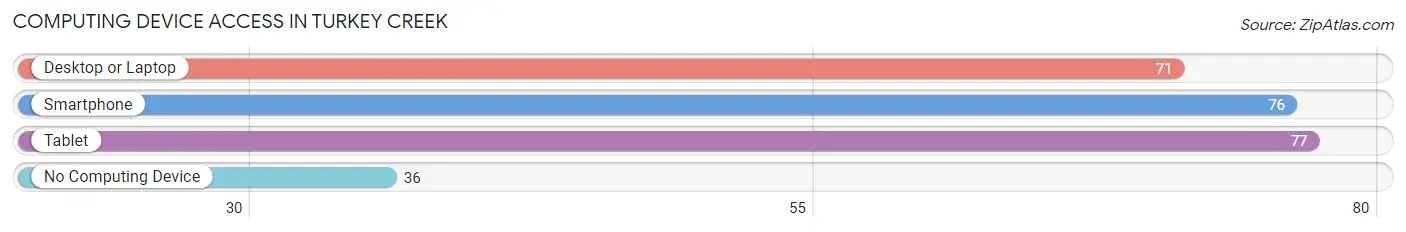
| Device Type | # Households | % Households |
| Desktop or Laptop | 71 | 58.7% |
| Smartphone | 76 | 62.8% |
| Tablet | 77 | 63.6% |
| No Computing Device | 36 | 29.7% |
| Total | 121 | 100.0% |
Internet Access in Turkey Creek
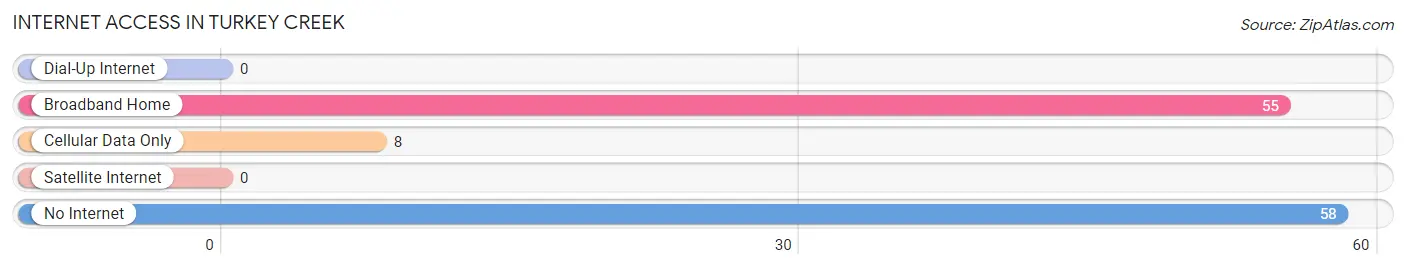
| Internet Type | # Households | % Households |
| Dial-Up Internet | 0 | 0.0% |
| Broadband Home | 55 | 45.5% |
| Cellular Data Only | 8 | 6.6% |
| Satellite Internet | 0 | 0.0% |
| No Internet | 58 | 47.9% |
| Total | 121 | 100.0% |
Turkey Creek Summary
History
The area now known as Turkey Creek, Arizona was first inhabited by the Hohokam people, who lived in the area from around 300 BCE to 1450 CE. The Hohokam were a semi-nomadic people who lived in small villages and farmed the land. They were known for their irrigation systems, which were used to water their crops.
The area was later inhabited by the Apache people, who lived in the area from the 16th century until the late 19th century. The Apache were a nomadic people who hunted and gathered food, and were known for their fierce resistance to the Spanish and Mexican settlers who arrived in the area.
In the late 19th century, the area was settled by Anglo-American settlers, who established the town of Turkey Creek in 1881. The town was named after the nearby creek, which was named for the wild turkeys that lived in the area.
The town grew quickly, and by the early 20th century it had become a thriving agricultural community. The town was home to several businesses, including a general store, a blacksmith, a livery stable, and a saloon.
Geography
Turkey Creek is located in the Sonoran Desert of Arizona, about 40 miles south of Phoenix. The town is situated in the foothills of the White Tank Mountains, at an elevation of 1,800 feet. The area is characterized by hot, dry summers and mild winters.
The town is located on the banks of the Turkey Creek, which is a tributary of the Gila River. The creek is a popular spot for fishing, and is home to a variety of wildlife, including beavers, muskrats, and a variety of birds.
Economy
The economy of Turkey Creek is largely based on agriculture. The town is home to several farms, which produce a variety of crops, including cotton, alfalfa, and wheat. The town is also home to several small businesses, including a general store, a hardware store, and a restaurant.
The town is also home to a number of tourist attractions, including the White Tank Mountain Regional Park, which offers camping, hiking, and other outdoor activities. The town is also home to the historic Turkey Creek Schoolhouse, which is listed on the National Register of Historic Places.
Demographics
As of the 2010 census, the population of Turkey Creek was 1,845. The town is predominantly white, with a small Hispanic population. The median household income is $41,250, and the median home value is $127,000. The town has a high rate of homeownership, with nearly 80% of residents owning their own homes.
Common Questions
What is Per Capita Income in Turkey Creek?
Per Capita income in Turkey Creek is $9,031.
What is the Median Family Income in Turkey Creek?
Median Family Income in Turkey Creek is $36,094.
What is the Median Household income in Turkey Creek?
Median Household Income in Turkey Creek is $24,583.
What is Inequality or Gini Index in Turkey Creek?
Inequality or Gini Index in Turkey Creek is 0.48.
What is the Total Population of Turkey Creek?
Total Population of Turkey Creek is 457.
What is the Total Male Population of Turkey Creek?
Total Male Population of Turkey Creek is 273.
What is the Total Female Population of Turkey Creek?
Total Female Population of Turkey Creek is 184.
What is the Ratio of Males per 100 Females in Turkey Creek?
There are 148.37 Males per 100 Females in Turkey Creek.
What is the Ratio of Females per 100 Males in Turkey Creek?
There are 67.40 Females per 100 Males in Turkey Creek.
What is the Median Population Age in Turkey Creek?
Median Population Age in Turkey Creek is 24.8 Years.
What is the Average Family Size in Turkey Creek
Average Family Size in Turkey Creek is 4.7 People.
What is the Average Household Size in Turkey Creek
Average Household Size in Turkey Creek is 3.8 People.
How Large is the Labor Force in Turkey Creek?
There are 118 People in the Labor Forcein in Turkey Creek.
What is the Percentage of People in the Labor Force in Turkey Creek?
37.0% of People are in the Labor Force in Turkey Creek.
What is the Unemployment Rate in Turkey Creek?
Unemployment Rate in Turkey Creek is 10.2%.