Lake City, GA Map & Demographics
Lake City Map
Lake City Overview
$24,316
PER CAPITA INCOME
$65,000
AVG FAMILY INCOME
$62,941
AVG HOUSEHOLD INCOME
31.9%
WAGE / INCOME GAP [ % ]
68.1¢/ $1
WAGE / INCOME GAP [ $ ]
0.43
INEQUALITY / GINI INDEX
2,916
TOTAL POPULATION
1,335
MALE POPULATION
1,581
FEMALE POPULATION
84.44
MALES / 100 FEMALES
118.43
FEMALES / 100 MALES
41.9
MEDIAN AGE
3.6
AVG FAMILY SIZE
2.6
AVG HOUSEHOLD SIZE
1,635
LABOR FORCE [ PEOPLE ]
64.7%
PERCENT IN LABOR FORCE
1.8%
UNEMPLOYMENT RATE
Lake City Area Codes
Income in Lake City
Income Overview in Lake City
Per Capita Income in Lake City is $24,316, while median incomes of families and households are $65,000 and $62,941 respectively.
| Characteristic | Number | Measure |
| Per Capita Income | 2,916 | $24,316 |
| Median Family Income | 500 | $65,000 |
| Mean Family Income | 500 | $74,831 |
| Median Household Income | 906 | $62,941 |
| Mean Household Income | 906 | $71,202 |
| Income Deficit | 500 | $0 |
| Wage / Income Gap (%) | 2,916 | 31.92% |
| Wage / Income Gap ($) | 2,916 | 68.08¢ per $1 |
| Gini / Inequality Index | 2,916 | 0.43 |
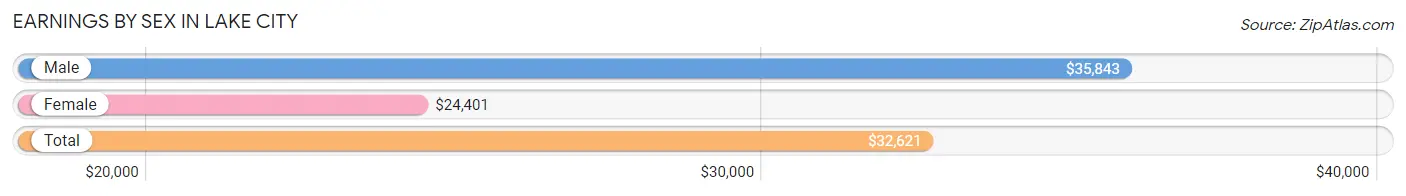
Earnings by Sex in Lake City
Average Earnings in Lake City are $32,621, $35,843 for men and $24,401 for women, a difference of 31.9%.
| Sex | Number | Average Earnings |
| Male | 769 (46.1%) | $35,843 |
| Female | 899 (53.9%) | $24,401 |
| Total | 1,668 (100.0%) | $32,621 |
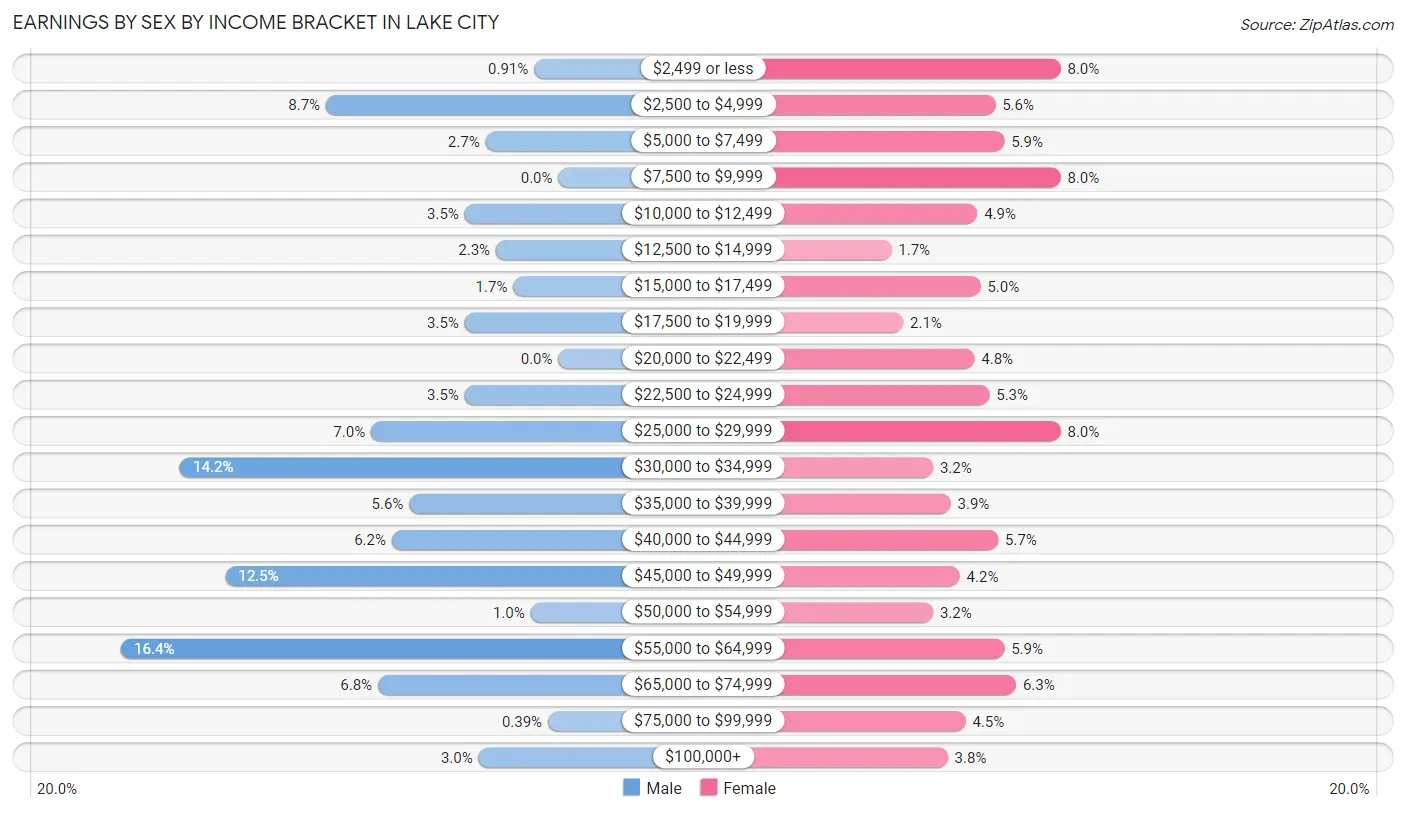
Earnings by Sex by Income Bracket in Lake City
The most common earnings brackets in Lake City are $55,000 to $64,999 for men (126 | 16.4%) and $2,499 or less for women (72 | 8.0%).
| Income | Male | Female |
| $2,499 or less | 7 (0.9%) | 72 (8.0%) |
| $2,500 to $4,999 | 67 (8.7%) | 50 (5.6%) |
| $5,000 to $7,499 | 21 (2.7%) | 53 (5.9%) |
| $7,500 to $9,999 | 0 (0.0%) | 72 (8.0%) |
| $10,000 to $12,499 | 27 (3.5%) | 44 (4.9%) |
| $12,500 to $14,999 | 18 (2.3%) | 15 (1.7%) |
| $15,000 to $17,499 | 13 (1.7%) | 45 (5.0%) |
| $17,500 to $19,999 | 27 (3.5%) | 19 (2.1%) |
| $20,000 to $22,499 | 0 (0.0%) | 43 (4.8%) |
| $22,500 to $24,999 | 27 (3.5%) | 48 (5.3%) |
| $25,000 to $29,999 | 54 (7.0%) | 72 (8.0%) |
| $30,000 to $34,999 | 109 (14.2%) | 29 (3.2%) |
| $35,000 to $39,999 | 43 (5.6%) | 35 (3.9%) |
| $40,000 to $44,999 | 48 (6.2%) | 51 (5.7%) |
| $45,000 to $49,999 | 96 (12.5%) | 38 (4.2%) |
| $50,000 to $54,999 | 8 (1.0%) | 29 (3.2%) |
| $55,000 to $64,999 | 126 (16.4%) | 53 (5.9%) |
| $65,000 to $74,999 | 52 (6.8%) | 57 (6.3%) |
| $75,000 to $99,999 | 3 (0.4%) | 40 (4.4%) |
| $100,000+ | 23 (3.0%) | 34 (3.8%) |
| Total | 769 (100.0%) | 899 (100.0%) |
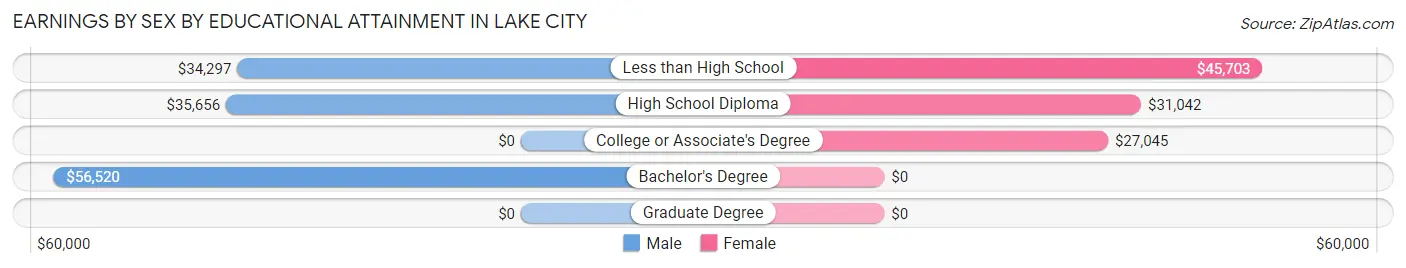
Earnings by Sex by Educational Attainment in Lake City
Average earnings in Lake City are $40,819 for men and $35,964 for women, a difference of 11.9%. Men with an educational attainment of bachelor's degree enjoy the highest average annual earnings of $56,520, while those with less than high school education earn the least with $34,297. Women with an educational attainment of less than high school earn the most with the average annual earnings of $45,703, while those with college or associate's degree education have the smallest earnings of $27,045.
| Educational Attainment | Male Income | Female Income |
| Less than High School | $34,297 | $45,703 |
| High School Diploma | $35,656 | $31,042 |
| College or Associate's Degree | - | - |
| Bachelor's Degree | $56,520 | $0 |
| Graduate Degree | - | - |
| Total | $40,819 | $35,964 |
Family Income in Lake City
Family Income Brackets in Lake City
According to the Lake City family income data, there are 195 families falling into the $50,000 to $74,999 income range, which is the most common income bracket and makes up 39.0% of all families.
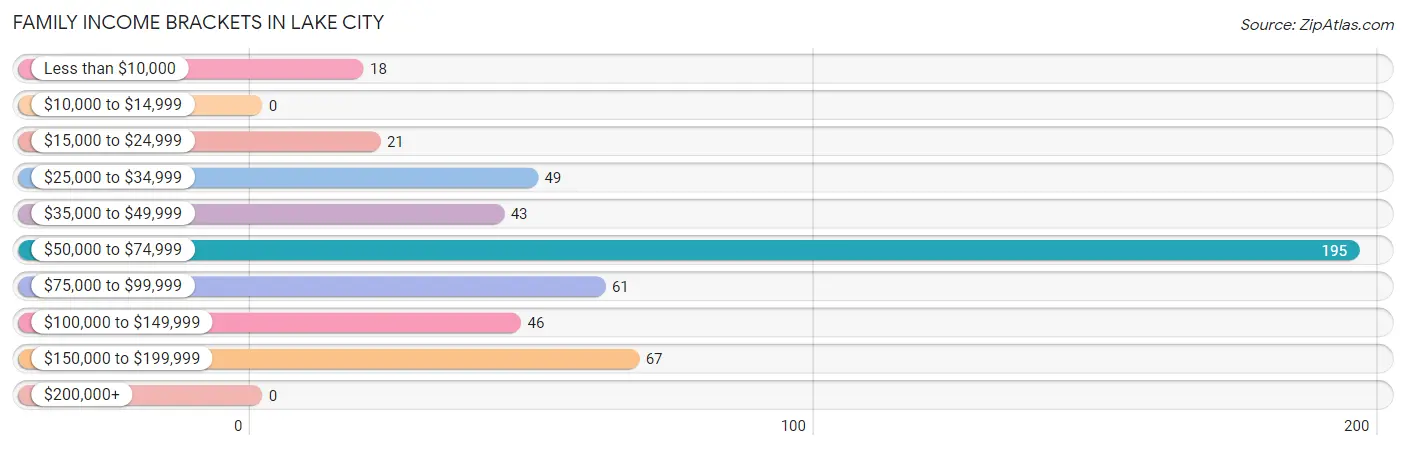
| Income Bracket | # Families | % Families |
| Less than $10,000 | 18 | 3.6% |
| $10,000 to $14,999 | 0 | 0.0% |
| $15,000 to $24,999 | 21 | 4.2% |
| $25,000 to $34,999 | 49 | 9.8% |
| $35,000 to $49,999 | 43 | 8.6% |
| $50,000 to $74,999 | 195 | 39.0% |
| $75,000 to $99,999 | 61 | 12.2% |
| $100,000 to $149,999 | 46 | 9.2% |
| $150,000 to $199,999 | 67 | 13.4% |
| $200,000+ | 0 | 0.0% |
Family Income by Famaliy Size in Lake City
6-person families (26 | 5.2%) account for the highest median family income in Lake City with $75,625 per family, while 2-person families (199 | 39.8%) have the highest median income of $29,050 per family member.
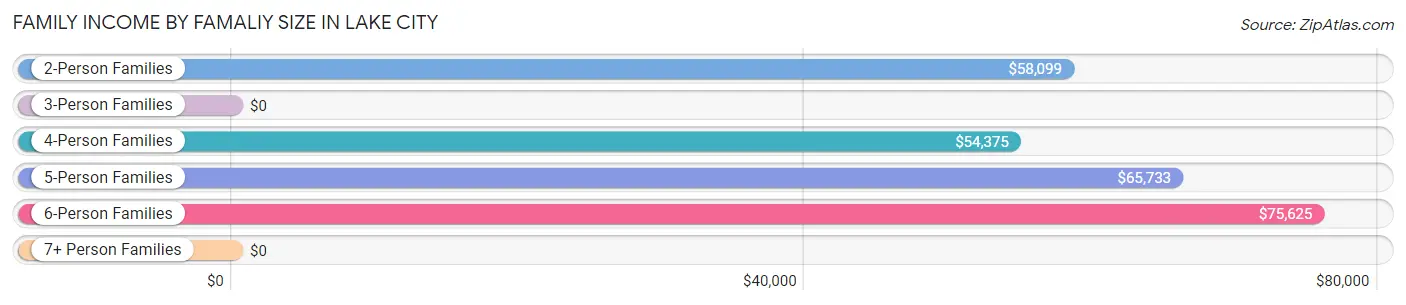
| Income Bracket | # Families | Median Income |
| 2-Person Families | 199 (39.8%) | $58,099 |
| 3-Person Families | 154 (30.8%) | $0 |
| 4-Person Families | 60 (12.0%) | $54,375 |
| 5-Person Families | 41 (8.2%) | $65,733 |
| 6-Person Families | 26 (5.2%) | $75,625 |
| 7+ Person Families | 20 (4.0%) | $0 |
| Total | 500 (100.0%) | $65,000 |
Family Income by Number of Earners in Lake City
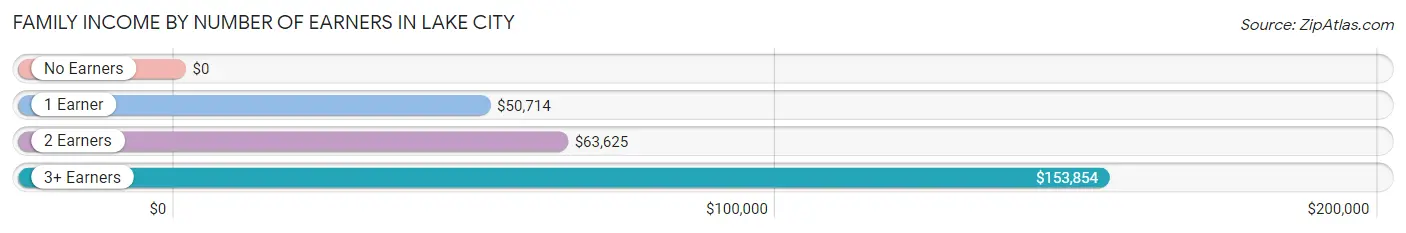
| Number of Earners | # Families | Median Income |
| No Earners | 38 (7.6%) | $0 |
| 1 Earner | 134 (26.8%) | $50,714 |
| 2 Earners | 213 (42.6%) | $63,625 |
| 3+ Earners | 115 (23.0%) | $153,854 |
| Total | 500 (100.0%) | $65,000 |
Household Income in Lake City
Household Income Brackets in Lake City
With 236 households falling in the category, the $50,000 to $74,999 income range is the most frequent in Lake City, accounting for 26.1% of all households. In contrast, only 33 households (3.6%) fall into the $10,000 to $14,999 income bracket, making it the least populous group.
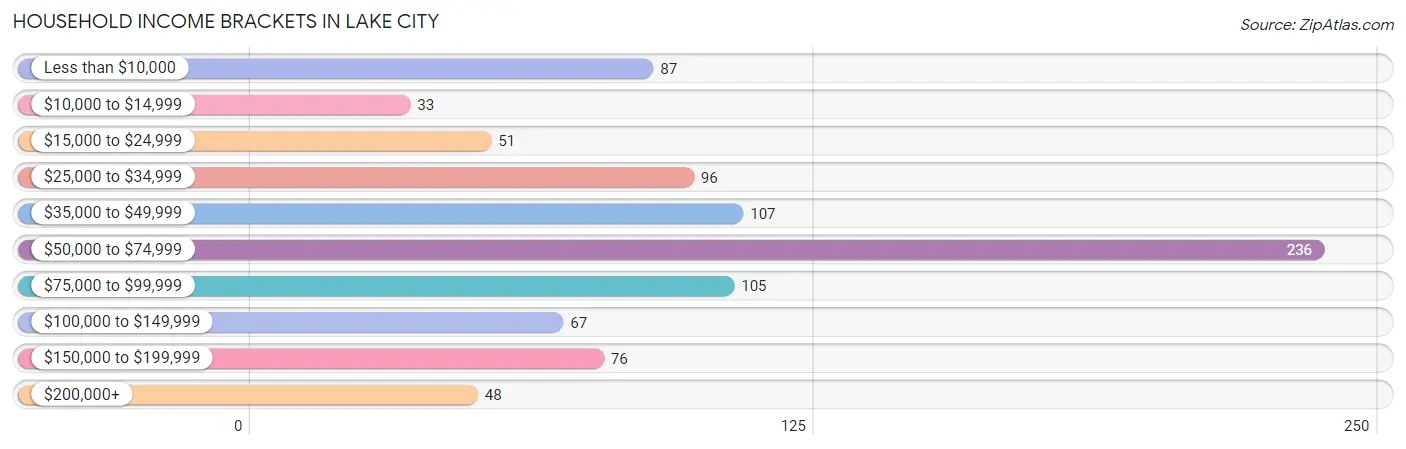
| Income Bracket | # Households | % Households |
| Less than $10,000 | 87 | 9.6% |
| $10,000 to $14,999 | 33 | 3.6% |
| $15,000 to $24,999 | 51 | 5.6% |
| $25,000 to $34,999 | 96 | 10.6% |
| $35,000 to $49,999 | 107 | 11.8% |
| $50,000 to $74,999 | 236 | 26.0% |
| $75,000 to $99,999 | 105 | 11.6% |
| $100,000 to $149,999 | 67 | 7.4% |
| $150,000 to $199,999 | 76 | 8.4% |
| $200,000+ | 48 | 5.3% |
Household Income by Householder Age in Lake City
The median household income in Lake City is $62,941, with the highest median household income of $88,438 found in the 45 to 64 years age bracket for the primary householder. A total of 374 households (41.3%) fall into this category. Meanwhile, the 65+ years age bracket for the primary householder has the lowest median household income of $40,104, with 216 households (23.8%) in this group.
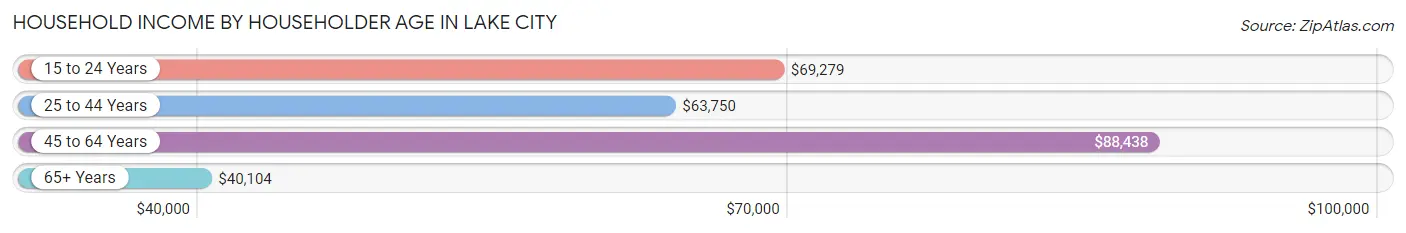
| Income Bracket | # Households | Median Income |
| 15 to 24 Years | 37 (4.1%) | $69,279 |
| 25 to 44 Years | 279 (30.8%) | $63,750 |
| 45 to 64 Years | 374 (41.3%) | $88,438 |
| 65+ Years | 216 (23.8%) | $40,104 |
| Total | 906 (100.0%) | $62,941 |
Poverty in Lake City
Income Below Poverty by Sex and Age in Lake City
With 6.4% poverty level for males and 12.9% for females among the residents of Lake City, 65 to 74 year old males and 12 to 14 year old females are the most vulnerable to poverty, with 24 males (29.6%) and 21 females (70.0%) in their respective age groups living below the poverty level.
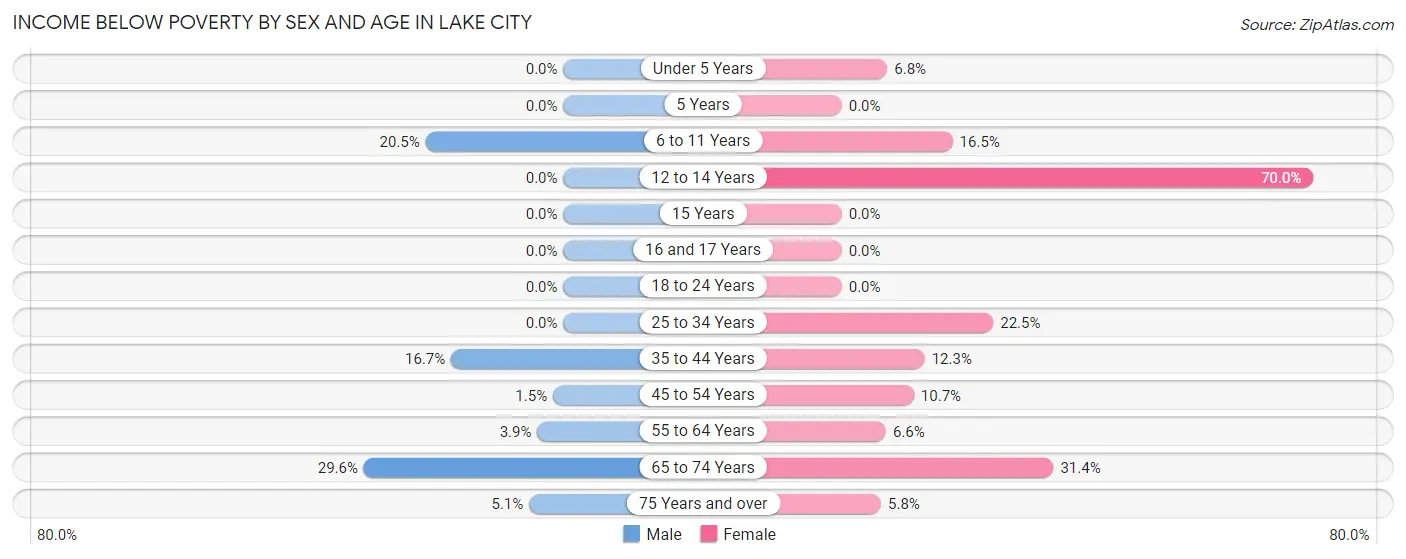
| Age Bracket | Male | Female |
| Under 5 Years | 0 (0.0%) | 5 (6.8%) |
| 5 Years | 0 (0.0%) | 0 (0.0%) |
| 6 to 11 Years | 18 (20.4%) | 13 (16.5%) |
| 12 to 14 Years | 0 (0.0%) | 21 (70.0%) |
| 15 Years | 0 (0.0%) | 0 (0.0%) |
| 16 and 17 Years | 0 (0.0%) | 0 (0.0%) |
| 18 to 24 Years | 0 (0.0%) | 0 (0.0%) |
| 25 to 34 Years | 0 (0.0%) | 45 (22.5%) |
| 35 to 44 Years | 17 (16.7%) | 17 (12.3%) |
| 45 to 54 Years | 4 (1.5%) | 21 (10.7%) |
| 55 to 64 Years | 6 (3.9%) | 13 (6.6%) |
| 65 to 74 Years | 24 (29.6%) | 22 (31.4%) |
| 75 Years and over | 3 (5.1%) | 6 (5.8%) |
| Total | 72 (6.4%) | 163 (12.9%) |
Income Above Poverty by Sex and Age in Lake City
According to the poverty statistics in Lake City, males aged under 5 years and females aged 5 years are the age groups that are most secure financially, with 100.0% of males and 100.0% of females in these age groups living above the poverty line.
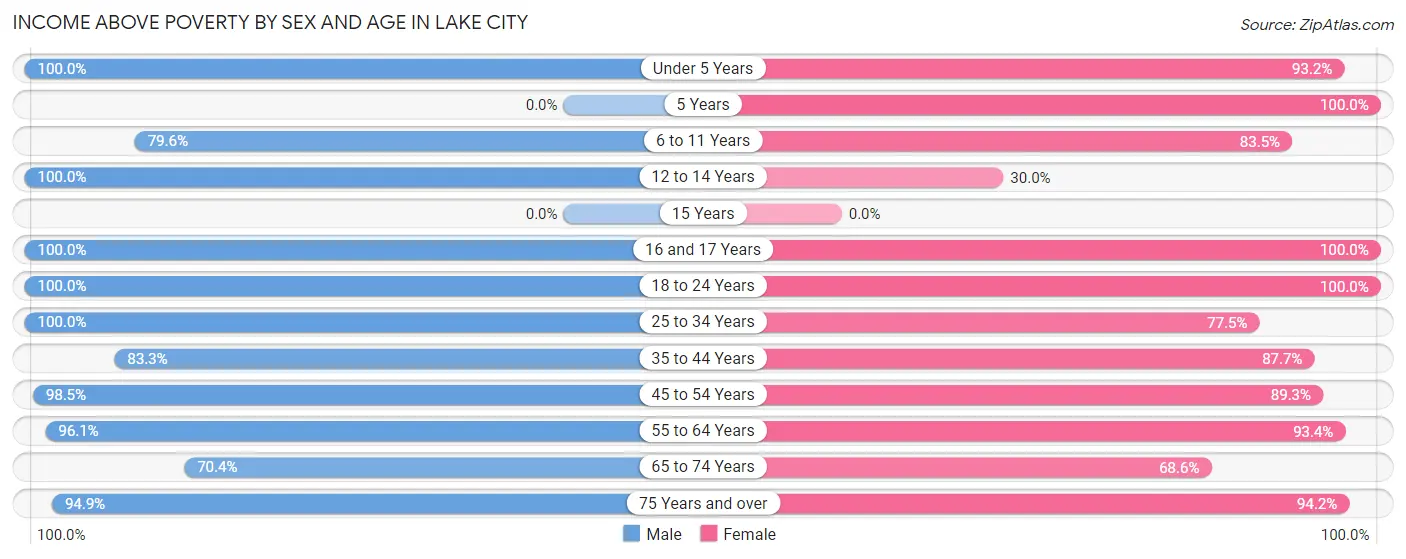
| Age Bracket | Male | Female |
| Under 5 Years | 64 (100.0%) | 69 (93.2%) |
| 5 Years | 0 (0.0%) | 11 (100.0%) |
| 6 to 11 Years | 70 (79.5%) | 66 (83.5%) |
| 12 to 14 Years | 43 (100.0%) | 9 (30.0%) |
| 15 Years | 0 (0.0%) | 0 (0.0%) |
| 16 and 17 Years | 18 (100.0%) | 71 (100.0%) |
| 18 to 24 Years | 31 (100.0%) | 92 (100.0%) |
| 25 to 34 Years | 229 (100.0%) | 155 (77.5%) |
| 35 to 44 Years | 85 (83.3%) | 121 (87.7%) |
| 45 to 54 Years | 256 (98.5%) | 175 (89.3%) |
| 55 to 64 Years | 149 (96.1%) | 185 (93.4%) |
| 65 to 74 Years | 57 (70.4%) | 48 (68.6%) |
| 75 Years and over | 56 (94.9%) | 97 (94.2%) |
| Total | 1,058 (93.6%) | 1,099 (87.1%) |
Income Below Poverty Among Married-Couple Families in Lake City
The poverty statistics for married-couple families in Lake City show that 6.6% or 19 of the total 288 families live below the poverty line. Families with no children have the highest poverty rate of 8.7%, comprising of 15 families. On the other hand, families with 3 or 4 children have the lowest poverty rate of 0.0%, which includes 0 families.
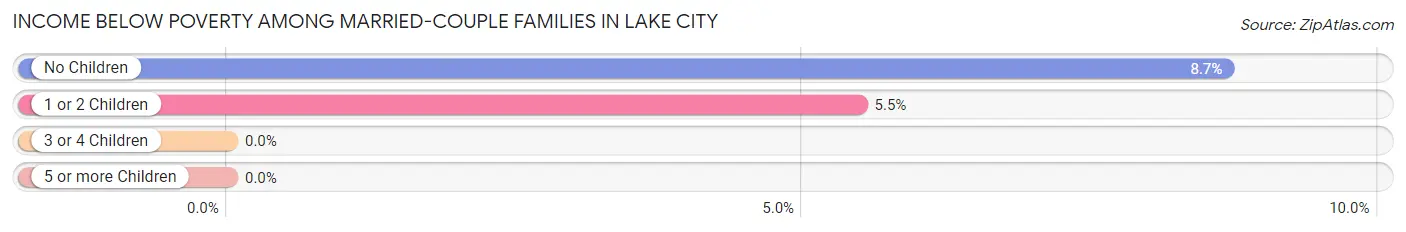
| Children | Above Poverty | Below Poverty |
| No Children | 158 (91.3%) | 15 (8.7%) |
| 1 or 2 Children | 69 (94.5%) | 4 (5.5%) |
| 3 or 4 Children | 42 (100.0%) | 0 (0.0%) |
| 5 or more Children | 0 (0.0%) | 0 (0.0%) |
| Total | 269 (93.4%) | 19 (6.6%) |
Income Below Poverty Among Single-Parent Households in Lake City
According to the poverty data in Lake City, 3.5% or 3 single-father households and 13.5% or 17 single-mother households are living below the poverty line. Among single-father households, those with 1 or 2 children have the highest poverty rate, with 3 households (27.3%) experiencing poverty. Likewise, among single-mother households, those with 1 or 2 children have the highest poverty rate, with 17 households (19.3%) falling below the poverty line.
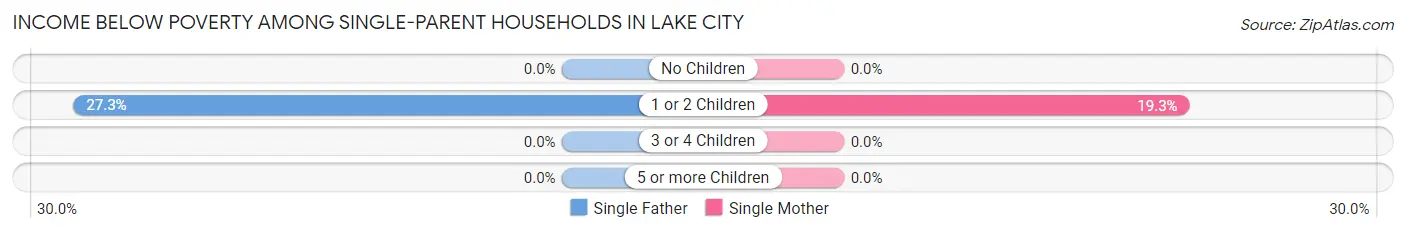
| Children | Single Father | Single Mother |
| No Children | 0 (0.0%) | 0 (0.0%) |
| 1 or 2 Children | 3 (27.3%) | 17 (19.3%) |
| 3 or 4 Children | 0 (0.0%) | 0 (0.0%) |
| 5 or more Children | 0 (0.0%) | 0 (0.0%) |
| Total | 3 (3.5%) | 17 (13.5%) |
Income Below Poverty Among Married-Couple vs Single-Parent Households in Lake City
The poverty data for Lake City shows that 19 of the married-couple family households (6.6%) and 20 of the single-parent households (9.4%) are living below the poverty level. Within the married-couple family households, those with no children have the highest poverty rate, with 15 households (8.7%) falling below the poverty line. Among the single-parent households, those with 1 or 2 children have the highest poverty rate, with 20 household (20.2%) living below poverty.
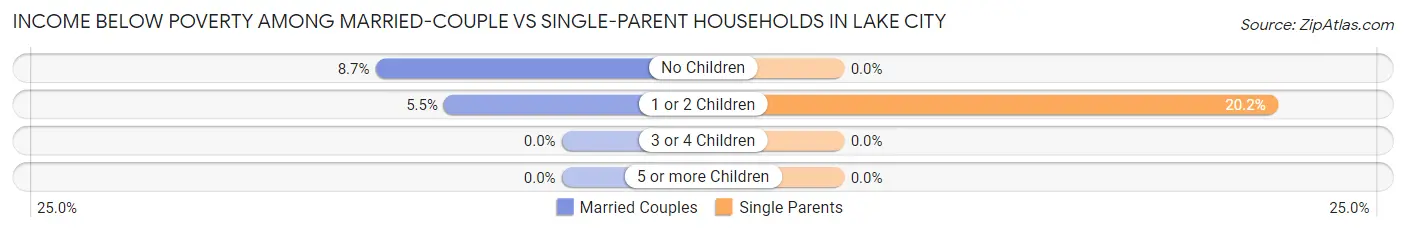
| Children | Married-Couple Families | Single-Parent Households |
| No Children | 15 (8.7%) | 0 (0.0%) |
| 1 or 2 Children | 4 (5.5%) | 20 (20.2%) |
| 3 or 4 Children | 0 (0.0%) | 0 (0.0%) |
| 5 or more Children | 0 (0.0%) | 0 (0.0%) |
| Total | 19 (6.6%) | 20 (9.4%) |
Race in Lake City
The most populous races in Lake City are Black / African American (1,235 | 42.3%), Asian (871 | 29.9%), and White / Caucasian (469 | 16.1%).
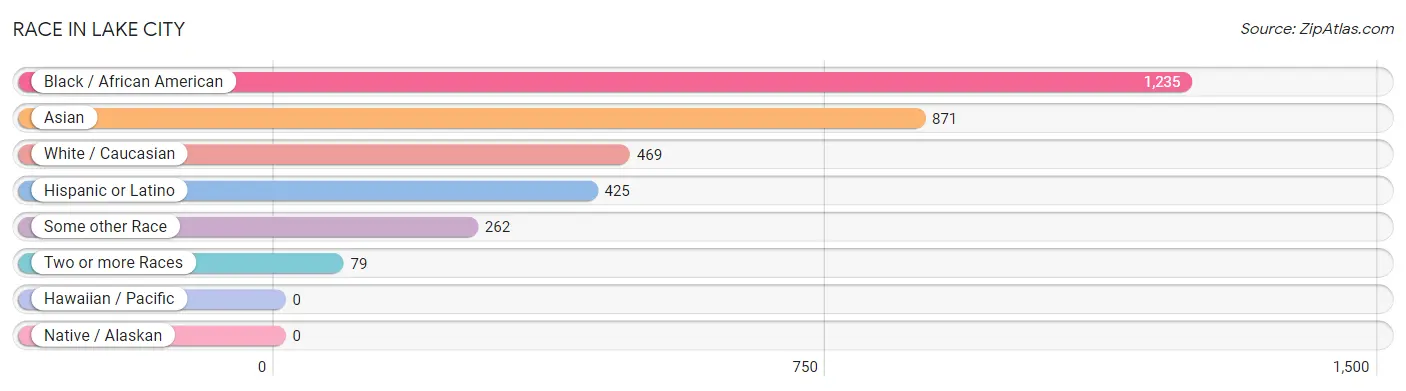
| Race | # Population | % Population |
| Asian | 871 | 29.9% |
| Black / African American | 1,235 | 42.3% |
| Hawaiian / Pacific | 0 | 0.0% |
| Hispanic or Latino | 425 | 14.6% |
| Native / Alaskan | 0 | 0.0% |
| White / Caucasian | 469 | 16.1% |
| Two or more Races | 79 | 2.7% |
| Some other Race | 262 | 9.0% |
| Total | 2,916 | 100.0% |
Ancestry in Lake City
The most populous ancestries reported in Lake City are Sri Lankan (759 | 26.0%), Mexican (310 | 10.6%), American (169 | 5.8%), Indian (Asian) (62 | 2.1%), and Central American (56 | 1.9%), together accounting for 46.5% of all Lake City residents.
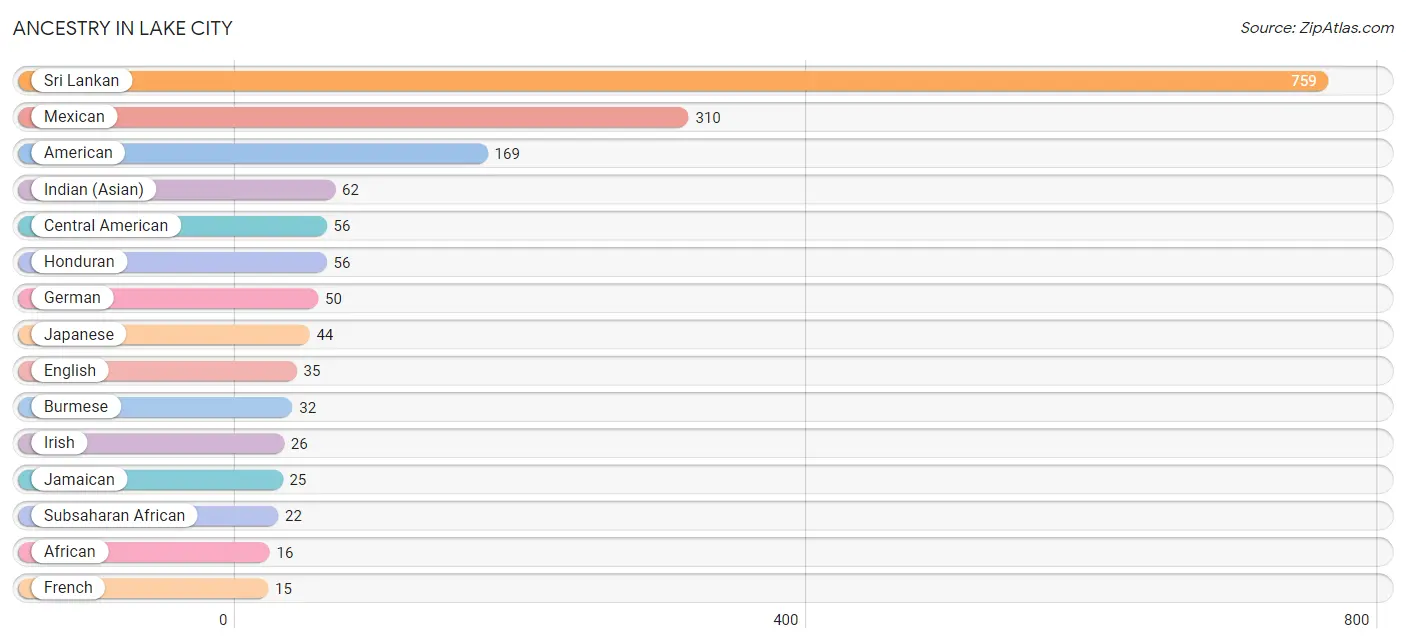
| Ancestry | # Population | % Population |
| African | 16 | 0.5% |
| American | 169 | 5.8% |
| Argentinean | 7 | 0.2% |
| British | 2 | 0.1% |
| Burmese | 32 | 1.1% |
| Central American | 56 | 1.9% |
| Dominican | 11 | 0.4% |
| Dutch | 4 | 0.1% |
| English | 35 | 1.2% |
| European | 9 | 0.3% |
| French | 15 | 0.5% |
| German | 50 | 1.7% |
| Guyanese | 9 | 0.3% |
| Honduran | 56 | 1.9% |
| Hungarian | 7 | 0.2% |
| Indian (Asian) | 62 | 2.1% |
| Irish | 26 | 0.9% |
| Italian | 10 | 0.3% |
| Jamaican | 25 | 0.9% |
| Japanese | 44 | 1.5% |
| Mexican | 310 | 10.6% |
| Nigerian | 6 | 0.2% |
| Polish | 14 | 0.5% |
| Puerto Rican | 14 | 0.5% |
| Scottish | 12 | 0.4% |
| South American | 7 | 0.2% |
| Sri Lankan | 759 | 26.0% |
| Subsaharan African | 22 | 0.7% |
| U.S. Virgin Islander | 6 | 0.2% |
| Welsh | 7 | 0.2% | View All 30 Rows |
Immigrants in Lake City
The most numerous immigrant groups reported in Lake City came from Asia (802 | 27.5%), South Eastern Asia (706 | 24.2%), Vietnam (700 | 24.0%), Latin America (240 | 8.2%), and Central America (211 | 7.2%), together accounting for 91.2% of all Lake City residents.
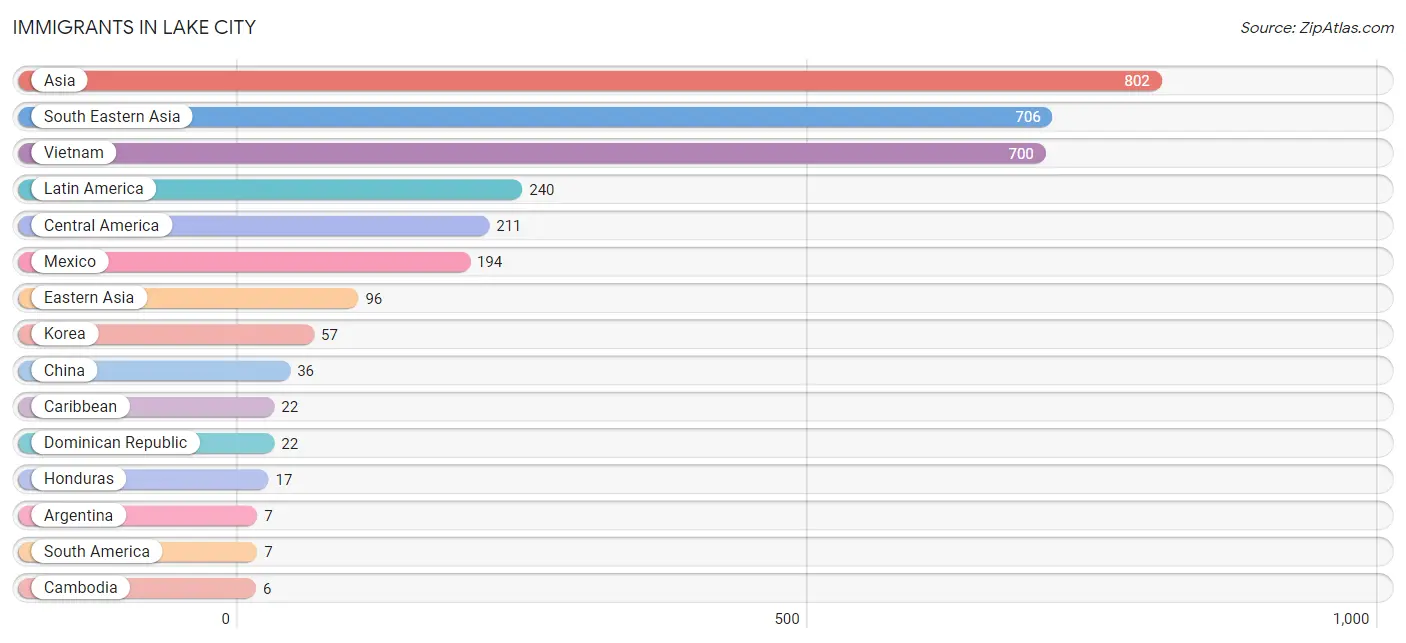
| Immigration Origin | # Population | % Population |
| Argentina | 7 | 0.2% |
| Asia | 802 | 27.5% |
| Cambodia | 6 | 0.2% |
| Caribbean | 22 | 0.7% |
| Central America | 211 | 7.2% |
| China | 36 | 1.2% |
| Dominican Republic | 22 | 0.7% |
| Eastern Asia | 96 | 3.3% |
| Honduras | 17 | 0.6% |
| Japan | 3 | 0.1% |
| Korea | 57 | 1.9% |
| Latin America | 240 | 8.2% |
| Mexico | 194 | 6.7% |
| South America | 7 | 0.2% |
| South Eastern Asia | 706 | 24.2% |
| Vietnam | 700 | 24.0% | View All 16 Rows |
Sex and Age in Lake City
Sex and Age in Lake City
The most populous age groups in Lake City are 45 to 49 Years (176 | 13.2%) for men and 20 to 24 Years (197 | 12.5%) for women.
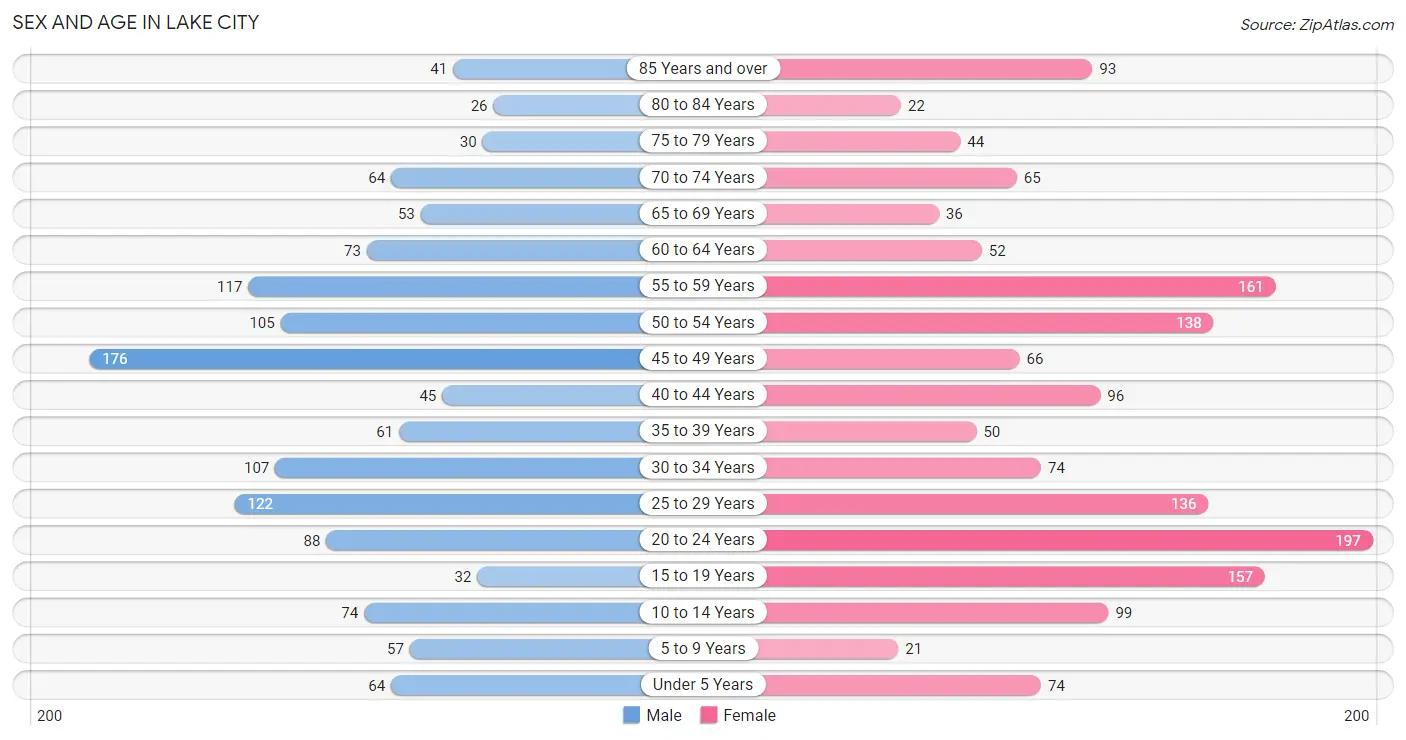
| Age Bracket | Male | Female |
| Under 5 Years | 64 (4.8%) | 74 (4.7%) |
| 5 to 9 Years | 57 (4.3%) | 21 (1.3%) |
| 10 to 14 Years | 74 (5.5%) | 99 (6.3%) |
| 15 to 19 Years | 32 (2.4%) | 157 (9.9%) |
| 20 to 24 Years | 88 (6.6%) | 197 (12.5%) |
| 25 to 29 Years | 122 (9.1%) | 136 (8.6%) |
| 30 to 34 Years | 107 (8.0%) | 74 (4.7%) |
| 35 to 39 Years | 61 (4.6%) | 50 (3.2%) |
| 40 to 44 Years | 45 (3.4%) | 96 (6.1%) |
| 45 to 49 Years | 176 (13.2%) | 66 (4.2%) |
| 50 to 54 Years | 105 (7.9%) | 138 (8.7%) |
| 55 to 59 Years | 117 (8.8%) | 161 (10.2%) |
| 60 to 64 Years | 73 (5.5%) | 52 (3.3%) |
| 65 to 69 Years | 53 (4.0%) | 36 (2.3%) |
| 70 to 74 Years | 64 (4.8%) | 65 (4.1%) |
| 75 to 79 Years | 30 (2.2%) | 44 (2.8%) |
| 80 to 84 Years | 26 (1.9%) | 22 (1.4%) |
| 85 Years and over | 41 (3.1%) | 93 (5.9%) |
| Total | 1,335 (100.0%) | 1,581 (100.0%) |
Families and Households in Lake City
Median Family Size in Lake City
The median family size in Lake City is 3.58 persons per family, with single female/mother families (126 | 25.2%) accounting for the largest median family size of 3.91 persons per family. On the other hand, single male/father families (86 | 17.2%) represent the smallest median family size with 2.07 persons per family.
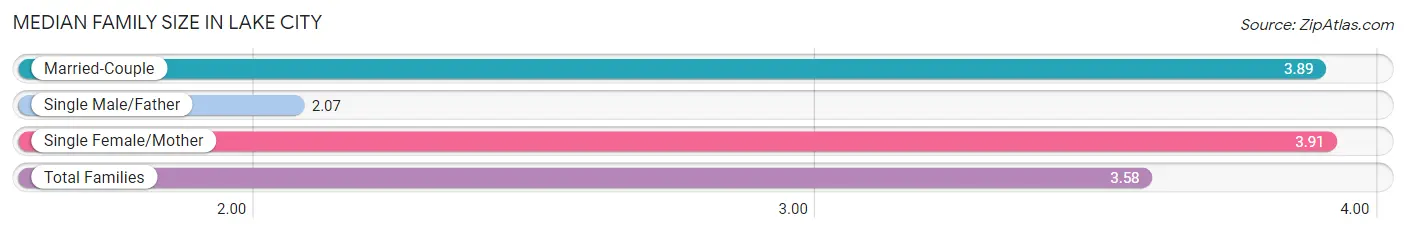
| Family Type | # Families | Family Size |
| Married-Couple | 288 (57.6%) | 3.89 |
| Single Male/Father | 86 (17.2%) | 2.07 |
| Single Female/Mother | 126 (25.2%) | 3.91 |
| Total Families | 500 (100.0%) | 3.58 |
Median Household Size in Lake City
The median household size in Lake City is 2.64 persons per household, with married-couple households (288 | 31.8%) accounting for the largest median household size of 3.98 persons per household. non-family households (406 | 44.8%) represent the smallest median household size with 1.07 persons per household.
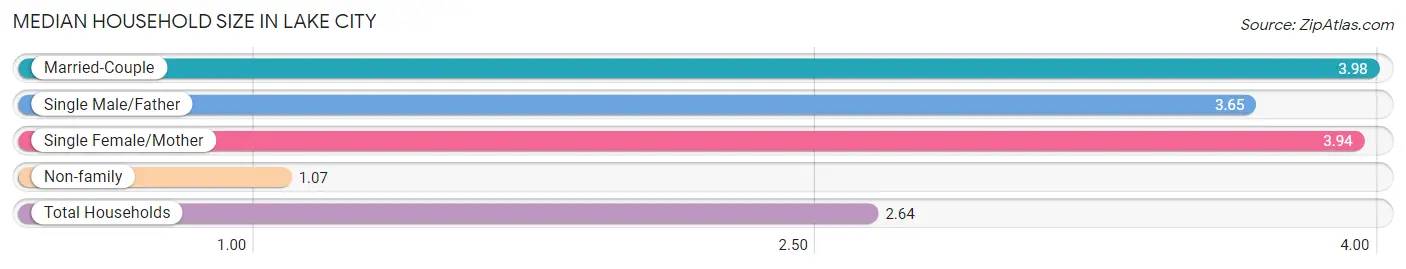
| Household Type | # Households | Household Size |
| Married-Couple | 288 (31.8%) | 3.98 |
| Single Male/Father | 86 (9.5%) | 3.65 |
| Single Female/Mother | 126 (13.9%) | 3.94 |
| Non-family | 406 (44.8%) | 1.07 |
| Total Households | 906 (100.0%) | 2.64 |
Household Size by Marriage Status in Lake City
Out of a total of 906 households in Lake City, 500 (55.2%) are family households, while 406 (44.8%) are nonfamily households. The most numerous type of family households are 3-person households, comprising 150, and the most common type of nonfamily households are 1-person households, comprising 393.
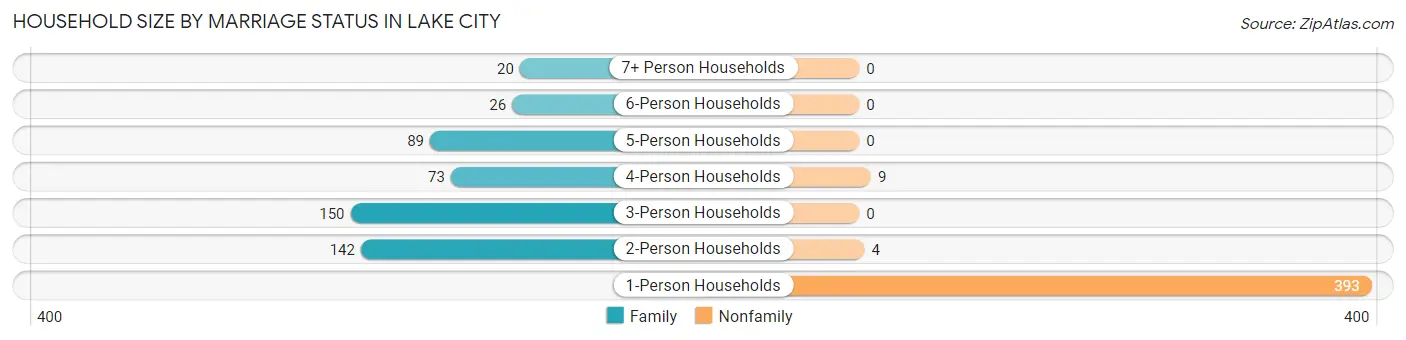
| Household Size | Family Households | Nonfamily Households |
| 1-Person Households | - | 393 (43.4%) |
| 2-Person Households | 142 (15.7%) | 4 (0.4%) |
| 3-Person Households | 150 (16.6%) | 0 (0.0%) |
| 4-Person Households | 73 (8.1%) | 9 (1.0%) |
| 5-Person Households | 89 (9.8%) | 0 (0.0%) |
| 6-Person Households | 26 (2.9%) | 0 (0.0%) |
| 7+ Person Households | 20 (2.2%) | 0 (0.0%) |
| Total | 500 (55.2%) | 406 (44.8%) |
Female Fertility in Lake City
Fertility by Age in Lake City
Average fertility rate in Lake City is 42.0 births per 1,000 women. Women in the age bracket of 35 to 50 years have the highest fertility rate with 74.0 births per 1,000 women. Women in the age bracket of 20 to 34 years acount for 51.5% of all women with births.
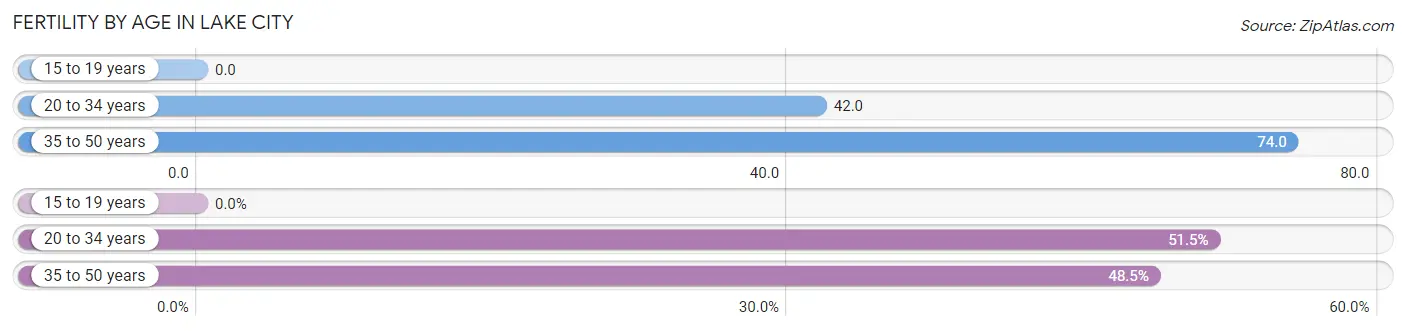
| Age Bracket | Women with Births | Births / 1,000 Women |
| 15 to 19 years | 0 (0.0%) | 0.0 |
| 20 to 34 years | 17 (51.5%) | 42.0 |
| 35 to 50 years | 16 (48.5%) | 74.0 |
| Total | 33 (100.0%) | 42.0 |
Fertility by Age by Marriage Status in Lake City
87.9% of women with births (33) in Lake City are married. The highest percentage of unmarried women with births falls into 35 to 50 years age bracket with 25.0% of them unmarried at the time of birth, while the lowest percentage of unmarried women with births belong to 20 to 34 years age bracket with 0.0% of them unmarried.
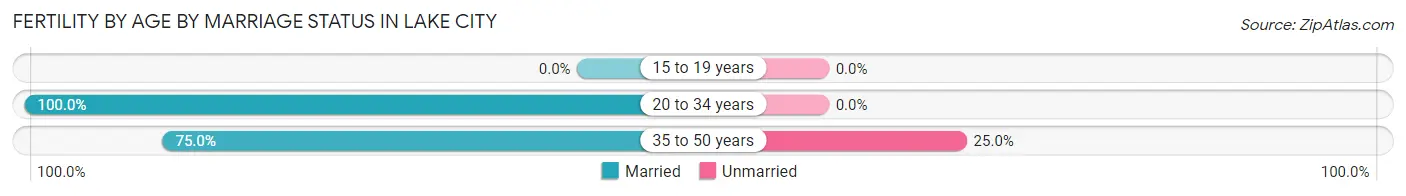
| Age Bracket | Married | Unmarried |
| 15 to 19 years | 0 (0.0%) | 0 (0.0%) |
| 20 to 34 years | 17 (100.0%) | 0 (0.0%) |
| 35 to 50 years | 12 (75.0%) | 4 (25.0%) |
| Total | 29 (87.9%) | 4 (12.1%) |
Fertility by Education in Lake City
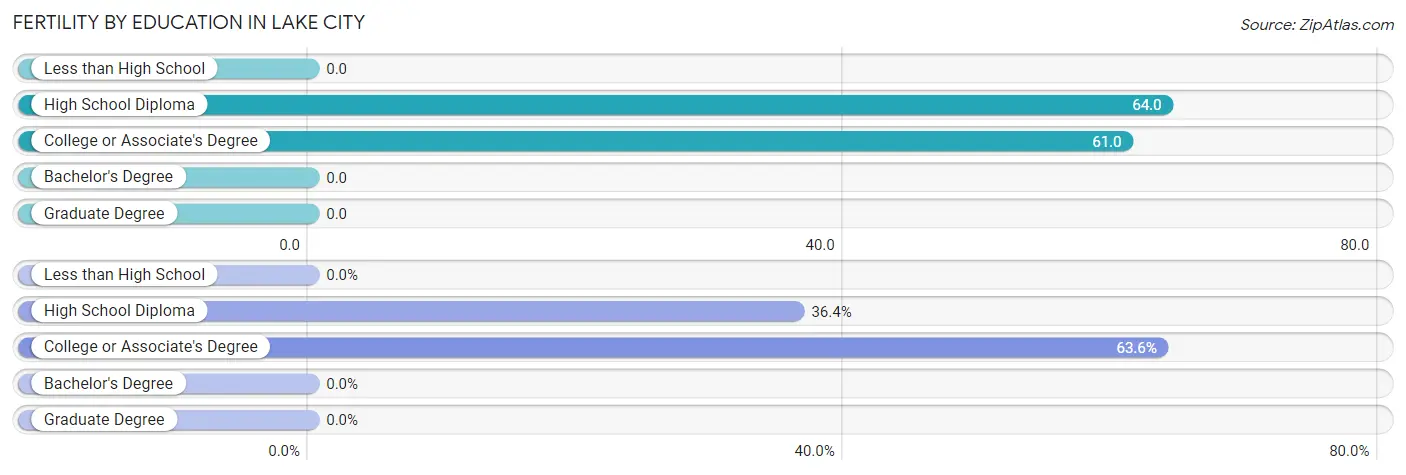
| Educational Attainment | Women with Births | Births / 1,000 Women |
| Less than High School | 0 (0.0%) | 0.0 |
| High School Diploma | 12 (36.4%) | 64.0 |
| College or Associate's Degree | 21 (63.6%) | 61.0 |
| Bachelor's Degree | 0 (0.0%) | 0.0 |
| Graduate Degree | 0 (0.0%) | 0.0 |
| Total | 33 (100.0%) | 42.0 |
Fertility by Education by Marriage Status in Lake City
12.1% of women with births in Lake City are unmarried. Women with the educational attainment of high school diploma are most likely to be married with 100.0% of them married at childbirth, while women with the educational attainment of college or associate's degree are least likely to be married with 19.1% of them unmarried at childbirth.
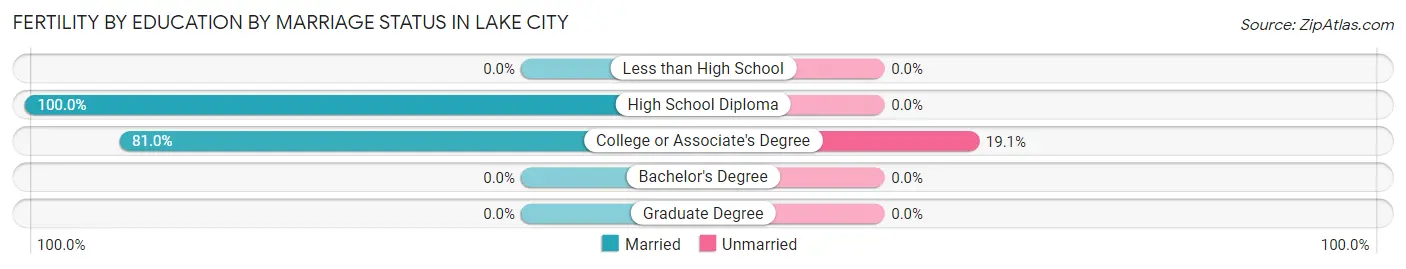
| Educational Attainment | Married | Unmarried |
| Less than High School | 0 (0.0%) | 0 (0.0%) |
| High School Diploma | 12 (100.0%) | 0 (0.0%) |
| College or Associate's Degree | 17 (80.9%) | 4 (19.1%) |
| Bachelor's Degree | 0 (0.0%) | 0 (0.0%) |
| Graduate Degree | 0 (0.0%) | 0 (0.0%) |
| Total | 29 (87.9%) | 4 (12.1%) |
Employment Characteristics in Lake City
Employment by Class of Employer in Lake City
Among the 1,584 employed individuals in Lake City, private company employees (1,294 | 81.7%), self-employed (not incorporated) (90 | 5.7%), and not-for-profit organizations (72 | 4.5%) make up the most common classes of employment.
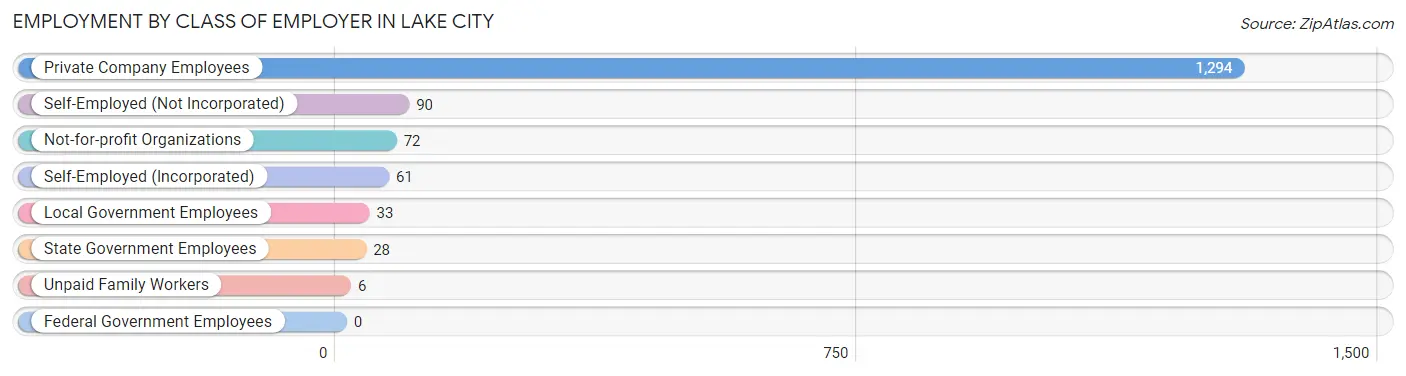
| Employer Class | # Employees | % Employees |
| Private Company Employees | 1,294 | 81.7% |
| Self-Employed (Incorporated) | 61 | 3.8% |
| Self-Employed (Not Incorporated) | 90 | 5.7% |
| Not-for-profit Organizations | 72 | 4.5% |
| Local Government Employees | 33 | 2.1% |
| State Government Employees | 28 | 1.8% |
| Federal Government Employees | 0 | 0.0% |
| Unpaid Family Workers | 6 | 0.4% |
| Total | 1,584 | 100.0% |
Employment Status by Age in Lake City
According to the labor force statistics for Lake City, out of the total population over 16 years of age (2,527), 64.7% or 1,635 individuals are in the labor force, with 1.8% or 29 of them unemployed. The age group with the highest labor force participation rate is 30 to 34 years, with 100.0% or 181 individuals in the labor force. Within the labor force, the 65 to 74 years age range has the highest percentage of unemployed individuals, with 15.6% or 7 of them being unemployed.
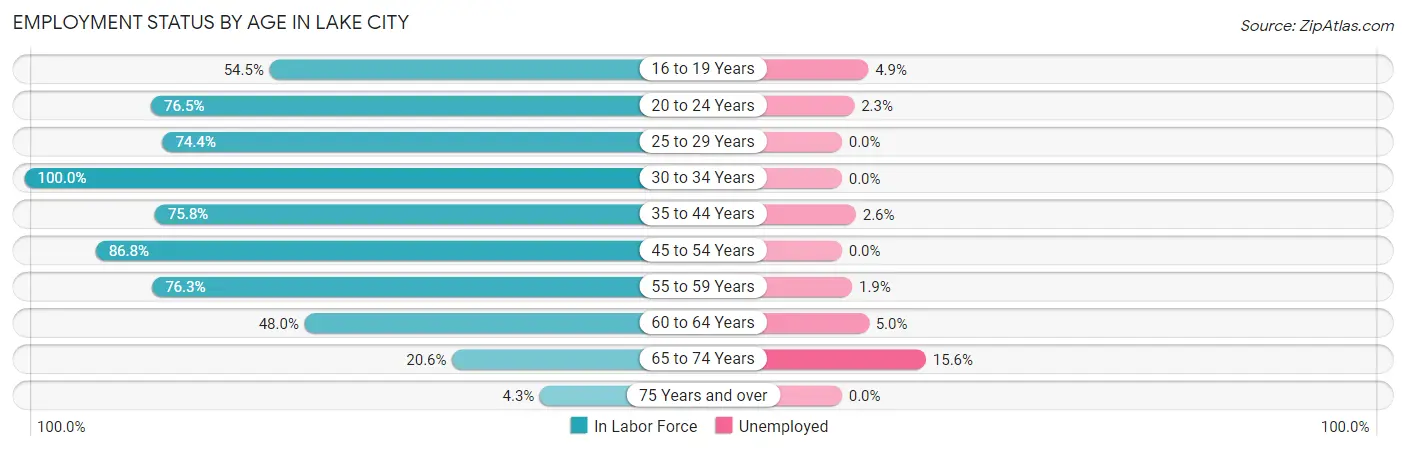
| Age Bracket | In Labor Force | Unemployed |
| 16 to 19 Years | 103 (54.5%) | 5 (4.9%) |
| 20 to 24 Years | 218 (76.5%) | 5 (2.3%) |
| 25 to 29 Years | 192 (74.4%) | 0 (0.0%) |
| 30 to 34 Years | 181 (100.0%) | 0 (0.0%) |
| 35 to 44 Years | 191 (75.8%) | 5 (2.6%) |
| 45 to 54 Years | 421 (86.8%) | 0 (0.0%) |
| 55 to 59 Years | 212 (76.3%) | 4 (1.9%) |
| 60 to 64 Years | 60 (48.0%) | 3 (5.0%) |
| 65 to 74 Years | 45 (20.6%) | 7 (15.6%) |
| 75 Years and over | 11 (4.3%) | 0 (0.0%) |
| Total | 1,635 (64.7%) | 29 (1.8%) |
Employment Status by Educational Attainment in Lake City
According to labor force statistics for Lake City, 79.6% of individuals (1,257) out of the total population between 25 and 64 years of age (1,579) are in the labor force, with 1.0% or 13 of them being unemployed. The group with the highest labor force participation rate are those with the educational attainment of bachelor's degree or higher, with 95.6% or 237 individuals in the labor force. Within the labor force, individuals with college / associate degree education have the highest percentage of unemployment, with 1.8% or 4 of them being unemployed.
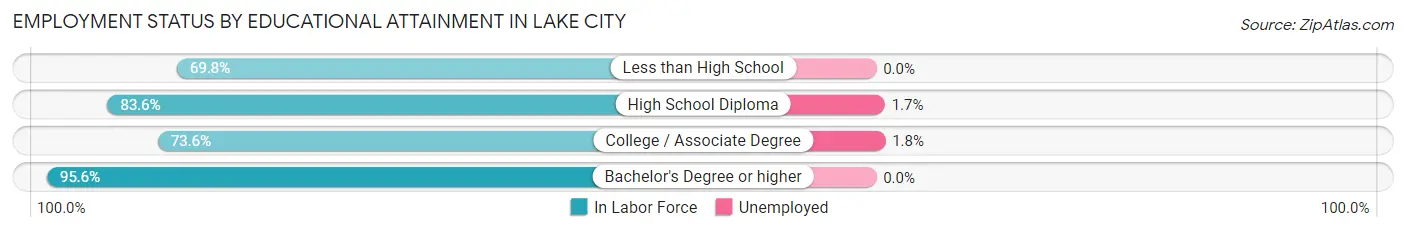
| Educational Attainment | In Labor Force | Unemployed |
| Less than High School | 314 (69.8%) | 0 (0.0%) |
| High School Diploma | 480 (83.6%) | 10 (1.7%) |
| College / Associate Degree | 226 (73.6%) | 6 (1.8%) |
| Bachelor's Degree or higher | 237 (95.6%) | 0 (0.0%) |
| Total | 1,257 (79.6%) | 16 (1.0%) |
Employment Occupations by Sex in Lake City
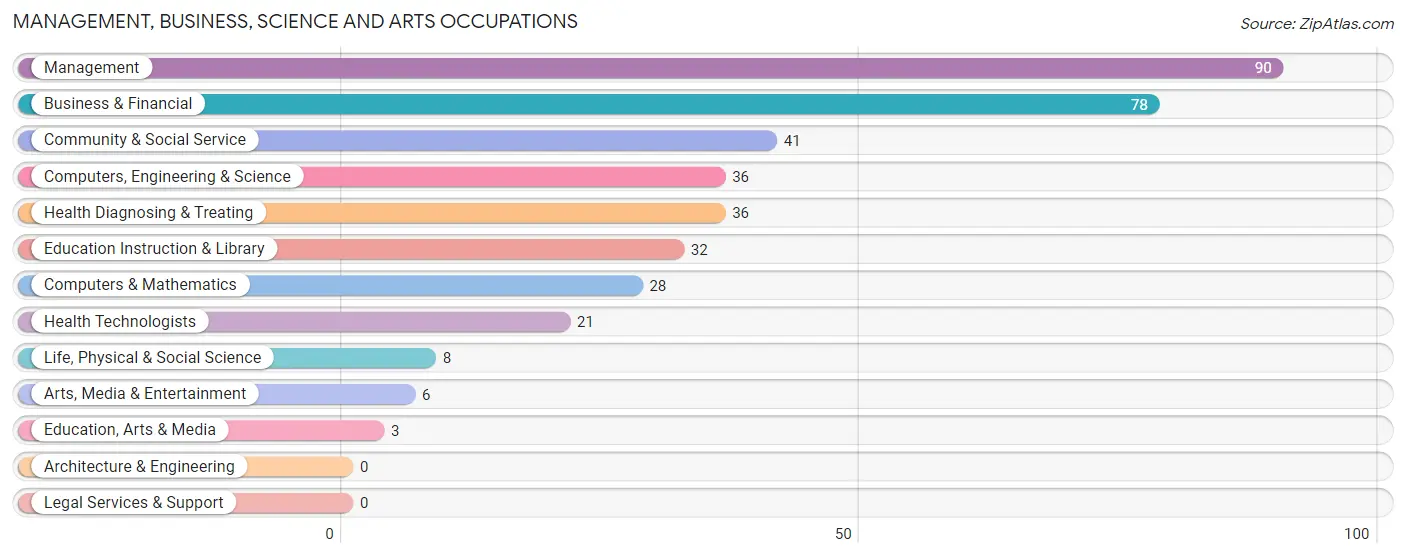
Management, Business, Science and Arts Occupations
The most common Management, Business, Science and Arts occupations in Lake City are Management (90 | 5.6%), Business & Financial (78 | 4.9%), Community & Social Service (41 | 2.5%), Computers, Engineering & Science (36 | 2.2%), and Health Diagnosing & Treating (36 | 2.2%).
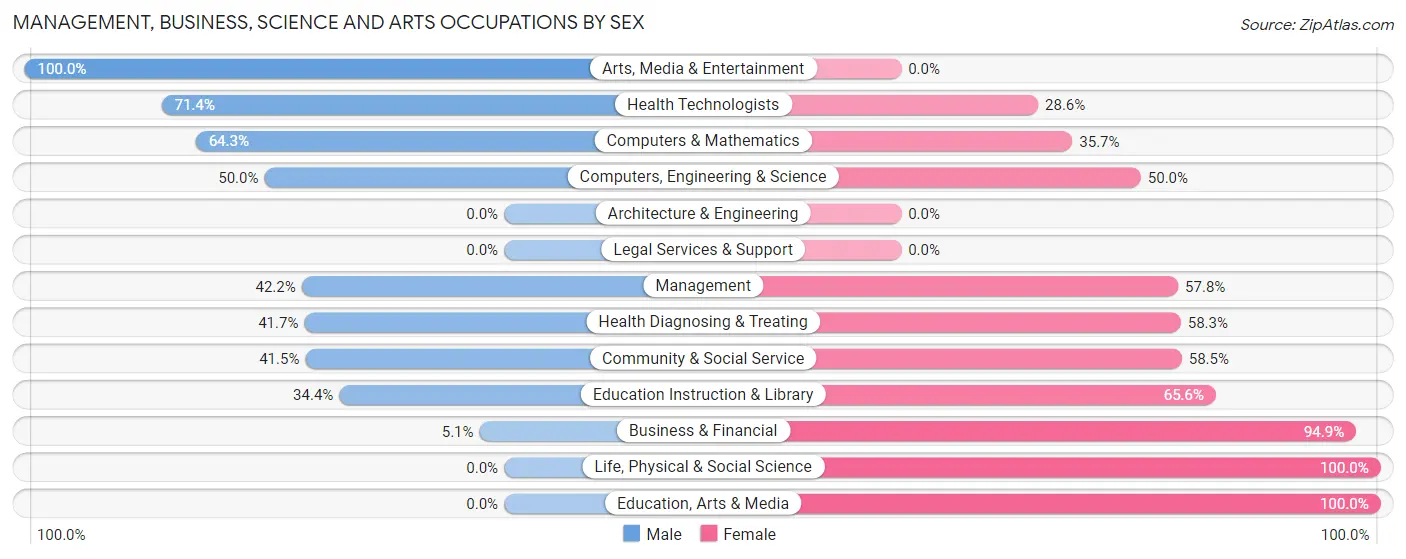
Management, Business, Science and Arts Occupations by Sex
Within the Management, Business, Science and Arts occupations in Lake City, the most male-oriented occupations are Arts, Media & Entertainment (100.0%), Health Technologists (71.4%), and Computers & Mathematics (64.3%), while the most female-oriented occupations are Life, Physical & Social Science (100.0%), Education, Arts & Media (100.0%), and Business & Financial (94.9%).
| Occupation | Male | Female |
| Management | 38 (42.2%) | 52 (57.8%) |
| Business & Financial | 4 (5.1%) | 74 (94.9%) |
| Computers, Engineering & Science | 18 (50.0%) | 18 (50.0%) |
| Computers & Mathematics | 18 (64.3%) | 10 (35.7%) |
| Architecture & Engineering | 0 (0.0%) | 0 (0.0%) |
| Life, Physical & Social Science | 0 (0.0%) | 8 (100.0%) |
| Community & Social Service | 17 (41.5%) | 24 (58.5%) |
| Education, Arts & Media | 0 (0.0%) | 3 (100.0%) |
| Legal Services & Support | 0 (0.0%) | 0 (0.0%) |
| Education Instruction & Library | 11 (34.4%) | 21 (65.6%) |
| Arts, Media & Entertainment | 6 (100.0%) | 0 (0.0%) |
| Health Diagnosing & Treating | 15 (41.7%) | 21 (58.3%) |
| Health Technologists | 15 (71.4%) | 6 (28.6%) |
| Total (Category) | 92 (32.7%) | 189 (67.3%) |
| Total (Overall) | 753 (46.9%) | 852 (53.1%) |
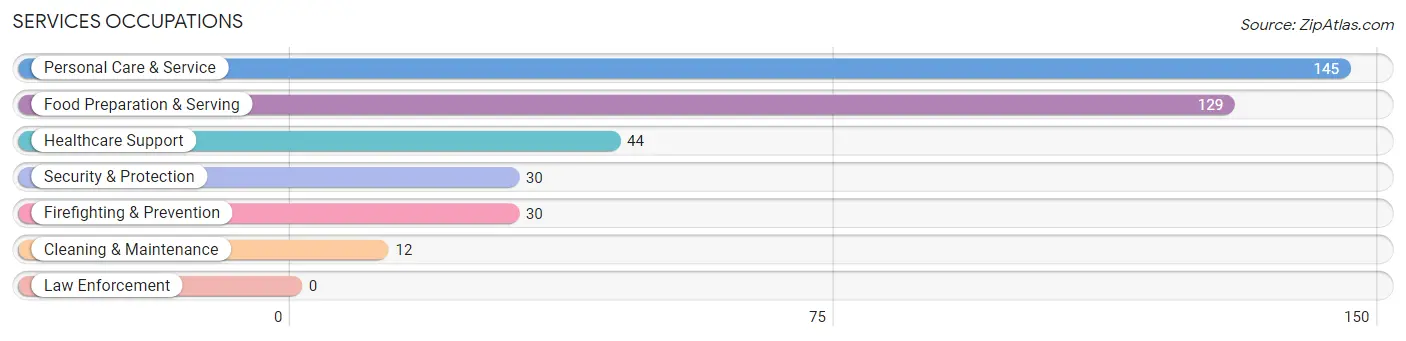
Services Occupations
The most common Services occupations in Lake City are Personal Care & Service (145 | 9.0%), Food Preparation & Serving (129 | 8.0%), Healthcare Support (44 | 2.7%), Security & Protection (30 | 1.9%), and Firefighting & Prevention (30 | 1.9%).
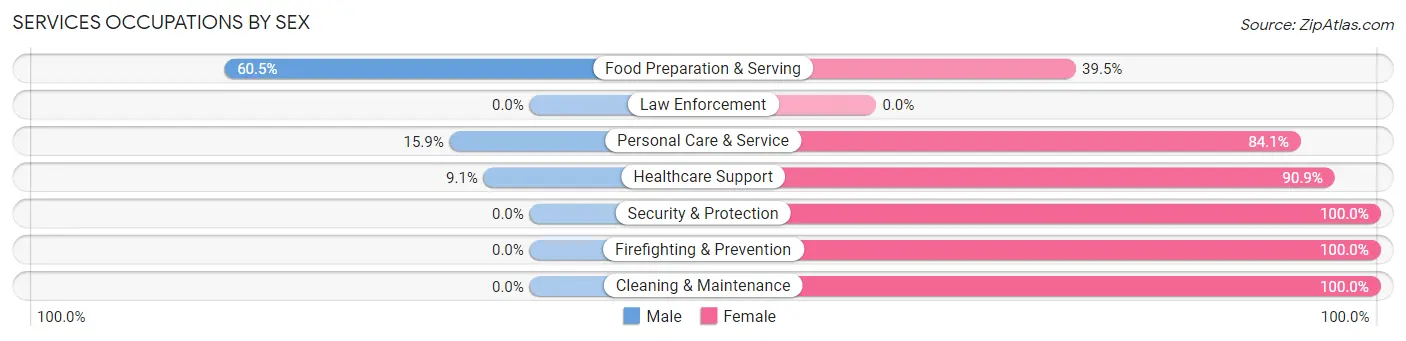
Services Occupations by Sex
Within the Services occupations in Lake City, the most male-oriented occupations are Food Preparation & Serving (60.5%), Personal Care & Service (15.9%), and Healthcare Support (9.1%), while the most female-oriented occupations are Security & Protection (100.0%), Firefighting & Prevention (100.0%), and Cleaning & Maintenance (100.0%).
| Occupation | Male | Female |
| Healthcare Support | 4 (9.1%) | 40 (90.9%) |
| Security & Protection | 0 (0.0%) | 30 (100.0%) |
| Firefighting & Prevention | 0 (0.0%) | 30 (100.0%) |
| Law Enforcement | 0 (0.0%) | 0 (0.0%) |
| Food Preparation & Serving | 78 (60.5%) | 51 (39.5%) |
| Cleaning & Maintenance | 0 (0.0%) | 12 (100.0%) |
| Personal Care & Service | 23 (15.9%) | 122 (84.1%) |
| Total (Category) | 105 (29.2%) | 255 (70.8%) |
| Total (Overall) | 753 (46.9%) | 852 (53.1%) |
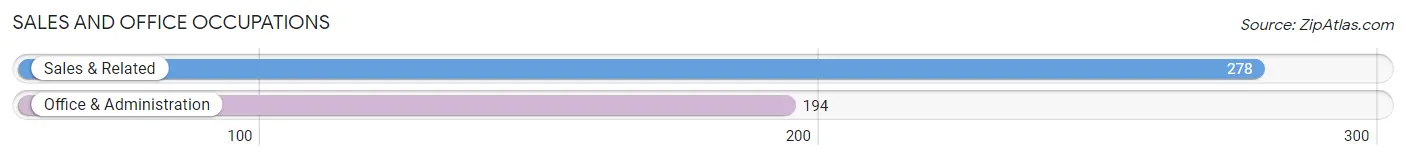
Sales and Office Occupations
The most common Sales and Office occupations in Lake City are Sales & Related (278 | 17.3%), and Office & Administration (194 | 12.1%).
Sales and Office Occupations by Sex
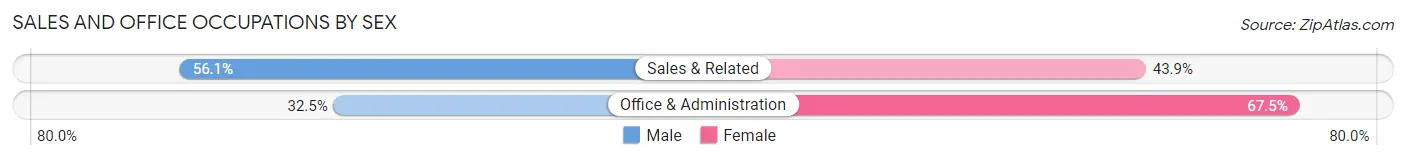
| Occupation | Male | Female |
| Sales & Related | 156 (56.1%) | 122 (43.9%) |
| Office & Administration | 63 (32.5%) | 131 (67.5%) |
| Total (Category) | 219 (46.4%) | 253 (53.6%) |
| Total (Overall) | 753 (46.9%) | 852 (53.1%) |
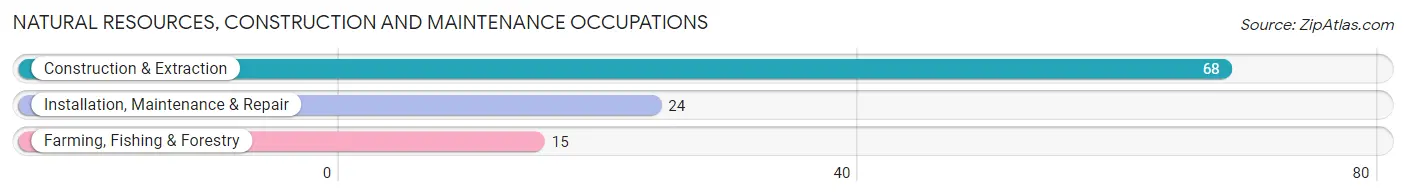
Natural Resources, Construction and Maintenance Occupations
The most common Natural Resources, Construction and Maintenance occupations in Lake City are Construction & Extraction (68 | 4.2%), Installation, Maintenance & Repair (24 | 1.5%), and Farming, Fishing & Forestry (15 | 0.9%).
Natural Resources, Construction and Maintenance Occupations by Sex
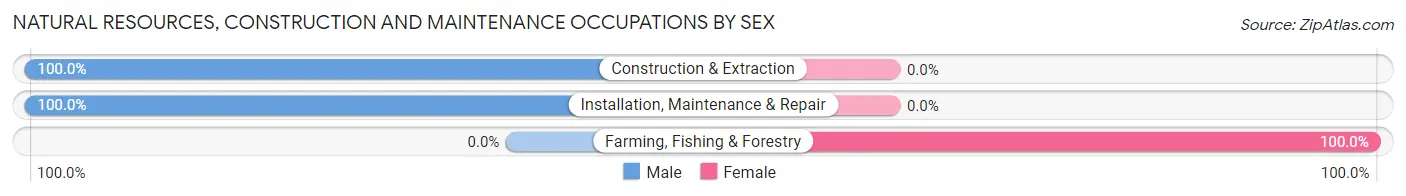
| Occupation | Male | Female |
| Farming, Fishing & Forestry | 0 (0.0%) | 15 (100.0%) |
| Construction & Extraction | 68 (100.0%) | 0 (0.0%) |
| Installation, Maintenance & Repair | 24 (100.0%) | 0 (0.0%) |
| Total (Category) | 92 (86.0%) | 15 (14.0%) |
| Total (Overall) | 753 (46.9%) | 852 (53.1%) |
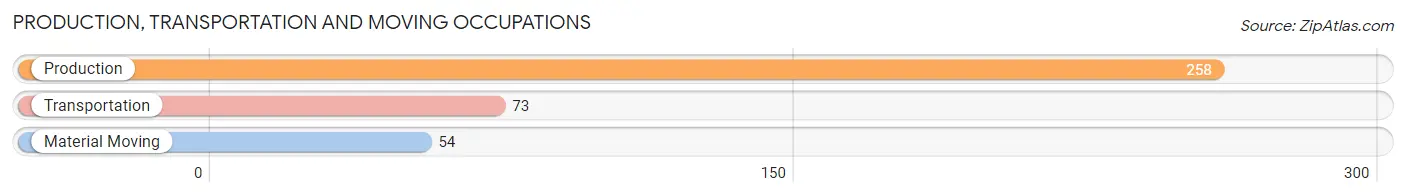
Production, Transportation and Moving Occupations
The most common Production, Transportation and Moving occupations in Lake City are Production (258 | 16.1%), Transportation (73 | 4.5%), and Material Moving (54 | 3.4%).
Production, Transportation and Moving Occupations by Sex
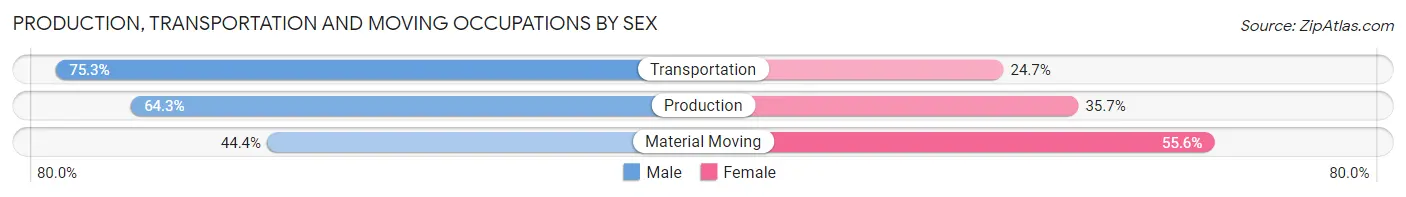
| Occupation | Male | Female |
| Production | 166 (64.3%) | 92 (35.7%) |
| Transportation | 55 (75.3%) | 18 (24.7%) |
| Material Moving | 24 (44.4%) | 30 (55.6%) |
| Total (Category) | 245 (63.6%) | 140 (36.4%) |
| Total (Overall) | 753 (46.9%) | 852 (53.1%) |
Employment Industries by Sex in Lake City
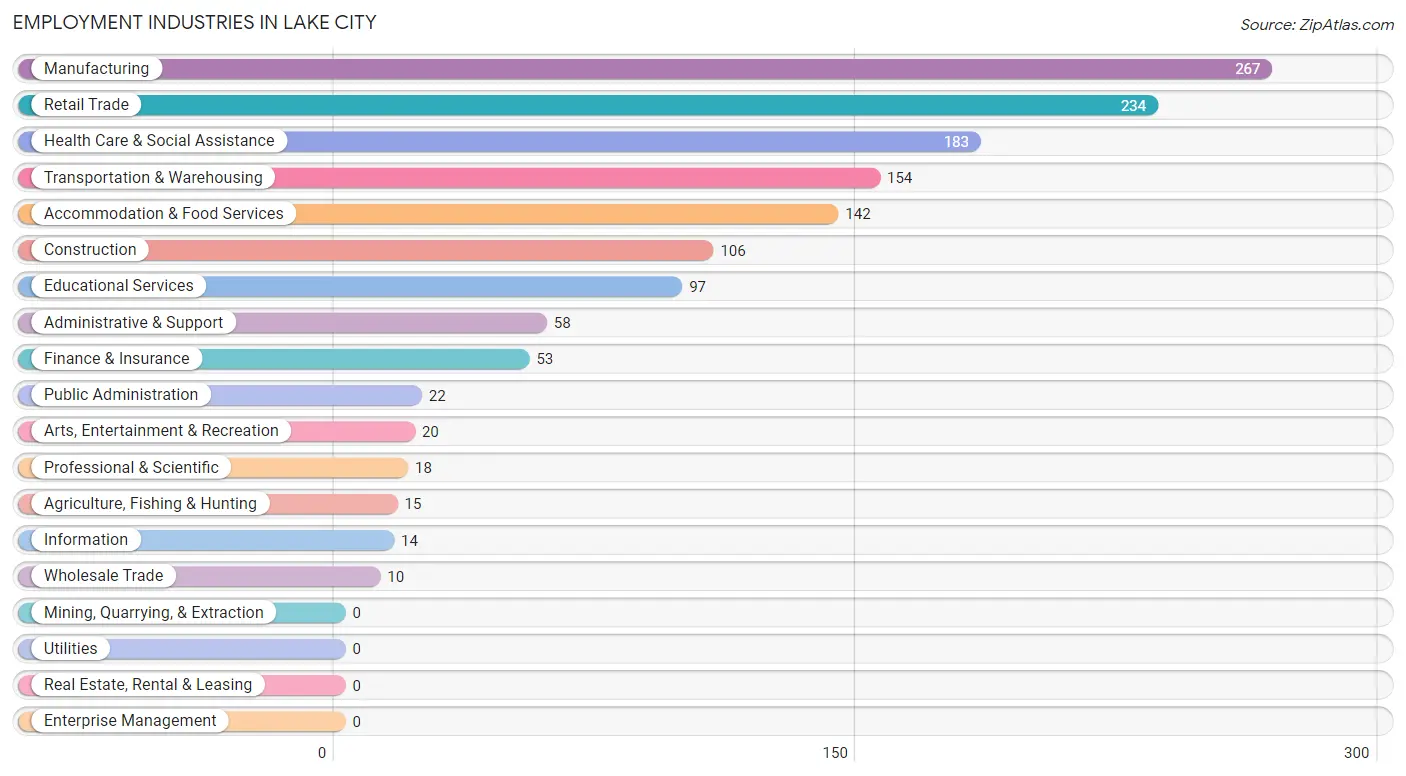
Employment Industries in Lake City
The major employment industries in Lake City include Manufacturing (267 | 16.6%), Retail Trade (234 | 14.6%), Health Care & Social Assistance (183 | 11.4%), Transportation & Warehousing (154 | 9.6%), and Accommodation & Food Services (142 | 8.8%).
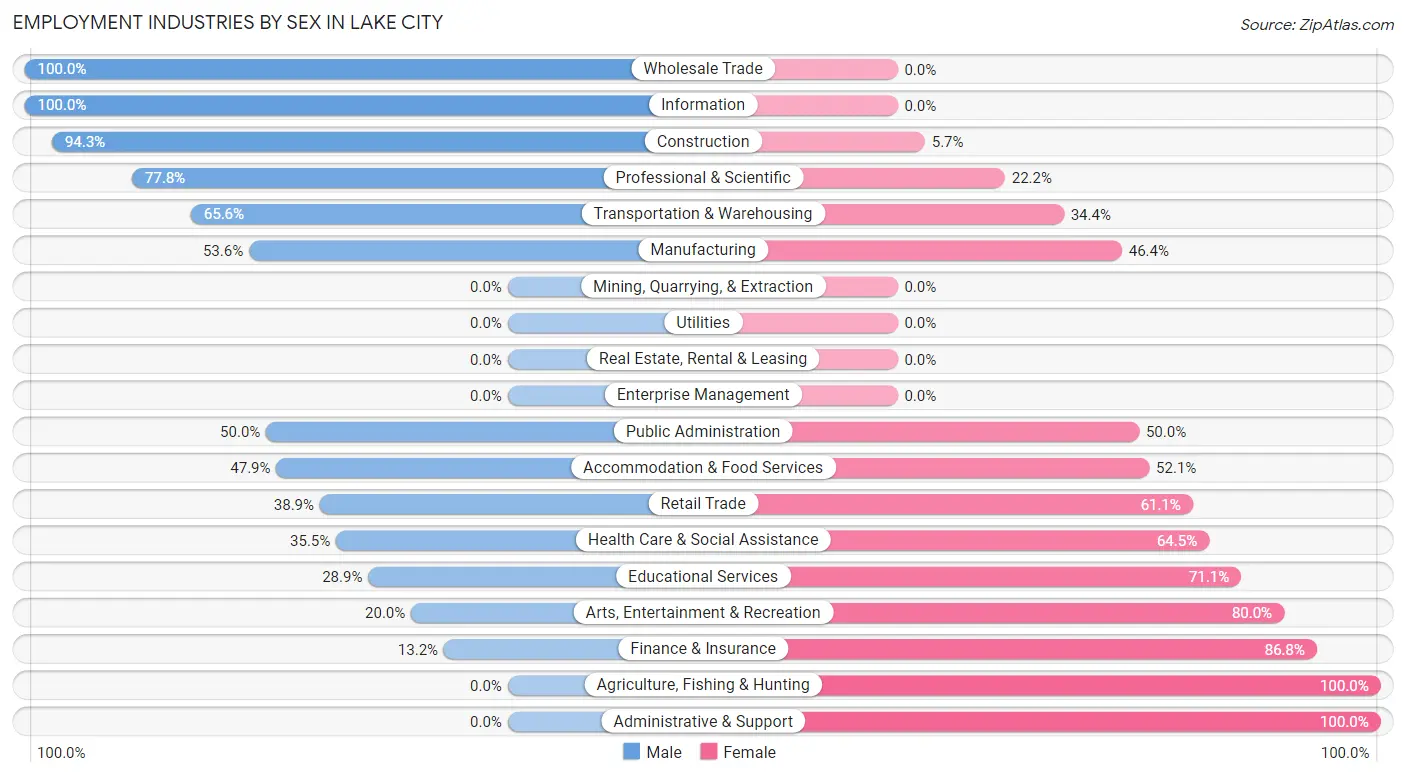
Employment Industries by Sex in Lake City
The Lake City industries that see more men than women are Wholesale Trade (100.0%), Information (100.0%), and Construction (94.3%), whereas the industries that tend to have a higher number of women are Agriculture, Fishing & Hunting (100.0%), Administrative & Support (100.0%), and Finance & Insurance (86.8%).
| Industry | Male | Female |
| Agriculture, Fishing & Hunting | 0 (0.0%) | 15 (100.0%) |
| Mining, Quarrying, & Extraction | 0 (0.0%) | 0 (0.0%) |
| Construction | 100 (94.3%) | 6 (5.7%) |
| Manufacturing | 143 (53.6%) | 124 (46.4%) |
| Wholesale Trade | 10 (100.0%) | 0 (0.0%) |
| Retail Trade | 91 (38.9%) | 143 (61.1%) |
| Transportation & Warehousing | 101 (65.6%) | 53 (34.4%) |
| Utilities | 0 (0.0%) | 0 (0.0%) |
| Information | 14 (100.0%) | 0 (0.0%) |
| Finance & Insurance | 7 (13.2%) | 46 (86.8%) |
| Real Estate, Rental & Leasing | 0 (0.0%) | 0 (0.0%) |
| Professional & Scientific | 14 (77.8%) | 4 (22.2%) |
| Enterprise Management | 0 (0.0%) | 0 (0.0%) |
| Administrative & Support | 0 (0.0%) | 58 (100.0%) |
| Educational Services | 28 (28.9%) | 69 (71.1%) |
| Health Care & Social Assistance | 65 (35.5%) | 118 (64.5%) |
| Arts, Entertainment & Recreation | 4 (20.0%) | 16 (80.0%) |
| Accommodation & Food Services | 68 (47.9%) | 74 (52.1%) |
| Public Administration | 11 (50.0%) | 11 (50.0%) |
| Total | 753 (46.9%) | 852 (53.1%) |
Education in Lake City
School Enrollment in Lake City
The most common levels of schooling among the 754 students in Lake City are college / undergraduate (398 | 52.8%), middle school (143 | 19.0%), and high school (115 | 15.2%).
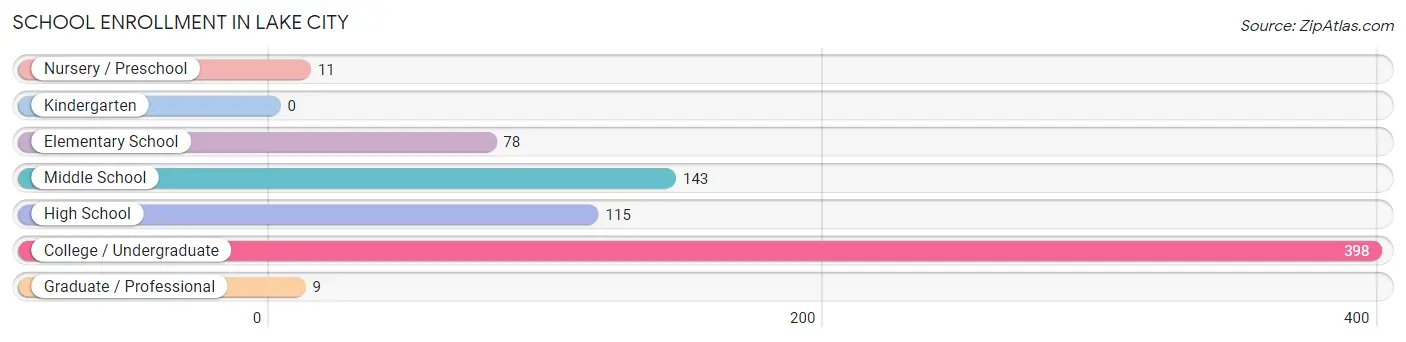
| School Level | # Students | % Students |
| Nursery / Preschool | 11 | 1.5% |
| Kindergarten | 0 | 0.0% |
| Elementary School | 78 | 10.3% |
| Middle School | 143 | 19.0% |
| High School | 115 | 15.2% |
| College / Undergraduate | 398 | 52.8% |
| Graduate / Professional | 9 | 1.2% |
| Total | 754 | 100.0% |
School Enrollment by Age by Funding Source in Lake City
Out of a total of 754 students who are enrolled in schools in Lake City, 35 (4.6%) attend a private institution, while the remaining 719 (95.4%) are enrolled in public schools. The age group of 35 years and over has the highest likelihood of being enrolled in private schools, with 13 (54.2% in the age bracket) enrolled. Conversely, the age group of 5 to 9 year old has the lowest likelihood of being enrolled in a private school, with 78 (100.0% in the age bracket) attending a public institution.
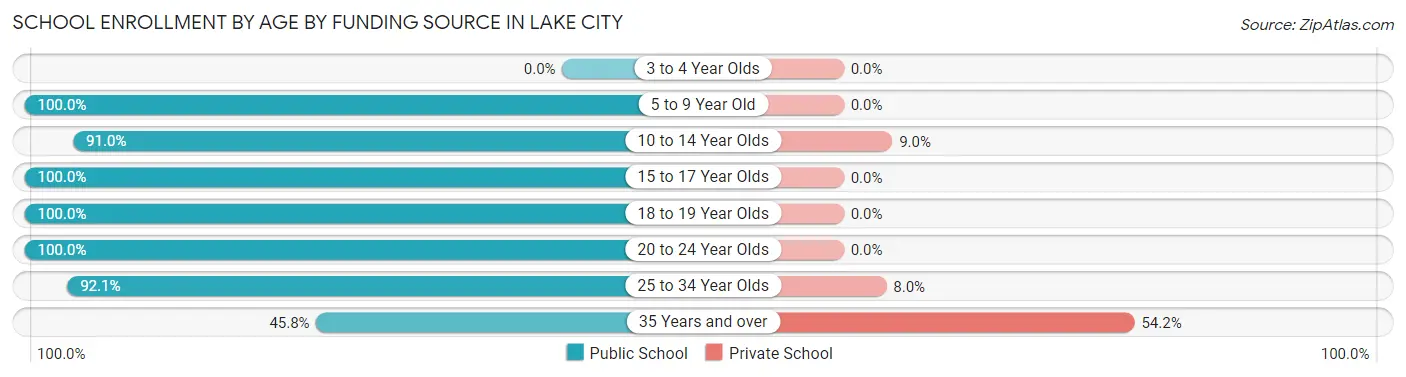
| Age Bracket | Public School | Private School |
| 3 to 4 Year Olds | 0 (0.0%) | 0 (0.0%) |
| 5 to 9 Year Old | 78 (100.0%) | 0 (0.0%) |
| 10 to 14 Year Olds | 151 (91.0%) | 15 (9.0%) |
| 15 to 17 Year Olds | 89 (100.0%) | 0 (0.0%) |
| 18 to 19 Year Olds | 87 (100.0%) | 0 (0.0%) |
| 20 to 24 Year Olds | 222 (100.0%) | 0 (0.0%) |
| 25 to 34 Year Olds | 81 (92.0%) | 7 (8.0%) |
| 35 Years and over | 11 (45.8%) | 13 (54.2%) |
| Total | 719 (95.4%) | 35 (4.6%) |
Educational Attainment by Field of Study in Lake City
Business (129 | 45.1%), science & technology (34 | 11.9%), social sciences (28 | 9.8%), education (21 | 7.3%), and arts & humanities (20 | 7.0%) are the most common fields of study among 286 individuals in Lake City who have obtained a bachelor's degree or higher.
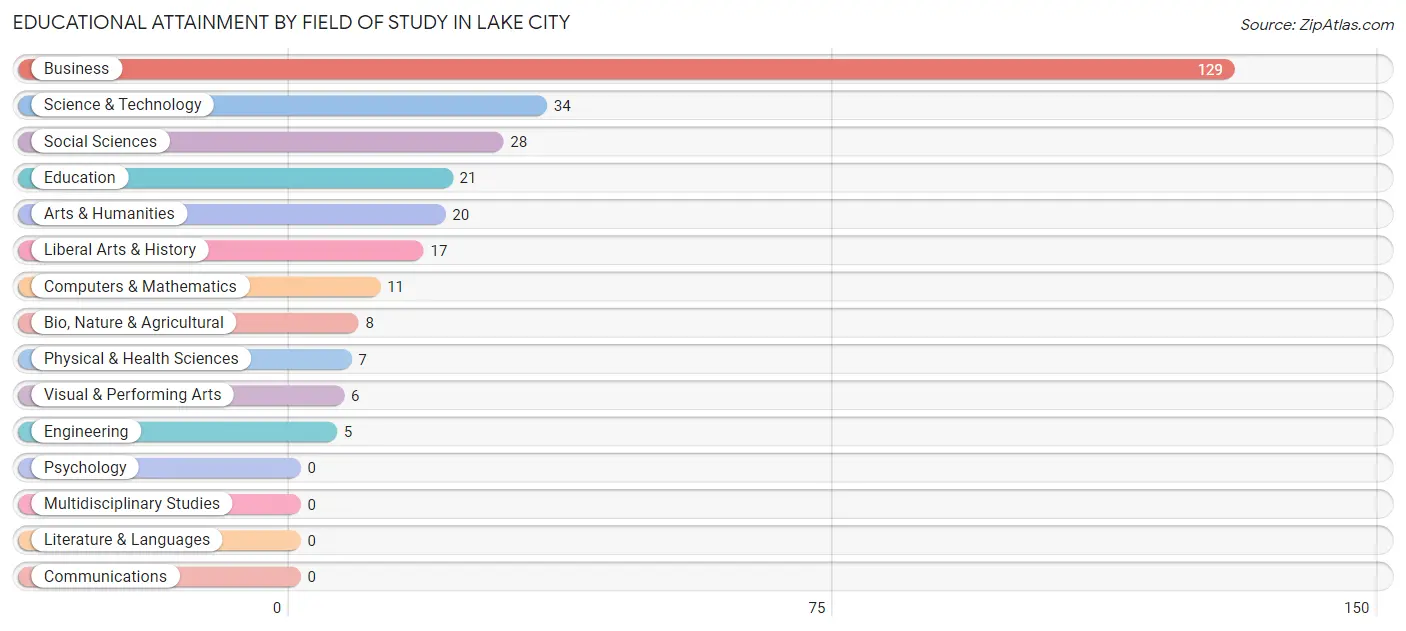
| Field of Study | # Graduates | % Graduates |
| Computers & Mathematics | 11 | 3.8% |
| Bio, Nature & Agricultural | 8 | 2.8% |
| Physical & Health Sciences | 7 | 2.5% |
| Psychology | 0 | 0.0% |
| Social Sciences | 28 | 9.8% |
| Engineering | 5 | 1.8% |
| Multidisciplinary Studies | 0 | 0.0% |
| Science & Technology | 34 | 11.9% |
| Business | 129 | 45.1% |
| Education | 21 | 7.3% |
| Literature & Languages | 0 | 0.0% |
| Liberal Arts & History | 17 | 5.9% |
| Visual & Performing Arts | 6 | 2.1% |
| Communications | 0 | 0.0% |
| Arts & Humanities | 20 | 7.0% |
| Total | 286 | 100.0% |
Transportation & Commute in Lake City
Vehicle Availability by Sex in Lake City
The most prevalent vehicle ownership categories in Lake City are males with 4 vehicles (207, accounting for 29.3%) and females with 4 vehicles (91, making up 29.4%).
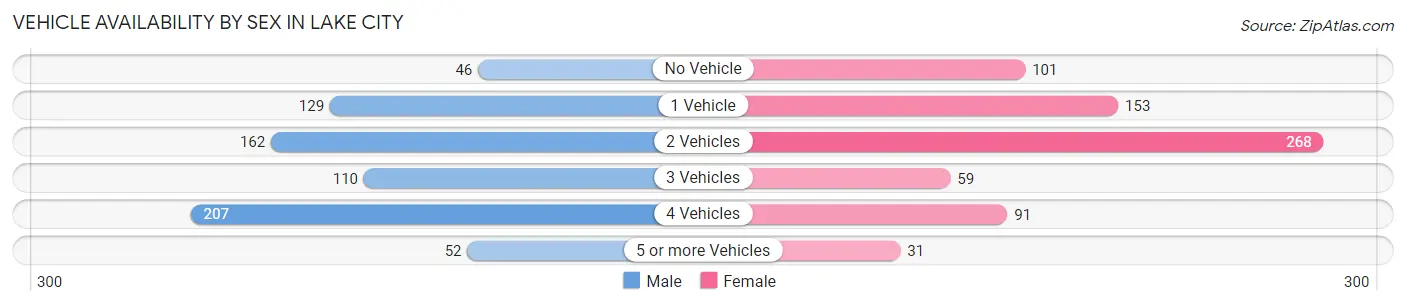
| Vehicles Available | Male | Female |
| No Vehicle | 46 (6.5%) | 101 (14.4%) |
| 1 Vehicle | 129 (18.3%) | 153 (21.8%) |
| 2 Vehicles | 162 (23.0%) | 268 (38.1%) |
| 3 Vehicles | 110 (15.6%) | 59 (8.4%) |
| 4 Vehicles | 207 (29.3%) | 91 (12.9%) |
| 5 or more Vehicles | 52 (7.4%) | 31 (4.4%) |
| Total | 706 (100.0%) | 703 (100.0%) |
Commute Time in Lake City
The most frequently occuring commute durations in Lake City are 30 to 34 minutes (316 commuters, 21.1%), 5 to 9 minutes (294 commuters, 19.7%), and 10 to 14 minutes (270 commuters, 18.1%).
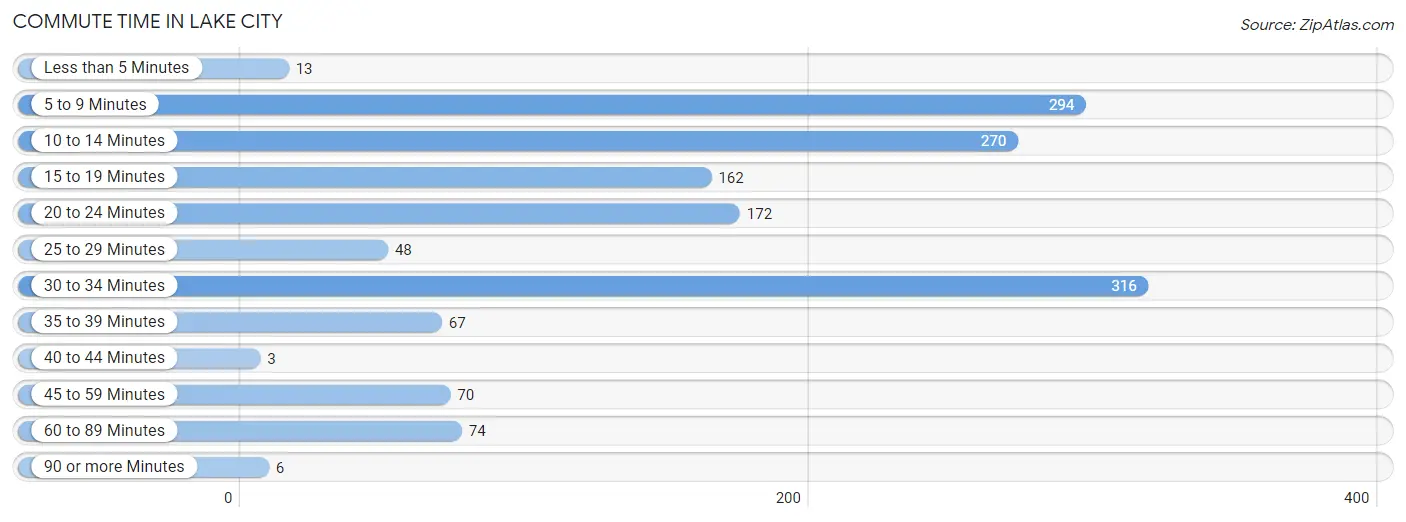
| Commute Time | # Commuters | % Commuters |
| Less than 5 Minutes | 13 | 0.9% |
| 5 to 9 Minutes | 294 | 19.7% |
| 10 to 14 Minutes | 270 | 18.1% |
| 15 to 19 Minutes | 162 | 10.8% |
| 20 to 24 Minutes | 172 | 11.5% |
| 25 to 29 Minutes | 48 | 3.2% |
| 30 to 34 Minutes | 316 | 21.1% |
| 35 to 39 Minutes | 67 | 4.5% |
| 40 to 44 Minutes | 3 | 0.2% |
| 45 to 59 Minutes | 70 | 4.7% |
| 60 to 89 Minutes | 74 | 5.0% |
| 90 or more Minutes | 6 | 0.4% |
Commute Time by Sex in Lake City
The most common commute times in Lake City are 30 to 34 minutes (150 commuters, 22.0%) for males and 30 to 34 minutes (166 commuters, 20.4%) for females.
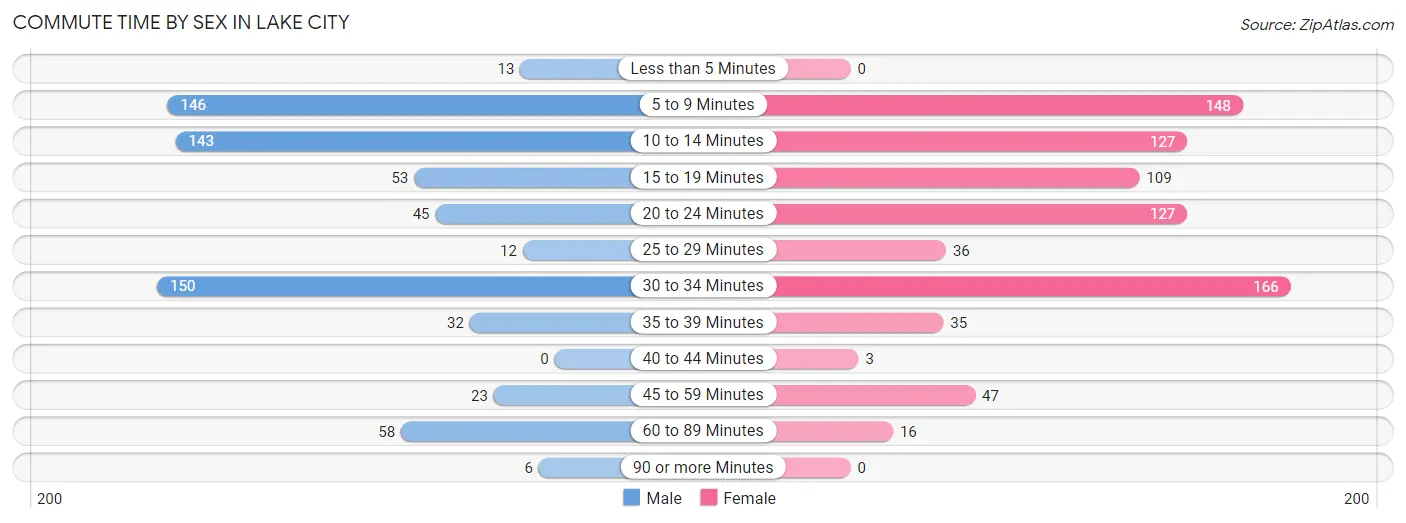
| Commute Time | Male | Female |
| Less than 5 Minutes | 13 (1.9%) | 0 (0.0%) |
| 5 to 9 Minutes | 146 (21.4%) | 148 (18.2%) |
| 10 to 14 Minutes | 143 (21.0%) | 127 (15.6%) |
| 15 to 19 Minutes | 53 (7.8%) | 109 (13.4%) |
| 20 to 24 Minutes | 45 (6.6%) | 127 (15.6%) |
| 25 to 29 Minutes | 12 (1.8%) | 36 (4.4%) |
| 30 to 34 Minutes | 150 (22.0%) | 166 (20.4%) |
| 35 to 39 Minutes | 32 (4.7%) | 35 (4.3%) |
| 40 to 44 Minutes | 0 (0.0%) | 3 (0.4%) |
| 45 to 59 Minutes | 23 (3.4%) | 47 (5.8%) |
| 60 to 89 Minutes | 58 (8.5%) | 16 (2.0%) |
| 90 or more Minutes | 6 (0.9%) | 0 (0.0%) |
Time of Departure to Work by Sex in Lake City
The most frequent times of departure to work in Lake City are 12:00 PM to 3:59 PM (117, 17.2%) for males and 6:30 AM to 6:59 AM (128, 15.7%) for females.
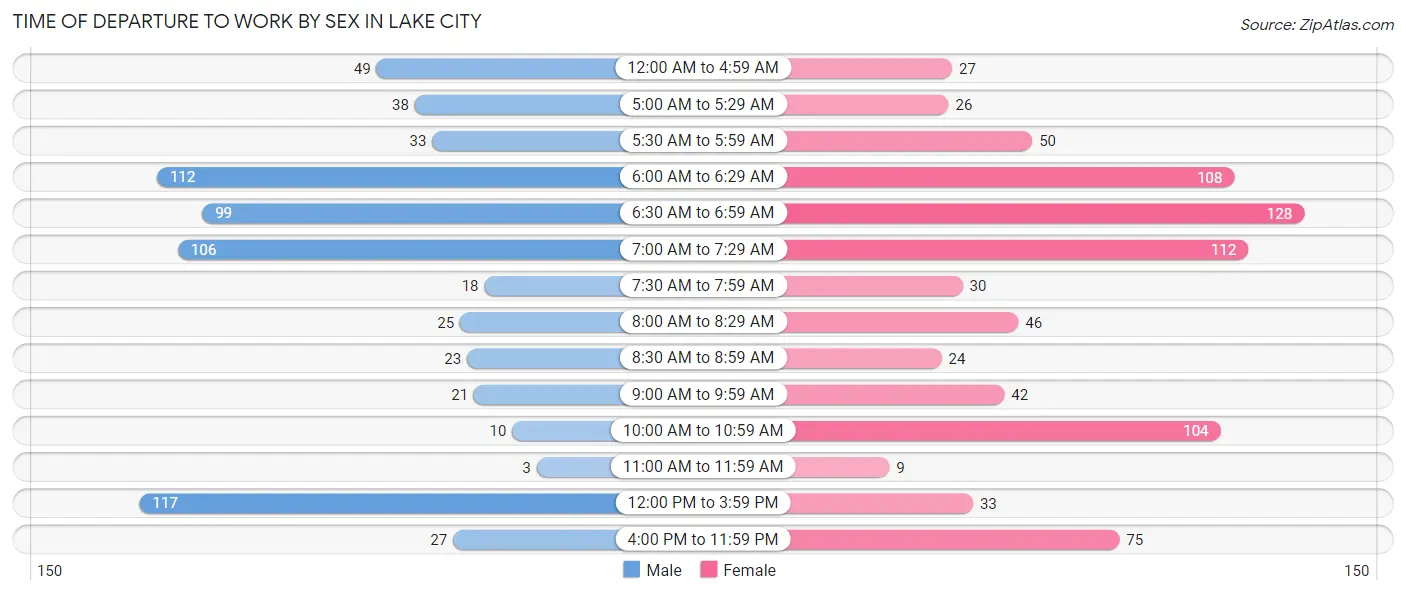
| Time of Departure | Male | Female |
| 12:00 AM to 4:59 AM | 49 (7.2%) | 27 (3.3%) |
| 5:00 AM to 5:29 AM | 38 (5.6%) | 26 (3.2%) |
| 5:30 AM to 5:59 AM | 33 (4.9%) | 50 (6.1%) |
| 6:00 AM to 6:29 AM | 112 (16.5%) | 108 (13.3%) |
| 6:30 AM to 6:59 AM | 99 (14.5%) | 128 (15.7%) |
| 7:00 AM to 7:29 AM | 106 (15.6%) | 112 (13.8%) |
| 7:30 AM to 7:59 AM | 18 (2.6%) | 30 (3.7%) |
| 8:00 AM to 8:29 AM | 25 (3.7%) | 46 (5.7%) |
| 8:30 AM to 8:59 AM | 23 (3.4%) | 24 (2.9%) |
| 9:00 AM to 9:59 AM | 21 (3.1%) | 42 (5.2%) |
| 10:00 AM to 10:59 AM | 10 (1.5%) | 104 (12.8%) |
| 11:00 AM to 11:59 AM | 3 (0.4%) | 9 (1.1%) |
| 12:00 PM to 3:59 PM | 117 (17.2%) | 33 (4.1%) |
| 4:00 PM to 11:59 PM | 27 (4.0%) | 75 (9.2%) |
| Total | 681 (100.0%) | 814 (100.0%) |
Housing Occupancy in Lake City
Occupancy by Ownership in Lake City
Of the total 906 dwellings in Lake City, owner-occupied units account for 430 (47.5%), while renter-occupied units make up 476 (52.5%).
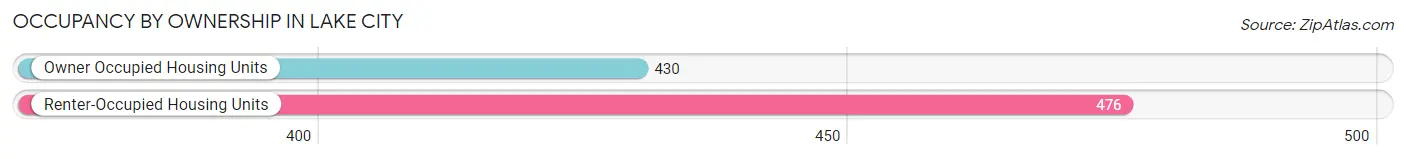
| Occupancy | # Housing Units | % Housing Units |
| Owner Occupied Housing Units | 430 | 47.5% |
| Renter-Occupied Housing Units | 476 | 52.5% |
| Total Occupied Housing Units | 906 | 100.0% |
Occupancy by Household Size in Lake City
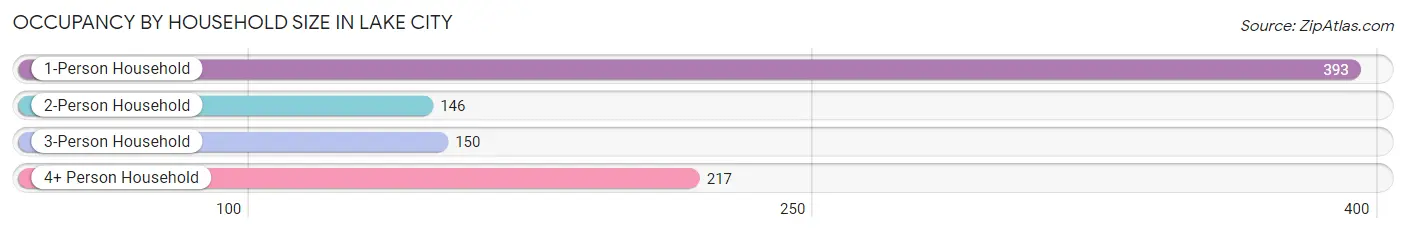
| Household Size | # Housing Units | % Housing Units |
| 1-Person Household | 393 | 43.4% |
| 2-Person Household | 146 | 16.1% |
| 3-Person Household | 150 | 16.6% |
| 4+ Person Household | 217 | 23.9% |
| Total Housing Units | 906 | 100.0% |
Occupancy by Ownership by Household Size in Lake City
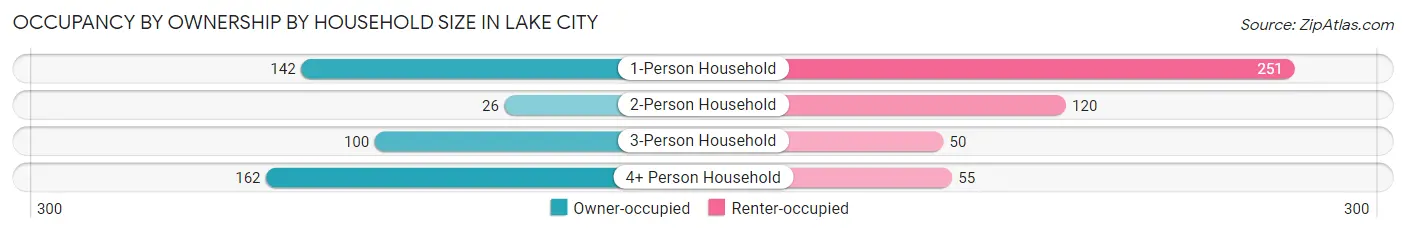
| Household Size | Owner-occupied | Renter-occupied |
| 1-Person Household | 142 (36.1%) | 251 (63.9%) |
| 2-Person Household | 26 (17.8%) | 120 (82.2%) |
| 3-Person Household | 100 (66.7%) | 50 (33.3%) |
| 4+ Person Household | 162 (74.7%) | 55 (25.4%) |
| Total Housing Units | 430 (47.5%) | 476 (52.5%) |
Occupancy by Educational Attainment in Lake City
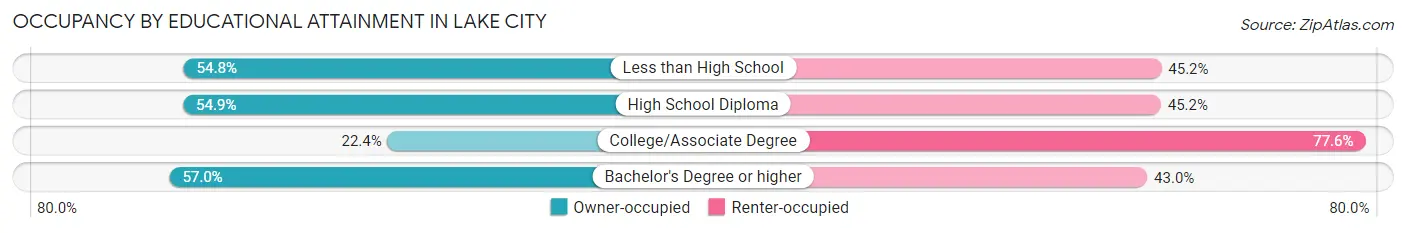
| Household Size | Owner-occupied | Renter-occupied |
| Less than High School | 132 (54.8%) | 109 (45.2%) |
| High School Diploma | 181 (54.8%) | 149 (45.2%) |
| College/Associate Degree | 48 (22.4%) | 166 (77.6%) |
| Bachelor's Degree or higher | 69 (57.0%) | 52 (43.0%) |
Occupancy by Age of Householder in Lake City
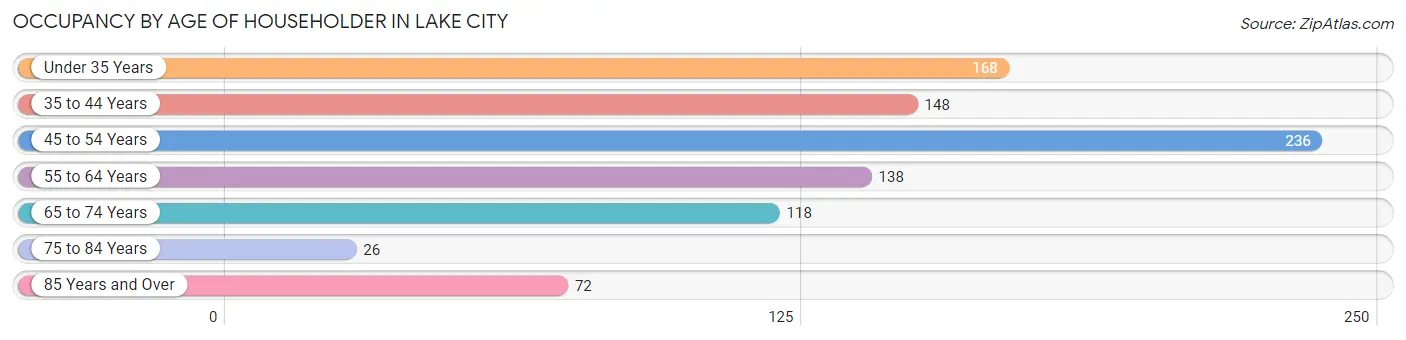
| Age Bracket | # Households | % Households |
| Under 35 Years | 168 | 18.5% |
| 35 to 44 Years | 148 | 16.3% |
| 45 to 54 Years | 236 | 26.1% |
| 55 to 64 Years | 138 | 15.2% |
| 65 to 74 Years | 118 | 13.0% |
| 75 to 84 Years | 26 | 2.9% |
| 85 Years and Over | 72 | 8.0% |
| Total | 906 | 100.0% |
Housing Finances in Lake City
Median Income by Occupancy in Lake City
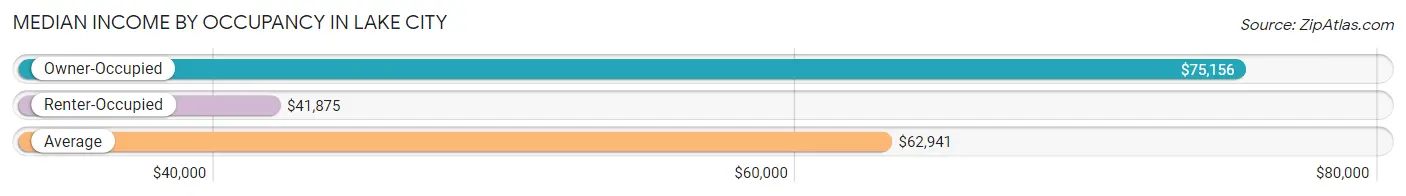
| Occupancy Type | # Households | Median Income |
| Owner-Occupied | 430 (47.5%) | $75,156 |
| Renter-Occupied | 476 (52.5%) | $41,875 |
| Average | 906 (100.0%) | $62,941 |
Occupancy by Householder Income Bracket in Lake City
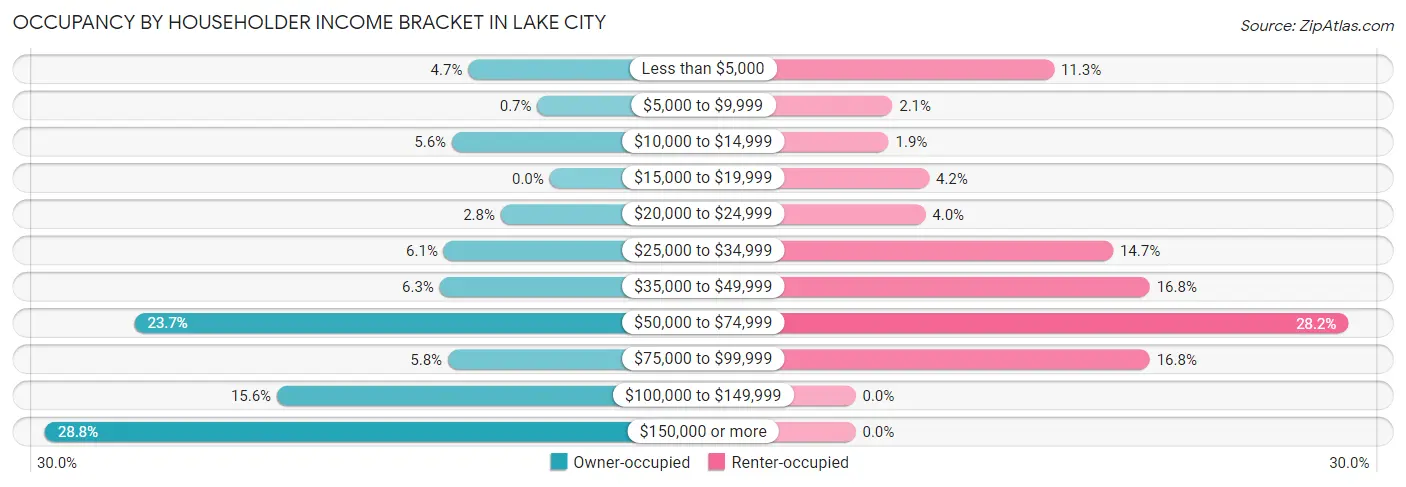
| Income Bracket | Owner-occupied | Renter-occupied |
| Less than $5,000 | 20 (4.6%) | 54 (11.3%) |
| $5,000 to $9,999 | 3 (0.7%) | 10 (2.1%) |
| $10,000 to $14,999 | 24 (5.6%) | 9 (1.9%) |
| $15,000 to $19,999 | 0 (0.0%) | 20 (4.2%) |
| $20,000 to $24,999 | 12 (2.8%) | 19 (4.0%) |
| $25,000 to $34,999 | 26 (6.0%) | 70 (14.7%) |
| $35,000 to $49,999 | 27 (6.3%) | 80 (16.8%) |
| $50,000 to $74,999 | 102 (23.7%) | 134 (28.1%) |
| $75,000 to $99,999 | 25 (5.8%) | 80 (16.8%) |
| $100,000 to $149,999 | 67 (15.6%) | 0 (0.0%) |
| $150,000 or more | 124 (28.8%) | 0 (0.0%) |
| Total | 430 (100.0%) | 476 (100.0%) |
Monthly Housing Cost Tiers in Lake City
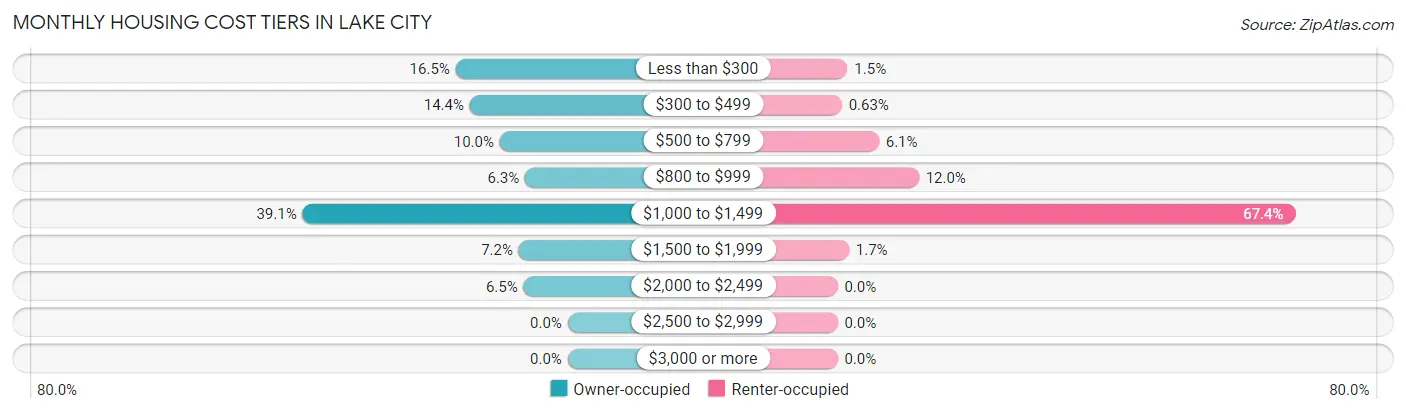
| Monthly Cost | Owner-occupied | Renter-occupied |
| Less than $300 | 71 (16.5%) | 7 (1.5%) |
| $300 to $499 | 62 (14.4%) | 3 (0.6%) |
| $500 to $799 | 43 (10.0%) | 29 (6.1%) |
| $800 to $999 | 27 (6.3%) | 57 (12.0%) |
| $1,000 to $1,499 | 168 (39.1%) | 321 (67.4%) |
| $1,500 to $1,999 | 31 (7.2%) | 8 (1.7%) |
| $2,000 to $2,499 | 28 (6.5%) | 0 (0.0%) |
| $2,500 to $2,999 | 0 (0.0%) | 0 (0.0%) |
| $3,000 or more | 0 (0.0%) | 0 (0.0%) |
| Total | 430 (100.0%) | 476 (100.0%) |
Physical Housing Characteristics in Lake City
Housing Structures in Lake City
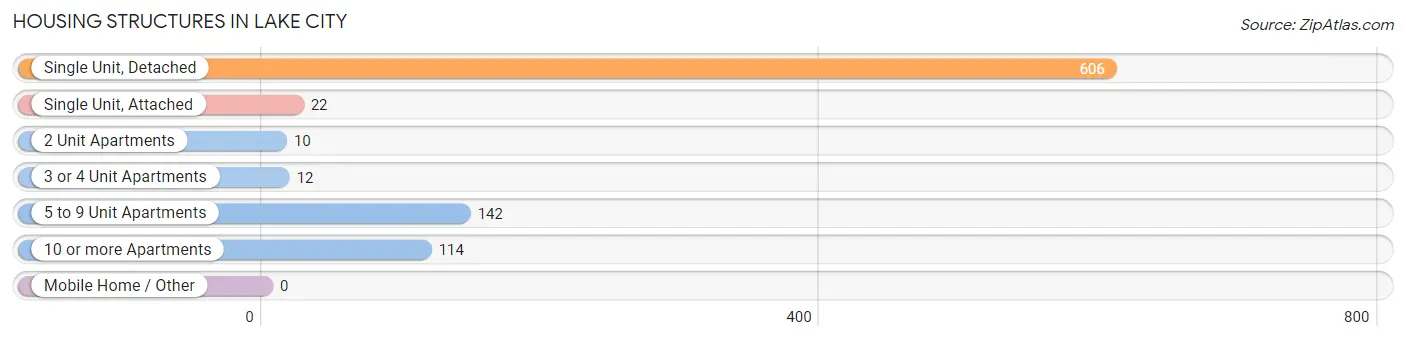
| Structure Type | # Housing Units | % Housing Units |
| Single Unit, Detached | 606 | 66.9% |
| Single Unit, Attached | 22 | 2.4% |
| 2 Unit Apartments | 10 | 1.1% |
| 3 or 4 Unit Apartments | 12 | 1.3% |
| 5 to 9 Unit Apartments | 142 | 15.7% |
| 10 or more Apartments | 114 | 12.6% |
| Mobile Home / Other | 0 | 0.0% |
| Total | 906 | 100.0% |
Housing Structures by Occupancy in Lake City
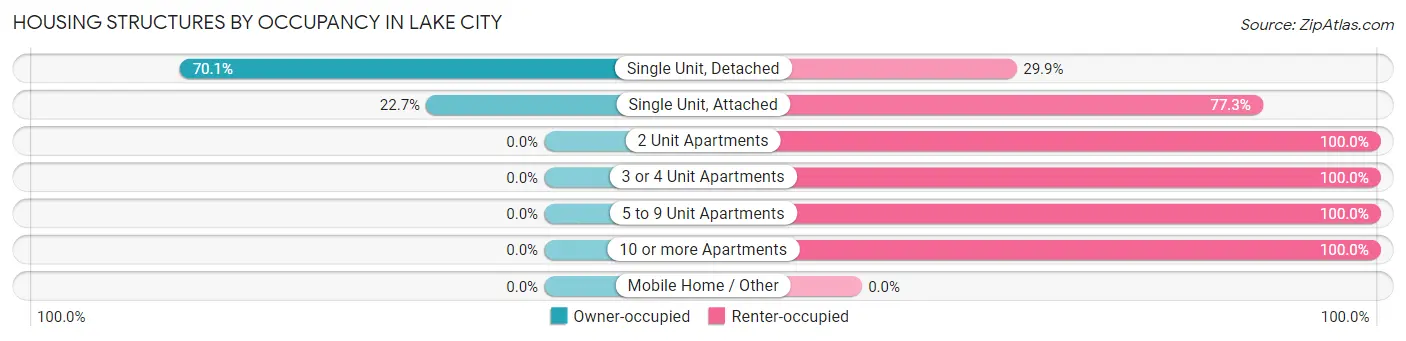
| Structure Type | Owner-occupied | Renter-occupied |
| Single Unit, Detached | 425 (70.1%) | 181 (29.9%) |
| Single Unit, Attached | 5 (22.7%) | 17 (77.3%) |
| 2 Unit Apartments | 0 (0.0%) | 10 (100.0%) |
| 3 or 4 Unit Apartments | 0 (0.0%) | 12 (100.0%) |
| 5 to 9 Unit Apartments | 0 (0.0%) | 142 (100.0%) |
| 10 or more Apartments | 0 (0.0%) | 114 (100.0%) |
| Mobile Home / Other | 0 (0.0%) | 0 (0.0%) |
| Total | 430 (47.5%) | 476 (52.5%) |
Housing Structures by Number of Rooms in Lake City
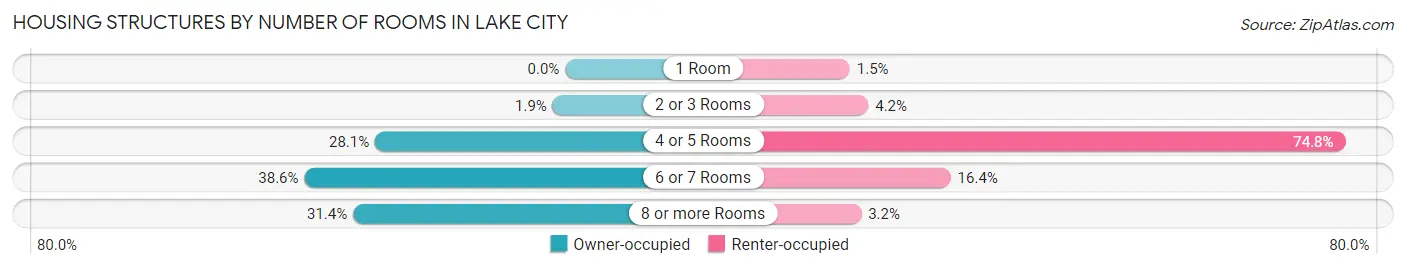
| Number of Rooms | Owner-occupied | Renter-occupied |
| 1 Room | 0 (0.0%) | 7 (1.5%) |
| 2 or 3 Rooms | 8 (1.9%) | 20 (4.2%) |
| 4 or 5 Rooms | 121 (28.1%) | 356 (74.8%) |
| 6 or 7 Rooms | 166 (38.6%) | 78 (16.4%) |
| 8 or more Rooms | 135 (31.4%) | 15 (3.2%) |
| Total | 430 (100.0%) | 476 (100.0%) |
Housing Structure by Heating Type in Lake City
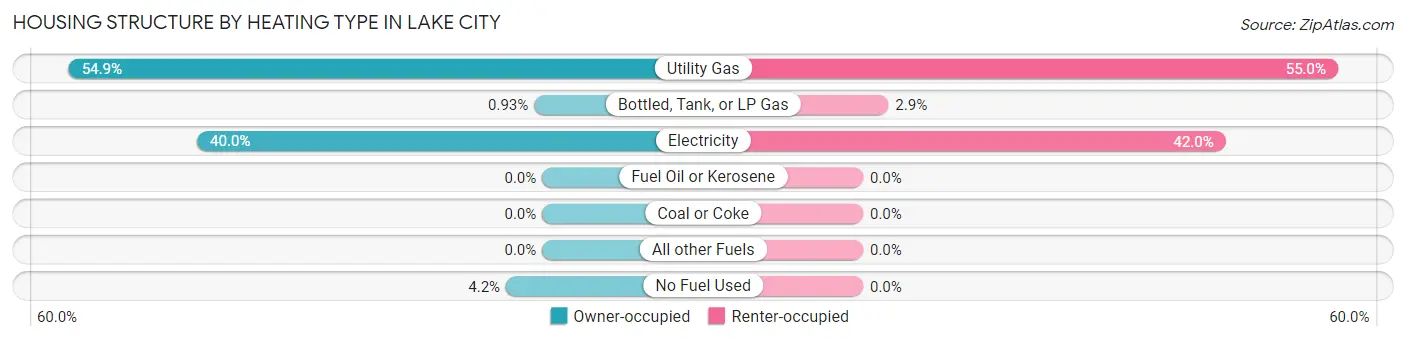
| Heating Type | Owner-occupied | Renter-occupied |
| Utility Gas | 236 (54.9%) | 262 (55.0%) |
| Bottled, Tank, or LP Gas | 4 (0.9%) | 14 (2.9%) |
| Electricity | 172 (40.0%) | 200 (42.0%) |
| Fuel Oil or Kerosene | 0 (0.0%) | 0 (0.0%) |
| Coal or Coke | 0 (0.0%) | 0 (0.0%) |
| All other Fuels | 0 (0.0%) | 0 (0.0%) |
| No Fuel Used | 18 (4.2%) | 0 (0.0%) |
| Total | 430 (100.0%) | 476 (100.0%) |
Household Vehicle Usage in Lake City
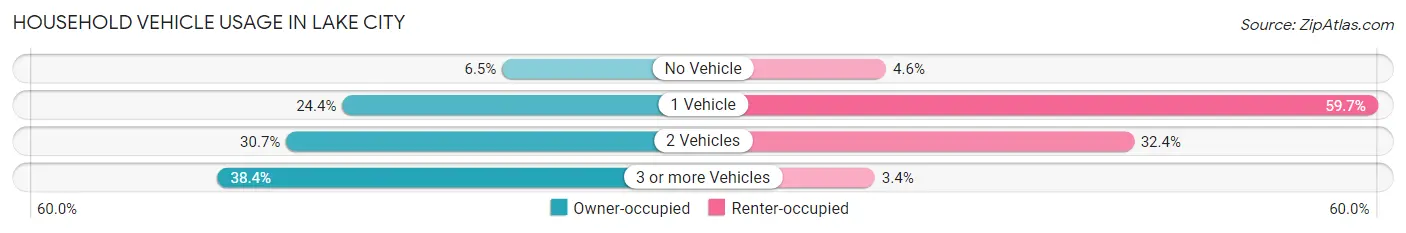
| Vehicles per Household | Owner-occupied | Renter-occupied |
| No Vehicle | 28 (6.5%) | 22 (4.6%) |
| 1 Vehicle | 105 (24.4%) | 284 (59.7%) |
| 2 Vehicles | 132 (30.7%) | 154 (32.4%) |
| 3 or more Vehicles | 165 (38.4%) | 16 (3.4%) |
| Total | 430 (100.0%) | 476 (100.0%) |
Real Estate & Mortgages in Lake City
Real Estate and Mortgage Overview in Lake City
| Characteristic | Without Mortgage | With Mortgage |
| Housing Units | 200 | 230 |
| Median Property Value | $131,400 | $177,800 |
| Median Household Income | $102,273 | $48 |
| Monthly Housing Costs | $364 | $0 |
| Real Estate Taxes | - | - |
Property Value by Mortgage Status in Lake City
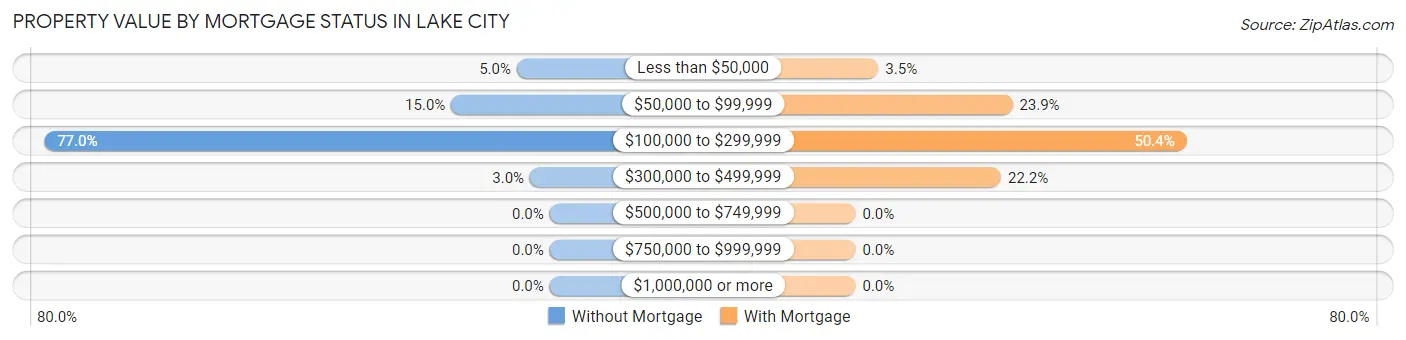
| Property Value | Without Mortgage | With Mortgage |
| Less than $50,000 | 10 (5.0%) | 8 (3.5%) |
| $50,000 to $99,999 | 30 (15.0%) | 55 (23.9%) |
| $100,000 to $299,999 | 154 (77.0%) | 116 (50.4%) |
| $300,000 to $499,999 | 6 (3.0%) | 51 (22.2%) |
| $500,000 to $749,999 | 0 (0.0%) | 0 (0.0%) |
| $750,000 to $999,999 | 0 (0.0%) | 0 (0.0%) |
| $1,000,000 or more | 0 (0.0%) | 0 (0.0%) |
| Total | 200 (100.0%) | 230 (100.0%) |
Household Income by Mortgage Status in Lake City
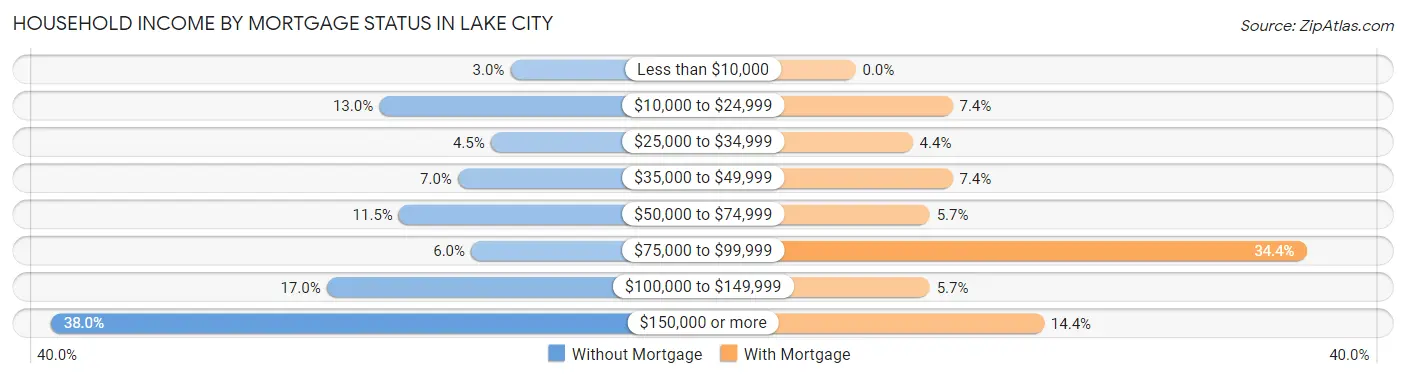
| Household Income | Without Mortgage | With Mortgage |
| Less than $10,000 | 6 (3.0%) | 0 (0.0%) |
| $10,000 to $24,999 | 26 (13.0%) | 17 (7.4%) |
| $25,000 to $34,999 | 9 (4.5%) | 10 (4.3%) |
| $35,000 to $49,999 | 14 (7.0%) | 17 (7.4%) |
| $50,000 to $74,999 | 23 (11.5%) | 13 (5.7%) |
| $75,000 to $99,999 | 12 (6.0%) | 79 (34.4%) |
| $100,000 to $149,999 | 34 (17.0%) | 13 (5.7%) |
| $150,000 or more | 76 (38.0%) | 33 (14.3%) |
| Total | 200 (100.0%) | 230 (100.0%) |
Property Value to Household Income Ratio in Lake City
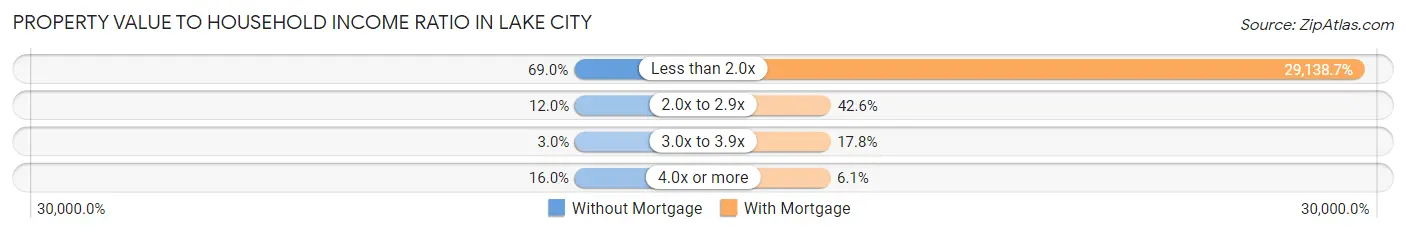
| Value-to-Income Ratio | Without Mortgage | With Mortgage |
| Less than 2.0x | 138 (69.0%) | 67,019 (29,138.7%) |
| 2.0x to 2.9x | 24 (12.0%) | 98 (42.6%) |
| 3.0x to 3.9x | 6 (3.0%) | 41 (17.8%) |
| 4.0x or more | 32 (16.0%) | 14 (6.1%) |
| Total | 200 (100.0%) | 230 (100.0%) |
Real Estate Taxes by Mortgage Status in Lake City
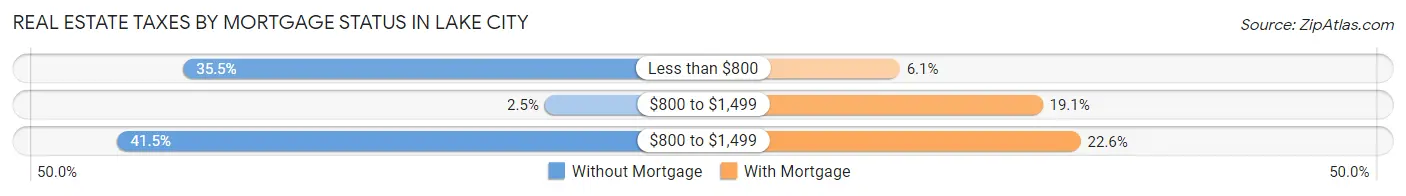
| Property Taxes | Without Mortgage | With Mortgage |
| Less than $800 | 71 (35.5%) | 14 (6.1%) |
| $800 to $1,499 | 5 (2.5%) | 44 (19.1%) |
| $800 to $1,499 | 83 (41.5%) | 52 (22.6%) |
| Total | 200 (100.0%) | 230 (100.0%) |
Health & Disability in Lake City
Health Insurance Coverage by Age in Lake City
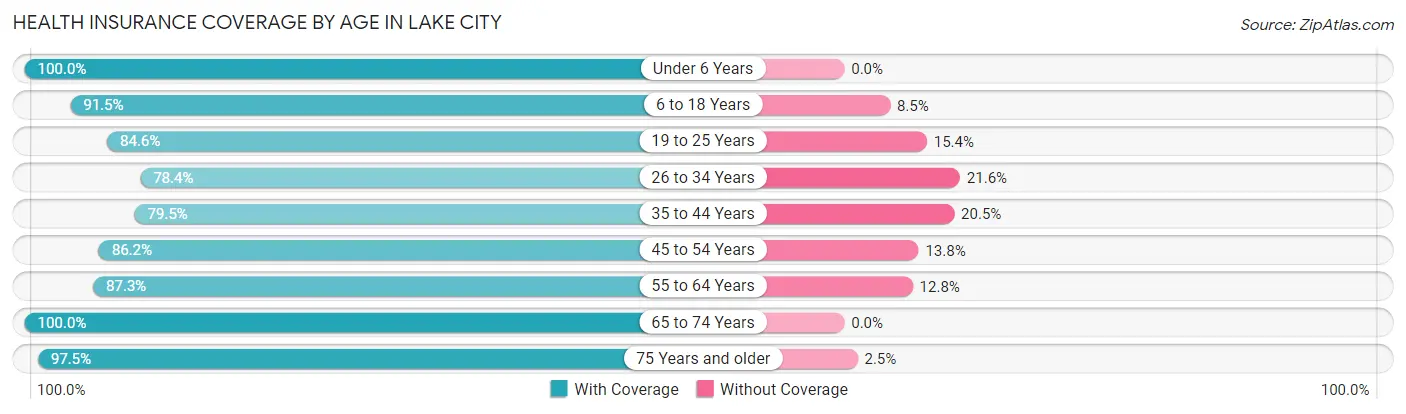
| Age Bracket | With Coverage | Without Coverage |
| Under 6 Years | 149 (100.0%) | 0 (0.0%) |
| 6 to 18 Years | 333 (91.5%) | 31 (8.5%) |
| 19 to 25 Years | 385 (84.6%) | 70 (15.4%) |
| 26 to 34 Years | 262 (78.4%) | 72 (21.6%) |
| 35 to 44 Years | 194 (79.5%) | 50 (20.5%) |
| 45 to 54 Years | 411 (86.2%) | 66 (13.8%) |
| 55 to 64 Years | 308 (87.3%) | 45 (12.8%) |
| 65 to 74 Years | 151 (100.0%) | 0 (0.0%) |
| 75 Years and older | 158 (97.5%) | 4 (2.5%) |
| Total | 2,351 (87.4%) | 338 (12.6%) |
Health Insurance Coverage by Citizenship Status in Lake City
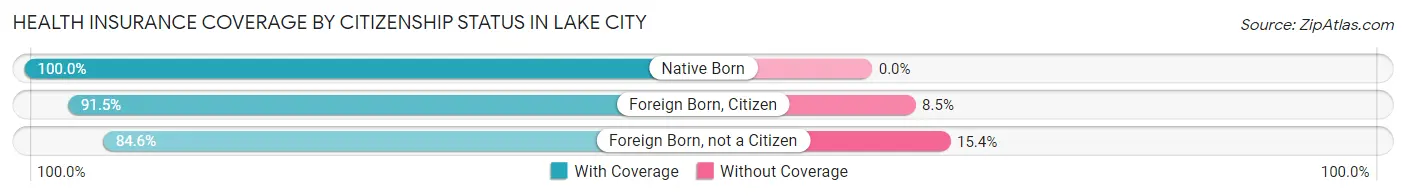
| Citizenship Status | With Coverage | Without Coverage |
| Native Born | 149 (100.0%) | 0 (0.0%) |
| Foreign Born, Citizen | 333 (91.5%) | 31 (8.5%) |
| Foreign Born, not a Citizen | 385 (84.6%) | 70 (15.4%) |
Health Insurance Coverage by Household Income in Lake City
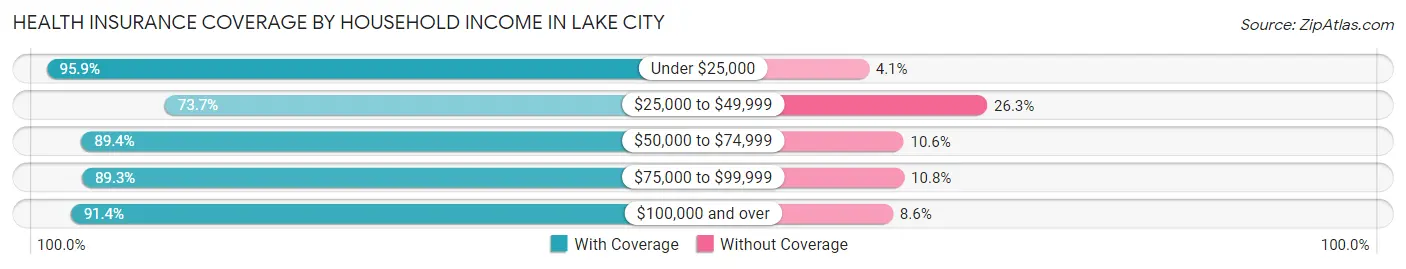
| Household Income | With Coverage | Without Coverage |
| Under $25,000 | 233 (95.9%) | 10 (4.1%) |
| $25,000 to $49,999 | 272 (73.7%) | 97 (26.3%) |
| $50,000 to $74,999 | 638 (89.4%) | 76 (10.6%) |
| $75,000 to $99,999 | 249 (89.2%) | 30 (10.7%) |
| $100,000 and over | 719 (91.4%) | 68 (8.6%) |
Public vs Private Health Insurance Coverage by Age in Lake City
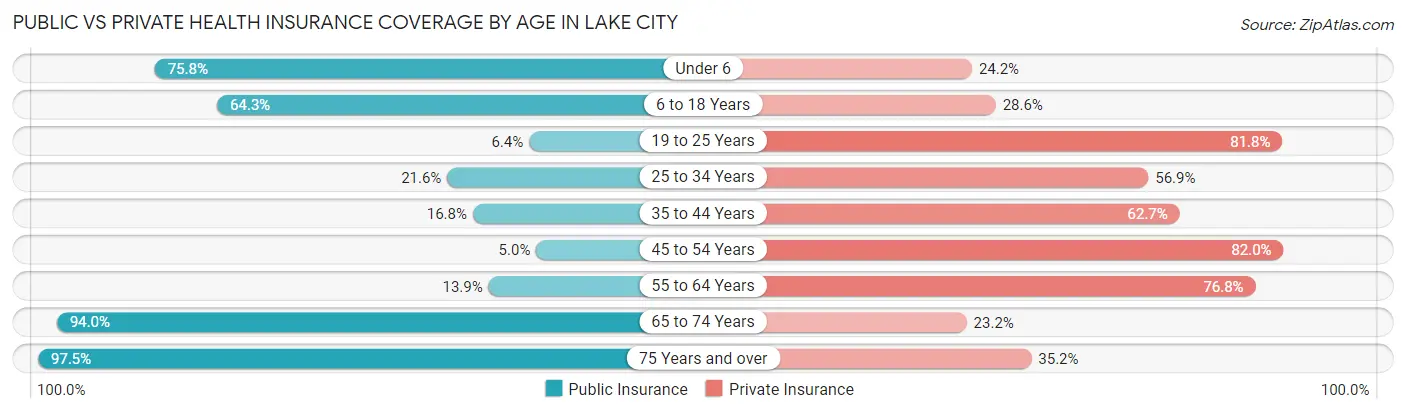
| Age Bracket | Public Insurance | Private Insurance |
| Under 6 | 113 (75.8%) | 36 (24.2%) |
| 6 to 18 Years | 234 (64.3%) | 104 (28.6%) |
| 19 to 25 Years | 29 (6.4%) | 372 (81.8%) |
| 25 to 34 Years | 72 (21.6%) | 190 (56.9%) |
| 35 to 44 Years | 41 (16.8%) | 153 (62.7%) |
| 45 to 54 Years | 24 (5.0%) | 391 (82.0%) |
| 55 to 64 Years | 49 (13.9%) | 271 (76.8%) |
| 65 to 74 Years | 142 (94.0%) | 35 (23.2%) |
| 75 Years and over | 158 (97.5%) | 57 (35.2%) |
| Total | 862 (32.1%) | 1,609 (59.8%) |
Disability Status by Sex by Age in Lake City
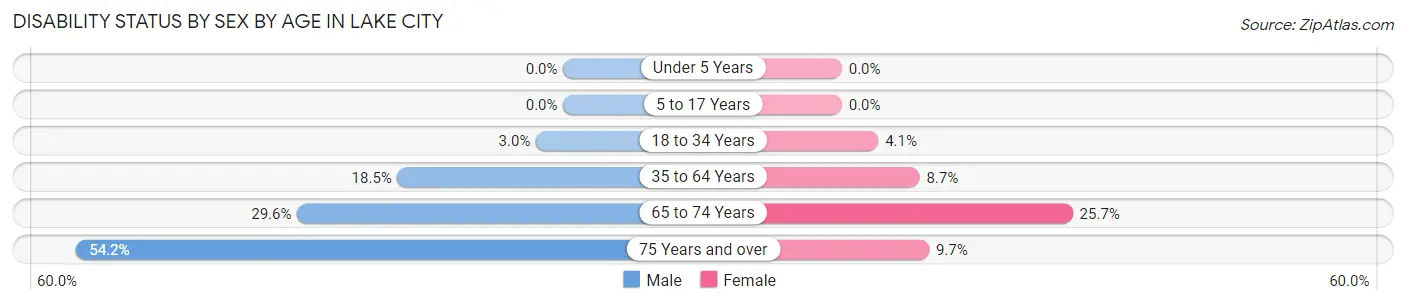
| Age Bracket | Male | Female |
| Under 5 Years | 0 (0.0%) | 0 (0.0%) |
| 5 to 17 Years | 0 (0.0%) | 0 (0.0%) |
| 18 to 34 Years | 10 (3.0%) | 20 (4.1%) |
| 35 to 64 Years | 100 (18.4%) | 46 (8.6%) |
| 65 to 74 Years | 24 (29.6%) | 18 (25.7%) |
| 75 Years and over | 32 (54.2%) | 10 (9.7%) |
Disability Class by Sex by Age in Lake City
Disability Class: Hearing Difficulty
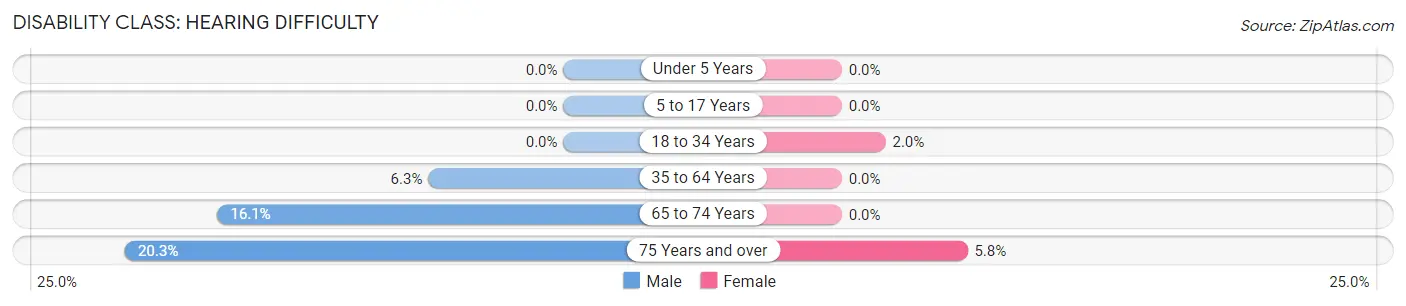
| Age Bracket | Male | Female |
| Under 5 Years | 0 (0.0%) | 0 (0.0%) |
| 5 to 17 Years | 0 (0.0%) | 0 (0.0%) |
| 18 to 34 Years | 0 (0.0%) | 10 (2.0%) |
| 35 to 64 Years | 34 (6.3%) | 0 (0.0%) |
| 65 to 74 Years | 13 (16.1%) | 0 (0.0%) |
| 75 Years and over | 12 (20.3%) | 6 (5.8%) |
Disability Class: Vision Difficulty
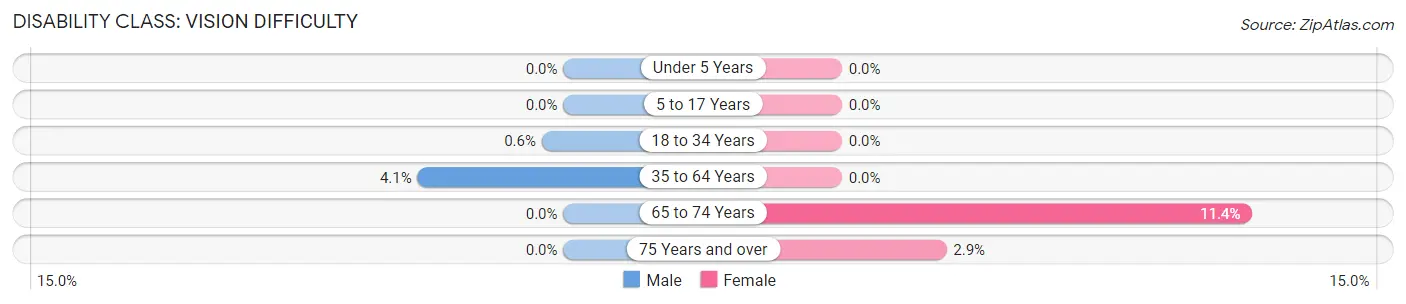
| Age Bracket | Male | Female |
| Under 5 Years | 0 (0.0%) | 0 (0.0%) |
| 5 to 17 Years | 0 (0.0%) | 0 (0.0%) |
| 18 to 34 Years | 2 (0.6%) | 0 (0.0%) |
| 35 to 64 Years | 22 (4.1%) | 0 (0.0%) |
| 65 to 74 Years | 0 (0.0%) | 8 (11.4%) |
| 75 Years and over | 0 (0.0%) | 3 (2.9%) |
Disability Class: Cognitive Difficulty
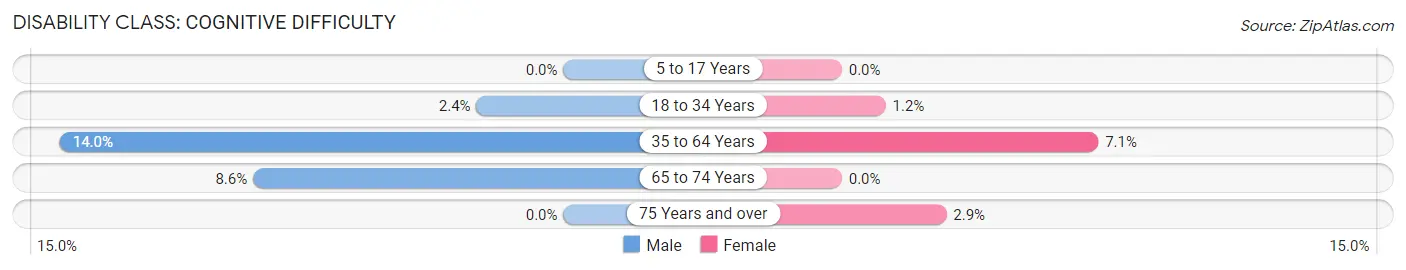
| Age Bracket | Male | Female |
| 5 to 17 Years | 0 (0.0%) | 0 (0.0%) |
| 18 to 34 Years | 8 (2.4%) | 6 (1.2%) |
| 35 to 64 Years | 76 (14.0%) | 38 (7.1%) |
| 65 to 74 Years | 7 (8.6%) | 0 (0.0%) |
| 75 Years and over | 0 (0.0%) | 3 (2.9%) |
Disability Class: Ambulatory Difficulty
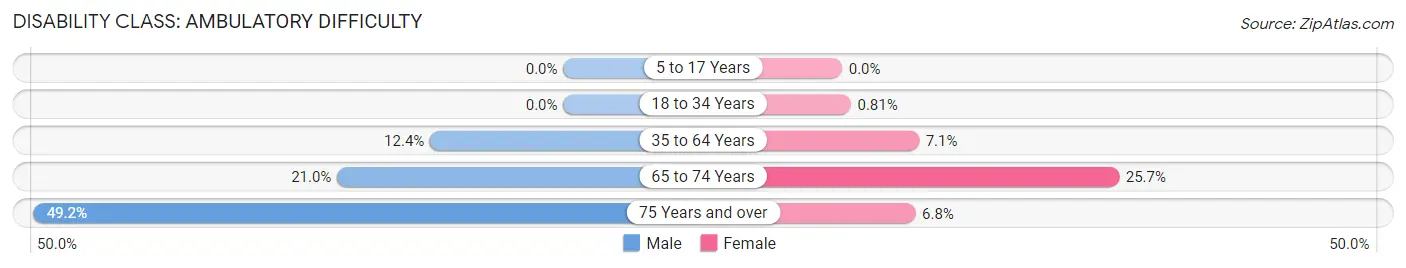
| Age Bracket | Male | Female |
| 5 to 17 Years | 0 (0.0%) | 0 (0.0%) |
| 18 to 34 Years | 0 (0.0%) | 4 (0.8%) |
| 35 to 64 Years | 67 (12.4%) | 38 (7.1%) |
| 65 to 74 Years | 17 (21.0%) | 18 (25.7%) |
| 75 Years and over | 29 (49.1%) | 7 (6.8%) |
Disability Class: Self-Care Difficulty
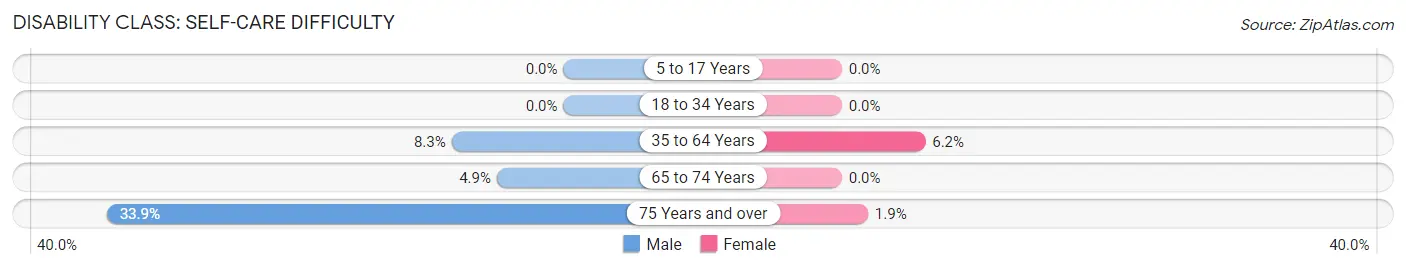
| Age Bracket | Male | Female |
| 5 to 17 Years | 0 (0.0%) | 0 (0.0%) |
| 18 to 34 Years | 0 (0.0%) | 0 (0.0%) |
| 35 to 64 Years | 45 (8.3%) | 33 (6.2%) |
| 65 to 74 Years | 4 (4.9%) | 0 (0.0%) |
| 75 Years and over | 20 (33.9%) | 2 (1.9%) |
Technology Access in Lake City
Computing Device Access in Lake City
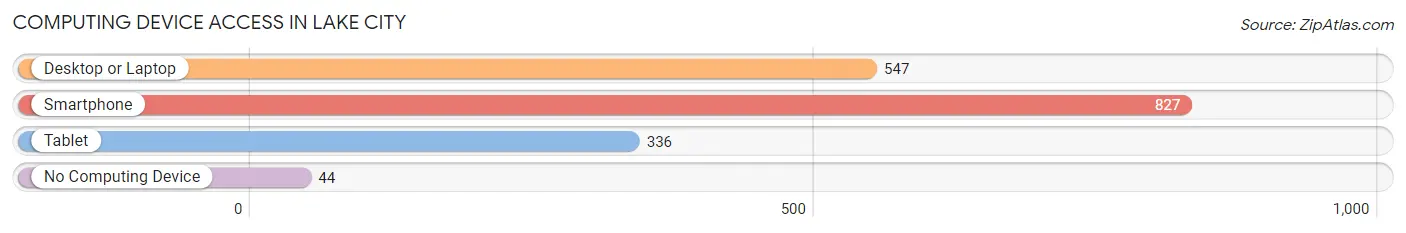
| Device Type | # Households | % Households |
| Desktop or Laptop | 547 | 60.4% |
| Smartphone | 827 | 91.3% |
| Tablet | 336 | 37.1% |
| No Computing Device | 44 | 4.9% |
| Total | 906 | 100.0% |
Internet Access in Lake City
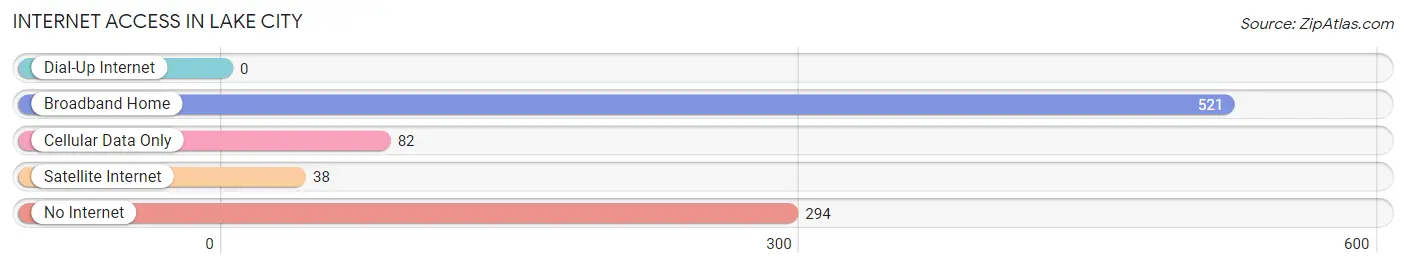
| Internet Type | # Households | % Households |
| Dial-Up Internet | 0 | 0.0% |
| Broadband Home | 521 | 57.5% |
| Cellular Data Only | 82 | 9.0% |
| Satellite Internet | 38 | 4.2% |
| No Internet | 294 | 32.5% |
| Total | 906 | 100.0% |
Lake City Summary
City of Lake City Georgia
Lake City, Georgia is a small city located in the southeastern part of the state, in the county of Ware. It is situated on the banks of the Satilla River, and is home to a population of approximately 2,000 people. The city is known for its rich history, its beautiful natural surroundings, and its vibrant economy.
History
The area that is now Lake City was first settled in the early 1800s by a group of settlers from North Carolina. The settlers named the area “Lake City” due to the numerous lakes in the area. The city was officially incorporated in 1883, and the first mayor was elected in 1884.
In the early 1900s, Lake City was a thriving agricultural center, with cotton, corn, and peanuts being the main crops. The city also had a thriving lumber industry, and the local sawmill was one of the largest in the state.
In the 1950s, the city began to experience a decline in its economy, as the lumber industry began to decline and the agricultural industry began to shift away from cotton and corn. The city was able to rebound in the 1960s, however, when the local economy began to diversify. The city began to attract new businesses, and the population began to grow.
Geography
Lake City is located in the southeastern part of the state, in the county of Ware. The city is situated on the banks of the Satilla River, and is surrounded by a number of lakes, including Lake Blackshear, Lake Seminole, and Lake Eufaula. The city is located approximately 30 miles from the Georgia-Florida border, and is about an hour’s drive from the cities of Valdosta and Albany.
The city has a total area of 4.2 square miles, of which 4.1 square miles is land and 0.1 square miles is water. The city is located at an elevation of approximately 200 feet above sea level.
Economy
The economy of Lake City is largely based on agriculture and tourism. The city is home to a number of farms, which produce a variety of crops, including cotton, corn, peanuts, and soybeans. The city is also home to a number of tourist attractions, including the Satilla River Wildlife Refuge, the Lake Blackshear Resort and Golf Course, and the Lake Seminole State Park.
The city is also home to a number of businesses, including a number of retail stores, restaurants, and other service-oriented businesses. The city is also home to a number of manufacturing companies, including a paper mill and a furniture factory.
Demographics
As of the 2010 census, the population of Lake City was 2,000 people. The racial makeup of the city was 79.2% White, 17.2% African American, 0.7% Native American, 0.3% Asian, 0.1% Pacific Islander, and 2.5% from other races. The median household income was $30,000, and the median family income was $35,000.
Conclusion
Lake City, Georgia is a small city located in the southeastern part of the state, in the county of Ware. It is situated on the banks of the Satilla River, and is home to a population of approximately 2,000 people. The city is known for its rich history, its beautiful natural surroundings, and its vibrant economy. The city’s economy is largely based on agriculture and tourism, and the city is home to a number of businesses, including a number of retail stores, restaurants, and other service-oriented businesses. The city is also home to a number of tourist attractions, including the Satilla River Wildlife Refuge, the Lake Blackshear Resort and Golf Course, and the Lake Seminole State Park. The population of Lake City is largely White, with African Americans, Native Americans, Asians, and Pacific Islanders making up the remainder of the population.
Common Questions
What is Per Capita Income in Lake City?
Per Capita income in Lake City is $24,316.
What is the Median Family Income in Lake City?
Median Family Income in Lake City is $65,000.
What is the Median Household income in Lake City?
Median Household Income in Lake City is $62,941.
What is Income or Wage Gap in Lake City?
Income or Wage Gap in Lake City is 31.9%.
Women in Lake City earn 68.1 cents for every dollar earned by a man.
What is Inequality or Gini Index in Lake City?
Inequality or Gini Index in Lake City is 0.43.
What is the Total Population of Lake City?
Total Population of Lake City is 2,916.
What is the Total Male Population of Lake City?
Total Male Population of Lake City is 1,335.
What is the Total Female Population of Lake City?
Total Female Population of Lake City is 1,581.
What is the Ratio of Males per 100 Females in Lake City?
There are 84.44 Males per 100 Females in Lake City.
What is the Ratio of Females per 100 Males in Lake City?
There are 118.43 Females per 100 Males in Lake City.
What is the Median Population Age in Lake City?
Median Population Age in Lake City is 41.9 Years.
What is the Average Family Size in Lake City
Average Family Size in Lake City is 3.6 People.
What is the Average Household Size in Lake City
Average Household Size in Lake City is 2.6 People.
How Large is the Labor Force in Lake City?
There are 1,635 People in the Labor Forcein in Lake City.
What is the Percentage of People in the Labor Force in Lake City?
64.7% of People are in the Labor Force in Lake City.
What is the Unemployment Rate in Lake City?
Unemployment Rate in Lake City is 1.8%.