Conception, MO Map & Demographics
Conception Map
Conception Overview
$11,339
PER CAPITA INCOME
$45,833
AVG FAMILY INCOME
$44,750
AVG HOUSEHOLD INCOME
0.23
INEQUALITY / GINI INDEX
266
TOTAL POPULATION
238
MALE POPULATION
28
FEMALE POPULATION
850.00
MALES / 100 FEMALES
11.76
FEMALES / 100 MALES
21.9
MEDIAN AGE
2.7
AVG FAMILY SIZE
2.0
AVG HOUSEHOLD SIZE
87
LABOR FORCE [ PEOPLE ]
34.1%
PERCENT IN LABOR FORCE
Conception Zip Codes
Conception Area Codes
Income in Conception
Income Overview in Conception
Per Capita Income in Conception is $11,339, while median incomes of families and households are $45,833 and $44,750 respectively.
| Characteristic | Number | Measure |
| Per Capita Income | 266 | $11,339 |
| Median Family Income | 12 | $45,833 |
| Mean Family Income | 12 | $53,800 |
| Median Household Income | 21 | $44,750 |
| Mean Household Income | 21 | $46,962 |
| Income Deficit | 12 | $0 |
| Wage / Income Gap (%) | 266 | 0.00% |
| Wage / Income Gap ($) | 266 | 100.00¢ per $1 |
| Gini / Inequality Index | 266 | 0.23 |
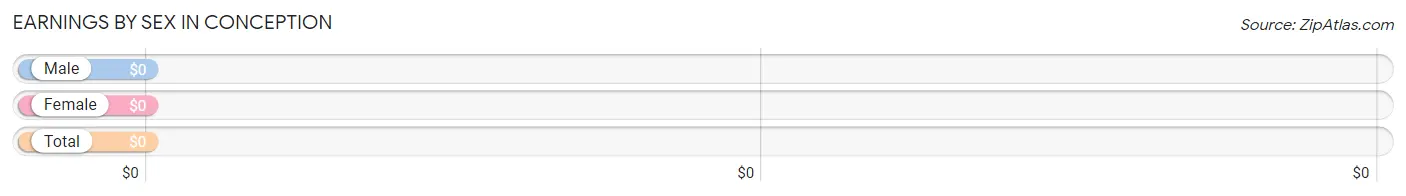
Earnings by Sex in Conception
| Sex | Number | Average Earnings |
| Male | 127 (87.6%) | $0 |
| Female | 18 (12.4%) | $0 |
| Total | 145 (100.0%) | $0 |
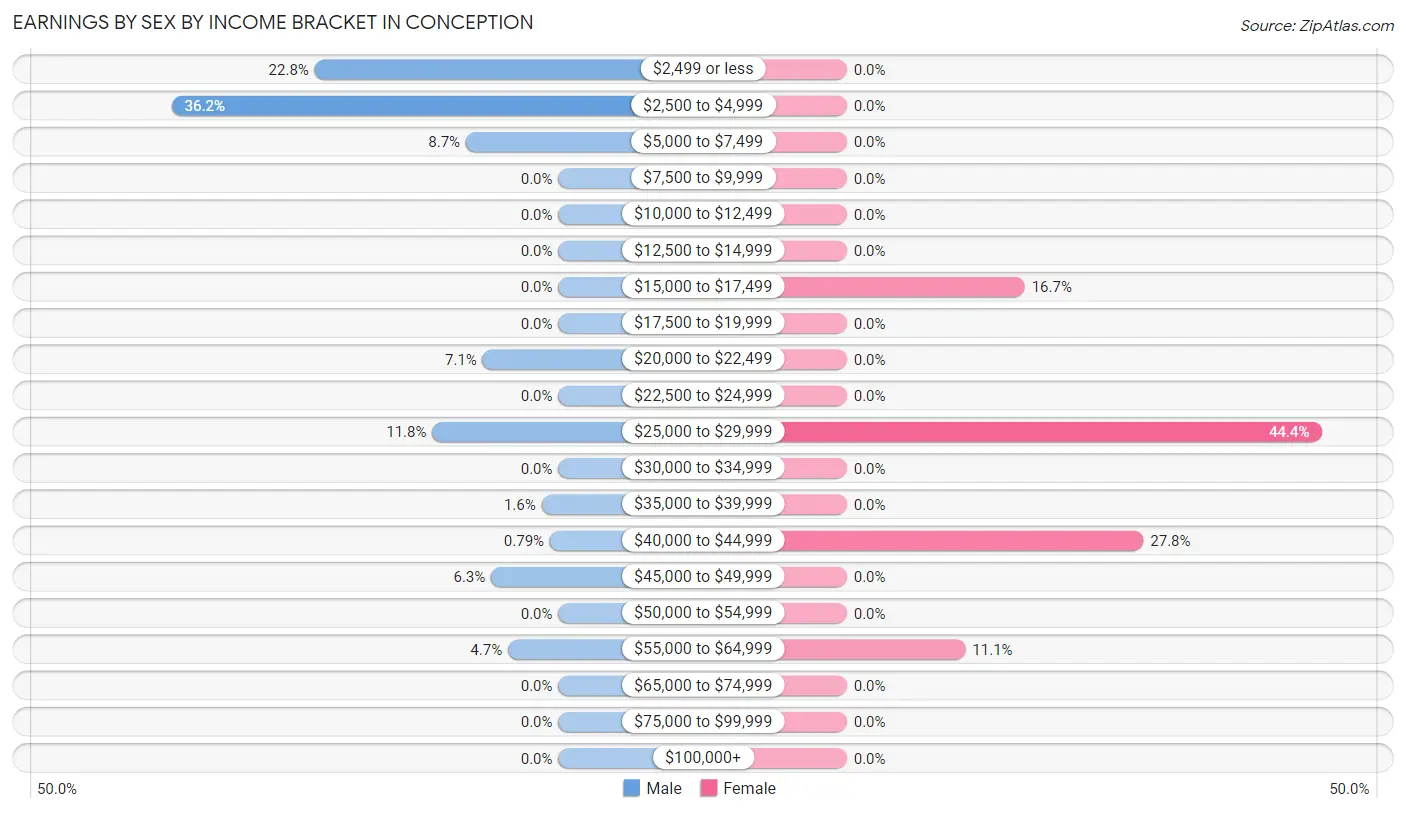
Earnings by Sex by Income Bracket in Conception
The most common earnings brackets in Conception are $2,500 to $4,999 for men (46 | 36.2%) and $25,000 to $29,999 for women (8 | 44.4%).
| Income | Male | Female |
| $2,499 or less | 29 (22.8%) | 0 (0.0%) |
| $2,500 to $4,999 | 46 (36.2%) | 0 (0.0%) |
| $5,000 to $7,499 | 11 (8.7%) | 0 (0.0%) |
| $7,500 to $9,999 | 0 (0.0%) | 0 (0.0%) |
| $10,000 to $12,499 | 0 (0.0%) | 0 (0.0%) |
| $12,500 to $14,999 | 0 (0.0%) | 0 (0.0%) |
| $15,000 to $17,499 | 0 (0.0%) | 3 (16.7%) |
| $17,500 to $19,999 | 0 (0.0%) | 0 (0.0%) |
| $20,000 to $22,499 | 9 (7.1%) | 0 (0.0%) |
| $22,500 to $24,999 | 0 (0.0%) | 0 (0.0%) |
| $25,000 to $29,999 | 15 (11.8%) | 8 (44.4%) |
| $30,000 to $34,999 | 0 (0.0%) | 0 (0.0%) |
| $35,000 to $39,999 | 2 (1.6%) | 0 (0.0%) |
| $40,000 to $44,999 | 1 (0.8%) | 5 (27.8%) |
| $45,000 to $49,999 | 8 (6.3%) | 0 (0.0%) |
| $50,000 to $54,999 | 0 (0.0%) | 0 (0.0%) |
| $55,000 to $64,999 | 6 (4.7%) | 2 (11.1%) |
| $65,000 to $74,999 | 0 (0.0%) | 0 (0.0%) |
| $75,000 to $99,999 | 0 (0.0%) | 0 (0.0%) |
| $100,000+ | 0 (0.0%) | 0 (0.0%) |
| Total | 127 (100.0%) | 18 (100.0%) |
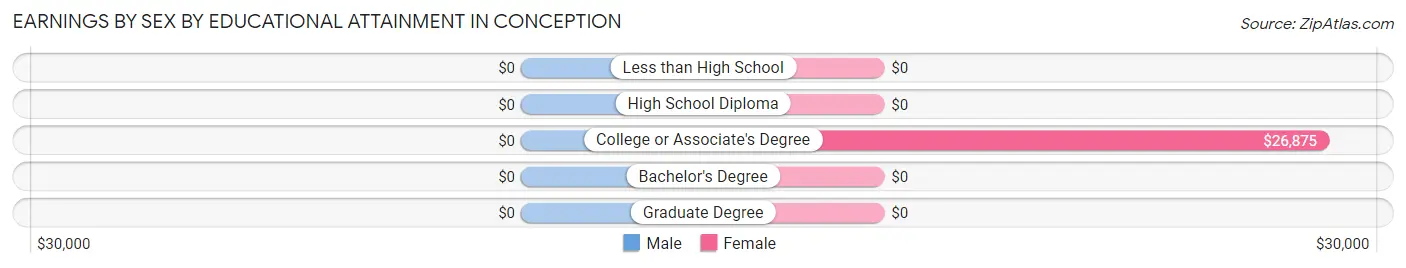
Earnings by Sex by Educational Attainment in Conception
| Educational Attainment | Male Income | Female Income |
| Less than High School | - | - |
| High School Diploma | - | - |
| College or Associate's Degree | - | - |
| Bachelor's Degree | - | - |
| Graduate Degree | - | - |
| Total | - | - |
Family Income in Conception
Family Income Brackets in Conception
According to the Conception family income data, there are 8 families falling into the $35,000 to $49,999 income range, which is the most common income bracket and makes up 66.7% of all families.
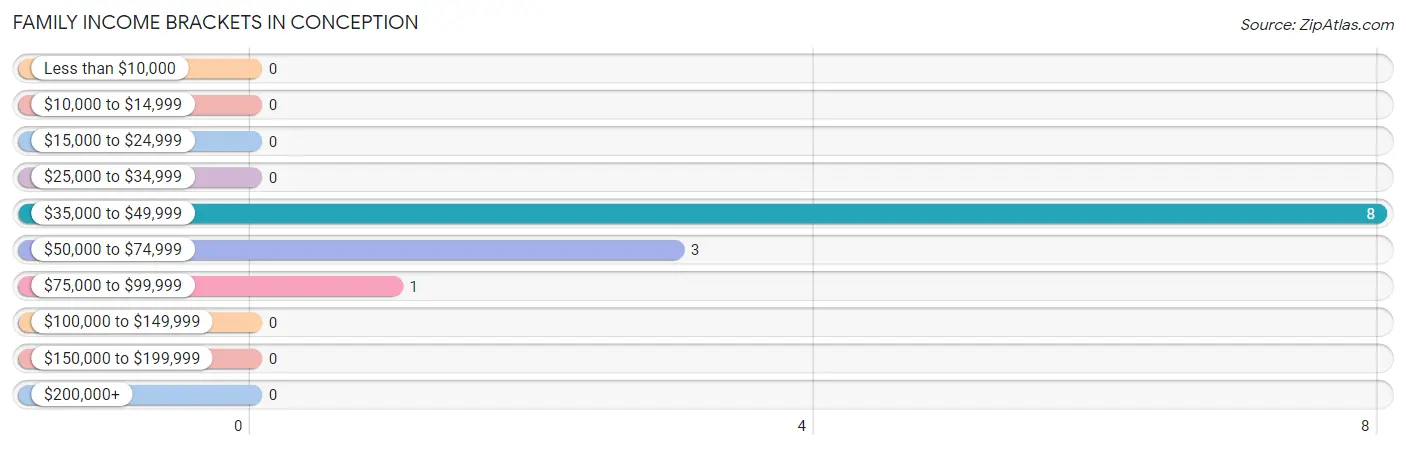
| Income Bracket | # Families | % Families |
| Less than $10,000 | 0 | 0.0% |
| $10,000 to $14,999 | 0 | 0.0% |
| $15,000 to $24,999 | 0 | 0.0% |
| $25,000 to $34,999 | 0 | 0.0% |
| $35,000 to $49,999 | 8 | 66.7% |
| $50,000 to $74,999 | 3 | 25.0% |
| $75,000 to $99,999 | 1 | 8.3% |
| $100,000 to $149,999 | 0 | 0.0% |
| $150,000 to $199,999 | 0 | 0.0% |
| $200,000+ | 0 | 0.0% |
Family Income by Famaliy Size in Conception
| Income Bracket | # Families | Median Income |
| 2-Person Families | 5 (41.7%) | $0 |
| 3-Person Families | 6 (50.0%) | $0 |
| 4-Person Families | 1 (8.3%) | $0 |
| 5-Person Families | 0 (0.0%) | $0 |
| 6-Person Families | 0 (0.0%) | $0 |
| 7+ Person Families | 0 (0.0%) | $0 |
| Total | 12 (100.0%) | $45,833 |
Family Income by Number of Earners in Conception
| Number of Earners | # Families | Median Income |
| No Earners | 4 (33.3%) | $0 |
| 1 Earner | 6 (50.0%) | $0 |
| 2 Earners | 1 (8.3%) | $0 |
| 3+ Earners | 1 (8.3%) | $0 |
| Total | 12 (100.0%) | $45,833 |
Household Income in Conception
Household Income Brackets in Conception
With 10 households falling in the category, the $35,000 to $49,999 income range is the most frequent in Conception, accounting for 47.6% of all households.
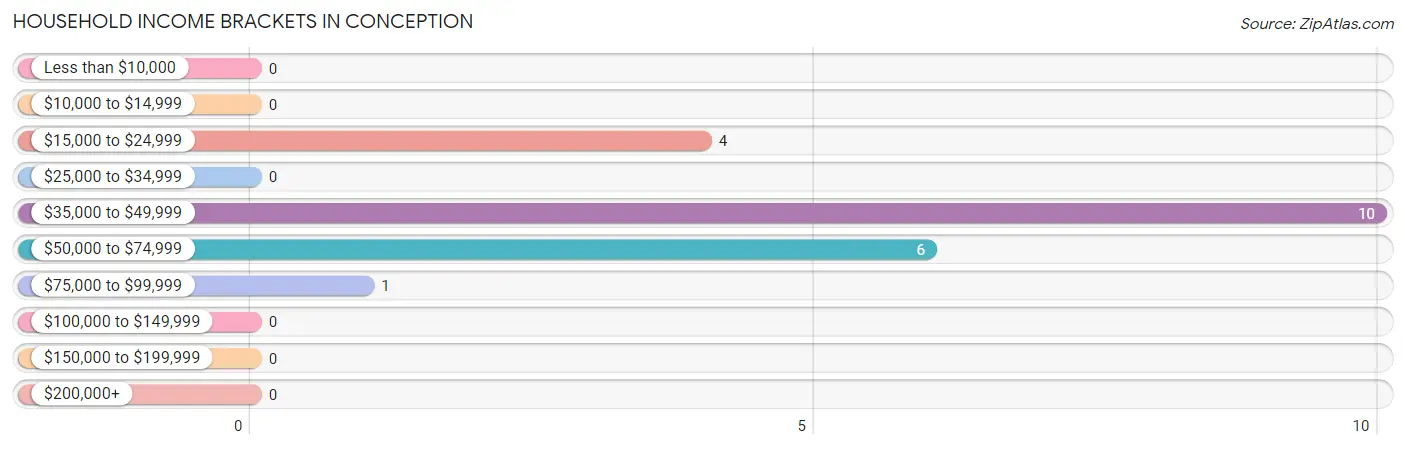
| Income Bracket | # Households | % Households |
| Less than $10,000 | 0 | 0.0% |
| $10,000 to $14,999 | 0 | 0.0% |
| $15,000 to $24,999 | 4 | 19.0% |
| $25,000 to $34,999 | 0 | 0.0% |
| $35,000 to $49,999 | 10 | 47.6% |
| $50,000 to $74,999 | 6 | 28.6% |
| $75,000 to $99,999 | 1 | 4.8% |
| $100,000 to $149,999 | 0 | 0.0% |
| $150,000 to $199,999 | 0 | 0.0% |
| $200,000+ | 0 | 0.0% |
Household Income by Householder Age in Conception
The median household income in Conception is $44,750, with the highest median household income of $70,417 found in the 65+ years age bracket for the primary householder. A total of 7 households (33.3%) fall into this category.
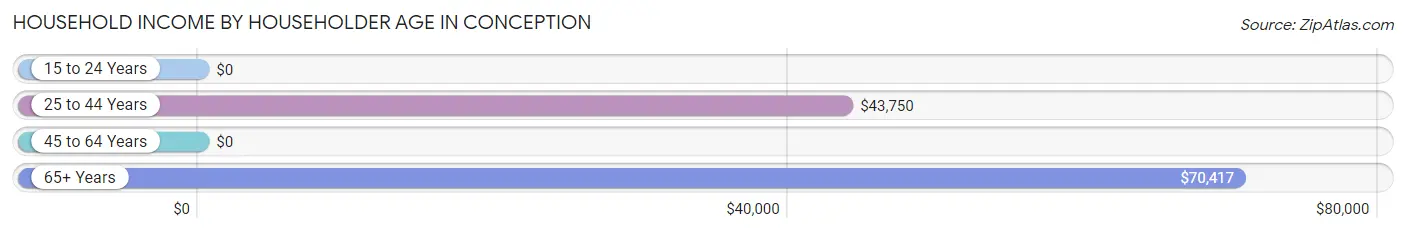
| Income Bracket | # Households | Median Income |
| 15 to 24 Years | 0 (0.0%) | $0 |
| 25 to 44 Years | 9 (42.9%) | $43,750 |
| 45 to 64 Years | 5 (23.8%) | $0 |
| 65+ Years | 7 (33.3%) | $70,417 |
| Total | 21 (100.0%) | $44,750 |
Poverty in Conception
Income Below Poverty by Sex and Age in Conception
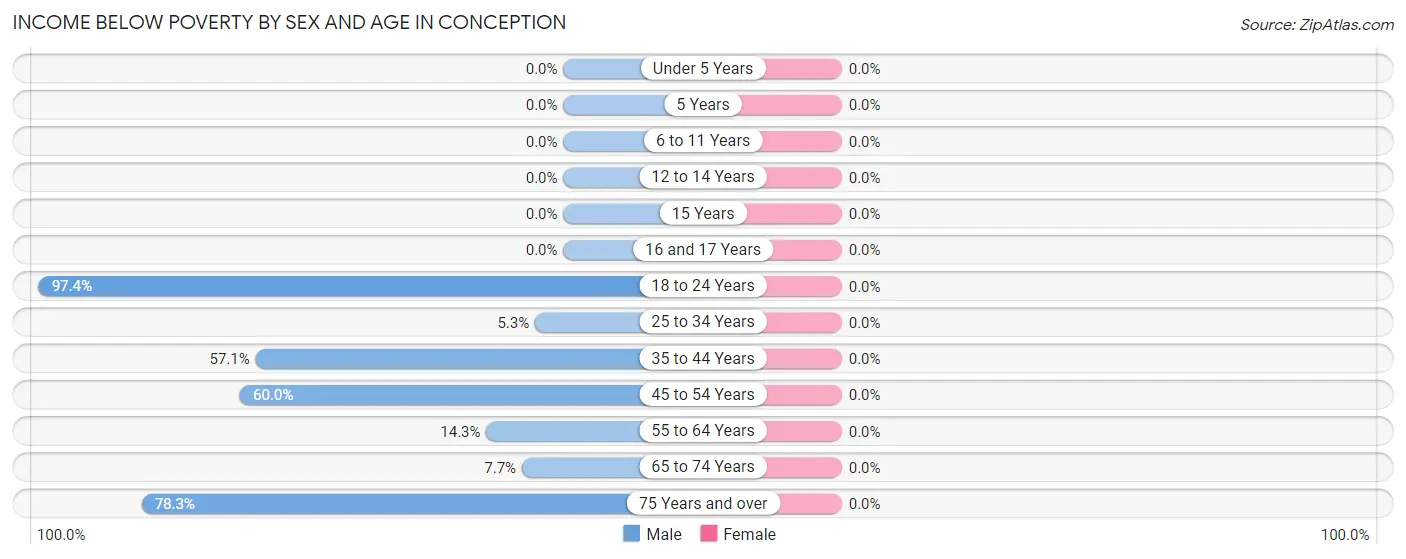
| Age Bracket | Male | Female |
| Under 5 Years | 0 (0.0%) | 0 (0.0%) |
| 5 Years | 0 (0.0%) | 0 (0.0%) |
| 6 to 11 Years | 0 (0.0%) | 0 (0.0%) |
| 12 to 14 Years | 0 (0.0%) | 0 (0.0%) |
| 15 Years | 0 (0.0%) | 0 (0.0%) |
| 16 and 17 Years | 0 (0.0%) | 0 (0.0%) |
| 18 to 24 Years | 37 (97.4%) | 0 (0.0%) |
| 25 to 34 Years | 1 (5.3%) | 0 (0.0%) |
| 35 to 44 Years | 12 (57.1%) | 0 (0.0%) |
| 45 to 54 Years | 9 (60.0%) | 0 (0.0%) |
| 55 to 64 Years | 1 (14.3%) | 0 (0.0%) |
| 65 to 74 Years | 1 (7.7%) | 0 (0.0%) |
| 75 Years and over | 18 (78.3%) | 0 (0.0%) |
| Total | 79 (54.9%) | 0 (0.0%) |
Income Above Poverty by Sex and Age in Conception
According to the poverty statistics in Conception, males aged under 5 years and females aged under 5 years are the age groups that are most secure financially, with 100.0% of males and 100.0% of females in these age groups living above the poverty line.
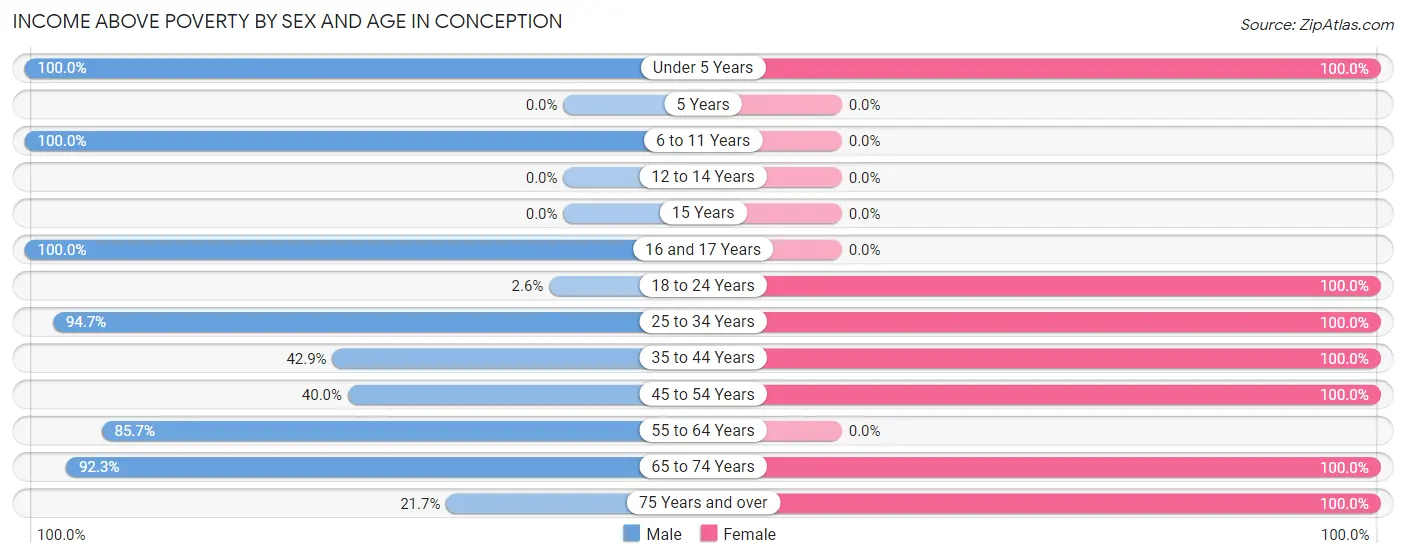
| Age Bracket | Male | Female |
| Under 5 Years | 1 (100.0%) | 4 (100.0%) |
| 5 Years | 0 (0.0%) | 0 (0.0%) |
| 6 to 11 Years | 6 (100.0%) | 0 (0.0%) |
| 12 to 14 Years | 0 (0.0%) | 0 (0.0%) |
| 15 Years | 0 (0.0%) | 0 (0.0%) |
| 16 and 17 Years | 1 (100.0%) | 0 (0.0%) |
| 18 to 24 Years | 1 (2.6%) | 2 (100.0%) |
| 25 to 34 Years | 18 (94.7%) | 6 (100.0%) |
| 35 to 44 Years | 9 (42.9%) | 8 (100.0%) |
| 45 to 54 Years | 6 (40.0%) | 5 (100.0%) |
| 55 to 64 Years | 6 (85.7%) | 0 (0.0%) |
| 65 to 74 Years | 12 (92.3%) | 2 (100.0%) |
| 75 Years and over | 5 (21.7%) | 1 (100.0%) |
| Total | 65 (45.1%) | 28 (100.0%) |
Income Below Poverty Among Married-Couple Families in Conception
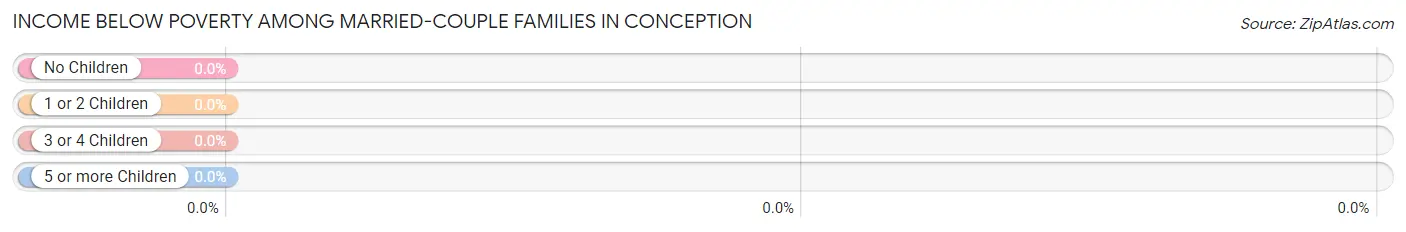
| Children | Above Poverty | Below Poverty |
| No Children | 5 (100.0%) | 0 (0.0%) |
| 1 or 2 Children | 1 (100.0%) | 0 (0.0%) |
| 3 or 4 Children | 0 (0.0%) | 0 (0.0%) |
| 5 or more Children | 0 (0.0%) | 0 (0.0%) |
| Total | 6 (100.0%) | 0 (0.0%) |
Income Below Poverty Among Single-Parent Households in Conception
| Children | Single Father | Single Mother |
| No Children | 0 (0.0%) | 0 (0.0%) |
| 1 or 2 Children | 0 (0.0%) | 0 (0.0%) |
| 3 or 4 Children | 0 (0.0%) | 0 (0.0%) |
| 5 or more Children | 0 (0.0%) | 0 (0.0%) |
| Total | 0 (0.0%) | 0 (0.0%) |
Income Below Poverty Among Married-Couple vs Single-Parent Households in Conception
| Children | Married-Couple Families | Single-Parent Households |
| No Children | 0 (0.0%) | 0 (0.0%) |
| 1 or 2 Children | 0 (0.0%) | 0 (0.0%) |
| 3 or 4 Children | 0 (0.0%) | 0 (0.0%) |
| 5 or more Children | 0 (0.0%) | 0 (0.0%) |
| Total | 0 (0.0%) | 0 (0.0%) |
Race in Conception
The most populous races in Conception are White / Caucasian (230 | 86.5%), Asian (36 | 13.5%), and Hispanic or Latino (16 | 6.0%).
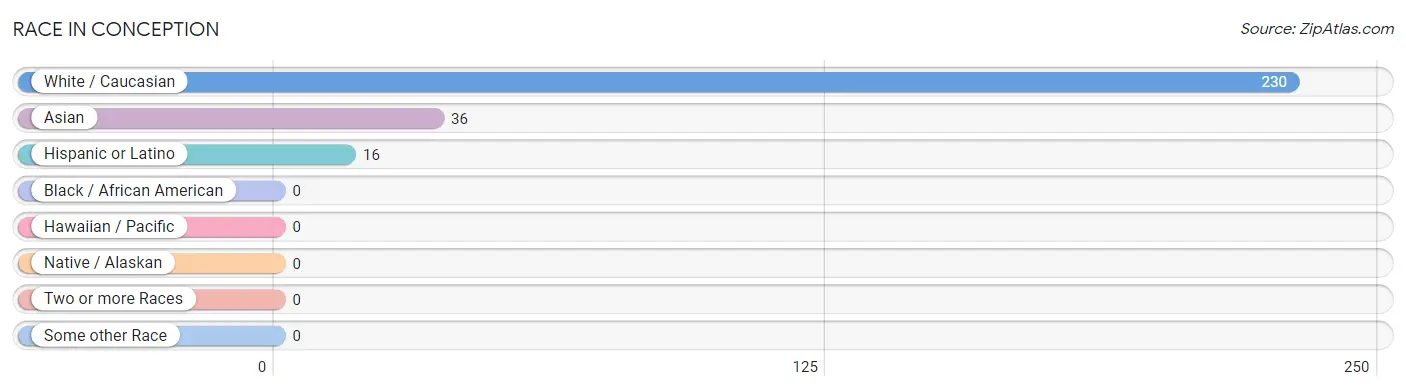
| Race | # Population | % Population |
| Asian | 36 | 13.5% |
| Black / African American | 0 | 0.0% |
| Hawaiian / Pacific | 0 | 0.0% |
| Hispanic or Latino | 16 | 6.0% |
| Native / Alaskan | 0 | 0.0% |
| White / Caucasian | 230 | 86.5% |
| Two or more Races | 0 | 0.0% |
| Some other Race | 0 | 0.0% |
| Total | 266 | 100.0% |
Ancestry in Conception
The most populous ancestries reported in Conception are German (77 | 28.9%), Irish (19 | 7.1%), Czechoslovakian (18 | 6.8%), English (18 | 6.8%), and Sri Lankan (18 | 6.8%), together accounting for 56.4% of all Conception residents.
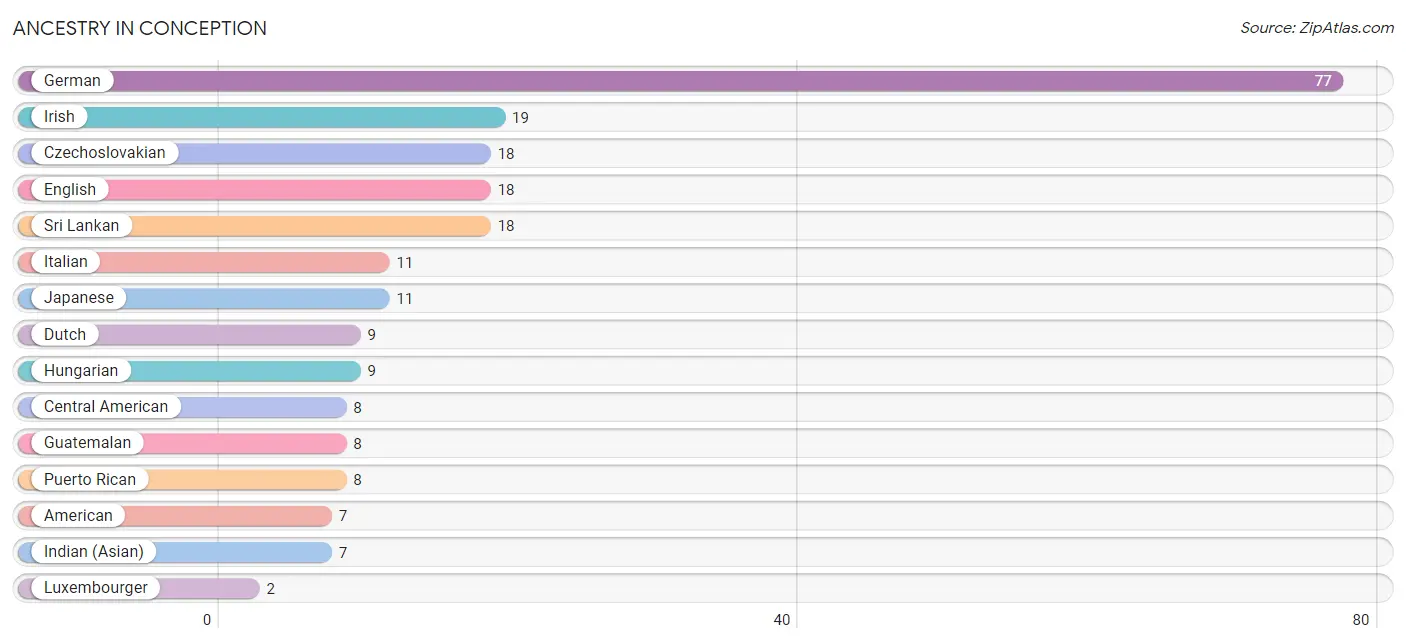
| Ancestry | # Population | % Population |
| American | 7 | 2.6% |
| Central American | 8 | 3.0% |
| Czechoslovakian | 18 | 6.8% |
| Dutch | 9 | 3.4% |
| English | 18 | 6.8% |
| German | 77 | 28.9% |
| Guatemalan | 8 | 3.0% |
| Hungarian | 9 | 3.4% |
| Indian (Asian) | 7 | 2.6% |
| Irish | 19 | 7.1% |
| Italian | 11 | 4.1% |
| Japanese | 11 | 4.1% |
| Luxembourger | 2 | 0.7% |
| Puerto Rican | 8 | 3.0% |
| Scottish | 2 | 0.7% |
| Sri Lankan | 18 | 6.8% |
| Swiss | 2 | 0.7% | View All 17 Rows |
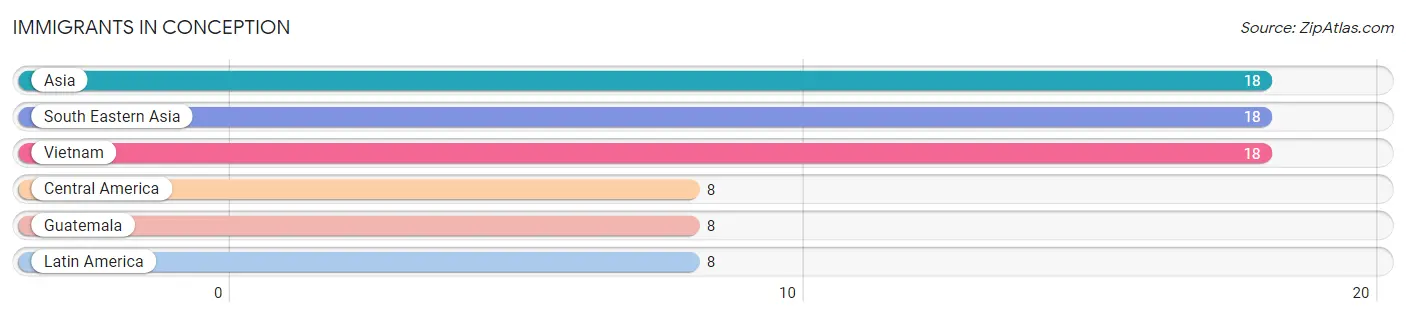
Immigrants in Conception
The most numerous immigrant groups reported in Conception came from Asia (18 | 6.8%), South Eastern Asia (18 | 6.8%), Vietnam (18 | 6.8%), Central America (8 | 3.0%), and Guatemala (8 | 3.0%), together accounting for 26.3% of all Conception residents.
| Immigration Origin | # Population | % Population |
| Asia | 18 | 6.8% |
| Central America | 8 | 3.0% |
| Guatemala | 8 | 3.0% |
| Latin America | 8 | 3.0% |
| South Eastern Asia | 18 | 6.8% |
| Vietnam | 18 | 6.8% | View All 6 Rows |
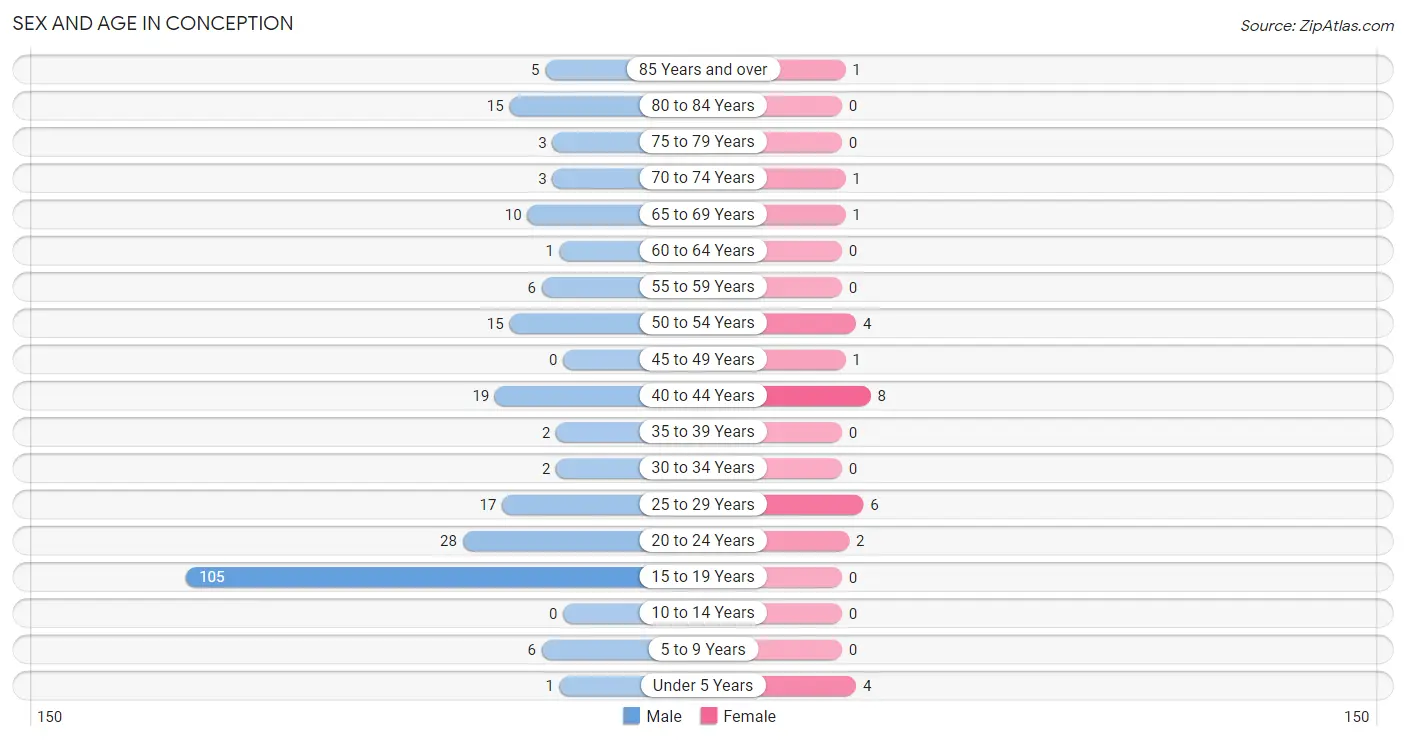
Sex and Age in Conception
Sex and Age in Conception
The most populous age groups in Conception are 15 to 19 Years (105 | 44.1%) for men and 40 to 44 Years (8 | 28.6%) for women.
| Age Bracket | Male | Female |
| Under 5 Years | 1 (0.4%) | 4 (14.3%) |
| 5 to 9 Years | 6 (2.5%) | 0 (0.0%) |
| 10 to 14 Years | 0 (0.0%) | 0 (0.0%) |
| 15 to 19 Years | 105 (44.1%) | 0 (0.0%) |
| 20 to 24 Years | 28 (11.8%) | 2 (7.1%) |
| 25 to 29 Years | 17 (7.1%) | 6 (21.4%) |
| 30 to 34 Years | 2 (0.8%) | 0 (0.0%) |
| 35 to 39 Years | 2 (0.8%) | 0 (0.0%) |
| 40 to 44 Years | 19 (8.0%) | 8 (28.6%) |
| 45 to 49 Years | 0 (0.0%) | 1 (3.6%) |
| 50 to 54 Years | 15 (6.3%) | 4 (14.3%) |
| 55 to 59 Years | 6 (2.5%) | 0 (0.0%) |
| 60 to 64 Years | 1 (0.4%) | 0 (0.0%) |
| 65 to 69 Years | 10 (4.2%) | 1 (3.6%) |
| 70 to 74 Years | 3 (1.3%) | 1 (3.6%) |
| 75 to 79 Years | 3 (1.3%) | 0 (0.0%) |
| 80 to 84 Years | 15 (6.3%) | 0 (0.0%) |
| 85 Years and over | 5 (2.1%) | 1 (3.6%) |
| Total | 238 (100.0%) | 28 (100.0%) |
Families and Households in Conception
Median Family Size in Conception
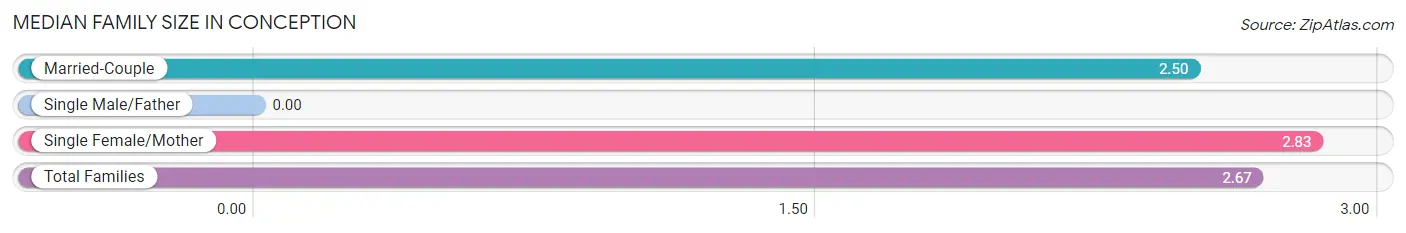
| Family Type | # Families | Family Size |
| Married-Couple | 6 (50.0%) | 2.50 |
| Single Male/Father | 0 (0.0%) | - |
| Single Female/Mother | 6 (50.0%) | 2.83 |
| Total Families | 12 (100.0%) | 2.67 |
Median Household Size in Conception
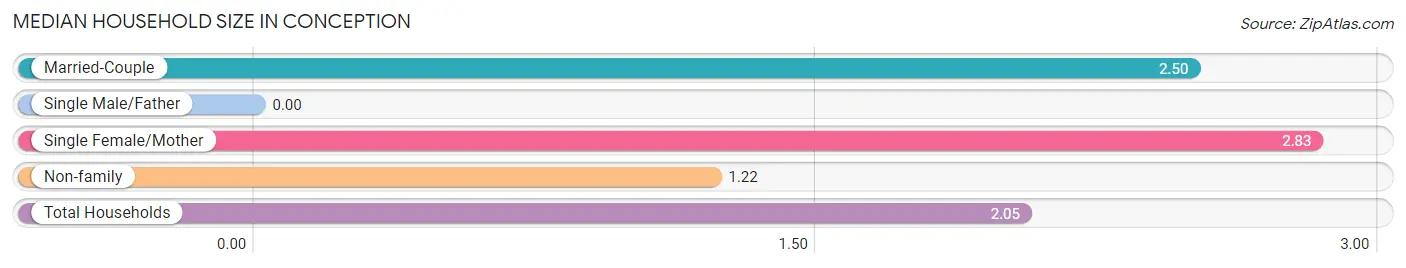
| Household Type | # Households | Household Size |
| Married-Couple | 6 (28.6%) | 2.50 |
| Single Male/Father | 0 (0.0%) | - |
| Single Female/Mother | 6 (28.6%) | 2.83 |
| Non-family | 9 (42.9%) | 1.22 |
| Total Households | 21 (100.0%) | 2.05 |
Household Size by Marriage Status in Conception
Out of a total of 21 households in Conception, 12 (57.1%) are family households, while 9 (42.9%) are nonfamily households. The most numerous type of family households are 3-person households, comprising 6, and the most common type of nonfamily households are 1-person households, comprising 8.
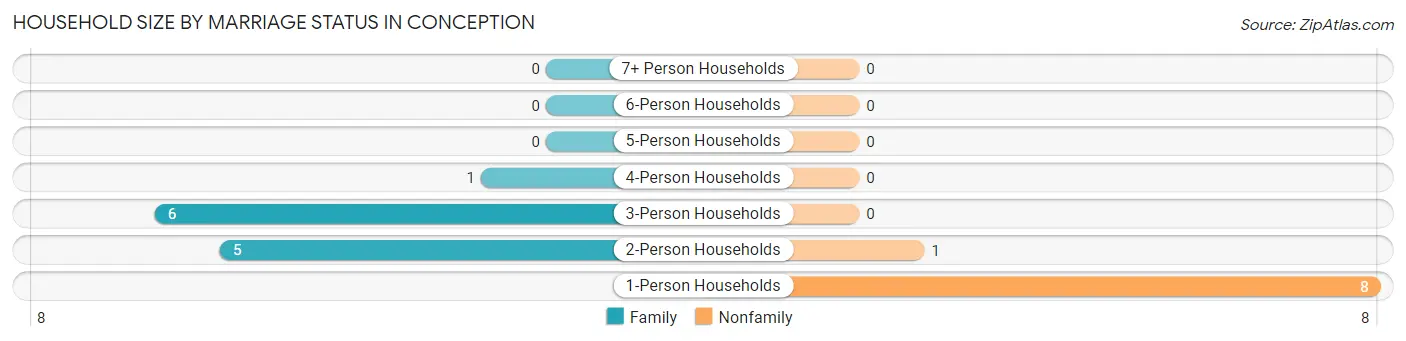
| Household Size | Family Households | Nonfamily Households |
| 1-Person Households | - | 8 (38.1%) |
| 2-Person Households | 5 (23.8%) | 1 (4.8%) |
| 3-Person Households | 6 (28.6%) | 0 (0.0%) |
| 4-Person Households | 1 (4.8%) | 0 (0.0%) |
| 5-Person Households | 0 (0.0%) | 0 (0.0%) |
| 6-Person Households | 0 (0.0%) | 0 (0.0%) |
| 7+ Person Households | 0 (0.0%) | 0 (0.0%) |
| Total | 12 (57.1%) | 9 (42.9%) |
Female Fertility in Conception
Fertility by Age in Conception
| Age Bracket | Women with Births | Births / 1,000 Women |
| 15 to 19 years | 0 (0.0%) | 0.0 |
| 20 to 34 years | 0 (0.0%) | 0.0 |
| 35 to 50 years | 0 (0.0%) | 0.0 |
| Total | 0 (0.0%) | 0.0 |
Fertility by Age by Marriage Status in Conception
| Age Bracket | Married | Unmarried |
| 15 to 19 years | 0 (0.0%) | 0 (0.0%) |
| 20 to 34 years | 0 (0.0%) | 0 (0.0%) |
| 35 to 50 years | 0 (0.0%) | 0 (0.0%) |
| Total | 0 (0.0%) | 0 (0.0%) |
Fertility by Education in Conception
| Educational Attainment | Women with Births | Births / 1,000 Women |
| Less than High School | 0 (0.0%) | 0.0 |
| High School Diploma | 0 (0.0%) | 0.0 |
| College or Associate's Degree | 0 (0.0%) | 0.0 |
| Bachelor's Degree | 0 (0.0%) | 0.0 |
| Graduate Degree | 0 (0.0%) | 0.0 |
| Total | 0 (0.0%) | 0.0 |
Fertility by Education by Marriage Status in Conception
| Educational Attainment | Married | Unmarried |
| Less than High School | 0 (0.0%) | 0 (0.0%) |
| High School Diploma | 0 (0.0%) | 0 (0.0%) |
| College or Associate's Degree | 0 (0.0%) | 0 (0.0%) |
| Bachelor's Degree | 0 (0.0%) | 0 (0.0%) |
| Graduate Degree | 0 (0.0%) | 0 (0.0%) |
| Total | 0 (0.0%) | 0 (0.0%) |
Employment Characteristics in Conception
Employment by Class of Employer in Conception
Among the 87 employed individuals in Conception, not-for-profit organizations (67 | 77.0%), private company employees (19 | 21.8%), and self-employed (incorporated) (1 | 1.1%) make up the most common classes of employment.
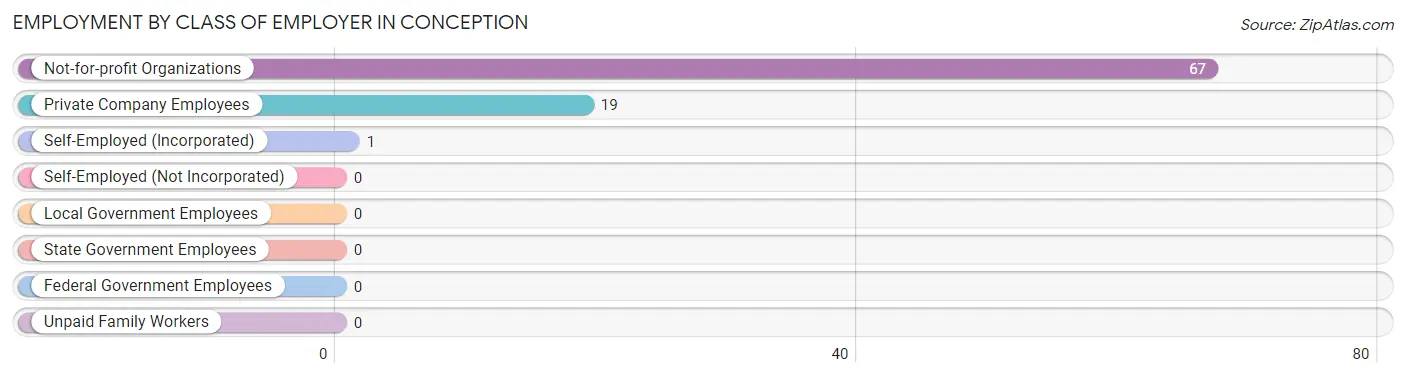
| Employer Class | # Employees | % Employees |
| Private Company Employees | 19 | 21.8% |
| Self-Employed (Incorporated) | 1 | 1.1% |
| Self-Employed (Not Incorporated) | 0 | 0.0% |
| Not-for-profit Organizations | 67 | 77.0% |
| Local Government Employees | 0 | 0.0% |
| State Government Employees | 0 | 0.0% |
| Federal Government Employees | 0 | 0.0% |
| Unpaid Family Workers | 0 | 0.0% |
| Total | 87 | 100.0% |
Employment Status by Age in Conception
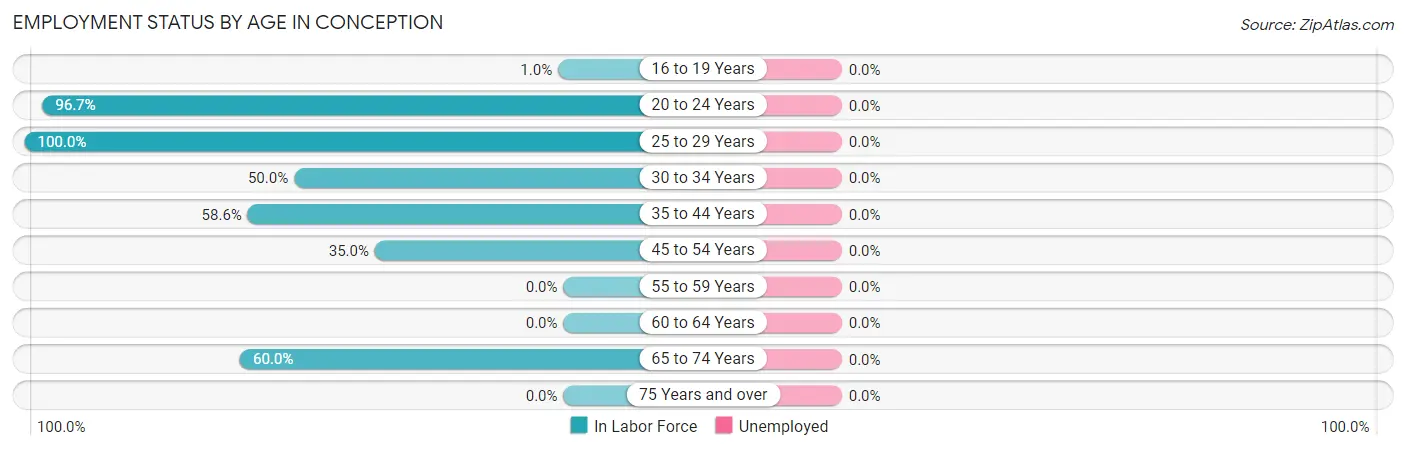
| Age Bracket | In Labor Force | Unemployed |
| 16 to 19 Years | 1 (1.0%) | 0 (0.0%) |
| 20 to 24 Years | 29 (96.7%) | 0 (0.0%) |
| 25 to 29 Years | 23 (100.0%) | 0 (0.0%) |
| 30 to 34 Years | 1 (50.0%) | 0 (0.0%) |
| 35 to 44 Years | 17 (58.6%) | 0 (0.0%) |
| 45 to 54 Years | 7 (35.0%) | 0 (0.0%) |
| 55 to 59 Years | 0 (0.0%) | 0 (0.0%) |
| 60 to 64 Years | 0 (0.0%) | 0 (0.0%) |
| 65 to 74 Years | 9 (60.0%) | 0 (0.0%) |
| 75 Years and over | 0 (0.0%) | 0 (0.0%) |
| Total | 87 (34.1%) | 0 (0.0%) |
Employment Status by Educational Attainment in Conception
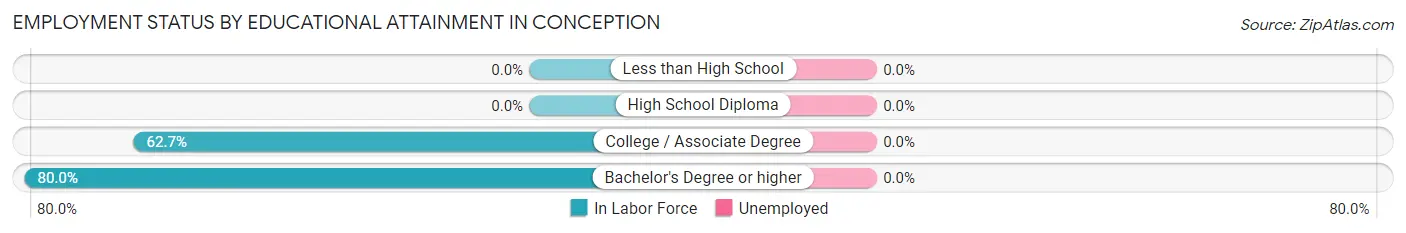
| Educational Attainment | In Labor Force | Unemployed |
| Less than High School | 0 (0.0%) | 0 (0.0%) |
| High School Diploma | 0 (0.0%) | 0 (0.0%) |
| College / Associate Degree | 32 (62.7%) | 0 (0.0%) |
| Bachelor's Degree or higher | 16 (80.0%) | 0 (0.0%) |
| Total | 48 (59.3%) | 0 (0.0%) |
Employment Occupations by Sex in Conception
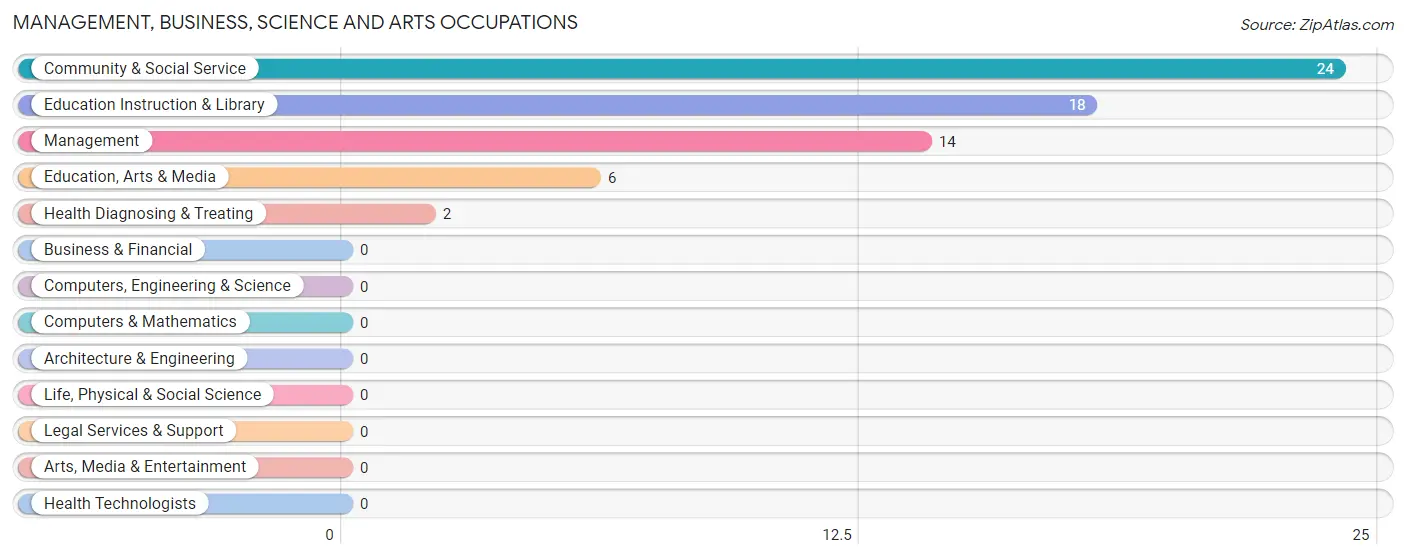
Management, Business, Science and Arts Occupations
The most common Management, Business, Science and Arts occupations in Conception are Community & Social Service (24 | 27.6%), Education Instruction & Library (18 | 20.7%), Management (14 | 16.1%), Education, Arts & Media (6 | 6.9%), and Health Diagnosing & Treating (2 | 2.3%).
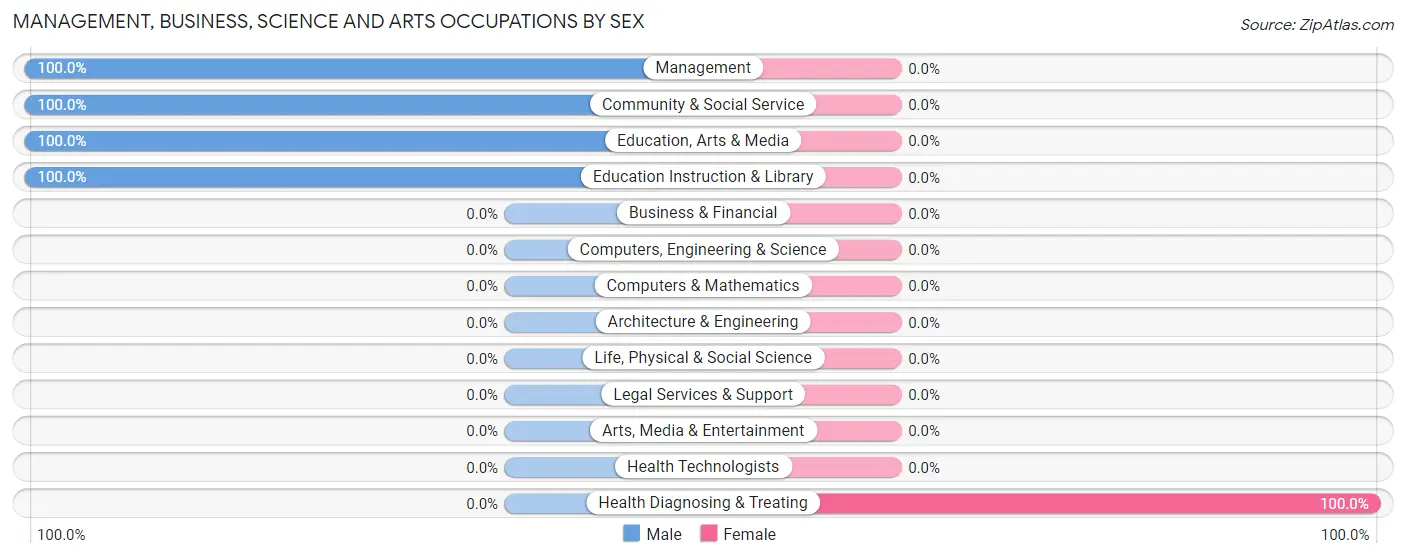
Management, Business, Science and Arts Occupations by Sex
| Occupation | Male | Female |
| Management | 14 (100.0%) | 0 (0.0%) |
| Business & Financial | 0 (0.0%) | 0 (0.0%) |
| Computers, Engineering & Science | 0 (0.0%) | 0 (0.0%) |
| Computers & Mathematics | 0 (0.0%) | 0 (0.0%) |
| Architecture & Engineering | 0 (0.0%) | 0 (0.0%) |
| Life, Physical & Social Science | 0 (0.0%) | 0 (0.0%) |
| Community & Social Service | 24 (100.0%) | 0 (0.0%) |
| Education, Arts & Media | 6 (100.0%) | 0 (0.0%) |
| Legal Services & Support | 0 (0.0%) | 0 (0.0%) |
| Education Instruction & Library | 18 (100.0%) | 0 (0.0%) |
| Arts, Media & Entertainment | 0 (0.0%) | 0 (0.0%) |
| Health Diagnosing & Treating | 0 (0.0%) | 2 (100.0%) |
| Health Technologists | 0 (0.0%) | 0 (0.0%) |
| Total (Category) | 38 (95.0%) | 2 (5.0%) |
| Total (Overall) | 69 (79.3%) | 18 (20.7%) |
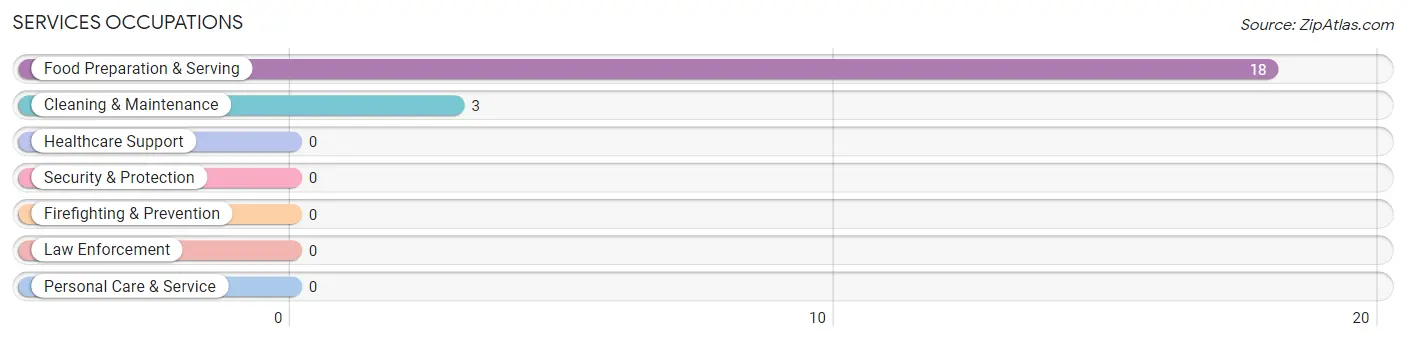
Services Occupations
The most common Services occupations in Conception are Food Preparation & Serving (18 | 20.7%), and Cleaning & Maintenance (3 | 3.5%).
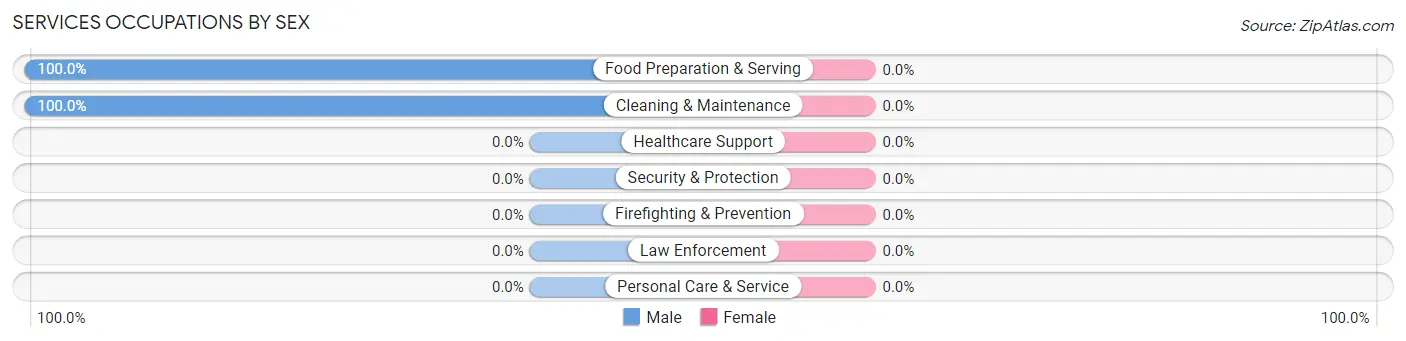
Services Occupations by Sex
| Occupation | Male | Female |
| Healthcare Support | 0 (0.0%) | 0 (0.0%) |
| Security & Protection | 0 (0.0%) | 0 (0.0%) |
| Firefighting & Prevention | 0 (0.0%) | 0 (0.0%) |
| Law Enforcement | 0 (0.0%) | 0 (0.0%) |
| Food Preparation & Serving | 18 (100.0%) | 0 (0.0%) |
| Cleaning & Maintenance | 3 (100.0%) | 0 (0.0%) |
| Personal Care & Service | 0 (0.0%) | 0 (0.0%) |
| Total (Category) | 21 (100.0%) | 0 (0.0%) |
| Total (Overall) | 69 (79.3%) | 18 (20.7%) |
Sales and Office Occupations
The most common Sales and Office occupations in Conception are Office & Administration (10 | 11.5%), and Sales & Related (7 | 8.1%).
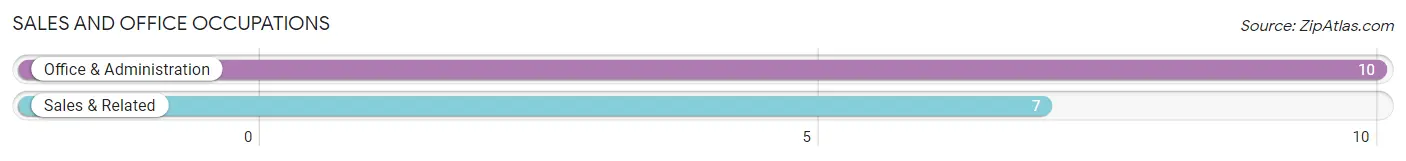
Sales and Office Occupations by Sex
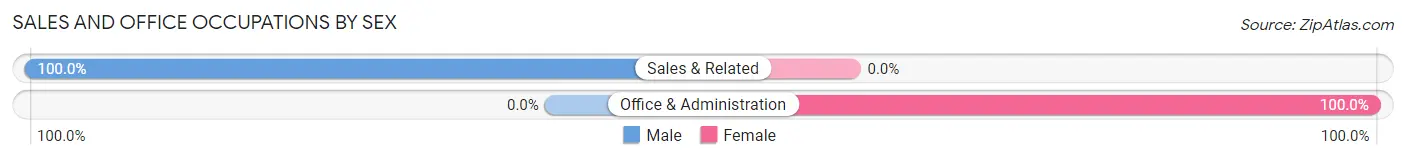
| Occupation | Male | Female |
| Sales & Related | 7 (100.0%) | 0 (0.0%) |
| Office & Administration | 0 (0.0%) | 10 (100.0%) |
| Total (Category) | 7 (41.2%) | 10 (58.8%) |
| Total (Overall) | 69 (79.3%) | 18 (20.7%) |
Natural Resources, Construction and Maintenance Occupations
The most common Natural Resources, Construction and Maintenance occupations in Conception are , and Installation, Maintenance & Repair (3 | 3.5%).
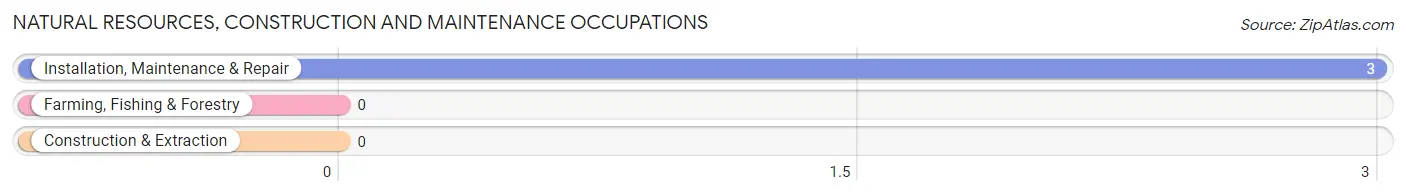
Natural Resources, Construction and Maintenance Occupations by Sex
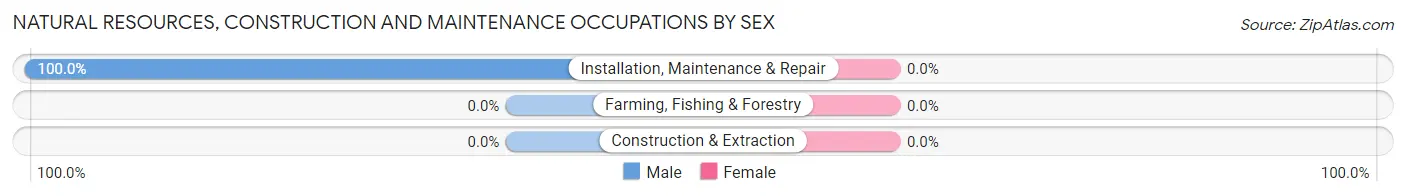
| Occupation | Male | Female |
| Farming, Fishing & Forestry | 0 (0.0%) | 0 (0.0%) |
| Construction & Extraction | 0 (0.0%) | 0 (0.0%) |
| Installation, Maintenance & Repair | 3 (100.0%) | 0 (0.0%) |
| Total (Category) | 3 (100.0%) | 0 (0.0%) |
| Total (Overall) | 69 (79.3%) | 18 (20.7%) |
Production, Transportation and Moving Occupations
The most common Production, Transportation and Moving occupations in Conception are Material Moving (5 | 5.8%), and Production (1 | 1.1%).
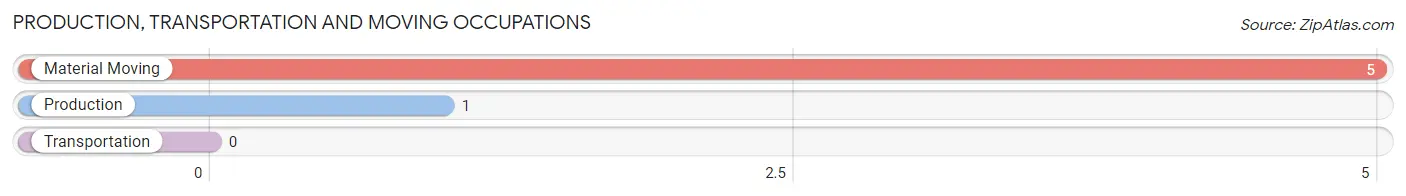
Production, Transportation and Moving Occupations by Sex
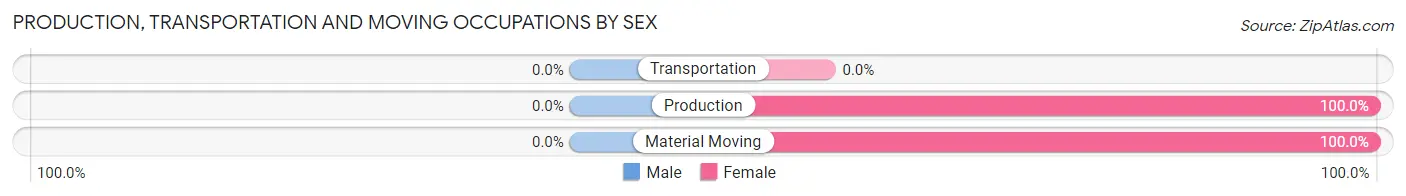
| Occupation | Male | Female |
| Production | 0 (0.0%) | 1 (100.0%) |
| Transportation | 0 (0.0%) | 0 (0.0%) |
| Material Moving | 0 (0.0%) | 5 (100.0%) |
| Total (Category) | 0 (0.0%) | 6 (100.0%) |
| Total (Overall) | 69 (79.3%) | 18 (20.7%) |
Employment Industries by Sex in Conception
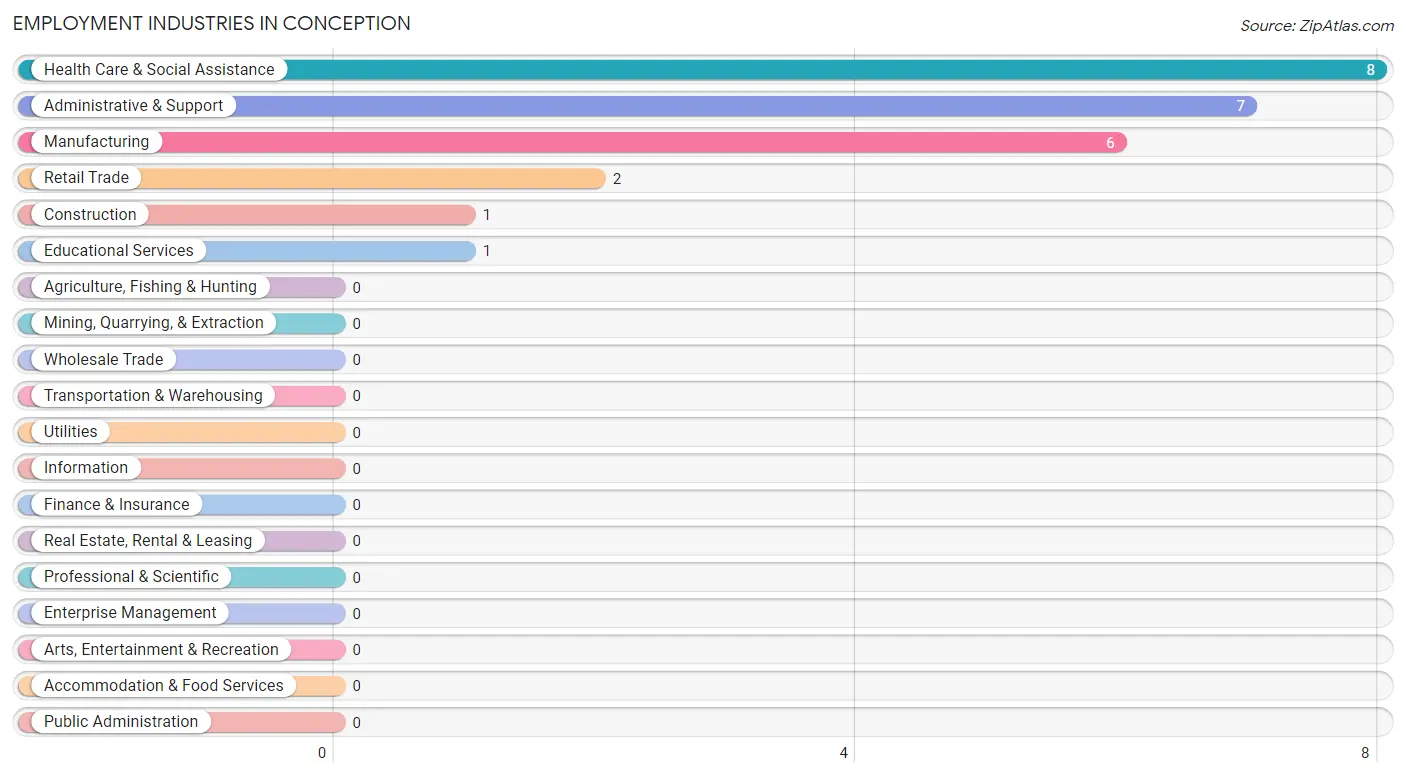
Employment Industries in Conception
The major employment industries in Conception include Health Care & Social Assistance (8 | 9.2%), Administrative & Support (7 | 8.1%), Manufacturing (6 | 6.9%), Retail Trade (2 | 2.3%), and Construction (1 | 1.1%).
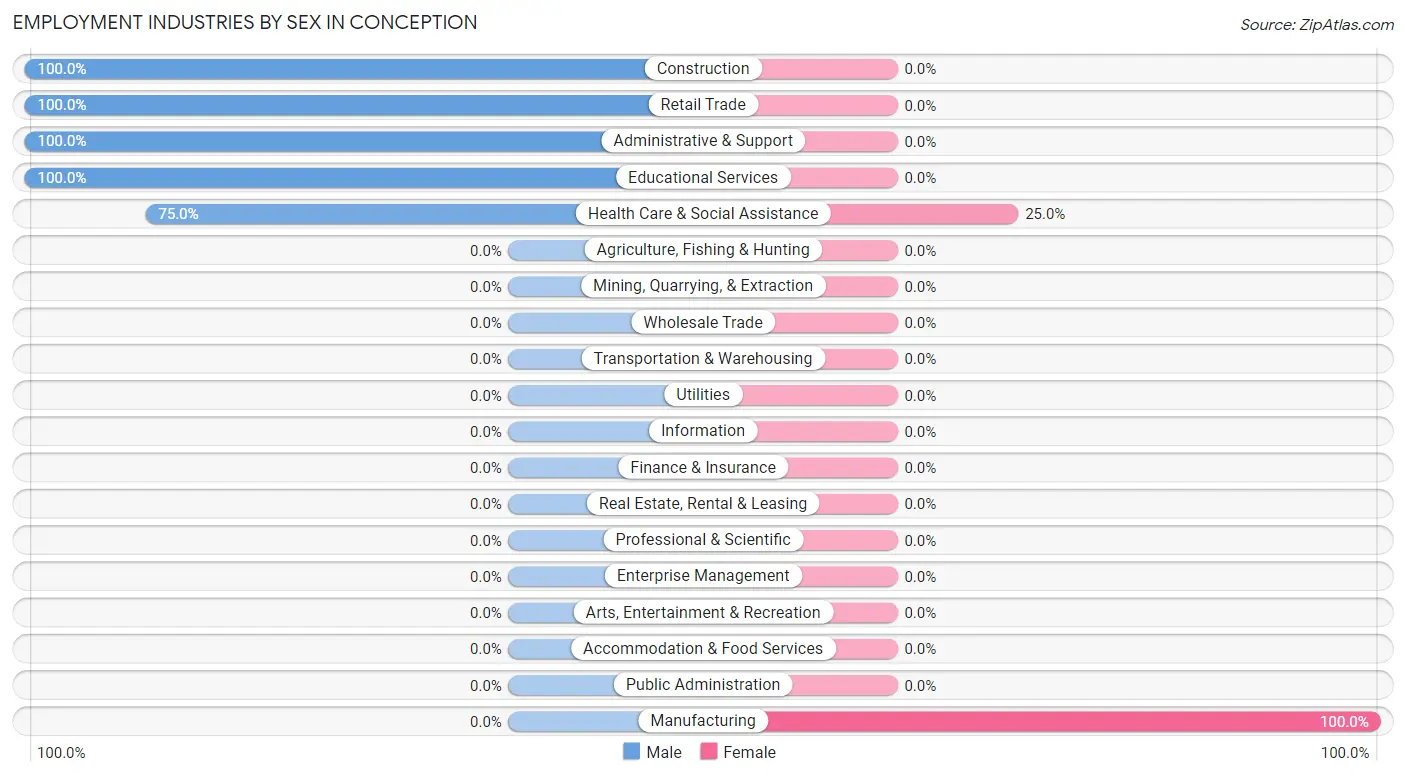
Employment Industries by Sex in Conception
The Conception industries that see more men than women are Construction (100.0%), Retail Trade (100.0%), and Administrative & Support (100.0%), whereas the industries that tend to have a higher number of women are Manufacturing (100.0%), and Health Care & Social Assistance (25.0%).
| Industry | Male | Female |
| Agriculture, Fishing & Hunting | 0 (0.0%) | 0 (0.0%) |
| Mining, Quarrying, & Extraction | 0 (0.0%) | 0 (0.0%) |
| Construction | 1 (100.0%) | 0 (0.0%) |
| Manufacturing | 0 (0.0%) | 6 (100.0%) |
| Wholesale Trade | 0 (0.0%) | 0 (0.0%) |
| Retail Trade | 2 (100.0%) | 0 (0.0%) |
| Transportation & Warehousing | 0 (0.0%) | 0 (0.0%) |
| Utilities | 0 (0.0%) | 0 (0.0%) |
| Information | 0 (0.0%) | 0 (0.0%) |
| Finance & Insurance | 0 (0.0%) | 0 (0.0%) |
| Real Estate, Rental & Leasing | 0 (0.0%) | 0 (0.0%) |
| Professional & Scientific | 0 (0.0%) | 0 (0.0%) |
| Enterprise Management | 0 (0.0%) | 0 (0.0%) |
| Administrative & Support | 7 (100.0%) | 0 (0.0%) |
| Educational Services | 1 (100.0%) | 0 (0.0%) |
| Health Care & Social Assistance | 6 (75.0%) | 2 (25.0%) |
| Arts, Entertainment & Recreation | 0 (0.0%) | 0 (0.0%) |
| Accommodation & Food Services | 0 (0.0%) | 0 (0.0%) |
| Public Administration | 0 (0.0%) | 0 (0.0%) |
| Total | 69 (79.3%) | 18 (20.7%) |
Education in Conception
School Enrollment in Conception
The most common levels of schooling among the 172 students in Conception are college / undergraduate (156 | 90.7%), graduate / professional (8 | 4.6%), and elementary school (6 | 3.5%).
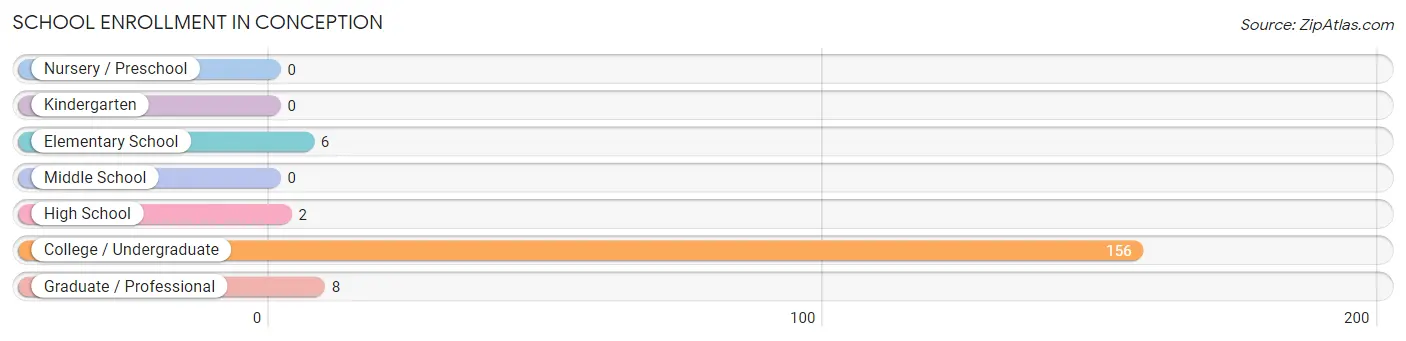
| School Level | # Students | % Students |
| Nursery / Preschool | 0 | 0.0% |
| Kindergarten | 0 | 0.0% |
| Elementary School | 6 | 3.5% |
| Middle School | 0 | 0.0% |
| High School | 2 | 1.2% |
| College / Undergraduate | 156 | 90.7% |
| Graduate / Professional | 8 | 4.6% |
| Total | 172 | 100.0% |
School Enrollment by Age by Funding Source in Conception
Out of a total of 172 students who are enrolled in schools in Conception, 61 (35.5%) attend a private institution, while the remaining 111 (64.5%) are enrolled in public schools. The age group of 35 years and over has the highest likelihood of being enrolled in private schools, with 25 (100.0% in the age bracket) enrolled. Conversely, the age group of 5 to 9 year old has the lowest likelihood of being enrolled in a private school, with 6 (100.0% in the age bracket) attending a public institution.
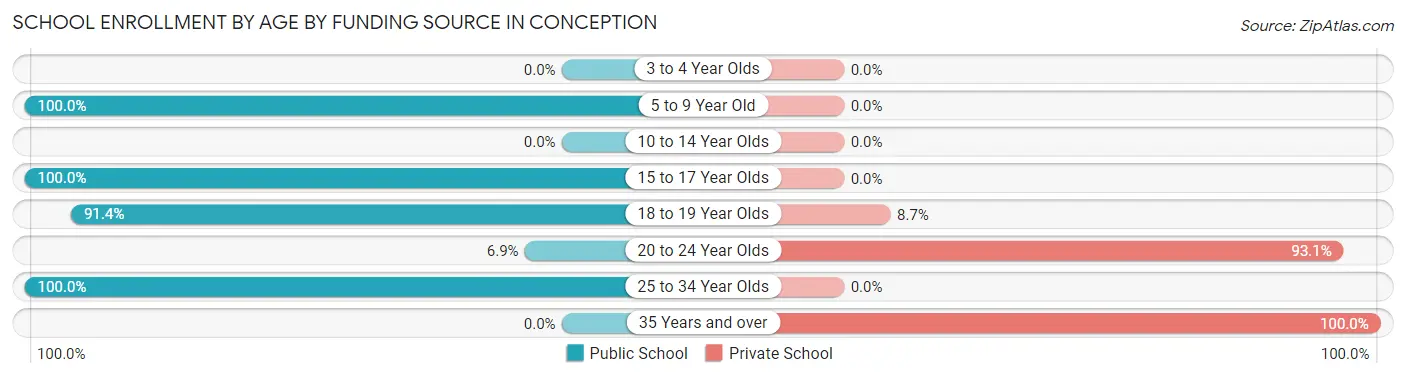
| Age Bracket | Public School | Private School |
| 3 to 4 Year Olds | 0 (0.0%) | 0 (0.0%) |
| 5 to 9 Year Old | 6 (100.0%) | 0 (0.0%) |
| 10 to 14 Year Olds | 0 (0.0%) | 0 (0.0%) |
| 15 to 17 Year Olds | 1 (100.0%) | 0 (0.0%) |
| 18 to 19 Year Olds | 95 (91.3%) | 9 (8.6%) |
| 20 to 24 Year Olds | 2 (6.9%) | 27 (93.1%) |
| 25 to 34 Year Olds | 7 (100.0%) | 0 (0.0%) |
| 35 Years and over | 0 (0.0%) | 25 (100.0%) |
| Total | 111 (64.5%) | 61 (35.5%) |
Educational Attainment by Field of Study in Conception
Liberal arts & history (34 | 79.1%), science & technology (8 | 18.6%), and business (1 | 2.3%) are the most common fields of study among 43 individuals in Conception who have obtained a bachelor's degree or higher.
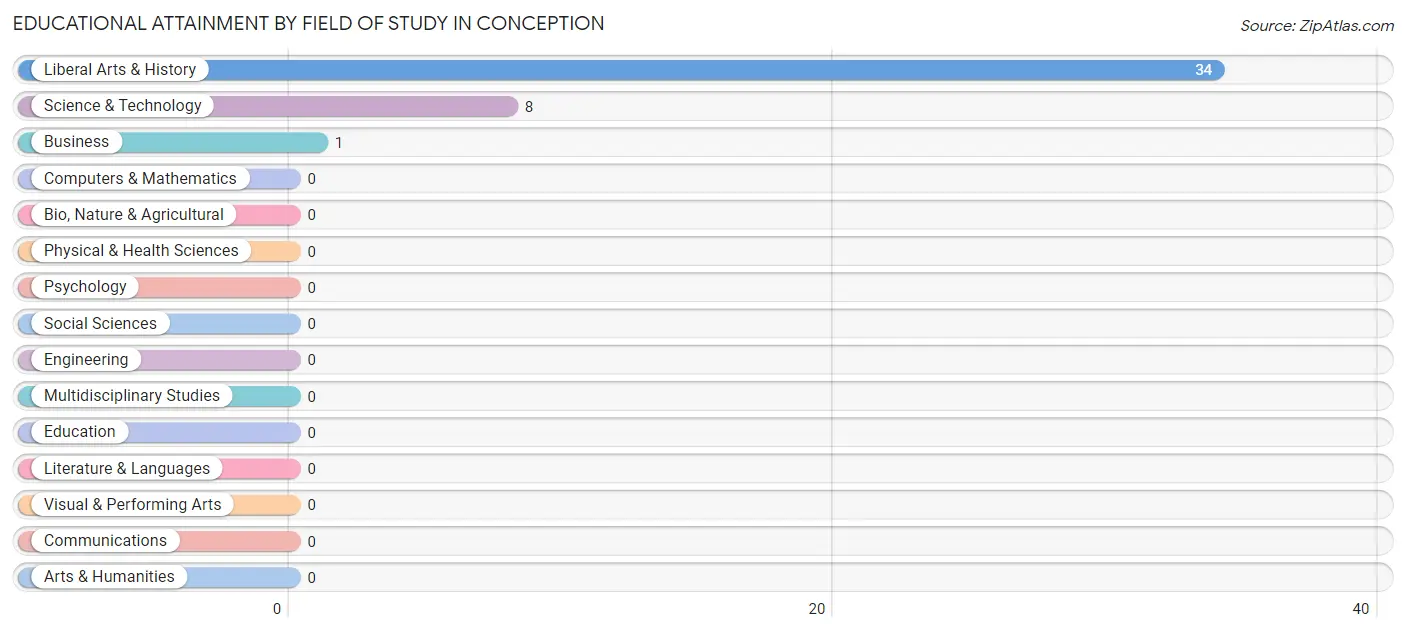
| Field of Study | # Graduates | % Graduates |
| Computers & Mathematics | 0 | 0.0% |
| Bio, Nature & Agricultural | 0 | 0.0% |
| Physical & Health Sciences | 0 | 0.0% |
| Psychology | 0 | 0.0% |
| Social Sciences | 0 | 0.0% |
| Engineering | 0 | 0.0% |
| Multidisciplinary Studies | 0 | 0.0% |
| Science & Technology | 8 | 18.6% |
| Business | 1 | 2.3% |
| Education | 0 | 0.0% |
| Literature & Languages | 0 | 0.0% |
| Liberal Arts & History | 34 | 79.1% |
| Visual & Performing Arts | 0 | 0.0% |
| Communications | 0 | 0.0% |
| Arts & Humanities | 0 | 0.0% |
| Total | 43 | 100.0% |
Transportation & Commute in Conception
Vehicle Availability by Sex in Conception
The most prevalent vehicle ownership categories in Conception are males with 2 vehicles (3, accounting for 50.0%) and females with 2 vehicles (2, making up 30.0%).
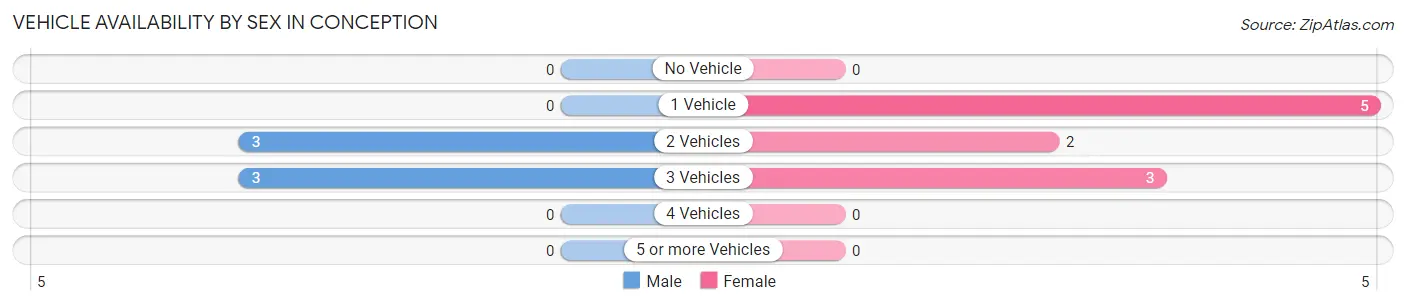
| Vehicles Available | Male | Female |
| No Vehicle | 0 (0.0%) | 0 (0.0%) |
| 1 Vehicle | 0 (0.0%) | 5 (50.0%) |
| 2 Vehicles | 3 (50.0%) | 2 (20.0%) |
| 3 Vehicles | 3 (50.0%) | 3 (30.0%) |
| 4 Vehicles | 0 (0.0%) | 0 (0.0%) |
| 5 or more Vehicles | 0 (0.0%) | 0 (0.0%) |
| Total | 6 (100.0%) | 10 (100.0%) |
Commute Time in Conception
The most frequently occuring commute durations in Conception are 20 to 24 minutes (21 commuters, 72.4%), 5 to 9 minutes (3 commuters, 10.3%), and 45 to 59 minutes (2 commuters, 6.9%).
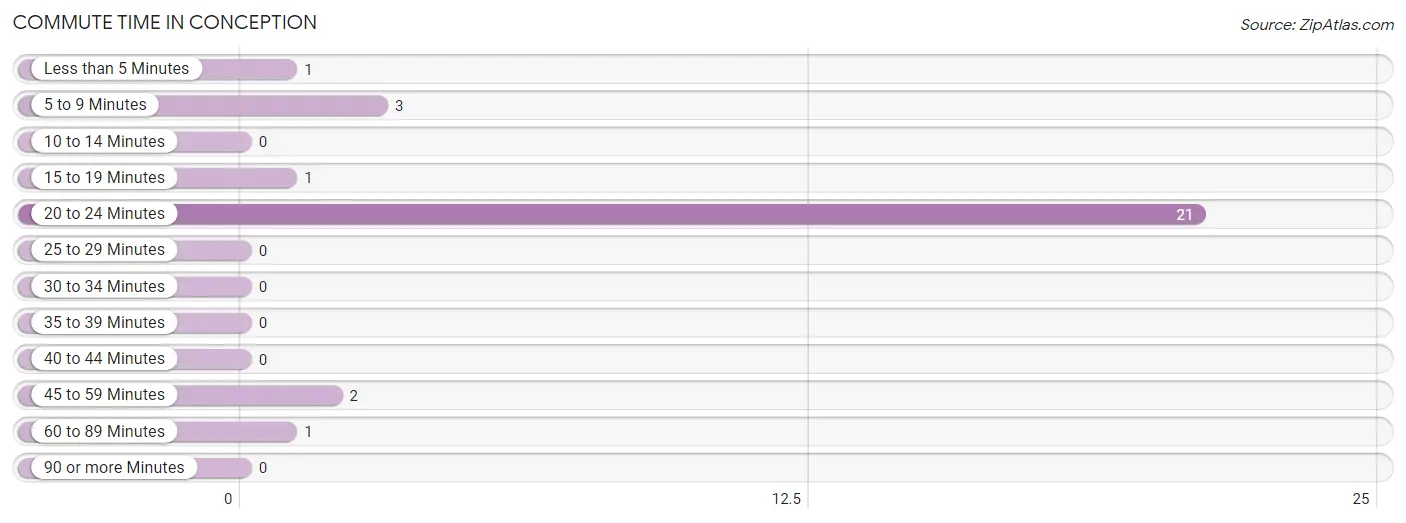
| Commute Time | # Commuters | % Commuters |
| Less than 5 Minutes | 1 | 3.5% |
| 5 to 9 Minutes | 3 | 10.3% |
| 10 to 14 Minutes | 0 | 0.0% |
| 15 to 19 Minutes | 1 | 3.5% |
| 20 to 24 Minutes | 21 | 72.4% |
| 25 to 29 Minutes | 0 | 0.0% |
| 30 to 34 Minutes | 0 | 0.0% |
| 35 to 39 Minutes | 0 | 0.0% |
| 40 to 44 Minutes | 0 | 0.0% |
| 45 to 59 Minutes | 2 | 6.9% |
| 60 to 89 Minutes | 1 | 3.5% |
| 90 or more Minutes | 0 | 0.0% |
Commute Time by Sex in Conception
The most common commute times in Conception are 20 to 24 minutes (15 commuters, 78.9%) for males and 20 to 24 minutes (6 commuters, 60.0%) for females.
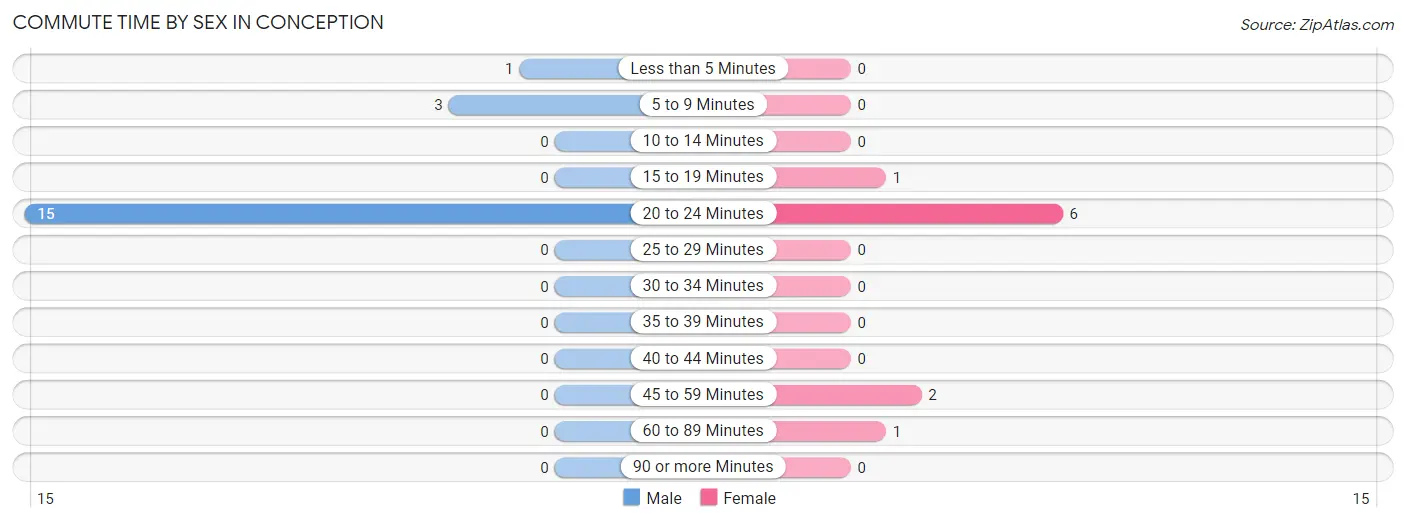
| Commute Time | Male | Female |
| Less than 5 Minutes | 1 (5.3%) | 0 (0.0%) |
| 5 to 9 Minutes | 3 (15.8%) | 0 (0.0%) |
| 10 to 14 Minutes | 0 (0.0%) | 0 (0.0%) |
| 15 to 19 Minutes | 0 (0.0%) | 1 (10.0%) |
| 20 to 24 Minutes | 15 (78.9%) | 6 (60.0%) |
| 25 to 29 Minutes | 0 (0.0%) | 0 (0.0%) |
| 30 to 34 Minutes | 0 (0.0%) | 0 (0.0%) |
| 35 to 39 Minutes | 0 (0.0%) | 0 (0.0%) |
| 40 to 44 Minutes | 0 (0.0%) | 0 (0.0%) |
| 45 to 59 Minutes | 0 (0.0%) | 2 (20.0%) |
| 60 to 89 Minutes | 0 (0.0%) | 1 (10.0%) |
| 90 or more Minutes | 0 (0.0%) | 0 (0.0%) |
Time of Departure to Work by Sex in Conception
The most frequent times of departure to work in Conception are 8:00 AM to 8:29 AM (7, 36.8%) for males and 4:00 PM to 11:59 PM (5, 50.0%) for females.
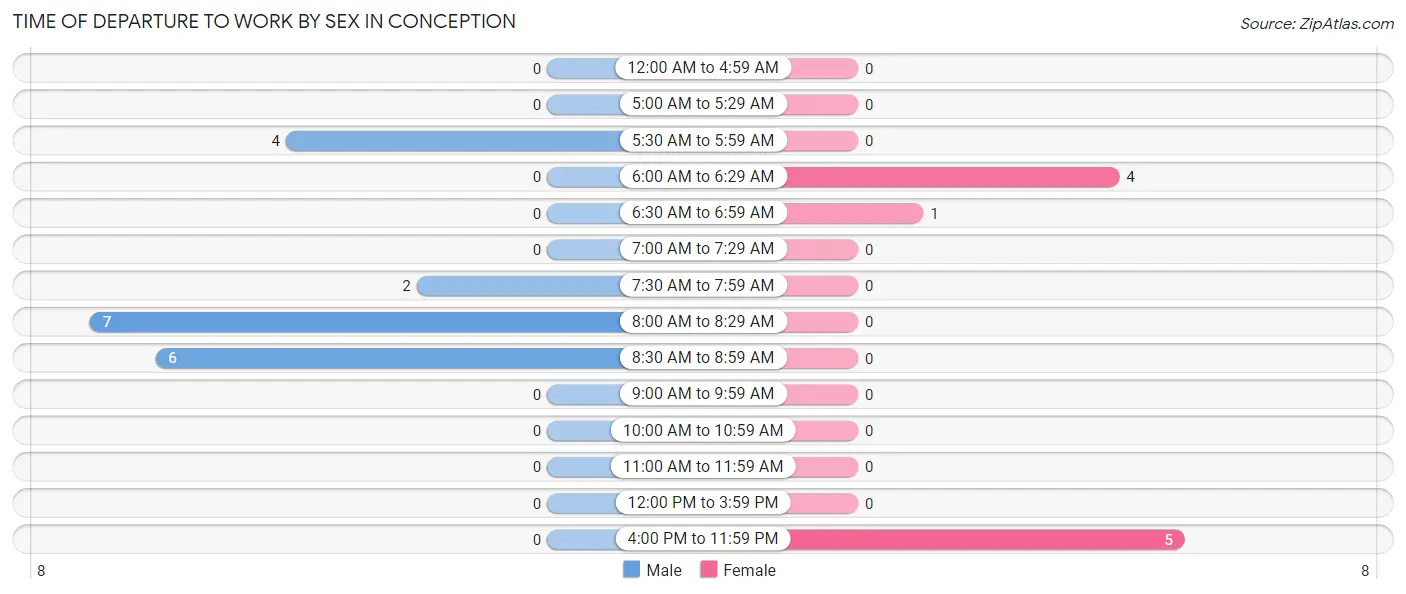
| Time of Departure | Male | Female |
| 12:00 AM to 4:59 AM | 0 (0.0%) | 0 (0.0%) |
| 5:00 AM to 5:29 AM | 0 (0.0%) | 0 (0.0%) |
| 5:30 AM to 5:59 AM | 4 (21.0%) | 0 (0.0%) |
| 6:00 AM to 6:29 AM | 0 (0.0%) | 4 (40.0%) |
| 6:30 AM to 6:59 AM | 0 (0.0%) | 1 (10.0%) |
| 7:00 AM to 7:29 AM | 0 (0.0%) | 0 (0.0%) |
| 7:30 AM to 7:59 AM | 2 (10.5%) | 0 (0.0%) |
| 8:00 AM to 8:29 AM | 7 (36.8%) | 0 (0.0%) |
| 8:30 AM to 8:59 AM | 6 (31.6%) | 0 (0.0%) |
| 9:00 AM to 9:59 AM | 0 (0.0%) | 0 (0.0%) |
| 10:00 AM to 10:59 AM | 0 (0.0%) | 0 (0.0%) |
| 11:00 AM to 11:59 AM | 0 (0.0%) | 0 (0.0%) |
| 12:00 PM to 3:59 PM | 0 (0.0%) | 0 (0.0%) |
| 4:00 PM to 11:59 PM | 0 (0.0%) | 5 (50.0%) |
| Total | 19 (100.0%) | 10 (100.0%) |
Housing Occupancy in Conception
Occupancy by Ownership in Conception
Of the total 21 dwellings in Conception, owner-occupied units account for 17 (80.9%), while renter-occupied units make up 4 (19.1%).
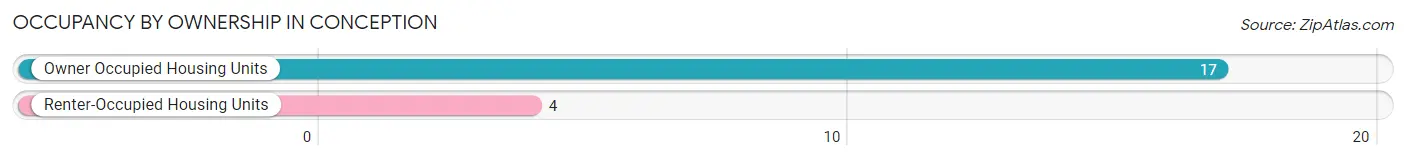
| Occupancy | # Housing Units | % Housing Units |
| Owner Occupied Housing Units | 17 | 80.9% |
| Renter-Occupied Housing Units | 4 | 19.1% |
| Total Occupied Housing Units | 21 | 100.0% |
Occupancy by Household Size in Conception
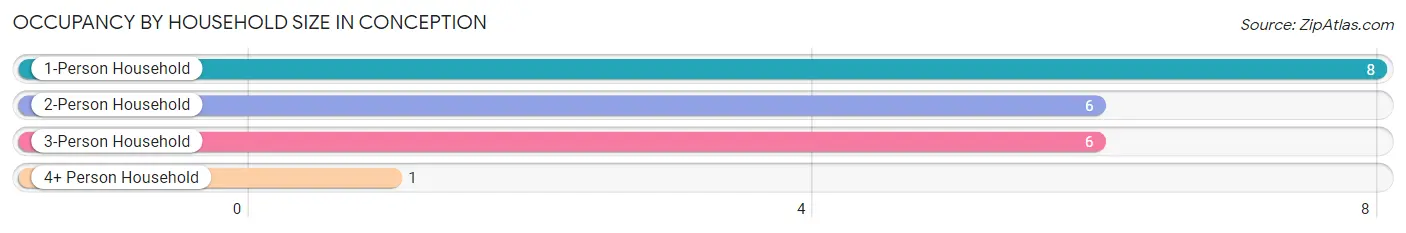
| Household Size | # Housing Units | % Housing Units |
| 1-Person Household | 8 | 38.1% |
| 2-Person Household | 6 | 28.6% |
| 3-Person Household | 6 | 28.6% |
| 4+ Person Household | 1 | 4.8% |
| Total Housing Units | 21 | 100.0% |
Occupancy by Ownership by Household Size in Conception
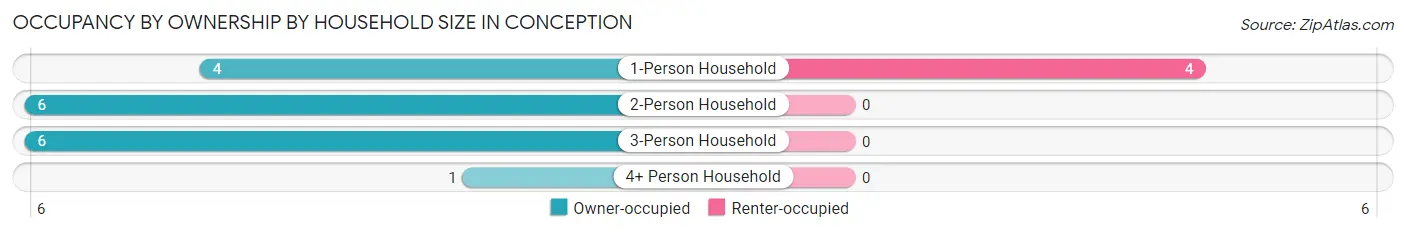
| Household Size | Owner-occupied | Renter-occupied |
| 1-Person Household | 4 (50.0%) | 4 (50.0%) |
| 2-Person Household | 6 (100.0%) | 0 (0.0%) |
| 3-Person Household | 6 (100.0%) | 0 (0.0%) |
| 4+ Person Household | 1 (100.0%) | 0 (0.0%) |
| Total Housing Units | 17 (80.9%) | 4 (19.1%) |
Occupancy by Educational Attainment in Conception
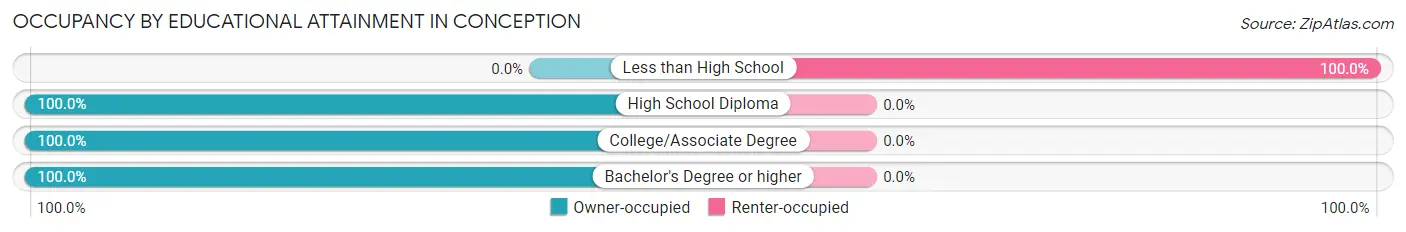
| Household Size | Owner-occupied | Renter-occupied |
| Less than High School | 0 (0.0%) | 4 (100.0%) |
| High School Diploma | 4 (100.0%) | 0 (0.0%) |
| College/Associate Degree | 12 (100.0%) | 0 (0.0%) |
| Bachelor's Degree or higher | 1 (100.0%) | 0 (0.0%) |
Occupancy by Age of Householder in Conception
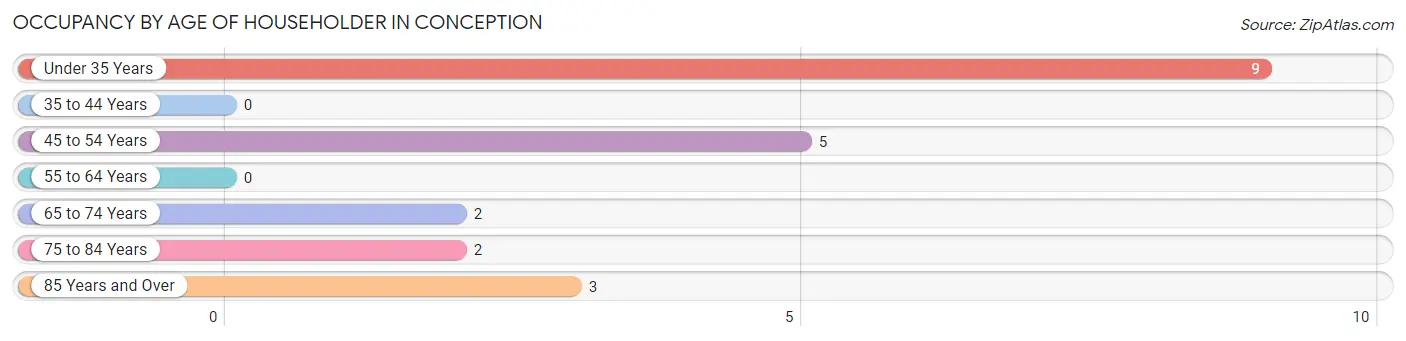
| Age Bracket | # Households | % Households |
| Under 35 Years | 9 | 42.9% |
| 35 to 44 Years | 0 | 0.0% |
| 45 to 54 Years | 5 | 23.8% |
| 55 to 64 Years | 0 | 0.0% |
| 65 to 74 Years | 2 | 9.5% |
| 75 to 84 Years | 2 | 9.5% |
| 85 Years and Over | 3 | 14.3% |
| Total | 21 | 100.0% |
Housing Finances in Conception
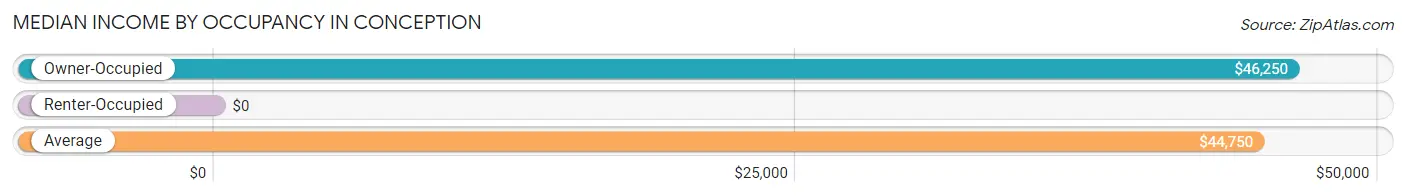
Median Income by Occupancy in Conception
| Occupancy Type | # Households | Median Income |
| Owner-Occupied | 17 (80.9%) | $46,250 |
| Renter-Occupied | 4 (19.1%) | $0 |
| Average | 21 (100.0%) | $44,750 |
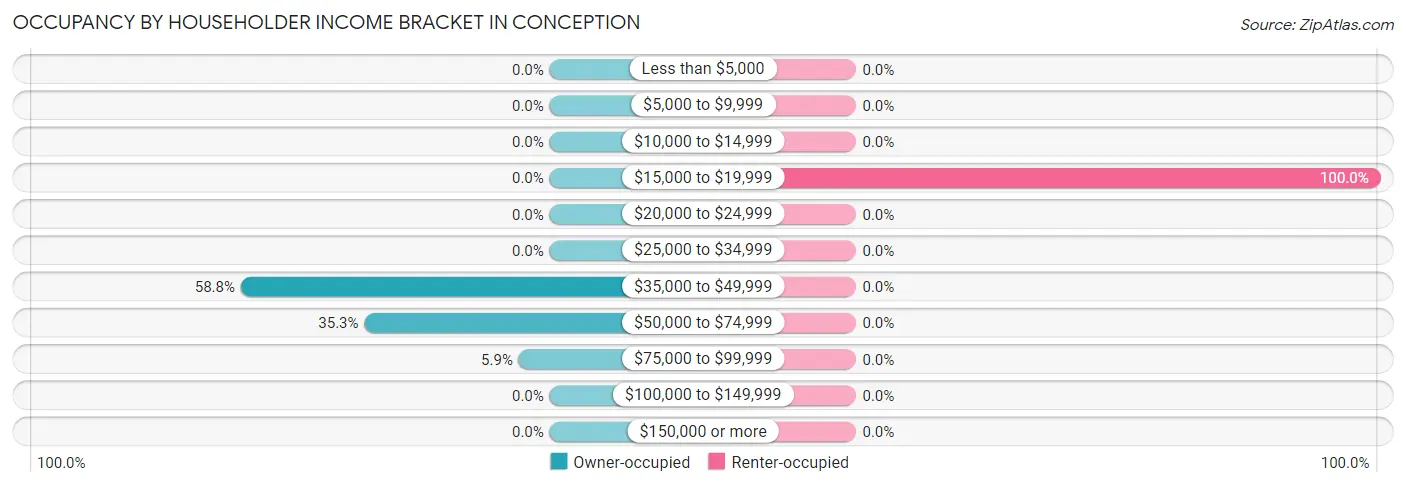
Occupancy by Householder Income Bracket in Conception
| Income Bracket | Owner-occupied | Renter-occupied |
| Less than $5,000 | 0 (0.0%) | 0 (0.0%) |
| $5,000 to $9,999 | 0 (0.0%) | 0 (0.0%) |
| $10,000 to $14,999 | 0 (0.0%) | 0 (0.0%) |
| $15,000 to $19,999 | 0 (0.0%) | 4 (100.0%) |
| $20,000 to $24,999 | 0 (0.0%) | 0 (0.0%) |
| $25,000 to $34,999 | 0 (0.0%) | 0 (0.0%) |
| $35,000 to $49,999 | 10 (58.8%) | 0 (0.0%) |
| $50,000 to $74,999 | 6 (35.3%) | 0 (0.0%) |
| $75,000 to $99,999 | 1 (5.9%) | 0 (0.0%) |
| $100,000 to $149,999 | 0 (0.0%) | 0 (0.0%) |
| $150,000 or more | 0 (0.0%) | 0 (0.0%) |
| Total | 17 (100.0%) | 4 (100.0%) |
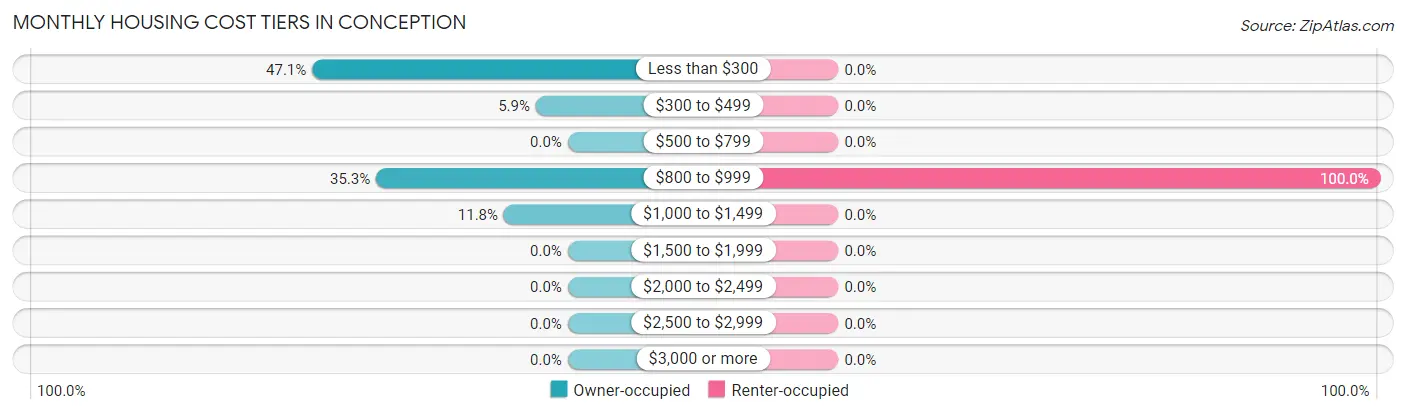
Monthly Housing Cost Tiers in Conception
| Monthly Cost | Owner-occupied | Renter-occupied |
| Less than $300 | 8 (47.1%) | 0 (0.0%) |
| $300 to $499 | 1 (5.9%) | 0 (0.0%) |
| $500 to $799 | 0 (0.0%) | 0 (0.0%) |
| $800 to $999 | 6 (35.3%) | 4 (100.0%) |
| $1,000 to $1,499 | 2 (11.8%) | 0 (0.0%) |
| $1,500 to $1,999 | 0 (0.0%) | 0 (0.0%) |
| $2,000 to $2,499 | 0 (0.0%) | 0 (0.0%) |
| $2,500 to $2,999 | 0 (0.0%) | 0 (0.0%) |
| $3,000 or more | 0 (0.0%) | 0 (0.0%) |
| Total | 17 (100.0%) | 4 (100.0%) |
Physical Housing Characteristics in Conception
Housing Structures in Conception
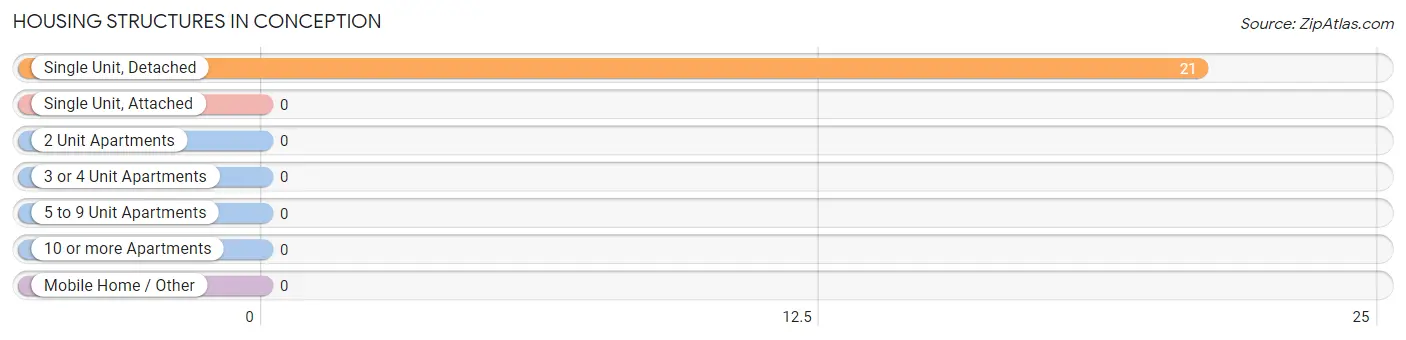
| Structure Type | # Housing Units | % Housing Units |
| Single Unit, Detached | 21 | 100.0% |
| Single Unit, Attached | 0 | 0.0% |
| 2 Unit Apartments | 0 | 0.0% |
| 3 or 4 Unit Apartments | 0 | 0.0% |
| 5 to 9 Unit Apartments | 0 | 0.0% |
| 10 or more Apartments | 0 | 0.0% |
| Mobile Home / Other | 0 | 0.0% |
| Total | 21 | 100.0% |
Housing Structures by Occupancy in Conception
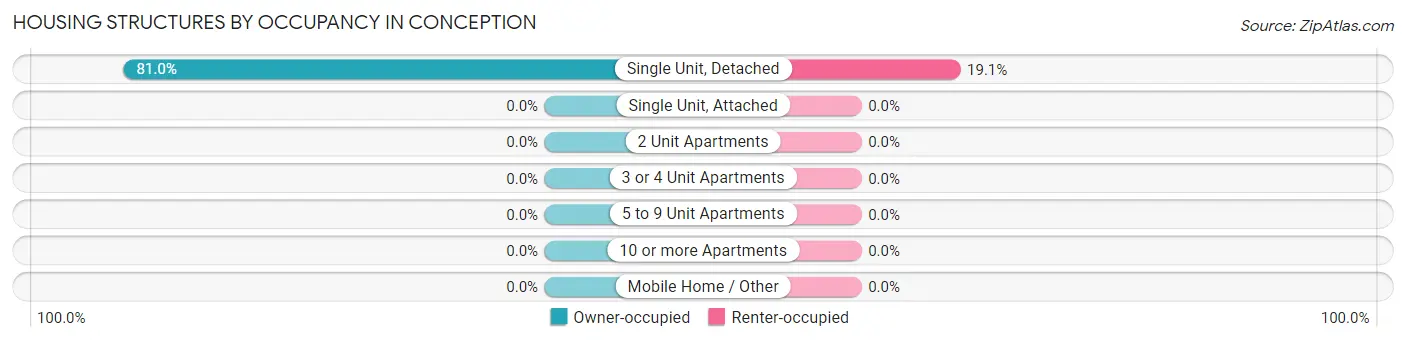
| Structure Type | Owner-occupied | Renter-occupied |
| Single Unit, Detached | 17 (80.9%) | 4 (19.1%) |
| Single Unit, Attached | 0 (0.0%) | 0 (0.0%) |
| 2 Unit Apartments | 0 (0.0%) | 0 (0.0%) |
| 3 or 4 Unit Apartments | 0 (0.0%) | 0 (0.0%) |
| 5 to 9 Unit Apartments | 0 (0.0%) | 0 (0.0%) |
| 10 or more Apartments | 0 (0.0%) | 0 (0.0%) |
| Mobile Home / Other | 0 (0.0%) | 0 (0.0%) |
| Total | 17 (80.9%) | 4 (19.1%) |
Housing Structures by Number of Rooms in Conception
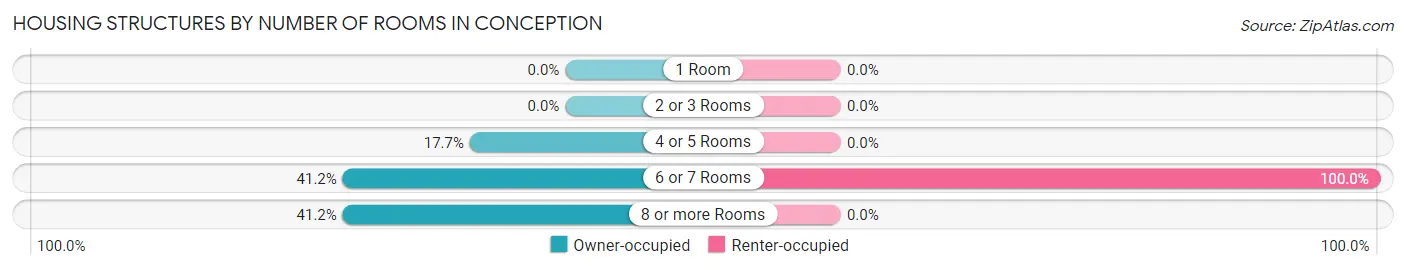
| Number of Rooms | Owner-occupied | Renter-occupied |
| 1 Room | 0 (0.0%) | 0 (0.0%) |
| 2 or 3 Rooms | 0 (0.0%) | 0 (0.0%) |
| 4 or 5 Rooms | 3 (17.6%) | 0 (0.0%) |
| 6 or 7 Rooms | 7 (41.2%) | 4 (100.0%) |
| 8 or more Rooms | 7 (41.2%) | 0 (0.0%) |
| Total | 17 (100.0%) | 4 (100.0%) |
Housing Structure by Heating Type in Conception
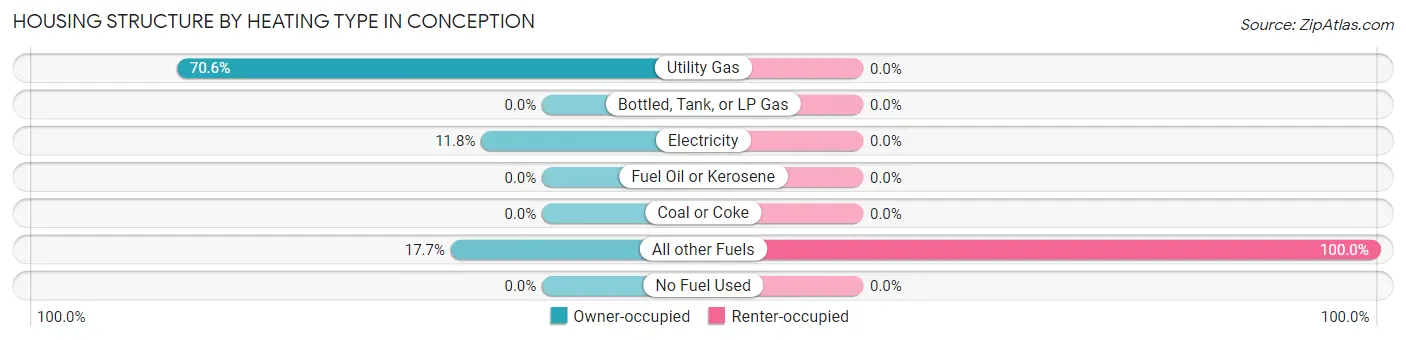
| Heating Type | Owner-occupied | Renter-occupied |
| Utility Gas | 12 (70.6%) | 0 (0.0%) |
| Bottled, Tank, or LP Gas | 0 (0.0%) | 0 (0.0%) |
| Electricity | 2 (11.8%) | 0 (0.0%) |
| Fuel Oil or Kerosene | 0 (0.0%) | 0 (0.0%) |
| Coal or Coke | 0 (0.0%) | 0 (0.0%) |
| All other Fuels | 3 (17.6%) | 4 (100.0%) |
| No Fuel Used | 0 (0.0%) | 0 (0.0%) |
| Total | 17 (100.0%) | 4 (100.0%) |
Household Vehicle Usage in Conception
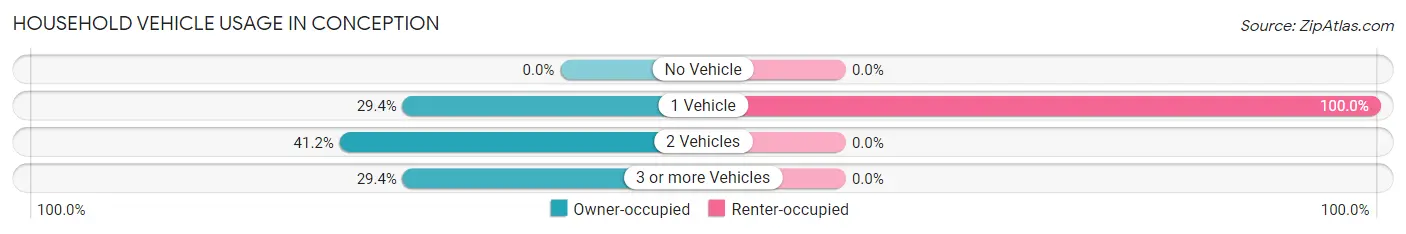
| Vehicles per Household | Owner-occupied | Renter-occupied |
| No Vehicle | 0 (0.0%) | 0 (0.0%) |
| 1 Vehicle | 5 (29.4%) | 4 (100.0%) |
| 2 Vehicles | 7 (41.2%) | 0 (0.0%) |
| 3 or more Vehicles | 5 (29.4%) | 0 (0.0%) |
| Total | 17 (100.0%) | 4 (100.0%) |
Real Estate & Mortgages in Conception
Real Estate and Mortgage Overview in Conception
| Characteristic | Without Mortgage | With Mortgage |
| Housing Units | 10 | 7 |
| Median Property Value | $45,000 | $114,600 |
| Median Household Income | $52,500 | $0 |
| Monthly Housing Costs | $233 | $0 |
| Real Estate Taxes | $450 | $0 |
Property Value by Mortgage Status in Conception
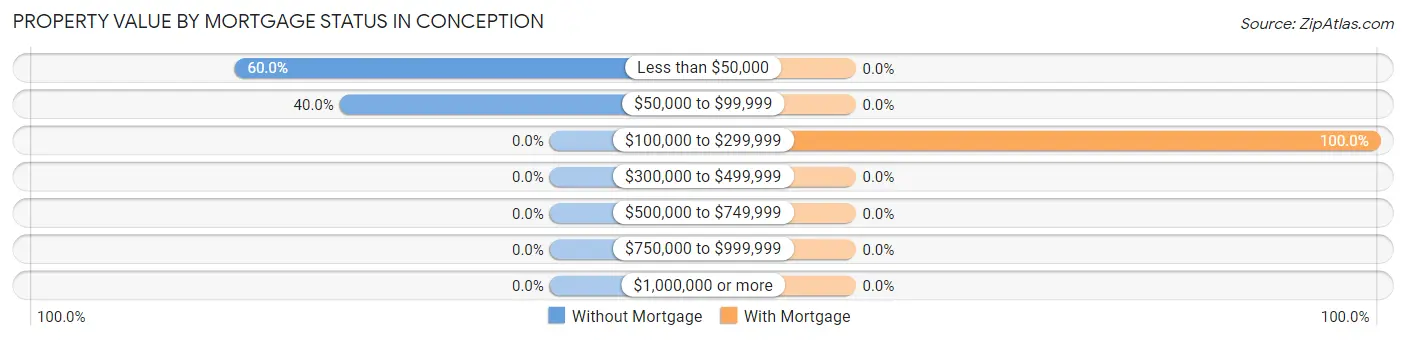
| Property Value | Without Mortgage | With Mortgage |
| Less than $50,000 | 6 (60.0%) | 0 (0.0%) |
| $50,000 to $99,999 | 4 (40.0%) | 0 (0.0%) |
| $100,000 to $299,999 | 0 (0.0%) | 7 (100.0%) |
| $300,000 to $499,999 | 0 (0.0%) | 0 (0.0%) |
| $500,000 to $749,999 | 0 (0.0%) | 0 (0.0%) |
| $750,000 to $999,999 | 0 (0.0%) | 0 (0.0%) |
| $1,000,000 or more | 0 (0.0%) | 0 (0.0%) |
| Total | 10 (100.0%) | 7 (100.0%) |
Household Income by Mortgage Status in Conception
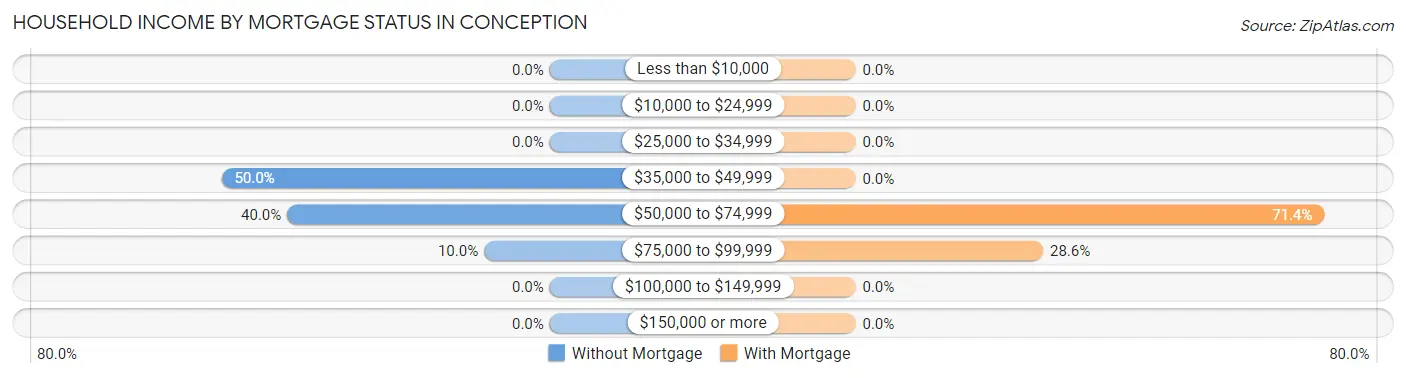
| Household Income | Without Mortgage | With Mortgage |
| Less than $10,000 | 0 (0.0%) | 0 (0.0%) |
| $10,000 to $24,999 | 0 (0.0%) | 0 (0.0%) |
| $25,000 to $34,999 | 0 (0.0%) | 0 (0.0%) |
| $35,000 to $49,999 | 5 (50.0%) | 0 (0.0%) |
| $50,000 to $74,999 | 4 (40.0%) | 5 (71.4%) |
| $75,000 to $99,999 | 1 (10.0%) | 2 (28.6%) |
| $100,000 to $149,999 | 0 (0.0%) | 0 (0.0%) |
| $150,000 or more | 0 (0.0%) | 0 (0.0%) |
| Total | 10 (100.0%) | 7 (100.0%) |
Property Value to Household Income Ratio in Conception
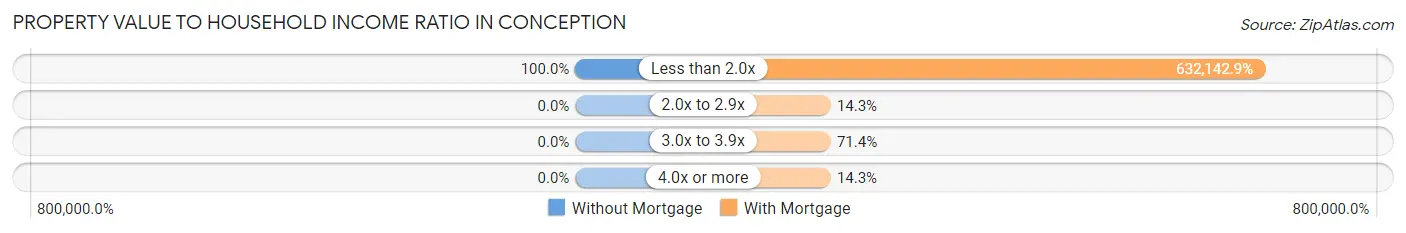
| Value-to-Income Ratio | Without Mortgage | With Mortgage |
| Less than 2.0x | 10 (100.0%) | 44,250 (632,142.9%) |
| 2.0x to 2.9x | 0 (0.0%) | 1 (14.3%) |
| 3.0x to 3.9x | 0 (0.0%) | 5 (71.4%) |
| 4.0x or more | 0 (0.0%) | 1 (14.3%) |
| Total | 10 (100.0%) | 7 (100.0%) |
Real Estate Taxes by Mortgage Status in Conception
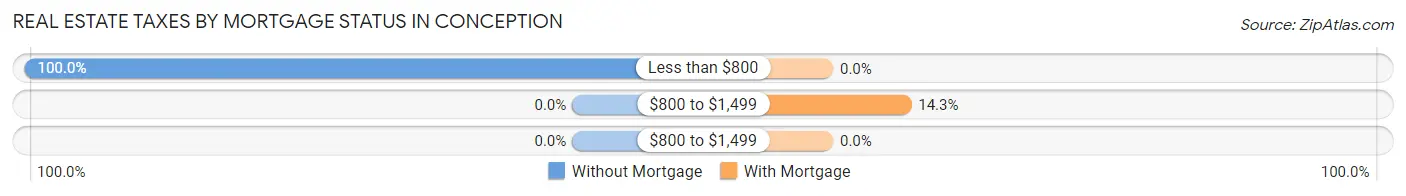
| Property Taxes | Without Mortgage | With Mortgage |
| Less than $800 | 10 (100.0%) | 0 (0.0%) |
| $800 to $1,499 | 0 (0.0%) | 1 (14.3%) |
| $800 to $1,499 | 0 (0.0%) | 0 (0.0%) |
| Total | 10 (100.0%) | 7 (100.0%) |
Health & Disability in Conception
Health Insurance Coverage by Age in Conception
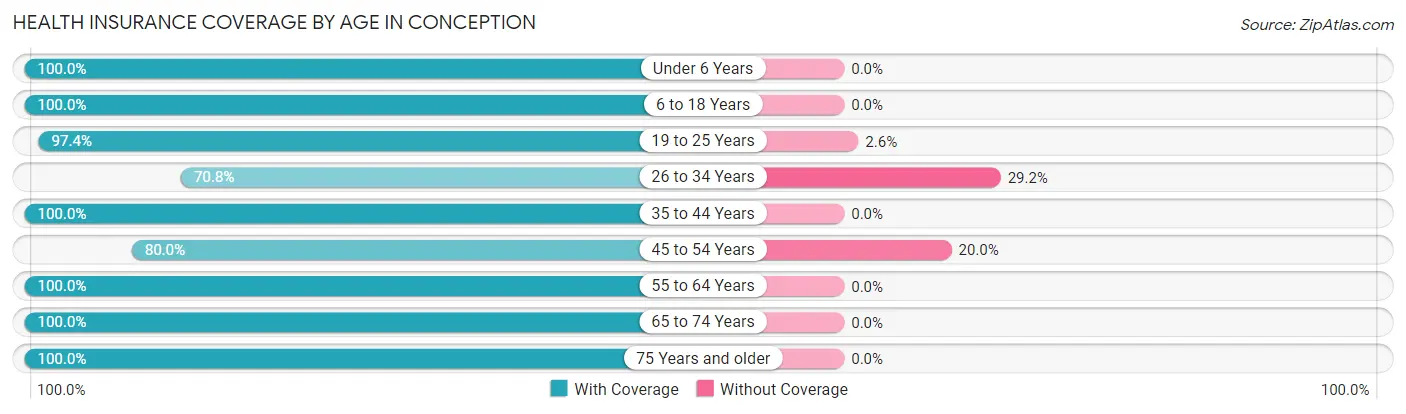
| Age Bracket | With Coverage | Without Coverage |
| Under 6 Years | 5 (100.0%) | 0 (0.0%) |
| 6 to 18 Years | 66 (100.0%) | 0 (0.0%) |
| 19 to 25 Years | 74 (97.4%) | 2 (2.6%) |
| 26 to 34 Years | 17 (70.8%) | 7 (29.2%) |
| 35 to 44 Years | 29 (100.0%) | 0 (0.0%) |
| 45 to 54 Years | 16 (80.0%) | 4 (20.0%) |
| 55 to 64 Years | 7 (100.0%) | 0 (0.0%) |
| 65 to 74 Years | 15 (100.0%) | 0 (0.0%) |
| 75 Years and older | 24 (100.0%) | 0 (0.0%) |
| Total | 253 (95.1%) | 13 (4.9%) |
Health Insurance Coverage by Citizenship Status in Conception
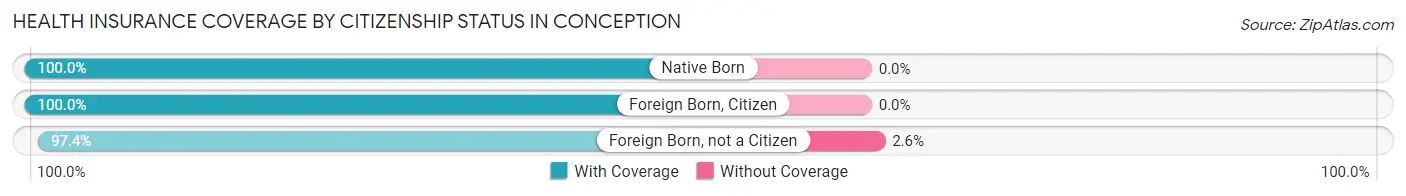
| Citizenship Status | With Coverage | Without Coverage |
| Native Born | 5 (100.0%) | 0 (0.0%) |
| Foreign Born, Citizen | 66 (100.0%) | 0 (0.0%) |
| Foreign Born, not a Citizen | 74 (97.4%) | 2 (2.6%) |
Health Insurance Coverage by Household Income in Conception
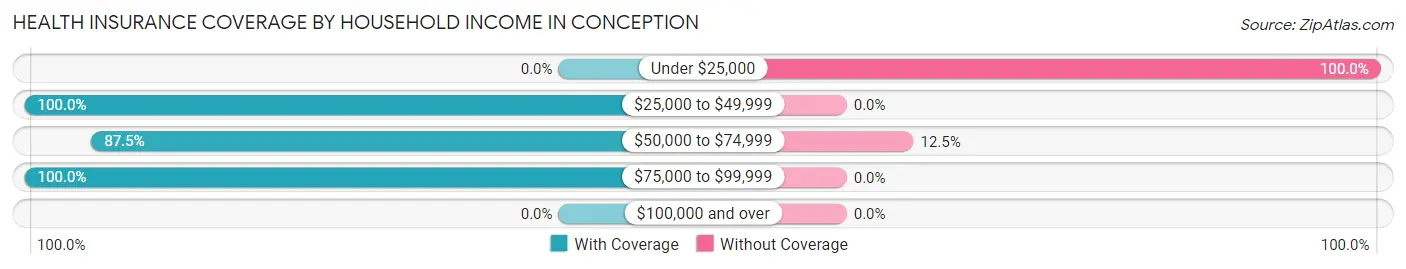
| Household Income | With Coverage | Without Coverage |
| Under $25,000 | 0 (0.0%) | 4 (100.0%) |
| $25,000 to $49,999 | 20 (100.0%) | 0 (0.0%) |
| $50,000 to $74,999 | 14 (87.5%) | 2 (12.5%) |
| $75,000 to $99,999 | 3 (100.0%) | 0 (0.0%) |
| $100,000 and over | 0 (0.0%) | 0 (0.0%) |
Public vs Private Health Insurance Coverage by Age in Conception
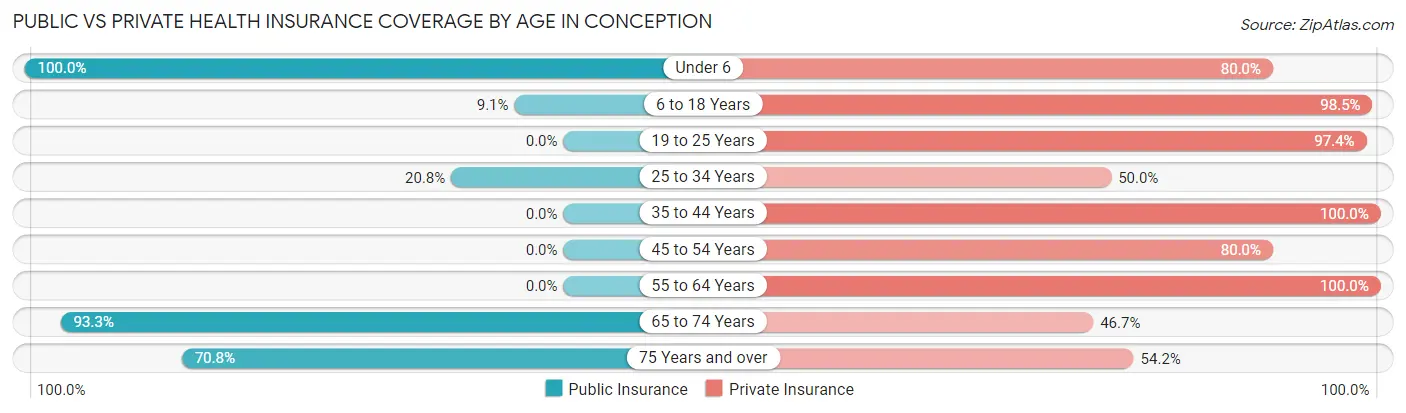
| Age Bracket | Public Insurance | Private Insurance |
| Under 6 | 5 (100.0%) | 4 (80.0%) |
| 6 to 18 Years | 6 (9.1%) | 65 (98.5%) |
| 19 to 25 Years | 0 (0.0%) | 74 (97.4%) |
| 25 to 34 Years | 5 (20.8%) | 12 (50.0%) |
| 35 to 44 Years | 0 (0.0%) | 29 (100.0%) |
| 45 to 54 Years | 0 (0.0%) | 16 (80.0%) |
| 55 to 64 Years | 0 (0.0%) | 7 (100.0%) |
| 65 to 74 Years | 14 (93.3%) | 7 (46.7%) |
| 75 Years and over | 17 (70.8%) | 13 (54.2%) |
| Total | 47 (17.7%) | 227 (85.3%) |
Disability Status by Sex by Age in Conception
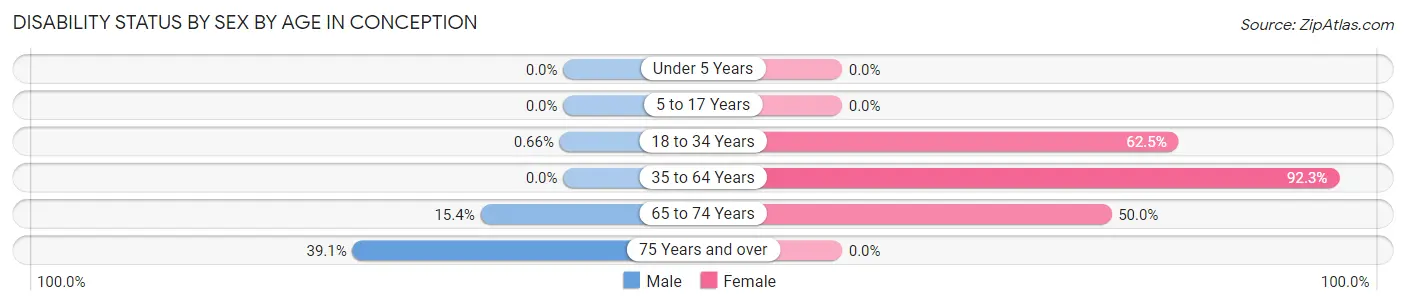
| Age Bracket | Male | Female |
| Under 5 Years | 0 (0.0%) | 0 (0.0%) |
| 5 to 17 Years | 0 (0.0%) | 0 (0.0%) |
| 18 to 34 Years | 1 (0.7%) | 5 (62.5%) |
| 35 to 64 Years | 0 (0.0%) | 12 (92.3%) |
| 65 to 74 Years | 2 (15.4%) | 1 (50.0%) |
| 75 Years and over | 9 (39.1%) | 0 (0.0%) |
Disability Class by Sex by Age in Conception
Disability Class: Hearing Difficulty
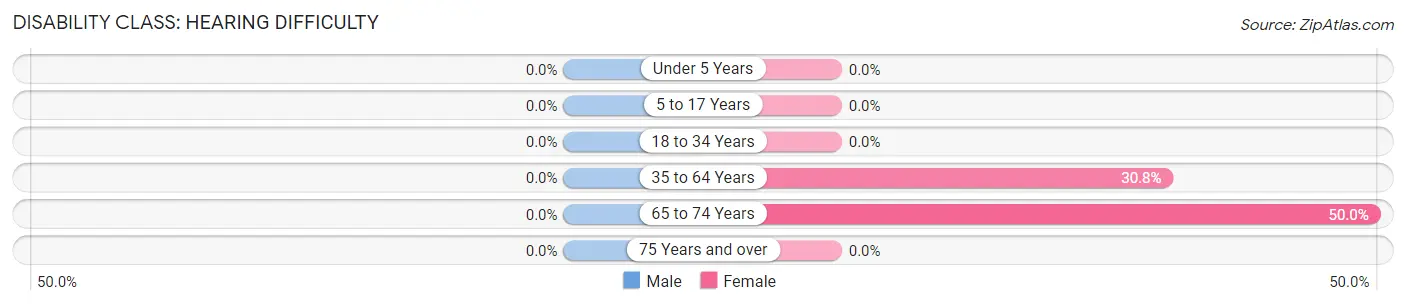
| Age Bracket | Male | Female |
| Under 5 Years | 0 (0.0%) | 0 (0.0%) |
| 5 to 17 Years | 0 (0.0%) | 0 (0.0%) |
| 18 to 34 Years | 0 (0.0%) | 0 (0.0%) |
| 35 to 64 Years | 0 (0.0%) | 4 (30.8%) |
| 65 to 74 Years | 0 (0.0%) | 1 (50.0%) |
| 75 Years and over | 0 (0.0%) | 0 (0.0%) |
Disability Class: Vision Difficulty
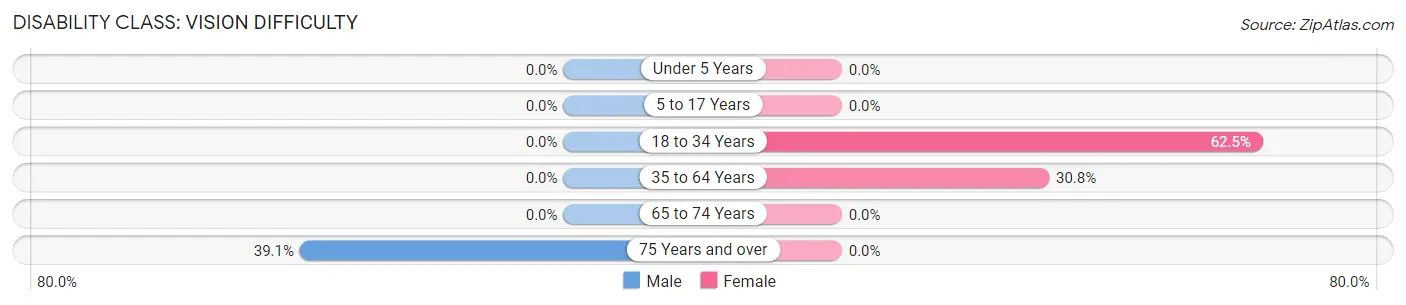
| Age Bracket | Male | Female |
| Under 5 Years | 0 (0.0%) | 0 (0.0%) |
| 5 to 17 Years | 0 (0.0%) | 0 (0.0%) |
| 18 to 34 Years | 0 (0.0%) | 5 (62.5%) |
| 35 to 64 Years | 0 (0.0%) | 4 (30.8%) |
| 65 to 74 Years | 0 (0.0%) | 0 (0.0%) |
| 75 Years and over | 9 (39.1%) | 0 (0.0%) |
Disability Class: Cognitive Difficulty
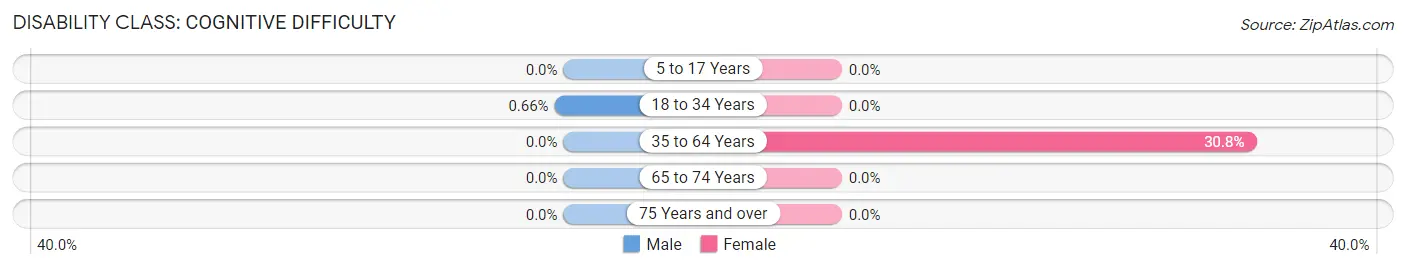
| Age Bracket | Male | Female |
| 5 to 17 Years | 0 (0.0%) | 0 (0.0%) |
| 18 to 34 Years | 1 (0.7%) | 0 (0.0%) |
| 35 to 64 Years | 0 (0.0%) | 4 (30.8%) |
| 65 to 74 Years | 0 (0.0%) | 0 (0.0%) |
| 75 Years and over | 0 (0.0%) | 0 (0.0%) |
Disability Class: Ambulatory Difficulty
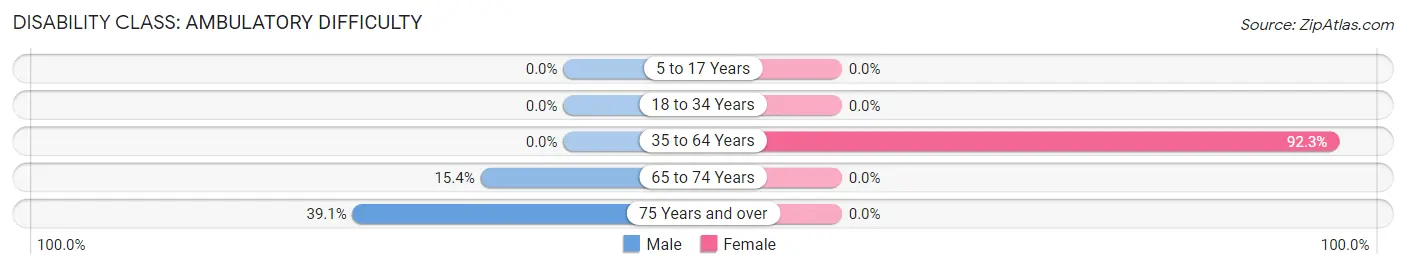
| Age Bracket | Male | Female |
| 5 to 17 Years | 0 (0.0%) | 0 (0.0%) |
| 18 to 34 Years | 0 (0.0%) | 0 (0.0%) |
| 35 to 64 Years | 0 (0.0%) | 12 (92.3%) |
| 65 to 74 Years | 2 (15.4%) | 0 (0.0%) |
| 75 Years and over | 9 (39.1%) | 0 (0.0%) |
Disability Class: Self-Care Difficulty
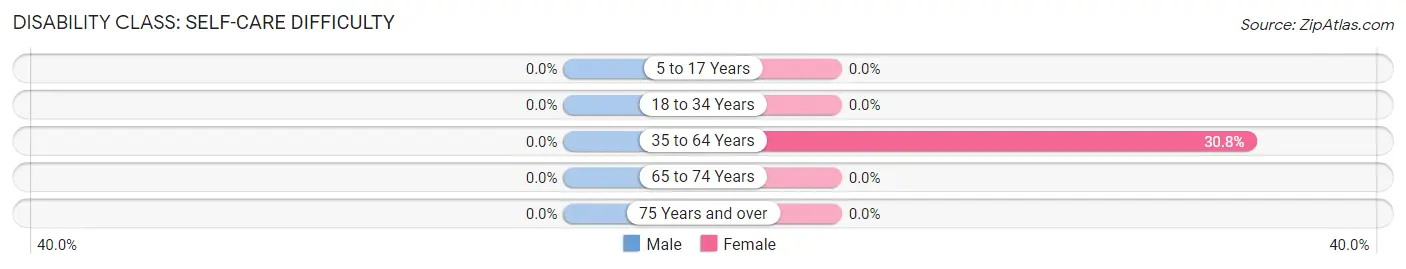
| Age Bracket | Male | Female |
| 5 to 17 Years | 0 (0.0%) | 0 (0.0%) |
| 18 to 34 Years | 0 (0.0%) | 0 (0.0%) |
| 35 to 64 Years | 0 (0.0%) | 4 (30.8%) |
| 65 to 74 Years | 0 (0.0%) | 0 (0.0%) |
| 75 Years and over | 0 (0.0%) | 0 (0.0%) |
Technology Access in Conception
Computing Device Access in Conception
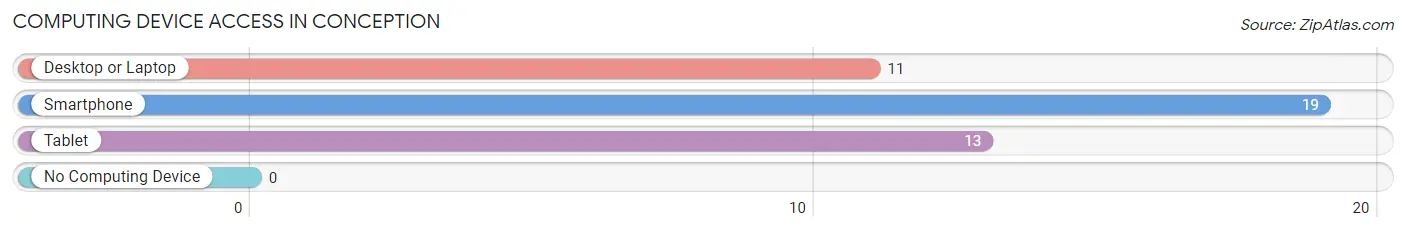
| Device Type | # Households | % Households |
| Desktop or Laptop | 11 | 52.4% |
| Smartphone | 19 | 90.5% |
| Tablet | 13 | 61.9% |
| No Computing Device | 0 | 0.0% |
| Total | 21 | 100.0% |
Internet Access in Conception
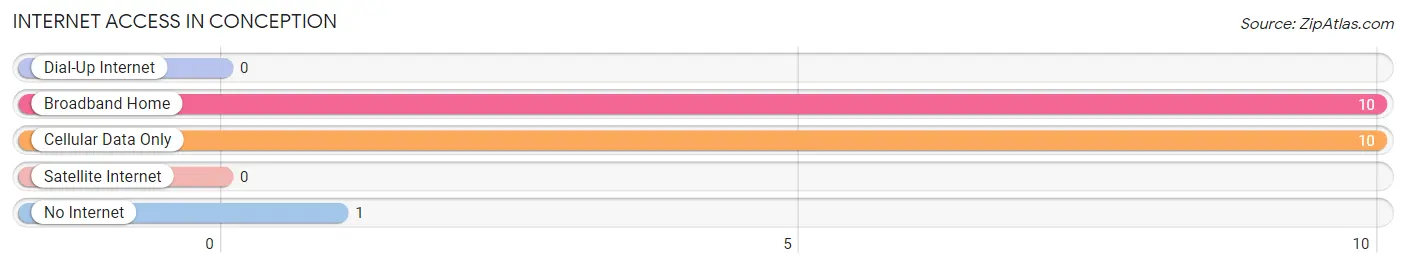
| Internet Type | # Households | % Households |
| Dial-Up Internet | 0 | 0.0% |
| Broadband Home | 10 | 47.6% |
| Cellular Data Only | 10 | 47.6% |
| Satellite Internet | 0 | 0.0% |
| No Internet | 1 | 4.8% |
| Total | 21 | 100.0% |
Conception Summary
Conception, Missouri is a small town located in Nodaway County in the northwest corner of the state. It is situated on the banks of the Nodaway River, and is home to a population of just over 500 people. The town was founded in 1845 by a group of German immigrants, and has since become a popular destination for tourists and outdoor enthusiasts.
Geography
Conception is located in the northwest corner of Missouri, approximately 30 miles south of Maryville and 40 miles north of St. Joseph. The town is situated on the banks of the Nodaway River, and is surrounded by rolling hills and farmland. The town is located in the Loess Hills region of the state, and is known for its picturesque views and lush vegetation.
The climate in Conception is typical of the Midwest, with hot summers and cold winters. The average temperature in the summer months is around 80 degrees Fahrenheit, while the average temperature in the winter months is around 30 degrees Fahrenheit. The town receives an average of 40 inches of precipitation each year, with most of it falling in the spring and summer months.
Economy
The economy of Conception is largely based on agriculture and tourism. The town is home to several small farms, which produce a variety of crops including corn, soybeans, and wheat. The town is also home to several small businesses, including a grocery store, a hardware store, and a restaurant.
Tourism is an important part of the local economy, as the town is a popular destination for outdoor enthusiasts. The town is home to several parks and trails, as well as a variety of outdoor activities such as fishing, hunting, and camping. The town also hosts several annual events, including a Fourth of July celebration and a Christmas parade.
Demographics
As of the 2010 census, the population of Conception was 514 people. The racial makeup of the town was 97.3% White, 0.6% African American, 0.2% Native American, 0.2% Asian, 0.4% from other races, and 1.3% from two or more races. Hispanic or Latino of any race were 1.2% of the population.
The median household income in Conception was $37,500, and the median family income was $45,000. The per capita income for the town was $18,000. About 11.3% of families and 14.2% of the population were below the poverty line, including 18.2% of those under age 18 and 8.3% of those age 65 or over.
Conclusion
Conception, Missouri is a small town located in Nodaway County in the northwest corner of the state. It is situated on the banks of the Nodaway River, and is home to a population of just over 500 people. The town was founded in 1845 by a group of German immigrants, and has since become a popular destination for tourists and outdoor enthusiasts. The economy of Conception is largely based on agriculture and tourism, and the town is home to several small businesses and farms. The town is also home to several parks and trails, as well as a variety of outdoor activities. The population of Conception is 97.3% White, and the median household income is $37,500.
Common Questions
What is Per Capita Income in Conception?
Per Capita income in Conception is $11,339.
What is the Median Family Income in Conception?
Median Family Income in Conception is $45,833.
What is the Median Household income in Conception?
Median Household Income in Conception is $44,750.
What is Inequality or Gini Index in Conception?
Inequality or Gini Index in Conception is 0.23.
What is the Total Population of Conception?
Total Population of Conception is 266.
What is the Total Male Population of Conception?
Total Male Population of Conception is 238.
What is the Total Female Population of Conception?
Total Female Population of Conception is 28.
What is the Ratio of Males per 100 Females in Conception?
There are 850.00 Males per 100 Females in Conception.
What is the Ratio of Females per 100 Males in Conception?
There are 11.76 Females per 100 Males in Conception.
What is the Median Population Age in Conception?
Median Population Age in Conception is 21.9 Years.
What is the Average Family Size in Conception
Average Family Size in Conception is 2.7 People.
What is the Average Household Size in Conception
Average Household Size in Conception is 2.0 People.
How Large is the Labor Force in Conception?
There are 87 People in the Labor Forcein in Conception.
What is the Percentage of People in the Labor Force in Conception?
34.1% of People are in the Labor Force in Conception.