Carlton Landing, OK Map & Demographics
Carlton Landing Map
Carlton Landing Overview
$67,205
PER CAPITA INCOME
$156,875
AVG HOUSEHOLD INCOME
0.33
INEQUALITY / GINI INDEX
43
TOTAL POPULATION
22
MALE POPULATION
21
FEMALE POPULATION
104.76
MALES / 100 FEMALES
95.45
FEMALES / 100 MALES
54.2
MEDIAN AGE
3.4
AVG FAMILY SIZE
2.5
AVG HOUSEHOLD SIZE
19
LABOR FORCE [ PEOPLE ]
61.3%
PERCENT IN LABOR FORCE
Carlton Landing Area Codes
Income in Carlton Landing
Income Overview in Carlton Landing
| Characteristic | Number | Measure |
| Per Capita Income | 43 | $67,205 |
| Median Family Income | 10 | $0 |
| Mean Family Income | 10 | $185,830 |
| Median Household Income | 17 | $156,875 |
| Mean Household Income | 17 | $168,900 |
| Income Deficit | 10 | $0 |
| Wage / Income Gap (%) | 43 | 0.00% |
| Wage / Income Gap ($) | 43 | 100.00¢ per $1 |
| Gini / Inequality Index | 43 | 0.33 |
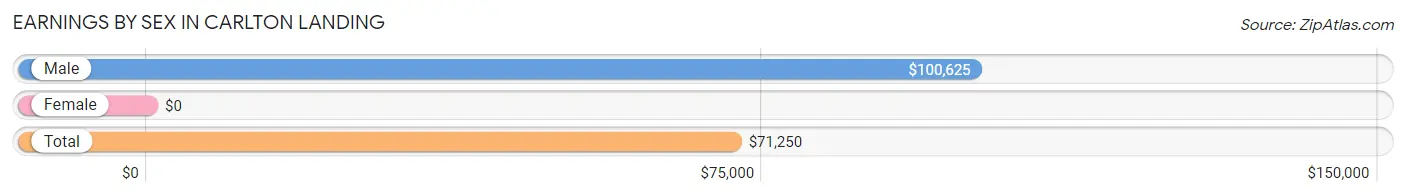
Earnings by Sex in Carlton Landing
| Sex | Number | Average Earnings |
| Male | 13 (61.9%) | $100,625 |
| Female | 8 (38.1%) | $0 |
| Total | 21 (100.0%) | $71,250 |
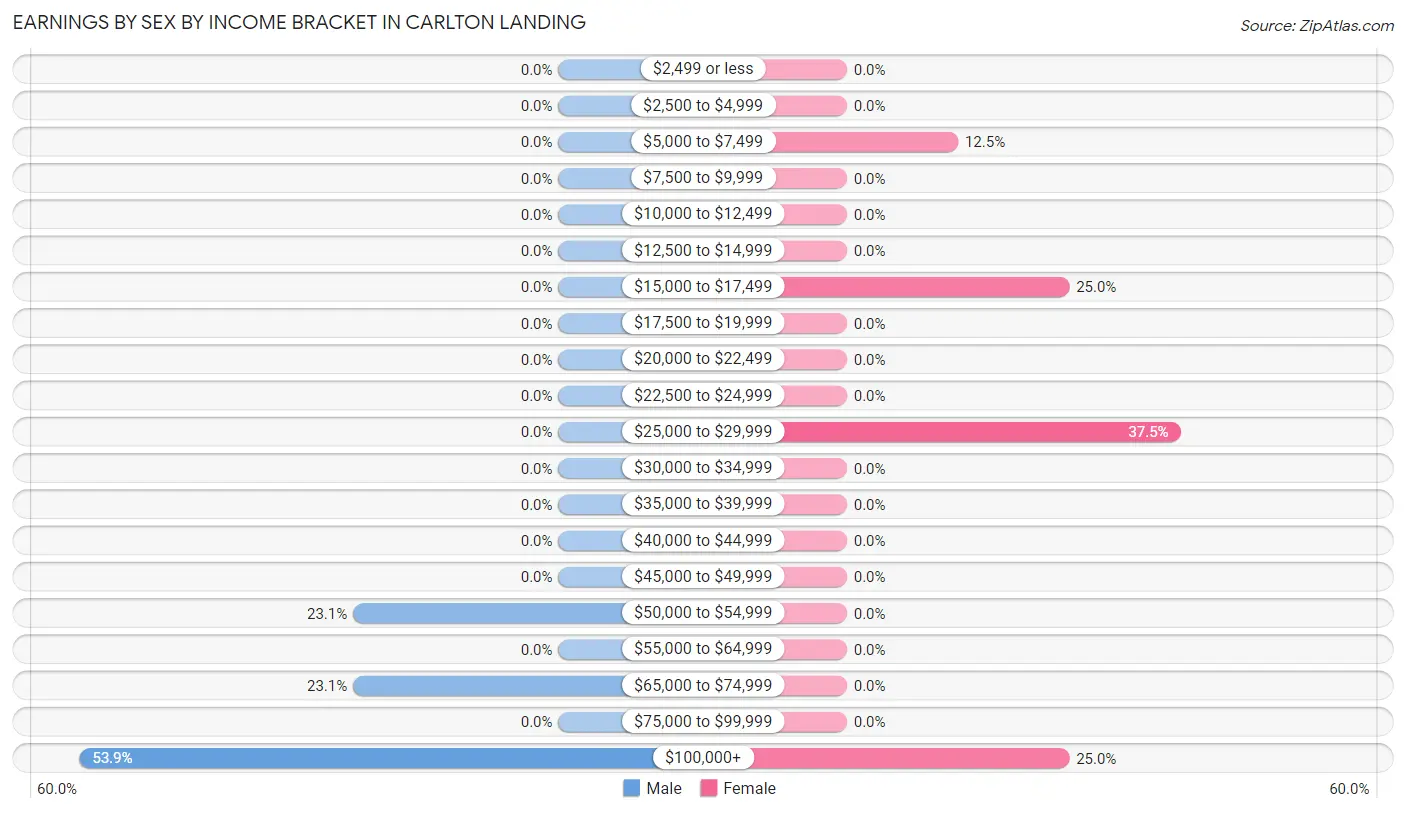
Earnings by Sex by Income Bracket in Carlton Landing
The most common earnings brackets in Carlton Landing are $100,000+ for men (7 | 53.8%) and $25,000 to $29,999 for women (3 | 37.5%).
| Income | Male | Female |
| $2,499 or less | 0 (0.0%) | 0 (0.0%) |
| $2,500 to $4,999 | 0 (0.0%) | 0 (0.0%) |
| $5,000 to $7,499 | 0 (0.0%) | 1 (12.5%) |
| $7,500 to $9,999 | 0 (0.0%) | 0 (0.0%) |
| $10,000 to $12,499 | 0 (0.0%) | 0 (0.0%) |
| $12,500 to $14,999 | 0 (0.0%) | 0 (0.0%) |
| $15,000 to $17,499 | 0 (0.0%) | 2 (25.0%) |
| $17,500 to $19,999 | 0 (0.0%) | 0 (0.0%) |
| $20,000 to $22,499 | 0 (0.0%) | 0 (0.0%) |
| $22,500 to $24,999 | 0 (0.0%) | 0 (0.0%) |
| $25,000 to $29,999 | 0 (0.0%) | 3 (37.5%) |
| $30,000 to $34,999 | 0 (0.0%) | 0 (0.0%) |
| $35,000 to $39,999 | 0 (0.0%) | 0 (0.0%) |
| $40,000 to $44,999 | 0 (0.0%) | 0 (0.0%) |
| $45,000 to $49,999 | 0 (0.0%) | 0 (0.0%) |
| $50,000 to $54,999 | 3 (23.1%) | 0 (0.0%) |
| $55,000 to $64,999 | 0 (0.0%) | 0 (0.0%) |
| $65,000 to $74,999 | 3 (23.1%) | 0 (0.0%) |
| $75,000 to $99,999 | 0 (0.0%) | 0 (0.0%) |
| $100,000+ | 7 (53.8%) | 2 (25.0%) |
| Total | 13 (100.0%) | 8 (100.0%) |
Earnings by Sex by Educational Attainment in Carlton Landing
| Educational Attainment | Male Income | Female Income |
| Less than High School | - | - |
| High School Diploma | - | - |
| College or Associate's Degree | - | - |
| Bachelor's Degree | - | - |
| Graduate Degree | - | - |
| Total | $100,625 | $0 |
Family Income in Carlton Landing
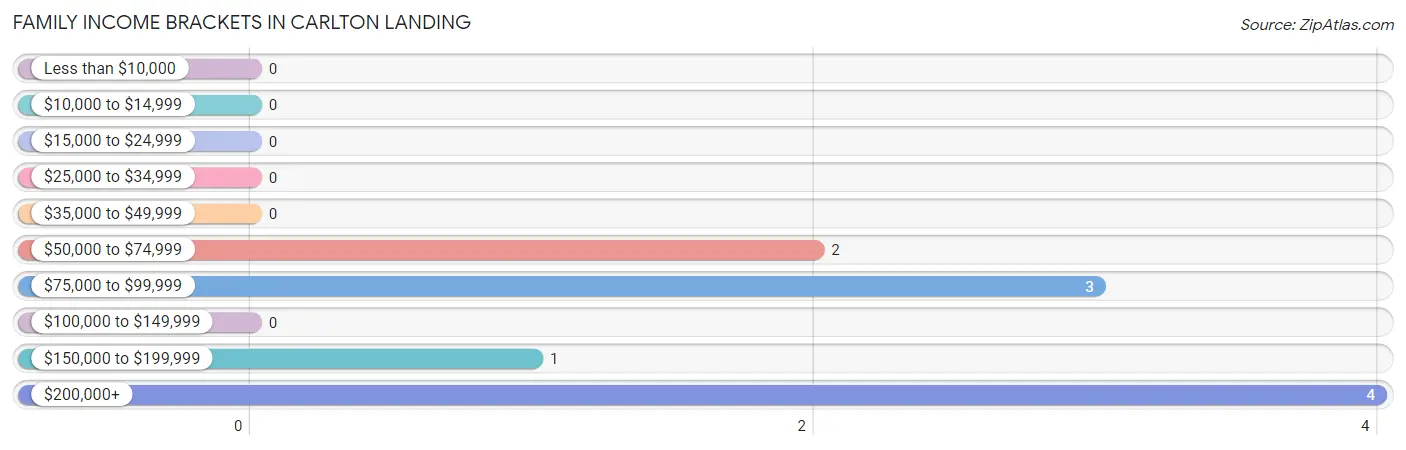
Family Income Brackets in Carlton Landing
According to the Carlton Landing family income data, there are 4 families falling into the $200,000+ income range, which is the most common income bracket and makes up 40.0% of all families.
| Income Bracket | # Families | % Families |
| Less than $10,000 | 0 | 0.0% |
| $10,000 to $14,999 | 0 | 0.0% |
| $15,000 to $24,999 | 0 | 0.0% |
| $25,000 to $34,999 | 0 | 0.0% |
| $35,000 to $49,999 | 0 | 0.0% |
| $50,000 to $74,999 | 2 | 20.0% |
| $75,000 to $99,999 | 3 | 30.0% |
| $100,000 to $149,999 | 0 | 0.0% |
| $150,000 to $199,999 | 1 | 10.0% |
| $200,000+ | 4 | 40.0% |
Family Income by Famaliy Size in Carlton Landing
| Income Bracket | # Families | Median Income |
| 2-Person Families | 4 (40.0%) | $0 |
| 3-Person Families | 2 (20.0%) | $0 |
| 4-Person Families | 1 (10.0%) | $0 |
| 5-Person Families | 3 (30.0%) | $0 |
| 6-Person Families | 0 (0.0%) | $0 |
| 7+ Person Families | 0 (0.0%) | $0 |
| Total | 10 (100.0%) | $0 |
Family Income by Number of Earners in Carlton Landing
| Number of Earners | # Families | Median Income |
| No Earners | 2 (20.0%) | $0 |
| 1 Earner | 0 (0.0%) | $0 |
| 2 Earners | 8 (80.0%) | $0 |
| 3+ Earners | 0 (0.0%) | $0 |
| Total | 10 (100.0%) | $0 |
Household Income in Carlton Landing
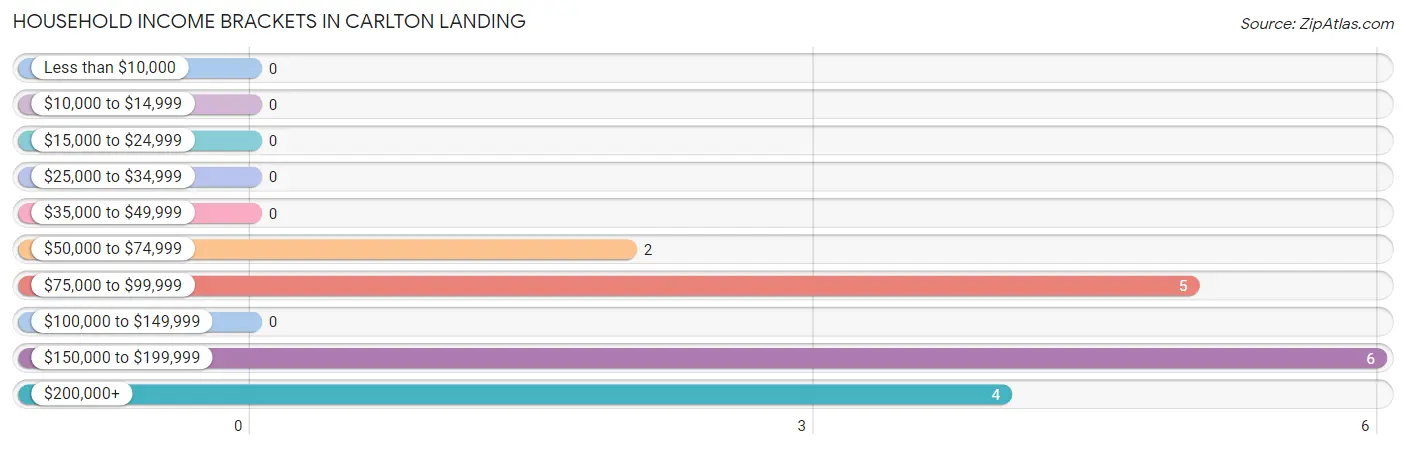
Household Income Brackets in Carlton Landing
With 6 households falling in the category, the $150,000 to $199,999 income range is the most frequent in Carlton Landing, accounting for 35.3% of all households.
| Income Bracket | # Households | % Households |
| Less than $10,000 | 0 | 0.0% |
| $10,000 to $14,999 | 0 | 0.0% |
| $15,000 to $24,999 | 0 | 0.0% |
| $25,000 to $34,999 | 0 | 0.0% |
| $35,000 to $49,999 | 0 | 0.0% |
| $50,000 to $74,999 | 2 | 11.8% |
| $75,000 to $99,999 | 5 | 29.4% |
| $100,000 to $149,999 | 0 | 0.0% |
| $150,000 to $199,999 | 6 | 35.3% |
| $200,000+ | 4 | 23.5% |
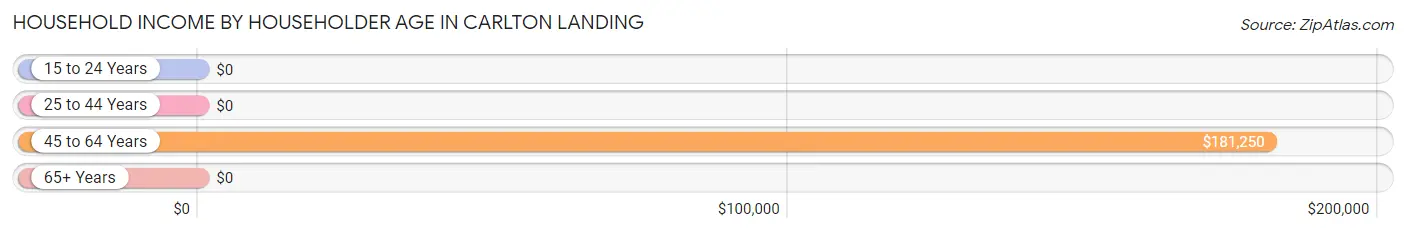
Household Income by Householder Age in Carlton Landing
The median household income in Carlton Landing is $156,875, with the highest median household income of $181,250 found in the 45 to 64 years age bracket for the primary householder. A total of 7 households (41.2%) fall into this category.
| Income Bracket | # Households | Median Income |
| 15 to 24 Years | 0 (0.0%) | $0 |
| 25 to 44 Years | 4 (23.5%) | $0 |
| 45 to 64 Years | 7 (41.2%) | $181,250 |
| 65+ Years | 6 (35.3%) | $0 |
| Total | 17 (100.0%) | $156,875 |
Poverty in Carlton Landing
Income Below Poverty by Sex and Age in Carlton Landing
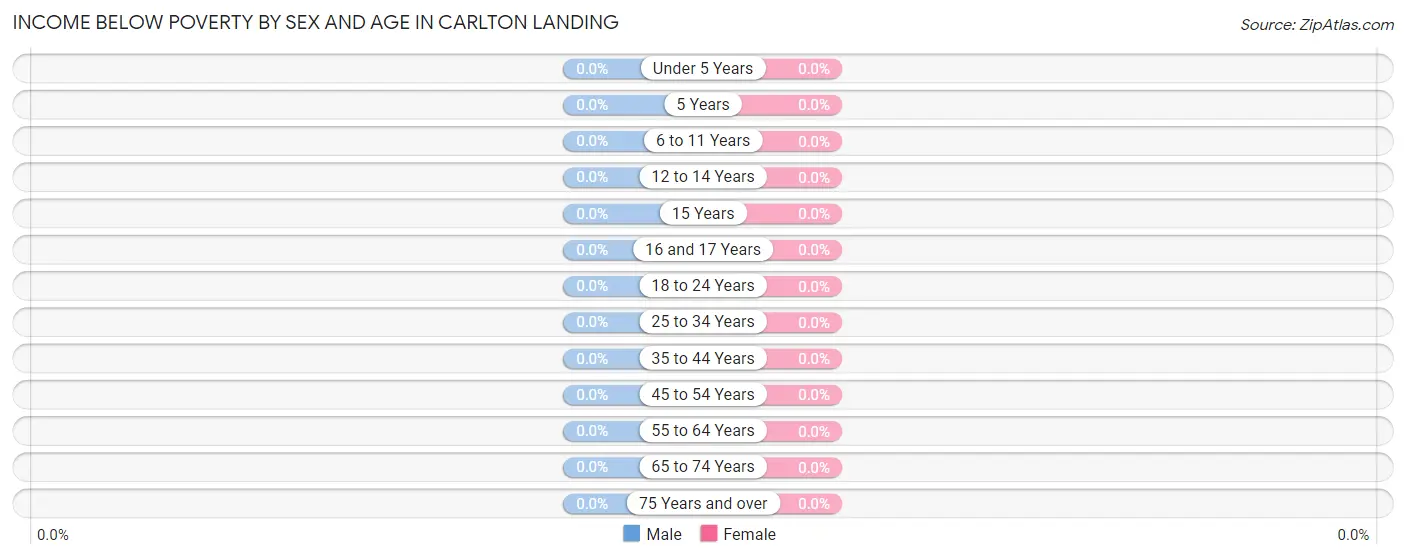
| Age Bracket | Male | Female |
| Under 5 Years | 0 (0.0%) | 0 (0.0%) |
| 5 Years | 0 (0.0%) | 0 (0.0%) |
| 6 to 11 Years | 0 (0.0%) | 0 (0.0%) |
| 12 to 14 Years | 0 (0.0%) | 0 (0.0%) |
| 15 Years | 0 (0.0%) | 0 (0.0%) |
| 16 and 17 Years | 0 (0.0%) | 0 (0.0%) |
| 18 to 24 Years | 0 (0.0%) | 0 (0.0%) |
| 25 to 34 Years | 0 (0.0%) | 0 (0.0%) |
| 35 to 44 Years | 0 (0.0%) | 0 (0.0%) |
| 45 to 54 Years | 0 (0.0%) | 0 (0.0%) |
| 55 to 64 Years | 0 (0.0%) | 0 (0.0%) |
| 65 to 74 Years | 0 (0.0%) | 0 (0.0%) |
| 75 Years and over | 0 (0.0%) | 0 (0.0%) |
| Total | 0 (0.0%) | 0 (0.0%) |
Income Above Poverty by Sex and Age in Carlton Landing
According to the poverty statistics in Carlton Landing, males aged 6 to 11 years and females aged 6 to 11 years are the age groups that are most secure financially, with 100.0% of males and 100.0% of females in these age groups living above the poverty line.
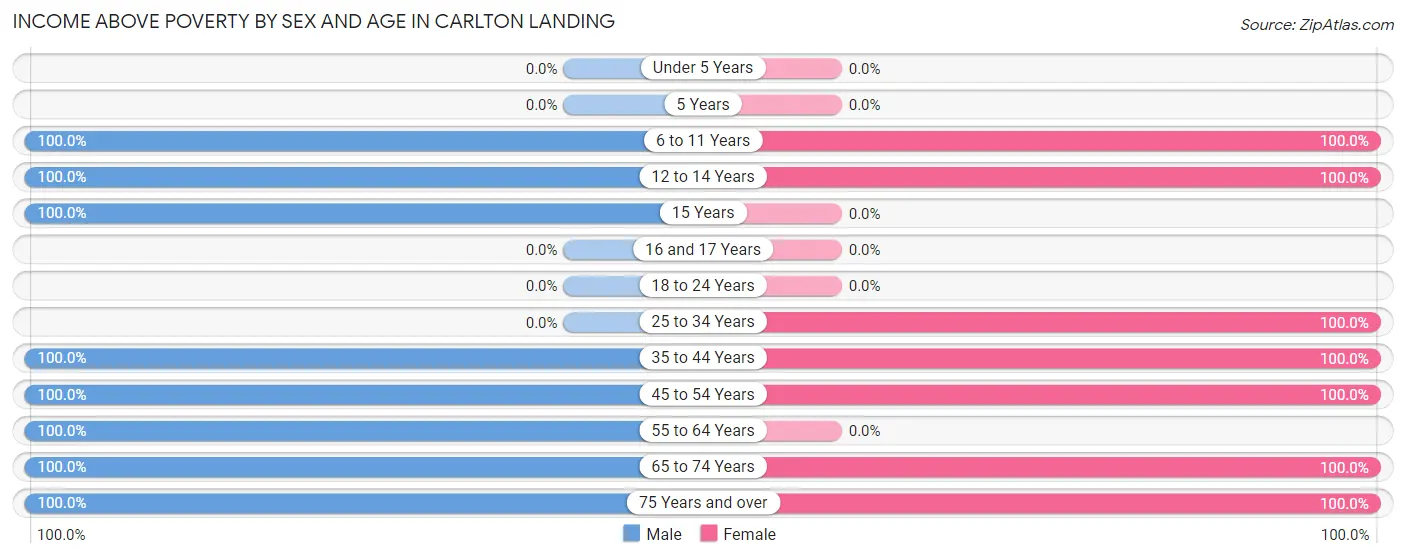
| Age Bracket | Male | Female |
| Under 5 Years | 0 (0.0%) | 0 (0.0%) |
| 5 Years | 0 (0.0%) | 0 (0.0%) |
| 6 to 11 Years | 3 (100.0%) | 2 (100.0%) |
| 12 to 14 Years | 1 (100.0%) | 3 (100.0%) |
| 15 Years | 3 (100.0%) | 0 (0.0%) |
| 16 and 17 Years | 0 (0.0%) | 0 (0.0%) |
| 18 to 24 Years | 0 (0.0%) | 0 (0.0%) |
| 25 to 34 Years | 0 (0.0%) | 2 (100.0%) |
| 35 to 44 Years | 1 (100.0%) | 4 (100.0%) |
| 45 to 54 Years | 3 (100.0%) | 2 (100.0%) |
| 55 to 64 Years | 7 (100.0%) | 0 (0.0%) |
| 65 to 74 Years | 2 (100.0%) | 3 (100.0%) |
| 75 Years and over | 2 (100.0%) | 5 (100.0%) |
| Total | 22 (100.0%) | 21 (100.0%) |
Income Below Poverty Among Married-Couple Families in Carlton Landing
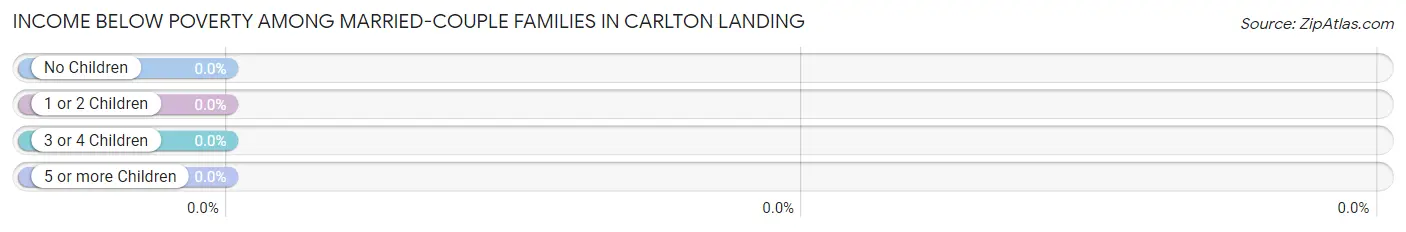
| Children | Above Poverty | Below Poverty |
| No Children | 6 (100.0%) | 0 (0.0%) |
| 1 or 2 Children | 1 (100.0%) | 0 (0.0%) |
| 3 or 4 Children | 3 (100.0%) | 0 (0.0%) |
| 5 or more Children | 0 (0.0%) | 0 (0.0%) |
| Total | 10 (100.0%) | 0 (0.0%) |
Income Below Poverty Among Single-Parent Households in Carlton Landing
| Children | Single Father | Single Mother |
| No Children | 0 (0.0%) | 0 (0.0%) |
| 1 or 2 Children | 0 (0.0%) | 0 (0.0%) |
| 3 or 4 Children | 0 (0.0%) | 0 (0.0%) |
| 5 or more Children | 0 (0.0%) | 0 (0.0%) |
| Total | 0 (0.0%) | 0 (0.0%) |
Income Below Poverty Among Married-Couple vs Single-Parent Households in Carlton Landing
| Children | Married-Couple Families | Single-Parent Households |
| No Children | 0 (0.0%) | 0 (0.0%) |
| 1 or 2 Children | 0 (0.0%) | 0 (0.0%) |
| 3 or 4 Children | 0 (0.0%) | 0 (0.0%) |
| 5 or more Children | 0 (0.0%) | 0 (0.0%) |
| Total | 0 (0.0%) | 0 (0.0%) |
Race in Carlton Landing
The most populous races in Carlton Landing are White / Caucasian (35 | 81.4%), Asian (3 | 7.0%), and Black / African American (3 | 7.0%).
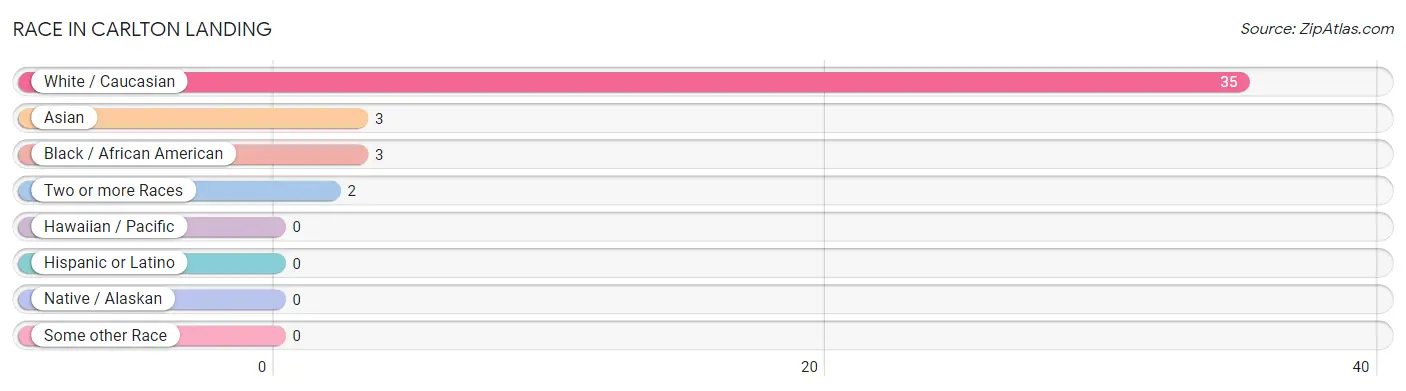
| Race | # Population | % Population |
| Asian | 3 | 7.0% |
| Black / African American | 3 | 7.0% |
| Hawaiian / Pacific | 0 | 0.0% |
| Hispanic or Latino | 0 | 0.0% |
| Native / Alaskan | 0 | 0.0% |
| White / Caucasian | 35 | 81.4% |
| Two or more Races | 2 | 4.6% |
| Some other Race | 0 | 0.0% |
| Total | 43 | 100.0% |
Ancestry in Carlton Landing
The most populous ancestries reported in Carlton Landing are English (11 | 25.6%), Indian (Asian) (5 | 11.6%), Sri Lankan (5 | 11.6%), German (4 | 9.3%), and European (3 | 7.0%), together accounting for 65.1% of all Carlton Landing residents.
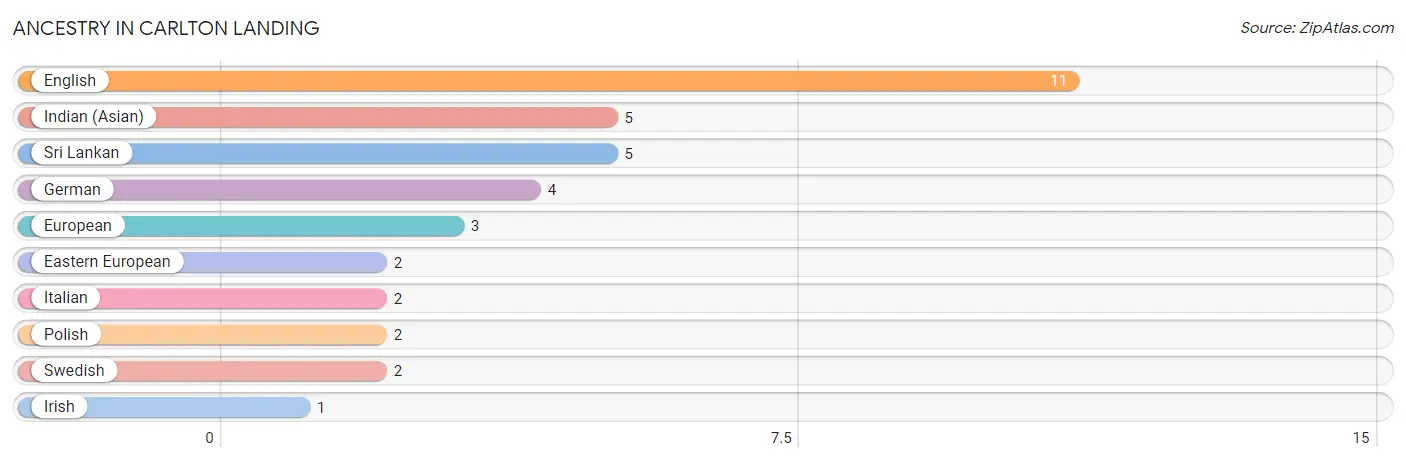
| Ancestry | # Population | % Population |
| Eastern European | 2 | 4.6% |
| English | 11 | 25.6% |
| European | 3 | 7.0% |
| German | 4 | 9.3% |
| Indian (Asian) | 5 | 11.6% |
| Irish | 1 | 2.3% |
| Italian | 2 | 4.6% |
| Polish | 2 | 4.6% |
| Sri Lankan | 5 | 11.6% |
| Swedish | 2 | 4.6% | View All 10 Rows |
Immigrants in Carlton Landing
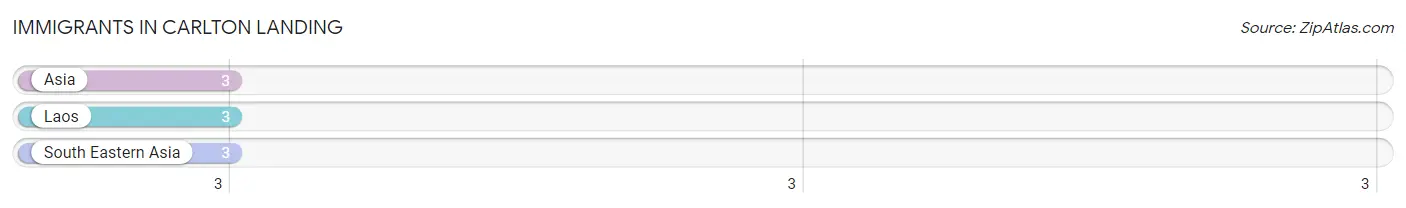
The most numerous immigrant groups reported in Carlton Landing came from Asia (3 | 7.0%), Laos (3 | 7.0%), and South Eastern Asia (3 | 7.0%), together accounting for 20.9% of all Carlton Landing residents.
| Immigration Origin | # Population | % Population |
| Asia | 3 | 7.0% |
| Laos | 3 | 7.0% |
| South Eastern Asia | 3 | 7.0% | View All 3 Rows |
Sex and Age in Carlton Landing
Sex and Age in Carlton Landing
The most populous age groups in Carlton Landing are 55 to 59 Years (4 | 18.2%) for men and 40 to 44 Years (4 | 19.1%) for women.
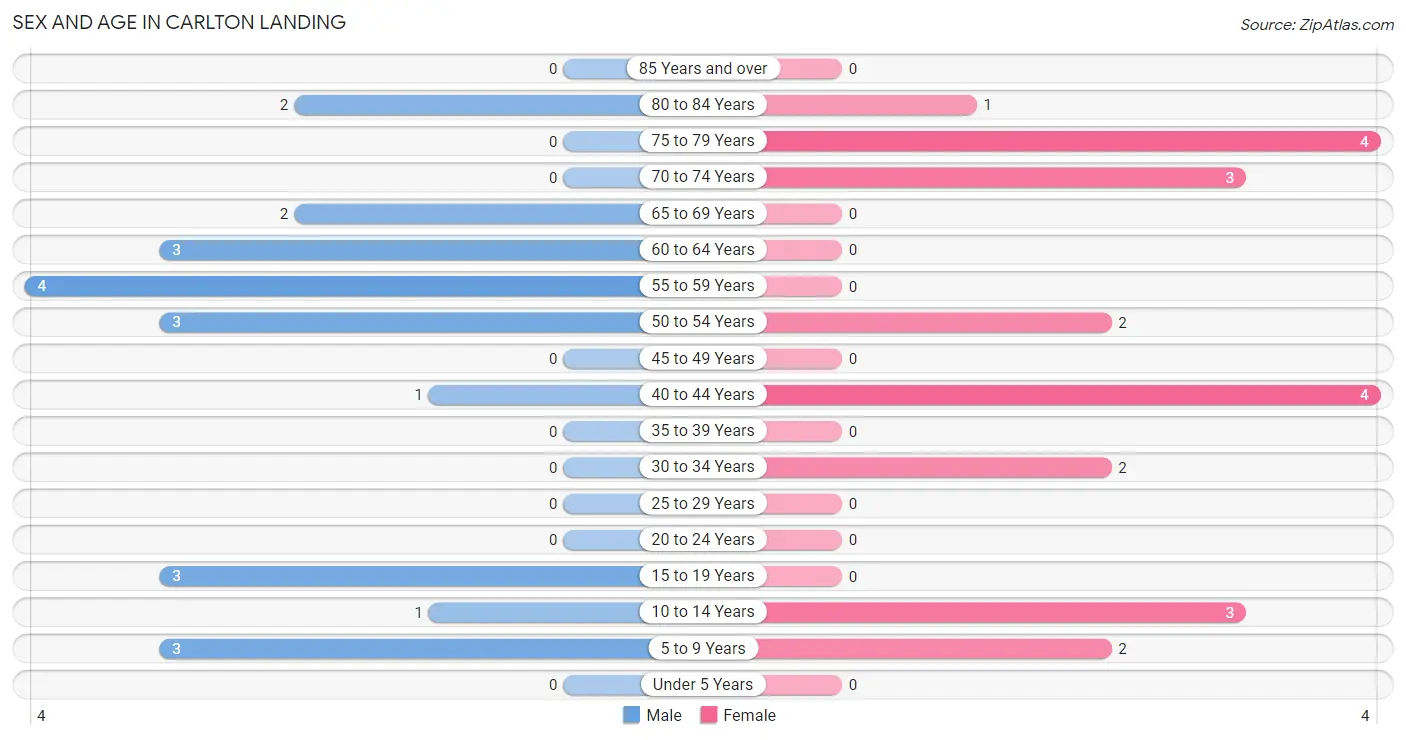
| Age Bracket | Male | Female |
| Under 5 Years | 0 (0.0%) | 0 (0.0%) |
| 5 to 9 Years | 3 (13.6%) | 2 (9.5%) |
| 10 to 14 Years | 1 (4.5%) | 3 (14.3%) |
| 15 to 19 Years | 3 (13.6%) | 0 (0.0%) |
| 20 to 24 Years | 0 (0.0%) | 0 (0.0%) |
| 25 to 29 Years | 0 (0.0%) | 0 (0.0%) |
| 30 to 34 Years | 0 (0.0%) | 2 (9.5%) |
| 35 to 39 Years | 0 (0.0%) | 0 (0.0%) |
| 40 to 44 Years | 1 (4.5%) | 4 (19.1%) |
| 45 to 49 Years | 0 (0.0%) | 0 (0.0%) |
| 50 to 54 Years | 3 (13.6%) | 2 (9.5%) |
| 55 to 59 Years | 4 (18.2%) | 0 (0.0%) |
| 60 to 64 Years | 3 (13.6%) | 0 (0.0%) |
| 65 to 69 Years | 2 (9.1%) | 0 (0.0%) |
| 70 to 74 Years | 0 (0.0%) | 3 (14.3%) |
| 75 to 79 Years | 0 (0.0%) | 4 (19.1%) |
| 80 to 84 Years | 2 (9.1%) | 1 (4.8%) |
| 85 Years and over | 0 (0.0%) | 0 (0.0%) |
| Total | 22 (100.0%) | 21 (100.0%) |
Families and Households in Carlton Landing
Median Family Size in Carlton Landing
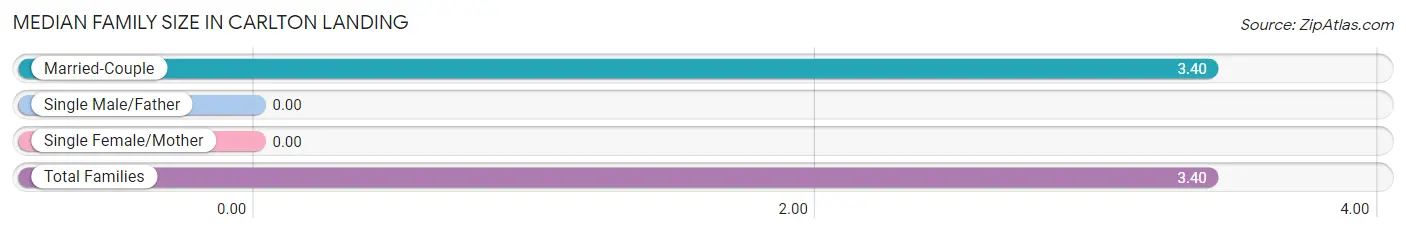
| Family Type | # Families | Family Size |
| Married-Couple | 10 (100.0%) | 3.40 |
| Single Male/Father | 0 (0.0%) | - |
| Single Female/Mother | 0 (0.0%) | - |
| Total Families | 10 (100.0%) | 3.40 |
Median Household Size in Carlton Landing
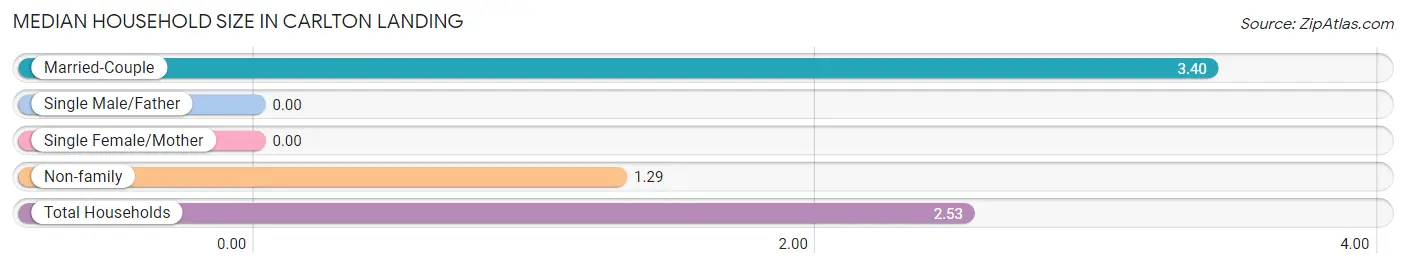
| Household Type | # Households | Household Size |
| Married-Couple | 10 (58.8%) | 3.40 |
| Single Male/Father | 0 (0.0%) | - |
| Single Female/Mother | 0 (0.0%) | - |
| Non-family | 7 (41.2%) | 1.29 |
| Total Households | 17 (100.0%) | 2.53 |
Household Size by Marriage Status in Carlton Landing
Out of a total of 17 households in Carlton Landing, 10 (58.8%) are family households, while 7 (41.2%) are nonfamily households. The most numerous type of family households are 2-person households, comprising 4, and the most common type of nonfamily households are 1-person households, comprising 5.
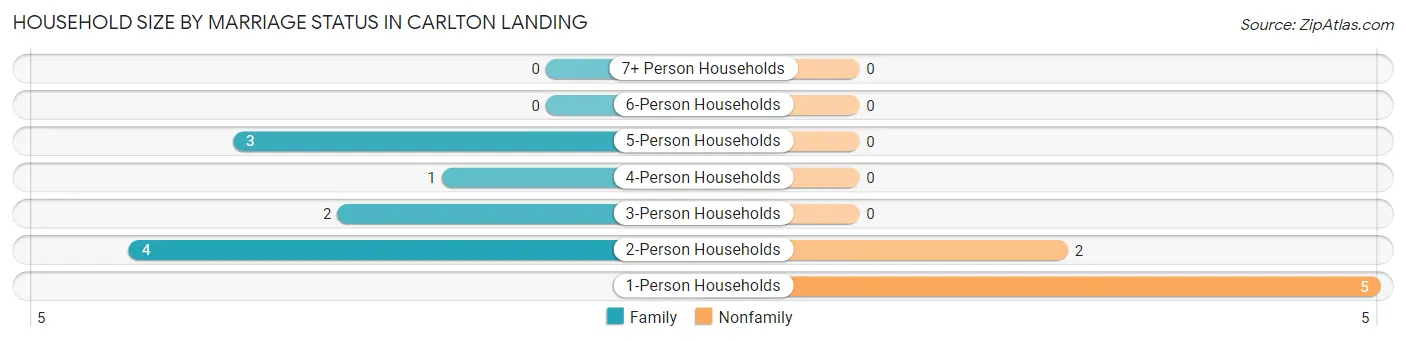
| Household Size | Family Households | Nonfamily Households |
| 1-Person Households | - | 5 (29.4%) |
| 2-Person Households | 4 (23.5%) | 2 (11.8%) |
| 3-Person Households | 2 (11.8%) | 0 (0.0%) |
| 4-Person Households | 1 (5.9%) | 0 (0.0%) |
| 5-Person Households | 3 (17.6%) | 0 (0.0%) |
| 6-Person Households | 0 (0.0%) | 0 (0.0%) |
| 7+ Person Households | 0 (0.0%) | 0 (0.0%) |
| Total | 10 (58.8%) | 7 (41.2%) |
Female Fertility in Carlton Landing
Fertility by Age in Carlton Landing
| Age Bracket | Women with Births | Births / 1,000 Women |
| 15 to 19 years | 0 (0.0%) | 0.0 |
| 20 to 34 years | 0 (0.0%) | 0.0 |
| 35 to 50 years | 0 (0.0%) | 0.0 |
| Total | 0 (0.0%) | 0.0 |
Fertility by Age by Marriage Status in Carlton Landing
| Age Bracket | Married | Unmarried |
| 15 to 19 years | 0 (0.0%) | 0 (0.0%) |
| 20 to 34 years | 0 (0.0%) | 0 (0.0%) |
| 35 to 50 years | 0 (0.0%) | 0 (0.0%) |
| Total | 0 (0.0%) | 0 (0.0%) |
Fertility by Education in Carlton Landing
| Educational Attainment | Women with Births | Births / 1,000 Women |
| Less than High School | 0 (0.0%) | 0.0 |
| High School Diploma | 0 (0.0%) | 0.0 |
| College or Associate's Degree | 0 (0.0%) | 0.0 |
| Bachelor's Degree | 0 (0.0%) | 0.0 |
| Graduate Degree | 0 (0.0%) | 0.0 |
| Total | 0 (0.0%) | 0.0 |
Fertility by Education by Marriage Status in Carlton Landing
| Educational Attainment | Married | Unmarried |
| Less than High School | 0 (0.0%) | 0 (0.0%) |
| High School Diploma | 0 (0.0%) | 0 (0.0%) |
| College or Associate's Degree | 0 (0.0%) | 0 (0.0%) |
| Bachelor's Degree | 0 (0.0%) | 0 (0.0%) |
| Graduate Degree | 0 (0.0%) | 0 (0.0%) |
| Total | 0 (0.0%) | 0 (0.0%) |
Employment Characteristics in Carlton Landing
Employment by Class of Employer in Carlton Landing
Among the 19 employed individuals in Carlton Landing, private company employees (11 | 57.9%), self-employed (incorporated) (5 | 26.3%), and local government employees (2 | 10.5%) make up the most common classes of employment.
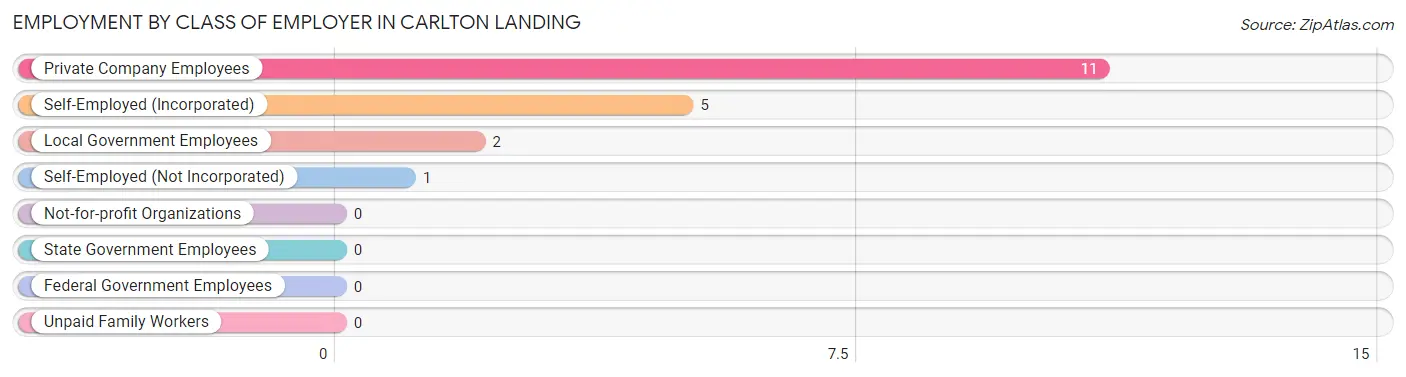
| Employer Class | # Employees | % Employees |
| Private Company Employees | 11 | 57.9% |
| Self-Employed (Incorporated) | 5 | 26.3% |
| Self-Employed (Not Incorporated) | 1 | 5.3% |
| Not-for-profit Organizations | 0 | 0.0% |
| Local Government Employees | 2 | 10.5% |
| State Government Employees | 0 | 0.0% |
| Federal Government Employees | 0 | 0.0% |
| Unpaid Family Workers | 0 | 0.0% |
| Total | 19 | 100.0% |
Employment Status by Age in Carlton Landing
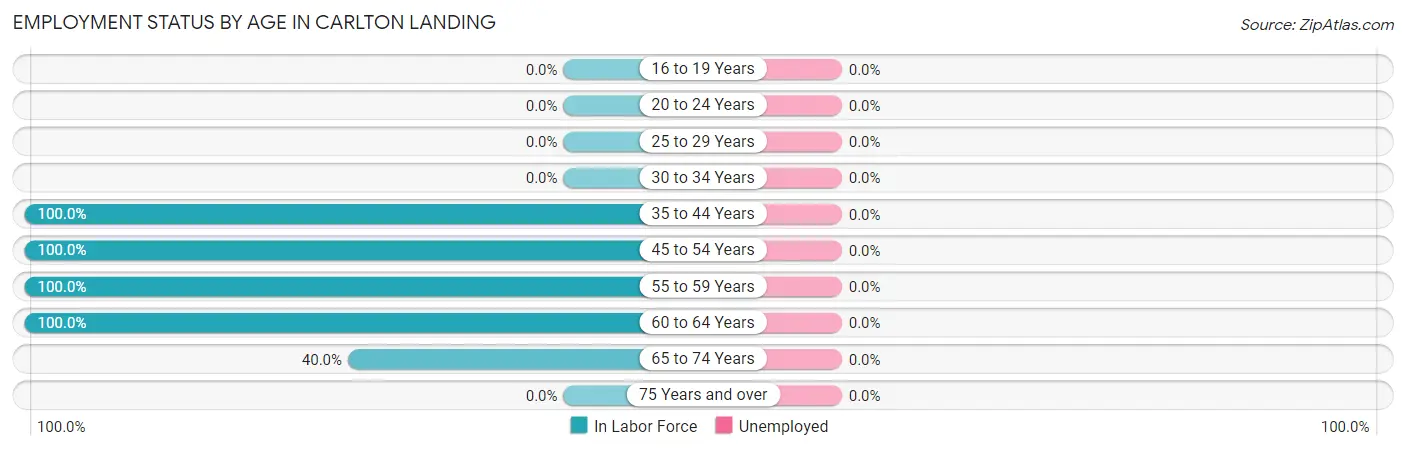
| Age Bracket | In Labor Force | Unemployed |
| 16 to 19 Years | 0 (0.0%) | 0 (0.0%) |
| 20 to 24 Years | 0 (0.0%) | 0 (0.0%) |
| 25 to 29 Years | 0 (0.0%) | 0 (0.0%) |
| 30 to 34 Years | 0 (0.0%) | 0 (0.0%) |
| 35 to 44 Years | 5 (100.0%) | 0 (0.0%) |
| 45 to 54 Years | 5 (100.0%) | 0 (0.0%) |
| 55 to 59 Years | 4 (100.0%) | 0 (0.0%) |
| 60 to 64 Years | 3 (100.0%) | 0 (0.0%) |
| 65 to 74 Years | 2 (40.0%) | 0 (0.0%) |
| 75 Years and over | 0 (0.0%) | 0 (0.0%) |
| Total | 19 (61.3%) | 0 (0.0%) |
Employment Status by Educational Attainment in Carlton Landing
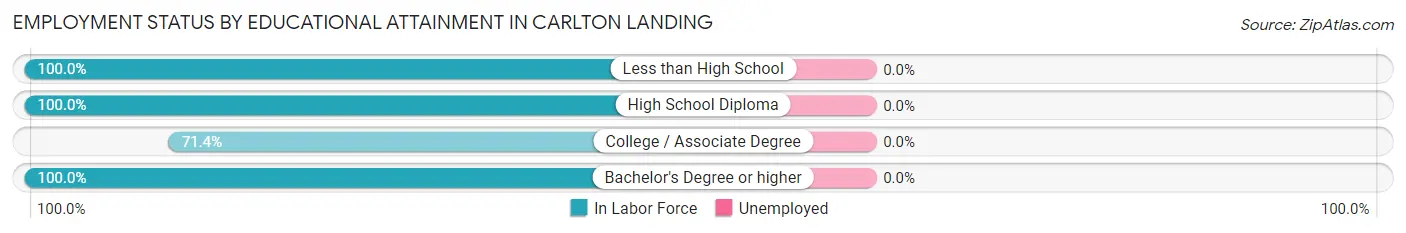
| Educational Attainment | In Labor Force | Unemployed |
| Less than High School | 3 (100.0%) | 0 (0.0%) |
| High School Diploma | 2 (100.0%) | 0 (0.0%) |
| College / Associate Degree | 5 (71.4%) | 0 (0.0%) |
| Bachelor's Degree or higher | 7 (100.0%) | 0 (0.0%) |
| Total | 17 (89.5%) | 0 (0.0%) |
Employment Occupations by Sex in Carlton Landing
Management, Business, Science and Arts Occupations
The most common Management, Business, Science and Arts occupations in Carlton Landing are Management (5 | 26.3%), Community & Social Service (1 | 5.3%), and Arts, Media & Entertainment (1 | 5.3%).
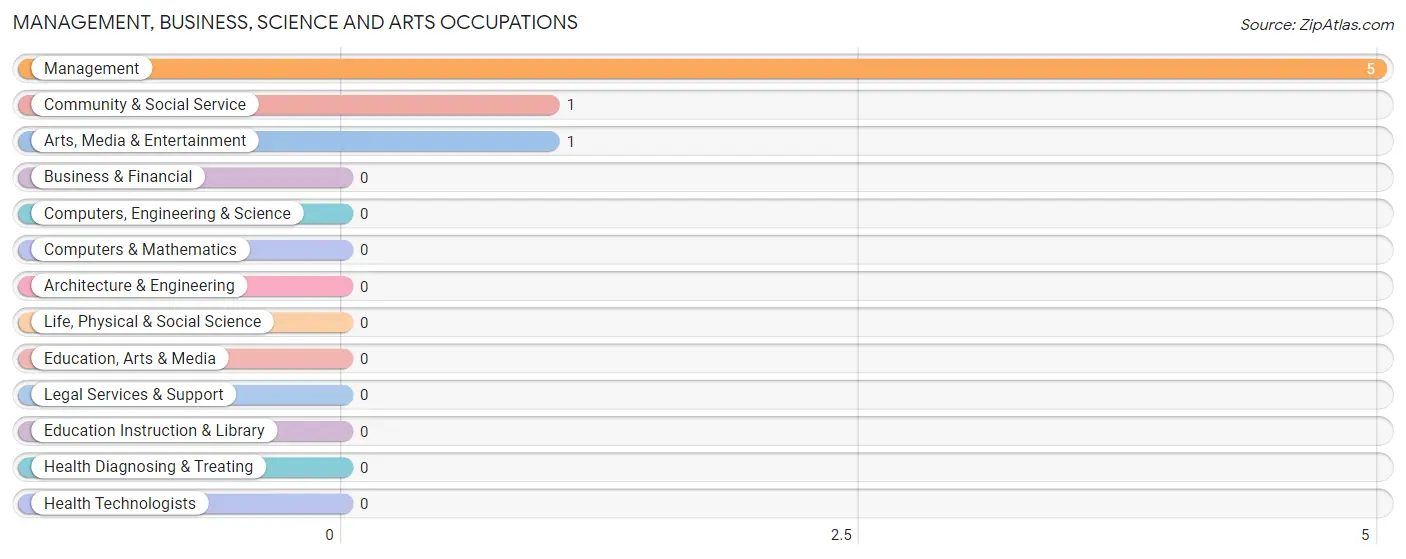
Management, Business, Science and Arts Occupations by Sex
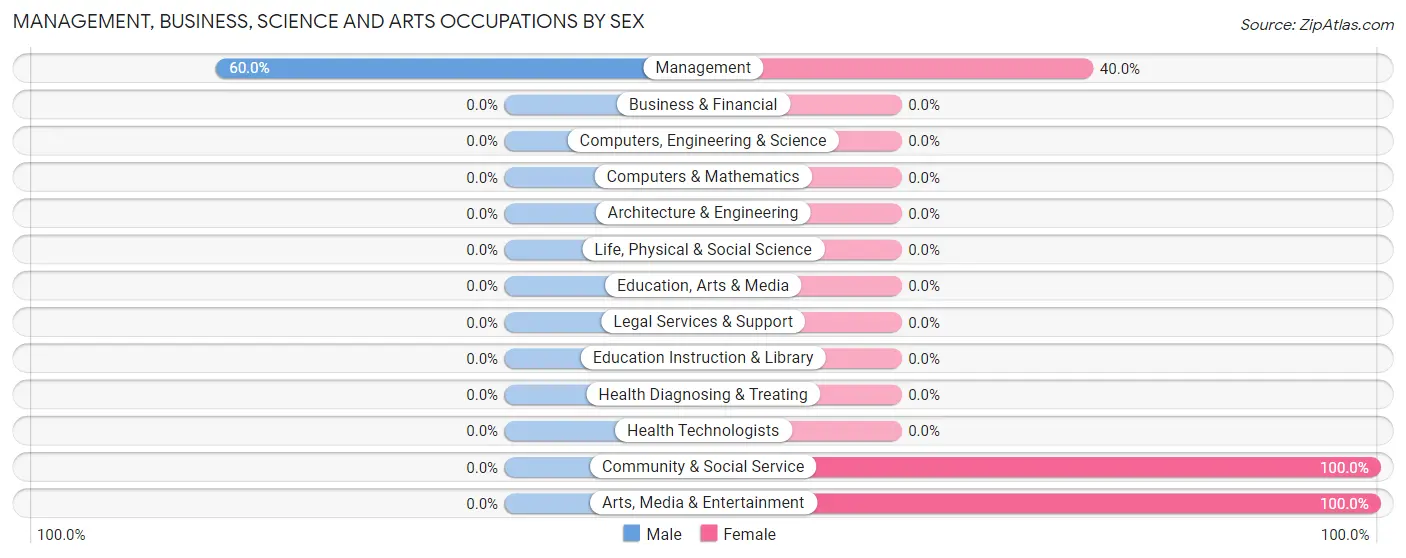
| Occupation | Male | Female |
| Management | 3 (60.0%) | 2 (40.0%) |
| Business & Financial | 0 (0.0%) | 0 (0.0%) |
| Computers, Engineering & Science | 0 (0.0%) | 0 (0.0%) |
| Computers & Mathematics | 0 (0.0%) | 0 (0.0%) |
| Architecture & Engineering | 0 (0.0%) | 0 (0.0%) |
| Life, Physical & Social Science | 0 (0.0%) | 0 (0.0%) |
| Community & Social Service | 0 (0.0%) | 1 (100.0%) |
| Education, Arts & Media | 0 (0.0%) | 0 (0.0%) |
| Legal Services & Support | 0 (0.0%) | 0 (0.0%) |
| Education Instruction & Library | 0 (0.0%) | 0 (0.0%) |
| Arts, Media & Entertainment | 0 (0.0%) | 1 (100.0%) |
| Health Diagnosing & Treating | 0 (0.0%) | 0 (0.0%) |
| Health Technologists | 0 (0.0%) | 0 (0.0%) |
| Total (Category) | 3 (50.0%) | 3 (50.0%) |
| Total (Overall) | 13 (68.4%) | 6 (31.6%) |
Services Occupations
The most common Services occupations in Carlton Landing are , and Cleaning & Maintenance (3 | 15.8%).
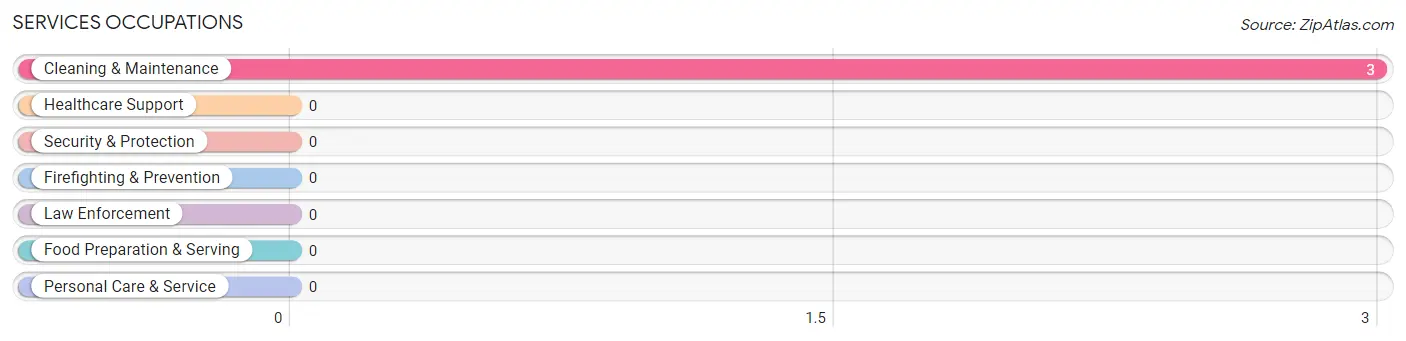
Services Occupations by Sex
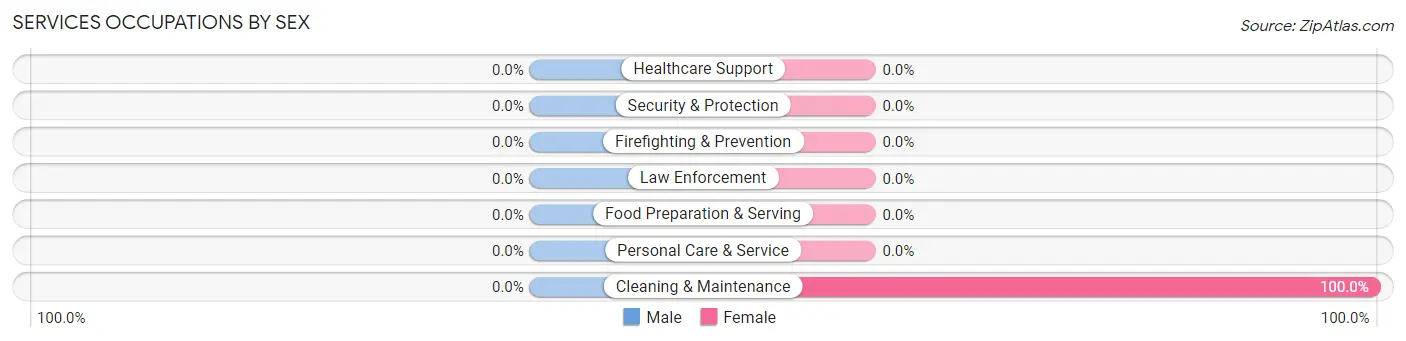
| Occupation | Male | Female |
| Healthcare Support | 0 (0.0%) | 0 (0.0%) |
| Security & Protection | 0 (0.0%) | 0 (0.0%) |
| Firefighting & Prevention | 0 (0.0%) | 0 (0.0%) |
| Law Enforcement | 0 (0.0%) | 0 (0.0%) |
| Food Preparation & Serving | 0 (0.0%) | 0 (0.0%) |
| Cleaning & Maintenance | 0 (0.0%) | 3 (100.0%) |
| Personal Care & Service | 0 (0.0%) | 0 (0.0%) |
| Total (Category) | 0 (0.0%) | 3 (100.0%) |
| Total (Overall) | 13 (68.4%) | 6 (31.6%) |
Sales and Office Occupations
The most common Sales and Office occupations in Carlton Landing are , and Sales & Related (3 | 15.8%).
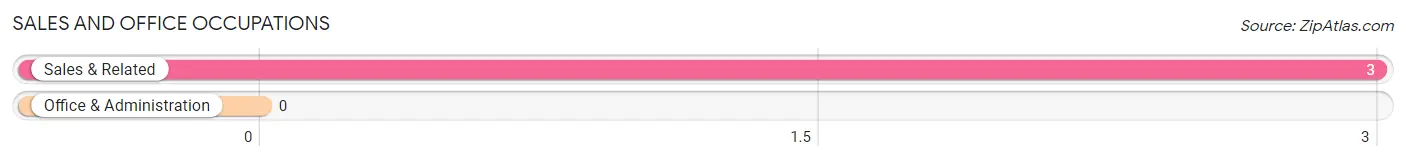
Sales and Office Occupations by Sex
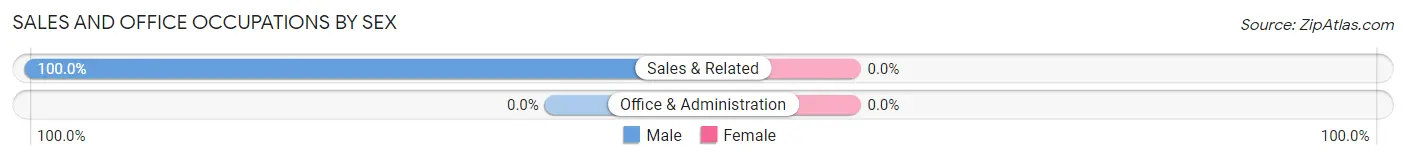
| Occupation | Male | Female |
| Sales & Related | 3 (100.0%) | 0 (0.0%) |
| Office & Administration | 0 (0.0%) | 0 (0.0%) |
| Total (Category) | 3 (100.0%) | 0 (0.0%) |
| Total (Overall) | 13 (68.4%) | 6 (31.6%) |
Natural Resources, Construction and Maintenance Occupations
The most common Natural Resources, Construction and Maintenance occupations in Carlton Landing are , and Construction & Extraction (4 | 21.0%).
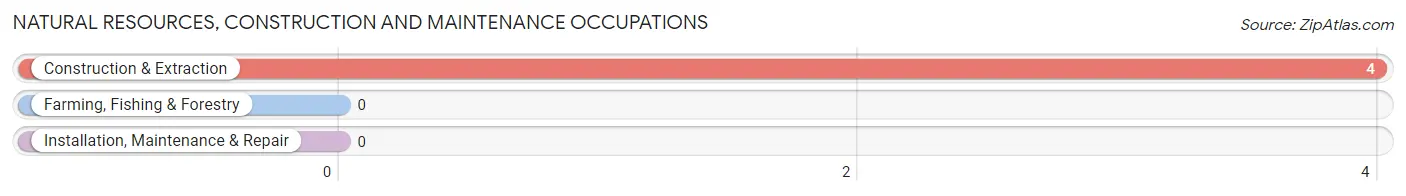
Natural Resources, Construction and Maintenance Occupations by Sex
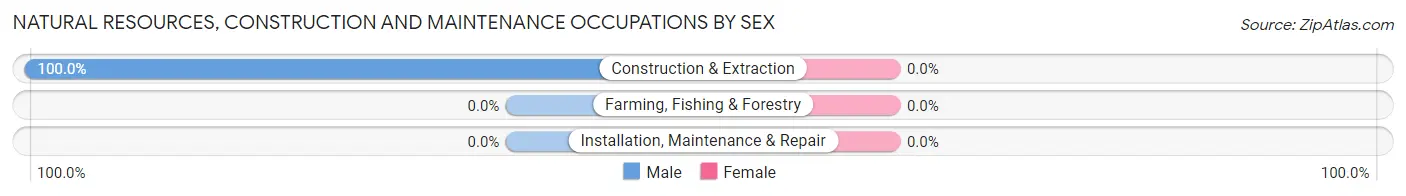
| Occupation | Male | Female |
| Farming, Fishing & Forestry | 0 (0.0%) | 0 (0.0%) |
| Construction & Extraction | 4 (100.0%) | 0 (0.0%) |
| Installation, Maintenance & Repair | 0 (0.0%) | 0 (0.0%) |
| Total (Category) | 4 (100.0%) | 0 (0.0%) |
| Total (Overall) | 13 (68.4%) | 6 (31.6%) |
Production, Transportation and Moving Occupations
The most common Production, Transportation and Moving occupations in Carlton Landing are , and Transportation (3 | 15.8%).
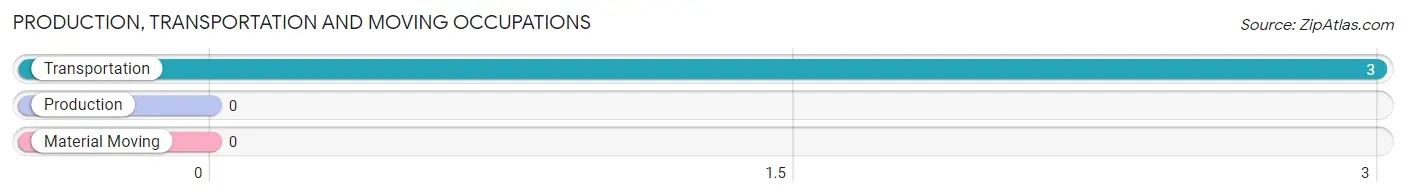
Production, Transportation and Moving Occupations by Sex
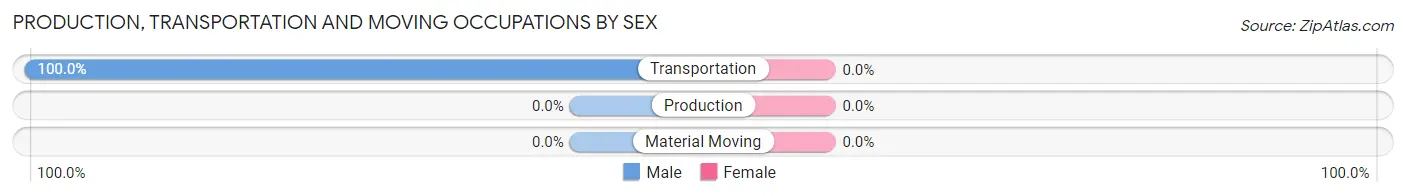
| Occupation | Male | Female |
| Production | 0 (0.0%) | 0 (0.0%) |
| Transportation | 3 (100.0%) | 0 (0.0%) |
| Material Moving | 0 (0.0%) | 0 (0.0%) |
| Total (Category) | 3 (100.0%) | 0 (0.0%) |
| Total (Overall) | 13 (68.4%) | 6 (31.6%) |
Employment Industries by Sex in Carlton Landing
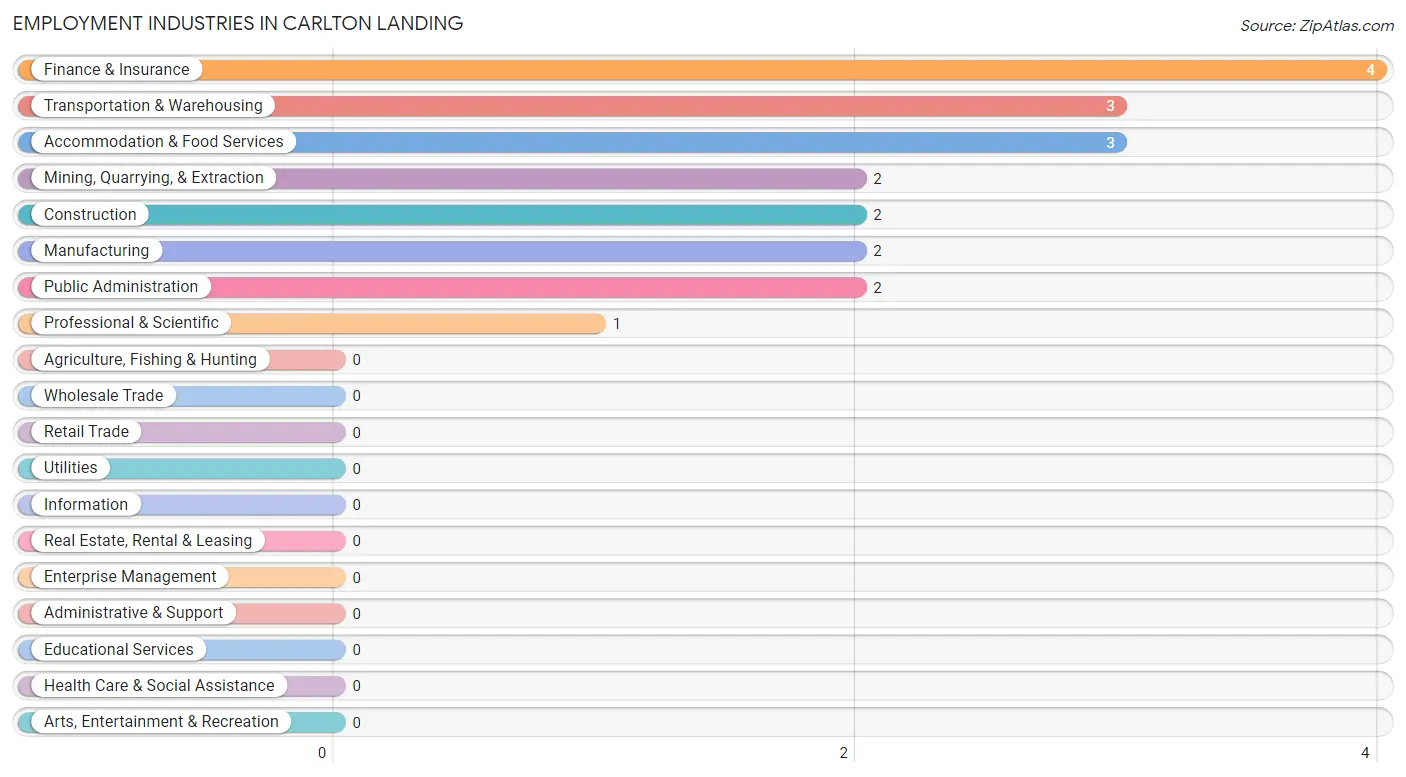
Employment Industries in Carlton Landing
The major employment industries in Carlton Landing include Finance & Insurance (4 | 21.0%), Transportation & Warehousing (3 | 15.8%), Accommodation & Food Services (3 | 15.8%), Mining, Quarrying, & Extraction (2 | 10.5%), and Construction (2 | 10.5%).
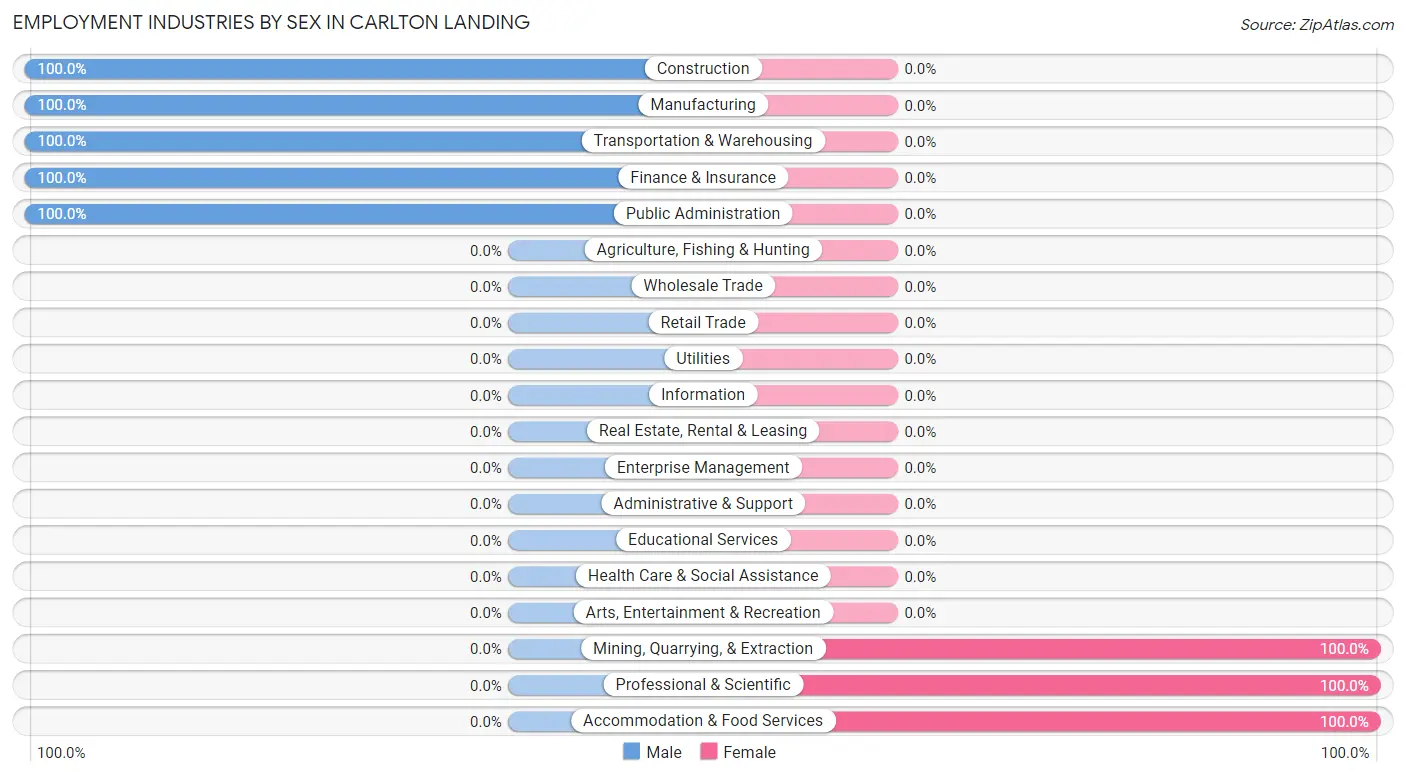
Employment Industries by Sex in Carlton Landing
The Carlton Landing industries that see more men than women are Construction (100.0%), Manufacturing (100.0%), and Transportation & Warehousing (100.0%), whereas the industries that tend to have a higher number of women are Mining, Quarrying, & Extraction (100.0%), Professional & Scientific (100.0%), and Accommodation & Food Services (100.0%).
| Industry | Male | Female |
| Agriculture, Fishing & Hunting | 0 (0.0%) | 0 (0.0%) |
| Mining, Quarrying, & Extraction | 0 (0.0%) | 2 (100.0%) |
| Construction | 2 (100.0%) | 0 (0.0%) |
| Manufacturing | 2 (100.0%) | 0 (0.0%) |
| Wholesale Trade | 0 (0.0%) | 0 (0.0%) |
| Retail Trade | 0 (0.0%) | 0 (0.0%) |
| Transportation & Warehousing | 3 (100.0%) | 0 (0.0%) |
| Utilities | 0 (0.0%) | 0 (0.0%) |
| Information | 0 (0.0%) | 0 (0.0%) |
| Finance & Insurance | 4 (100.0%) | 0 (0.0%) |
| Real Estate, Rental & Leasing | 0 (0.0%) | 0 (0.0%) |
| Professional & Scientific | 0 (0.0%) | 1 (100.0%) |
| Enterprise Management | 0 (0.0%) | 0 (0.0%) |
| Administrative & Support | 0 (0.0%) | 0 (0.0%) |
| Educational Services | 0 (0.0%) | 0 (0.0%) |
| Health Care & Social Assistance | 0 (0.0%) | 0 (0.0%) |
| Arts, Entertainment & Recreation | 0 (0.0%) | 0 (0.0%) |
| Accommodation & Food Services | 0 (0.0%) | 3 (100.0%) |
| Public Administration | 2 (100.0%) | 0 (0.0%) |
| Total | 13 (68.4%) | 6 (31.6%) |
Education in Carlton Landing
School Enrollment in Carlton Landing
The most common levels of schooling among the 17 students in Carlton Landing are elementary school (5 | 29.4%), middle school (4 | 23.5%), and high school (3 | 17.6%).
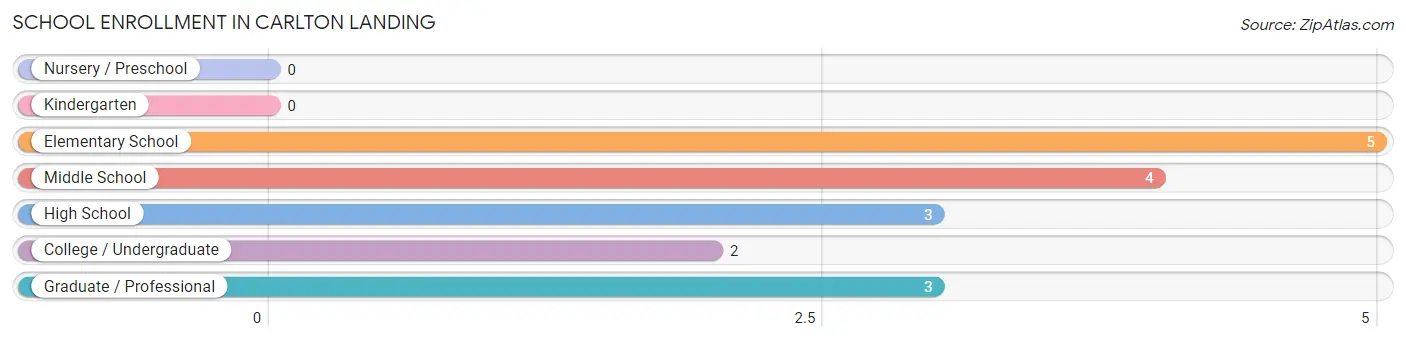
| School Level | # Students | % Students |
| Nursery / Preschool | 0 | 0.0% |
| Kindergarten | 0 | 0.0% |
| Elementary School | 5 | 29.4% |
| Middle School | 4 | 23.5% |
| High School | 3 | 17.6% |
| College / Undergraduate | 2 | 11.8% |
| Graduate / Professional | 3 | 17.6% |
| Total | 17 | 100.0% |
School Enrollment by Age by Funding Source in Carlton Landing
Out of a total of 17 students who are enrolled in schools in Carlton Landing, 1 (5.9%) attend a private institution, while the remaining 16 (94.1%) are enrolled in public schools. The age group of 10 to 14 year olds has the highest likelihood of being enrolled in private schools, with 1 (25.0% in the age bracket) enrolled. Conversely, the age group of 5 to 9 year old has the lowest likelihood of being enrolled in a private school, with 5 (100.0% in the age bracket) attending a public institution.
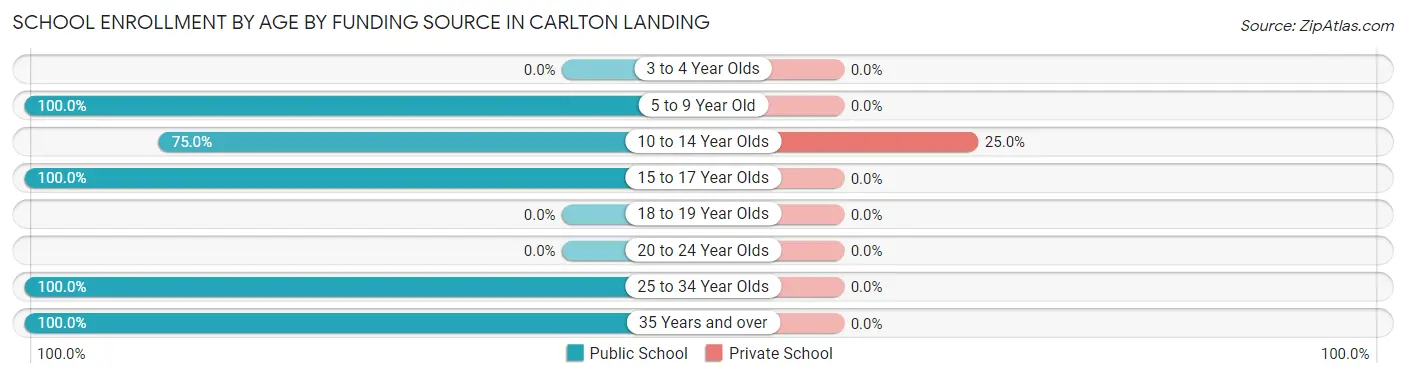
| Age Bracket | Public School | Private School |
| 3 to 4 Year Olds | 0 (0.0%) | 0 (0.0%) |
| 5 to 9 Year Old | 5 (100.0%) | 0 (0.0%) |
| 10 to 14 Year Olds | 3 (75.0%) | 1 (25.0%) |
| 15 to 17 Year Olds | 3 (100.0%) | 0 (0.0%) |
| 18 to 19 Year Olds | 0 (0.0%) | 0 (0.0%) |
| 20 to 24 Year Olds | 0 (0.0%) | 0 (0.0%) |
| 25 to 34 Year Olds | 2 (100.0%) | 0 (0.0%) |
| 35 Years and over | 3 (100.0%) | 0 (0.0%) |
| Total | 16 (94.1%) | 1 (5.9%) |
Educational Attainment by Field of Study in Carlton Landing
Computers & mathematics (3 | 20.0%), psychology (3 | 20.0%), social sciences (2 | 13.3%), business (2 | 13.3%), and education (2 | 13.3%) are the most common fields of study among 15 individuals in Carlton Landing who have obtained a bachelor's degree or higher.
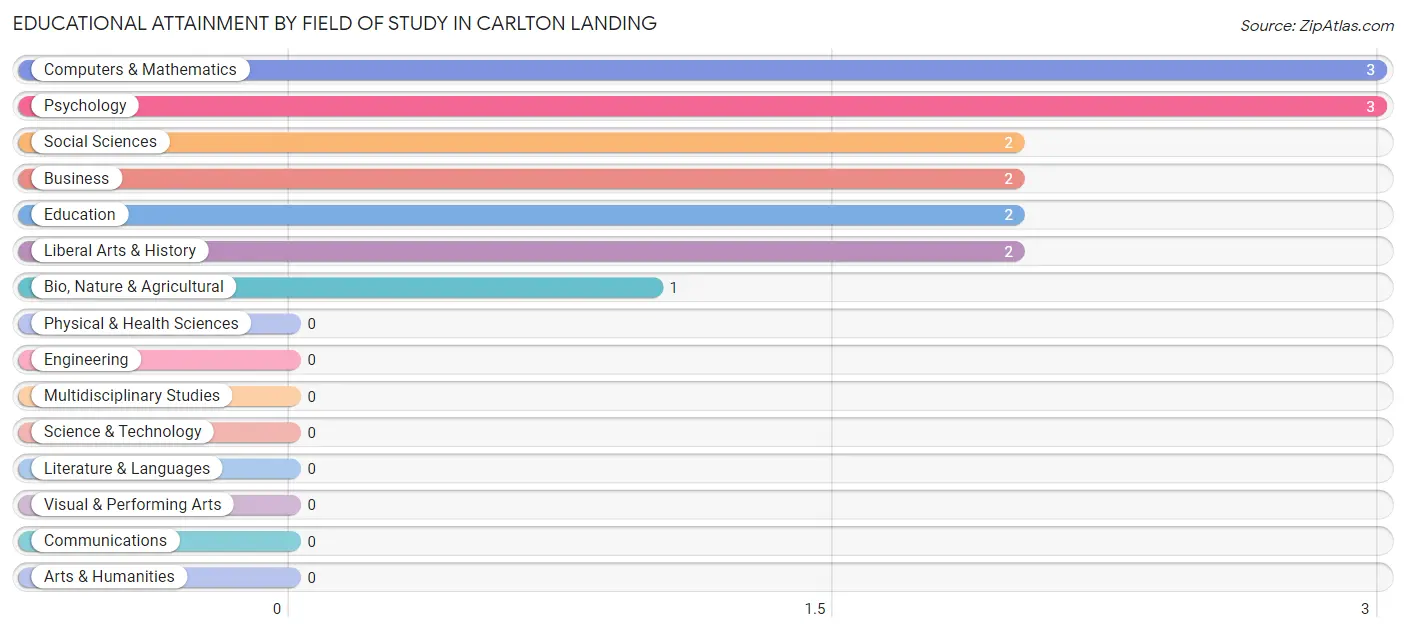
| Field of Study | # Graduates | % Graduates |
| Computers & Mathematics | 3 | 20.0% |
| Bio, Nature & Agricultural | 1 | 6.7% |
| Physical & Health Sciences | 0 | 0.0% |
| Psychology | 3 | 20.0% |
| Social Sciences | 2 | 13.3% |
| Engineering | 0 | 0.0% |
| Multidisciplinary Studies | 0 | 0.0% |
| Science & Technology | 0 | 0.0% |
| Business | 2 | 13.3% |
| Education | 2 | 13.3% |
| Literature & Languages | 0 | 0.0% |
| Liberal Arts & History | 2 | 13.3% |
| Visual & Performing Arts | 0 | 0.0% |
| Communications | 0 | 0.0% |
| Arts & Humanities | 0 | 0.0% |
| Total | 15 | 100.0% |
Transportation & Commute in Carlton Landing
Vehicle Availability by Sex in Carlton Landing
The most prevalent vehicle ownership categories in Carlton Landing are males with 2 vehicles (5, accounting for 38.5%) and females with 2 vehicles (3, making up 83.3%).
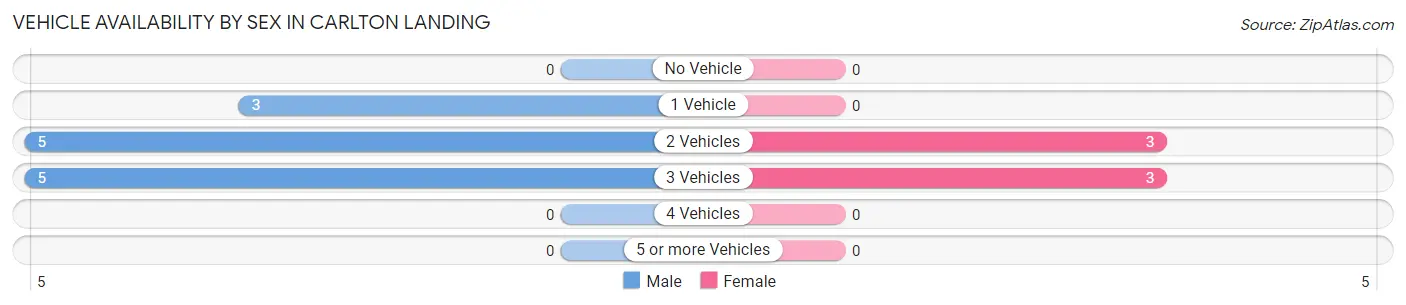
| Vehicles Available | Male | Female |
| No Vehicle | 0 (0.0%) | 0 (0.0%) |
| 1 Vehicle | 3 (23.1%) | 0 (0.0%) |
| 2 Vehicles | 5 (38.5%) | 3 (50.0%) |
| 3 Vehicles | 5 (38.5%) | 3 (50.0%) |
| 4 Vehicles | 0 (0.0%) | 0 (0.0%) |
| 5 or more Vehicles | 0 (0.0%) | 0 (0.0%) |
| Total | 13 (100.0%) | 6 (100.0%) |
Commute Time in Carlton Landing
The most frequently occuring commute durations in Carlton Landing are 90 or more minutes (6 commuters, 35.3%), 10 to 14 minutes (3 commuters, 17.6%), and 45 to 59 minutes (3 commuters, 17.6%).
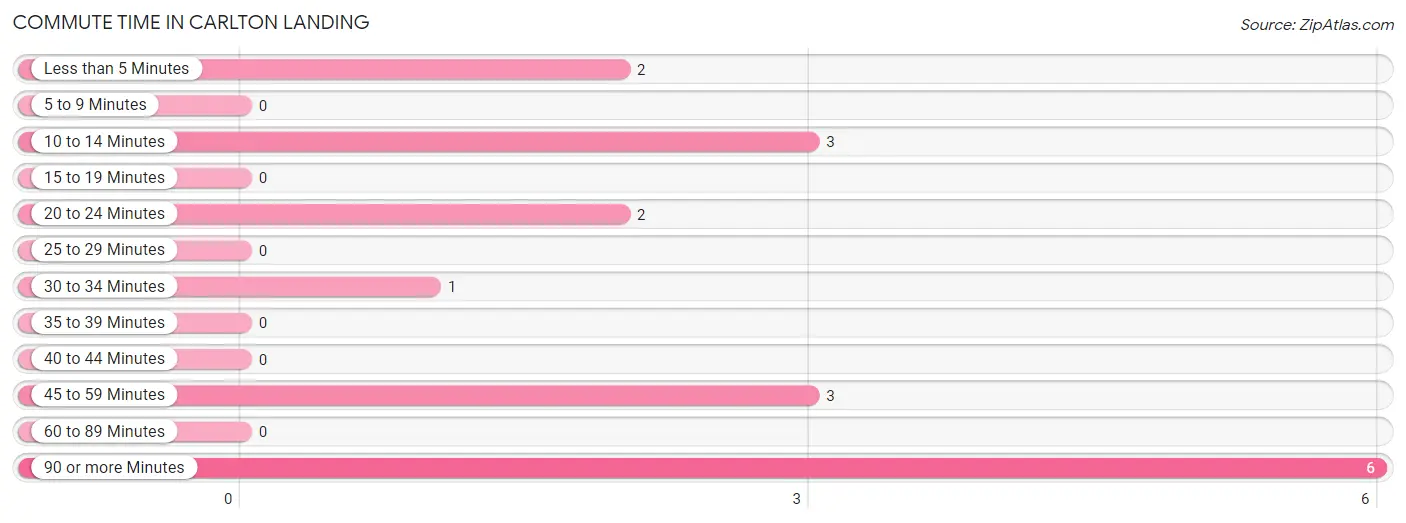
| Commute Time | # Commuters | % Commuters |
| Less than 5 Minutes | 2 | 11.8% |
| 5 to 9 Minutes | 0 | 0.0% |
| 10 to 14 Minutes | 3 | 17.6% |
| 15 to 19 Minutes | 0 | 0.0% |
| 20 to 24 Minutes | 2 | 11.8% |
| 25 to 29 Minutes | 0 | 0.0% |
| 30 to 34 Minutes | 1 | 5.9% |
| 35 to 39 Minutes | 0 | 0.0% |
| 40 to 44 Minutes | 0 | 0.0% |
| 45 to 59 Minutes | 3 | 17.6% |
| 60 to 89 Minutes | 0 | 0.0% |
| 90 or more Minutes | 6 | 35.3% |
Commute Time by Sex in Carlton Landing
The most common commute times in Carlton Landing are 90 or more minutes (5 commuters, 45.5%) for males and 10 to 14 minutes (3 commuters, 50.0%) for females.
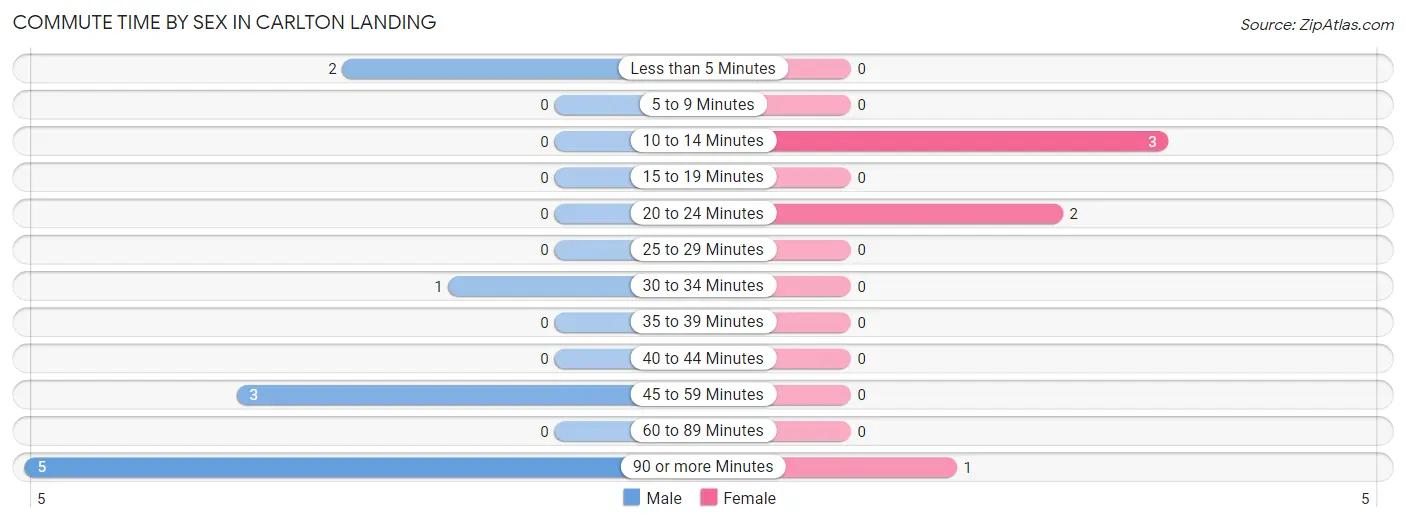
| Commute Time | Male | Female |
| Less than 5 Minutes | 2 (18.2%) | 0 (0.0%) |
| 5 to 9 Minutes | 0 (0.0%) | 0 (0.0%) |
| 10 to 14 Minutes | 0 (0.0%) | 3 (50.0%) |
| 15 to 19 Minutes | 0 (0.0%) | 0 (0.0%) |
| 20 to 24 Minutes | 0 (0.0%) | 2 (33.3%) |
| 25 to 29 Minutes | 0 (0.0%) | 0 (0.0%) |
| 30 to 34 Minutes | 1 (9.1%) | 0 (0.0%) |
| 35 to 39 Minutes | 0 (0.0%) | 0 (0.0%) |
| 40 to 44 Minutes | 0 (0.0%) | 0 (0.0%) |
| 45 to 59 Minutes | 3 (27.3%) | 0 (0.0%) |
| 60 to 89 Minutes | 0 (0.0%) | 0 (0.0%) |
| 90 or more Minutes | 5 (45.5%) | 1 (16.7%) |
Time of Departure to Work by Sex in Carlton Landing
The most frequent times of departure to work in Carlton Landing are 8:00 AM to 8:29 AM (6, 54.5%) for males and 8:00 AM to 8:29 AM (3, 50.0%) for females.
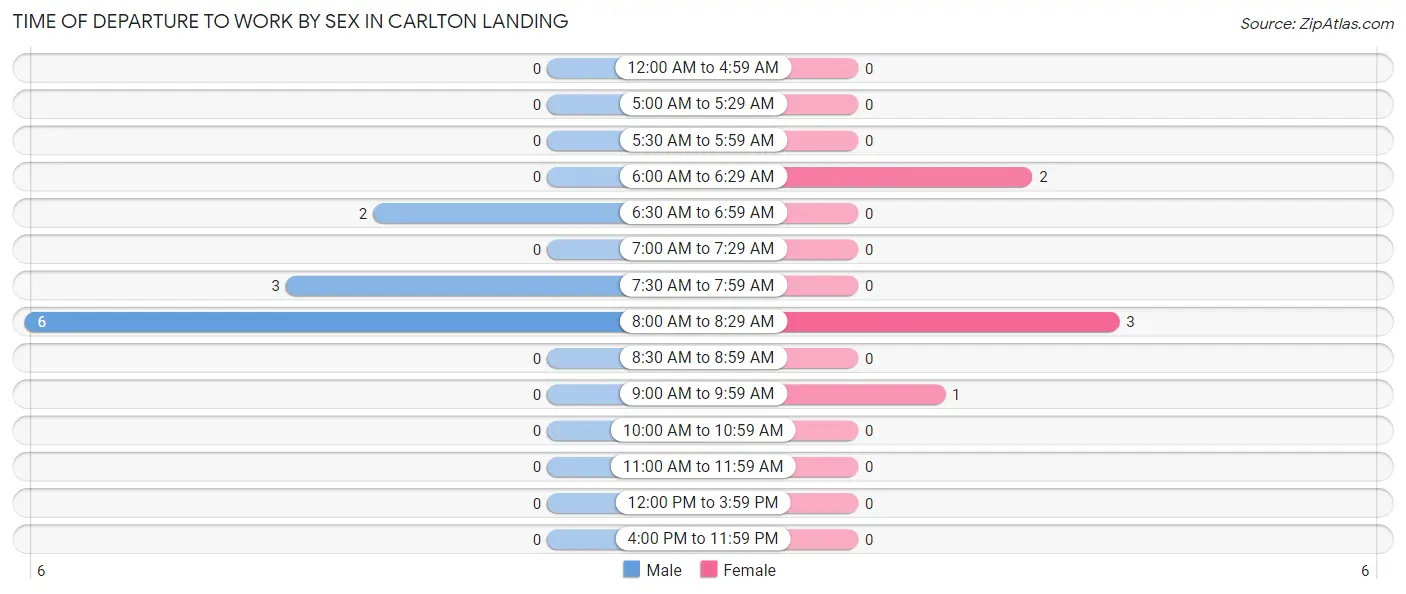
| Time of Departure | Male | Female |
| 12:00 AM to 4:59 AM | 0 (0.0%) | 0 (0.0%) |
| 5:00 AM to 5:29 AM | 0 (0.0%) | 0 (0.0%) |
| 5:30 AM to 5:59 AM | 0 (0.0%) | 0 (0.0%) |
| 6:00 AM to 6:29 AM | 0 (0.0%) | 2 (33.3%) |
| 6:30 AM to 6:59 AM | 2 (18.2%) | 0 (0.0%) |
| 7:00 AM to 7:29 AM | 0 (0.0%) | 0 (0.0%) |
| 7:30 AM to 7:59 AM | 3 (27.3%) | 0 (0.0%) |
| 8:00 AM to 8:29 AM | 6 (54.5%) | 3 (50.0%) |
| 8:30 AM to 8:59 AM | 0 (0.0%) | 0 (0.0%) |
| 9:00 AM to 9:59 AM | 0 (0.0%) | 1 (16.7%) |
| 10:00 AM to 10:59 AM | 0 (0.0%) | 0 (0.0%) |
| 11:00 AM to 11:59 AM | 0 (0.0%) | 0 (0.0%) |
| 12:00 PM to 3:59 PM | 0 (0.0%) | 0 (0.0%) |
| 4:00 PM to 11:59 PM | 0 (0.0%) | 0 (0.0%) |
| Total | 11 (100.0%) | 6 (100.0%) |
Housing Occupancy in Carlton Landing
Occupancy by Ownership in Carlton Landing
Of the total 17 dwellings in Carlton Landing, owner-occupied units account for 13 (76.5%), while renter-occupied units make up 4 (23.5%).
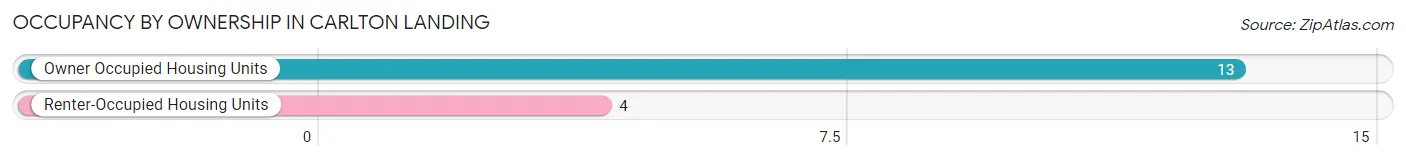
| Occupancy | # Housing Units | % Housing Units |
| Owner Occupied Housing Units | 13 | 76.5% |
| Renter-Occupied Housing Units | 4 | 23.5% |
| Total Occupied Housing Units | 17 | 100.0% |
Occupancy by Household Size in Carlton Landing
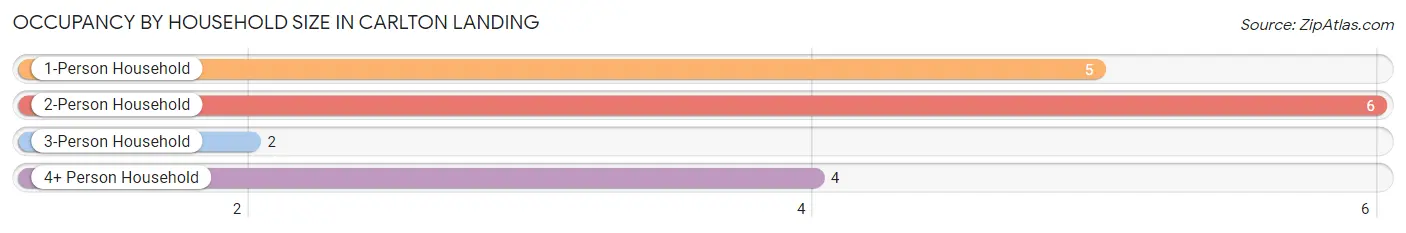
| Household Size | # Housing Units | % Housing Units |
| 1-Person Household | 5 | 29.4% |
| 2-Person Household | 6 | 35.3% |
| 3-Person Household | 2 | 11.8% |
| 4+ Person Household | 4 | 23.5% |
| Total Housing Units | 17 | 100.0% |
Occupancy by Ownership by Household Size in Carlton Landing
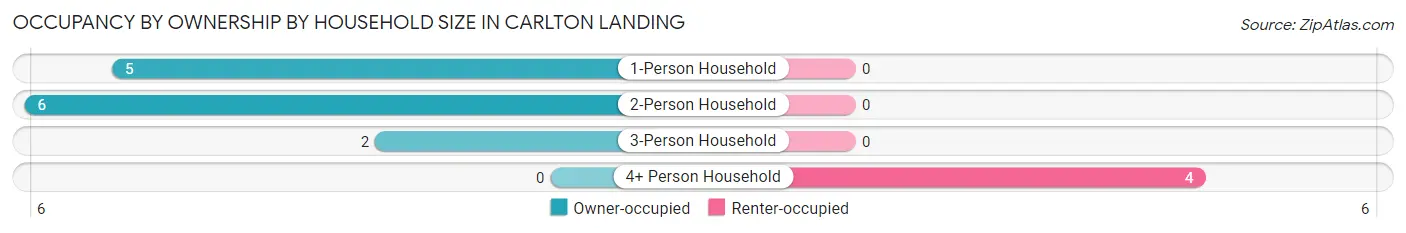
| Household Size | Owner-occupied | Renter-occupied |
| 1-Person Household | 5 (100.0%) | 0 (0.0%) |
| 2-Person Household | 6 (100.0%) | 0 (0.0%) |
| 3-Person Household | 2 (100.0%) | 0 (0.0%) |
| 4+ Person Household | 0 (0.0%) | 4 (100.0%) |
| Total Housing Units | 13 (76.5%) | 4 (23.5%) |
Occupancy by Educational Attainment in Carlton Landing
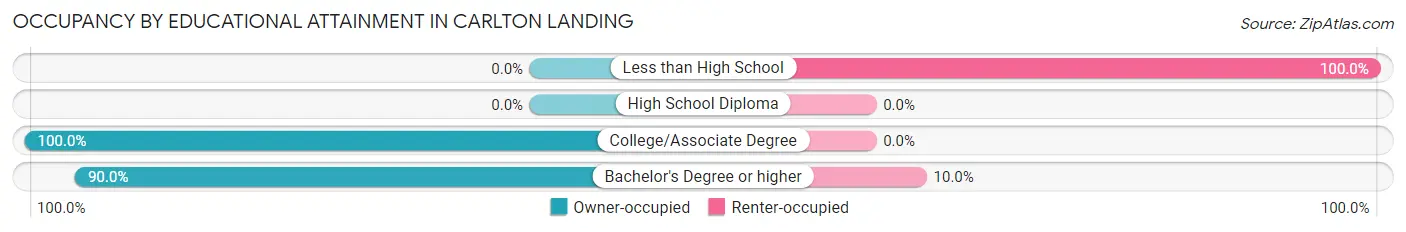
| Household Size | Owner-occupied | Renter-occupied |
| Less than High School | 0 (0.0%) | 3 (100.0%) |
| High School Diploma | 0 (0.0%) | 0 (0.0%) |
| College/Associate Degree | 4 (100.0%) | 0 (0.0%) |
| Bachelor's Degree or higher | 9 (90.0%) | 1 (10.0%) |
Occupancy by Age of Householder in Carlton Landing
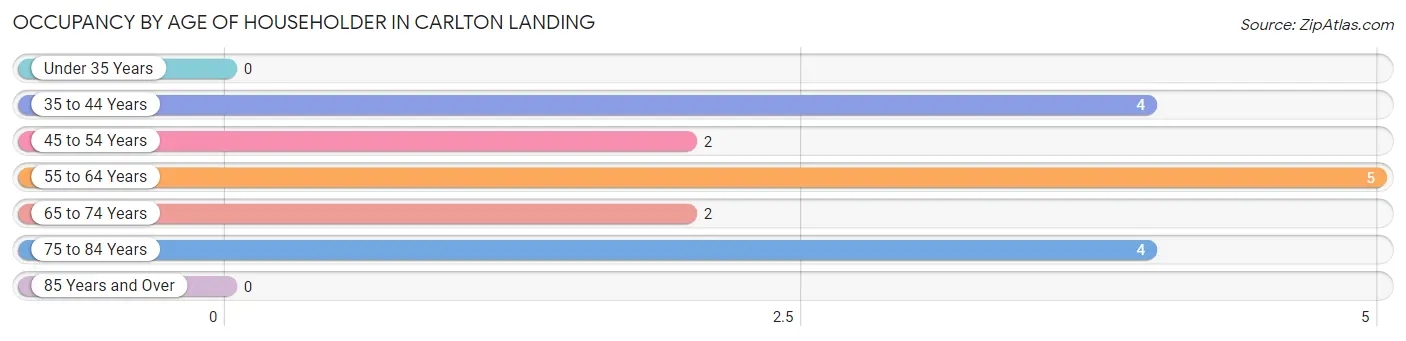
| Age Bracket | # Households | % Households |
| Under 35 Years | 0 | 0.0% |
| 35 to 44 Years | 4 | 23.5% |
| 45 to 54 Years | 2 | 11.8% |
| 55 to 64 Years | 5 | 29.4% |
| 65 to 74 Years | 2 | 11.8% |
| 75 to 84 Years | 4 | 23.5% |
| 85 Years and Over | 0 | 0.0% |
| Total | 17 | 100.0% |
Housing Finances in Carlton Landing
Median Income by Occupancy in Carlton Landing
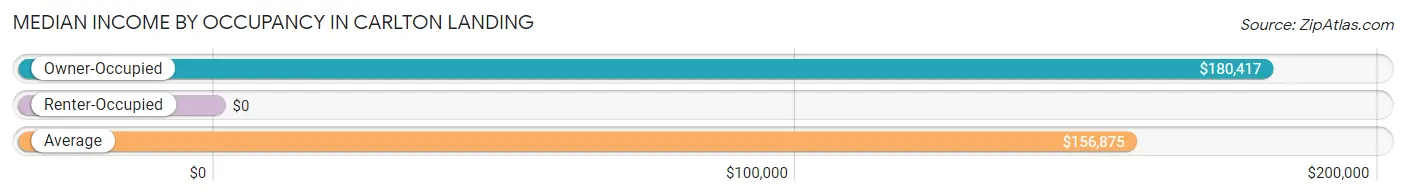
| Occupancy Type | # Households | Median Income |
| Owner-Occupied | 13 (76.5%) | $180,417 |
| Renter-Occupied | 4 (23.5%) | $0 |
| Average | 17 (100.0%) | $156,875 |
Occupancy by Householder Income Bracket in Carlton Landing
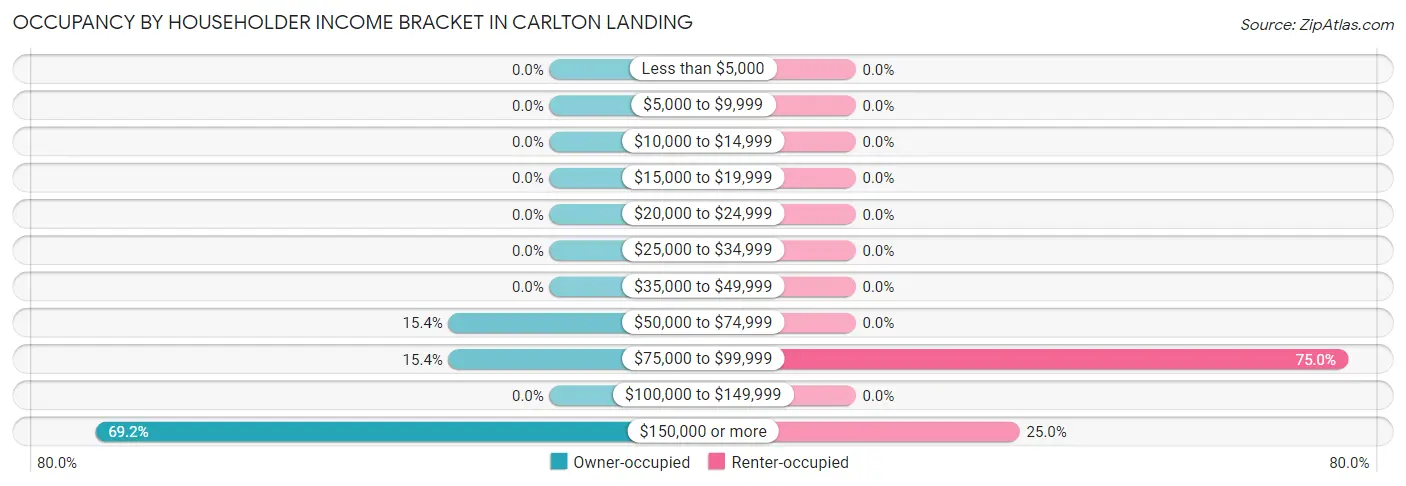
| Income Bracket | Owner-occupied | Renter-occupied |
| Less than $5,000 | 0 (0.0%) | 0 (0.0%) |
| $5,000 to $9,999 | 0 (0.0%) | 0 (0.0%) |
| $10,000 to $14,999 | 0 (0.0%) | 0 (0.0%) |
| $15,000 to $19,999 | 0 (0.0%) | 0 (0.0%) |
| $20,000 to $24,999 | 0 (0.0%) | 0 (0.0%) |
| $25,000 to $34,999 | 0 (0.0%) | 0 (0.0%) |
| $35,000 to $49,999 | 0 (0.0%) | 0 (0.0%) |
| $50,000 to $74,999 | 2 (15.4%) | 0 (0.0%) |
| $75,000 to $99,999 | 2 (15.4%) | 3 (75.0%) |
| $100,000 to $149,999 | 0 (0.0%) | 0 (0.0%) |
| $150,000 or more | 9 (69.2%) | 1 (25.0%) |
| Total | 13 (100.0%) | 4 (100.0%) |
Monthly Housing Cost Tiers in Carlton Landing
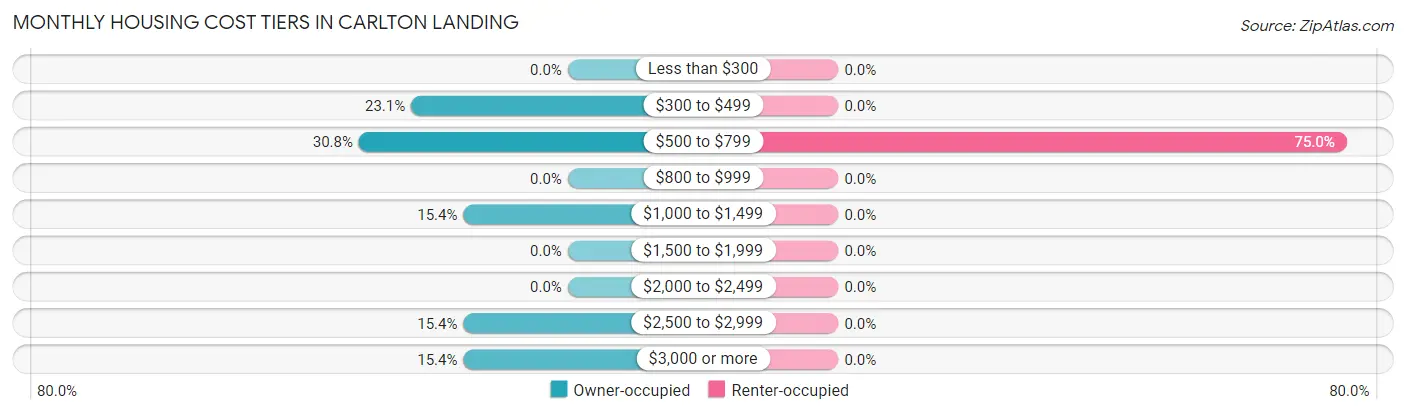
| Monthly Cost | Owner-occupied | Renter-occupied |
| Less than $300 | 0 (0.0%) | 0 (0.0%) |
| $300 to $499 | 3 (23.1%) | 0 (0.0%) |
| $500 to $799 | 4 (30.8%) | 3 (75.0%) |
| $800 to $999 | 0 (0.0%) | 0 (0.0%) |
| $1,000 to $1,499 | 2 (15.4%) | 0 (0.0%) |
| $1,500 to $1,999 | 0 (0.0%) | 0 (0.0%) |
| $2,000 to $2,499 | 0 (0.0%) | 0 (0.0%) |
| $2,500 to $2,999 | 2 (15.4%) | 0 (0.0%) |
| $3,000 or more | 2 (15.4%) | 0 (0.0%) |
| Total | 13 (100.0%) | 4 (100.0%) |
Physical Housing Characteristics in Carlton Landing
Housing Structures in Carlton Landing
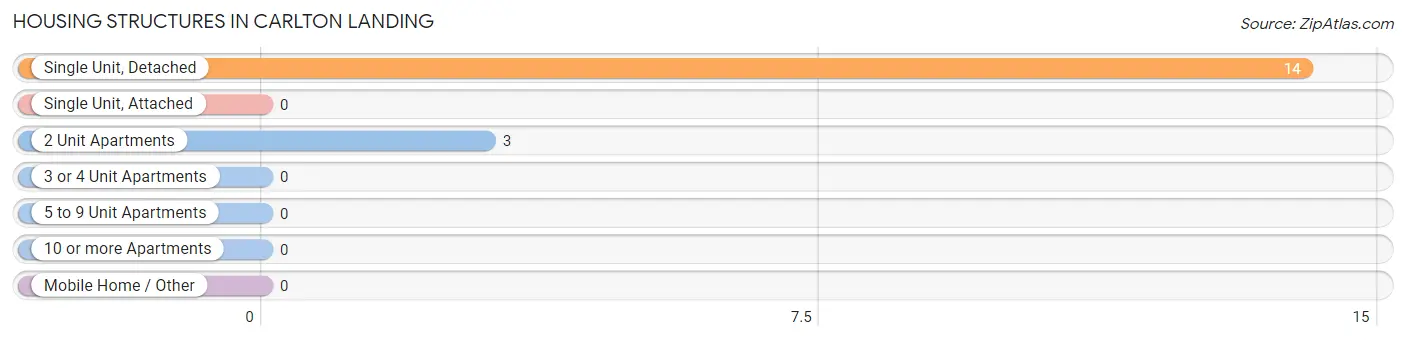
| Structure Type | # Housing Units | % Housing Units |
| Single Unit, Detached | 14 | 82.4% |
| Single Unit, Attached | 0 | 0.0% |
| 2 Unit Apartments | 3 | 17.6% |
| 3 or 4 Unit Apartments | 0 | 0.0% |
| 5 to 9 Unit Apartments | 0 | 0.0% |
| 10 or more Apartments | 0 | 0.0% |
| Mobile Home / Other | 0 | 0.0% |
| Total | 17 | 100.0% |
Housing Structures by Occupancy in Carlton Landing
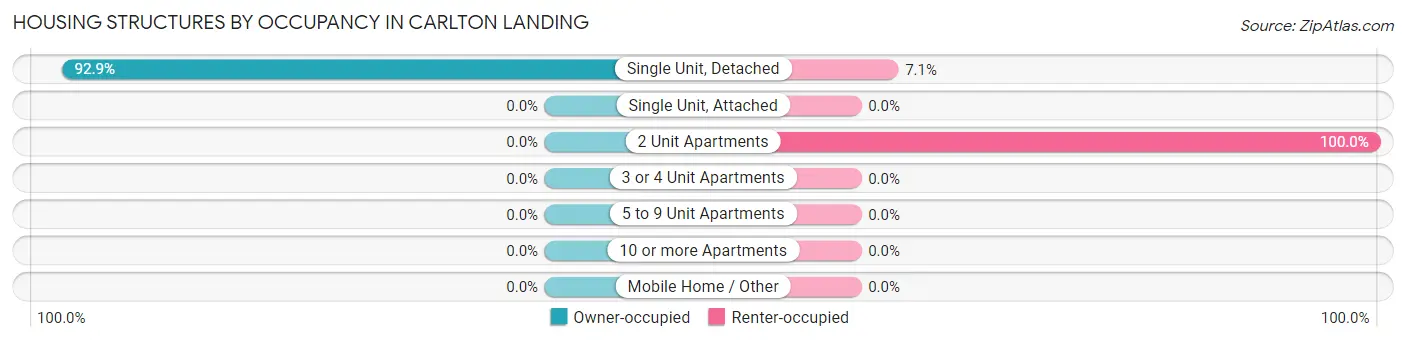
| Structure Type | Owner-occupied | Renter-occupied |
| Single Unit, Detached | 13 (92.9%) | 1 (7.1%) |
| Single Unit, Attached | 0 (0.0%) | 0 (0.0%) |
| 2 Unit Apartments | 0 (0.0%) | 3 (100.0%) |
| 3 or 4 Unit Apartments | 0 (0.0%) | 0 (0.0%) |
| 5 to 9 Unit Apartments | 0 (0.0%) | 0 (0.0%) |
| 10 or more Apartments | 0 (0.0%) | 0 (0.0%) |
| Mobile Home / Other | 0 (0.0%) | 0 (0.0%) |
| Total | 13 (76.5%) | 4 (23.5%) |
Housing Structures by Number of Rooms in Carlton Landing
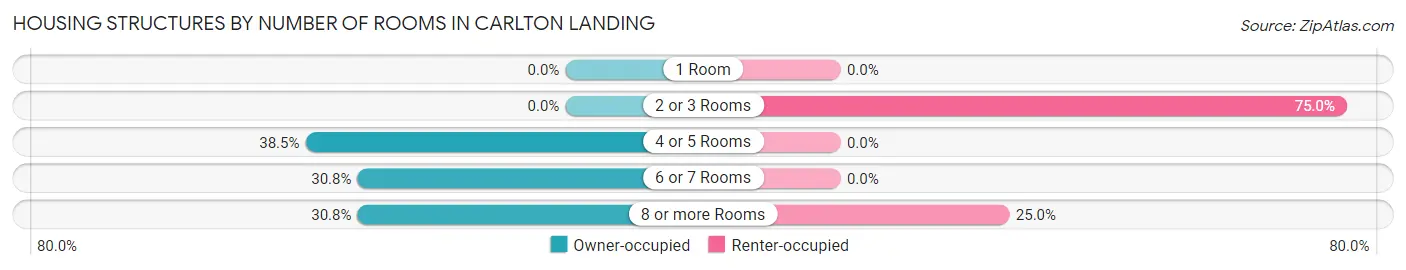
| Number of Rooms | Owner-occupied | Renter-occupied |
| 1 Room | 0 (0.0%) | 0 (0.0%) |
| 2 or 3 Rooms | 0 (0.0%) | 3 (75.0%) |
| 4 or 5 Rooms | 5 (38.5%) | 0 (0.0%) |
| 6 or 7 Rooms | 4 (30.8%) | 0 (0.0%) |
| 8 or more Rooms | 4 (30.8%) | 1 (25.0%) |
| Total | 13 (100.0%) | 4 (100.0%) |
Housing Structure by Heating Type in Carlton Landing
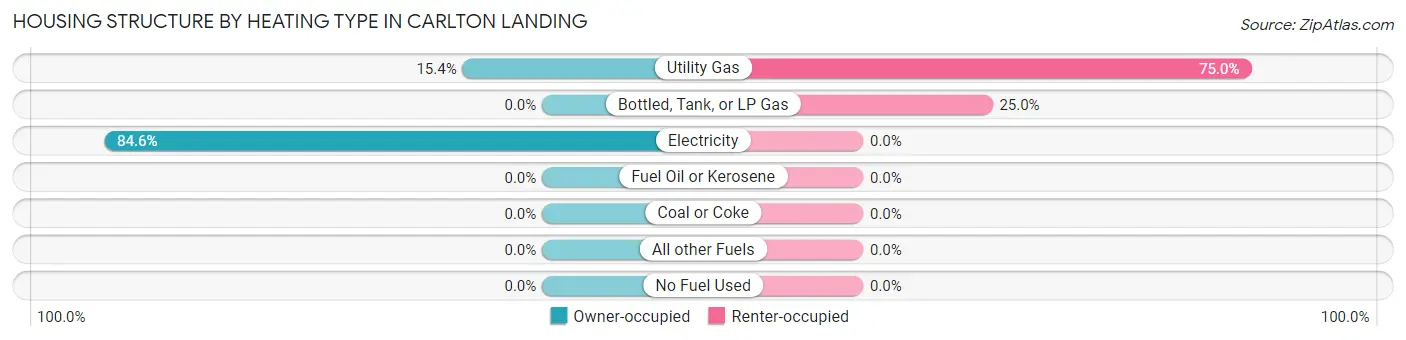
| Heating Type | Owner-occupied | Renter-occupied |
| Utility Gas | 2 (15.4%) | 3 (75.0%) |
| Bottled, Tank, or LP Gas | 0 (0.0%) | 1 (25.0%) |
| Electricity | 11 (84.6%) | 0 (0.0%) |
| Fuel Oil or Kerosene | 0 (0.0%) | 0 (0.0%) |
| Coal or Coke | 0 (0.0%) | 0 (0.0%) |
| All other Fuels | 0 (0.0%) | 0 (0.0%) |
| No Fuel Used | 0 (0.0%) | 0 (0.0%) |
| Total | 13 (100.0%) | 4 (100.0%) |
Household Vehicle Usage in Carlton Landing
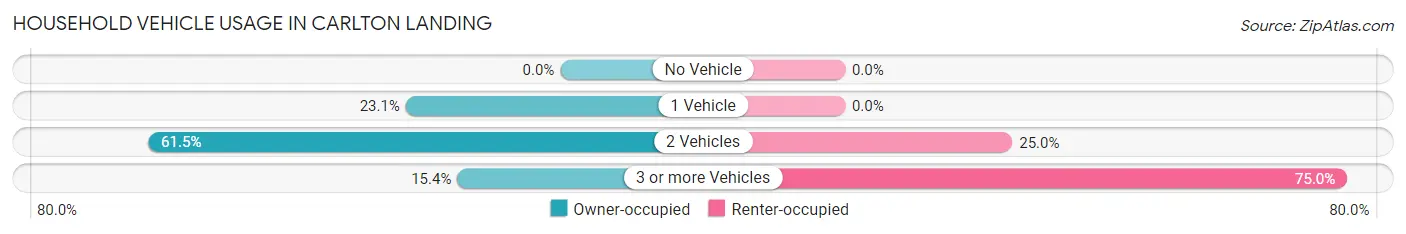
| Vehicles per Household | Owner-occupied | Renter-occupied |
| No Vehicle | 0 (0.0%) | 0 (0.0%) |
| 1 Vehicle | 3 (23.1%) | 0 (0.0%) |
| 2 Vehicles | 8 (61.5%) | 1 (25.0%) |
| 3 or more Vehicles | 2 (15.4%) | 3 (75.0%) |
| Total | 13 (100.0%) | 4 (100.0%) |
Real Estate & Mortgages in Carlton Landing
Real Estate and Mortgage Overview in Carlton Landing
| Characteristic | Without Mortgage | With Mortgage |
| Housing Units | 6 | 7 |
| Median Property Value | $562,500 | $0 |
| Median Household Income | - | - |
| Monthly Housing Costs | $675 | $2 |
| Real Estate Taxes | $4,500 | $0 |
Property Value by Mortgage Status in Carlton Landing
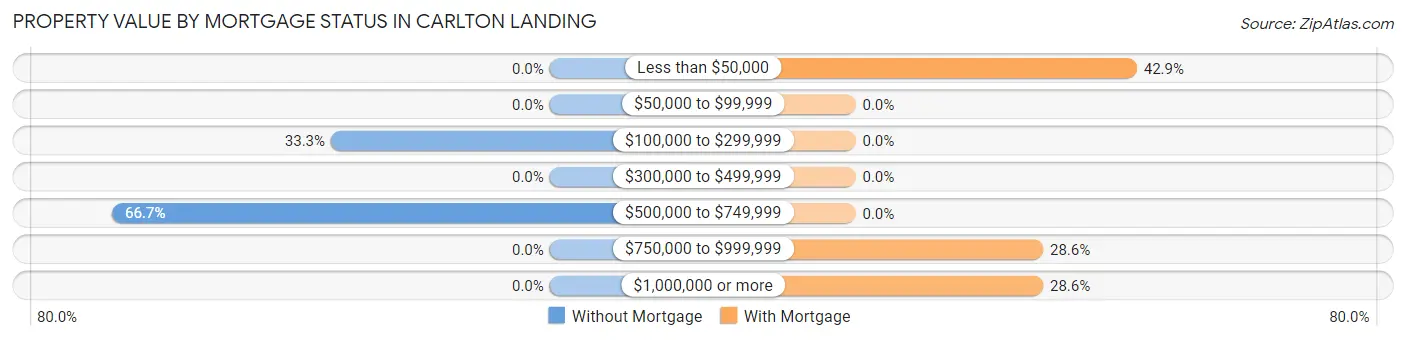
| Property Value | Without Mortgage | With Mortgage |
| Less than $50,000 | 0 (0.0%) | 3 (42.9%) |
| $50,000 to $99,999 | 0 (0.0%) | 0 (0.0%) |
| $100,000 to $299,999 | 2 (33.3%) | 0 (0.0%) |
| $300,000 to $499,999 | 0 (0.0%) | 0 (0.0%) |
| $500,000 to $749,999 | 4 (66.7%) | 0 (0.0%) |
| $750,000 to $999,999 | 0 (0.0%) | 2 (28.6%) |
| $1,000,000 or more | 0 (0.0%) | 2 (28.6%) |
| Total | 6 (100.0%) | 7 (100.0%) |
Household Income by Mortgage Status in Carlton Landing
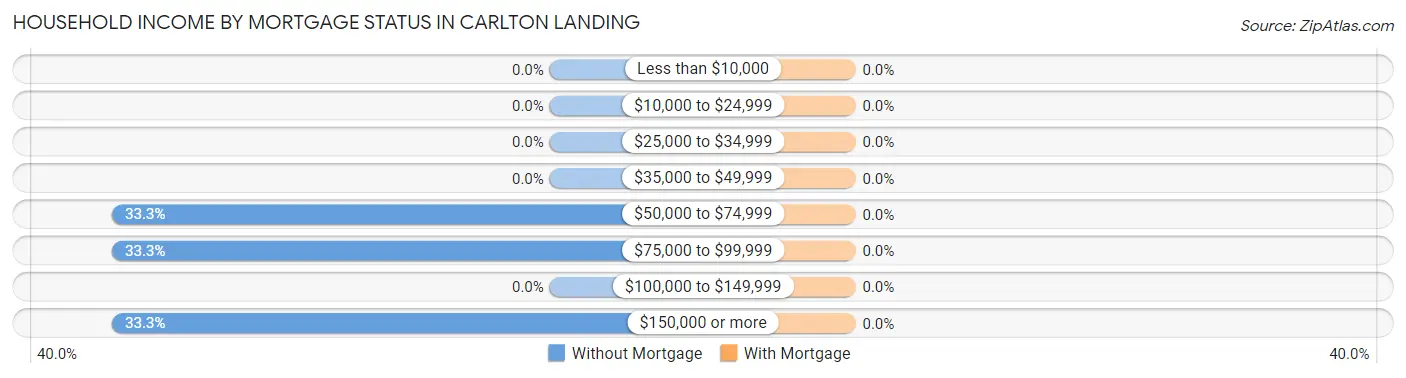
| Household Income | Without Mortgage | With Mortgage |
| Less than $10,000 | 0 (0.0%) | 0 (0.0%) |
| $10,000 to $24,999 | 0 (0.0%) | 0 (0.0%) |
| $25,000 to $34,999 | 0 (0.0%) | 0 (0.0%) |
| $35,000 to $49,999 | 0 (0.0%) | 0 (0.0%) |
| $50,000 to $74,999 | 2 (33.3%) | 0 (0.0%) |
| $75,000 to $99,999 | 2 (33.3%) | 0 (0.0%) |
| $100,000 to $149,999 | 0 (0.0%) | 0 (0.0%) |
| $150,000 or more | 2 (33.3%) | 0 (0.0%) |
| Total | 6 (100.0%) | 7 (100.0%) |
Property Value to Household Income Ratio in Carlton Landing
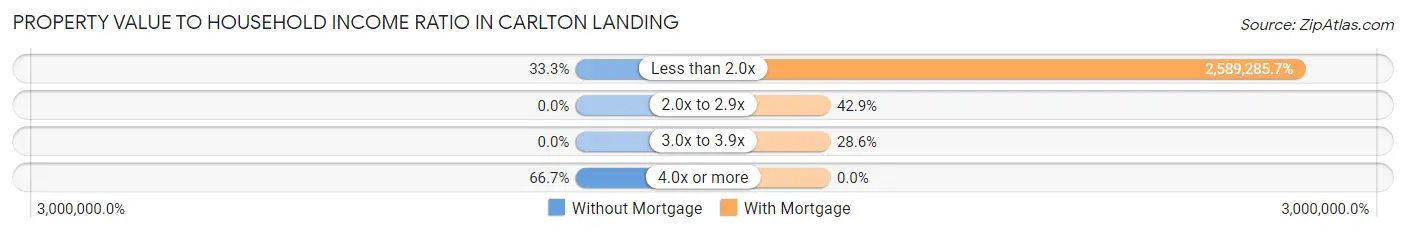
| Value-to-Income Ratio | Without Mortgage | With Mortgage |
| Less than 2.0x | 2 (33.3%) | 181,250 (2,589,285.7%) |
| 2.0x to 2.9x | 0 (0.0%) | 3 (42.9%) |
| 3.0x to 3.9x | 0 (0.0%) | 2 (28.6%) |
| 4.0x or more | 4 (66.7%) | 0 (0.0%) |
| Total | 6 (100.0%) | 7 (100.0%) |
Real Estate Taxes by Mortgage Status in Carlton Landing
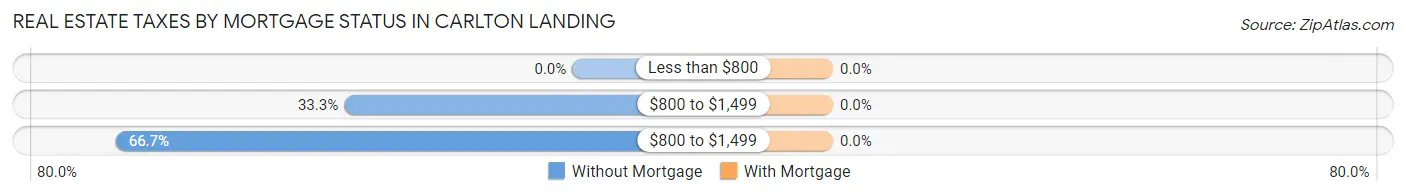
| Property Taxes | Without Mortgage | With Mortgage |
| Less than $800 | 0 (0.0%) | 0 (0.0%) |
| $800 to $1,499 | 2 (33.3%) | 0 (0.0%) |
| $800 to $1,499 | 4 (66.7%) | 0 (0.0%) |
| Total | 6 (100.0%) | 7 (100.0%) |
Health & Disability in Carlton Landing
Health Insurance Coverage by Age in Carlton Landing
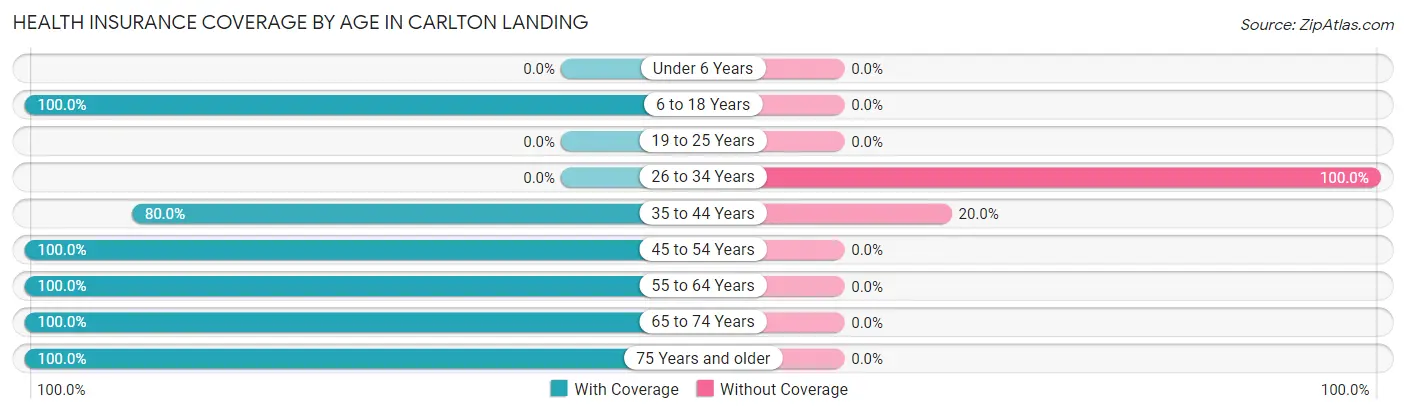
| Age Bracket | With Coverage | Without Coverage |
| Under 6 Years | 0 (0.0%) | 0 (0.0%) |
| 6 to 18 Years | 12 (100.0%) | 0 (0.0%) |
| 19 to 25 Years | 0 (0.0%) | 0 (0.0%) |
| 26 to 34 Years | 0 (0.0%) | 2 (100.0%) |
| 35 to 44 Years | 4 (80.0%) | 1 (20.0%) |
| 45 to 54 Years | 5 (100.0%) | 0 (0.0%) |
| 55 to 64 Years | 7 (100.0%) | 0 (0.0%) |
| 65 to 74 Years | 5 (100.0%) | 0 (0.0%) |
| 75 Years and older | 7 (100.0%) | 0 (0.0%) |
| Total | 40 (93.0%) | 3 (7.0%) |
Health Insurance Coverage by Citizenship Status in Carlton Landing
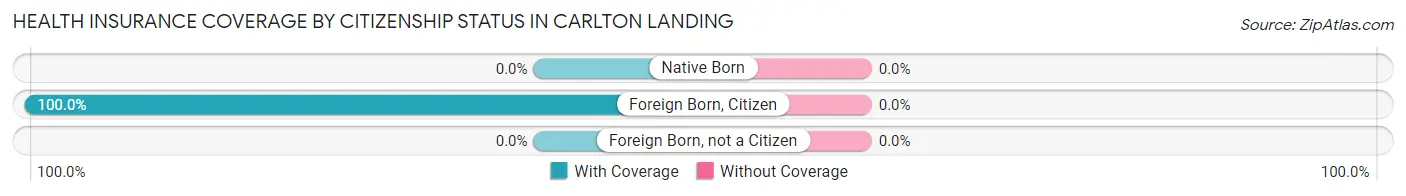
| Citizenship Status | With Coverage | Without Coverage |
| Native Born | 0 (0.0%) | 0 (0.0%) |
| Foreign Born, Citizen | 12 (100.0%) | 0 (0.0%) |
| Foreign Born, not a Citizen | 0 (0.0%) | 0 (0.0%) |
Health Insurance Coverage by Household Income in Carlton Landing
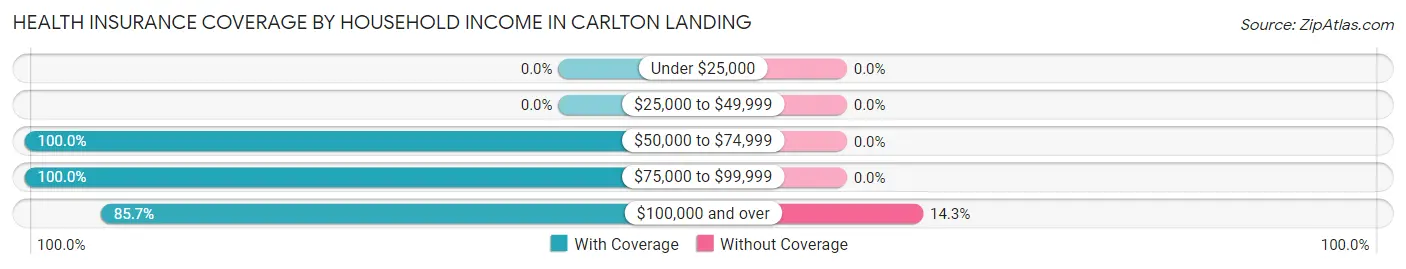
| Household Income | With Coverage | Without Coverage |
| Under $25,000 | 0 (0.0%) | 0 (0.0%) |
| $25,000 to $49,999 | 0 (0.0%) | 0 (0.0%) |
| $50,000 to $74,999 | 3 (100.0%) | 0 (0.0%) |
| $75,000 to $99,999 | 19 (100.0%) | 0 (0.0%) |
| $100,000 and over | 18 (85.7%) | 3 (14.3%) |
Public vs Private Health Insurance Coverage by Age in Carlton Landing
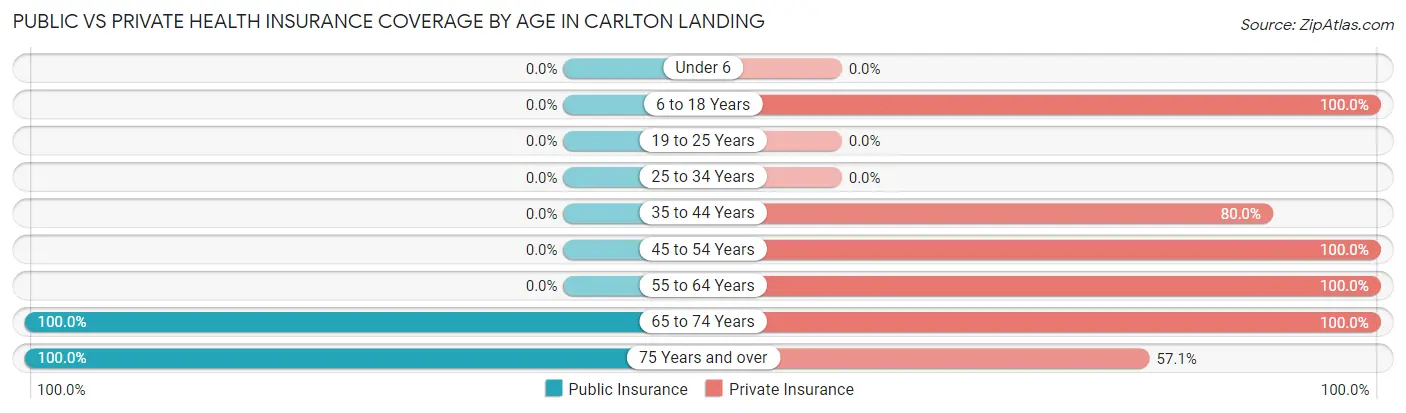
| Age Bracket | Public Insurance | Private Insurance |
| Under 6 | 0 (0.0%) | 0 (0.0%) |
| 6 to 18 Years | 0 (0.0%) | 12 (100.0%) |
| 19 to 25 Years | 0 (0.0%) | 0 (0.0%) |
| 25 to 34 Years | 0 (0.0%) | 0 (0.0%) |
| 35 to 44 Years | 0 (0.0%) | 4 (80.0%) |
| 45 to 54 Years | 0 (0.0%) | 5 (100.0%) |
| 55 to 64 Years | 0 (0.0%) | 7 (100.0%) |
| 65 to 74 Years | 5 (100.0%) | 5 (100.0%) |
| 75 Years and over | 7 (100.0%) | 4 (57.1%) |
| Total | 12 (27.9%) | 37 (86.1%) |
Disability Status by Sex by Age in Carlton Landing
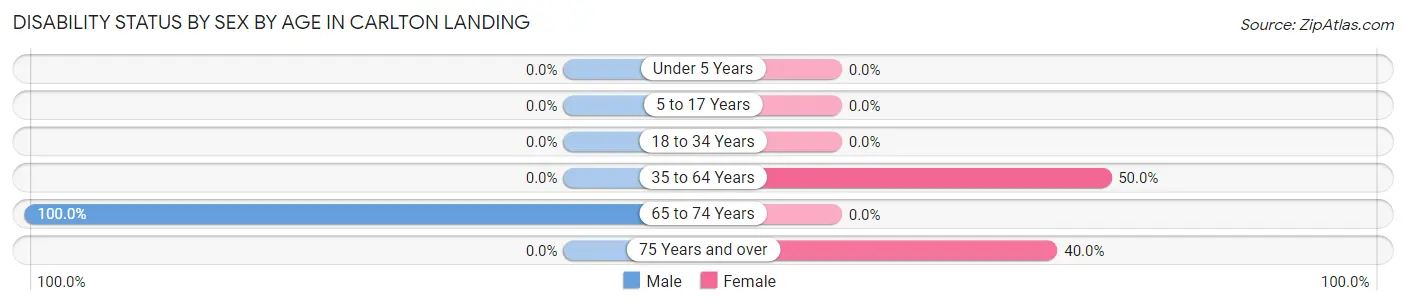
| Age Bracket | Male | Female |
| Under 5 Years | 0 (0.0%) | 0 (0.0%) |
| 5 to 17 Years | 0 (0.0%) | 0 (0.0%) |
| 18 to 34 Years | 0 (0.0%) | 0 (0.0%) |
| 35 to 64 Years | 0 (0.0%) | 3 (50.0%) |
| 65 to 74 Years | 2 (100.0%) | 0 (0.0%) |
| 75 Years and over | 0 (0.0%) | 2 (40.0%) |
Disability Class by Sex by Age in Carlton Landing
Disability Class: Hearing Difficulty
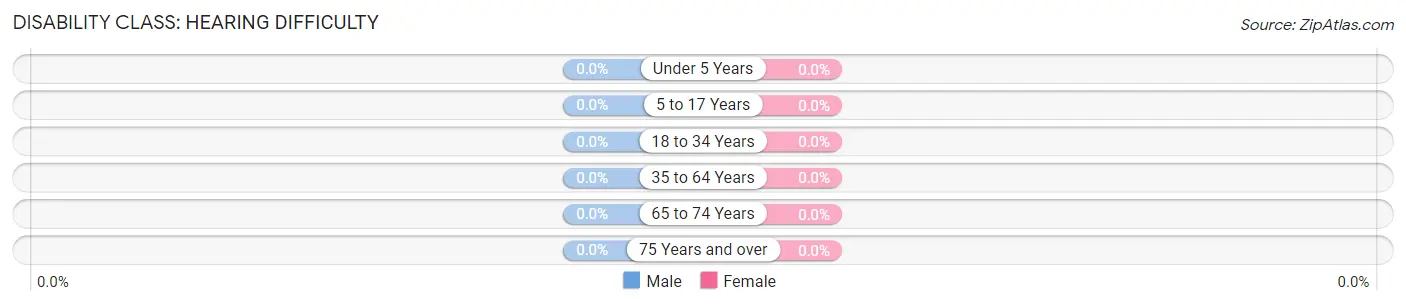
| Age Bracket | Male | Female |
| Under 5 Years | 0 (0.0%) | 0 (0.0%) |
| 5 to 17 Years | 0 (0.0%) | 0 (0.0%) |
| 18 to 34 Years | 0 (0.0%) | 0 (0.0%) |
| 35 to 64 Years | 0 (0.0%) | 0 (0.0%) |
| 65 to 74 Years | 0 (0.0%) | 0 (0.0%) |
| 75 Years and over | 0 (0.0%) | 0 (0.0%) |
Disability Class: Vision Difficulty
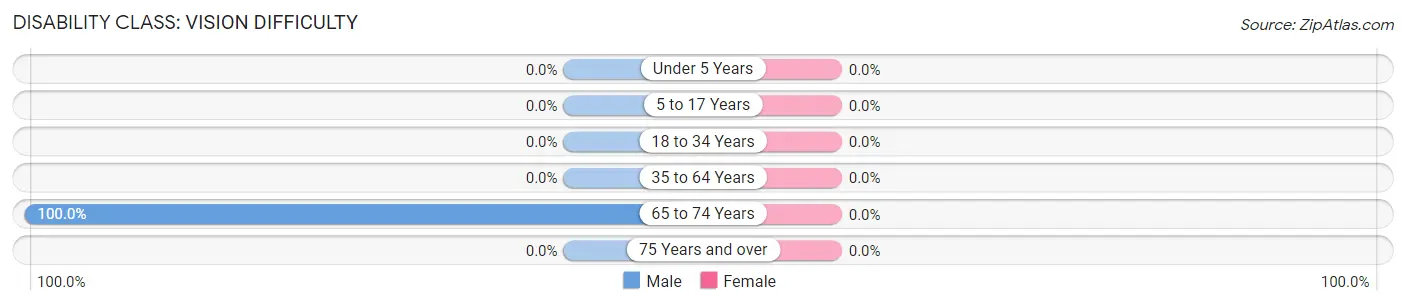
| Age Bracket | Male | Female |
| Under 5 Years | 0 (0.0%) | 0 (0.0%) |
| 5 to 17 Years | 0 (0.0%) | 0 (0.0%) |
| 18 to 34 Years | 0 (0.0%) | 0 (0.0%) |
| 35 to 64 Years | 0 (0.0%) | 0 (0.0%) |
| 65 to 74 Years | 2 (100.0%) | 0 (0.0%) |
| 75 Years and over | 0 (0.0%) | 0 (0.0%) |
Disability Class: Cognitive Difficulty

| Age Bracket | Male | Female |
| 5 to 17 Years | 0 (0.0%) | 0 (0.0%) |
| 18 to 34 Years | 0 (0.0%) | 0 (0.0%) |
| 35 to 64 Years | 0 (0.0%) | 0 (0.0%) |
| 65 to 74 Years | 0 (0.0%) | 0 (0.0%) |
| 75 Years and over | 0 (0.0%) | 0 (0.0%) |
Disability Class: Ambulatory Difficulty
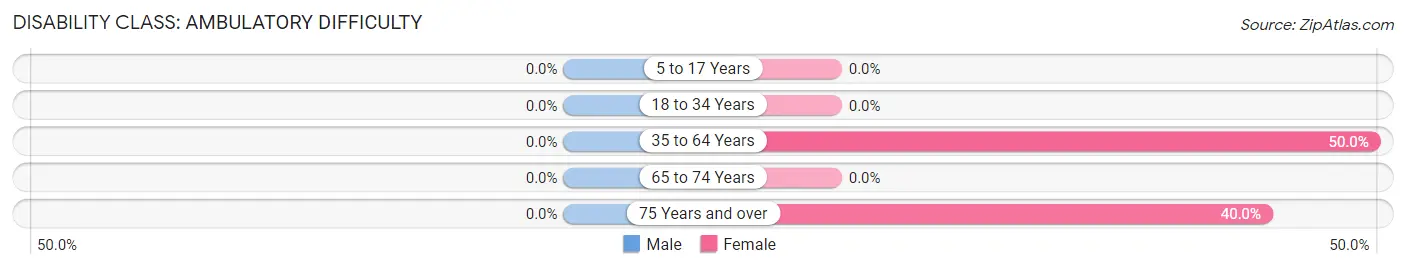
| Age Bracket | Male | Female |
| 5 to 17 Years | 0 (0.0%) | 0 (0.0%) |
| 18 to 34 Years | 0 (0.0%) | 0 (0.0%) |
| 35 to 64 Years | 0 (0.0%) | 3 (50.0%) |
| 65 to 74 Years | 0 (0.0%) | 0 (0.0%) |
| 75 Years and over | 0 (0.0%) | 2 (40.0%) |
Disability Class: Self-Care Difficulty
| Age Bracket | Male | Female |
| 5 to 17 Years | 0 (0.0%) | 0 (0.0%) |
| 18 to 34 Years | 0 (0.0%) | 0 (0.0%) |
| 35 to 64 Years | 0 (0.0%) | 0 (0.0%) |
| 65 to 74 Years | 0 (0.0%) | 0 (0.0%) |
| 75 Years and over | 0 (0.0%) | 0 (0.0%) |
Technology Access in Carlton Landing
Computing Device Access in Carlton Landing
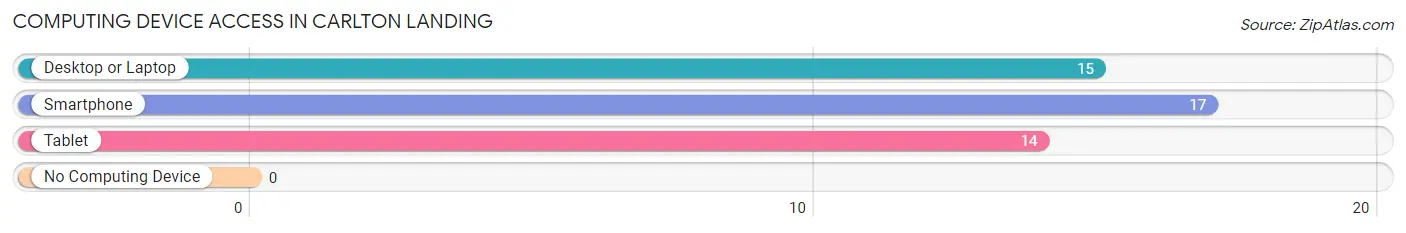
| Device Type | # Households | % Households |
| Desktop or Laptop | 15 | 88.2% |
| Smartphone | 17 | 100.0% |
| Tablet | 14 | 82.4% |
| No Computing Device | 0 | 0.0% |
| Total | 17 | 100.0% |
Internet Access in Carlton Landing
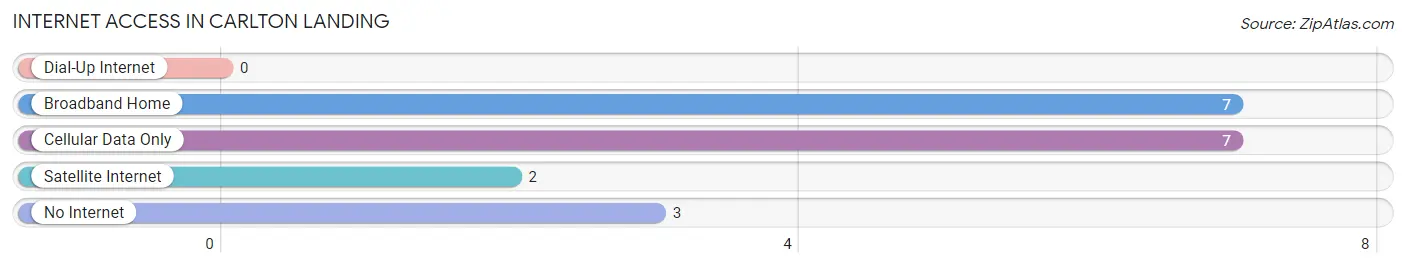
| Internet Type | # Households | % Households |
| Dial-Up Internet | 0 | 0.0% |
| Broadband Home | 7 | 41.2% |
| Cellular Data Only | 7 | 41.2% |
| Satellite Internet | 2 | 11.8% |
| No Internet | 3 | 17.6% |
| Total | 17 | 100.0% |
Carlton Landing Summary
Carlton Landing is a small town located in the state of Oklahoma, in the United States. It is situated in the southeastern part of the state, in the county of Pontotoc. The town was founded in the late 1800s by a group of settlers from the Choctaw Nation. The town was named after the Choctaw chief, John Carlton.
Geography
Carlton Landing is located in the southeastern part of Oklahoma, in the county of Pontotoc. It is situated on the banks of Lake Eufaula, which is the largest lake in the state. The town is located about 30 miles east of the city of Ada, and about 50 miles south of the city of Tulsa. The town is surrounded by rolling hills and wooded areas, and is known for its beautiful scenery.
The climate in Carlton Landing is generally mild, with temperatures ranging from the mid-50s in the winter to the mid-80s in the summer. The town receives an average of about 40 inches of rain per year, and is known for its mild winters and hot summers.
Economy
The economy of Carlton Landing is largely based on tourism. The town is home to several resorts and hotels, as well as a number of restaurants and shops. The town is also home to a number of marinas, which offer boat rentals and fishing charters.
The town is also home to a number of manufacturing and industrial businesses, including a paper mill and a furniture factory. The town is also home to a number of agricultural businesses, including a dairy farm and a number of cattle ranches.
Demographics
As of the 2010 census, the population of Carlton Landing was 1,845. The town is predominantly white, with about 90% of the population being white. The town also has a small Hispanic population, with about 5% of the population being Hispanic. The town also has a small African American population, with about 2% of the population being African American.
The median household income in Carlton Landing is about $35,000, which is slightly lower than the national average. The town also has a higher than average poverty rate, with about 20% of the population living below the poverty line.
Conclusion
Carlton Landing is a small town located in the southeastern part of Oklahoma. The town is known for its beautiful scenery and mild climate, and is a popular tourist destination. The town is also home to a number of manufacturing and industrial businesses, as well as a number of agricultural businesses. The town has a predominantly white population, with a small Hispanic and African American population. The town has a median household income of about $35,000, and a higher than average poverty rate.
Common Questions
What is Per Capita Income in Carlton Landing?
Per Capita income in Carlton Landing is $67,205.
What is the Median Household income in Carlton Landing?
Median Household Income in Carlton Landing is $156,875.
What is Inequality or Gini Index in Carlton Landing?
Inequality or Gini Index in Carlton Landing is 0.33.
What is the Total Population of Carlton Landing?
Total Population of Carlton Landing is 43.
What is the Total Male Population of Carlton Landing?
Total Male Population of Carlton Landing is 22.
What is the Total Female Population of Carlton Landing?
Total Female Population of Carlton Landing is 21.
What is the Ratio of Males per 100 Females in Carlton Landing?
There are 104.76 Males per 100 Females in Carlton Landing.
What is the Ratio of Females per 100 Males in Carlton Landing?
There are 95.45 Females per 100 Males in Carlton Landing.
What is the Median Population Age in Carlton Landing?
Median Population Age in Carlton Landing is 54.2 Years.
What is the Average Family Size in Carlton Landing
Average Family Size in Carlton Landing is 3.4 People.
What is the Average Household Size in Carlton Landing
Average Household Size in Carlton Landing is 2.5 People.
How Large is the Labor Force in Carlton Landing?
There are 19 People in the Labor Forcein in Carlton Landing.
What is the Percentage of People in the Labor Force in Carlton Landing?
61.3% of People are in the Labor Force in Carlton Landing.