Chewey, OK Map & Demographics
Chewey Map
Chewey Overview
$16,459
PER CAPITA INCOME
$91,094
AVG FAMILY INCOME
$65,156
AVG HOUSEHOLD INCOME
0.39
INEQUALITY / GINI INDEX
346
TOTAL POPULATION
234
MALE POPULATION
112
FEMALE POPULATION
208.93
MALES / 100 FEMALES
47.86
FEMALES / 100 MALES
24.7
MEDIAN AGE
2.9
AVG FAMILY SIZE
2.0
AVG HOUSEHOLD SIZE
87
LABOR FORCE [ PEOPLE ]
33.2%
PERCENT IN LABOR FORCE
Income in Chewey
Income Overview in Chewey
Per Capita Income in Chewey is $16,459, while median incomes of families and households are $91,094 and $65,156 respectively.
| Characteristic | Number | Measure |
| Per Capita Income | 346 | $16,459 |
| Median Family Income | 59 | $91,094 |
| Mean Family Income | 59 | $83,458 |
| Median Household Income | 109 | $65,156 |
| Mean Household Income | 109 | $55,390 |
| Income Deficit | 59 | $0 |
| Wage / Income Gap (%) | 346 | 0.00% |
| Wage / Income Gap ($) | 346 | 100.00¢ per $1 |
| Gini / Inequality Index | 346 | 0.39 |
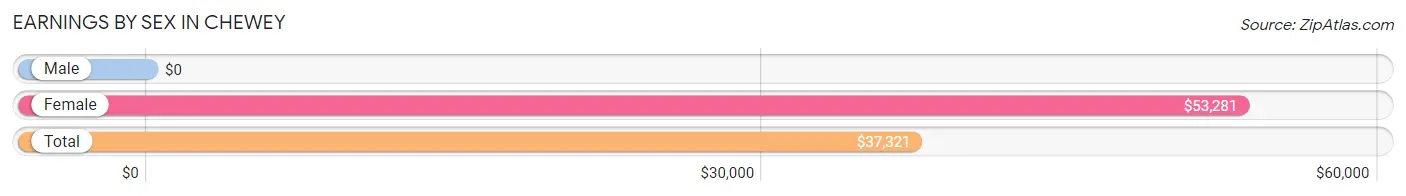
Earnings by Sex in Chewey
| Sex | Number | Average Earnings |
| Male | 58 (54.2%) | $0 |
| Female | 49 (45.8%) | $53,281 |
| Total | 107 (100.0%) | $37,321 |
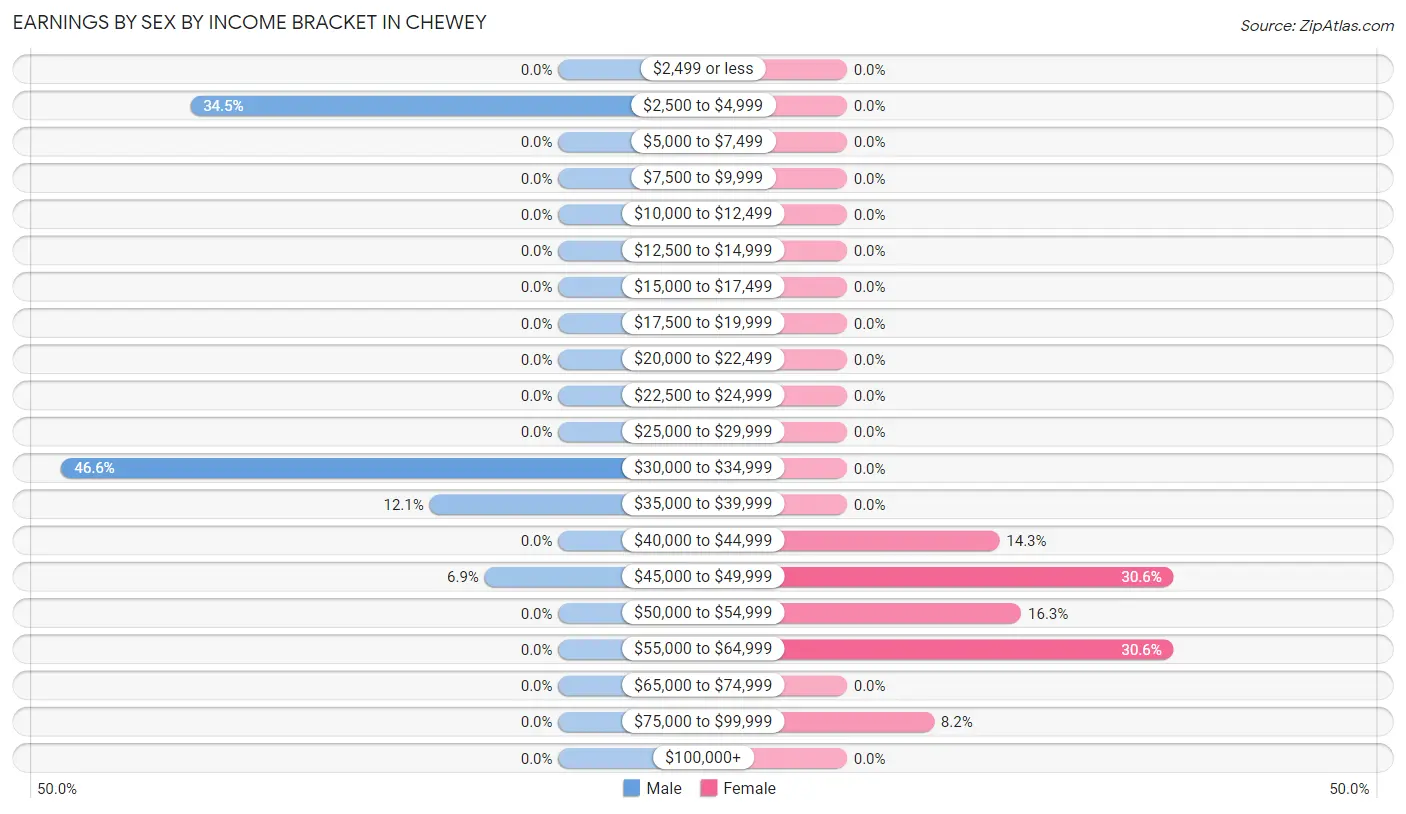
Earnings by Sex by Income Bracket in Chewey
The most common earnings brackets in Chewey are $30,000 to $34,999 for men (27 | 46.6%) and $45,000 to $49,999 for women (15 | 30.6%).
| Income | Male | Female |
| $2,499 or less | 0 (0.0%) | 0 (0.0%) |
| $2,500 to $4,999 | 20 (34.5%) | 0 (0.0%) |
| $5,000 to $7,499 | 0 (0.0%) | 0 (0.0%) |
| $7,500 to $9,999 | 0 (0.0%) | 0 (0.0%) |
| $10,000 to $12,499 | 0 (0.0%) | 0 (0.0%) |
| $12,500 to $14,999 | 0 (0.0%) | 0 (0.0%) |
| $15,000 to $17,499 | 0 (0.0%) | 0 (0.0%) |
| $17,500 to $19,999 | 0 (0.0%) | 0 (0.0%) |
| $20,000 to $22,499 | 0 (0.0%) | 0 (0.0%) |
| $22,500 to $24,999 | 0 (0.0%) | 0 (0.0%) |
| $25,000 to $29,999 | 0 (0.0%) | 0 (0.0%) |
| $30,000 to $34,999 | 27 (46.6%) | 0 (0.0%) |
| $35,000 to $39,999 | 7 (12.1%) | 0 (0.0%) |
| $40,000 to $44,999 | 0 (0.0%) | 7 (14.3%) |
| $45,000 to $49,999 | 4 (6.9%) | 15 (30.6%) |
| $50,000 to $54,999 | 0 (0.0%) | 8 (16.3%) |
| $55,000 to $64,999 | 0 (0.0%) | 15 (30.6%) |
| $65,000 to $74,999 | 0 (0.0%) | 0 (0.0%) |
| $75,000 to $99,999 | 0 (0.0%) | 4 (8.2%) |
| $100,000+ | 0 (0.0%) | 0 (0.0%) |
| Total | 58 (100.0%) | 49 (100.0%) |
Earnings by Sex by Educational Attainment in Chewey
| Educational Attainment | Male Income | Female Income |
| Less than High School | - | - |
| High School Diploma | - | - |
| College or Associate's Degree | - | - |
| Bachelor's Degree | - | - |
| Graduate Degree | - | - |
| Total | $34,259 | $53,281 |
Family Income in Chewey
Family Income Brackets in Chewey
According to the Chewey family income data, there are 36 families falling into the $75,000 to $99,999 income range, which is the most common income bracket and makes up 61.0% of all families.
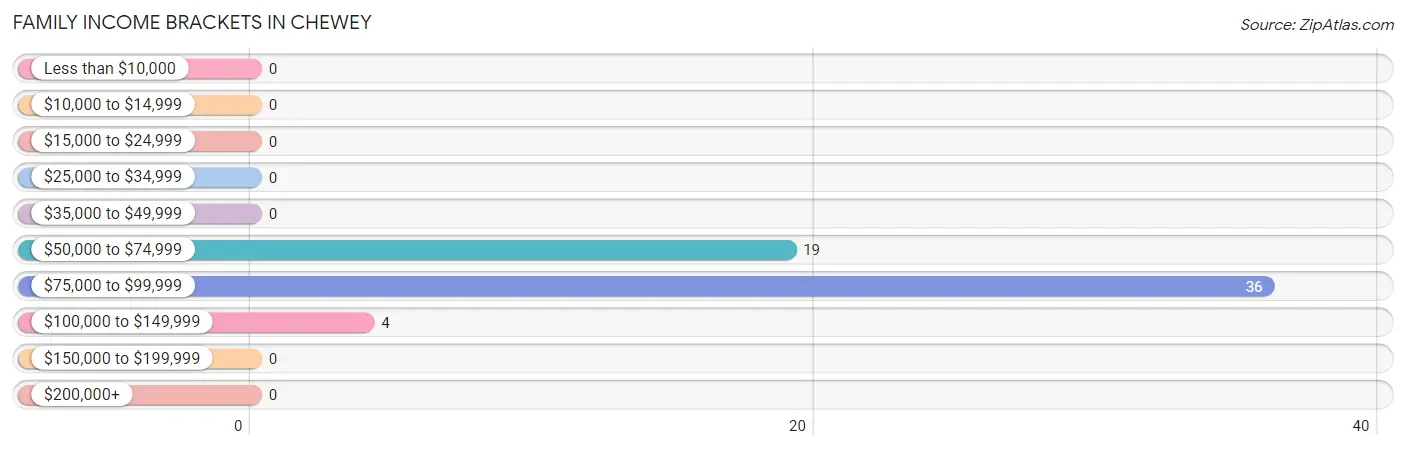
| Income Bracket | # Families | % Families |
| Less than $10,000 | 0 | 0.0% |
| $10,000 to $14,999 | 0 | 0.0% |
| $15,000 to $24,999 | 0 | 0.0% |
| $25,000 to $34,999 | 0 | 0.0% |
| $35,000 to $49,999 | 0 | 0.0% |
| $50,000 to $74,999 | 19 | 32.2% |
| $75,000 to $99,999 | 36 | 61.0% |
| $100,000 to $149,999 | 4 | 6.8% |
| $150,000 to $199,999 | 0 | 0.0% |
| $200,000+ | 0 | 0.0% |
Family Income by Famaliy Size in Chewey
2-person families (31 | 52.5%) account for the highest median family income in Chewey with $66,406 per family, while 2-person families (31 | 52.5%) have the highest median income of $33,203 per family member.
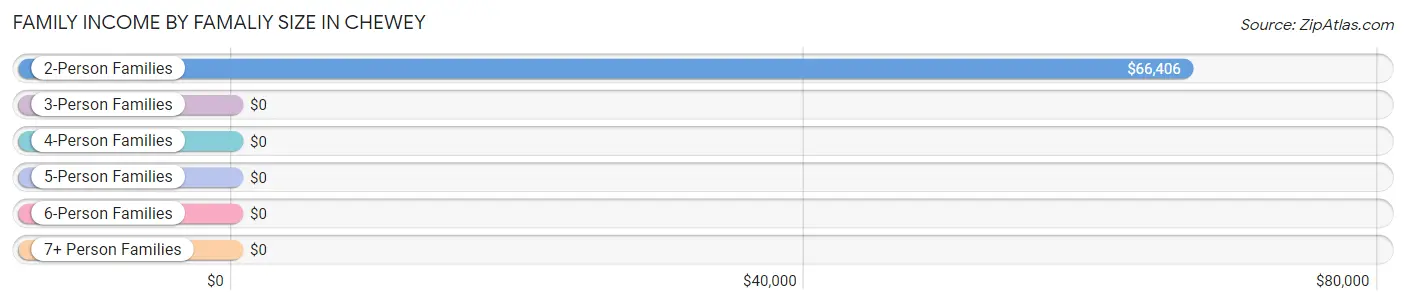
| Income Bracket | # Families | Median Income |
| 2-Person Families | 31 (52.5%) | $66,406 |
| 3-Person Families | 0 (0.0%) | $0 |
| 4-Person Families | 28 (47.5%) | $0 |
| 5-Person Families | 0 (0.0%) | $0 |
| 6-Person Families | 0 (0.0%) | $0 |
| 7+ Person Families | 0 (0.0%) | $0 |
| Total | 59 (100.0%) | $91,094 |
Family Income by Number of Earners in Chewey
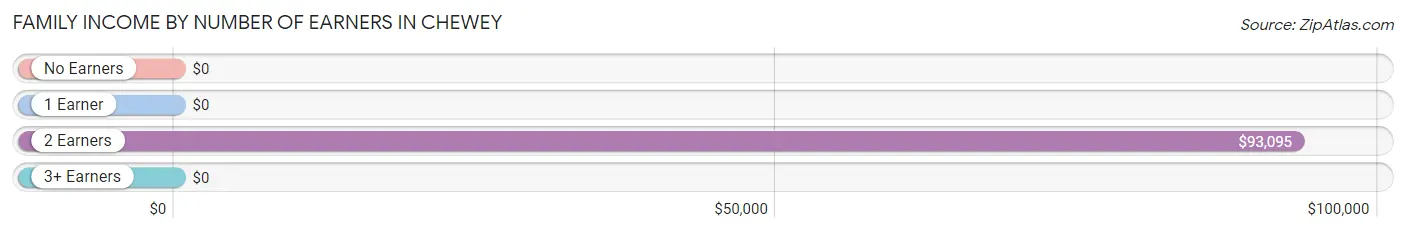
| Number of Earners | # Families | Median Income |
| No Earners | 11 (18.6%) | $0 |
| 1 Earner | 8 (13.6%) | $0 |
| 2 Earners | 40 (67.8%) | $93,095 |
| 3+ Earners | 0 (0.0%) | $0 |
| Total | 59 (100.0%) | $91,094 |
Household Income in Chewey
Household Income Brackets in Chewey
With 43 households falling in the category, the $75,000 to $99,999 income range is the most frequent in Chewey, accounting for 39.5% of all households.
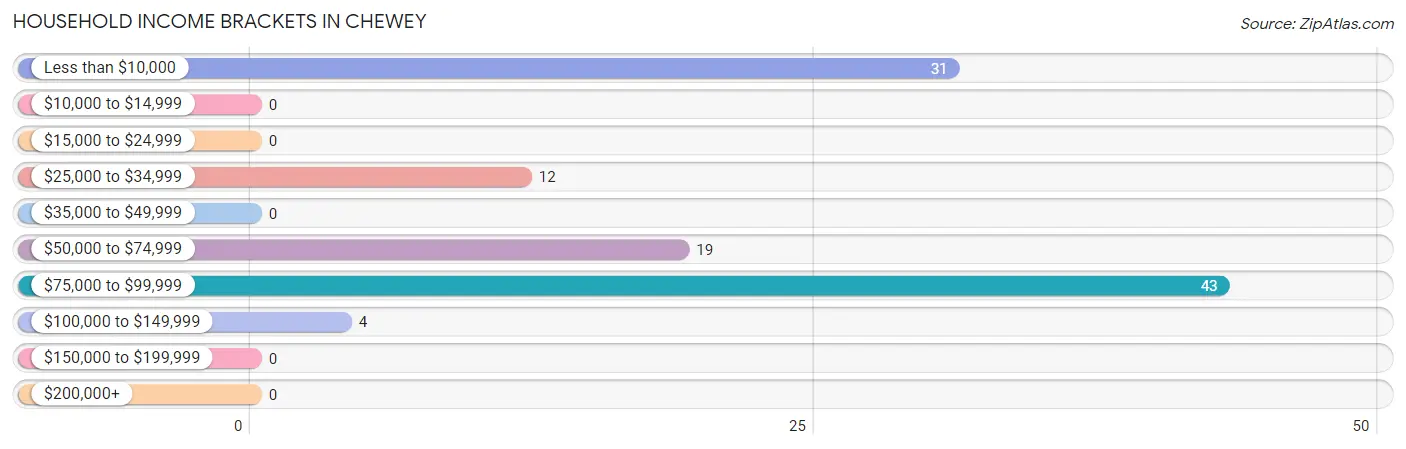
| Income Bracket | # Households | % Households |
| Less than $10,000 | 31 | 28.4% |
| $10,000 to $14,999 | 0 | 0.0% |
| $15,000 to $24,999 | 0 | 0.0% |
| $25,000 to $34,999 | 12 | 11.0% |
| $35,000 to $49,999 | 0 | 0.0% |
| $50,000 to $74,999 | 19 | 17.4% |
| $75,000 to $99,999 | 43 | 39.4% |
| $100,000 to $149,999 | 4 | 3.7% |
| $150,000 to $199,999 | 0 | 0.0% |
| $200,000+ | 0 | 0.0% |
Household Income by Householder Age in Chewey
The median household income in Chewey is $65,156, with the highest median household income of $57,614 found in the 65+ years age bracket for the primary householder. A total of 35 households (32.1%) fall into this category.
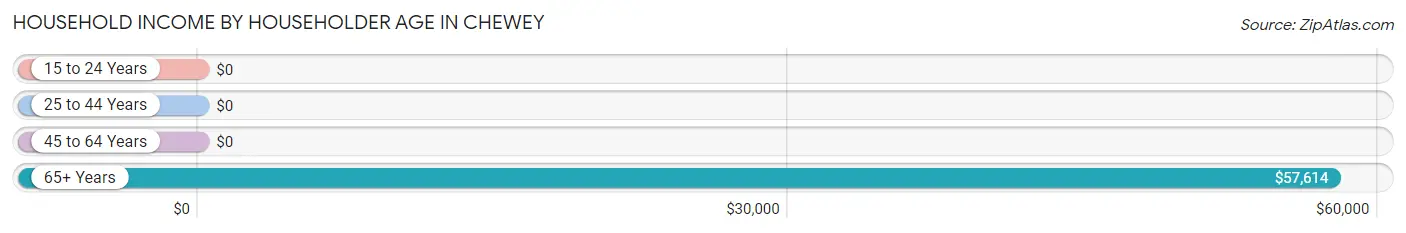
| Income Bracket | # Households | Median Income |
| 15 to 24 Years | 0 (0.0%) | $0 |
| 25 to 44 Years | 28 (25.7%) | $0 |
| 45 to 64 Years | 46 (42.2%) | $0 |
| 65+ Years | 35 (32.1%) | $57,614 |
| Total | 109 (100.0%) | $65,156 |
Poverty in Chewey
Income Below Poverty by Sex and Age in Chewey
With 59.6% poverty level for males and 4.7% for females among the residents of Chewey, 18 to 24 year old males and 75 year old and over females are the most vulnerable to poverty, with 99 males (100.0%) and 5 females (100.0%) in their respective age groups living below the poverty level.
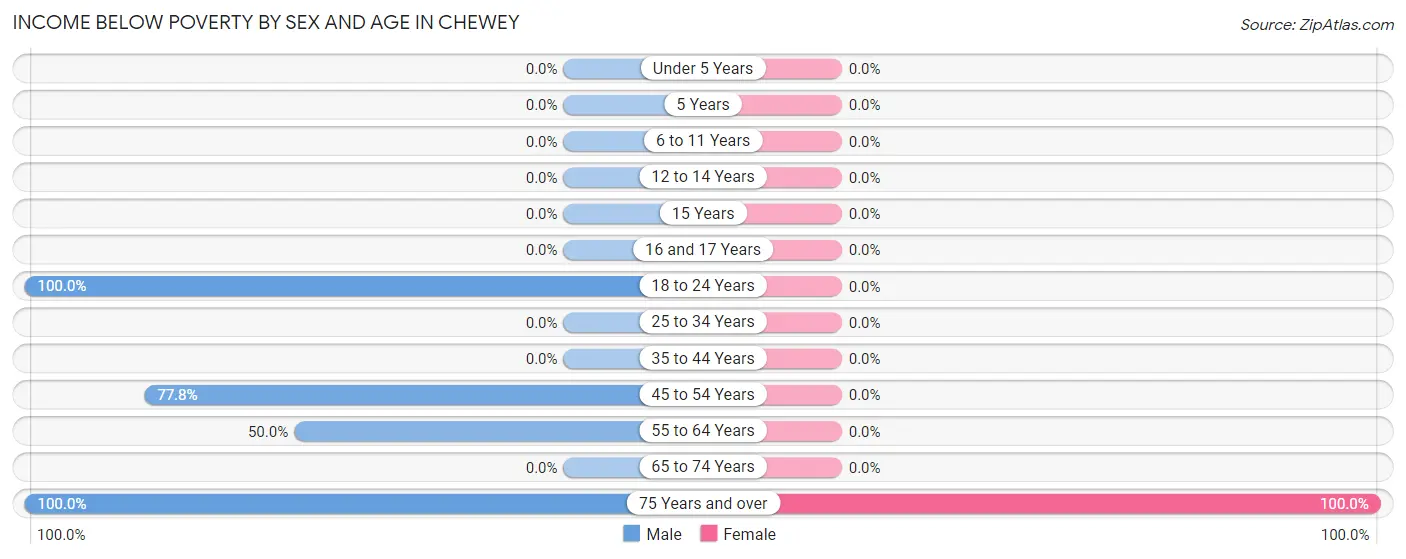
| Age Bracket | Male | Female |
| Under 5 Years | 0 (0.0%) | 0 (0.0%) |
| 5 Years | 0 (0.0%) | 0 (0.0%) |
| 6 to 11 Years | 0 (0.0%) | 0 (0.0%) |
| 12 to 14 Years | 0 (0.0%) | 0 (0.0%) |
| 15 Years | 0 (0.0%) | 0 (0.0%) |
| 16 and 17 Years | 0 (0.0%) | 0 (0.0%) |
| 18 to 24 Years | 99 (100.0%) | 0 (0.0%) |
| 25 to 34 Years | 0 (0.0%) | 0 (0.0%) |
| 35 to 44 Years | 0 (0.0%) | 0 (0.0%) |
| 45 to 54 Years | 14 (77.8%) | 0 (0.0%) |
| 55 to 64 Years | 12 (50.0%) | 0 (0.0%) |
| 65 to 74 Years | 0 (0.0%) | 0 (0.0%) |
| 75 Years and over | 2 (100.0%) | 5 (100.0%) |
| Total | 127 (59.6%) | 5 (4.7%) |
Income Above Poverty by Sex and Age in Chewey
According to the poverty statistics in Chewey, males aged 6 to 11 years and females aged under 5 years are the age groups that are most secure financially, with 100.0% of males and 100.0% of females in these age groups living above the poverty line.
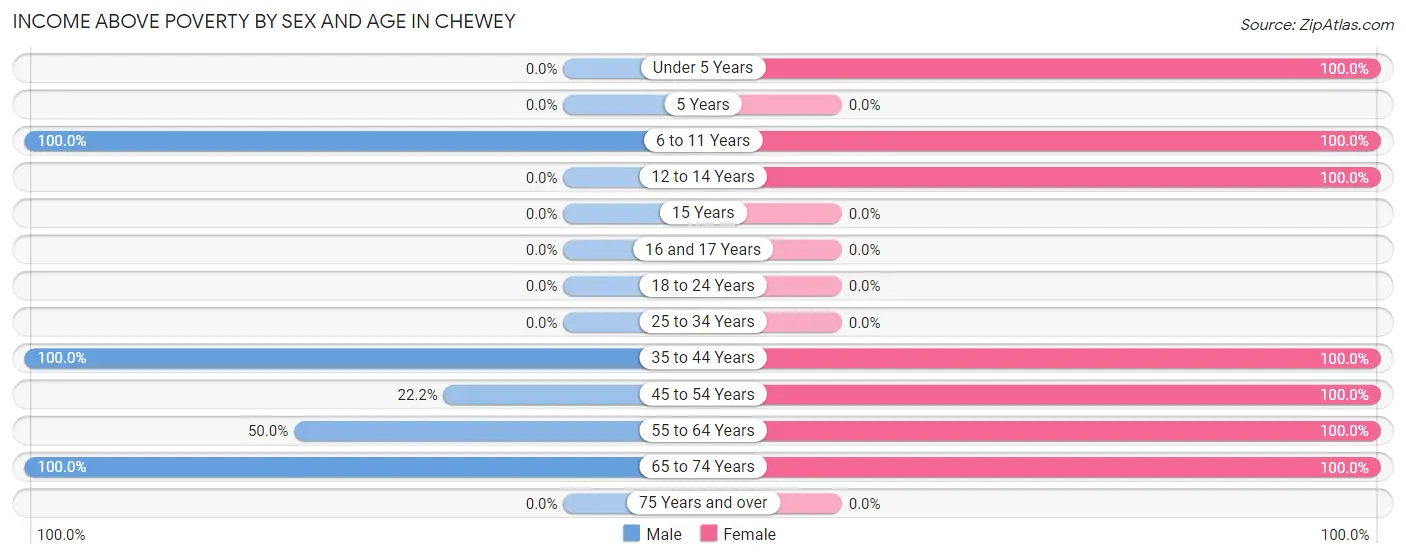
| Age Bracket | Male | Female |
| Under 5 Years | 0 (0.0%) | 11 (100.0%) |
| 5 Years | 0 (0.0%) | 0 (0.0%) |
| 6 to 11 Years | 22 (100.0%) | 8 (100.0%) |
| 12 to 14 Years | 0 (0.0%) | 20 (100.0%) |
| 15 Years | 0 (0.0%) | 0 (0.0%) |
| 16 and 17 Years | 0 (0.0%) | 0 (0.0%) |
| 18 to 24 Years | 0 (0.0%) | 0 (0.0%) |
| 25 to 34 Years | 0 (0.0%) | 0 (0.0%) |
| 35 to 44 Years | 28 (100.0%) | 22 (100.0%) |
| 45 to 54 Years | 4 (22.2%) | 4 (100.0%) |
| 55 to 64 Years | 12 (50.0%) | 16 (100.0%) |
| 65 to 74 Years | 20 (100.0%) | 20 (100.0%) |
| 75 Years and over | 0 (0.0%) | 0 (0.0%) |
| Total | 86 (40.4%) | 101 (95.3%) |
Income Below Poverty Among Married-Couple Families in Chewey
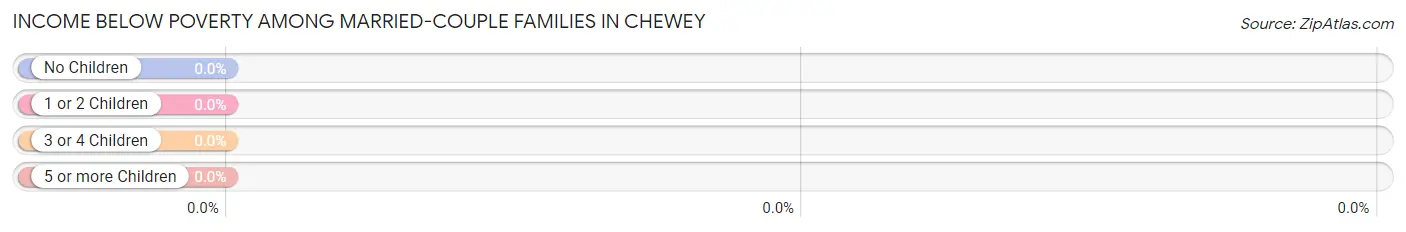
| Children | Above Poverty | Below Poverty |
| No Children | 31 (100.0%) | 0 (0.0%) |
| 1 or 2 Children | 28 (100.0%) | 0 (0.0%) |
| 3 or 4 Children | 0 (0.0%) | 0 (0.0%) |
| 5 or more Children | 0 (0.0%) | 0 (0.0%) |
| Total | 59 (100.0%) | 0 (0.0%) |
Income Below Poverty Among Single-Parent Households in Chewey
| Children | Single Father | Single Mother |
| No Children | 0 (0.0%) | 0 (0.0%) |
| 1 or 2 Children | 0 (0.0%) | 0 (0.0%) |
| 3 or 4 Children | 0 (0.0%) | 0 (0.0%) |
| 5 or more Children | 0 (0.0%) | 0 (0.0%) |
| Total | 0 (0.0%) | 0 (0.0%) |
Income Below Poverty Among Married-Couple vs Single-Parent Households in Chewey
| Children | Married-Couple Families | Single-Parent Households |
| No Children | 0 (0.0%) | 0 (0.0%) |
| 1 or 2 Children | 0 (0.0%) | 0 (0.0%) |
| 3 or 4 Children | 0 (0.0%) | 0 (0.0%) |
| 5 or more Children | 0 (0.0%) | 0 (0.0%) |
| Total | 0 (0.0%) | 0 (0.0%) |
Race in Chewey
The most populous races in Chewey are White / Caucasian (133 | 38.4%), Native / Alaskan (107 | 30.9%), and Asian (78 | 22.5%).
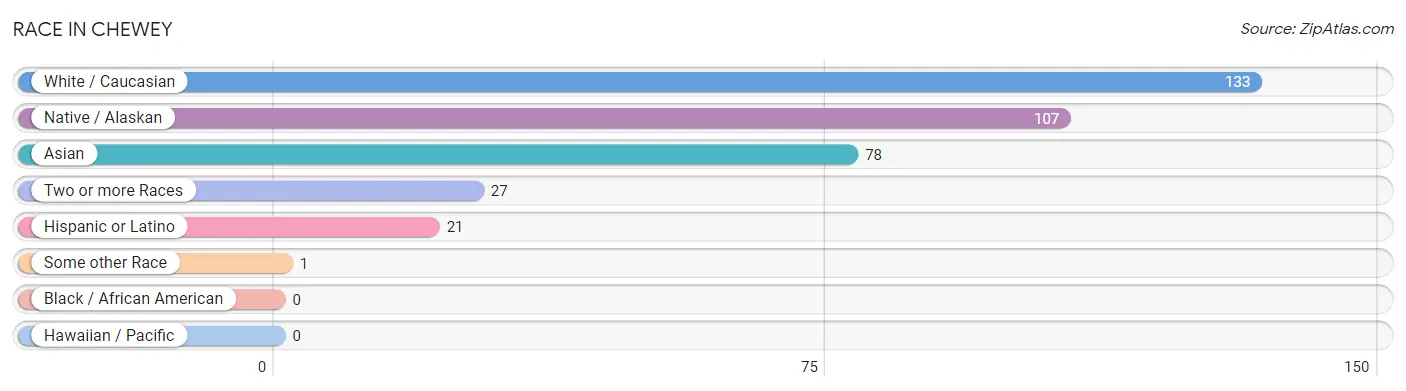
| Race | # Population | % Population |
| Asian | 78 | 22.5% |
| Black / African American | 0 | 0.0% |
| Hawaiian / Pacific | 0 | 0.0% |
| Hispanic or Latino | 21 | 6.1% |
| Native / Alaskan | 107 | 30.9% |
| White / Caucasian | 133 | 38.4% |
| Two or more Races | 27 | 7.8% |
| Some other Race | 1 | 0.3% |
| Total | 346 | 100.0% |
Ancestry in Chewey
The most populous ancestries reported in Chewey are Sri Lankan (78 | 22.5%), Cherokee (67 | 19.4%), Delaware (40 | 11.6%), Scotch-Irish (40 | 11.6%), and English (33 | 9.5%), together accounting for 74.6% of all Chewey residents.
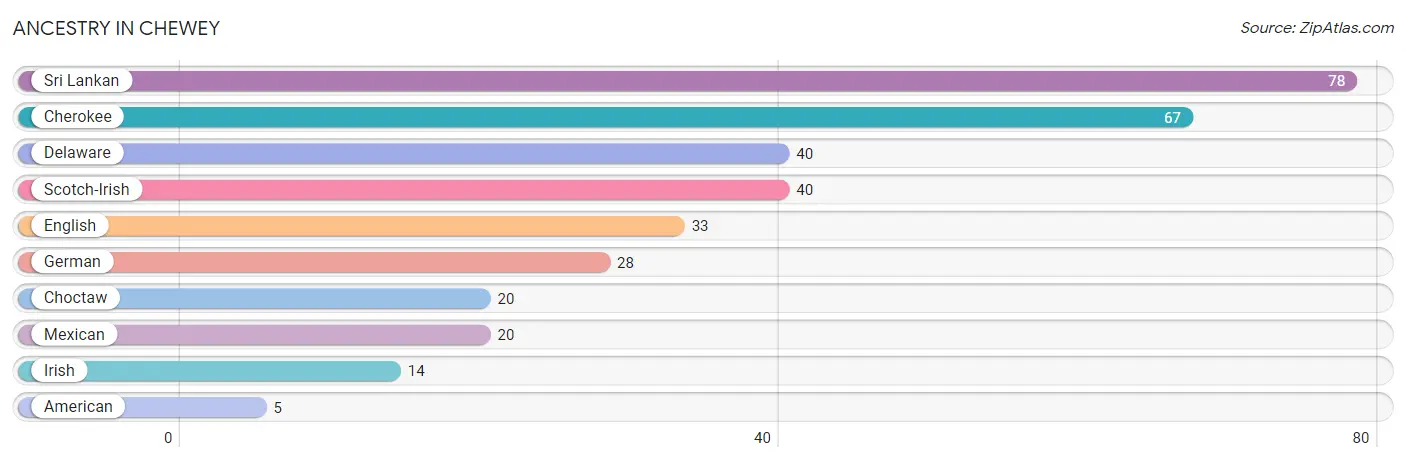
| Ancestry | # Population | % Population |
| American | 5 | 1.5% |
| Cherokee | 67 | 19.4% |
| Choctaw | 20 | 5.8% |
| Delaware | 40 | 11.6% |
| English | 33 | 9.5% |
| German | 28 | 8.1% |
| Irish | 14 | 4.1% |
| Mexican | 20 | 5.8% |
| Scotch-Irish | 40 | 11.6% |
| Sri Lankan | 78 | 22.5% | View All 10 Rows |
Immigrants in Chewey
The most numerous immigrant groups reported in Chewey came from Asia (36 | 10.4%), South Eastern Asia (36 | 10.4%), and Vietnam (36 | 10.4%), together accounting for 31.2% of all Chewey residents.
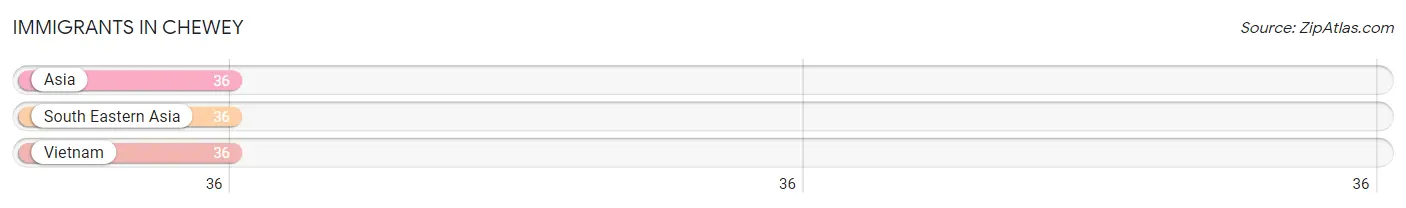
| Immigration Origin | # Population | % Population |
| Asia | 36 | 10.4% |
| South Eastern Asia | 36 | 10.4% |
| Vietnam | 36 | 10.4% | View All 3 Rows |
Sex and Age in Chewey
Sex and Age in Chewey
The most populous age groups in Chewey are 20 to 24 Years (79 | 33.8%) for men and 10 to 14 Years (30 | 26.8%) for women.
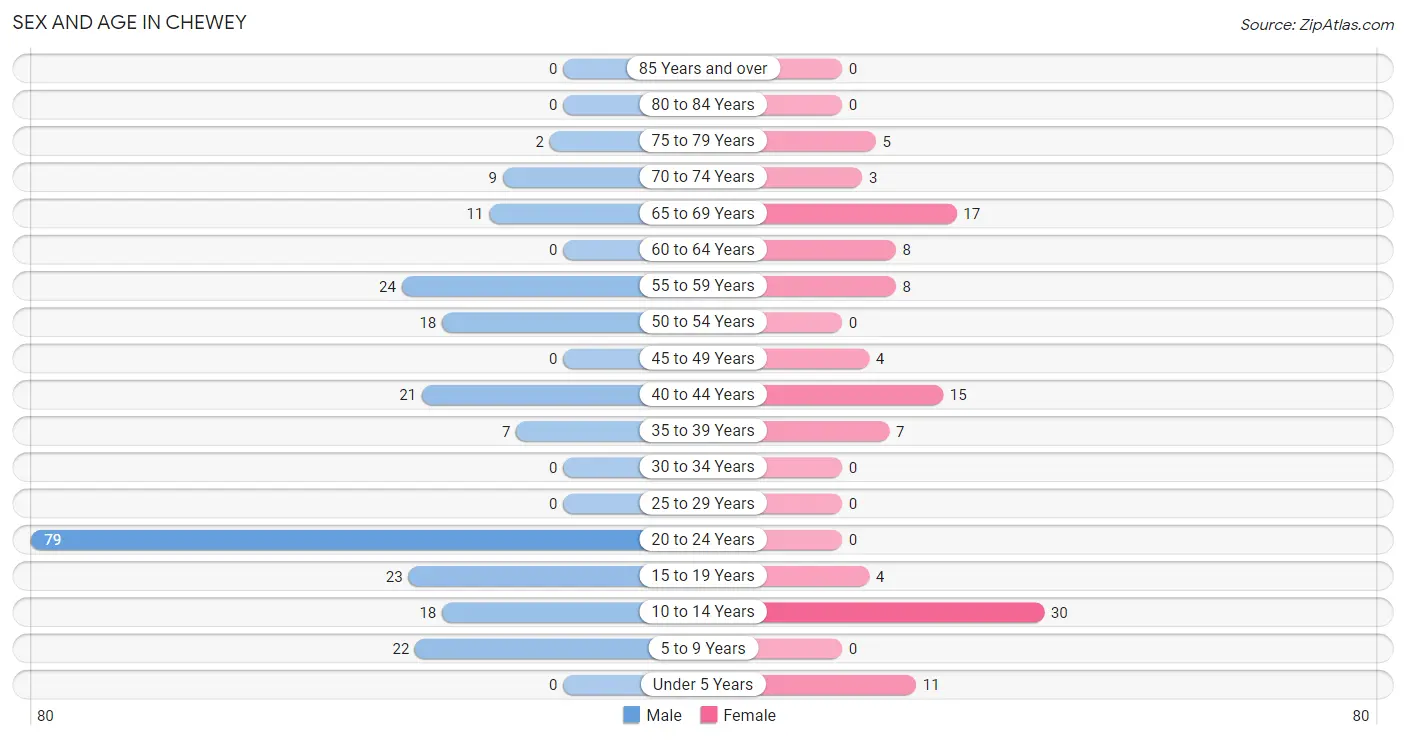
| Age Bracket | Male | Female |
| Under 5 Years | 0 (0.0%) | 11 (9.8%) |
| 5 to 9 Years | 22 (9.4%) | 0 (0.0%) |
| 10 to 14 Years | 18 (7.7%) | 30 (26.8%) |
| 15 to 19 Years | 23 (9.8%) | 4 (3.6%) |
| 20 to 24 Years | 79 (33.8%) | 0 (0.0%) |
| 25 to 29 Years | 0 (0.0%) | 0 (0.0%) |
| 30 to 34 Years | 0 (0.0%) | 0 (0.0%) |
| 35 to 39 Years | 7 (3.0%) | 7 (6.2%) |
| 40 to 44 Years | 21 (9.0%) | 15 (13.4%) |
| 45 to 49 Years | 0 (0.0%) | 4 (3.6%) |
| 50 to 54 Years | 18 (7.7%) | 0 (0.0%) |
| 55 to 59 Years | 24 (10.3%) | 8 (7.1%) |
| 60 to 64 Years | 0 (0.0%) | 8 (7.1%) |
| 65 to 69 Years | 11 (4.7%) | 17 (15.2%) |
| 70 to 74 Years | 9 (3.8%) | 3 (2.7%) |
| 75 to 79 Years | 2 (0.9%) | 5 (4.5%) |
| 80 to 84 Years | 0 (0.0%) | 0 (0.0%) |
| 85 Years and over | 0 (0.0%) | 0 (0.0%) |
| Total | 234 (100.0%) | 112 (100.0%) |
Families and Households in Chewey
Median Family Size in Chewey
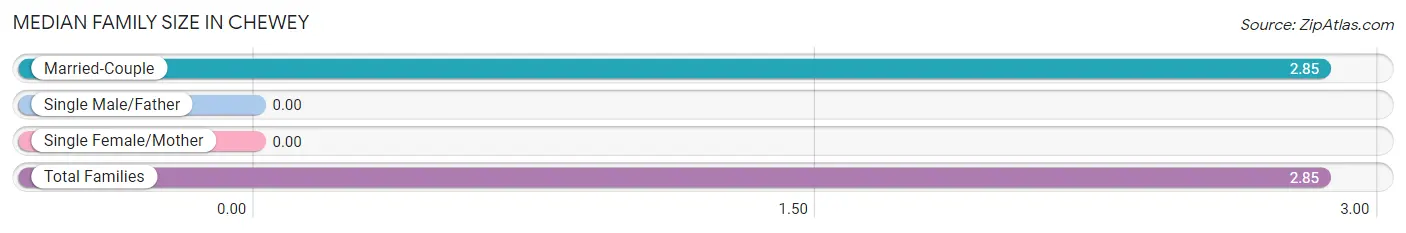
| Family Type | # Families | Family Size |
| Married-Couple | 59 (100.0%) | 2.85 |
| Single Male/Father | 0 (0.0%) | - |
| Single Female/Mother | 0 (0.0%) | - |
| Total Families | 59 (100.0%) | 2.85 |
Median Household Size in Chewey
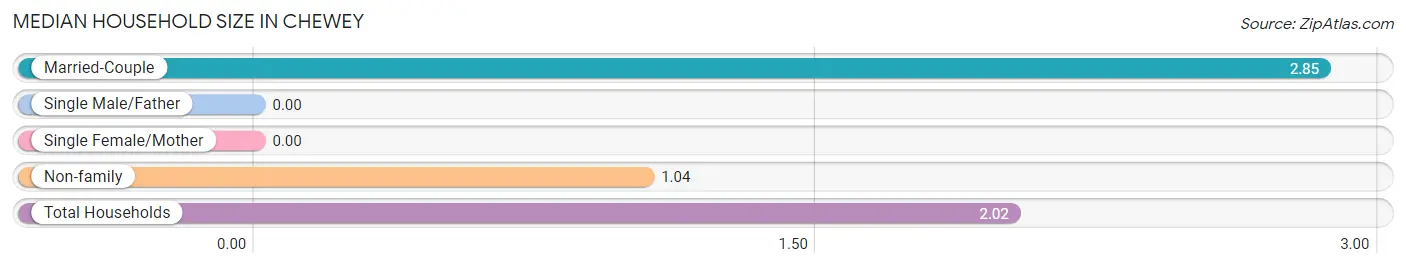
| Household Type | # Households | Household Size |
| Married-Couple | 59 (54.1%) | 2.85 |
| Single Male/Father | 0 (0.0%) | - |
| Single Female/Mother | 0 (0.0%) | - |
| Non-family | 50 (45.9%) | 1.04 |
| Total Households | 109 (100.0%) | 2.02 |
Household Size by Marriage Status in Chewey
Out of a total of 109 households in Chewey, 59 (54.1%) are family households, while 50 (45.9%) are nonfamily households. The most numerous type of family households are 2-person households, comprising 31, and the most common type of nonfamily households are 1-person households, comprising 47.
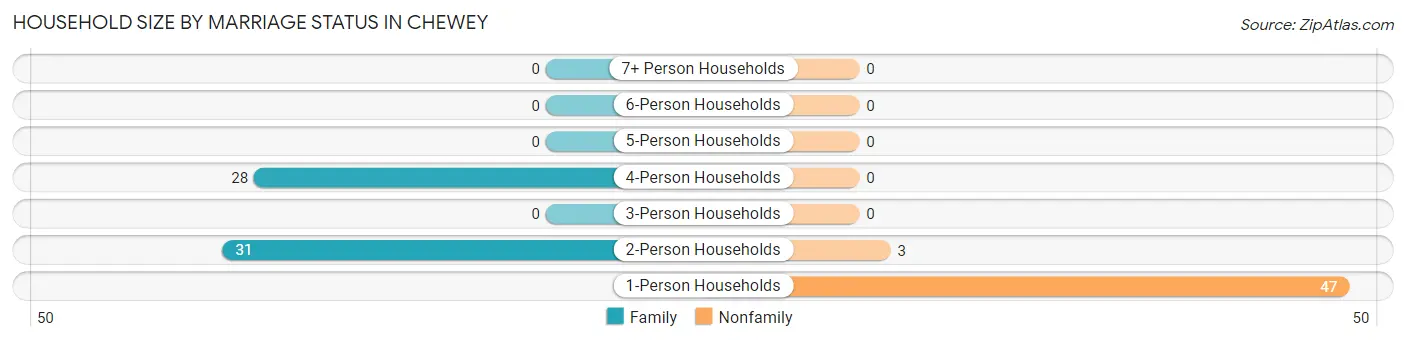
| Household Size | Family Households | Nonfamily Households |
| 1-Person Households | - | 47 (43.1%) |
| 2-Person Households | 31 (28.4%) | 3 (2.8%) |
| 3-Person Households | 0 (0.0%) | 0 (0.0%) |
| 4-Person Households | 28 (25.7%) | 0 (0.0%) |
| 5-Person Households | 0 (0.0%) | 0 (0.0%) |
| 6-Person Households | 0 (0.0%) | 0 (0.0%) |
| 7+ Person Households | 0 (0.0%) | 0 (0.0%) |
| Total | 59 (54.1%) | 50 (45.9%) |
Female Fertility in Chewey
Fertility by Age in Chewey
| Age Bracket | Women with Births | Births / 1,000 Women |
| 15 to 19 years | 0 (0.0%) | 0.0 |
| 20 to 34 years | 0 (0.0%) | 0.0 |
| 35 to 50 years | 0 (0.0%) | 0.0 |
| Total | 0 (0.0%) | 0.0 |
Fertility by Age by Marriage Status in Chewey
| Age Bracket | Married | Unmarried |
| 15 to 19 years | 0 (0.0%) | 0 (0.0%) |
| 20 to 34 years | 0 (0.0%) | 0 (0.0%) |
| 35 to 50 years | 0 (0.0%) | 0 (0.0%) |
| Total | 0 (0.0%) | 0 (0.0%) |
Fertility by Education in Chewey
| Educational Attainment | Women with Births | Births / 1,000 Women |
| Less than High School | 0 (0.0%) | 0.0 |
| High School Diploma | 0 (0.0%) | 0.0 |
| College or Associate's Degree | 0 (0.0%) | 0.0 |
| Bachelor's Degree | 0 (0.0%) | 0.0 |
| Graduate Degree | 0 (0.0%) | 0.0 |
| Total | 0 (0.0%) | 0.0 |
Fertility by Education by Marriage Status in Chewey
| Educational Attainment | Married | Unmarried |
| Less than High School | 0 (0.0%) | 0 (0.0%) |
| High School Diploma | 0 (0.0%) | 0 (0.0%) |
| College or Associate's Degree | 0 (0.0%) | 0 (0.0%) |
| Bachelor's Degree | 0 (0.0%) | 0 (0.0%) |
| Graduate Degree | 0 (0.0%) | 0 (0.0%) |
| Total | 0 (0.0%) | 0 (0.0%) |
Employment Characteristics in Chewey
Employment by Class of Employer in Chewey
Among the 87 employed individuals in Chewey, private company employees (50 | 57.5%), local government employees (15 | 17.2%), and not-for-profit organizations (14 | 16.1%) make up the most common classes of employment.
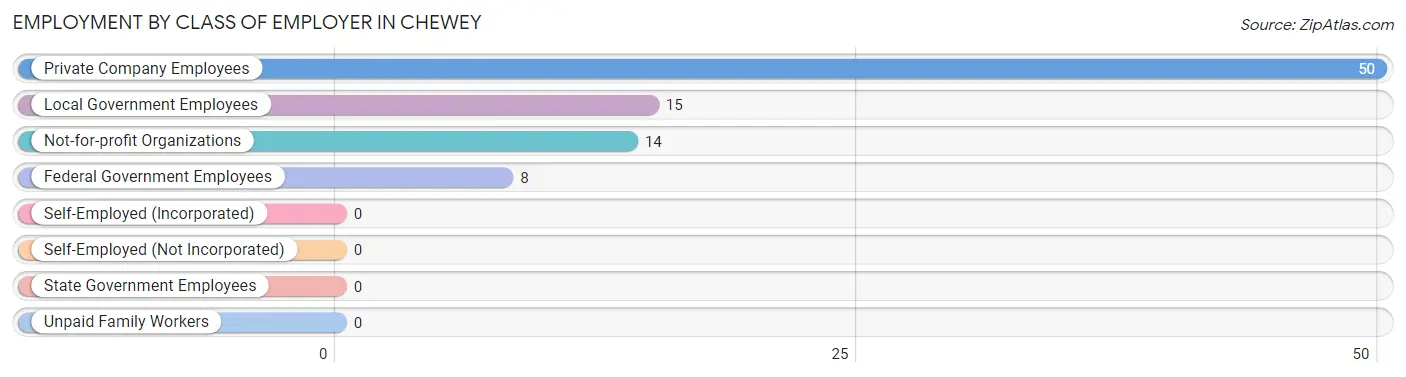
| Employer Class | # Employees | % Employees |
| Private Company Employees | 50 | 57.5% |
| Self-Employed (Incorporated) | 0 | 0.0% |
| Self-Employed (Not Incorporated) | 0 | 0.0% |
| Not-for-profit Organizations | 14 | 16.1% |
| Local Government Employees | 15 | 17.2% |
| State Government Employees | 0 | 0.0% |
| Federal Government Employees | 8 | 9.2% |
| Unpaid Family Workers | 0 | 0.0% |
| Total | 87 | 100.0% |
Employment Status by Age in Chewey
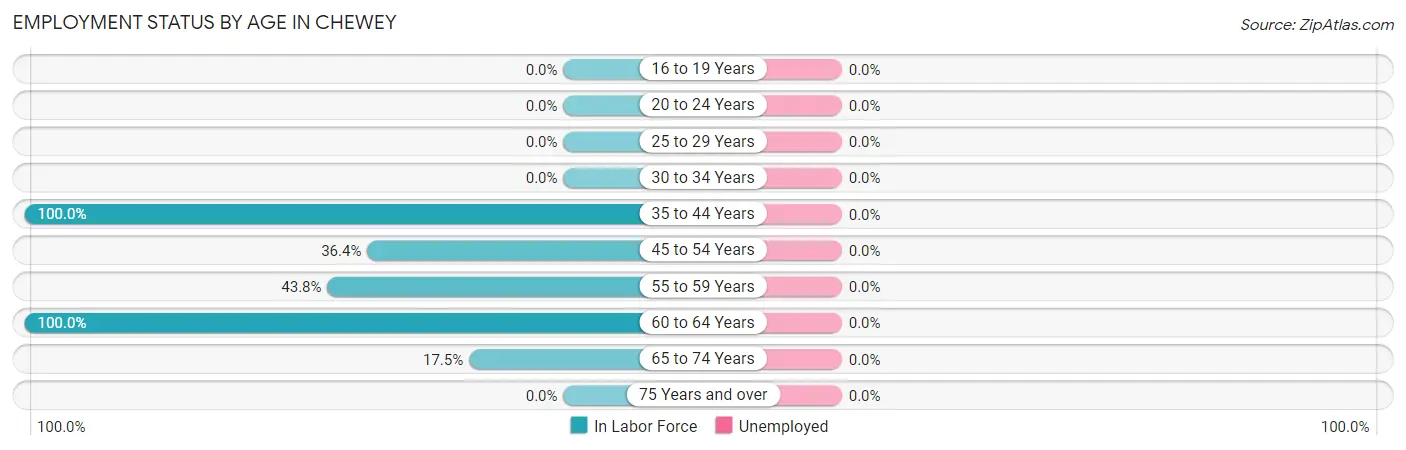
| Age Bracket | In Labor Force | Unemployed |
| 16 to 19 Years | 0 (0.0%) | 0 (0.0%) |
| 20 to 24 Years | 0 (0.0%) | 0 (0.0%) |
| 25 to 29 Years | 0 (0.0%) | 0 (0.0%) |
| 30 to 34 Years | 0 (0.0%) | 0 (0.0%) |
| 35 to 44 Years | 50 (100.0%) | 0 (0.0%) |
| 45 to 54 Years | 8 (36.4%) | 0 (0.0%) |
| 55 to 59 Years | 14 (43.8%) | 0 (0.0%) |
| 60 to 64 Years | 8 (100.0%) | 0 (0.0%) |
| 65 to 74 Years | 7 (17.5%) | 0 (0.0%) |
| 75 Years and over | 0 (0.0%) | 0 (0.0%) |
| Total | 87 (33.2%) | 0 (0.0%) |
Employment Status by Educational Attainment in Chewey
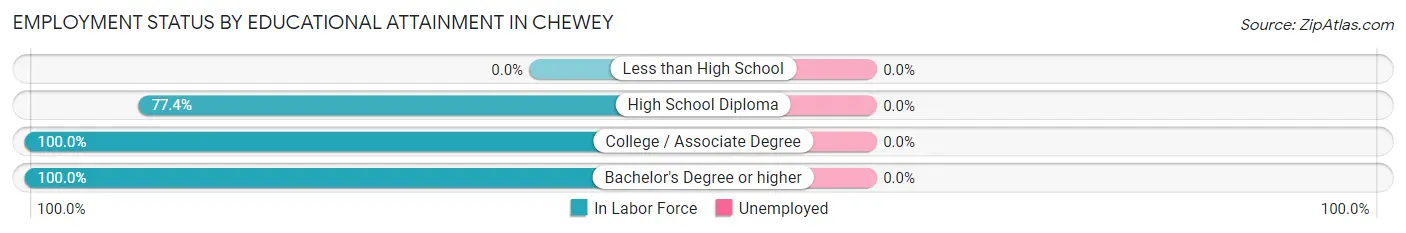
| Educational Attainment | In Labor Force | Unemployed |
| Less than High School | 0 (0.0%) | 0 (0.0%) |
| High School Diploma | 48 (77.4%) | 0 (0.0%) |
| College / Associate Degree | 12 (100.0%) | 0 (0.0%) |
| Bachelor's Degree or higher | 20 (100.0%) | 0 (0.0%) |
| Total | 80 (71.4%) | 0 (0.0%) |
Employment Occupations by Sex in Chewey
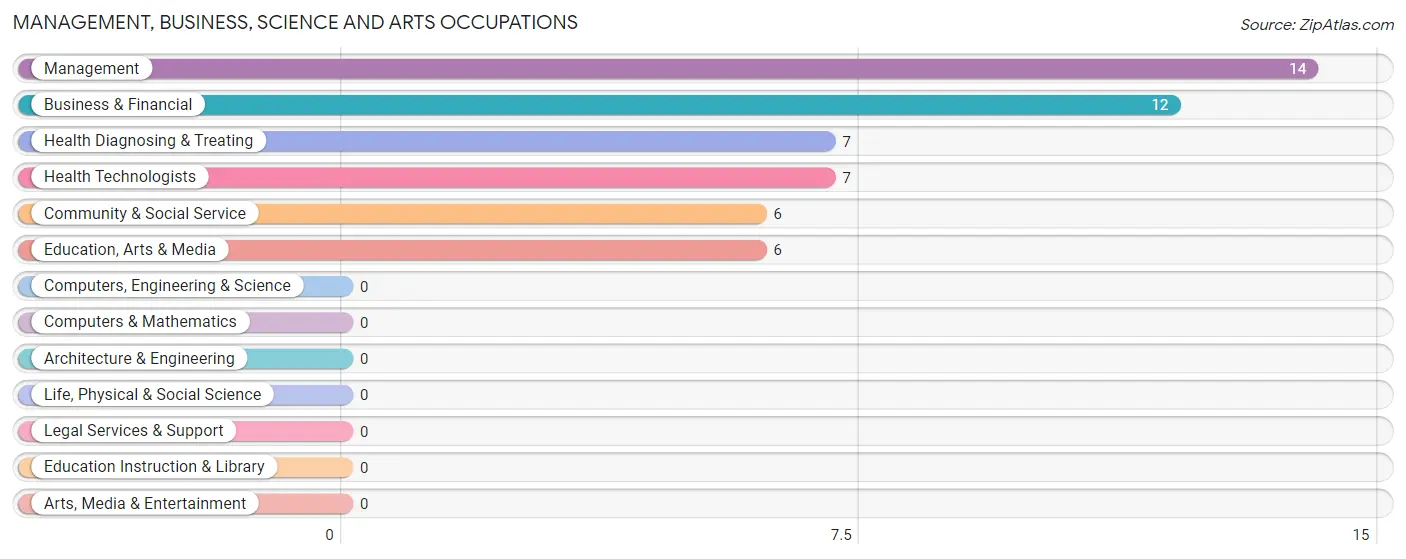
Management, Business, Science and Arts Occupations
The most common Management, Business, Science and Arts occupations in Chewey are Management (14 | 16.1%), Business & Financial (12 | 13.8%), Health Diagnosing & Treating (7 | 8.1%), Health Technologists (7 | 8.1%), and Community & Social Service (6 | 6.9%).
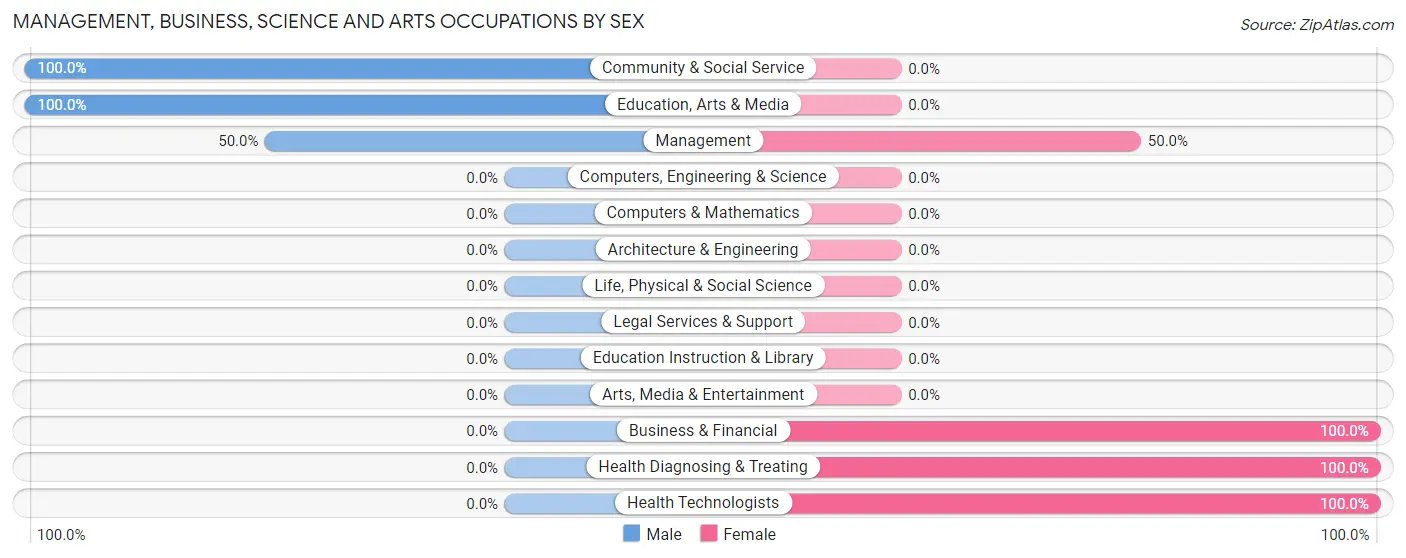
Management, Business, Science and Arts Occupations by Sex
Within the Management, Business, Science and Arts occupations in Chewey, the most male-oriented occupations are Community & Social Service (100.0%), Education, Arts & Media (100.0%), and Management (50.0%), while the most female-oriented occupations are Business & Financial (100.0%), Health Diagnosing & Treating (100.0%), and Health Technologists (100.0%).
| Occupation | Male | Female |
| Management | 7 (50.0%) | 7 (50.0%) |
| Business & Financial | 0 (0.0%) | 12 (100.0%) |
| Computers, Engineering & Science | 0 (0.0%) | 0 (0.0%) |
| Computers & Mathematics | 0 (0.0%) | 0 (0.0%) |
| Architecture & Engineering | 0 (0.0%) | 0 (0.0%) |
| Life, Physical & Social Science | 0 (0.0%) | 0 (0.0%) |
| Community & Social Service | 6 (100.0%) | 0 (0.0%) |
| Education, Arts & Media | 6 (100.0%) | 0 (0.0%) |
| Legal Services & Support | 0 (0.0%) | 0 (0.0%) |
| Education Instruction & Library | 0 (0.0%) | 0 (0.0%) |
| Arts, Media & Entertainment | 0 (0.0%) | 0 (0.0%) |
| Health Diagnosing & Treating | 0 (0.0%) | 7 (100.0%) |
| Health Technologists | 0 (0.0%) | 7 (100.0%) |
| Total (Category) | 13 (33.3%) | 26 (66.7%) |
| Total (Overall) | 38 (43.7%) | 49 (56.3%) |
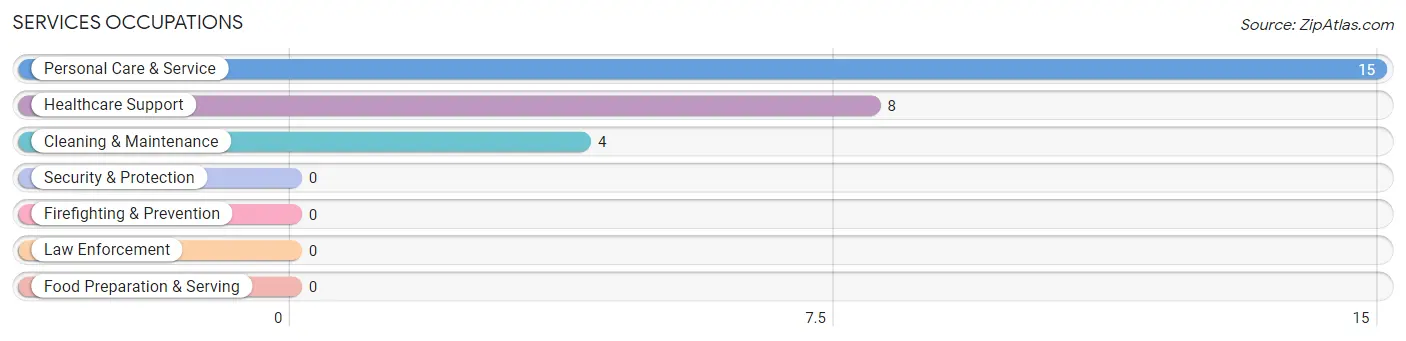
Services Occupations
The most common Services occupations in Chewey are Personal Care & Service (15 | 17.2%), Healthcare Support (8 | 9.2%), and Cleaning & Maintenance (4 | 4.6%).
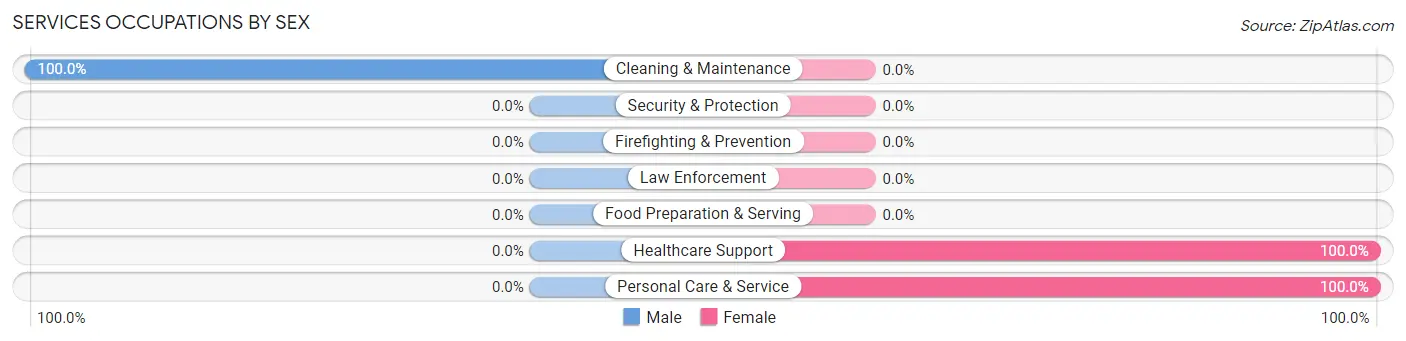
Services Occupations by Sex
| Occupation | Male | Female |
| Healthcare Support | 0 (0.0%) | 8 (100.0%) |
| Security & Protection | 0 (0.0%) | 0 (0.0%) |
| Firefighting & Prevention | 0 (0.0%) | 0 (0.0%) |
| Law Enforcement | 0 (0.0%) | 0 (0.0%) |
| Food Preparation & Serving | 0 (0.0%) | 0 (0.0%) |
| Cleaning & Maintenance | 4 (100.0%) | 0 (0.0%) |
| Personal Care & Service | 0 (0.0%) | 15 (100.0%) |
| Total (Category) | 4 (14.8%) | 23 (85.2%) |
| Total (Overall) | 38 (43.7%) | 49 (56.3%) |
Sales and Office Occupations
Sales and Office Occupations by Sex
| Occupation | Male | Female |
| Sales & Related | 0 (0.0%) | 0 (0.0%) |
| Office & Administration | 0 (0.0%) | 0 (0.0%) |
| Total (Category) | 0 (0.0%) | 0 (0.0%) |
| Total (Overall) | 38 (43.7%) | 49 (56.3%) |
Natural Resources, Construction and Maintenance Occupations
The most common Natural Resources, Construction and Maintenance occupations in Chewey are , and Farming, Fishing & Forestry (21 | 24.1%).
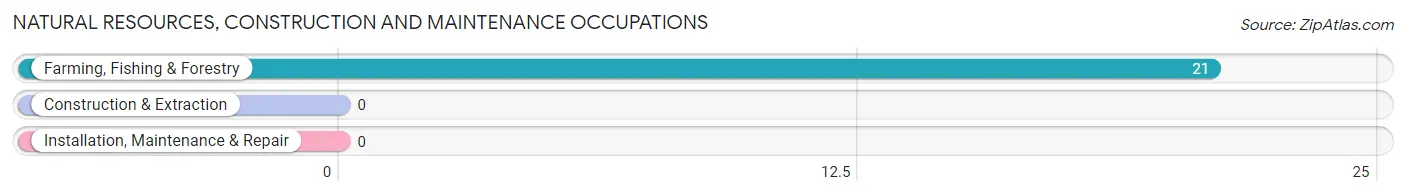
Natural Resources, Construction and Maintenance Occupations by Sex
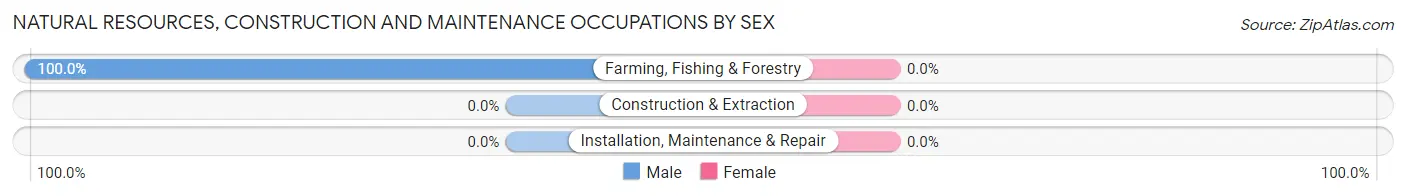
| Occupation | Male | Female |
| Farming, Fishing & Forestry | 21 (100.0%) | 0 (0.0%) |
| Construction & Extraction | 0 (0.0%) | 0 (0.0%) |
| Installation, Maintenance & Repair | 0 (0.0%) | 0 (0.0%) |
| Total (Category) | 21 (100.0%) | 0 (0.0%) |
| Total (Overall) | 38 (43.7%) | 49 (56.3%) |
Production, Transportation and Moving Occupations
Production, Transportation and Moving Occupations by Sex
| Occupation | Male | Female |
| Production | 0 (0.0%) | 0 (0.0%) |
| Transportation | 0 (0.0%) | 0 (0.0%) |
| Material Moving | 0 (0.0%) | 0 (0.0%) |
| Total (Category) | 0 (0.0%) | 0 (0.0%) |
| Total (Overall) | 38 (43.7%) | 49 (56.3%) |
Employment Industries by Sex in Chewey
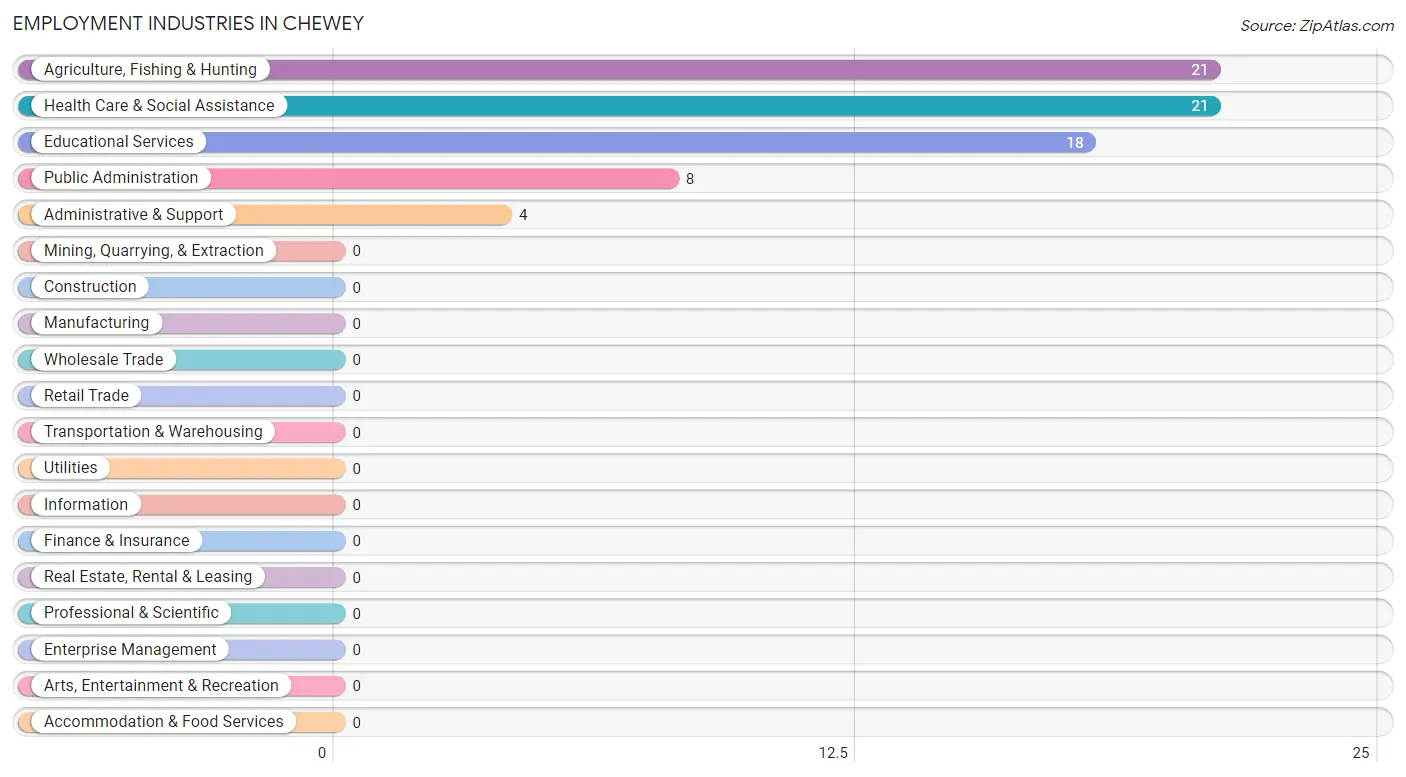
Employment Industries in Chewey
The major employment industries in Chewey include Agriculture, Fishing & Hunting (21 | 24.1%), Health Care & Social Assistance (21 | 24.1%), Educational Services (18 | 20.7%), Public Administration (8 | 9.2%), and Administrative & Support (4 | 4.6%).
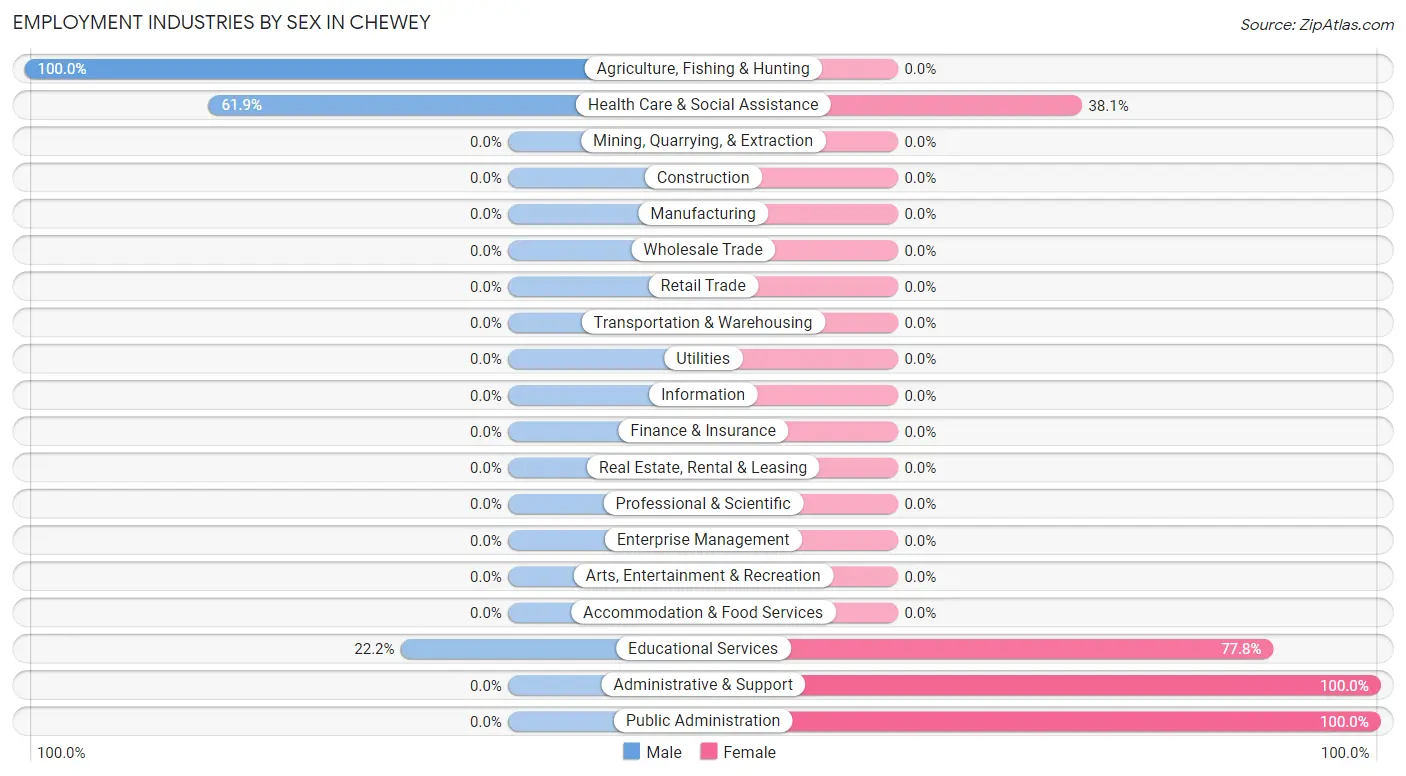
Employment Industries by Sex in Chewey
The Chewey industries that see more men than women are Agriculture, Fishing & Hunting (100.0%), Health Care & Social Assistance (61.9%), and Educational Services (22.2%), whereas the industries that tend to have a higher number of women are Administrative & Support (100.0%), Public Administration (100.0%), and Educational Services (77.8%).
| Industry | Male | Female |
| Agriculture, Fishing & Hunting | 21 (100.0%) | 0 (0.0%) |
| Mining, Quarrying, & Extraction | 0 (0.0%) | 0 (0.0%) |
| Construction | 0 (0.0%) | 0 (0.0%) |
| Manufacturing | 0 (0.0%) | 0 (0.0%) |
| Wholesale Trade | 0 (0.0%) | 0 (0.0%) |
| Retail Trade | 0 (0.0%) | 0 (0.0%) |
| Transportation & Warehousing | 0 (0.0%) | 0 (0.0%) |
| Utilities | 0 (0.0%) | 0 (0.0%) |
| Information | 0 (0.0%) | 0 (0.0%) |
| Finance & Insurance | 0 (0.0%) | 0 (0.0%) |
| Real Estate, Rental & Leasing | 0 (0.0%) | 0 (0.0%) |
| Professional & Scientific | 0 (0.0%) | 0 (0.0%) |
| Enterprise Management | 0 (0.0%) | 0 (0.0%) |
| Administrative & Support | 0 (0.0%) | 4 (100.0%) |
| Educational Services | 4 (22.2%) | 14 (77.8%) |
| Health Care & Social Assistance | 13 (61.9%) | 8 (38.1%) |
| Arts, Entertainment & Recreation | 0 (0.0%) | 0 (0.0%) |
| Accommodation & Food Services | 0 (0.0%) | 0 (0.0%) |
| Public Administration | 0 (0.0%) | 8 (100.0%) |
| Total | 38 (43.7%) | 49 (56.3%) |
Education in Chewey
School Enrollment in Chewey
The most common levels of schooling among the 95 students in Chewey are middle school (30 | 31.6%), high school (25 | 26.3%), and kindergarten (22 | 23.2%).
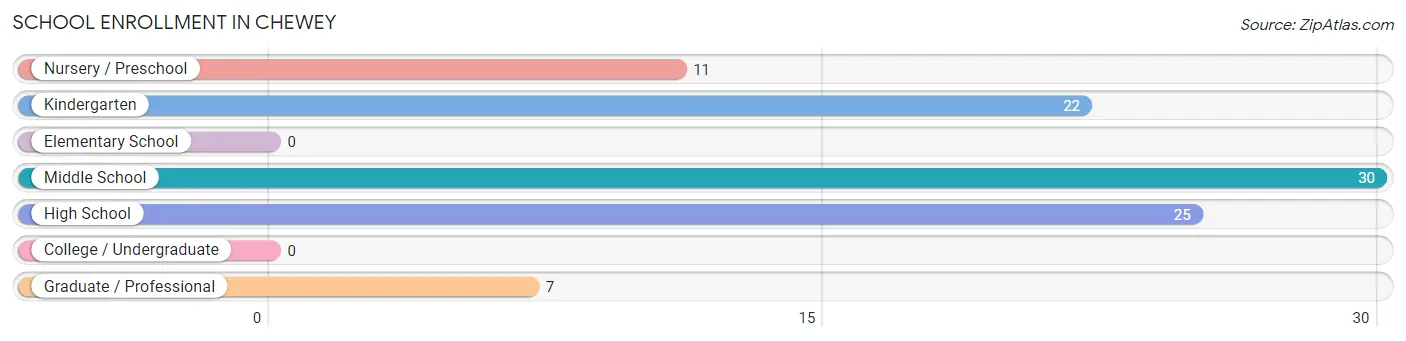
| School Level | # Students | % Students |
| Nursery / Preschool | 11 | 11.6% |
| Kindergarten | 22 | 23.2% |
| Elementary School | 0 | 0.0% |
| Middle School | 30 | 31.6% |
| High School | 25 | 26.3% |
| College / Undergraduate | 0 | 0.0% |
| Graduate / Professional | 7 | 7.4% |
| Total | 95 | 100.0% |
School Enrollment by Age by Funding Source in Chewey
Out of a total of 95 students who are enrolled in schools in Chewey, 22 (23.2%) attend a private institution, while the remaining 73 (76.8%) are enrolled in public schools. The age group of 3 to 4 year olds has the highest likelihood of being enrolled in private schools, with 11 (100.0% in the age bracket) enrolled. Conversely, the age group of 5 to 9 year old has the lowest likelihood of being enrolled in a private school, with 22 (100.0% in the age bracket) attending a public institution.
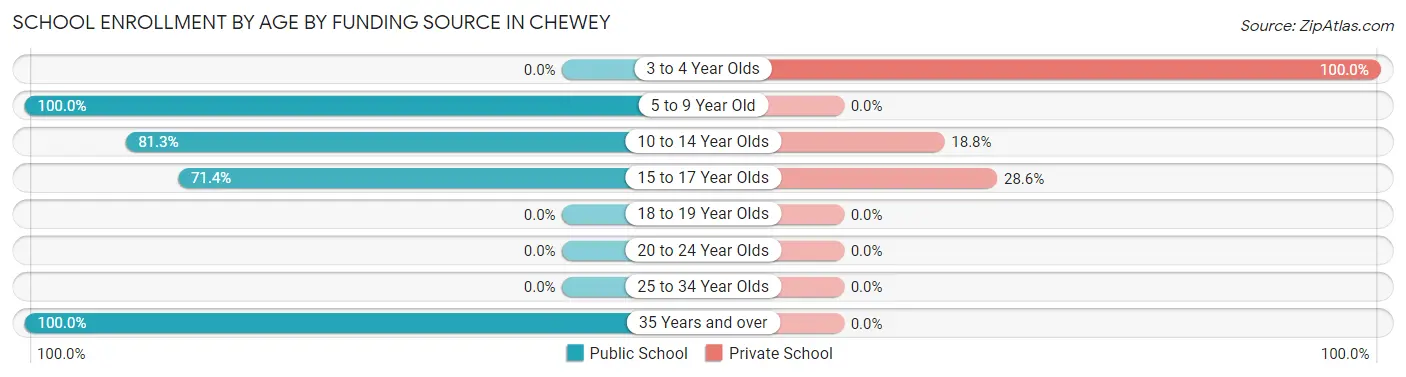
| Age Bracket | Public School | Private School |
| 3 to 4 Year Olds | 0 (0.0%) | 11 (100.0%) |
| 5 to 9 Year Old | 22 (100.0%) | 0 (0.0%) |
| 10 to 14 Year Olds | 39 (81.2%) | 9 (18.8%) |
| 15 to 17 Year Olds | 5 (71.4%) | 2 (28.6%) |
| 18 to 19 Year Olds | 0 (0.0%) | 0 (0.0%) |
| 20 to 24 Year Olds | 0 (0.0%) | 0 (0.0%) |
| 25 to 34 Year Olds | 0 (0.0%) | 0 (0.0%) |
| 35 Years and over | 7 (100.0%) | 0 (0.0%) |
| Total | 73 (76.8%) | 22 (23.2%) |
Educational Attainment by Field of Study in Chewey
Liberal arts & history (14 | 43.8%), education (10 | 31.2%), and bio, nature & agricultural (8 | 25.0%) are the most common fields of study among 32 individuals in Chewey who have obtained a bachelor's degree or higher.
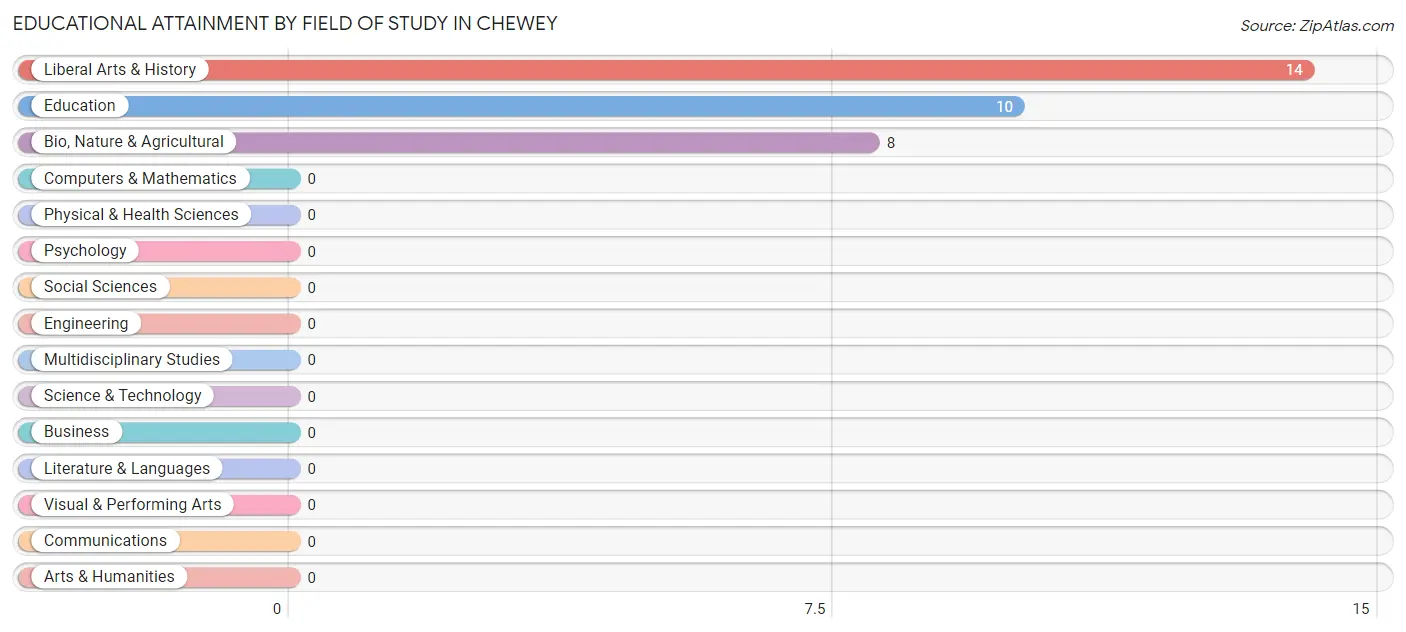
| Field of Study | # Graduates | % Graduates |
| Computers & Mathematics | 0 | 0.0% |
| Bio, Nature & Agricultural | 8 | 25.0% |
| Physical & Health Sciences | 0 | 0.0% |
| Psychology | 0 | 0.0% |
| Social Sciences | 0 | 0.0% |
| Engineering | 0 | 0.0% |
| Multidisciplinary Studies | 0 | 0.0% |
| Science & Technology | 0 | 0.0% |
| Business | 0 | 0.0% |
| Education | 10 | 31.2% |
| Literature & Languages | 0 | 0.0% |
| Liberal Arts & History | 14 | 43.8% |
| Visual & Performing Arts | 0 | 0.0% |
| Communications | 0 | 0.0% |
| Arts & Humanities | 0 | 0.0% |
| Total | 32 | 100.0% |
Transportation & Commute in Chewey
Vehicle Availability by Sex in Chewey
The most prevalent vehicle ownership categories in Chewey are males with 2 vehicles (38, accounting for 100.0%) and females with 2 vehicles (42, making up 77.5%).
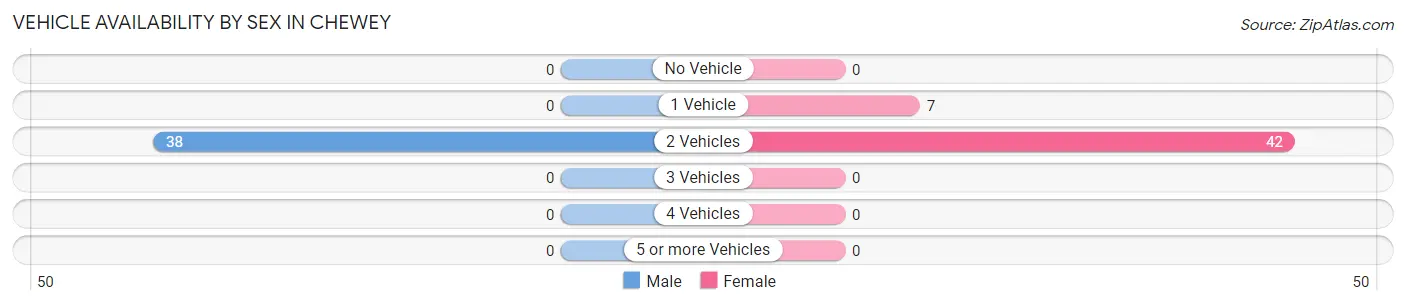
| Vehicles Available | Male | Female |
| No Vehicle | 0 (0.0%) | 0 (0.0%) |
| 1 Vehicle | 0 (0.0%) | 7 (14.3%) |
| 2 Vehicles | 38 (100.0%) | 42 (85.7%) |
| 3 Vehicles | 0 (0.0%) | 0 (0.0%) |
| 4 Vehicles | 0 (0.0%) | 0 (0.0%) |
| 5 or more Vehicles | 0 (0.0%) | 0 (0.0%) |
| Total | 38 (100.0%) | 49 (100.0%) |
Commute Time in Chewey
The most frequently occuring commute durations in Chewey are 30 to 34 minutes (23 commuters, 26.4%), 10 to 14 minutes (21 commuters, 24.1%), and 45 to 59 minutes (21 commuters, 24.1%).
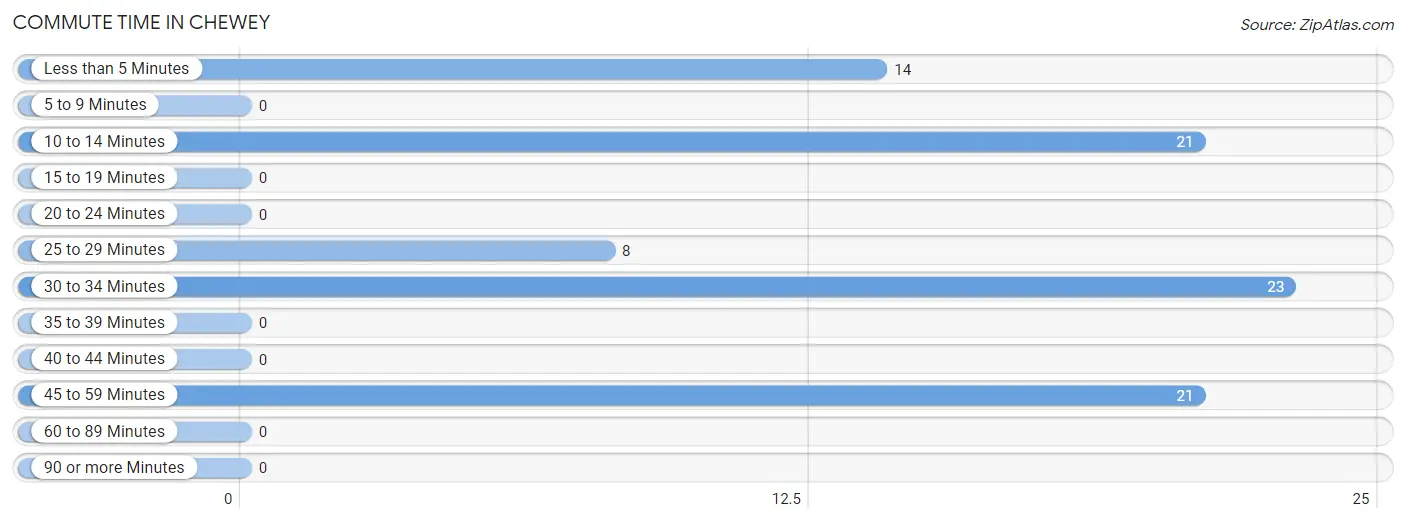
| Commute Time | # Commuters | % Commuters |
| Less than 5 Minutes | 14 | 16.1% |
| 5 to 9 Minutes | 0 | 0.0% |
| 10 to 14 Minutes | 21 | 24.1% |
| 15 to 19 Minutes | 0 | 0.0% |
| 20 to 24 Minutes | 0 | 0.0% |
| 25 to 29 Minutes | 8 | 9.2% |
| 30 to 34 Minutes | 23 | 26.4% |
| 35 to 39 Minutes | 0 | 0.0% |
| 40 to 44 Minutes | 0 | 0.0% |
| 45 to 59 Minutes | 21 | 24.1% |
| 60 to 89 Minutes | 0 | 0.0% |
| 90 or more Minutes | 0 | 0.0% |
Commute Time by Sex in Chewey
The most common commute times in Chewey are 10 to 14 minutes (21 commuters, 55.3%) for males and 30 to 34 minutes (19 commuters, 38.8%) for females.
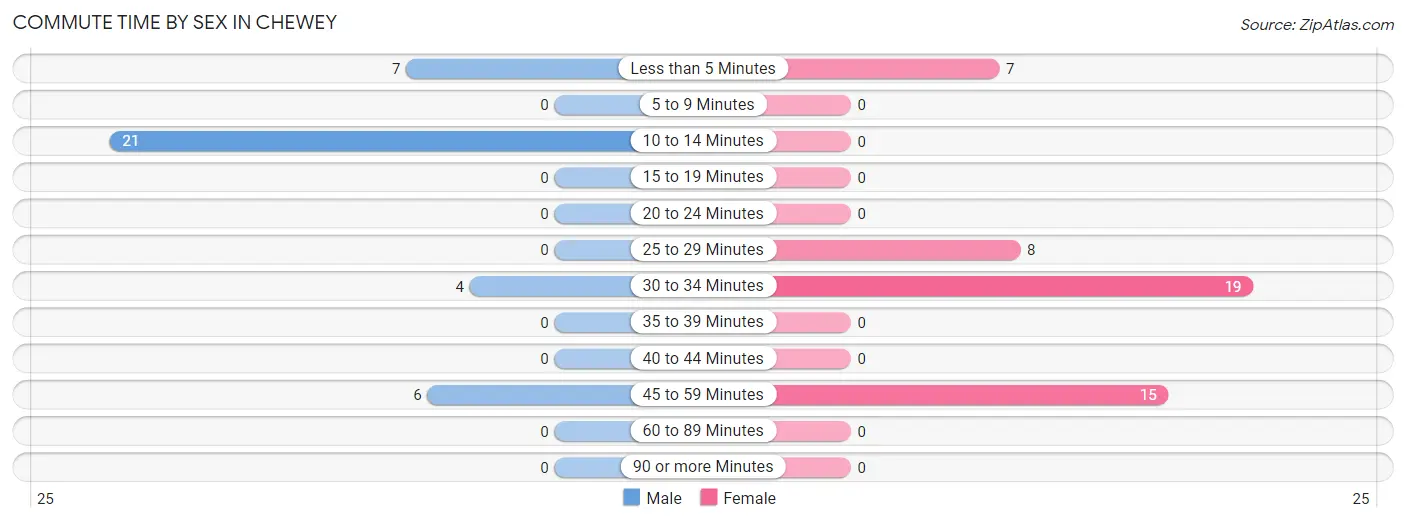
| Commute Time | Male | Female |
| Less than 5 Minutes | 7 (18.4%) | 7 (14.3%) |
| 5 to 9 Minutes | 0 (0.0%) | 0 (0.0%) |
| 10 to 14 Minutes | 21 (55.3%) | 0 (0.0%) |
| 15 to 19 Minutes | 0 (0.0%) | 0 (0.0%) |
| 20 to 24 Minutes | 0 (0.0%) | 0 (0.0%) |
| 25 to 29 Minutes | 0 (0.0%) | 8 (16.3%) |
| 30 to 34 Minutes | 4 (10.5%) | 19 (38.8%) |
| 35 to 39 Minutes | 0 (0.0%) | 0 (0.0%) |
| 40 to 44 Minutes | 0 (0.0%) | 0 (0.0%) |
| 45 to 59 Minutes | 6 (15.8%) | 15 (30.6%) |
| 60 to 89 Minutes | 0 (0.0%) | 0 (0.0%) |
| 90 or more Minutes | 0 (0.0%) | 0 (0.0%) |
Time of Departure to Work by Sex in Chewey
The most frequent times of departure to work in Chewey are 12:00 PM to 3:59 PM (27, 71.1%) for males and 6:30 AM to 6:59 AM (16, 32.7%) for females.
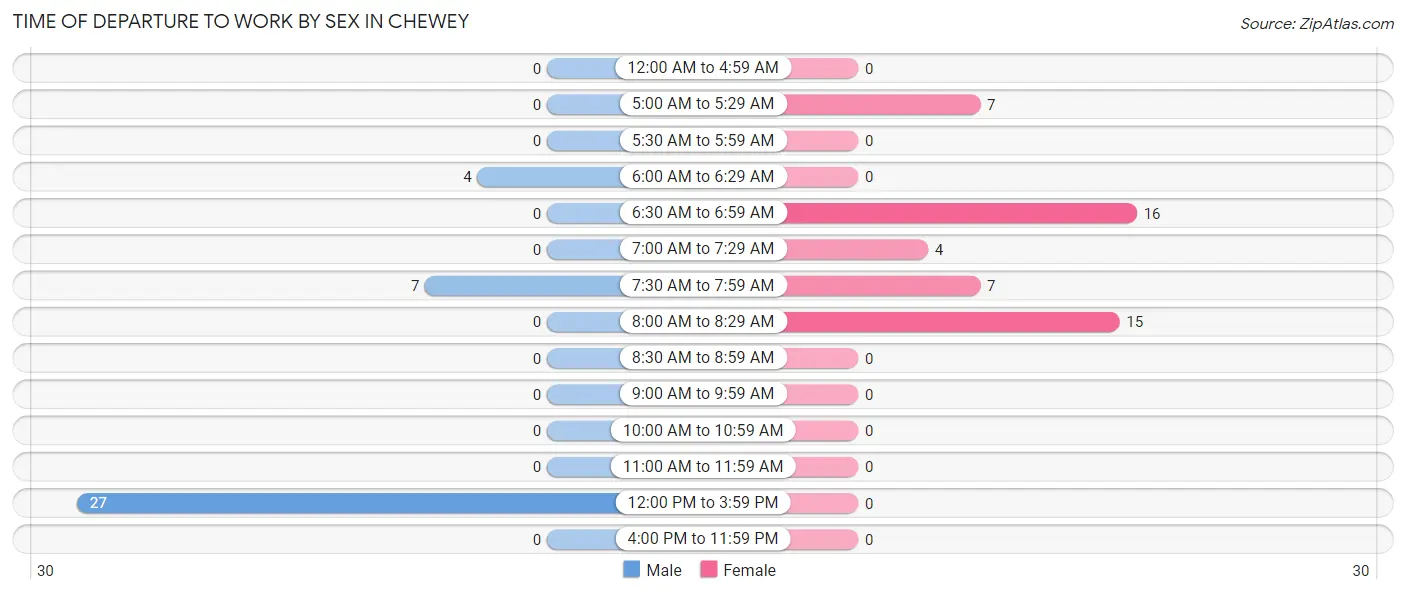
| Time of Departure | Male | Female |
| 12:00 AM to 4:59 AM | 0 (0.0%) | 0 (0.0%) |
| 5:00 AM to 5:29 AM | 0 (0.0%) | 7 (14.3%) |
| 5:30 AM to 5:59 AM | 0 (0.0%) | 0 (0.0%) |
| 6:00 AM to 6:29 AM | 4 (10.5%) | 0 (0.0%) |
| 6:30 AM to 6:59 AM | 0 (0.0%) | 16 (32.7%) |
| 7:00 AM to 7:29 AM | 0 (0.0%) | 4 (8.2%) |
| 7:30 AM to 7:59 AM | 7 (18.4%) | 7 (14.3%) |
| 8:00 AM to 8:29 AM | 0 (0.0%) | 15 (30.6%) |
| 8:30 AM to 8:59 AM | 0 (0.0%) | 0 (0.0%) |
| 9:00 AM to 9:59 AM | 0 (0.0%) | 0 (0.0%) |
| 10:00 AM to 10:59 AM | 0 (0.0%) | 0 (0.0%) |
| 11:00 AM to 11:59 AM | 0 (0.0%) | 0 (0.0%) |
| 12:00 PM to 3:59 PM | 27 (71.1%) | 0 (0.0%) |
| 4:00 PM to 11:59 PM | 0 (0.0%) | 0 (0.0%) |
| Total | 38 (100.0%) | 49 (100.0%) |
Housing Occupancy in Chewey
Occupancy by Ownership in Chewey
Of the total 109 dwellings in Chewey, owner-occupied units account for 88 (80.7%), while renter-occupied units make up 21 (19.3%).
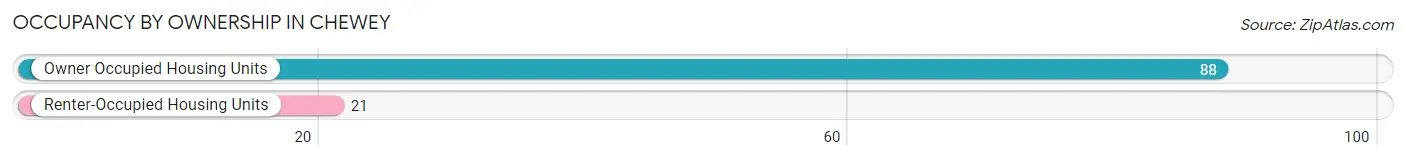
| Occupancy | # Housing Units | % Housing Units |
| Owner Occupied Housing Units | 88 | 80.7% |
| Renter-Occupied Housing Units | 21 | 19.3% |
| Total Occupied Housing Units | 109 | 100.0% |
Occupancy by Household Size in Chewey
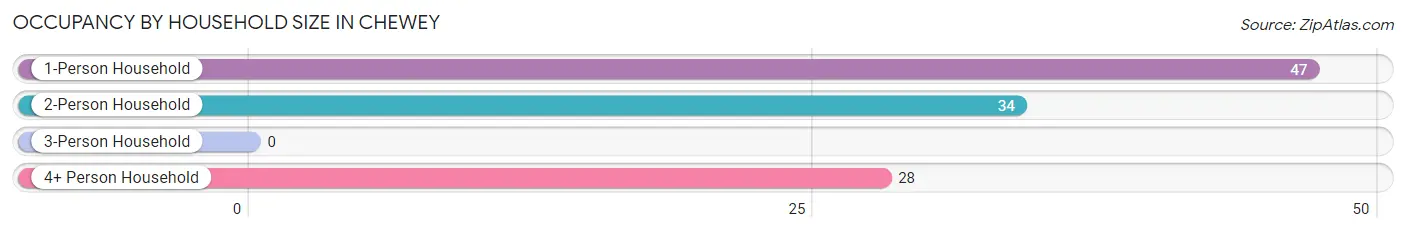
| Household Size | # Housing Units | % Housing Units |
| 1-Person Household | 47 | 43.1% |
| 2-Person Household | 34 | 31.2% |
| 3-Person Household | 0 | 0.0% |
| 4+ Person Household | 28 | 25.7% |
| Total Housing Units | 109 | 100.0% |
Occupancy by Ownership by Household Size in Chewey
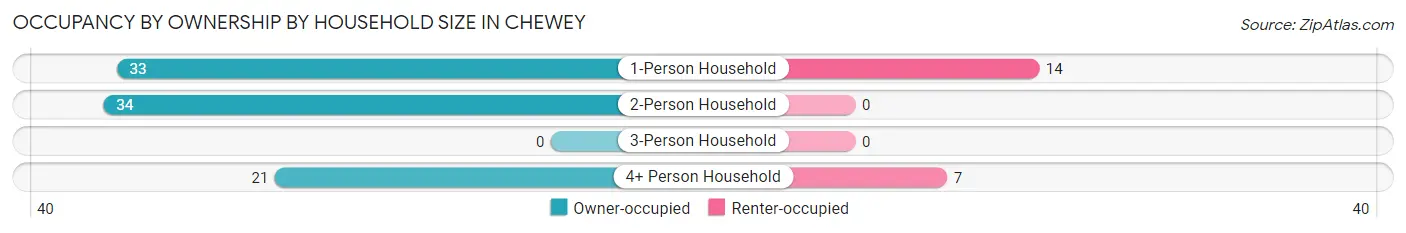
| Household Size | Owner-occupied | Renter-occupied |
| 1-Person Household | 33 (70.2%) | 14 (29.8%) |
| 2-Person Household | 34 (100.0%) | 0 (0.0%) |
| 3-Person Household | 0 (0.0%) | 0 (0.0%) |
| 4+ Person Household | 21 (75.0%) | 7 (25.0%) |
| Total Housing Units | 88 (80.7%) | 21 (19.3%) |
Occupancy by Educational Attainment in Chewey
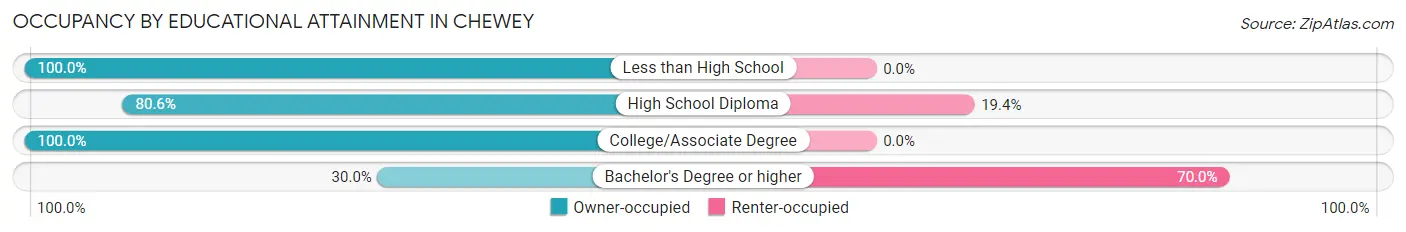
| Household Size | Owner-occupied | Renter-occupied |
| Less than High School | 19 (100.0%) | 0 (0.0%) |
| High School Diploma | 58 (80.6%) | 14 (19.4%) |
| College/Associate Degree | 8 (100.0%) | 0 (0.0%) |
| Bachelor's Degree or higher | 3 (30.0%) | 7 (70.0%) |
Occupancy by Age of Householder in Chewey
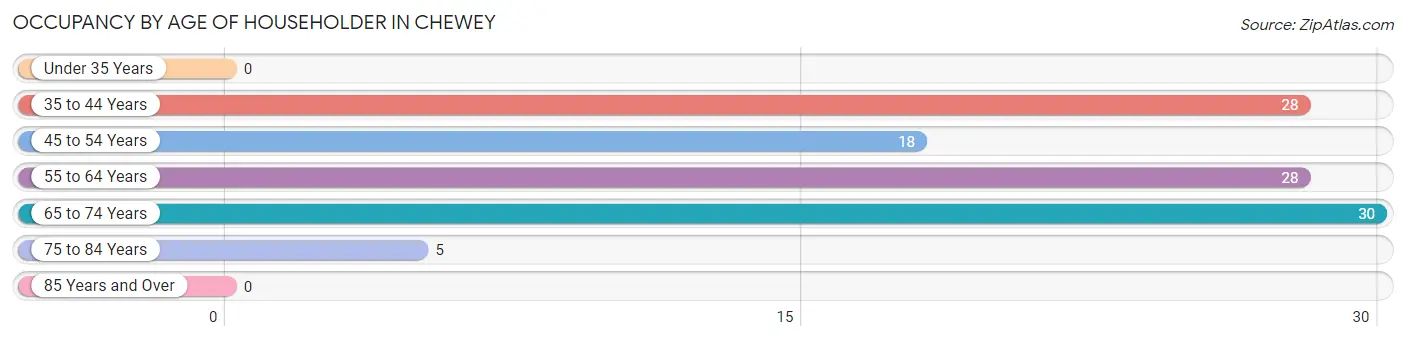
| Age Bracket | # Households | % Households |
| Under 35 Years | 0 | 0.0% |
| 35 to 44 Years | 28 | 25.7% |
| 45 to 54 Years | 18 | 16.5% |
| 55 to 64 Years | 28 | 25.7% |
| 65 to 74 Years | 30 | 27.5% |
| 75 to 84 Years | 5 | 4.6% |
| 85 Years and Over | 0 | 0.0% |
| Total | 109 | 100.0% |
Housing Finances in Chewey
Median Income by Occupancy in Chewey
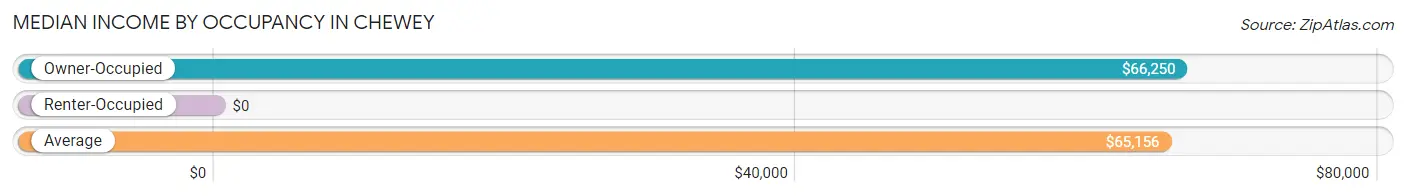
| Occupancy Type | # Households | Median Income |
| Owner-Occupied | 88 (80.7%) | $66,250 |
| Renter-Occupied | 21 (19.3%) | $0 |
| Average | 109 (100.0%) | $65,156 |
Occupancy by Householder Income Bracket in Chewey
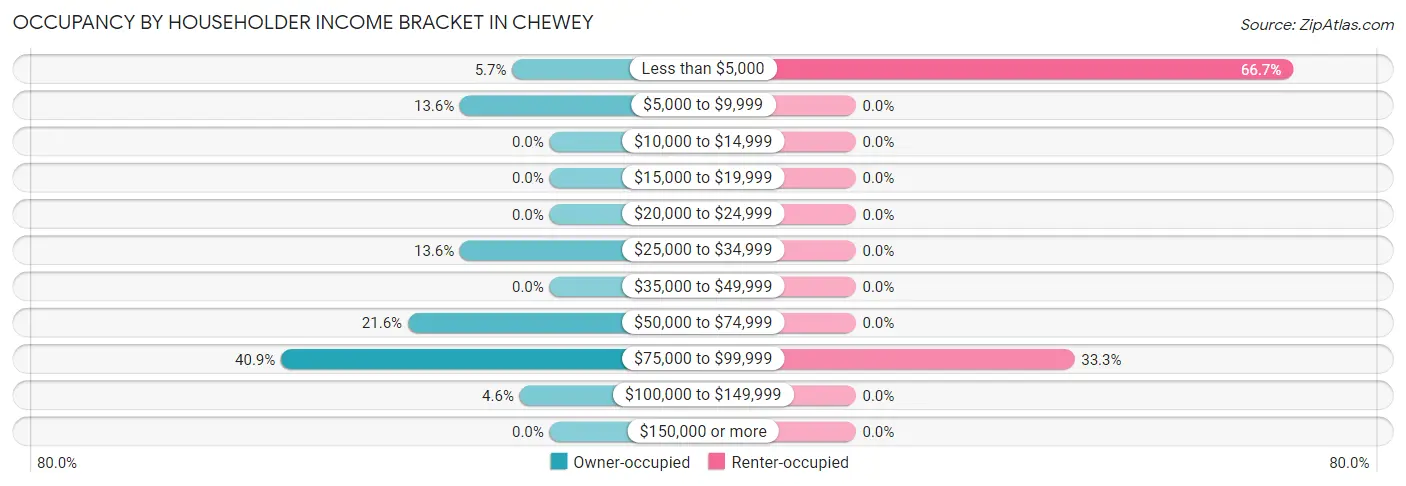
| Income Bracket | Owner-occupied | Renter-occupied |
| Less than $5,000 | 5 (5.7%) | 14 (66.7%) |
| $5,000 to $9,999 | 12 (13.6%) | 0 (0.0%) |
| $10,000 to $14,999 | 0 (0.0%) | 0 (0.0%) |
| $15,000 to $19,999 | 0 (0.0%) | 0 (0.0%) |
| $20,000 to $24,999 | 0 (0.0%) | 0 (0.0%) |
| $25,000 to $34,999 | 12 (13.6%) | 0 (0.0%) |
| $35,000 to $49,999 | 0 (0.0%) | 0 (0.0%) |
| $50,000 to $74,999 | 19 (21.6%) | 0 (0.0%) |
| $75,000 to $99,999 | 36 (40.9%) | 7 (33.3%) |
| $100,000 to $149,999 | 4 (4.5%) | 0 (0.0%) |
| $150,000 or more | 0 (0.0%) | 0 (0.0%) |
| Total | 88 (100.0%) | 21 (100.0%) |
Monthly Housing Cost Tiers in Chewey
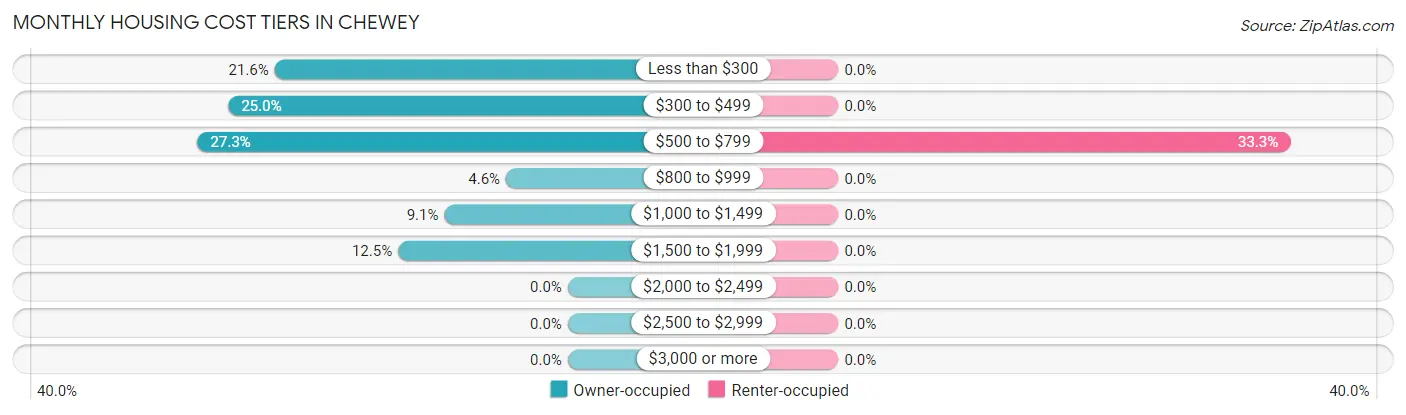
| Monthly Cost | Owner-occupied | Renter-occupied |
| Less than $300 | 19 (21.6%) | 0 (0.0%) |
| $300 to $499 | 22 (25.0%) | 0 (0.0%) |
| $500 to $799 | 24 (27.3%) | 7 (33.3%) |
| $800 to $999 | 4 (4.5%) | 0 (0.0%) |
| $1,000 to $1,499 | 8 (9.1%) | 0 (0.0%) |
| $1,500 to $1,999 | 11 (12.5%) | 0 (0.0%) |
| $2,000 to $2,499 | 0 (0.0%) | 0 (0.0%) |
| $2,500 to $2,999 | 0 (0.0%) | 0 (0.0%) |
| $3,000 or more | 0 (0.0%) | 0 (0.0%) |
| Total | 88 (100.0%) | 21 (100.0%) |
Physical Housing Characteristics in Chewey
Housing Structures in Chewey
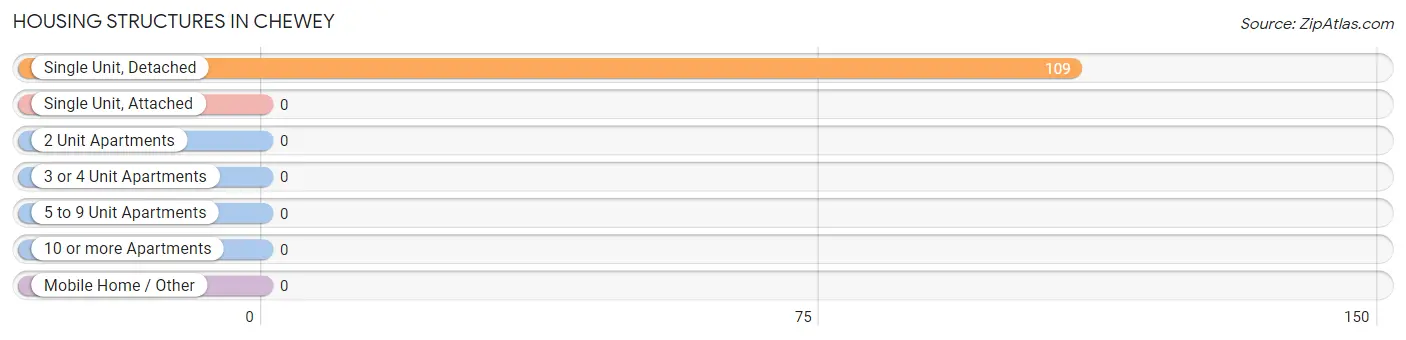
| Structure Type | # Housing Units | % Housing Units |
| Single Unit, Detached | 109 | 100.0% |
| Single Unit, Attached | 0 | 0.0% |
| 2 Unit Apartments | 0 | 0.0% |
| 3 or 4 Unit Apartments | 0 | 0.0% |
| 5 to 9 Unit Apartments | 0 | 0.0% |
| 10 or more Apartments | 0 | 0.0% |
| Mobile Home / Other | 0 | 0.0% |
| Total | 109 | 100.0% |
Housing Structures by Occupancy in Chewey
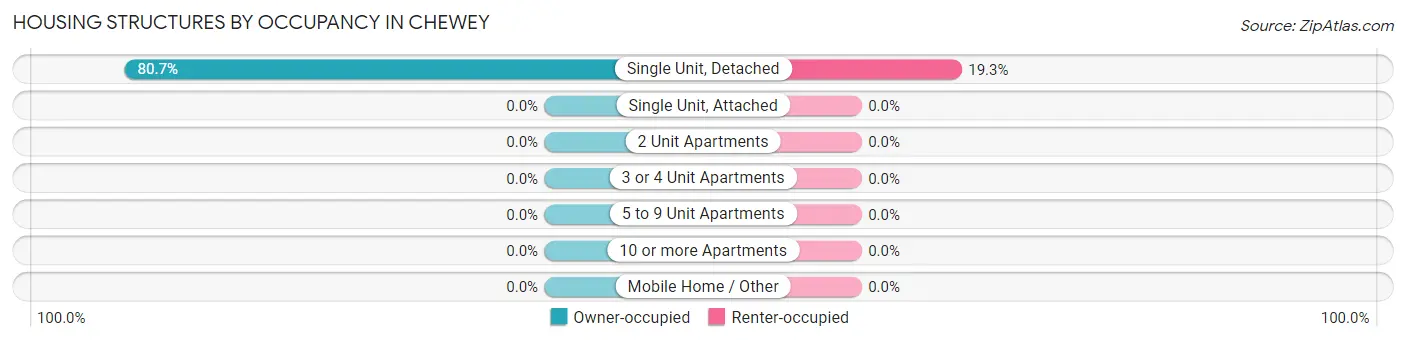
| Structure Type | Owner-occupied | Renter-occupied |
| Single Unit, Detached | 88 (80.7%) | 21 (19.3%) |
| Single Unit, Attached | 0 (0.0%) | 0 (0.0%) |
| 2 Unit Apartments | 0 (0.0%) | 0 (0.0%) |
| 3 or 4 Unit Apartments | 0 (0.0%) | 0 (0.0%) |
| 5 to 9 Unit Apartments | 0 (0.0%) | 0 (0.0%) |
| 10 or more Apartments | 0 (0.0%) | 0 (0.0%) |
| Mobile Home / Other | 0 (0.0%) | 0 (0.0%) |
| Total | 88 (80.7%) | 21 (19.3%) |
Housing Structures by Number of Rooms in Chewey
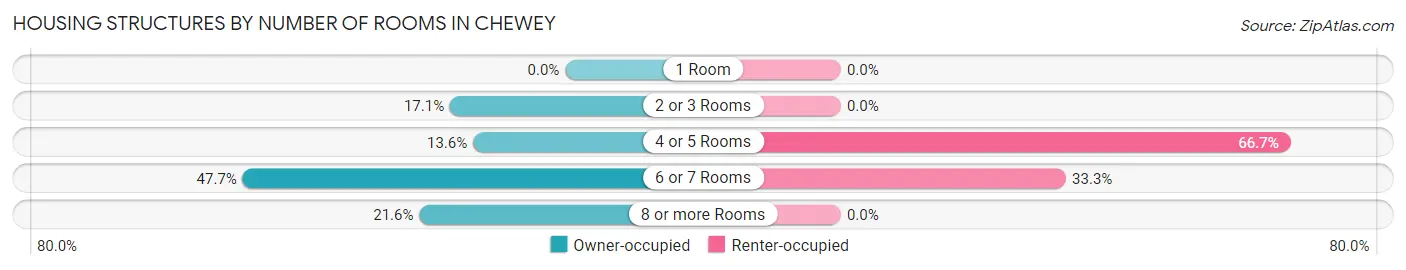
| Number of Rooms | Owner-occupied | Renter-occupied |
| 1 Room | 0 (0.0%) | 0 (0.0%) |
| 2 or 3 Rooms | 15 (17.1%) | 0 (0.0%) |
| 4 or 5 Rooms | 12 (13.6%) | 14 (66.7%) |
| 6 or 7 Rooms | 42 (47.7%) | 7 (33.3%) |
| 8 or more Rooms | 19 (21.6%) | 0 (0.0%) |
| Total | 88 (100.0%) | 21 (100.0%) |
Housing Structure by Heating Type in Chewey
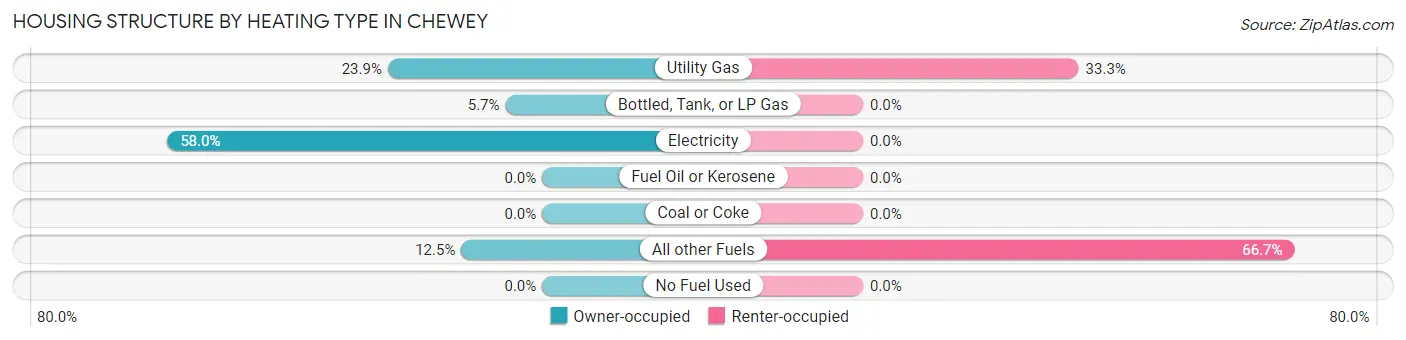
| Heating Type | Owner-occupied | Renter-occupied |
| Utility Gas | 21 (23.9%) | 7 (33.3%) |
| Bottled, Tank, or LP Gas | 5 (5.7%) | 0 (0.0%) |
| Electricity | 51 (58.0%) | 0 (0.0%) |
| Fuel Oil or Kerosene | 0 (0.0%) | 0 (0.0%) |
| Coal or Coke | 0 (0.0%) | 0 (0.0%) |
| All other Fuels | 11 (12.5%) | 14 (66.7%) |
| No Fuel Used | 0 (0.0%) | 0 (0.0%) |
| Total | 88 (100.0%) | 21 (100.0%) |
Household Vehicle Usage in Chewey
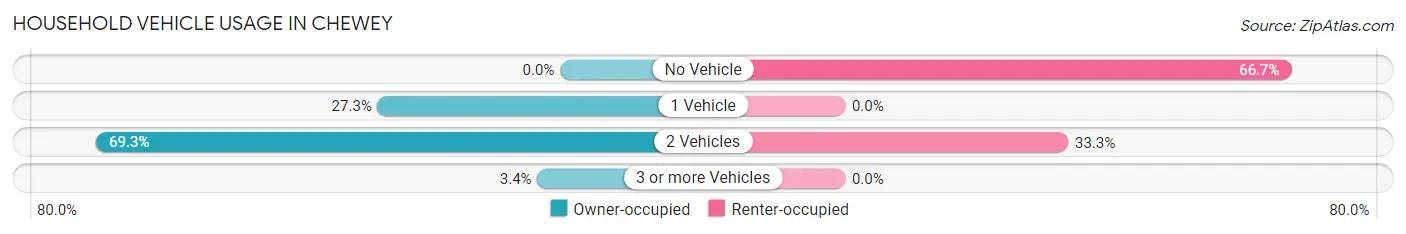
| Vehicles per Household | Owner-occupied | Renter-occupied |
| No Vehicle | 0 (0.0%) | 14 (66.7%) |
| 1 Vehicle | 24 (27.3%) | 0 (0.0%) |
| 2 Vehicles | 61 (69.3%) | 7 (33.3%) |
| 3 or more Vehicles | 3 (3.4%) | 0 (0.0%) |
| Total | 88 (100.0%) | 21 (100.0%) |
Real Estate & Mortgages in Chewey
Real Estate and Mortgage Overview in Chewey
| Characteristic | Without Mortgage | With Mortgage |
| Housing Units | 65 | 23 |
| Median Property Value | $107,400 | $0 |
| Median Household Income | $66,094 | $0 |
| Monthly Housing Costs | $398 | $0 |
| Real Estate Taxes | $822 | $4 |
Property Value by Mortgage Status in Chewey
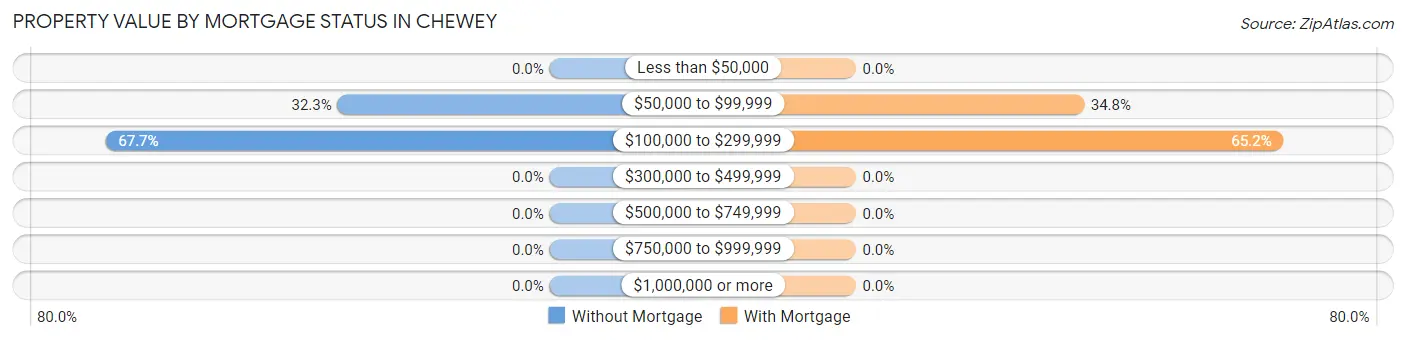
| Property Value | Without Mortgage | With Mortgage |
| Less than $50,000 | 0 (0.0%) | 0 (0.0%) |
| $50,000 to $99,999 | 21 (32.3%) | 8 (34.8%) |
| $100,000 to $299,999 | 44 (67.7%) | 15 (65.2%) |
| $300,000 to $499,999 | 0 (0.0%) | 0 (0.0%) |
| $500,000 to $749,999 | 0 (0.0%) | 0 (0.0%) |
| $750,000 to $999,999 | 0 (0.0%) | 0 (0.0%) |
| $1,000,000 or more | 0 (0.0%) | 0 (0.0%) |
| Total | 65 (100.0%) | 23 (100.0%) |
Household Income by Mortgage Status in Chewey
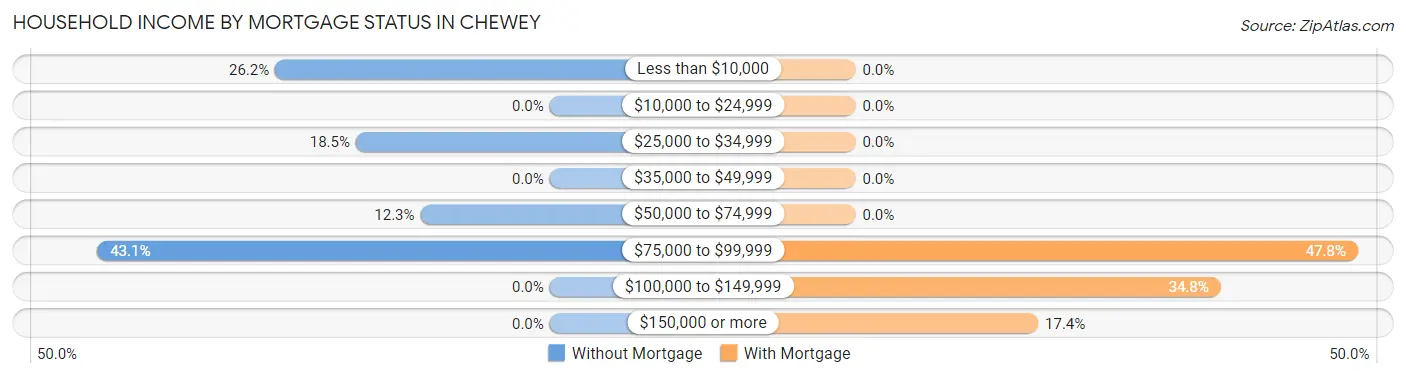
| Household Income | Without Mortgage | With Mortgage |
| Less than $10,000 | 17 (26.2%) | 0 (0.0%) |
| $10,000 to $24,999 | 0 (0.0%) | 0 (0.0%) |
| $25,000 to $34,999 | 12 (18.5%) | 0 (0.0%) |
| $35,000 to $49,999 | 0 (0.0%) | 0 (0.0%) |
| $50,000 to $74,999 | 8 (12.3%) | 0 (0.0%) |
| $75,000 to $99,999 | 28 (43.1%) | 11 (47.8%) |
| $100,000 to $149,999 | 0 (0.0%) | 8 (34.8%) |
| $150,000 or more | 0 (0.0%) | 4 (17.4%) |
| Total | 65 (100.0%) | 23 (100.0%) |
Property Value to Household Income Ratio in Chewey
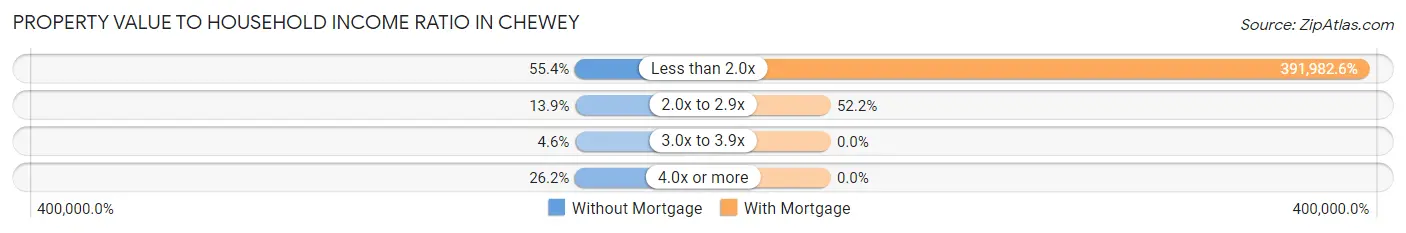
| Value-to-Income Ratio | Without Mortgage | With Mortgage |
| Less than 2.0x | 36 (55.4%) | 90,156 (391,982.6%) |
| 2.0x to 2.9x | 9 (13.9%) | 12 (52.2%) |
| 3.0x to 3.9x | 3 (4.6%) | 0 (0.0%) |
| 4.0x or more | 17 (26.2%) | 0 (0.0%) |
| Total | 65 (100.0%) | 23 (100.0%) |
Real Estate Taxes by Mortgage Status in Chewey
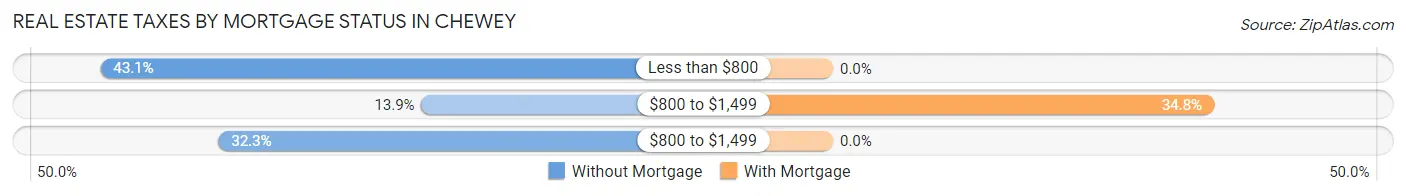
| Property Taxes | Without Mortgage | With Mortgage |
| Less than $800 | 28 (43.1%) | 0 (0.0%) |
| $800 to $1,499 | 9 (13.9%) | 8 (34.8%) |
| $800 to $1,499 | 21 (32.3%) | 0 (0.0%) |
| Total | 65 (100.0%) | 23 (100.0%) |
Health & Disability in Chewey
Health Insurance Coverage by Age in Chewey
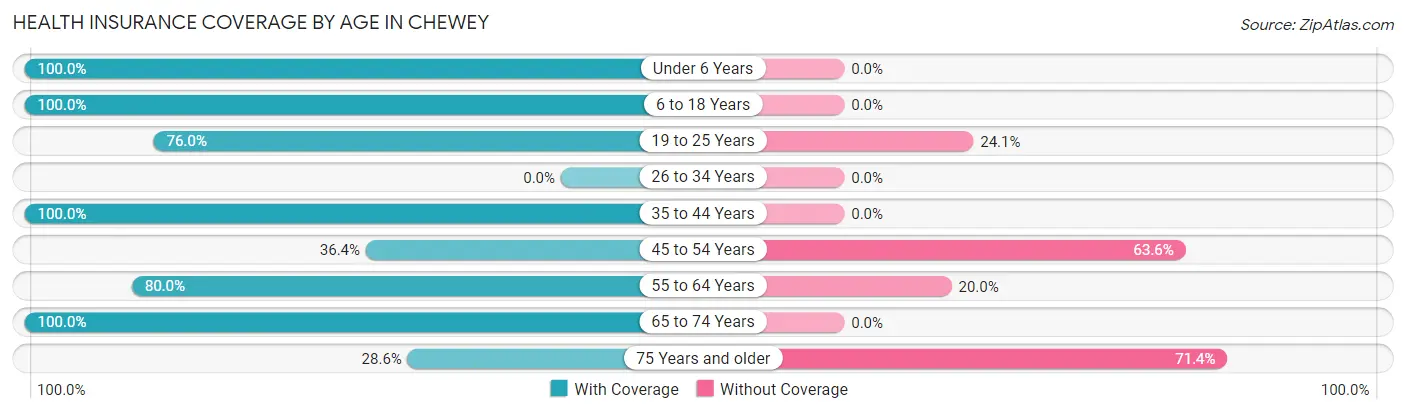
| Age Bracket | With Coverage | Without Coverage |
| Under 6 Years | 11 (100.0%) | 0 (0.0%) |
| 6 to 18 Years | 70 (100.0%) | 0 (0.0%) |
| 19 to 25 Years | 60 (75.9%) | 19 (24.0%) |
| 26 to 34 Years | 0 (0.0%) | 0 (0.0%) |
| 35 to 44 Years | 50 (100.0%) | 0 (0.0%) |
| 45 to 54 Years | 8 (36.4%) | 14 (63.6%) |
| 55 to 64 Years | 32 (80.0%) | 8 (20.0%) |
| 65 to 74 Years | 40 (100.0%) | 0 (0.0%) |
| 75 Years and older | 2 (28.6%) | 5 (71.4%) |
| Total | 273 (85.6%) | 46 (14.4%) |
Health Insurance Coverage by Citizenship Status in Chewey
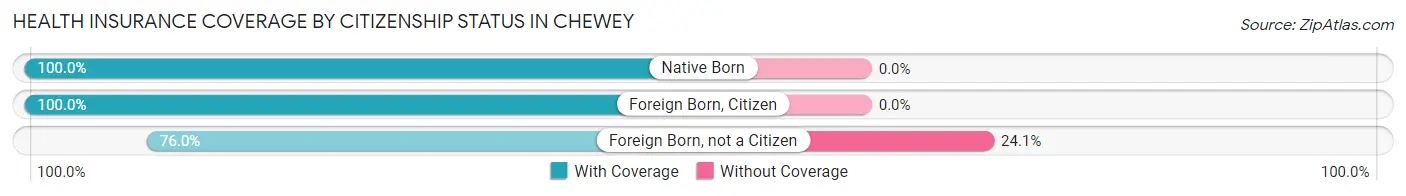
| Citizenship Status | With Coverage | Without Coverage |
| Native Born | 11 (100.0%) | 0 (0.0%) |
| Foreign Born, Citizen | 70 (100.0%) | 0 (0.0%) |
| Foreign Born, not a Citizen | 60 (75.9%) | 19 (24.0%) |
Health Insurance Coverage by Household Income in Chewey
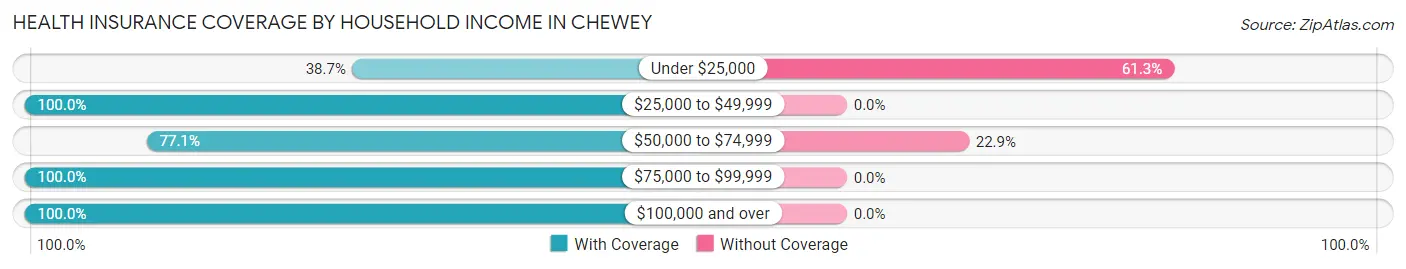
| Household Income | With Coverage | Without Coverage |
| Under $25,000 | 12 (38.7%) | 19 (61.3%) |
| $25,000 to $49,999 | 14 (100.0%) | 0 (0.0%) |
| $50,000 to $74,999 | 27 (77.1%) | 8 (22.9%) |
| $75,000 to $99,999 | 132 (100.0%) | 0 (0.0%) |
| $100,000 and over | 8 (100.0%) | 0 (0.0%) |
Public vs Private Health Insurance Coverage by Age in Chewey
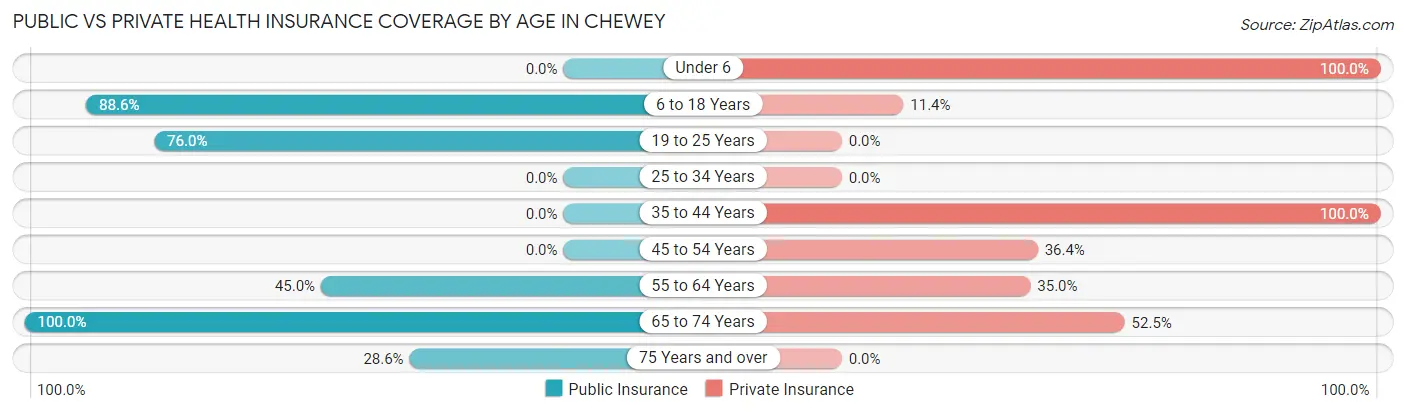
| Age Bracket | Public Insurance | Private Insurance |
| Under 6 | 0 (0.0%) | 11 (100.0%) |
| 6 to 18 Years | 62 (88.6%) | 8 (11.4%) |
| 19 to 25 Years | 60 (75.9%) | 0 (0.0%) |
| 25 to 34 Years | 0 (0.0%) | 0 (0.0%) |
| 35 to 44 Years | 0 (0.0%) | 50 (100.0%) |
| 45 to 54 Years | 0 (0.0%) | 8 (36.4%) |
| 55 to 64 Years | 18 (45.0%) | 14 (35.0%) |
| 65 to 74 Years | 40 (100.0%) | 21 (52.5%) |
| 75 Years and over | 2 (28.6%) | 0 (0.0%) |
| Total | 182 (57.1%) | 112 (35.1%) |
Disability Status by Sex by Age in Chewey
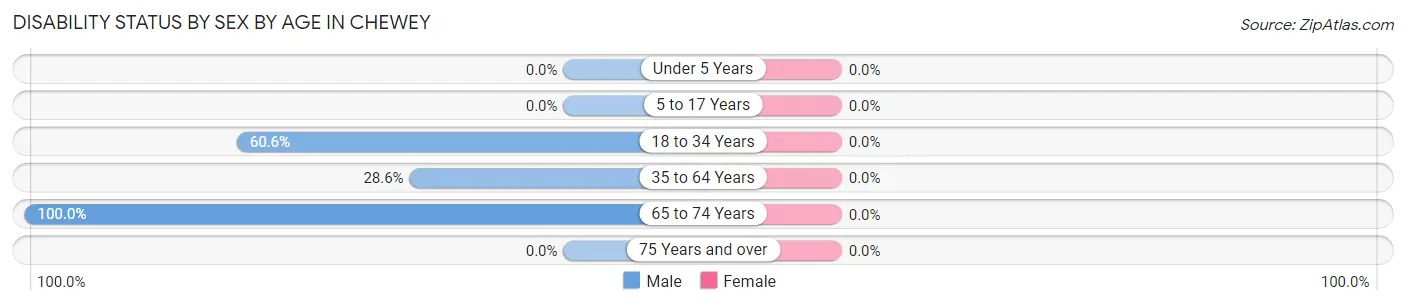
| Age Bracket | Male | Female |
| Under 5 Years | 0 (0.0%) | 0 (0.0%) |
| 5 to 17 Years | 0 (0.0%) | 0 (0.0%) |
| 18 to 34 Years | 60 (60.6%) | 0 (0.0%) |
| 35 to 64 Years | 20 (28.6%) | 0 (0.0%) |
| 65 to 74 Years | 20 (100.0%) | 0 (0.0%) |
| 75 Years and over | 0 (0.0%) | 0 (0.0%) |
Disability Class by Sex by Age in Chewey
Disability Class: Hearing Difficulty
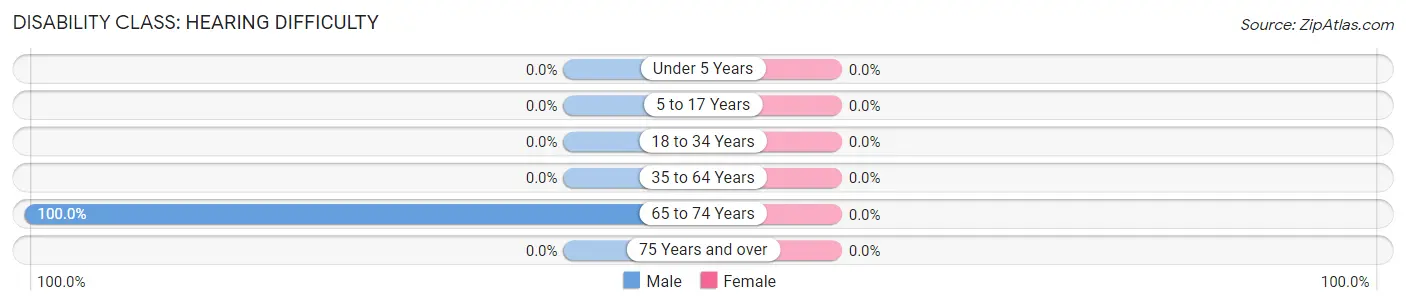
| Age Bracket | Male | Female |
| Under 5 Years | 0 (0.0%) | 0 (0.0%) |
| 5 to 17 Years | 0 (0.0%) | 0 (0.0%) |
| 18 to 34 Years | 0 (0.0%) | 0 (0.0%) |
| 35 to 64 Years | 0 (0.0%) | 0 (0.0%) |
| 65 to 74 Years | 20 (100.0%) | 0 (0.0%) |
| 75 Years and over | 0 (0.0%) | 0 (0.0%) |
Disability Class: Vision Difficulty
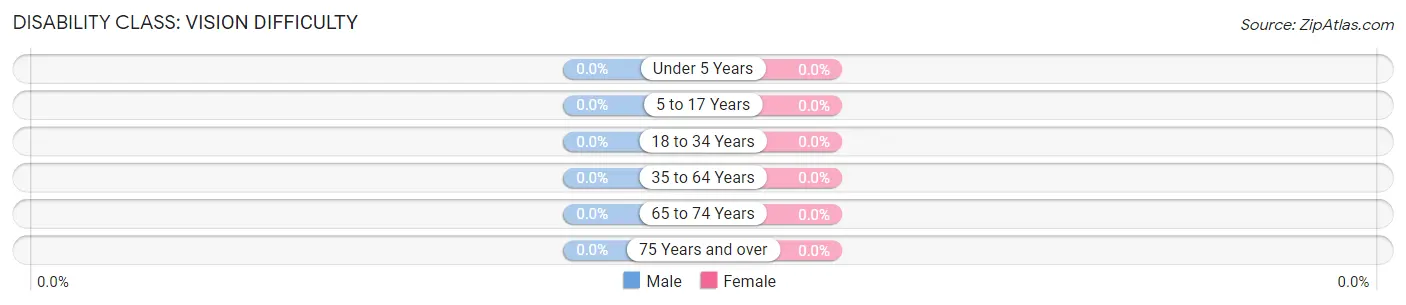
| Age Bracket | Male | Female |
| Under 5 Years | 0 (0.0%) | 0 (0.0%) |
| 5 to 17 Years | 0 (0.0%) | 0 (0.0%) |
| 18 to 34 Years | 0 (0.0%) | 0 (0.0%) |
| 35 to 64 Years | 0 (0.0%) | 0 (0.0%) |
| 65 to 74 Years | 0 (0.0%) | 0 (0.0%) |
| 75 Years and over | 0 (0.0%) | 0 (0.0%) |
Disability Class: Cognitive Difficulty
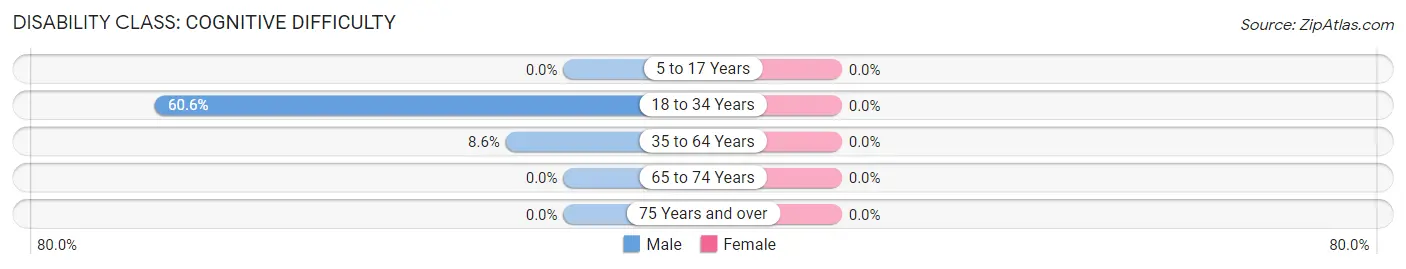
| Age Bracket | Male | Female |
| 5 to 17 Years | 0 (0.0%) | 0 (0.0%) |
| 18 to 34 Years | 60 (60.6%) | 0 (0.0%) |
| 35 to 64 Years | 6 (8.6%) | 0 (0.0%) |
| 65 to 74 Years | 0 (0.0%) | 0 (0.0%) |
| 75 Years and over | 0 (0.0%) | 0 (0.0%) |
Disability Class: Ambulatory Difficulty
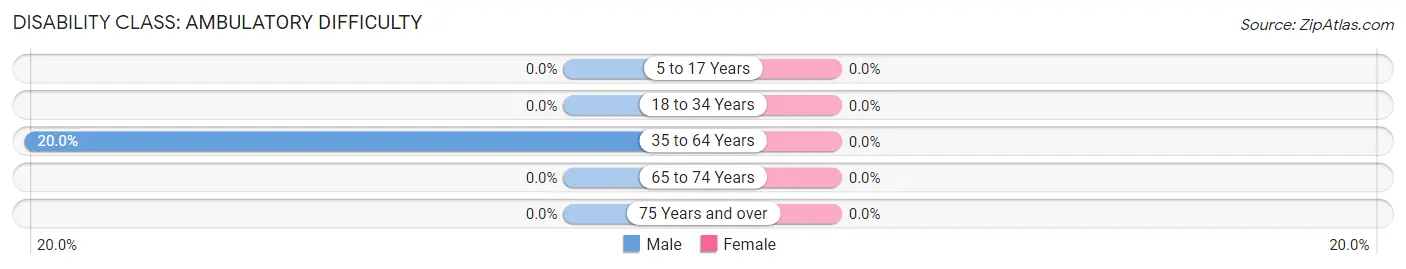
| Age Bracket | Male | Female |
| 5 to 17 Years | 0 (0.0%) | 0 (0.0%) |
| 18 to 34 Years | 0 (0.0%) | 0 (0.0%) |
| 35 to 64 Years | 14 (20.0%) | 0 (0.0%) |
| 65 to 74 Years | 0 (0.0%) | 0 (0.0%) |
| 75 Years and over | 0 (0.0%) | 0 (0.0%) |
Disability Class: Self-Care Difficulty
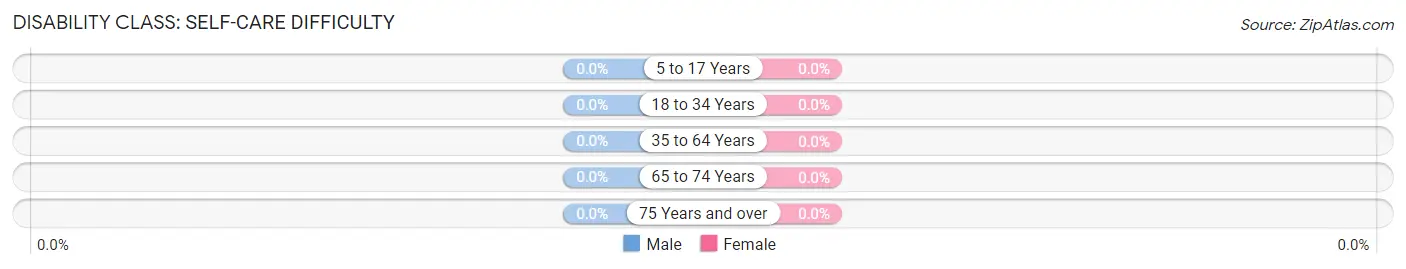
| Age Bracket | Male | Female |
| 5 to 17 Years | 0 (0.0%) | 0 (0.0%) |
| 18 to 34 Years | 0 (0.0%) | 0 (0.0%) |
| 35 to 64 Years | 0 (0.0%) | 0 (0.0%) |
| 65 to 74 Years | 0 (0.0%) | 0 (0.0%) |
| 75 Years and over | 0 (0.0%) | 0 (0.0%) |
Technology Access in Chewey
Computing Device Access in Chewey
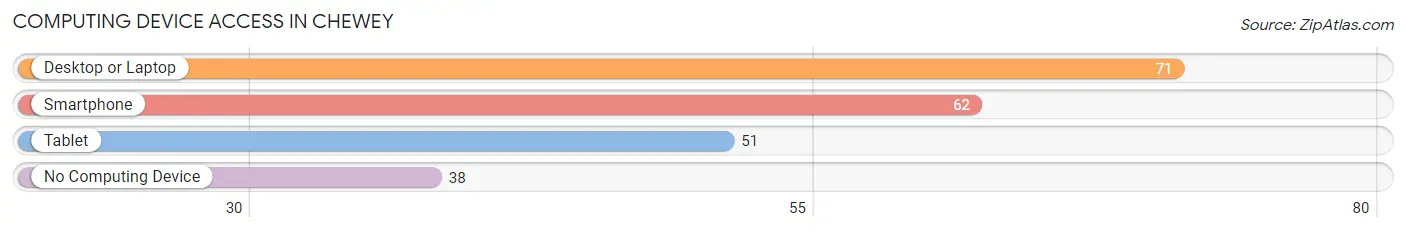
| Device Type | # Households | % Households |
| Desktop or Laptop | 71 | 65.1% |
| Smartphone | 62 | 56.9% |
| Tablet | 51 | 46.8% |
| No Computing Device | 38 | 34.9% |
| Total | 109 | 100.0% |
Internet Access in Chewey
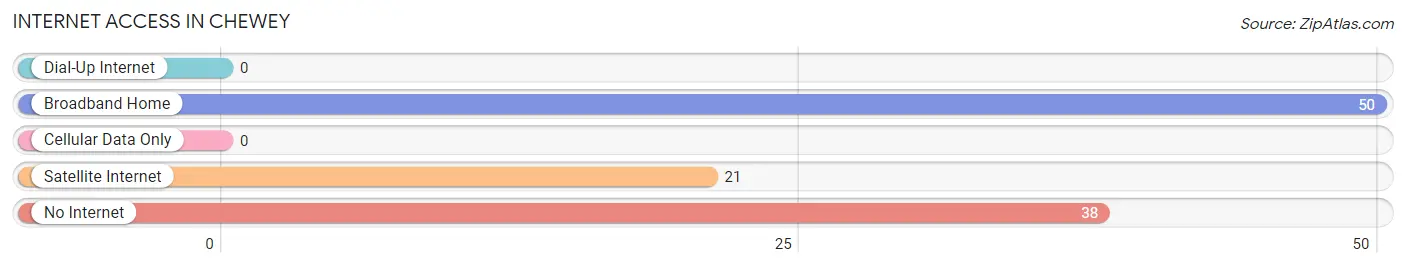
| Internet Type | # Households | % Households |
| Dial-Up Internet | 0 | 0.0% |
| Broadband Home | 50 | 45.9% |
| Cellular Data Only | 0 | 0.0% |
| Satellite Internet | 21 | 19.3% |
| No Internet | 38 | 34.9% |
| Total | 109 | 100.0% |
Chewey Summary
Chewey, Oklahoma is a small town located in the southeastern corner of the state. It is situated in the foothills of the Ouachita Mountains and is part of the Ouachita National Forest. The town is located in Le Flore County and is approximately 20 miles from the Arkansas border. The population of Chewey was estimated to be around 1,000 people in 2020.
History
Chewey was founded in 1891 by a group of settlers from Arkansas. The town was named after a local Native American chief, Chief Chewey. The town was originally a farming community and the main crops grown were cotton, corn, and wheat. The town also had a sawmill and a gristmill.
In the early 1900s, the town began to grow and the population increased. The town was incorporated in 1910 and the first mayor was elected in 1911. The town continued to grow and by the 1920s, it had a population of over 1,000 people.
In the 1930s, the Great Depression hit the town hard and many of the businesses closed. The population decreased and the town struggled to survive. However, the town was able to recover and by the 1950s, the population had increased to over 1,500 people.
Geography
Chewey is located in the southeastern corner of Oklahoma in Le Flore County. The town is situated in the foothills of the Ouachita Mountains and is part of the Ouachita National Forest. The town is located approximately 20 miles from the Arkansas border.
The town is located on the banks of the Poteau River and is surrounded by rolling hills and forests. The town is located in a humid subtropical climate zone and experiences hot summers and mild winters. The average annual temperature is around 65 degrees Fahrenheit.
Economy
The economy of Chewey is largely based on agriculture and forestry. The town is home to several farms that grow cotton, corn, and wheat. The town also has a sawmill and a gristmill.
The town is also home to several small businesses, including restaurants, stores, and a few manufacturing companies. The town also has a few tourist attractions, including a museum and a historic district.
Demographics
The population of Chewey was estimated to be around 1,000 people in 2020. The town is predominantly white, with around 95% of the population being white. The remaining 5% of the population is made up of African Americans, Native Americans, and other races.
The median household income in Chewey is around $35,000 and the median home value is around $90,000. The town has a low unemployment rate and a high rate of homeownership.
Conclusion
Chewey, Oklahoma is a small town located in the southeastern corner of the state. It is situated in the foothills of the Ouachita Mountains and is part of the Ouachita National Forest. The town is home to around 1,000 people and is predominantly white. The economy of Chewey is largely based on agriculture and forestry and the town is home to several small businesses. The town also has a few tourist attractions, including a museum and a historic district.
Common Questions
What is Per Capita Income in Chewey?
Per Capita income in Chewey is $16,459.
What is the Median Family Income in Chewey?
Median Family Income in Chewey is $91,094.
What is the Median Household income in Chewey?
Median Household Income in Chewey is $65,156.
What is Inequality or Gini Index in Chewey?
Inequality or Gini Index in Chewey is 0.39.
What is the Total Population of Chewey?
Total Population of Chewey is 346.
What is the Total Male Population of Chewey?
Total Male Population of Chewey is 234.
What is the Total Female Population of Chewey?
Total Female Population of Chewey is 112.
What is the Ratio of Males per 100 Females in Chewey?
There are 208.93 Males per 100 Females in Chewey.
What is the Ratio of Females per 100 Males in Chewey?
There are 47.86 Females per 100 Males in Chewey.
What is the Median Population Age in Chewey?
Median Population Age in Chewey is 24.7 Years.
What is the Average Family Size in Chewey
Average Family Size in Chewey is 2.9 People.
What is the Average Household Size in Chewey
Average Household Size in Chewey is 2.0 People.
How Large is the Labor Force in Chewey?
There are 87 People in the Labor Forcein in Chewey.
What is the Percentage of People in the Labor Force in Chewey?
33.2% of People are in the Labor Force in Chewey.