Redland, AL Map & Demographics
Redland Map
Redland Overview
$42,945
PER CAPITA INCOME
$130,538
AVG FAMILY INCOME
$121,033
AVG HOUSEHOLD INCOME
49.7%
WAGE / INCOME GAP [ % ]
50.3¢/ $1
WAGE / INCOME GAP [ $ ]
0.31
INEQUALITY / GINI INDEX
4,960
TOTAL POPULATION
2,386
MALE POPULATION
2,574
FEMALE POPULATION
92.70
MALES / 100 FEMALES
107.88
FEMALES / 100 MALES
38.8
MEDIAN AGE
3.2
AVG FAMILY SIZE
2.9
AVG HOUSEHOLD SIZE
2,721
LABOR FORCE [ PEOPLE ]
66.6%
PERCENT IN LABOR FORCE
1.3%
UNEMPLOYMENT RATE
Income in Redland
Income Overview in Redland
Per Capita Income in Redland is $42,945, while median incomes of families and households are $130,538 and $121,033 respectively.
| Characteristic | Number | Measure |
| Per Capita Income | 4,960 | $42,945 |
| Median Family Income | 1,427 | $130,538 |
| Mean Family Income | 1,427 | $135,936 |
| Median Household Income | 1,720 | $121,033 |
| Mean Household Income | 1,720 | $122,750 |
| Income Deficit | 1,427 | $0 |
| Wage / Income Gap (%) | 4,960 | 49.70% |
| Wage / Income Gap ($) | 4,960 | 50.30¢ per $1 |
| Gini / Inequality Index | 4,960 | 0.31 |
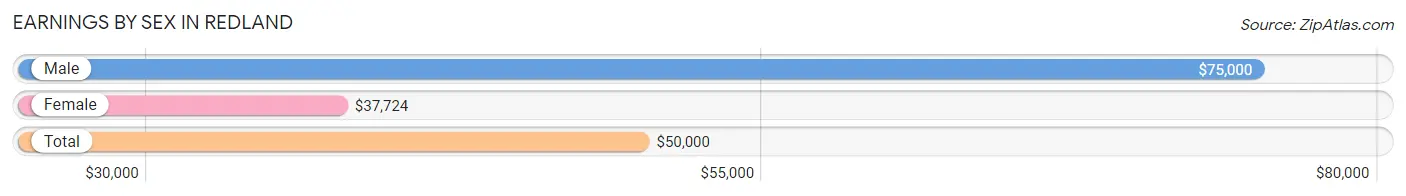
Earnings by Sex in Redland
Average Earnings in Redland are $50,000, $75,000 for men and $37,724 for women, a difference of 49.7%.
| Sex | Number | Average Earnings |
| Male | 1,470 (51.8%) | $75,000 |
| Female | 1,370 (48.2%) | $37,724 |
| Total | 2,840 (100.0%) | $50,000 |
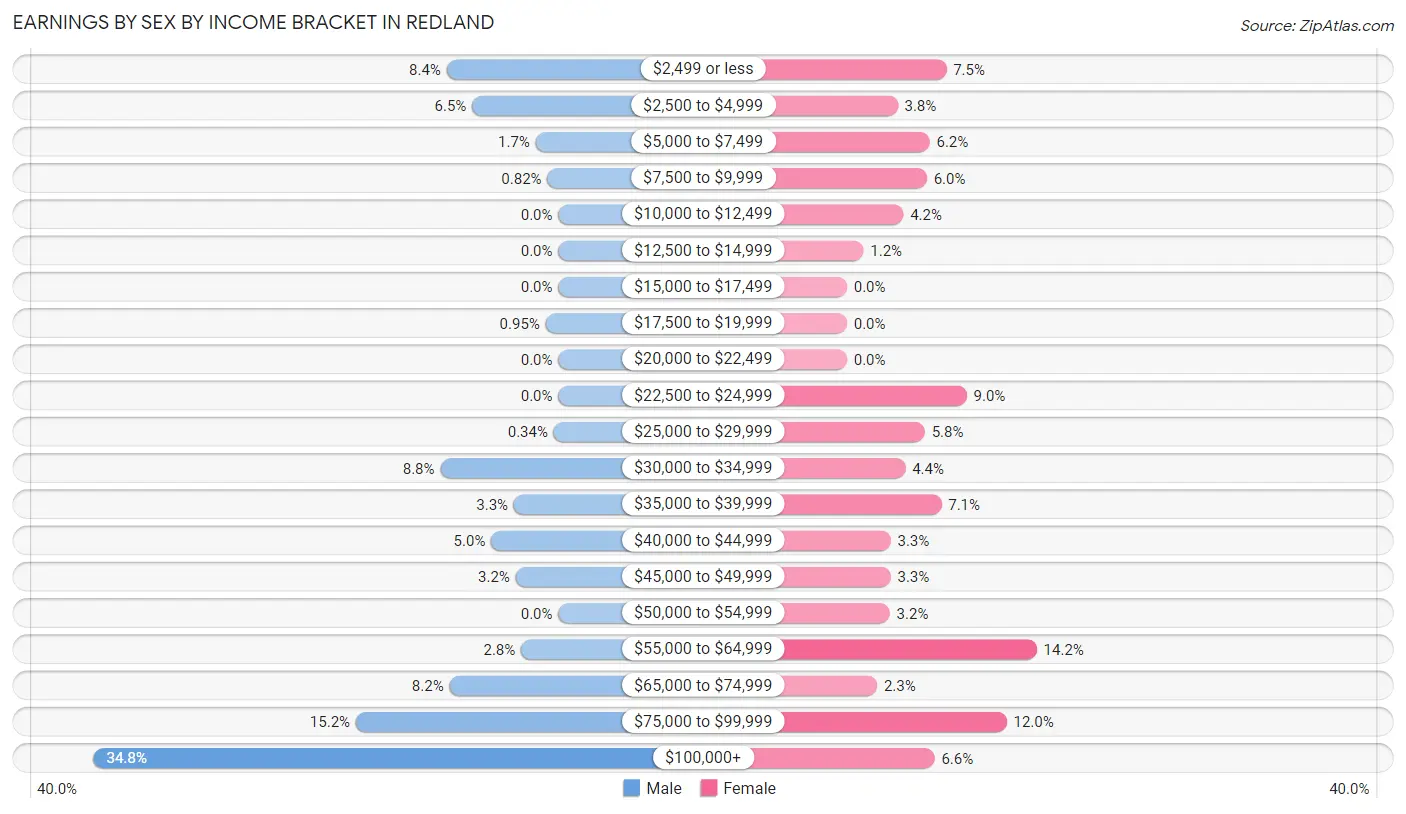
Earnings by Sex by Income Bracket in Redland
The most common earnings brackets in Redland are $100,000+ for men (512 | 34.8%) and $55,000 to $64,999 for women (195 | 14.2%).
| Income | Male | Female |
| $2,499 or less | 123 (8.4%) | 102 (7.4%) |
| $2,500 to $4,999 | 95 (6.5%) | 52 (3.8%) |
| $5,000 to $7,499 | 25 (1.7%) | 85 (6.2%) |
| $7,500 to $9,999 | 12 (0.8%) | 82 (6.0%) |
| $10,000 to $12,499 | 0 (0.0%) | 58 (4.2%) |
| $12,500 to $14,999 | 0 (0.0%) | 17 (1.2%) |
| $15,000 to $17,499 | 0 (0.0%) | 0 (0.0%) |
| $17,500 to $19,999 | 14 (0.9%) | 0 (0.0%) |
| $20,000 to $22,499 | 0 (0.0%) | 0 (0.0%) |
| $22,500 to $24,999 | 0 (0.0%) | 123 (9.0%) |
| $25,000 to $29,999 | 5 (0.3%) | 80 (5.8%) |
| $30,000 to $34,999 | 130 (8.8%) | 60 (4.4%) |
| $35,000 to $39,999 | 49 (3.3%) | 97 (7.1%) |
| $40,000 to $44,999 | 74 (5.0%) | 45 (3.3%) |
| $45,000 to $49,999 | 47 (3.2%) | 45 (3.3%) |
| $50,000 to $54,999 | 0 (0.0%) | 44 (3.2%) |
| $55,000 to $64,999 | 41 (2.8%) | 195 (14.2%) |
| $65,000 to $74,999 | 120 (8.2%) | 31 (2.3%) |
| $75,000 to $99,999 | 223 (15.2%) | 164 (12.0%) |
| $100,000+ | 512 (34.8%) | 90 (6.6%) |
| Total | 1,470 (100.0%) | 1,370 (100.0%) |
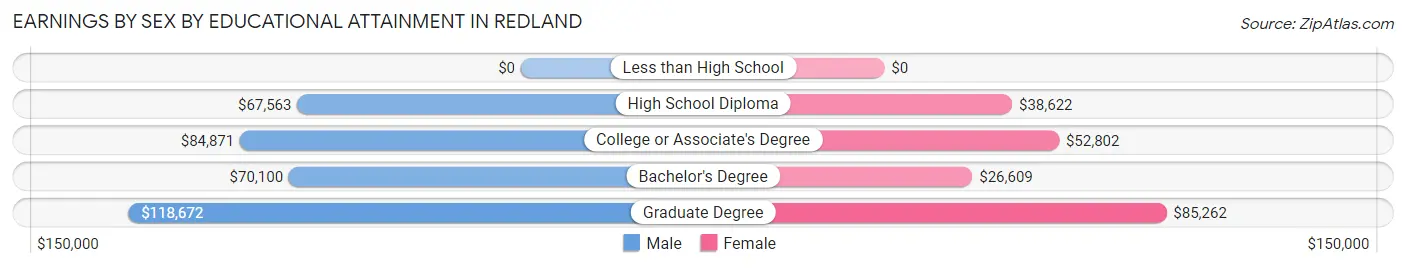
Earnings by Sex by Educational Attainment in Redland
Average earnings in Redland are $82,500 for men and $40,980 for women, a difference of 50.3%. Men with an educational attainment of graduate degree enjoy the highest average annual earnings of $118,672, while those with high school diploma education earn the least with $67,563. Women with an educational attainment of graduate degree earn the most with the average annual earnings of $85,262, while those with bachelor's degree education have the smallest earnings of $26,609.
| Educational Attainment | Male Income | Female Income |
| Less than High School | - | - |
| High School Diploma | $67,563 | $38,622 |
| College or Associate's Degree | $84,871 | $52,802 |
| Bachelor's Degree | $70,100 | $26,609 |
| Graduate Degree | $118,672 | $85,262 |
| Total | $82,500 | $40,980 |
Family Income in Redland
Family Income Brackets in Redland
According to the Redland family income data, there are 521 families falling into the $100,000 to $149,999 income range, which is the most common income bracket and makes up 36.5% of all families.
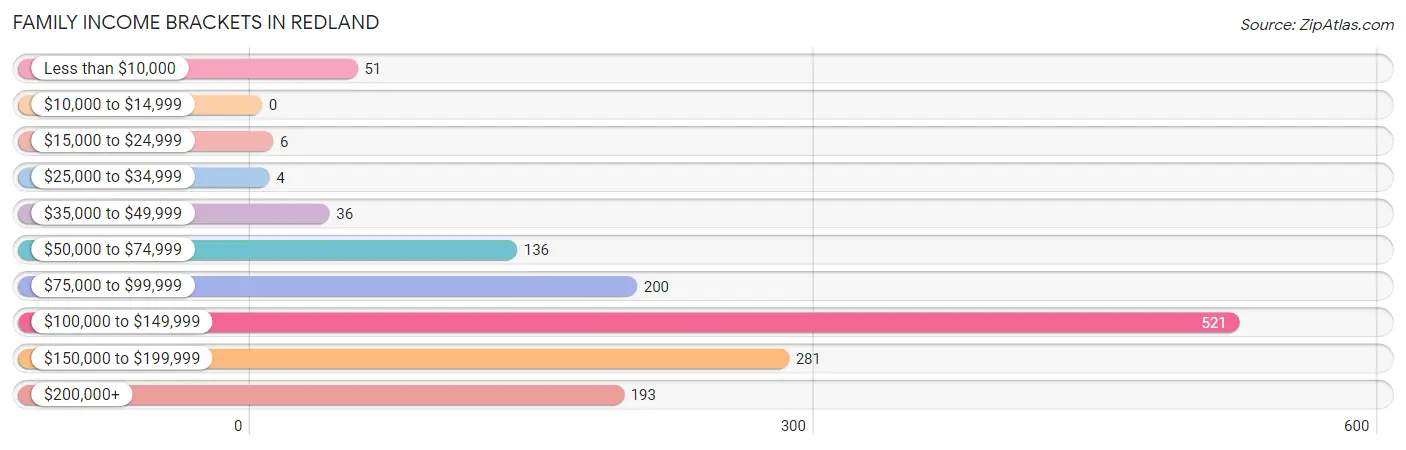
| Income Bracket | # Families | % Families |
| Less than $10,000 | 51 | 3.6% |
| $10,000 to $14,999 | 0 | 0.0% |
| $15,000 to $24,999 | 6 | 0.4% |
| $25,000 to $34,999 | 4 | 0.3% |
| $35,000 to $49,999 | 36 | 2.5% |
| $50,000 to $74,999 | 136 | 9.5% |
| $75,000 to $99,999 | 200 | 14.0% |
| $100,000 to $149,999 | 521 | 36.5% |
| $150,000 to $199,999 | 281 | 19.7% |
| $200,000+ | 193 | 13.5% |
Family Income by Famaliy Size in Redland
3-person families (237 | 16.6%) account for the highest median family income in Redland with $173,875 per family, while 2-person families (636 | 44.6%) have the highest median income of $59,962 per family member.
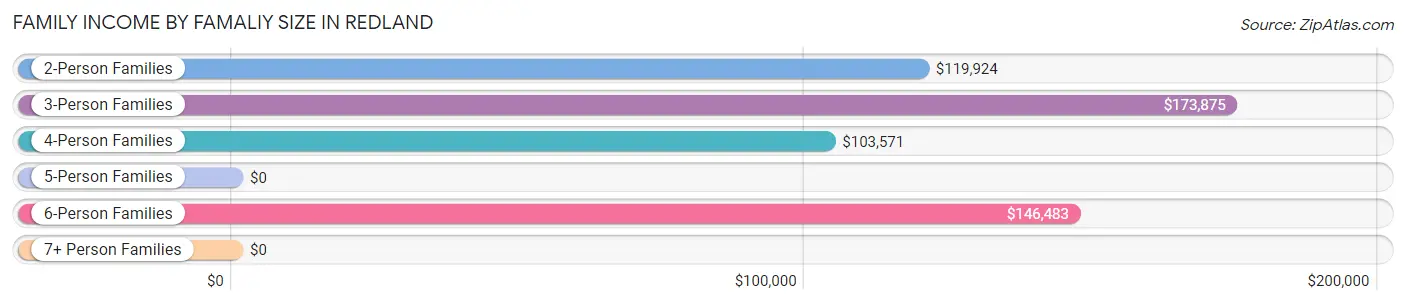
| Income Bracket | # Families | Median Income |
| 2-Person Families | 636 (44.6%) | $119,924 |
| 3-Person Families | 237 (16.6%) | $173,875 |
| 4-Person Families | 388 (27.2%) | $103,571 |
| 5-Person Families | 63 (4.4%) | $0 |
| 6-Person Families | 79 (5.5%) | $146,483 |
| 7+ Person Families | 24 (1.7%) | $0 |
| Total | 1,427 (100.0%) | $130,538 |
Family Income by Number of Earners in Redland
The median family income in Redland is $130,538, with families comprising 3+ earners (189) having the highest median family income of $183,661, while families with 1 earner (218) have the lowest median family income of $82,432, accounting for 13.2% and 15.3% of families, respectively.
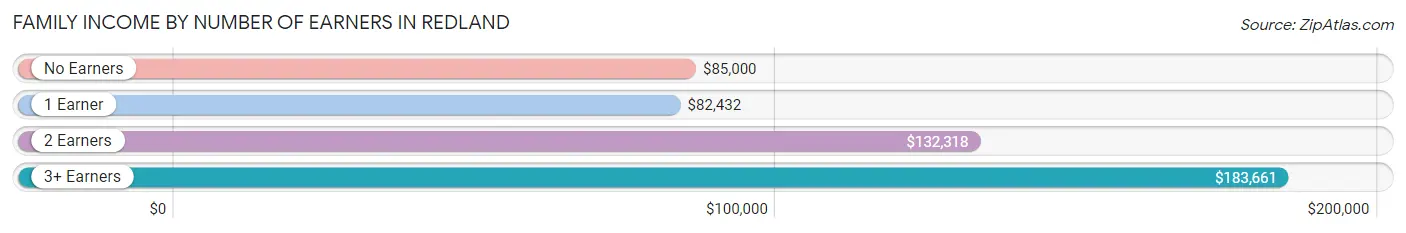
| Number of Earners | # Families | Median Income |
| No Earners | 168 (11.8%) | $85,000 |
| 1 Earner | 218 (15.3%) | $82,432 |
| 2 Earners | 852 (59.7%) | $132,318 |
| 3+ Earners | 189 (13.2%) | $183,661 |
| Total | 1,427 (100.0%) | $130,538 |
Household Income in Redland
Household Income Brackets in Redland
With 578 households falling in the category, the $100,000 to $149,999 income range is the most frequent in Redland, accounting for 33.6% of all households. In contrast, only 14 households (0.8%) fall into the less than $10,000 income bracket, making it the least populous group.
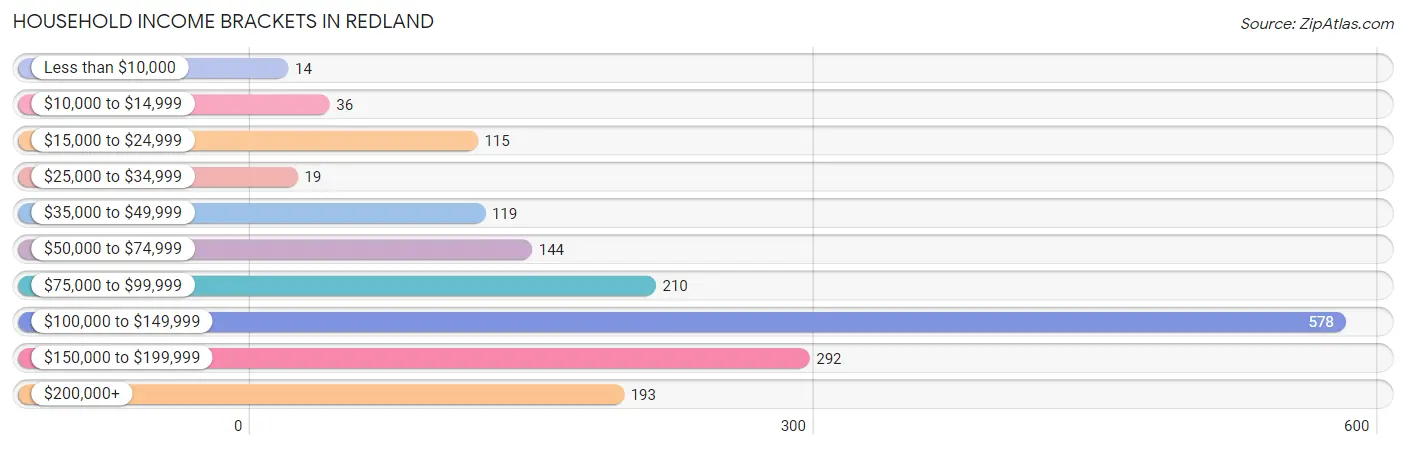
| Income Bracket | # Households | % Households |
| Less than $10,000 | 14 | 0.8% |
| $10,000 to $14,999 | 36 | 2.1% |
| $15,000 to $24,999 | 115 | 6.7% |
| $25,000 to $34,999 | 19 | 1.1% |
| $35,000 to $49,999 | 119 | 6.9% |
| $50,000 to $74,999 | 144 | 8.4% |
| $75,000 to $99,999 | 210 | 12.2% |
| $100,000 to $149,999 | 578 | 33.6% |
| $150,000 to $199,999 | 292 | 17.0% |
| $200,000+ | 193 | 11.2% |
Household Income by Householder Age in Redland
The median household income in Redland is $121,033, with the highest median household income of $147,442 found in the 25 to 44 years age bracket for the primary householder. A total of 444 households (25.8%) fall into this category.
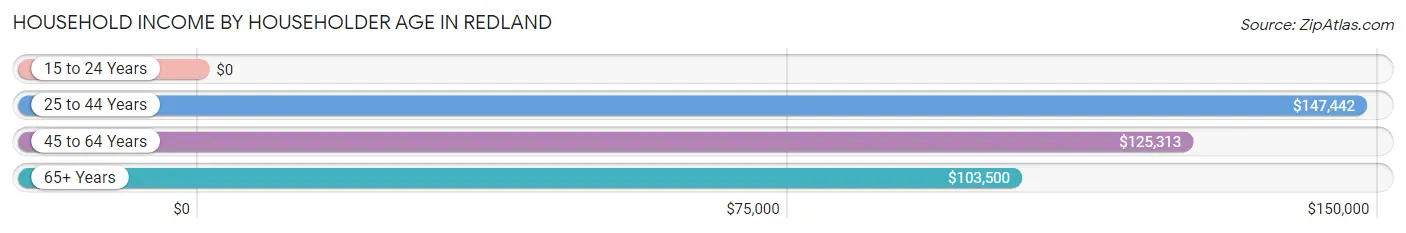
| Income Bracket | # Households | Median Income |
| 15 to 24 Years | 0 (0.0%) | $0 |
| 25 to 44 Years | 444 (25.8%) | $147,442 |
| 45 to 64 Years | 888 (51.6%) | $125,313 |
| 65+ Years | 388 (22.6%) | $103,500 |
| Total | 1,720 (100.0%) | $121,033 |
Poverty in Redland
Income Below Poverty by Sex and Age in Redland
With 4.0% poverty level for males and 5.5% for females among the residents of Redland, 6 to 11 year old males and 6 to 11 year old females are the most vulnerable to poverty, with 26 males (17.7%) and 89 females (33.2%) in their respective age groups living below the poverty level.
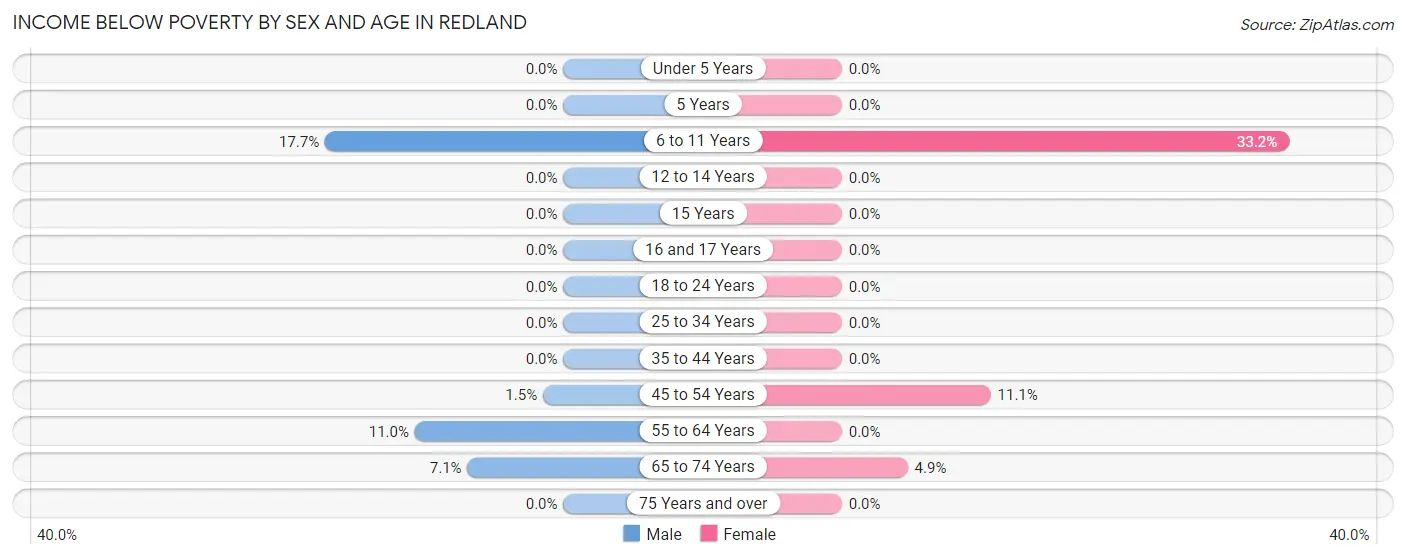
| Age Bracket | Male | Female |
| Under 5 Years | 0 (0.0%) | 0 (0.0%) |
| 5 Years | 0 (0.0%) | 0 (0.0%) |
| 6 to 11 Years | 26 (17.7%) | 89 (33.2%) |
| 12 to 14 Years | 0 (0.0%) | 0 (0.0%) |
| 15 Years | 0 (0.0%) | 0 (0.0%) |
| 16 and 17 Years | 0 (0.0%) | 0 (0.0%) |
| 18 to 24 Years | 0 (0.0%) | 0 (0.0%) |
| 25 to 34 Years | 0 (0.0%) | 0 (0.0%) |
| 35 to 44 Years | 0 (0.0%) | 0 (0.0%) |
| 45 to 54 Years | 6 (1.5%) | 38 (11.1%) |
| 55 to 64 Years | 44 (11.0%) | 0 (0.0%) |
| 65 to 74 Years | 19 (7.1%) | 13 (4.9%) |
| 75 Years and over | 0 (0.0%) | 0 (0.0%) |
| Total | 95 (4.0%) | 140 (5.5%) |
Income Above Poverty by Sex and Age in Redland
According to the poverty statistics in Redland, males aged under 5 years and females aged under 5 years are the age groups that are most secure financially, with 100.0% of males and 100.0% of females in these age groups living above the poverty line.
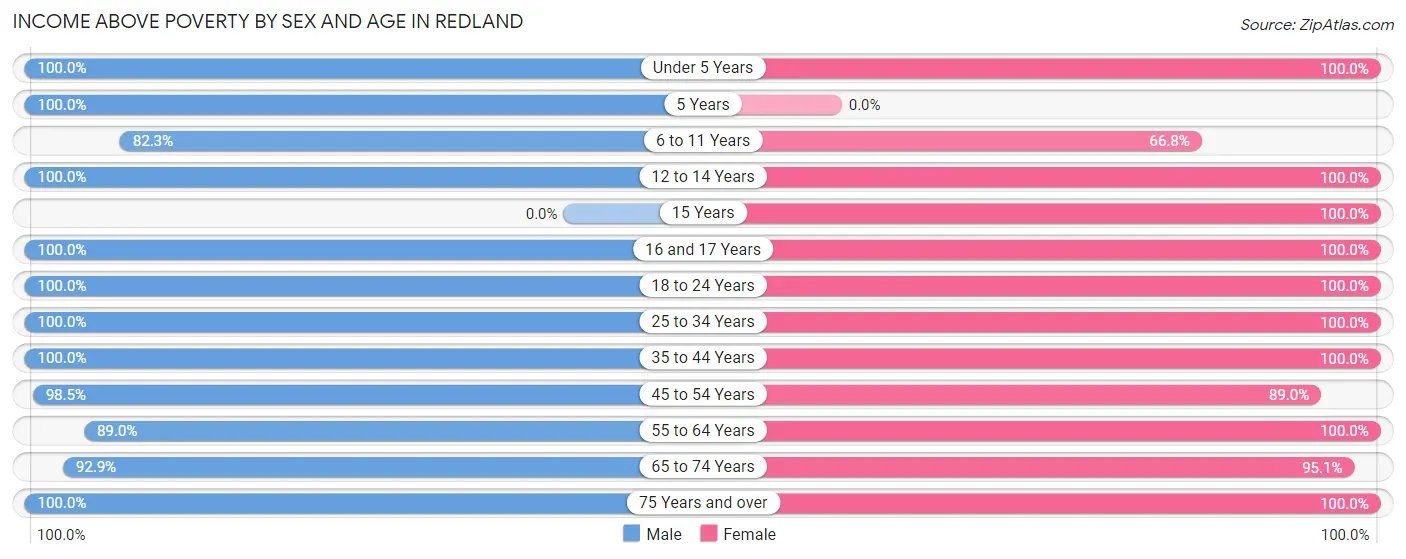
| Age Bracket | Male | Female |
| Under 5 Years | 95 (100.0%) | 153 (100.0%) |
| 5 Years | 20 (100.0%) | 0 (0.0%) |
| 6 to 11 Years | 121 (82.3%) | 179 (66.8%) |
| 12 to 14 Years | 37 (100.0%) | 108 (100.0%) |
| 15 Years | 0 (0.0%) | 32 (100.0%) |
| 16 and 17 Years | 105 (100.0%) | 155 (100.0%) |
| 18 to 24 Years | 305 (100.0%) | 251 (100.0%) |
| 25 to 34 Years | 261 (100.0%) | 301 (100.0%) |
| 35 to 44 Years | 277 (100.0%) | 317 (100.0%) |
| 45 to 54 Years | 392 (98.5%) | 306 (88.9%) |
| 55 to 64 Years | 355 (89.0%) | 274 (100.0%) |
| 65 to 74 Years | 248 (92.9%) | 253 (95.1%) |
| 75 Years and over | 75 (100.0%) | 90 (100.0%) |
| Total | 2,291 (96.0%) | 2,419 (94.5%) |
Income Below Poverty Among Married-Couple Families in Redland
The poverty statistics for married-couple families in Redland show that 1.1% or 14 of the total 1,243 families live below the poverty line. Families with no children have the highest poverty rate of 2.1%, comprising of 14 families. On the other hand, families with 1 or 2 children have the lowest poverty rate of 0.0%, which includes 0 families.

| Children | Above Poverty | Below Poverty |
| No Children | 660 (97.9%) | 14 (2.1%) |
| 1 or 2 Children | 490 (100.0%) | 0 (0.0%) |
| 3 or 4 Children | 79 (100.0%) | 0 (0.0%) |
| 5 or more Children | 0 (0.0%) | 0 (0.0%) |
| Total | 1,229 (98.9%) | 14 (1.1%) |
Income Below Poverty Among Single-Parent Households in Redland
According to the poverty data in Redland, 12.5% or 6 single-father households and 27.9% or 38 single-mother households are living below the poverty line. Among single-father households, those with no children have the highest poverty rate, with 6 households (54.5%) experiencing poverty. Likewise, among single-mother households, those with 3 or 4 children have the highest poverty rate, with 38 households (100.0%) falling below the poverty line.
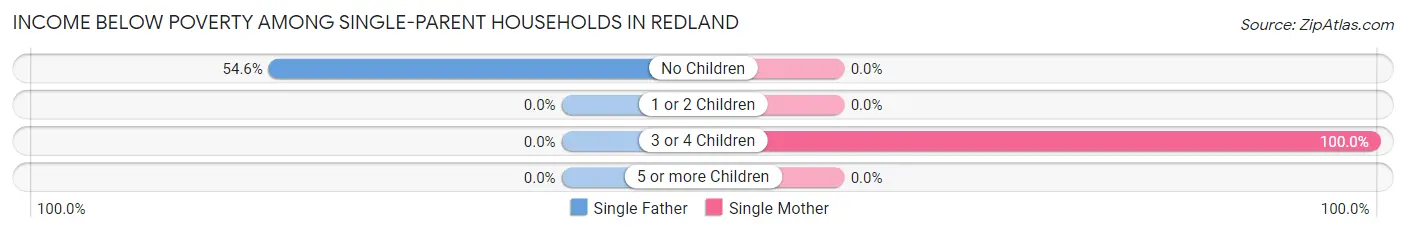
| Children | Single Father | Single Mother |
| No Children | 6 (54.5%) | 0 (0.0%) |
| 1 or 2 Children | 0 (0.0%) | 0 (0.0%) |
| 3 or 4 Children | 0 (0.0%) | 38 (100.0%) |
| 5 or more Children | 0 (0.0%) | 0 (0.0%) |
| Total | 6 (12.5%) | 38 (27.9%) |
Income Below Poverty Among Married-Couple vs Single-Parent Households in Redland
The poverty data for Redland shows that 14 of the married-couple family households (1.1%) and 44 of the single-parent households (23.9%) are living below the poverty level. Within the married-couple family households, those with no children have the highest poverty rate, with 14 households (2.1%) falling below the poverty line. Among the single-parent households, those with 3 or 4 children have the highest poverty rate, with 38 household (64.4%) living below poverty.
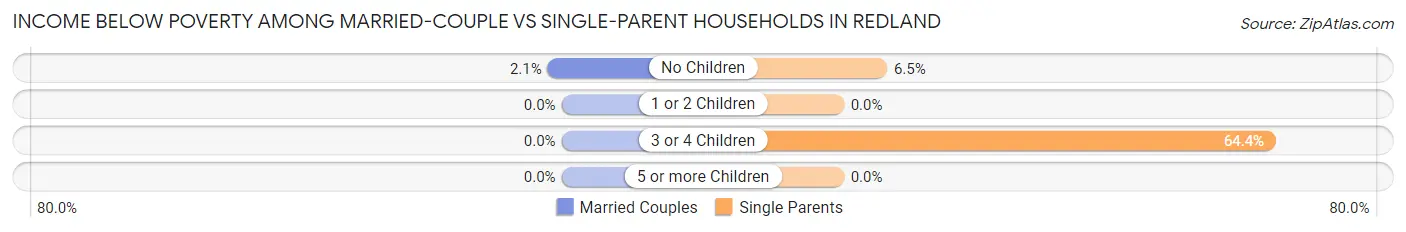
| Children | Married-Couple Families | Single-Parent Households |
| No Children | 14 (2.1%) | 6 (6.5%) |
| 1 or 2 Children | 0 (0.0%) | 0 (0.0%) |
| 3 or 4 Children | 0 (0.0%) | 38 (64.4%) |
| 5 or more Children | 0 (0.0%) | 0 (0.0%) |
| Total | 14 (1.1%) | 44 (23.9%) |
Race in Redland
The most populous races in Redland are White / Caucasian (4,177 | 84.2%), Black / African American (783 | 15.8%), and Hispanic or Latino (149 | 3.0%).
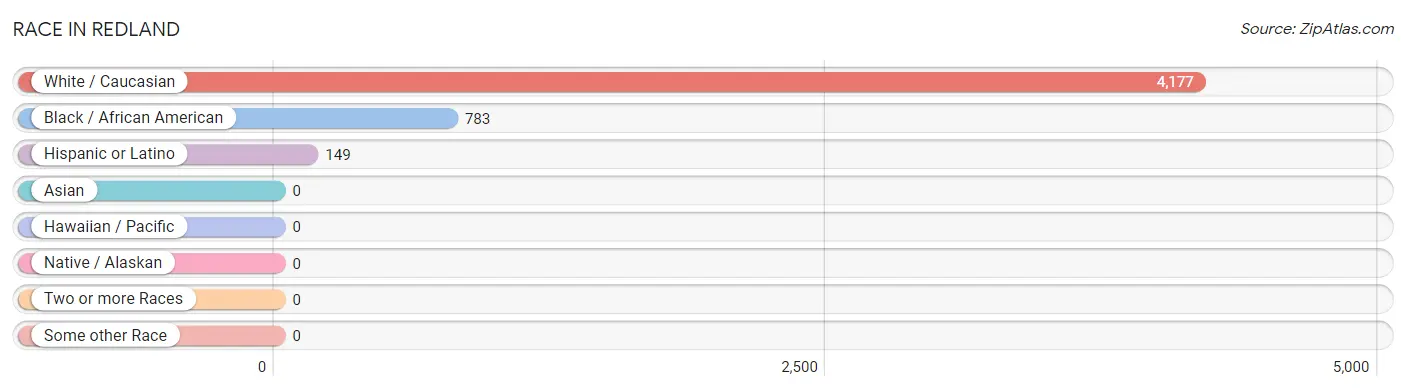
| Race | # Population | % Population |
| Asian | 0 | 0.0% |
| Black / African American | 783 | 15.8% |
| Hawaiian / Pacific | 0 | 0.0% |
| Hispanic or Latino | 149 | 3.0% |
| Native / Alaskan | 0 | 0.0% |
| White / Caucasian | 4,177 | 84.2% |
| Two or more Races | 0 | 0.0% |
| Some other Race | 0 | 0.0% |
| Total | 4,960 | 100.0% |
Ancestry in Redland
The most populous ancestries reported in Redland are English (788 | 15.9%), Irish (314 | 6.3%), American (312 | 6.3%), Scotch-Irish (248 | 5.0%), and German (244 | 4.9%), together accounting for 38.4% of all Redland residents.
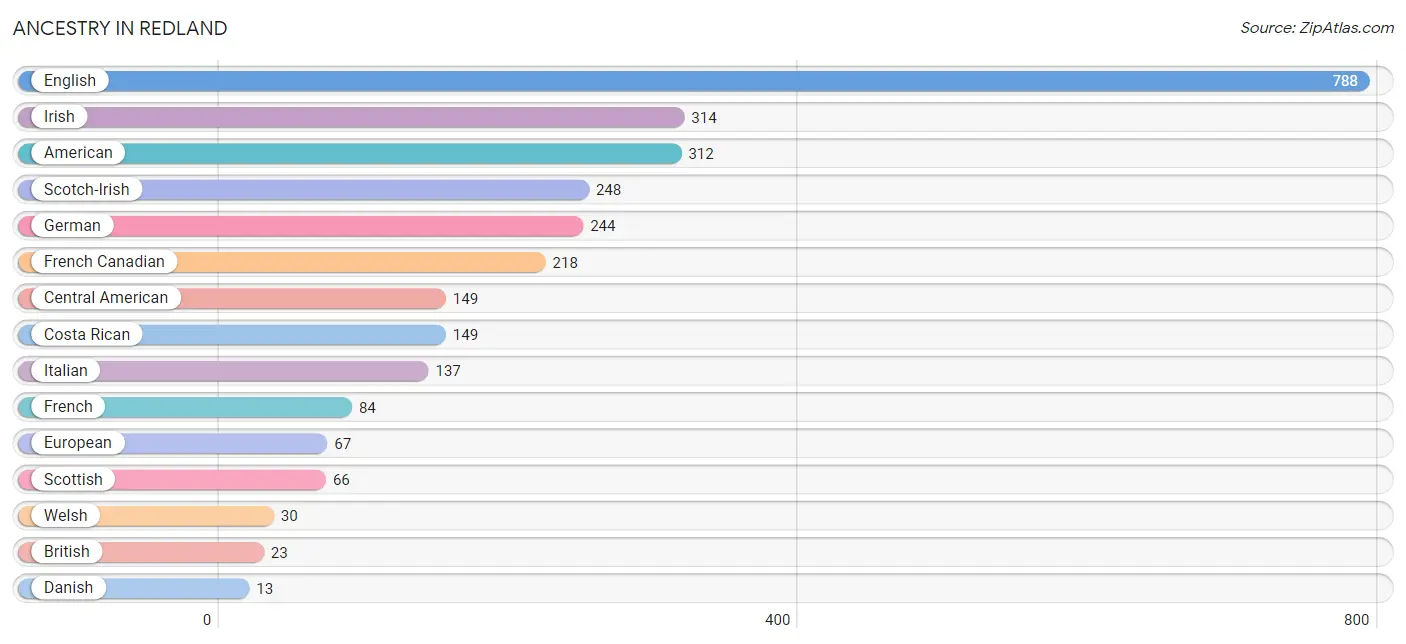
| Ancestry | # Population | % Population |
| American | 312 | 6.3% |
| British | 23 | 0.5% |
| Central American | 149 | 3.0% |
| Costa Rican | 149 | 3.0% |
| Czech | 12 | 0.2% |
| Danish | 13 | 0.3% |
| English | 788 | 15.9% |
| European | 67 | 1.3% |
| French | 84 | 1.7% |
| French Canadian | 218 | 4.4% |
| German | 244 | 4.9% |
| Irish | 314 | 6.3% |
| Italian | 137 | 2.8% |
| Polish | 12 | 0.2% |
| Scotch-Irish | 248 | 5.0% |
| Scottish | 66 | 1.3% |
| Swedish | 12 | 0.2% |
| Welsh | 30 | 0.6% | View All 18 Rows |
Immigrants in Redland
The most numerous immigrant groups reported in Redland came from Central America (100 | 2.0%), Latin America (100 | 2.0%), Mexico (100 | 2.0%), Africa (37 | 0.7%), and Ghana (37 | 0.7%), together accounting for 7.6% of all Redland residents.
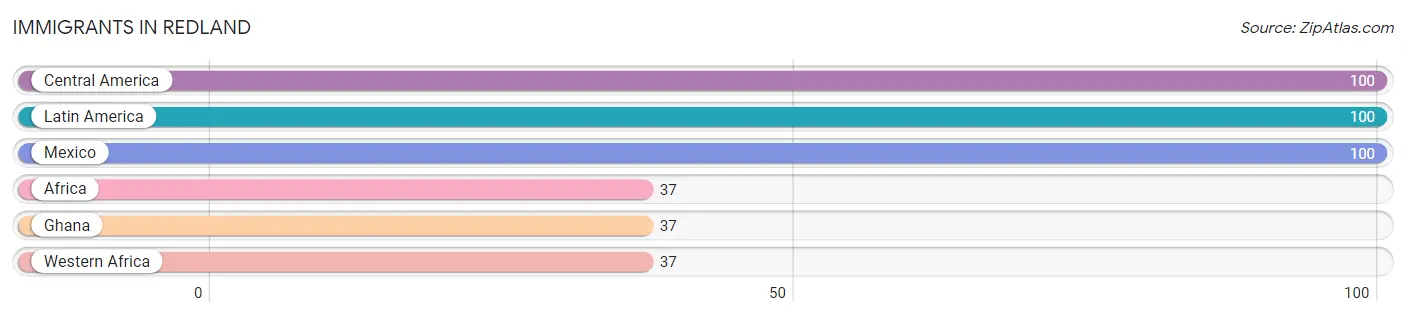
| Immigration Origin | # Population | % Population |
| Africa | 37 | 0.7% |
| Central America | 100 | 2.0% |
| Ghana | 37 | 0.7% |
| Latin America | 100 | 2.0% |
| Mexico | 100 | 2.0% |
| Western Africa | 37 | 0.7% | View All 6 Rows |
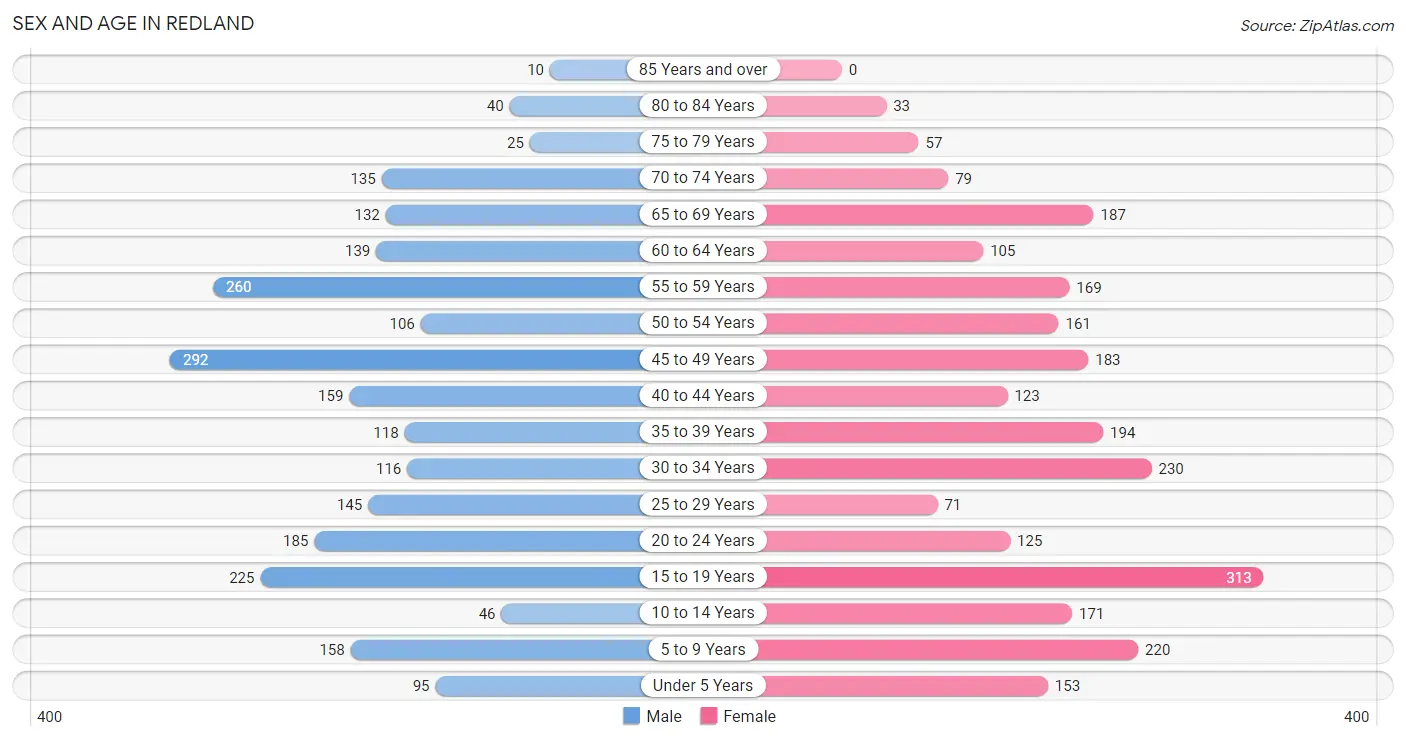
Sex and Age in Redland
Sex and Age in Redland
The most populous age groups in Redland are 45 to 49 Years (292 | 12.2%) for men and 15 to 19 Years (313 | 12.2%) for women.
| Age Bracket | Male | Female |
| Under 5 Years | 95 (4.0%) | 153 (5.9%) |
| 5 to 9 Years | 158 (6.6%) | 220 (8.6%) |
| 10 to 14 Years | 46 (1.9%) | 171 (6.6%) |
| 15 to 19 Years | 225 (9.4%) | 313 (12.2%) |
| 20 to 24 Years | 185 (7.7%) | 125 (4.9%) |
| 25 to 29 Years | 145 (6.1%) | 71 (2.8%) |
| 30 to 34 Years | 116 (4.9%) | 230 (8.9%) |
| 35 to 39 Years | 118 (5.0%) | 194 (7.5%) |
| 40 to 44 Years | 159 (6.7%) | 123 (4.8%) |
| 45 to 49 Years | 292 (12.2%) | 183 (7.1%) |
| 50 to 54 Years | 106 (4.4%) | 161 (6.2%) |
| 55 to 59 Years | 260 (10.9%) | 169 (6.6%) |
| 60 to 64 Years | 139 (5.8%) | 105 (4.1%) |
| 65 to 69 Years | 132 (5.5%) | 187 (7.3%) |
| 70 to 74 Years | 135 (5.7%) | 79 (3.1%) |
| 75 to 79 Years | 25 (1.1%) | 57 (2.2%) |
| 80 to 84 Years | 40 (1.7%) | 33 (1.3%) |
| 85 Years and over | 10 (0.4%) | 0 (0.0%) |
| Total | 2,386 (100.0%) | 2,574 (100.0%) |
Families and Households in Redland
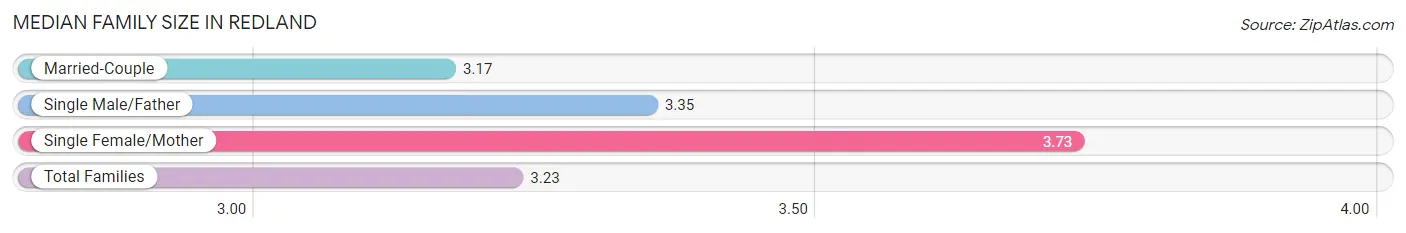
Median Family Size in Redland
The median family size in Redland is 3.23 persons per family, with single female/mother families (136 | 9.5%) accounting for the largest median family size of 3.73 persons per family. On the other hand, married-couple families (1,243 | 87.1%) represent the smallest median family size with 3.17 persons per family.
| Family Type | # Families | Family Size |
| Married-Couple | 1,243 (87.1%) | 3.17 |
| Single Male/Father | 48 (3.4%) | 3.35 |
| Single Female/Mother | 136 (9.5%) | 3.73 |
| Total Families | 1,427 (100.0%) | 3.23 |
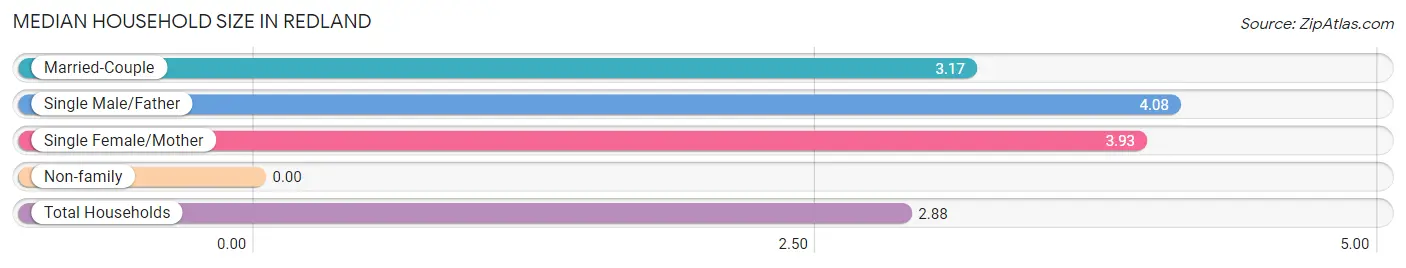
Median Household Size in Redland
| Household Type | # Households | Household Size |
| Married-Couple | 1,243 (72.3%) | 3.17 |
| Single Male/Father | 48 (2.8%) | 4.08 |
| Single Female/Mother | 136 (7.9%) | 3.93 |
| Non-family | 293 (17.0%) | - |
| Total Households | 1,720 (100.0%) | 2.88 |
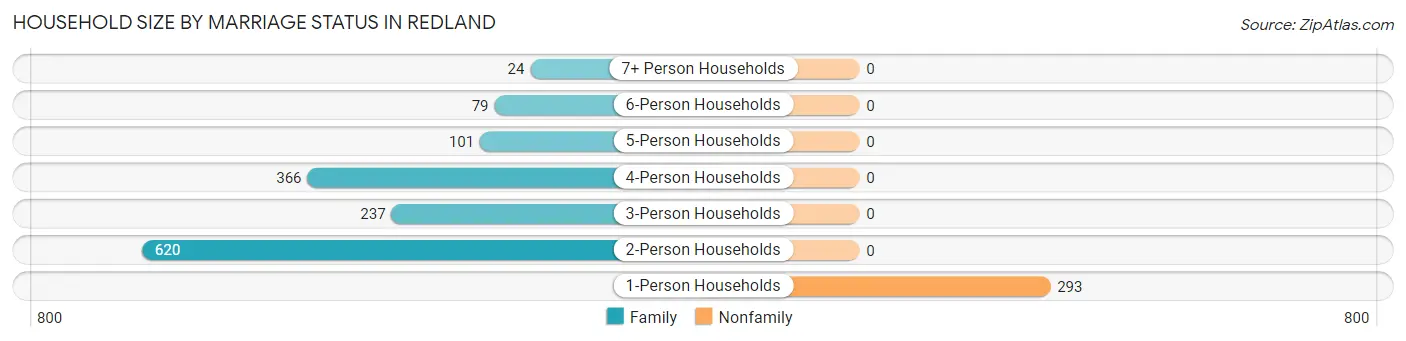
Household Size by Marriage Status in Redland
Out of a total of 1,720 households in Redland, 1,427 (83.0%) are family households, while 293 (17.0%) are nonfamily households. The most numerous type of family households are 2-person households, comprising 620, and the most common type of nonfamily households are 1-person households, comprising 293.
| Household Size | Family Households | Nonfamily Households |
| 1-Person Households | - | 293 (17.0%) |
| 2-Person Households | 620 (36.0%) | 0 (0.0%) |
| 3-Person Households | 237 (13.8%) | 0 (0.0%) |
| 4-Person Households | 366 (21.3%) | 0 (0.0%) |
| 5-Person Households | 101 (5.9%) | 0 (0.0%) |
| 6-Person Households | 79 (4.6%) | 0 (0.0%) |
| 7+ Person Households | 24 (1.4%) | 0 (0.0%) |
| Total | 1,427 (83.0%) | 293 (17.0%) |
Female Fertility in Redland
Fertility by Age in Redland
Average fertility rate in Redland is 15.0 births per 1,000 women. Women in the age bracket of 20 to 34 years have the highest fertility rate with 47.0 births per 1,000 women. Women in the age bracket of 20 to 34 years acount for 100.0% of all women with births.
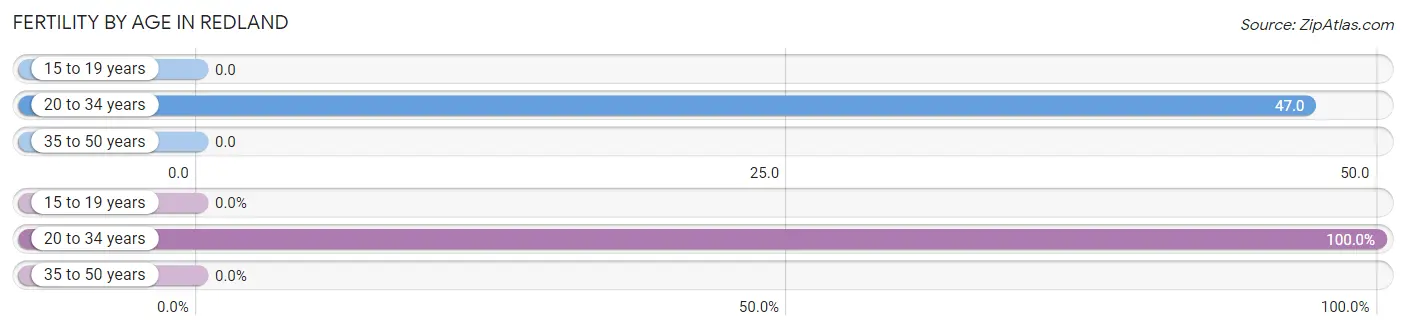
| Age Bracket | Women with Births | Births / 1,000 Women |
| 15 to 19 years | 0 (0.0%) | 0.0 |
| 20 to 34 years | 20 (100.0%) | 47.0 |
| 35 to 50 years | 0 (0.0%) | 0.0 |
| Total | 20 (100.0%) | 15.0 |
Fertility by Age by Marriage Status in Redland

| Age Bracket | Married | Unmarried |
| 15 to 19 years | 0 (0.0%) | 0 (0.0%) |
| 20 to 34 years | 20 (100.0%) | 0 (0.0%) |
| 35 to 50 years | 0 (0.0%) | 0 (0.0%) |
| Total | 20 (100.0%) | 0 (0.0%) |
Fertility by Education in Redland
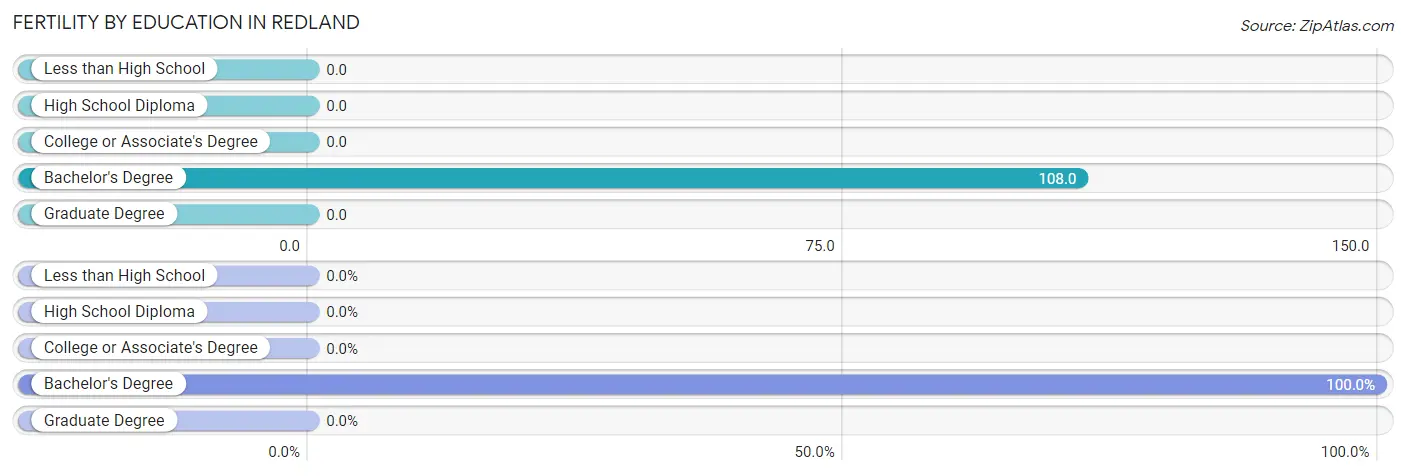
| Educational Attainment | Women with Births | Births / 1,000 Women |
| Less than High School | 0 (0.0%) | 0.0 |
| High School Diploma | 0 (0.0%) | 0.0 |
| College or Associate's Degree | 0 (0.0%) | 0.0 |
| Bachelor's Degree | 20 (100.0%) | 108.0 |
| Graduate Degree | 0 (0.0%) | 0.0 |
| Total | 20 (100.0%) | 15.0 |
Fertility by Education by Marriage Status in Redland
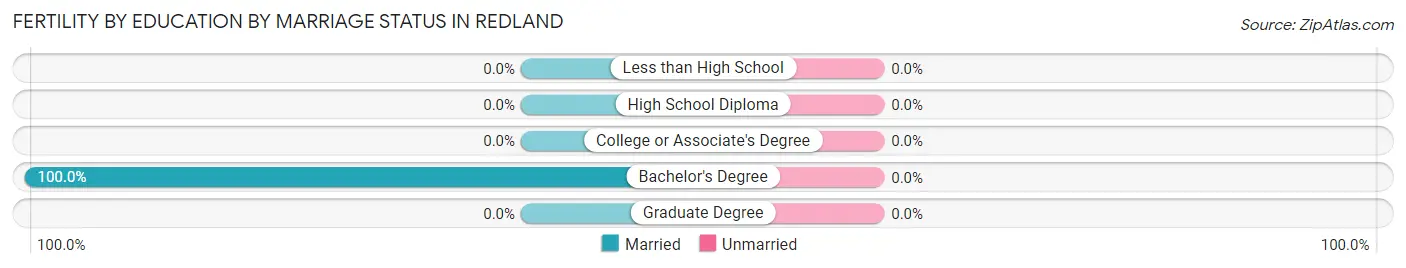
| Educational Attainment | Married | Unmarried |
| Less than High School | 0 (0.0%) | 0 (0.0%) |
| High School Diploma | 0 (0.0%) | 0 (0.0%) |
| College or Associate's Degree | 0 (0.0%) | 0 (0.0%) |
| Bachelor's Degree | 20 (100.0%) | 0 (0.0%) |
| Graduate Degree | 0 (0.0%) | 0 (0.0%) |
| Total | 20 (100.0%) | 0 (0.0%) |
Employment Characteristics in Redland
Employment by Class of Employer in Redland
Among the 2,664 employed individuals in Redland, private company employees (1,474 | 55.3%), not-for-profit organizations (405 | 15.2%), and state government employees (334 | 12.5%) make up the most common classes of employment.
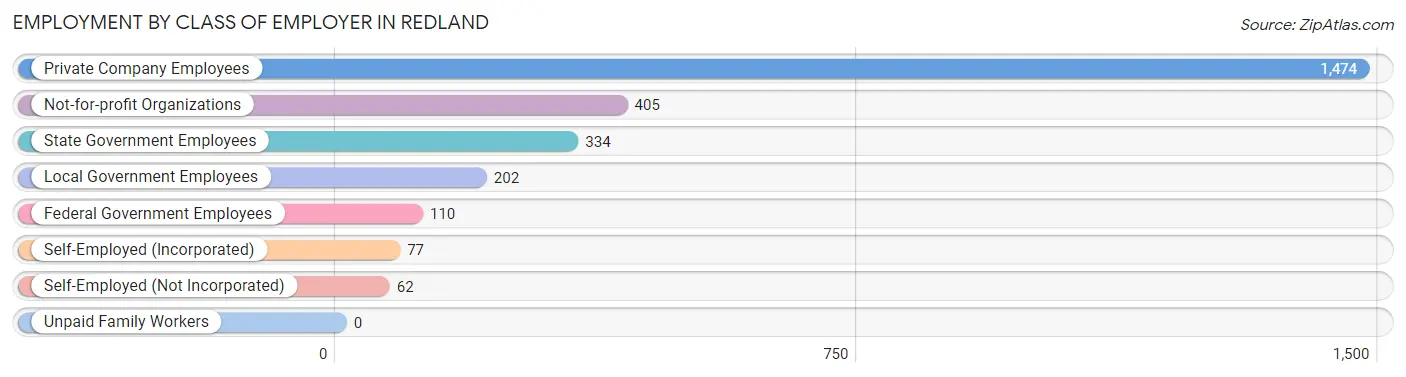
| Employer Class | # Employees | % Employees |
| Private Company Employees | 1,474 | 55.3% |
| Self-Employed (Incorporated) | 77 | 2.9% |
| Self-Employed (Not Incorporated) | 62 | 2.3% |
| Not-for-profit Organizations | 405 | 15.2% |
| Local Government Employees | 202 | 7.6% |
| State Government Employees | 334 | 12.5% |
| Federal Government Employees | 110 | 4.1% |
| Unpaid Family Workers | 0 | 0.0% |
| Total | 2,664 | 100.0% |
Employment Status by Age in Redland
According to the labor force statistics for Redland, out of the total population over 16 years of age (4,085), 66.6% or 2,721 individuals are in the labor force, with 1.3% or 35 of them unemployed. The age group with the highest labor force participation rate is 25 to 29 years, with 100.0% or 216 individuals in the labor force. Within the labor force, the 45 to 54 years age range has the highest percentage of unemployed individuals, with 5.5% or 35 of them being unemployed.
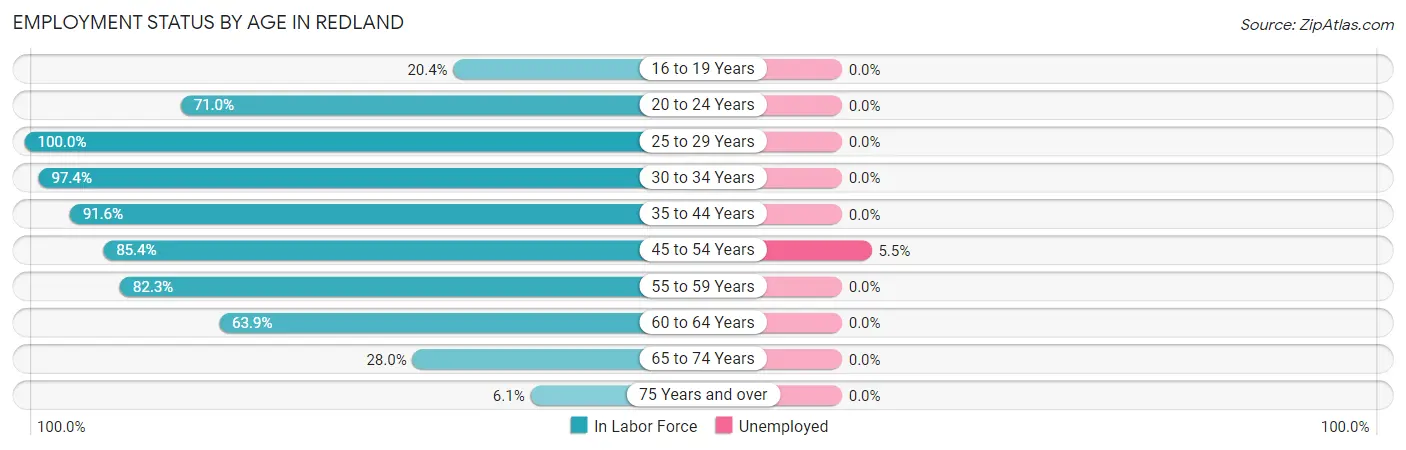
| Age Bracket | In Labor Force | Unemployed |
| 16 to 19 Years | 103 (20.4%) | 0 (0.0%) |
| 20 to 24 Years | 220 (71.0%) | 0 (0.0%) |
| 25 to 29 Years | 216 (100.0%) | 0 (0.0%) |
| 30 to 34 Years | 337 (97.4%) | 0 (0.0%) |
| 35 to 44 Years | 544 (91.6%) | 0 (0.0%) |
| 45 to 54 Years | 634 (85.4%) | 35 (5.5%) |
| 55 to 59 Years | 353 (82.3%) | 0 (0.0%) |
| 60 to 64 Years | 156 (63.9%) | 0 (0.0%) |
| 65 to 74 Years | 149 (28.0%) | 0 (0.0%) |
| 75 Years and over | 10 (6.1%) | 0 (0.0%) |
| Total | 2,721 (66.6%) | 35 (1.3%) |
Employment Status by Educational Attainment in Redland
According to labor force statistics for Redland, 87.1% of individuals (2,239) out of the total population between 25 and 64 years of age (2,571) are in the labor force, with 1.6% or 36 of them being unemployed. The group with the highest labor force participation rate are those with the educational attainment of college / associate degree, with 94.4% or 977 individuals in the labor force. Within the labor force, individuals with college / associate degree education have the highest percentage of unemployment, with 3.6% or 35 of them being unemployed.
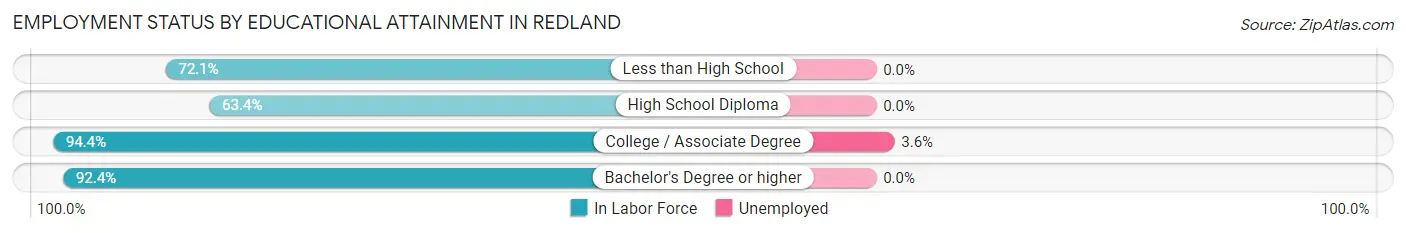
| Educational Attainment | In Labor Force | Unemployed |
| Less than High School | 137 (72.1%) | 0 (0.0%) |
| High School Diploma | 258 (63.4%) | 0 (0.0%) |
| College / Associate Degree | 977 (94.4%) | 37 (3.6%) |
| Bachelor's Degree or higher | 868 (92.4%) | 0 (0.0%) |
| Total | 2,239 (87.1%) | 41 (1.6%) |
Employment Occupations by Sex in Redland
Management, Business, Science and Arts Occupations
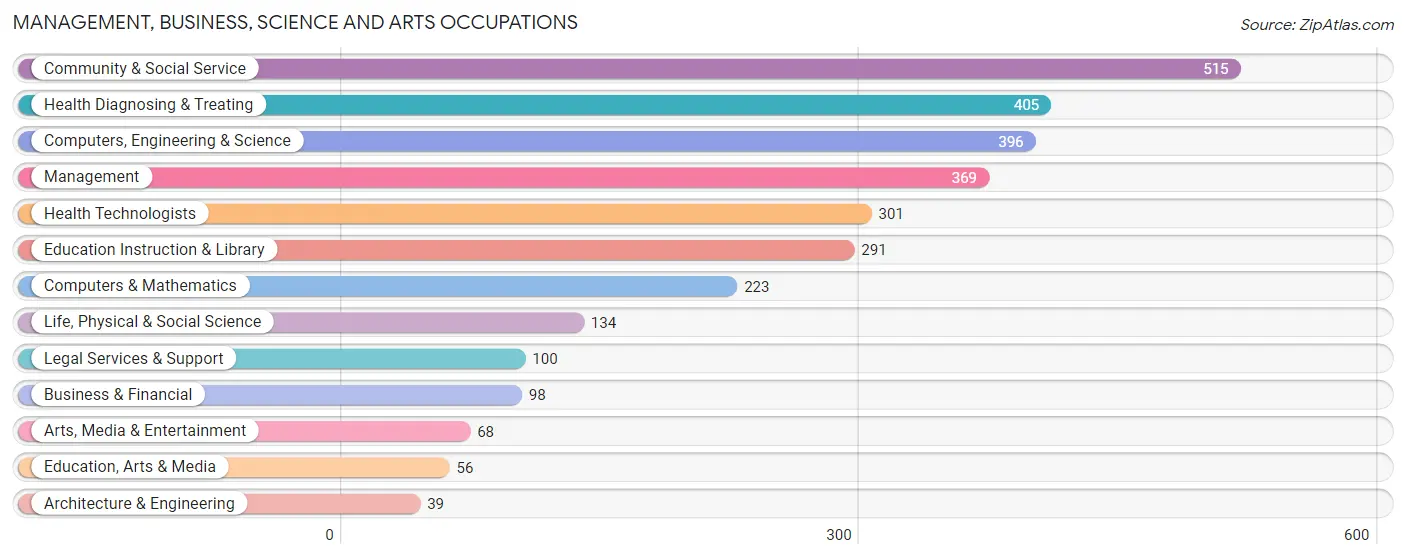
The most common Management, Business, Science and Arts occupations in Redland are Community & Social Service (515 | 19.5%), Health Diagnosing & Treating (405 | 15.3%), Computers, Engineering & Science (396 | 15.0%), Management (369 | 14.0%), and Health Technologists (301 | 11.4%).
Management, Business, Science and Arts Occupations by Sex
Within the Management, Business, Science and Arts occupations in Redland, the most male-oriented occupations are Computers & Mathematics (100.0%), Architecture & Engineering (100.0%), and Computers, Engineering & Science (97.0%), while the most female-oriented occupations are Legal Services & Support (100.0%), Business & Financial (87.8%), and Education, Arts & Media (75.0%).
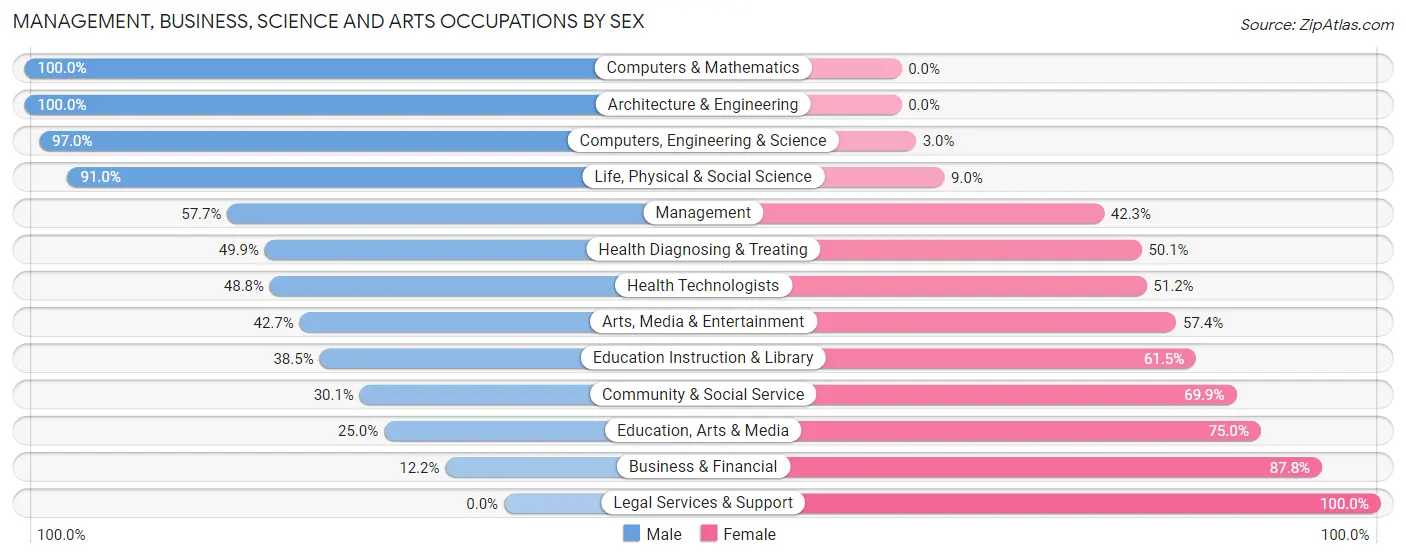
| Occupation | Male | Female |
| Management | 213 (57.7%) | 156 (42.3%) |
| Business & Financial | 12 (12.2%) | 86 (87.8%) |
| Computers, Engineering & Science | 384 (97.0%) | 12 (3.0%) |
| Computers & Mathematics | 223 (100.0%) | 0 (0.0%) |
| Architecture & Engineering | 39 (100.0%) | 0 (0.0%) |
| Life, Physical & Social Science | 122 (91.0%) | 12 (9.0%) |
| Community & Social Service | 155 (30.1%) | 360 (69.9%) |
| Education, Arts & Media | 14 (25.0%) | 42 (75.0%) |
| Legal Services & Support | 0 (0.0%) | 100 (100.0%) |
| Education Instruction & Library | 112 (38.5%) | 179 (61.5%) |
| Arts, Media & Entertainment | 29 (42.6%) | 39 (57.4%) |
| Health Diagnosing & Treating | 202 (49.9%) | 203 (50.1%) |
| Health Technologists | 147 (48.8%) | 154 (51.2%) |
| Total (Category) | 966 (54.2%) | 817 (45.8%) |
| Total (Overall) | 1,344 (50.8%) | 1,300 (49.2%) |
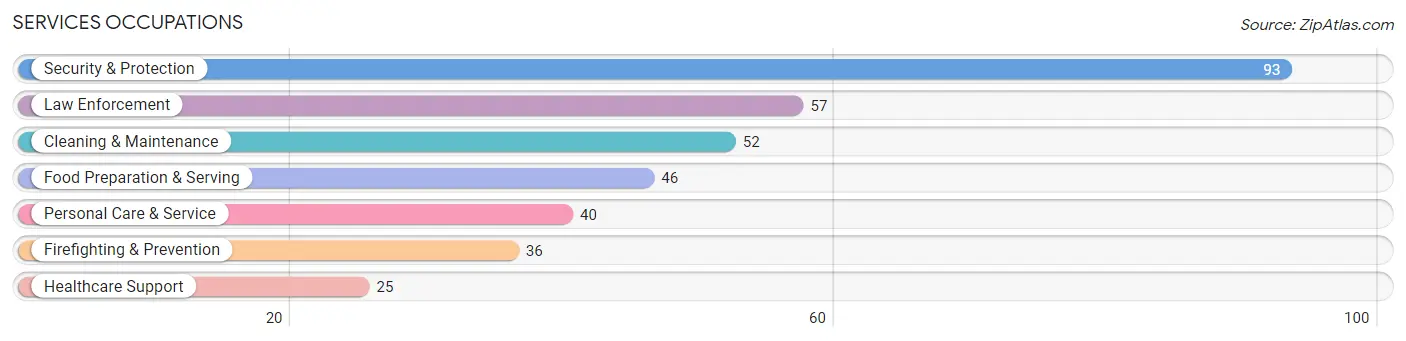
Services Occupations
The most common Services occupations in Redland are Security & Protection (93 | 3.5%), Law Enforcement (57 | 2.2%), Cleaning & Maintenance (52 | 2.0%), Food Preparation & Serving (46 | 1.7%), and Personal Care & Service (40 | 1.5%).
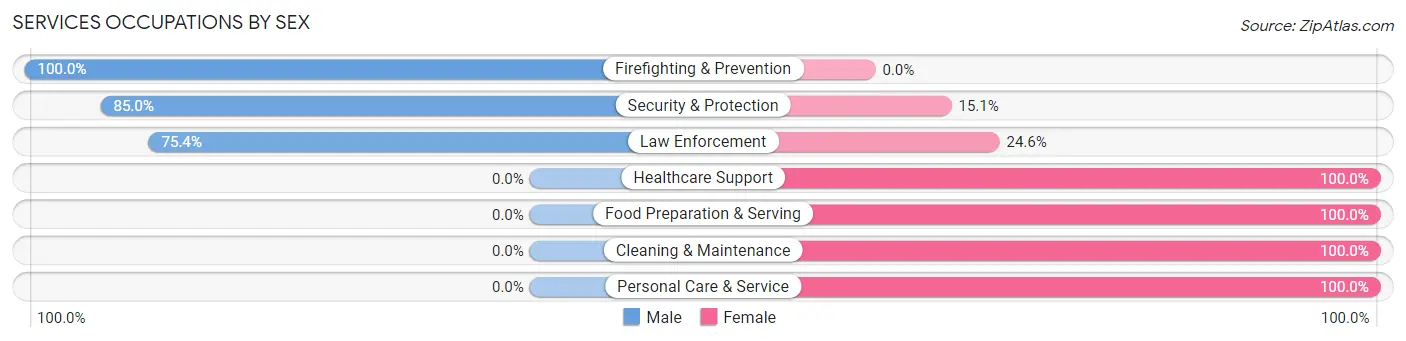
Services Occupations by Sex
Within the Services occupations in Redland, the most male-oriented occupations are Firefighting & Prevention (100.0%), Security & Protection (85.0%), and Law Enforcement (75.4%), while the most female-oriented occupations are Healthcare Support (100.0%), Food Preparation & Serving (100.0%), and Cleaning & Maintenance (100.0%).
| Occupation | Male | Female |
| Healthcare Support | 0 (0.0%) | 25 (100.0%) |
| Security & Protection | 79 (85.0%) | 14 (15.0%) |
| Firefighting & Prevention | 36 (100.0%) | 0 (0.0%) |
| Law Enforcement | 43 (75.4%) | 14 (24.6%) |
| Food Preparation & Serving | 0 (0.0%) | 46 (100.0%) |
| Cleaning & Maintenance | 0 (0.0%) | 52 (100.0%) |
| Personal Care & Service | 0 (0.0%) | 40 (100.0%) |
| Total (Category) | 79 (30.9%) | 177 (69.1%) |
| Total (Overall) | 1,344 (50.8%) | 1,300 (49.2%) |
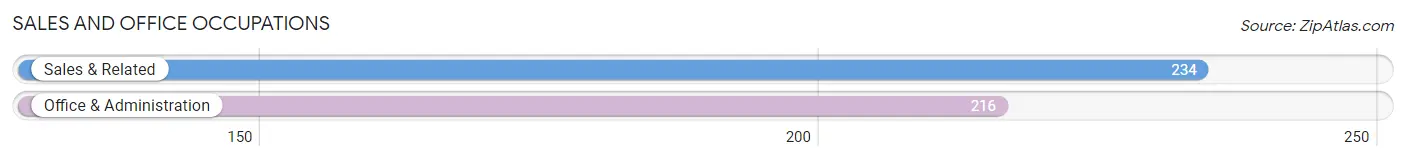
Sales and Office Occupations
The most common Sales and Office occupations in Redland are Sales & Related (234 | 8.8%), and Office & Administration (216 | 8.2%).
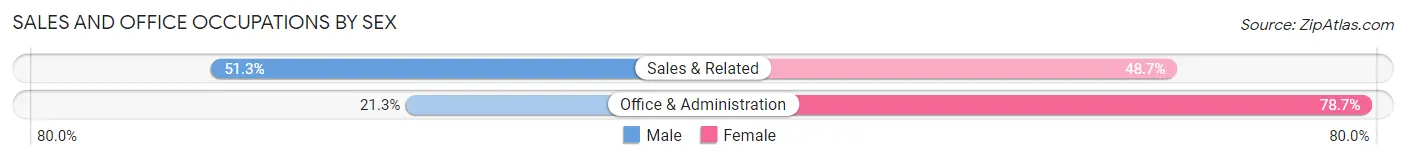
Sales and Office Occupations by Sex
| Occupation | Male | Female |
| Sales & Related | 120 (51.3%) | 114 (48.7%) |
| Office & Administration | 46 (21.3%) | 170 (78.7%) |
| Total (Category) | 166 (36.9%) | 284 (63.1%) |
| Total (Overall) | 1,344 (50.8%) | 1,300 (49.2%) |
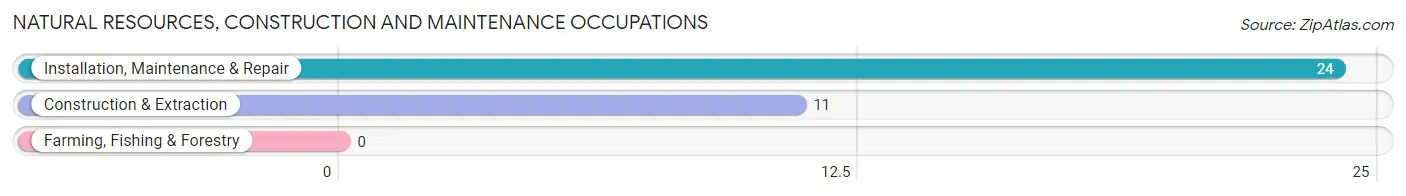
Natural Resources, Construction and Maintenance Occupations
The most common Natural Resources, Construction and Maintenance occupations in Redland are Installation, Maintenance & Repair (24 | 0.9%), and Construction & Extraction (11 | 0.4%).
Natural Resources, Construction and Maintenance Occupations by Sex
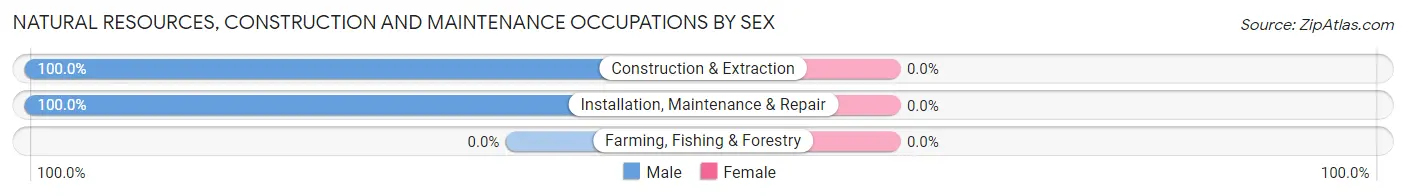
| Occupation | Male | Female |
| Farming, Fishing & Forestry | 0 (0.0%) | 0 (0.0%) |
| Construction & Extraction | 11 (100.0%) | 0 (0.0%) |
| Installation, Maintenance & Repair | 24 (100.0%) | 0 (0.0%) |
| Total (Category) | 35 (100.0%) | 0 (0.0%) |
| Total (Overall) | 1,344 (50.8%) | 1,300 (49.2%) |
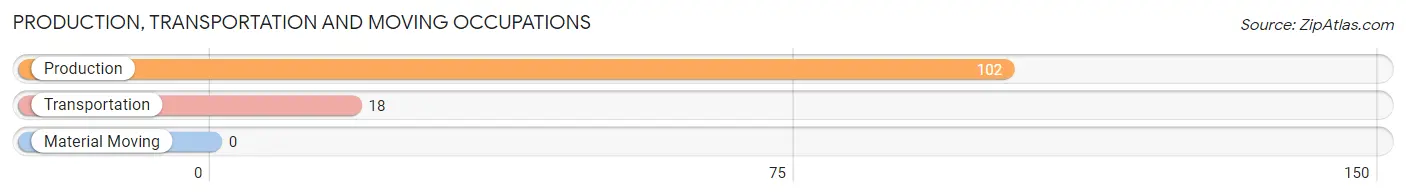
Production, Transportation and Moving Occupations
The most common Production, Transportation and Moving occupations in Redland are Production (102 | 3.9%), and Transportation (18 | 0.7%).
Production, Transportation and Moving Occupations by Sex
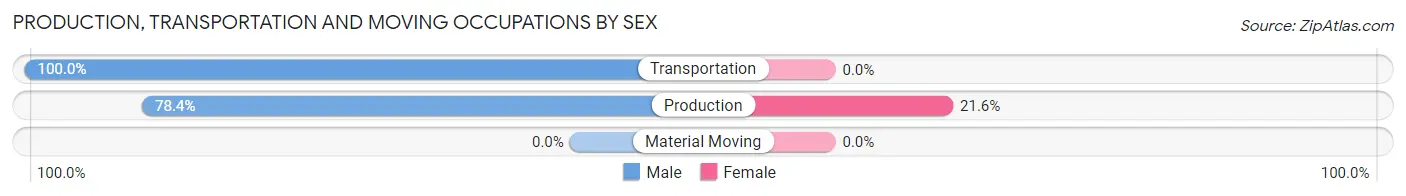
| Occupation | Male | Female |
| Production | 80 (78.4%) | 22 (21.6%) |
| Transportation | 18 (100.0%) | 0 (0.0%) |
| Material Moving | 0 (0.0%) | 0 (0.0%) |
| Total (Category) | 98 (81.7%) | 22 (18.3%) |
| Total (Overall) | 1,344 (50.8%) | 1,300 (49.2%) |
Employment Industries by Sex in Redland
Employment Industries in Redland
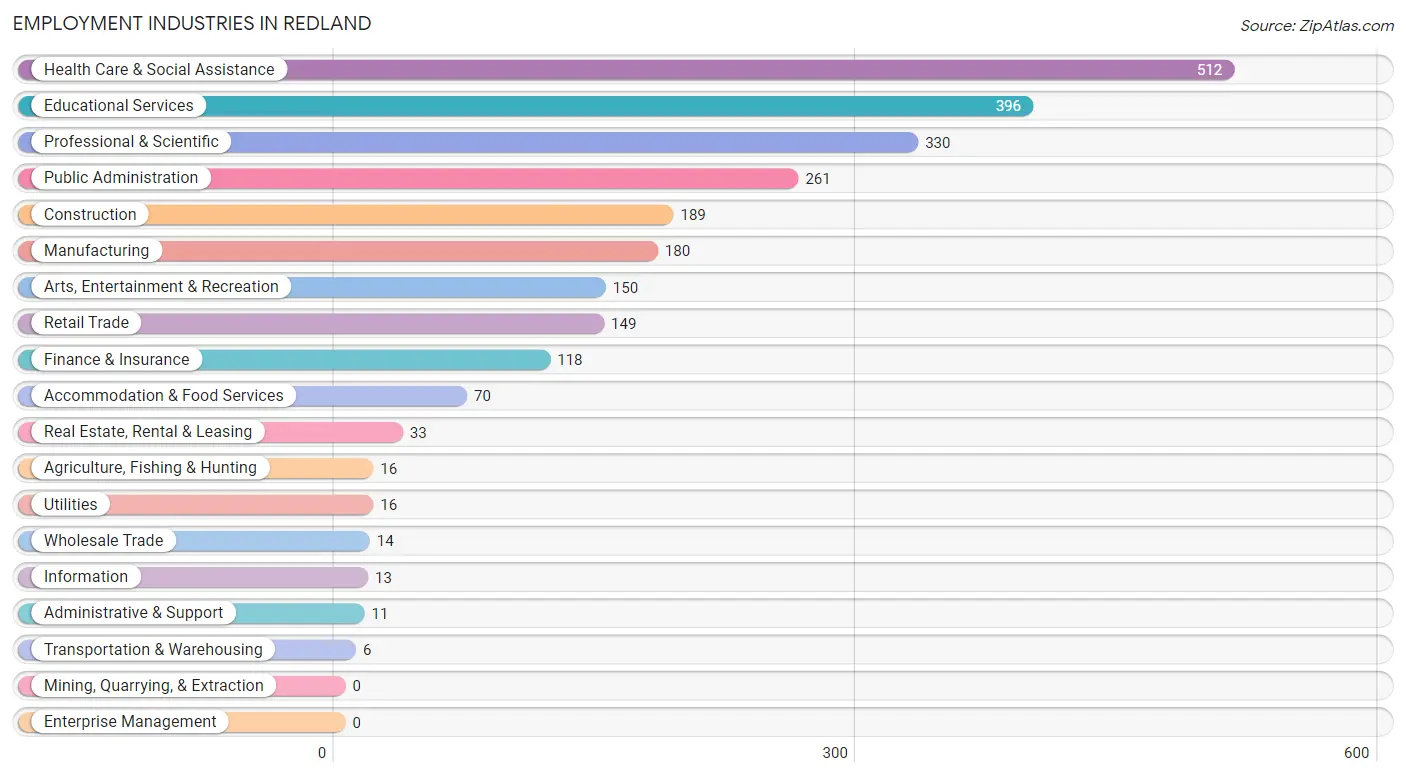
The major employment industries in Redland include Health Care & Social Assistance (512 | 19.4%), Educational Services (396 | 15.0%), Professional & Scientific (330 | 12.5%), Public Administration (261 | 9.9%), and Construction (189 | 7.1%).
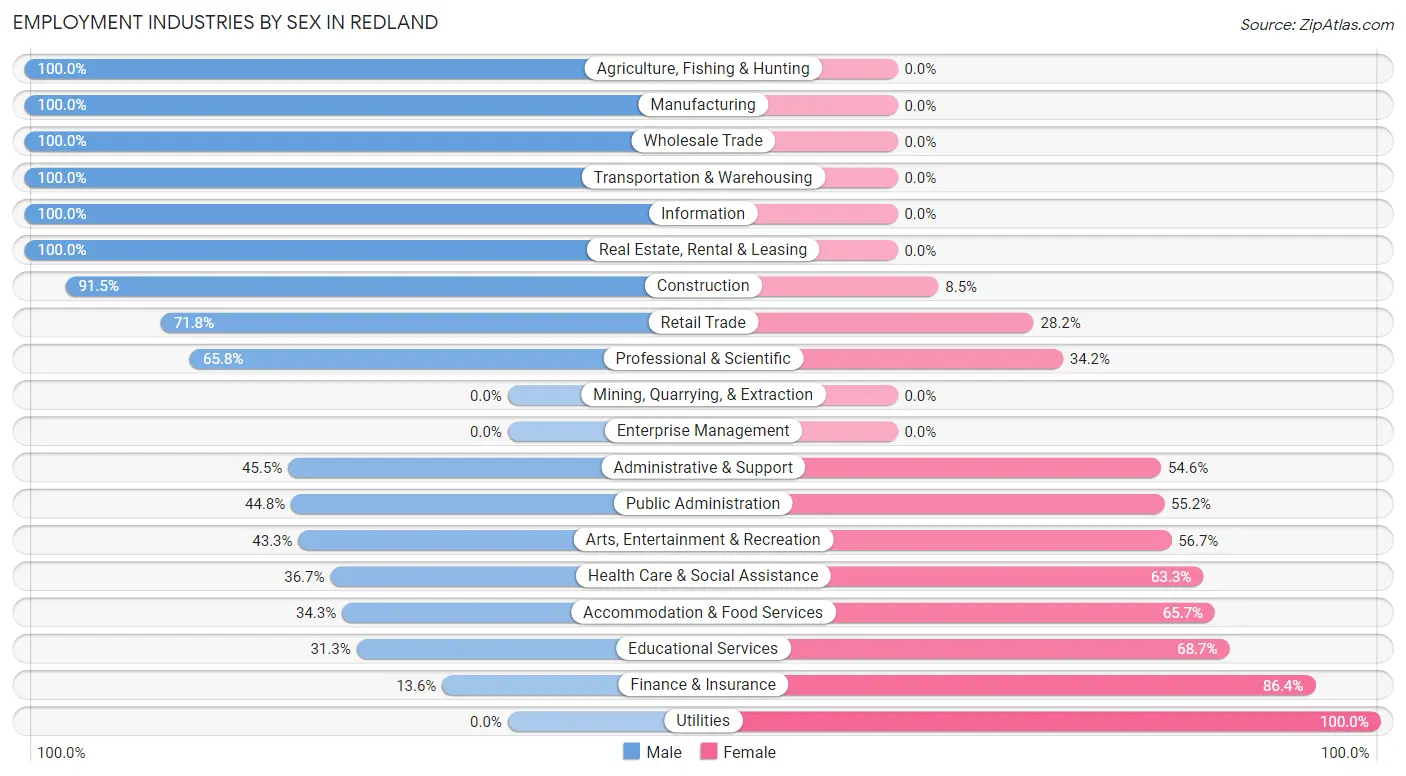
Employment Industries by Sex in Redland
The Redland industries that see more men than women are Agriculture, Fishing & Hunting (100.0%), Manufacturing (100.0%), and Wholesale Trade (100.0%), whereas the industries that tend to have a higher number of women are Utilities (100.0%), Finance & Insurance (86.4%), and Educational Services (68.7%).
| Industry | Male | Female |
| Agriculture, Fishing & Hunting | 16 (100.0%) | 0 (0.0%) |
| Mining, Quarrying, & Extraction | 0 (0.0%) | 0 (0.0%) |
| Construction | 173 (91.5%) | 16 (8.5%) |
| Manufacturing | 180 (100.0%) | 0 (0.0%) |
| Wholesale Trade | 14 (100.0%) | 0 (0.0%) |
| Retail Trade | 107 (71.8%) | 42 (28.2%) |
| Transportation & Warehousing | 6 (100.0%) | 0 (0.0%) |
| Utilities | 0 (0.0%) | 16 (100.0%) |
| Information | 13 (100.0%) | 0 (0.0%) |
| Finance & Insurance | 16 (13.6%) | 102 (86.4%) |
| Real Estate, Rental & Leasing | 33 (100.0%) | 0 (0.0%) |
| Professional & Scientific | 217 (65.8%) | 113 (34.2%) |
| Enterprise Management | 0 (0.0%) | 0 (0.0%) |
| Administrative & Support | 5 (45.5%) | 6 (54.5%) |
| Educational Services | 124 (31.3%) | 272 (68.7%) |
| Health Care & Social Assistance | 188 (36.7%) | 324 (63.3%) |
| Arts, Entertainment & Recreation | 65 (43.3%) | 85 (56.7%) |
| Accommodation & Food Services | 24 (34.3%) | 46 (65.7%) |
| Public Administration | 117 (44.8%) | 144 (55.2%) |
| Total | 1,344 (50.8%) | 1,300 (49.2%) |
Education in Redland
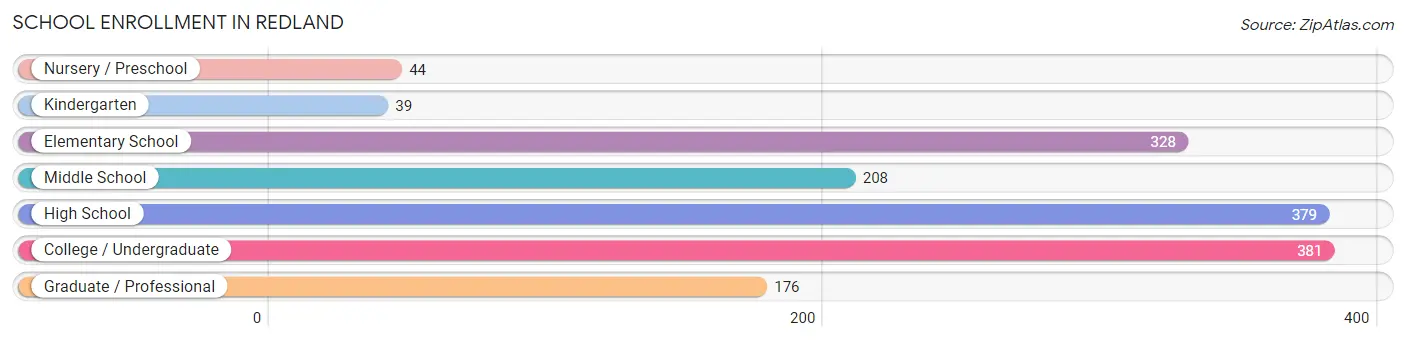
School Enrollment in Redland
The most common levels of schooling among the 1,555 students in Redland are college / undergraduate (381 | 24.5%), high school (379 | 24.4%), and elementary school (328 | 21.1%).
| School Level | # Students | % Students |
| Nursery / Preschool | 44 | 2.8% |
| Kindergarten | 39 | 2.5% |
| Elementary School | 328 | 21.1% |
| Middle School | 208 | 13.4% |
| High School | 379 | 24.4% |
| College / Undergraduate | 381 | 24.5% |
| Graduate / Professional | 176 | 11.3% |
| Total | 1,555 | 100.0% |
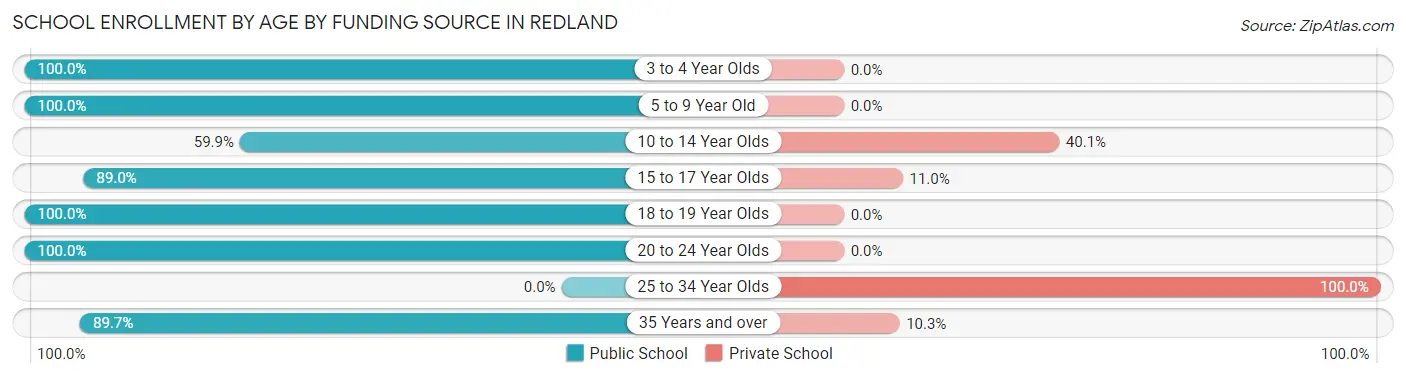
School Enrollment by Age by Funding Source in Redland
Out of a total of 1,555 students who are enrolled in schools in Redland, 197 (12.7%) attend a private institution, while the remaining 1,358 (87.3%) are enrolled in public schools. The age group of 25 to 34 year olds has the highest likelihood of being enrolled in private schools, with 58 (100.0% in the age bracket) enrolled. Conversely, the age group of 3 to 4 year olds has the lowest likelihood of being enrolled in a private school, with 44 (100.0% in the age bracket) attending a public institution.
| Age Bracket | Public School | Private School |
| 3 to 4 Year Olds | 44 (100.0%) | 0 (0.0%) |
| 5 to 9 Year Old | 358 (100.0%) | 0 (0.0%) |
| 10 to 14 Year Olds | 130 (59.9%) | 87 (40.1%) |
| 15 to 17 Year Olds | 260 (89.0%) | 32 (11.0%) |
| 18 to 19 Year Olds | 144 (100.0%) | 0 (0.0%) |
| 20 to 24 Year Olds | 239 (100.0%) | 0 (0.0%) |
| 25 to 34 Year Olds | 0 (0.0%) | 58 (100.0%) |
| 35 Years and over | 182 (89.7%) | 21 (10.3%) |
| Total | 1,358 (87.3%) | 197 (12.7%) |
Educational Attainment by Field of Study in Redland
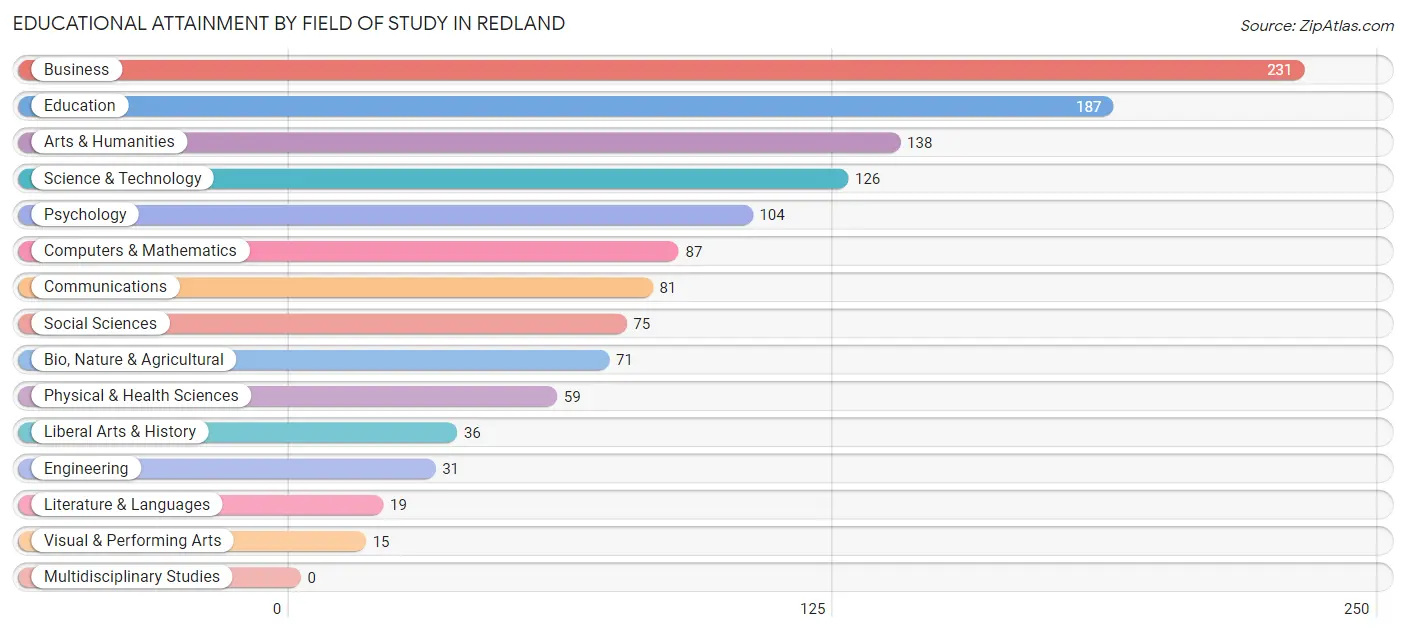
Business (231 | 18.3%), education (187 | 14.8%), arts & humanities (138 | 11.0%), science & technology (126 | 10.0%), and psychology (104 | 8.3%) are the most common fields of study among 1,260 individuals in Redland who have obtained a bachelor's degree or higher.
| Field of Study | # Graduates | % Graduates |
| Computers & Mathematics | 87 | 6.9% |
| Bio, Nature & Agricultural | 71 | 5.6% |
| Physical & Health Sciences | 59 | 4.7% |
| Psychology | 104 | 8.3% |
| Social Sciences | 75 | 5.9% |
| Engineering | 31 | 2.5% |
| Multidisciplinary Studies | 0 | 0.0% |
| Science & Technology | 126 | 10.0% |
| Business | 231 | 18.3% |
| Education | 187 | 14.8% |
| Literature & Languages | 19 | 1.5% |
| Liberal Arts & History | 36 | 2.9% |
| Visual & Performing Arts | 15 | 1.2% |
| Communications | 81 | 6.4% |
| Arts & Humanities | 138 | 11.0% |
| Total | 1,260 | 100.0% |
Transportation & Commute in Redland
Vehicle Availability by Sex in Redland
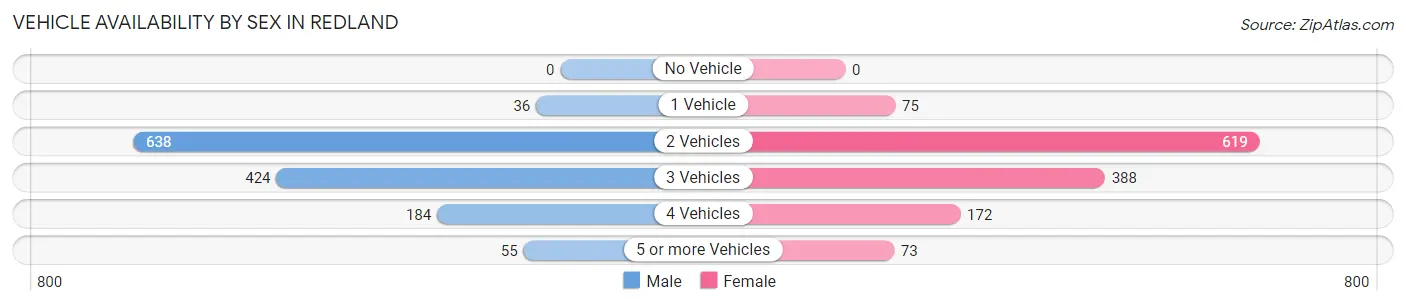
The most prevalent vehicle ownership categories in Redland are males with 2 vehicles (638, accounting for 47.7%) and females with 2 vehicles (619, making up 48.1%).
| Vehicles Available | Male | Female |
| No Vehicle | 0 (0.0%) | 0 (0.0%) |
| 1 Vehicle | 36 (2.7%) | 75 (5.7%) |
| 2 Vehicles | 638 (47.7%) | 619 (46.7%) |
| 3 Vehicles | 424 (31.7%) | 388 (29.2%) |
| 4 Vehicles | 184 (13.8%) | 172 (13.0%) |
| 5 or more Vehicles | 55 (4.1%) | 73 (5.5%) |
| Total | 1,337 (100.0%) | 1,327 (100.0%) |
Commute Time in Redland
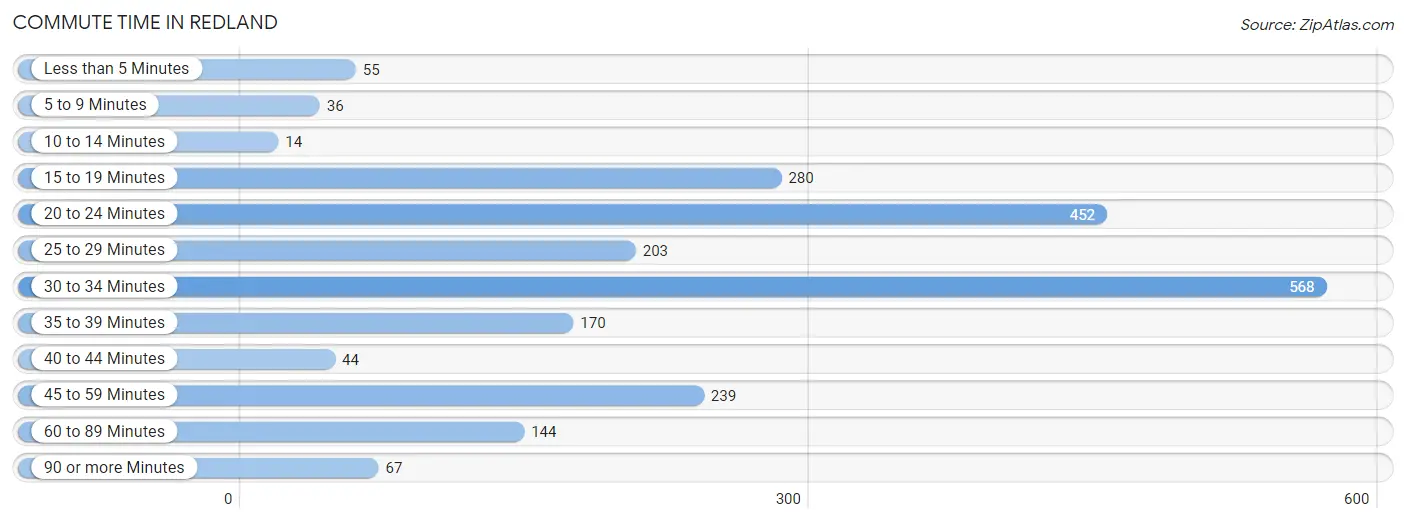
The most frequently occuring commute durations in Redland are 30 to 34 minutes (568 commuters, 25.0%), 20 to 24 minutes (452 commuters, 19.9%), and 15 to 19 minutes (280 commuters, 12.3%).
| Commute Time | # Commuters | % Commuters |
| Less than 5 Minutes | 55 | 2.4% |
| 5 to 9 Minutes | 36 | 1.6% |
| 10 to 14 Minutes | 14 | 0.6% |
| 15 to 19 Minutes | 280 | 12.3% |
| 20 to 24 Minutes | 452 | 19.9% |
| 25 to 29 Minutes | 203 | 8.9% |
| 30 to 34 Minutes | 568 | 25.0% |
| 35 to 39 Minutes | 170 | 7.5% |
| 40 to 44 Minutes | 44 | 1.9% |
| 45 to 59 Minutes | 239 | 10.5% |
| 60 to 89 Minutes | 144 | 6.3% |
| 90 or more Minutes | 67 | 2.9% |
Commute Time by Sex in Redland
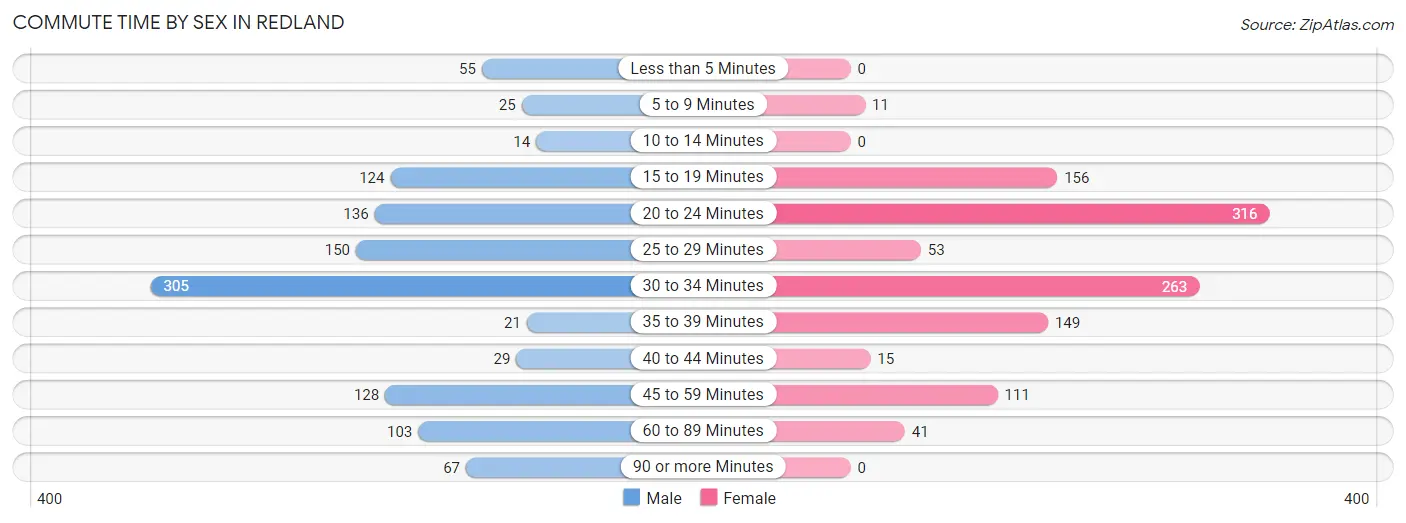
The most common commute times in Redland are 30 to 34 minutes (305 commuters, 26.4%) for males and 20 to 24 minutes (316 commuters, 28.3%) for females.
| Commute Time | Male | Female |
| Less than 5 Minutes | 55 (4.8%) | 0 (0.0%) |
| 5 to 9 Minutes | 25 (2.2%) | 11 (1.0%) |
| 10 to 14 Minutes | 14 (1.2%) | 0 (0.0%) |
| 15 to 19 Minutes | 124 (10.7%) | 156 (14.0%) |
| 20 to 24 Minutes | 136 (11.7%) | 316 (28.3%) |
| 25 to 29 Minutes | 150 (13.0%) | 53 (4.8%) |
| 30 to 34 Minutes | 305 (26.4%) | 263 (23.6%) |
| 35 to 39 Minutes | 21 (1.8%) | 149 (13.4%) |
| 40 to 44 Minutes | 29 (2.5%) | 15 (1.3%) |
| 45 to 59 Minutes | 128 (11.1%) | 111 (10.0%) |
| 60 to 89 Minutes | 103 (8.9%) | 41 (3.7%) |
| 90 or more Minutes | 67 (5.8%) | 0 (0.0%) |
Time of Departure to Work by Sex in Redland
The most frequent times of departure to work in Redland are 6:30 AM to 6:59 AM (202, 17.5%) for males and 6:30 AM to 6:59 AM (226, 20.3%) for females.
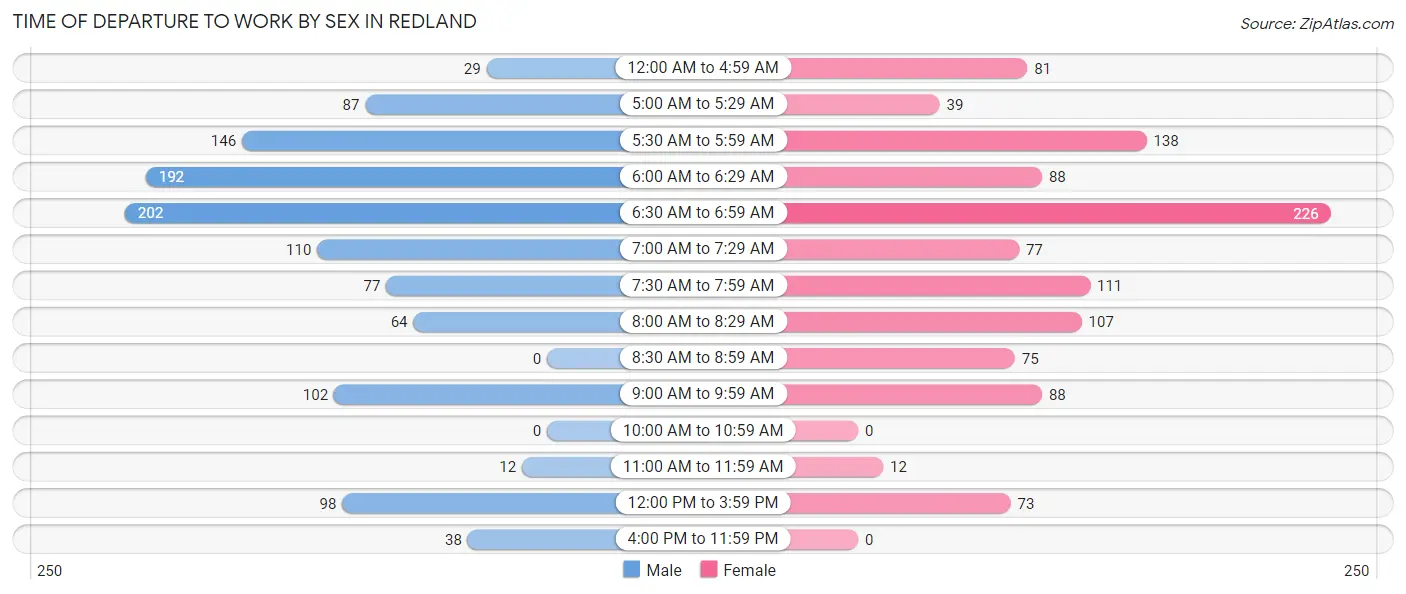
| Time of Departure | Male | Female |
| 12:00 AM to 4:59 AM | 29 (2.5%) | 81 (7.3%) |
| 5:00 AM to 5:29 AM | 87 (7.5%) | 39 (3.5%) |
| 5:30 AM to 5:59 AM | 146 (12.6%) | 138 (12.4%) |
| 6:00 AM to 6:29 AM | 192 (16.6%) | 88 (7.9%) |
| 6:30 AM to 6:59 AM | 202 (17.5%) | 226 (20.3%) |
| 7:00 AM to 7:29 AM | 110 (9.5%) | 77 (6.9%) |
| 7:30 AM to 7:59 AM | 77 (6.7%) | 111 (10.0%) |
| 8:00 AM to 8:29 AM | 64 (5.5%) | 107 (9.6%) |
| 8:30 AM to 8:59 AM | 0 (0.0%) | 75 (6.7%) |
| 9:00 AM to 9:59 AM | 102 (8.8%) | 88 (7.9%) |
| 10:00 AM to 10:59 AM | 0 (0.0%) | 0 (0.0%) |
| 11:00 AM to 11:59 AM | 12 (1.0%) | 12 (1.1%) |
| 12:00 PM to 3:59 PM | 98 (8.5%) | 73 (6.6%) |
| 4:00 PM to 11:59 PM | 38 (3.3%) | 0 (0.0%) |
| Total | 1,157 (100.0%) | 1,115 (100.0%) |
Housing Occupancy in Redland
Occupancy by Ownership in Redland
Of the total 1,720 dwellings in Redland, owner-occupied units account for 1,587 (92.3%), while renter-occupied units make up 133 (7.7%).
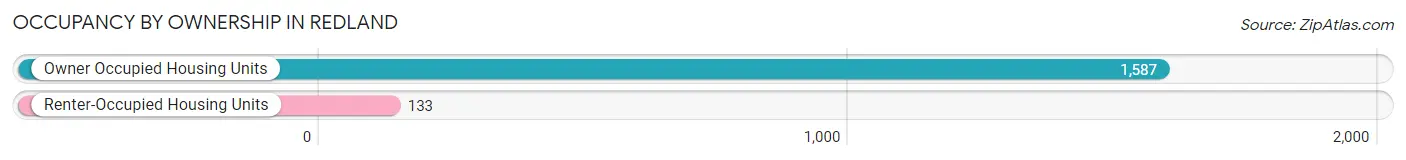
| Occupancy | # Housing Units | % Housing Units |
| Owner Occupied Housing Units | 1,587 | 92.3% |
| Renter-Occupied Housing Units | 133 | 7.7% |
| Total Occupied Housing Units | 1,720 | 100.0% |
Occupancy by Household Size in Redland
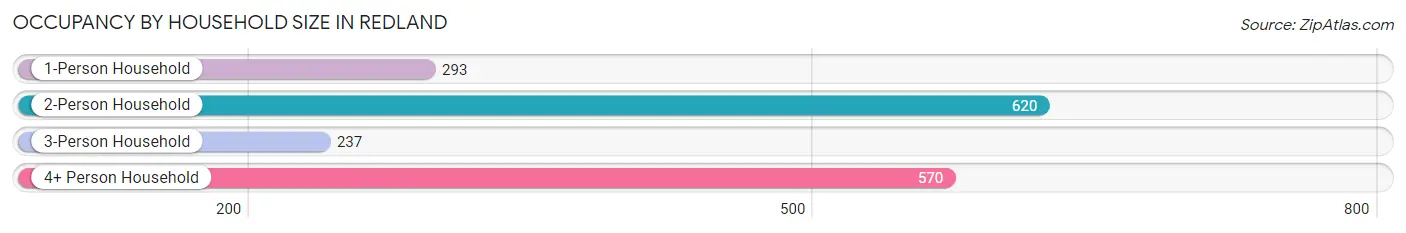
| Household Size | # Housing Units | % Housing Units |
| 1-Person Household | 293 | 17.0% |
| 2-Person Household | 620 | 36.0% |
| 3-Person Household | 237 | 13.8% |
| 4+ Person Household | 570 | 33.1% |
| Total Housing Units | 1,720 | 100.0% |
Occupancy by Ownership by Household Size in Redland
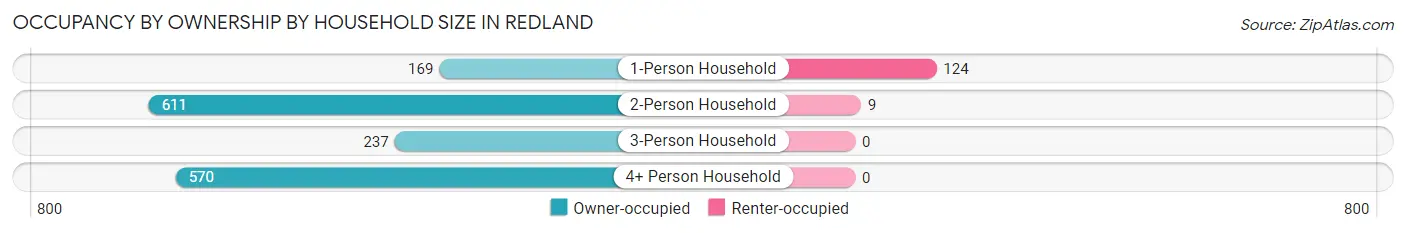
| Household Size | Owner-occupied | Renter-occupied |
| 1-Person Household | 169 (57.7%) | 124 (42.3%) |
| 2-Person Household | 611 (98.6%) | 9 (1.5%) |
| 3-Person Household | 237 (100.0%) | 0 (0.0%) |
| 4+ Person Household | 570 (100.0%) | 0 (0.0%) |
| Total Housing Units | 1,587 (92.3%) | 133 (7.7%) |
Occupancy by Educational Attainment in Redland
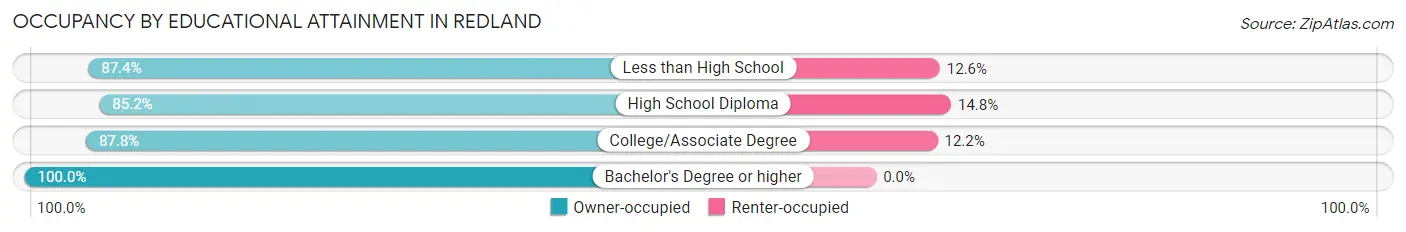
| Household Size | Owner-occupied | Renter-occupied |
| Less than High School | 83 (87.4%) | 12 (12.6%) |
| High School Diploma | 241 (85.2%) | 42 (14.8%) |
| College/Associate Degree | 570 (87.8%) | 79 (12.2%) |
| Bachelor's Degree or higher | 693 (100.0%) | 0 (0.0%) |
Occupancy by Age of Householder in Redland
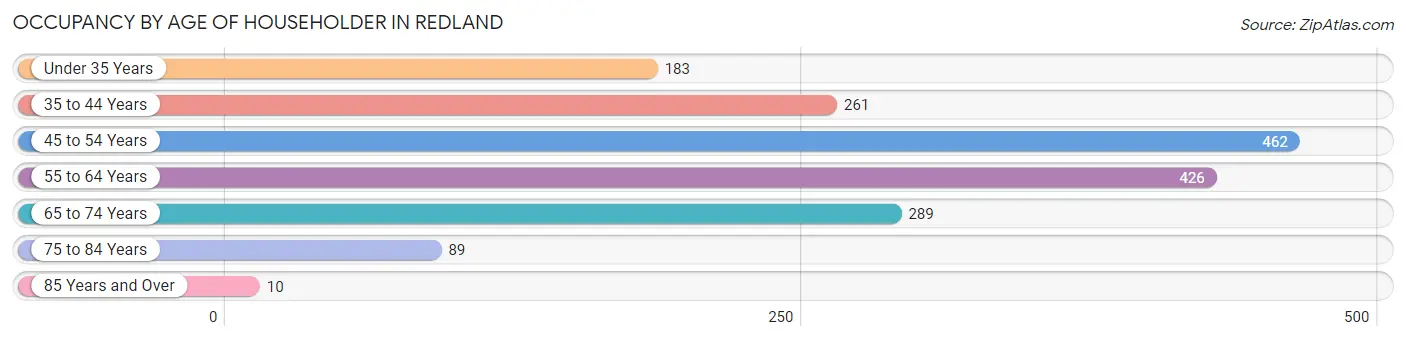
| Age Bracket | # Households | % Households |
| Under 35 Years | 183 | 10.6% |
| 35 to 44 Years | 261 | 15.2% |
| 45 to 54 Years | 462 | 26.9% |
| 55 to 64 Years | 426 | 24.8% |
| 65 to 74 Years | 289 | 16.8% |
| 75 to 84 Years | 89 | 5.2% |
| 85 Years and Over | 10 | 0.6% |
| Total | 1,720 | 100.0% |
Housing Finances in Redland
Median Income by Occupancy in Redland
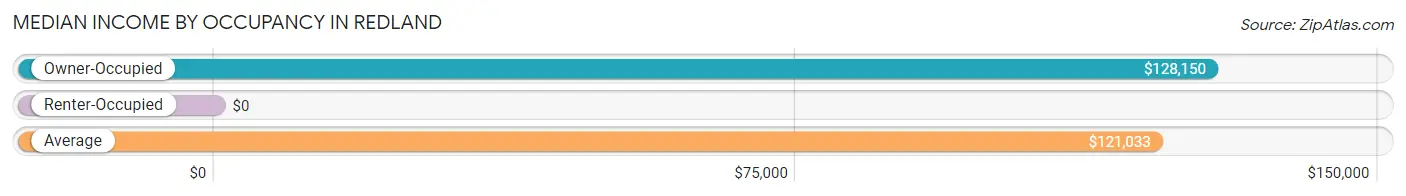
| Occupancy Type | # Households | Median Income |
| Owner-Occupied | 1,587 (92.3%) | $128,150 |
| Renter-Occupied | 133 (7.7%) | $0 |
| Average | 1,720 (100.0%) | $121,033 |
Occupancy by Householder Income Bracket in Redland
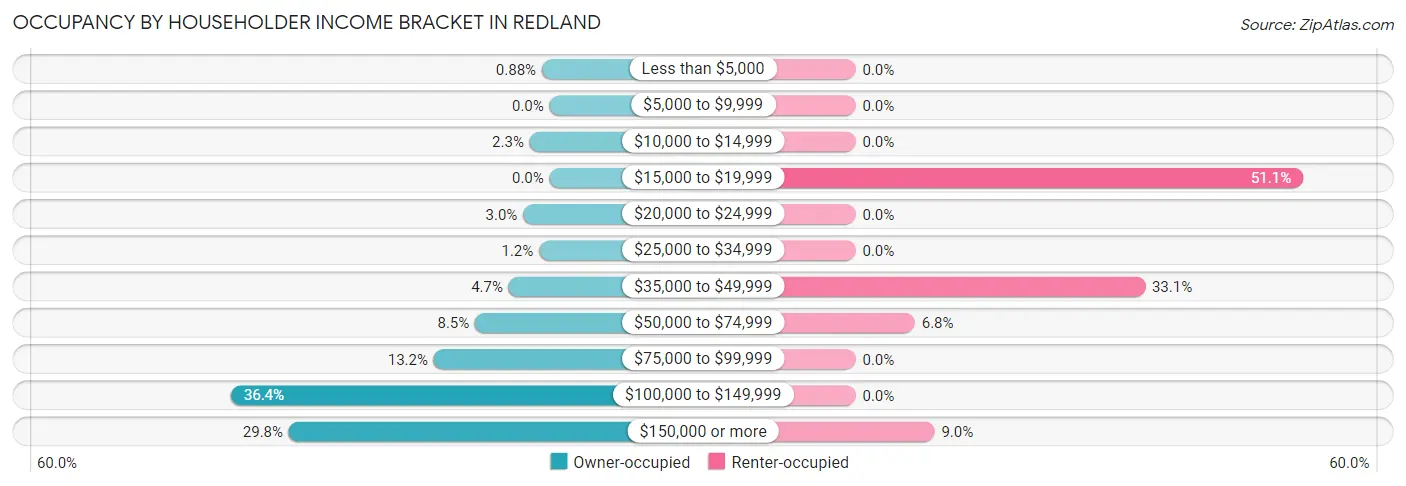
| Income Bracket | Owner-occupied | Renter-occupied |
| Less than $5,000 | 14 (0.9%) | 0 (0.0%) |
| $5,000 to $9,999 | 0 (0.0%) | 0 (0.0%) |
| $10,000 to $14,999 | 36 (2.3%) | 0 (0.0%) |
| $15,000 to $19,999 | 0 (0.0%) | 68 (51.1%) |
| $20,000 to $24,999 | 48 (3.0%) | 0 (0.0%) |
| $25,000 to $34,999 | 19 (1.2%) | 0 (0.0%) |
| $35,000 to $49,999 | 74 (4.7%) | 44 (33.1%) |
| $50,000 to $74,999 | 135 (8.5%) | 9 (6.8%) |
| $75,000 to $99,999 | 210 (13.2%) | 0 (0.0%) |
| $100,000 to $149,999 | 578 (36.4%) | 0 (0.0%) |
| $150,000 or more | 473 (29.8%) | 12 (9.0%) |
| Total | 1,587 (100.0%) | 133 (100.0%) |
Monthly Housing Cost Tiers in Redland
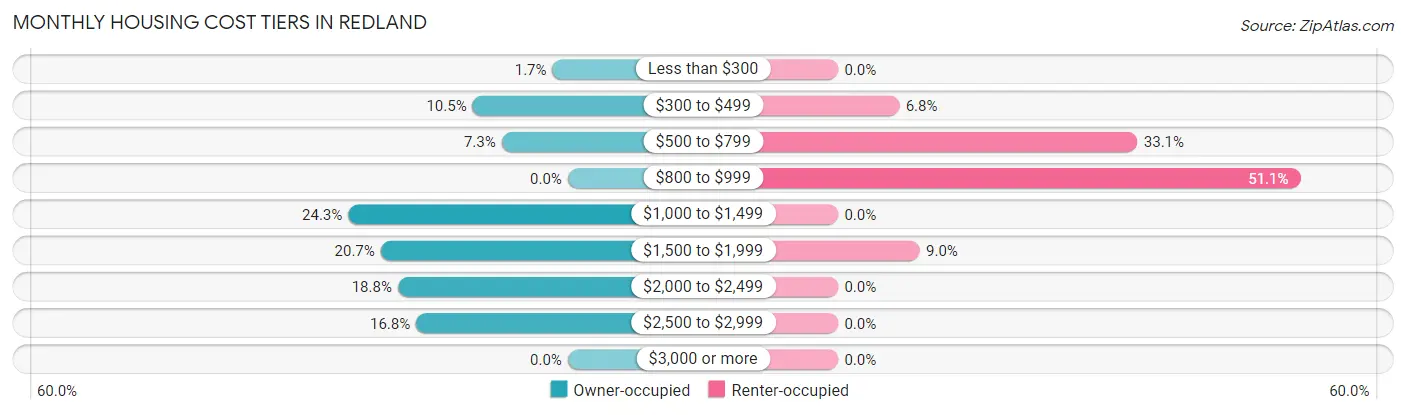
| Monthly Cost | Owner-occupied | Renter-occupied |
| Less than $300 | 27 (1.7%) | 0 (0.0%) |
| $300 to $499 | 167 (10.5%) | 9 (6.8%) |
| $500 to $799 | 116 (7.3%) | 44 (33.1%) |
| $800 to $999 | 0 (0.0%) | 68 (51.1%) |
| $1,000 to $1,499 | 385 (24.3%) | 0 (0.0%) |
| $1,500 to $1,999 | 328 (20.7%) | 12 (9.0%) |
| $2,000 to $2,499 | 298 (18.8%) | 0 (0.0%) |
| $2,500 to $2,999 | 266 (16.8%) | 0 (0.0%) |
| $3,000 or more | 0 (0.0%) | 0 (0.0%) |
| Total | 1,587 (100.0%) | 133 (100.0%) |
Physical Housing Characteristics in Redland
Housing Structures in Redland
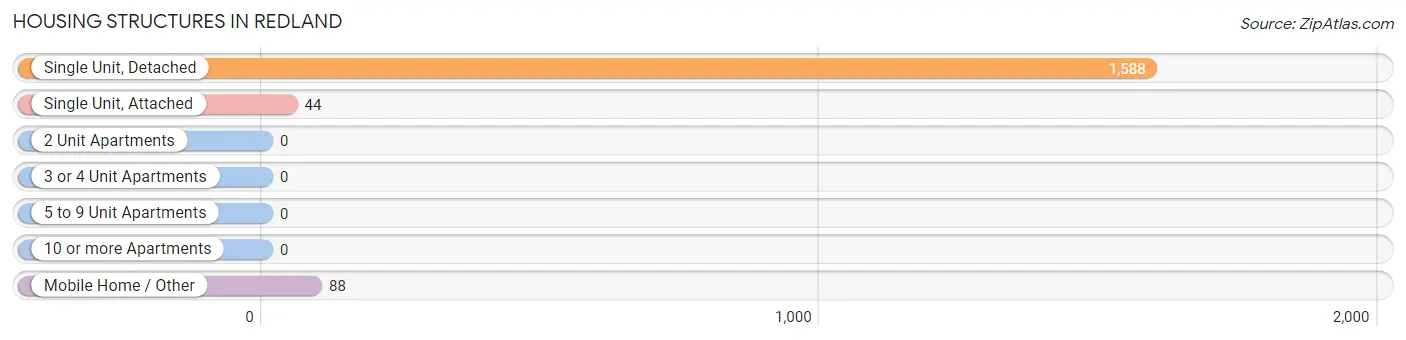
| Structure Type | # Housing Units | % Housing Units |
| Single Unit, Detached | 1,588 | 92.3% |
| Single Unit, Attached | 44 | 2.6% |
| 2 Unit Apartments | 0 | 0.0% |
| 3 or 4 Unit Apartments | 0 | 0.0% |
| 5 to 9 Unit Apartments | 0 | 0.0% |
| 10 or more Apartments | 0 | 0.0% |
| Mobile Home / Other | 88 | 5.1% |
| Total | 1,720 | 100.0% |
Housing Structures by Occupancy in Redland

| Structure Type | Owner-occupied | Renter-occupied |
| Single Unit, Detached | 1,567 (98.7%) | 21 (1.3%) |
| Single Unit, Attached | 0 (0.0%) | 44 (100.0%) |
| 2 Unit Apartments | 0 (0.0%) | 0 (0.0%) |
| 3 or 4 Unit Apartments | 0 (0.0%) | 0 (0.0%) |
| 5 to 9 Unit Apartments | 0 (0.0%) | 0 (0.0%) |
| 10 or more Apartments | 0 (0.0%) | 0 (0.0%) |
| Mobile Home / Other | 20 (22.7%) | 68 (77.3%) |
| Total | 1,587 (92.3%) | 133 (7.7%) |
Housing Structures by Number of Rooms in Redland
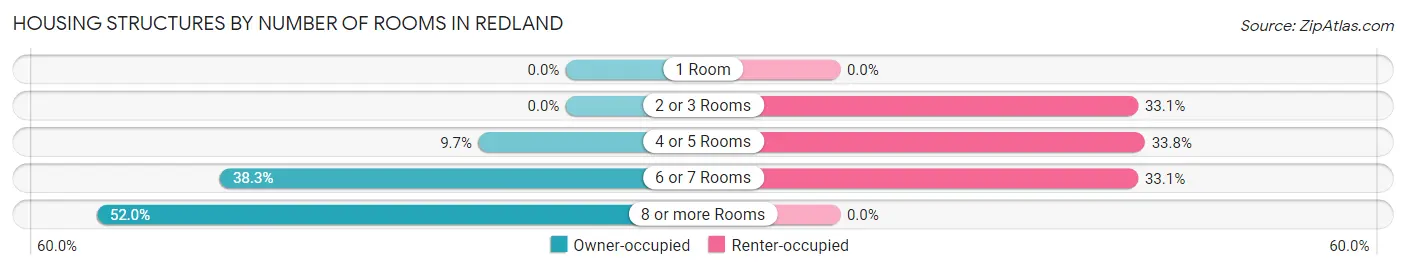
| Number of Rooms | Owner-occupied | Renter-occupied |
| 1 Room | 0 (0.0%) | 0 (0.0%) |
| 2 or 3 Rooms | 0 (0.0%) | 44 (33.1%) |
| 4 or 5 Rooms | 154 (9.7%) | 45 (33.8%) |
| 6 or 7 Rooms | 608 (38.3%) | 44 (33.1%) |
| 8 or more Rooms | 825 (52.0%) | 0 (0.0%) |
| Total | 1,587 (100.0%) | 133 (100.0%) |
Housing Structure by Heating Type in Redland
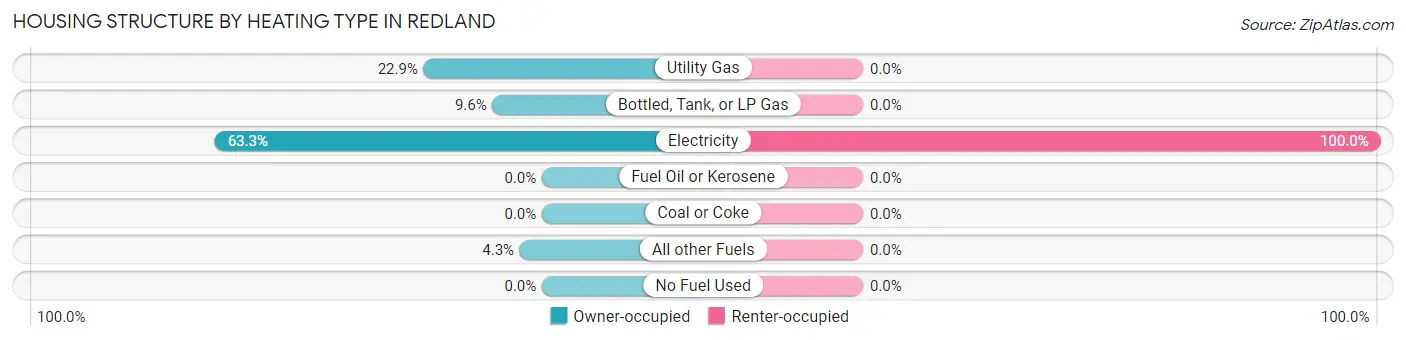
| Heating Type | Owner-occupied | Renter-occupied |
| Utility Gas | 363 (22.9%) | 0 (0.0%) |
| Bottled, Tank, or LP Gas | 152 (9.6%) | 0 (0.0%) |
| Electricity | 1,004 (63.3%) | 133 (100.0%) |
| Fuel Oil or Kerosene | 0 (0.0%) | 0 (0.0%) |
| Coal or Coke | 0 (0.0%) | 0 (0.0%) |
| All other Fuels | 68 (4.3%) | 0 (0.0%) |
| No Fuel Used | 0 (0.0%) | 0 (0.0%) |
| Total | 1,587 (100.0%) | 133 (100.0%) |
Household Vehicle Usage in Redland
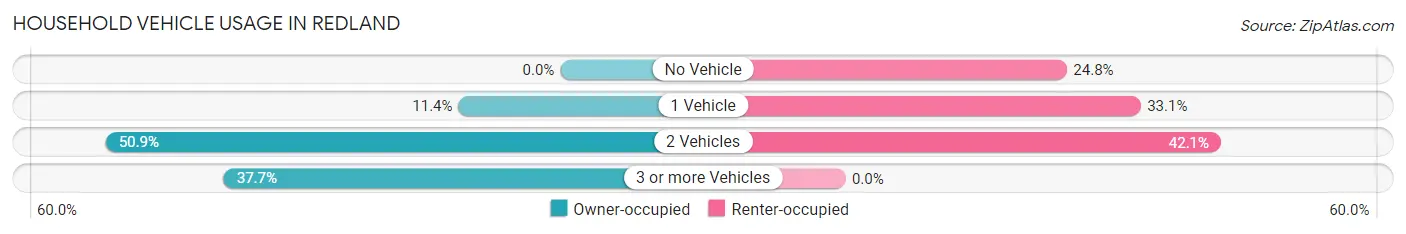
| Vehicles per Household | Owner-occupied | Renter-occupied |
| No Vehicle | 0 (0.0%) | 33 (24.8%) |
| 1 Vehicle | 181 (11.4%) | 44 (33.1%) |
| 2 Vehicles | 808 (50.9%) | 56 (42.1%) |
| 3 or more Vehicles | 598 (37.7%) | 0 (0.0%) |
| Total | 1,587 (100.0%) | 133 (100.0%) |
Real Estate & Mortgages in Redland
Real Estate and Mortgage Overview in Redland
| Characteristic | Without Mortgage | With Mortgage |
| Housing Units | 293 | 1,294 |
| Median Property Value | $324,800 | $300,300 |
| Median Household Income | $103,304 | $461 |
| Monthly Housing Costs | $471 | $0 |
| Real Estate Taxes | $690 | $87 |
Property Value by Mortgage Status in Redland
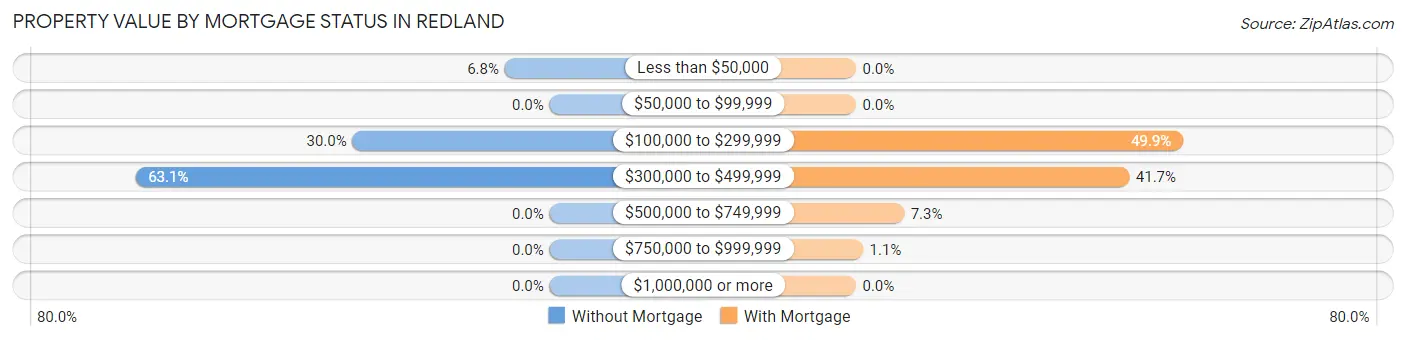
| Property Value | Without Mortgage | With Mortgage |
| Less than $50,000 | 20 (6.8%) | 0 (0.0%) |
| $50,000 to $99,999 | 0 (0.0%) | 0 (0.0%) |
| $100,000 to $299,999 | 88 (30.0%) | 646 (49.9%) |
| $300,000 to $499,999 | 185 (63.1%) | 539 (41.6%) |
| $500,000 to $749,999 | 0 (0.0%) | 95 (7.3%) |
| $750,000 to $999,999 | 0 (0.0%) | 14 (1.1%) |
| $1,000,000 or more | 0 (0.0%) | 0 (0.0%) |
| Total | 293 (100.0%) | 1,294 (100.0%) |
Household Income by Mortgage Status in Redland
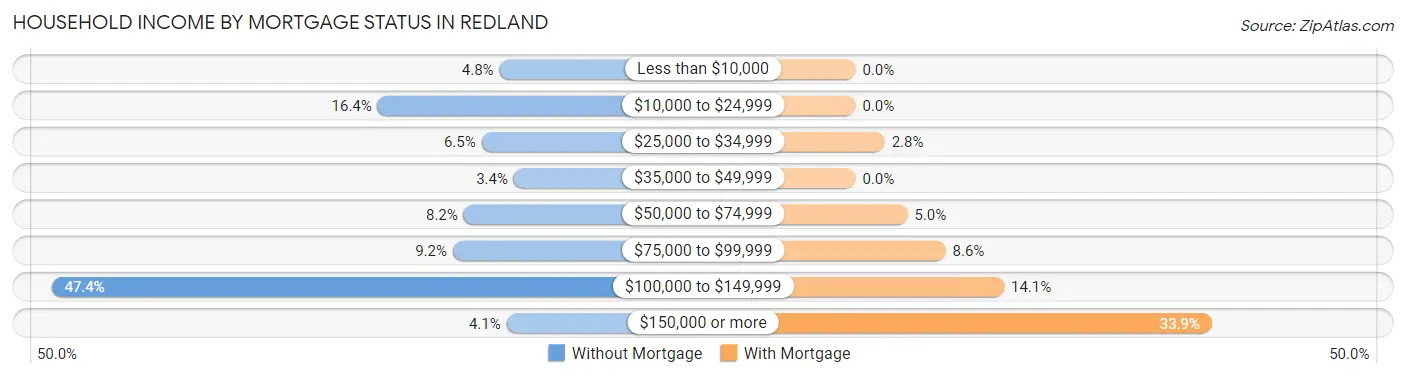
| Household Income | Without Mortgage | With Mortgage |
| Less than $10,000 | 14 (4.8%) | 0 (0.0%) |
| $10,000 to $24,999 | 48 (16.4%) | 0 (0.0%) |
| $25,000 to $34,999 | 19 (6.5%) | 36 (2.8%) |
| $35,000 to $49,999 | 10 (3.4%) | 0 (0.0%) |
| $50,000 to $74,999 | 24 (8.2%) | 64 (5.0%) |
| $75,000 to $99,999 | 27 (9.2%) | 111 (8.6%) |
| $100,000 to $149,999 | 139 (47.4%) | 183 (14.1%) |
| $150,000 or more | 12 (4.1%) | 439 (33.9%) |
| Total | 293 (100.0%) | 1,294 (100.0%) |
Property Value to Household Income Ratio in Redland
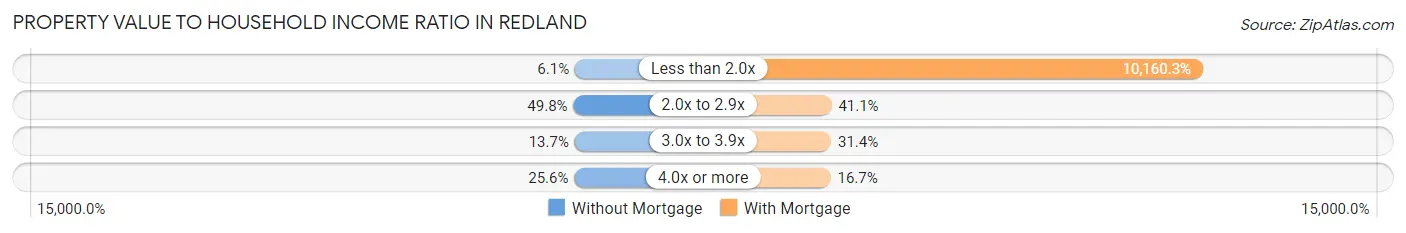
| Value-to-Income Ratio | Without Mortgage | With Mortgage |
| Less than 2.0x | 18 (6.1%) | 131,474 (10,160.3%) |
| 2.0x to 2.9x | 146 (49.8%) | 532 (41.1%) |
| 3.0x to 3.9x | 40 (13.7%) | 406 (31.4%) |
| 4.0x or more | 75 (25.6%) | 216 (16.7%) |
| Total | 293 (100.0%) | 1,294 (100.0%) |
Real Estate Taxes by Mortgage Status in Redland
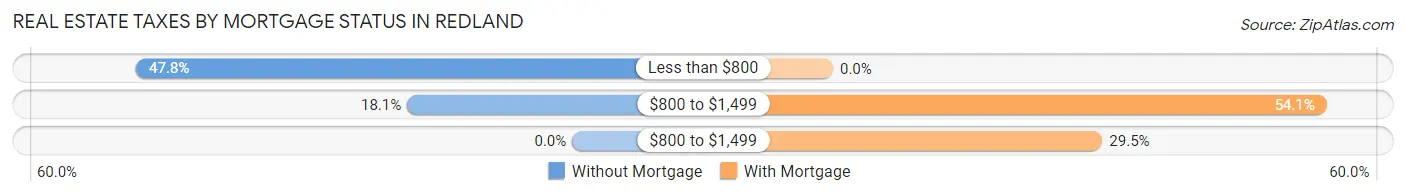
| Property Taxes | Without Mortgage | With Mortgage |
| Less than $800 | 140 (47.8%) | 0 (0.0%) |
| $800 to $1,499 | 53 (18.1%) | 700 (54.1%) |
| $800 to $1,499 | 0 (0.0%) | 382 (29.5%) |
| Total | 293 (100.0%) | 1,294 (100.0%) |
Health & Disability in Redland
Health Insurance Coverage by Age in Redland
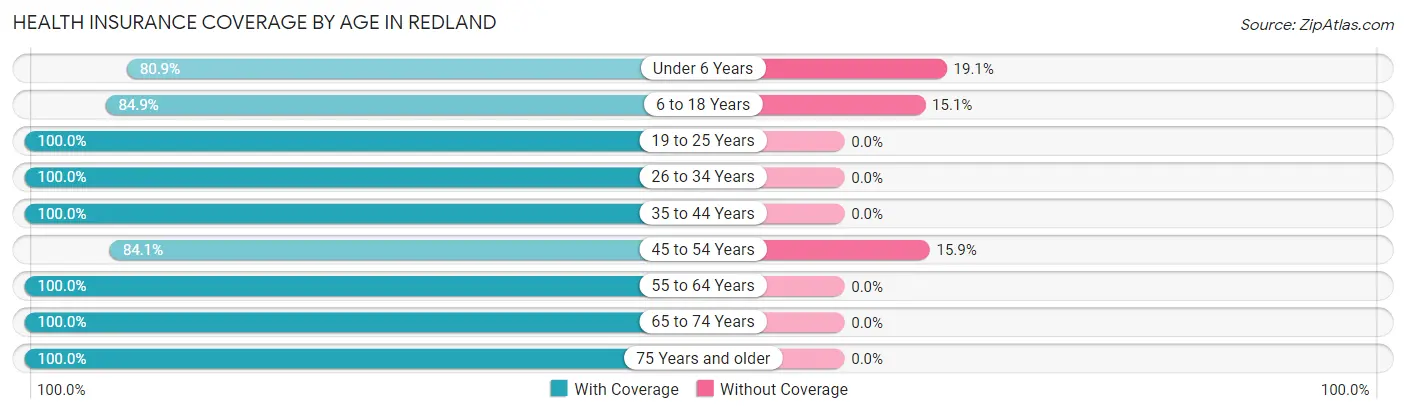
| Age Bracket | With Coverage | Without Coverage |
| Under 6 Years | 229 (80.9%) | 54 (19.1%) |
| 6 to 18 Years | 777 (84.9%) | 138 (15.1%) |
| 19 to 25 Years | 510 (100.0%) | 0 (0.0%) |
| 26 to 34 Years | 502 (100.0%) | 0 (0.0%) |
| 35 to 44 Years | 594 (100.0%) | 0 (0.0%) |
| 45 to 54 Years | 624 (84.1%) | 118 (15.9%) |
| 55 to 64 Years | 673 (100.0%) | 0 (0.0%) |
| 65 to 74 Years | 533 (100.0%) | 0 (0.0%) |
| 75 Years and older | 165 (100.0%) | 0 (0.0%) |
| Total | 4,607 (93.7%) | 310 (6.3%) |
Health Insurance Coverage by Citizenship Status in Redland
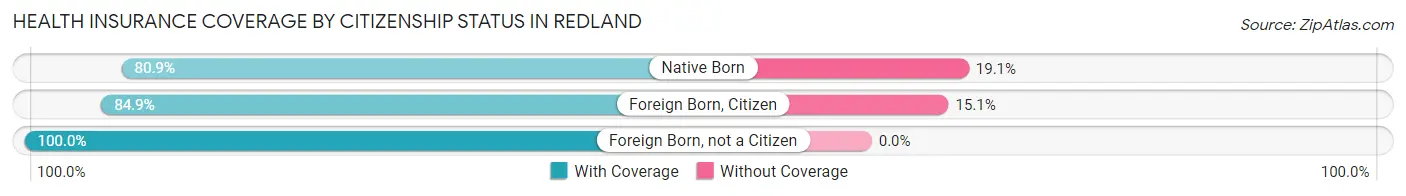
| Citizenship Status | With Coverage | Without Coverage |
| Native Born | 229 (80.9%) | 54 (19.1%) |
| Foreign Born, Citizen | 777 (84.9%) | 138 (15.1%) |
| Foreign Born, not a Citizen | 510 (100.0%) | 0 (0.0%) |
Health Insurance Coverage by Household Income in Redland
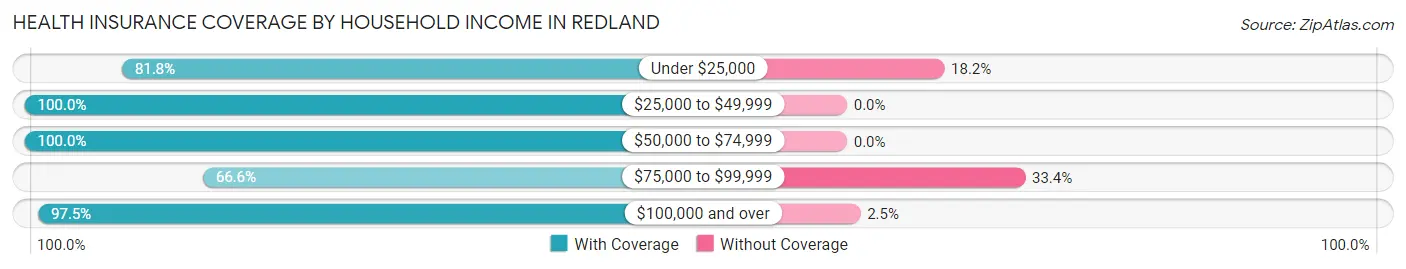
| Household Income | With Coverage | Without Coverage |
| Under $25,000 | 157 (81.8%) | 35 (18.2%) |
| $25,000 to $49,999 | 374 (100.0%) | 0 (0.0%) |
| $50,000 to $74,999 | 432 (100.0%) | 0 (0.0%) |
| $75,000 to $99,999 | 381 (66.6%) | 191 (33.4%) |
| $100,000 and over | 3,263 (97.5%) | 84 (2.5%) |
Public vs Private Health Insurance Coverage by Age in Redland
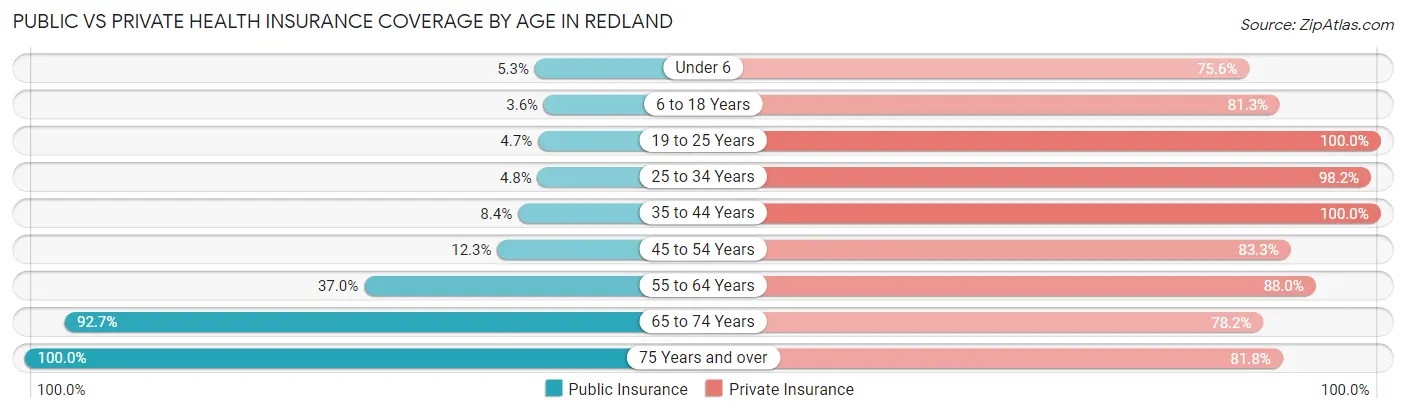
| Age Bracket | Public Insurance | Private Insurance |
| Under 6 | 15 (5.3%) | 214 (75.6%) |
| 6 to 18 Years | 33 (3.6%) | 744 (81.3%) |
| 19 to 25 Years | 24 (4.7%) | 510 (100.0%) |
| 25 to 34 Years | 24 (4.8%) | 493 (98.2%) |
| 35 to 44 Years | 50 (8.4%) | 594 (100.0%) |
| 45 to 54 Years | 91 (12.3%) | 618 (83.3%) |
| 55 to 64 Years | 249 (37.0%) | 592 (88.0%) |
| 65 to 74 Years | 494 (92.7%) | 417 (78.2%) |
| 75 Years and over | 165 (100.0%) | 135 (81.8%) |
| Total | 1,145 (23.3%) | 4,317 (87.8%) |
Disability Status by Sex by Age in Redland
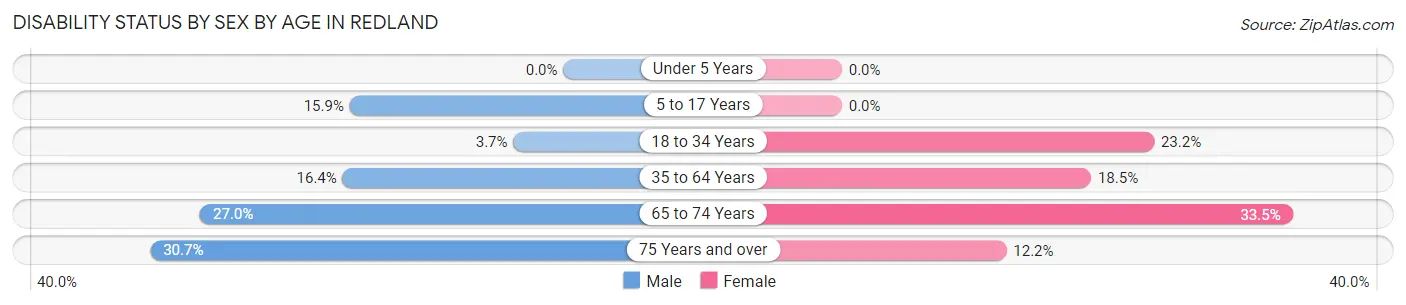
| Age Bracket | Male | Female |
| Under 5 Years | 0 (0.0%) | 0 (0.0%) |
| 5 to 17 Years | 49 (15.9%) | 0 (0.0%) |
| 18 to 34 Years | 21 (3.7%) | 118 (23.2%) |
| 35 to 64 Years | 176 (16.4%) | 173 (18.5%) |
| 65 to 74 Years | 72 (27.0%) | 89 (33.5%) |
| 75 Years and over | 23 (30.7%) | 11 (12.2%) |
Disability Class by Sex by Age in Redland
Disability Class: Hearing Difficulty
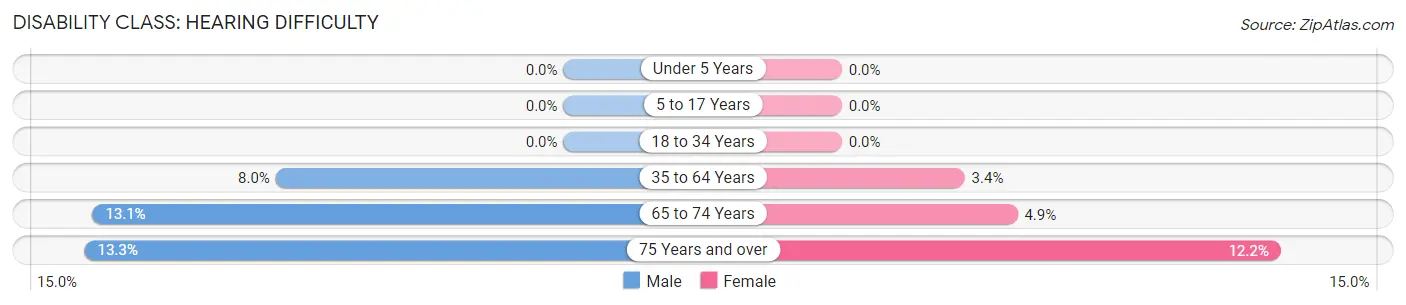
| Age Bracket | Male | Female |
| Under 5 Years | 0 (0.0%) | 0 (0.0%) |
| 5 to 17 Years | 0 (0.0%) | 0 (0.0%) |
| 18 to 34 Years | 0 (0.0%) | 0 (0.0%) |
| 35 to 64 Years | 86 (8.0%) | 32 (3.4%) |
| 65 to 74 Years | 35 (13.1%) | 13 (4.9%) |
| 75 Years and over | 10 (13.3%) | 11 (12.2%) |
Disability Class: Vision Difficulty
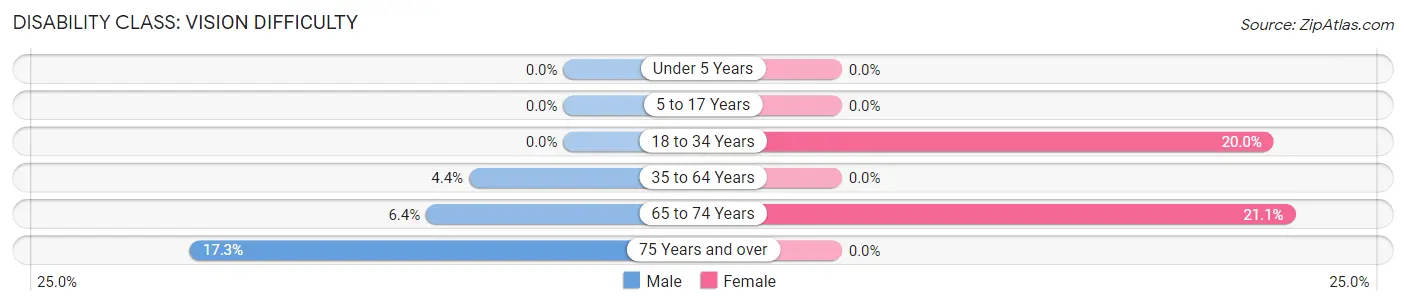
| Age Bracket | Male | Female |
| Under 5 Years | 0 (0.0%) | 0 (0.0%) |
| 5 to 17 Years | 0 (0.0%) | 0 (0.0%) |
| 18 to 34 Years | 0 (0.0%) | 102 (20.0%) |
| 35 to 64 Years | 47 (4.4%) | 0 (0.0%) |
| 65 to 74 Years | 17 (6.4%) | 56 (21.0%) |
| 75 Years and over | 13 (17.3%) | 0 (0.0%) |
Disability Class: Cognitive Difficulty
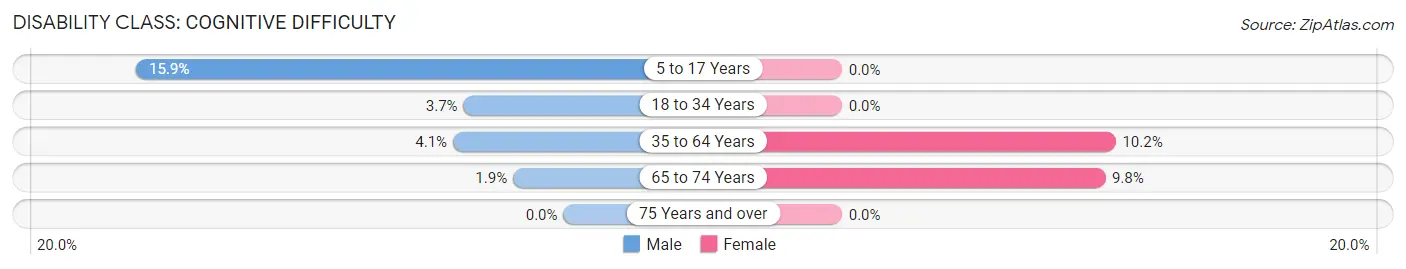
| Age Bracket | Male | Female |
| 5 to 17 Years | 49 (15.9%) | 0 (0.0%) |
| 18 to 34 Years | 21 (3.7%) | 0 (0.0%) |
| 35 to 64 Years | 44 (4.1%) | 95 (10.2%) |
| 65 to 74 Years | 5 (1.9%) | 26 (9.8%) |
| 75 Years and over | 0 (0.0%) | 0 (0.0%) |
Disability Class: Ambulatory Difficulty
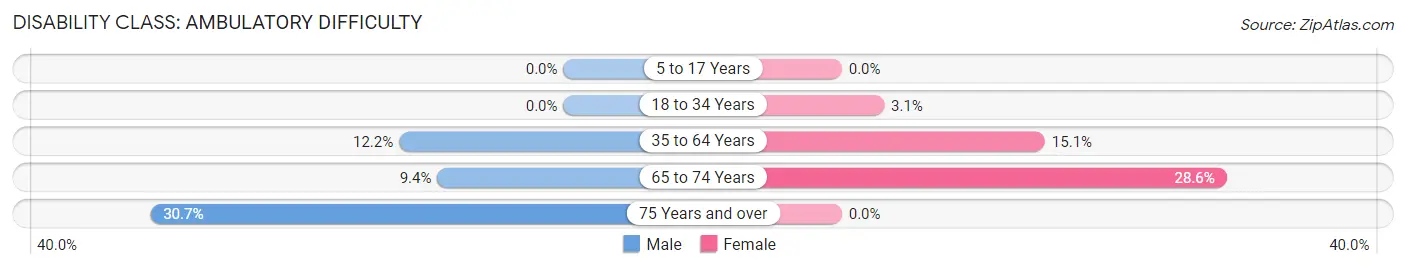
| Age Bracket | Male | Female |
| 5 to 17 Years | 0 (0.0%) | 0 (0.0%) |
| 18 to 34 Years | 0 (0.0%) | 16 (3.1%) |
| 35 to 64 Years | 131 (12.2%) | 141 (15.1%) |
| 65 to 74 Years | 25 (9.4%) | 76 (28.6%) |
| 75 Years and over | 23 (30.7%) | 0 (0.0%) |
Disability Class: Self-Care Difficulty

| Age Bracket | Male | Female |
| 5 to 17 Years | 0 (0.0%) | 0 (0.0%) |
| 18 to 34 Years | 0 (0.0%) | 0 (0.0%) |
| 35 to 64 Years | 77 (7.2%) | 20 (2.1%) |
| 65 to 74 Years | 0 (0.0%) | 26 (9.8%) |
| 75 Years and over | 0 (0.0%) | 0 (0.0%) |
Technology Access in Redland
Computing Device Access in Redland
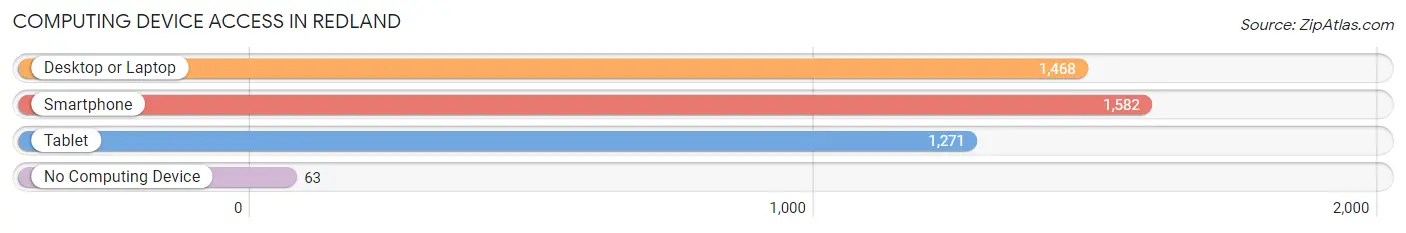
| Device Type | # Households | % Households |
| Desktop or Laptop | 1,468 | 85.4% |
| Smartphone | 1,582 | 92.0% |
| Tablet | 1,271 | 73.9% |
| No Computing Device | 63 | 3.7% |
| Total | 1,720 | 100.0% |
Internet Access in Redland
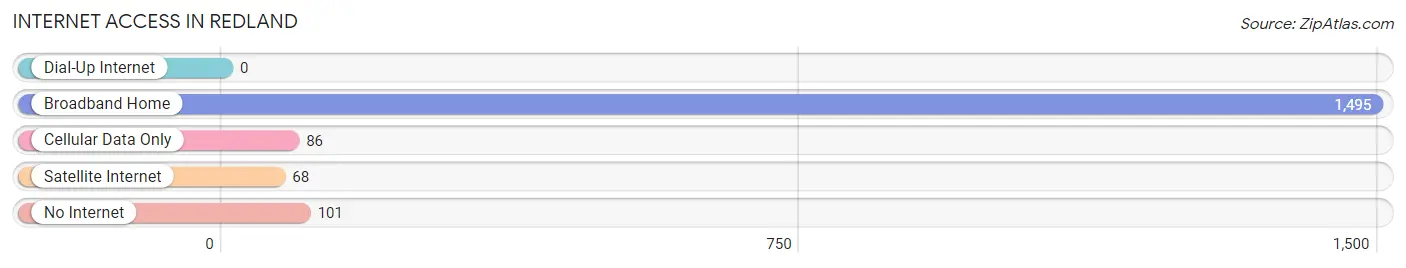
| Internet Type | # Households | % Households |
| Dial-Up Internet | 0 | 0.0% |
| Broadband Home | 1,495 | 86.9% |
| Cellular Data Only | 86 | 5.0% |
| Satellite Internet | 68 | 4.0% |
| No Internet | 101 | 5.9% |
| Total | 1,720 | 100.0% |
Redland Summary
Redland, Alabama is a small town located in the southeastern corner of the state, just north of the Florida border. It is part of the Dothan metropolitan area and is home to a population of just over 1,000 people. The town was founded in 1820 and has a rich history of agriculture, industry, and commerce.
Geography
Redland is located in the southeastern corner of Alabama, just north of the Florida border. It is part of the Dothan metropolitan area and is situated in Houston County. The town is located on the banks of the Choctawhatchee River and is surrounded by rolling hills and forests. The town is located at an elevation of approximately 200 feet above sea level.
Economy
Redland’s economy is largely based on agriculture and industry. The town is home to several farms and ranches, as well as a number of small businesses. The town is also home to a number of manufacturing plants, including a paper mill and a furniture factory. The town is also home to a number of retail stores, restaurants, and other businesses.
Demographics
As of the 2010 census, Redland had a population of 1,072 people. The racial makeup of the town was 79.2% White, 17.3% African American, 0.3% Native American, 0.7% Asian, 0.1% Pacific Islander, and 2.4% from other races. The median household income was $31,250 and the median family income was $37,500. The per capita income was $17,845.
Conclusion
Redland, Alabama is a small town located in the southeastern corner of the state, just north of the Florida border. It is part of the Dothan metropolitan area and is home to a population of just over 1,000 people. The town was founded in 1820 and has a rich history of agriculture, industry, and commerce. The town’s economy is largely based on agriculture and industry, and the town is home to a number of small businesses, manufacturing plants, and retail stores. The town’s population is largely white, with a small percentage of African Americans, Native Americans, Asians, and Pacific Islanders. The median household income is $31,250 and the median family income is $37,500.
Common Questions
What is Per Capita Income in Redland?
Per Capita income in Redland is $42,945.
What is the Median Family Income in Redland?
Median Family Income in Redland is $130,538.
What is the Median Household income in Redland?
Median Household Income in Redland is $121,033.
What is Income or Wage Gap in Redland?
Income or Wage Gap in Redland is 49.7%.
Women in Redland earn 50.3 cents for every dollar earned by a man.
What is Inequality or Gini Index in Redland?
Inequality or Gini Index in Redland is 0.31.
What is the Total Population of Redland?
Total Population of Redland is 4,960.
What is the Total Male Population of Redland?
Total Male Population of Redland is 2,386.
What is the Total Female Population of Redland?
Total Female Population of Redland is 2,574.
What is the Ratio of Males per 100 Females in Redland?
There are 92.70 Males per 100 Females in Redland.
What is the Ratio of Females per 100 Males in Redland?
There are 107.88 Females per 100 Males in Redland.
What is the Median Population Age in Redland?
Median Population Age in Redland is 38.8 Years.
What is the Average Family Size in Redland
Average Family Size in Redland is 3.2 People.
What is the Average Household Size in Redland
Average Household Size in Redland is 2.9 People.
How Large is the Labor Force in Redland?
There are 2,721 People in the Labor Forcein in Redland.
What is the Percentage of People in the Labor Force in Redland?
66.6% of People are in the Labor Force in Redland.
What is the Unemployment Rate in Redland?
Unemployment Rate in Redland is 1.3%.