Poipu, HI Map & Demographics
Poipu Map
Poipu Overview
$115,240
PER CAPITA INCOME
$158,021
AVG FAMILY INCOME
$134,028
AVG HOUSEHOLD INCOME
65.3%
WAGE / INCOME GAP [ % ]
34.7¢/ $1
WAGE / INCOME GAP [ $ ]
$11,378
FAMILY INCOME DEFICIT
0.57
INEQUALITY / GINI INDEX
1,085
TOTAL POPULATION
550
MALE POPULATION
535
FEMALE POPULATION
102.80
MALES / 100 FEMALES
97.27
FEMALES / 100 MALES
62.2
MEDIAN AGE
2.6
AVG FAMILY SIZE
2.0
AVG HOUSEHOLD SIZE
519
LABOR FORCE [ PEOPLE ]
53.1%
PERCENT IN LABOR FORCE
2.3%
UNEMPLOYMENT RATE
Income in Poipu
Income Overview in Poipu
Per Capita Income in Poipu is $115,240, while median incomes of families and households are $158,021 and $134,028 respectively.
| Characteristic | Number | Measure |
| Per Capita Income | 1,085 | $115,240 |
| Median Family Income | 323 | $158,021 |
| Mean Family Income | 323 | $255,954 |
| Median Household Income | 538 | $134,028 |
| Mean Household Income | 538 | $232,264 |
| Income Deficit | 323 | $11,378 |
| Wage / Income Gap (%) | 1,085 | 65.33% |
| Wage / Income Gap ($) | 1,085 | 34.67¢ per $1 |
| Gini / Inequality Index | 1,085 | 0.57 |
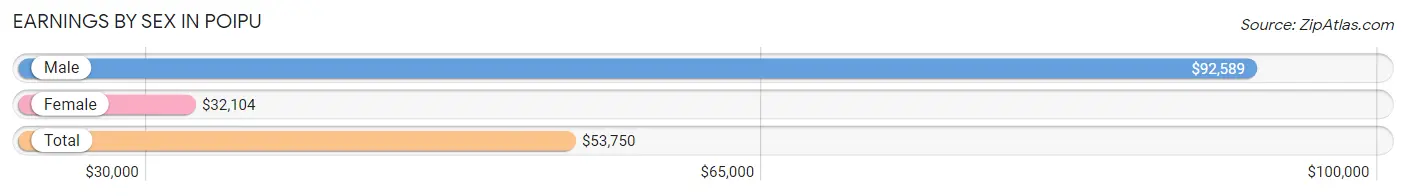
Earnings by Sex in Poipu
Average Earnings in Poipu are $53,750, $92,589 for men and $32,104 for women, a difference of 65.3%.
| Sex | Number | Average Earnings |
| Male | 287 (51.2%) | $92,589 |
| Female | 273 (48.7%) | $32,104 |
| Total | 560 (100.0%) | $53,750 |
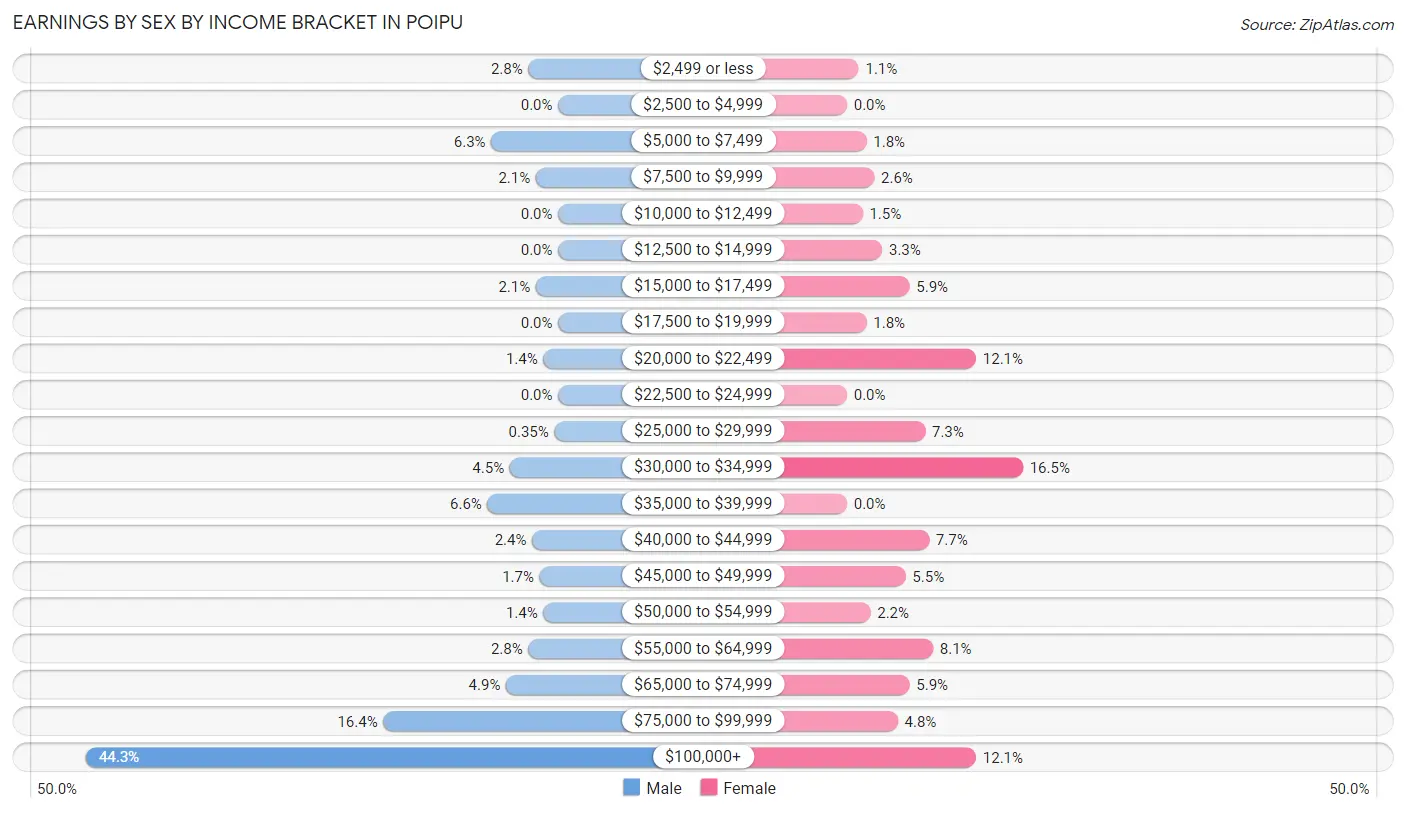
Earnings by Sex by Income Bracket in Poipu
The most common earnings brackets in Poipu are $100,000+ for men (127 | 44.3%) and $30,000 to $34,999 for women (45 | 16.5%).
| Income | Male | Female |
| $2,499 or less | 8 (2.8%) | 3 (1.1%) |
| $2,500 to $4,999 | 0 (0.0%) | 0 (0.0%) |
| $5,000 to $7,499 | 18 (6.3%) | 5 (1.8%) |
| $7,500 to $9,999 | 6 (2.1%) | 7 (2.6%) |
| $10,000 to $12,499 | 0 (0.0%) | 4 (1.5%) |
| $12,500 to $14,999 | 0 (0.0%) | 9 (3.3%) |
| $15,000 to $17,499 | 6 (2.1%) | 16 (5.9%) |
| $17,500 to $19,999 | 0 (0.0%) | 5 (1.8%) |
| $20,000 to $22,499 | 4 (1.4%) | 33 (12.1%) |
| $22,500 to $24,999 | 0 (0.0%) | 0 (0.0%) |
| $25,000 to $29,999 | 1 (0.4%) | 20 (7.3%) |
| $30,000 to $34,999 | 13 (4.5%) | 45 (16.5%) |
| $35,000 to $39,999 | 19 (6.6%) | 0 (0.0%) |
| $40,000 to $44,999 | 7 (2.4%) | 21 (7.7%) |
| $45,000 to $49,999 | 5 (1.7%) | 15 (5.5%) |
| $50,000 to $54,999 | 4 (1.4%) | 6 (2.2%) |
| $55,000 to $64,999 | 8 (2.8%) | 22 (8.1%) |
| $65,000 to $74,999 | 14 (4.9%) | 16 (5.9%) |
| $75,000 to $99,999 | 47 (16.4%) | 13 (4.8%) |
| $100,000+ | 127 (44.3%) | 33 (12.1%) |
| Total | 287 (100.0%) | 273 (100.0%) |
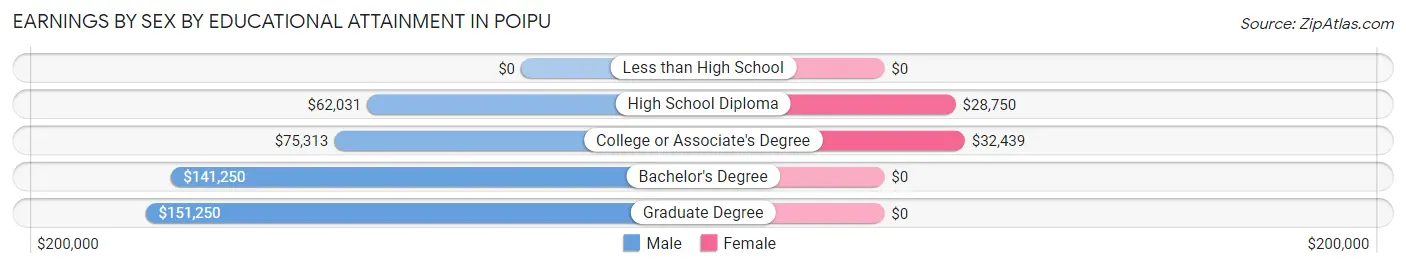
Earnings by Sex by Educational Attainment in Poipu
Average earnings in Poipu are $93,125 for men and $33,750 for women, a difference of 63.8%. Men with an educational attainment of graduate degree enjoy the highest average annual earnings of $151,250, while those with high school diploma education earn the least with $62,031. Women with an educational attainment of college or associate's degree earn the most with the average annual earnings of $32,439, while those with high school diploma education have the smallest earnings of $28,750.
| Educational Attainment | Male Income | Female Income |
| Less than High School | - | - |
| High School Diploma | $62,031 | $28,750 |
| College or Associate's Degree | $75,313 | $32,439 |
| Bachelor's Degree | $141,250 | $0 |
| Graduate Degree | $151,250 | $0 |
| Total | $93,125 | $33,750 |
Family Income in Poipu
Family Income Brackets in Poipu
According to the Poipu family income data, there are 127 families falling into the $200,000+ income range, which is the most common income bracket and makes up 39.3% of all families. Conversely, the less than $10,000 income bracket is the least frequent group with only 1 families (0.3%) belonging to this category.
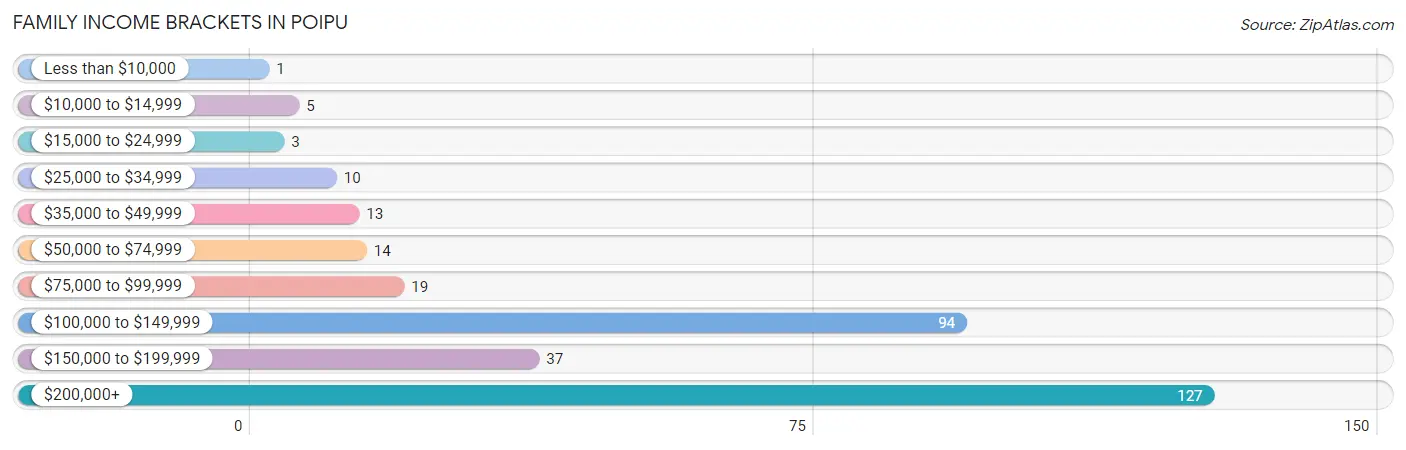
| Income Bracket | # Families | % Families |
| Less than $10,000 | 1 | 0.3% |
| $10,000 to $14,999 | 5 | 1.5% |
| $15,000 to $24,999 | 3 | 0.9% |
| $25,000 to $34,999 | 10 | 3.1% |
| $35,000 to $49,999 | 13 | 4.0% |
| $50,000 to $74,999 | 14 | 4.3% |
| $75,000 to $99,999 | 19 | 5.9% |
| $100,000 to $149,999 | 94 | 29.1% |
| $150,000 to $199,999 | 37 | 11.5% |
| $200,000+ | 127 | 39.3% |
Family Income by Famaliy Size in Poipu
3-person families (41 | 12.7%) account for the highest median family income in Poipu with $165,750 per family, while 2-person families (239 | 74.0%) have the highest median income of $79,375 per family member.
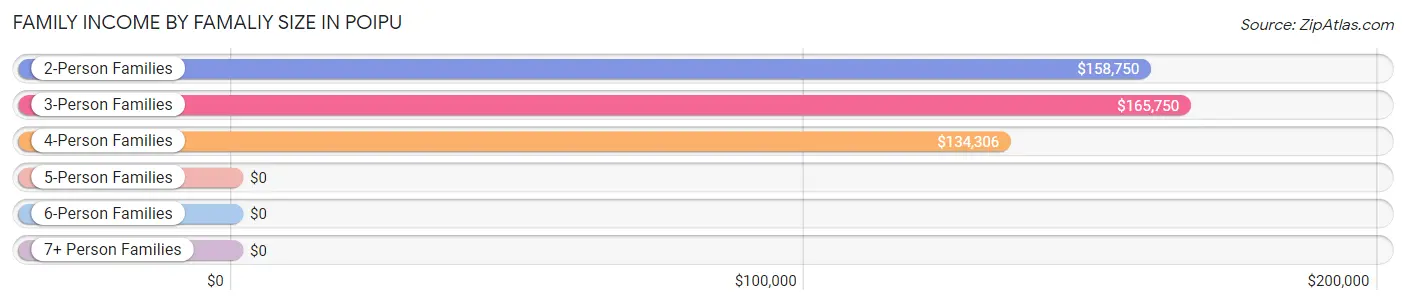
| Income Bracket | # Families | Median Income |
| 2-Person Families | 239 (74.0%) | $158,750 |
| 3-Person Families | 41 (12.7%) | $165,750 |
| 4-Person Families | 36 (11.2%) | $134,306 |
| 5-Person Families | 0 (0.0%) | $0 |
| 6-Person Families | 7 (2.2%) | $0 |
| 7+ Person Families | 0 (0.0%) | $0 |
| Total | 323 (100.0%) | $158,021 |
Family Income by Number of Earners in Poipu
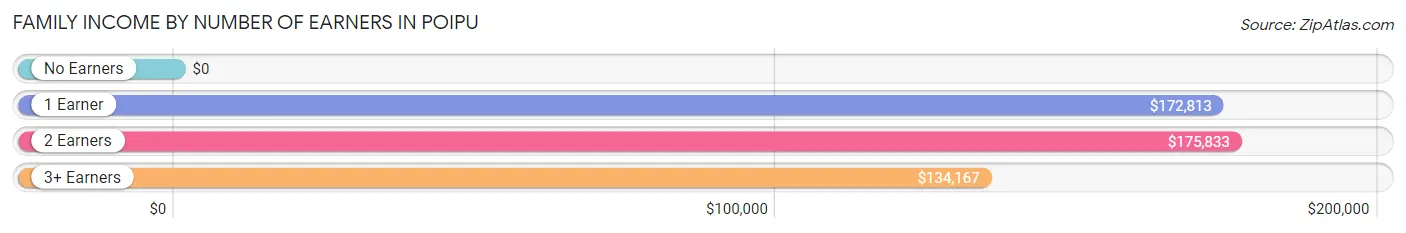
| Number of Earners | # Families | Median Income |
| No Earners | 106 (32.8%) | $0 |
| 1 Earner | 81 (25.1%) | $172,813 |
| 2 Earners | 104 (32.2%) | $175,833 |
| 3+ Earners | 32 (9.9%) | $134,167 |
| Total | 323 (100.0%) | $158,021 |
Household Income in Poipu
Household Income Brackets in Poipu
With 157 households falling in the category, the $200,000+ income range is the most frequent in Poipu, accounting for 29.2% of all households. In contrast, only 7 households (1.3%) fall into the $15,000 to $24,999 income bracket, making it the least populous group.
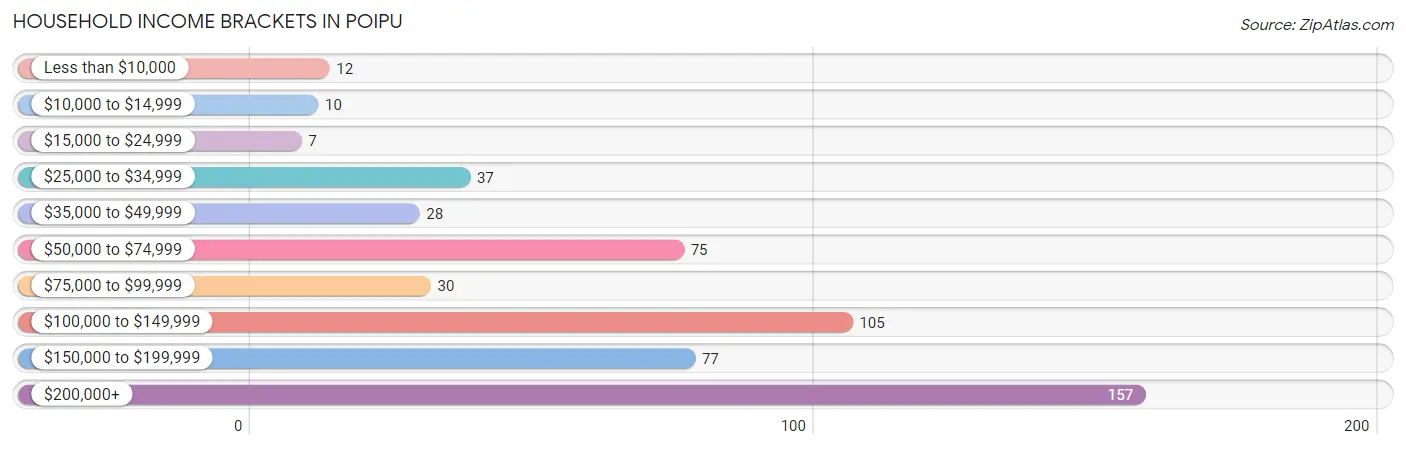
| Income Bracket | # Households | % Households |
| Less than $10,000 | 12 | 2.2% |
| $10,000 to $14,999 | 10 | 1.9% |
| $15,000 to $24,999 | 7 | 1.3% |
| $25,000 to $34,999 | 37 | 6.9% |
| $35,000 to $49,999 | 28 | 5.2% |
| $50,000 to $74,999 | 75 | 13.9% |
| $75,000 to $99,999 | 30 | 5.6% |
| $100,000 to $149,999 | 105 | 19.5% |
| $150,000 to $199,999 | 77 | 14.3% |
| $200,000+ | 157 | 29.2% |
Household Income by Householder Age in Poipu
The median household income in Poipu is $134,028, with the highest median household income of $168,125 found in the 25 to 44 years age bracket for the primary householder. A total of 77 households (14.3%) fall into this category.
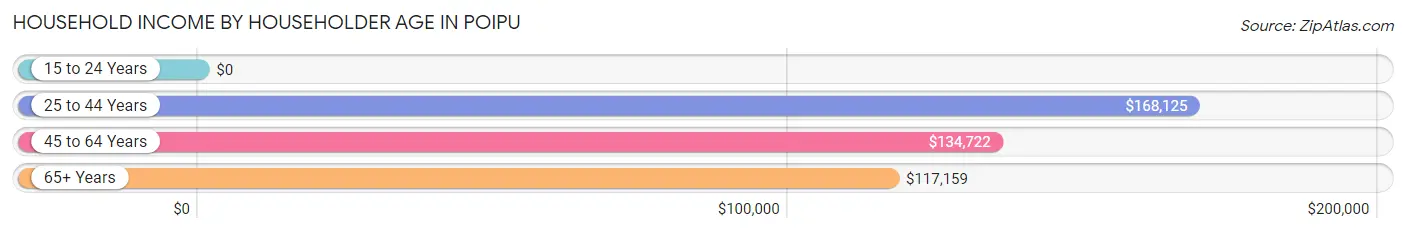
| Income Bracket | # Households | Median Income |
| 15 to 24 Years | 0 (0.0%) | $0 |
| 25 to 44 Years | 77 (14.3%) | $168,125 |
| 45 to 64 Years | 166 (30.9%) | $134,722 |
| 65+ Years | 295 (54.8%) | $117,159 |
| Total | 538 (100.0%) | $134,028 |
Poverty in Poipu
Income Below Poverty by Sex and Age in Poipu
With 2.9% poverty level for males and 10.3% for females among the residents of Poipu, 15 year old males and 18 to 24 year old females are the most vulnerable to poverty, with 4 males (100.0%) and 20 females (74.1%) in their respective age groups living below the poverty level.
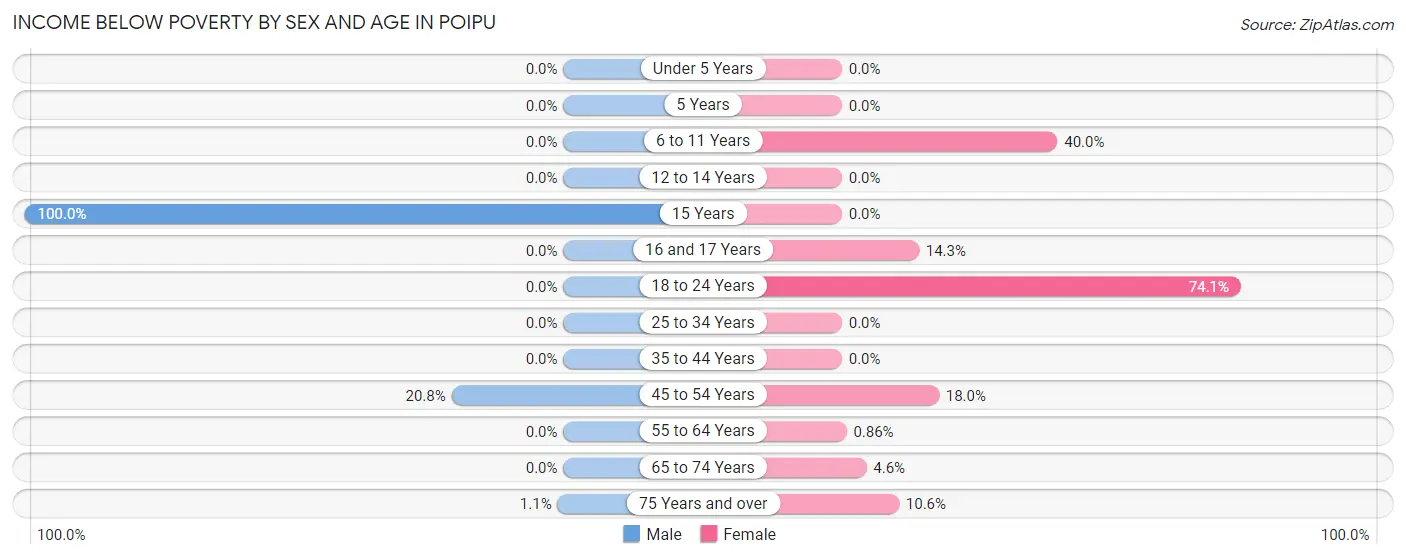
| Age Bracket | Male | Female |
| Under 5 Years | 0 (0.0%) | 0 (0.0%) |
| 5 Years | 0 (0.0%) | 0 (0.0%) |
| 6 to 11 Years | 0 (0.0%) | 6 (40.0%) |
| 12 to 14 Years | 0 (0.0%) | 0 (0.0%) |
| 15 Years | 4 (100.0%) | 0 (0.0%) |
| 16 and 17 Years | 0 (0.0%) | 5 (14.3%) |
| 18 to 24 Years | 0 (0.0%) | 20 (74.1%) |
| 25 to 34 Years | 0 (0.0%) | 0 (0.0%) |
| 35 to 44 Years | 0 (0.0%) | 0 (0.0%) |
| 45 to 54 Years | 11 (20.7%) | 9 (18.0%) |
| 55 to 64 Years | 0 (0.0%) | 1 (0.9%) |
| 65 to 74 Years | 0 (0.0%) | 5 (4.5%) |
| 75 Years and over | 1 (1.1%) | 9 (10.6%) |
| Total | 16 (2.9%) | 55 (10.3%) |
Income Above Poverty by Sex and Age in Poipu
According to the poverty statistics in Poipu, males aged under 5 years and females aged under 5 years are the age groups that are most secure financially, with 100.0% of males and 100.0% of females in these age groups living above the poverty line.
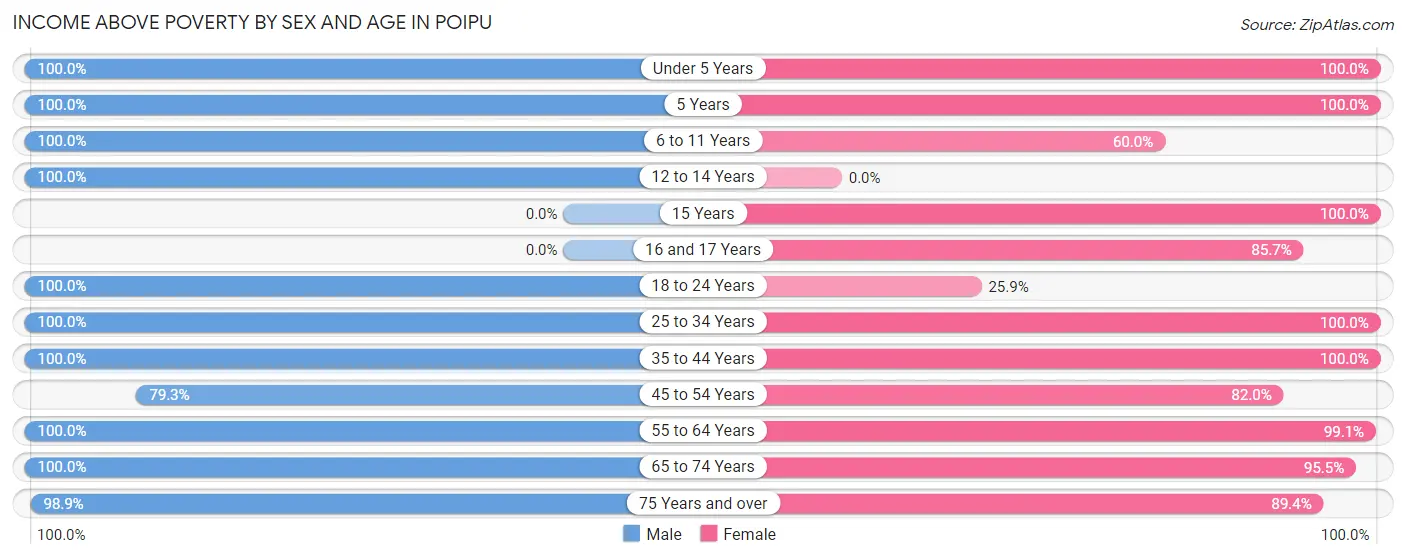
| Age Bracket | Male | Female |
| Under 5 Years | 23 (100.0%) | 6 (100.0%) |
| 5 Years | 4 (100.0%) | 3 (100.0%) |
| 6 to 11 Years | 8 (100.0%) | 9 (60.0%) |
| 12 to 14 Years | 28 (100.0%) | 0 (0.0%) |
| 15 Years | 0 (0.0%) | 16 (100.0%) |
| 16 and 17 Years | 0 (0.0%) | 30 (85.7%) |
| 18 to 24 Years | 6 (100.0%) | 7 (25.9%) |
| 25 to 34 Years | 49 (100.0%) | 53 (100.0%) |
| 35 to 44 Years | 14 (100.0%) | 19 (100.0%) |
| 45 to 54 Years | 42 (79.2%) | 41 (82.0%) |
| 55 to 64 Years | 108 (100.0%) | 115 (99.1%) |
| 65 to 74 Years | 161 (100.0%) | 105 (95.5%) |
| 75 Years and over | 91 (98.9%) | 76 (89.4%) |
| Total | 534 (97.1%) | 480 (89.7%) |
Income Below Poverty Among Married-Couple Families in Poipu
The poverty statistics for married-couple families in Poipu show that 2.9% or 9 of the total 311 families live below the poverty line. Families with 1 or 2 children have the highest poverty rate of 13.8%, comprising of 8 families. On the other hand, families with 3 or 4 children have the lowest poverty rate of 0.0%, which includes 0 families.
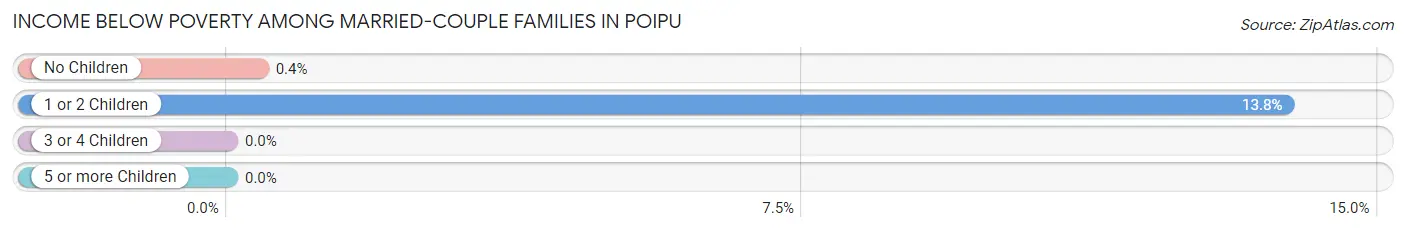
| Children | Above Poverty | Below Poverty |
| No Children | 249 (99.6%) | 1 (0.4%) |
| 1 or 2 Children | 50 (86.2%) | 8 (13.8%) |
| 3 or 4 Children | 3 (100.0%) | 0 (0.0%) |
| 5 or more Children | 0 (0.0%) | 0 (0.0%) |
| Total | 302 (97.1%) | 9 (2.9%) |
Income Below Poverty Among Single-Parent Households in Poipu
| Children | Single Father | Single Mother |
| No Children | 0 (0.0%) | 0 (0.0%) |
| 1 or 2 Children | 0 (0.0%) | 0 (0.0%) |
| 3 or 4 Children | 0 (0.0%) | 0 (0.0%) |
| 5 or more Children | 0 (0.0%) | 0 (0.0%) |
| Total | 0 (0.0%) | 0 (0.0%) |
Income Below Poverty Among Married-Couple vs Single-Parent Households in Poipu
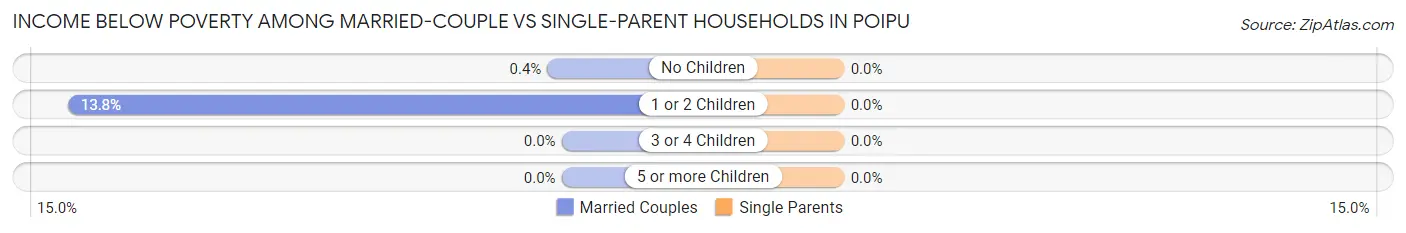
| Children | Married-Couple Families | Single-Parent Households |
| No Children | 1 (0.4%) | 0 (0.0%) |
| 1 or 2 Children | 8 (13.8%) | 0 (0.0%) |
| 3 or 4 Children | 0 (0.0%) | 0 (0.0%) |
| 5 or more Children | 0 (0.0%) | 0 (0.0%) |
| Total | 9 (2.9%) | 0 (0.0%) |
Race in Poipu
The most populous races in Poipu are White / Caucasian (742 | 68.4%), Two or more Races (162 | 14.9%), and Hispanic or Latino (143 | 13.2%).
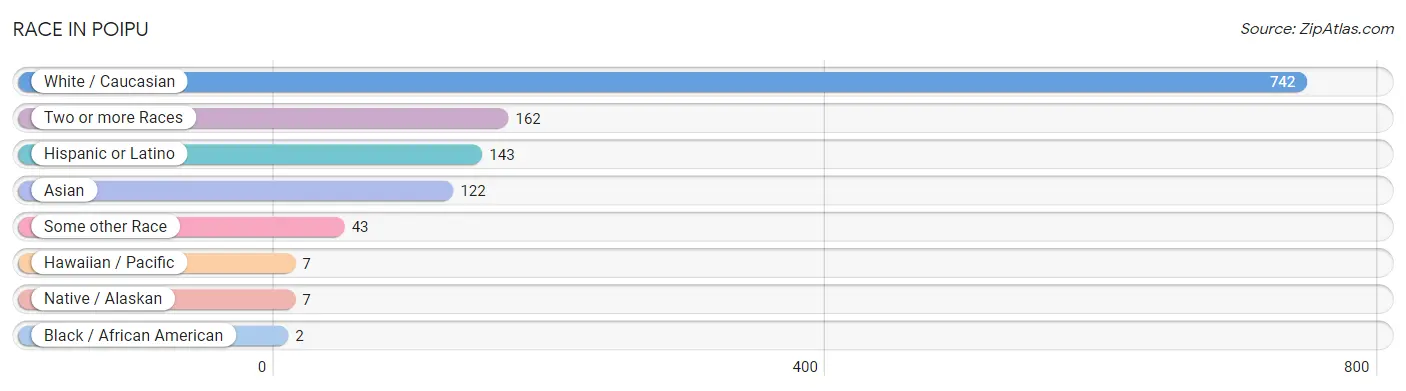
| Race | # Population | % Population |
| Asian | 122 | 11.2% |
| Black / African American | 2 | 0.2% |
| Hawaiian / Pacific | 7 | 0.6% |
| Hispanic or Latino | 143 | 13.2% |
| Native / Alaskan | 7 | 0.6% |
| White / Caucasian | 742 | 68.4% |
| Two or more Races | 162 | 14.9% |
| Some other Race | 43 | 4.0% |
| Total | 1,085 | 100.0% |
Ancestry in Poipu
The most populous ancestries reported in Poipu are German (191 | 17.6%), English (173 | 15.9%), Irish (147 | 13.6%), European (99 | 9.1%), and Bhutanese (86 | 7.9%), together accounting for 64.1% of all Poipu residents.
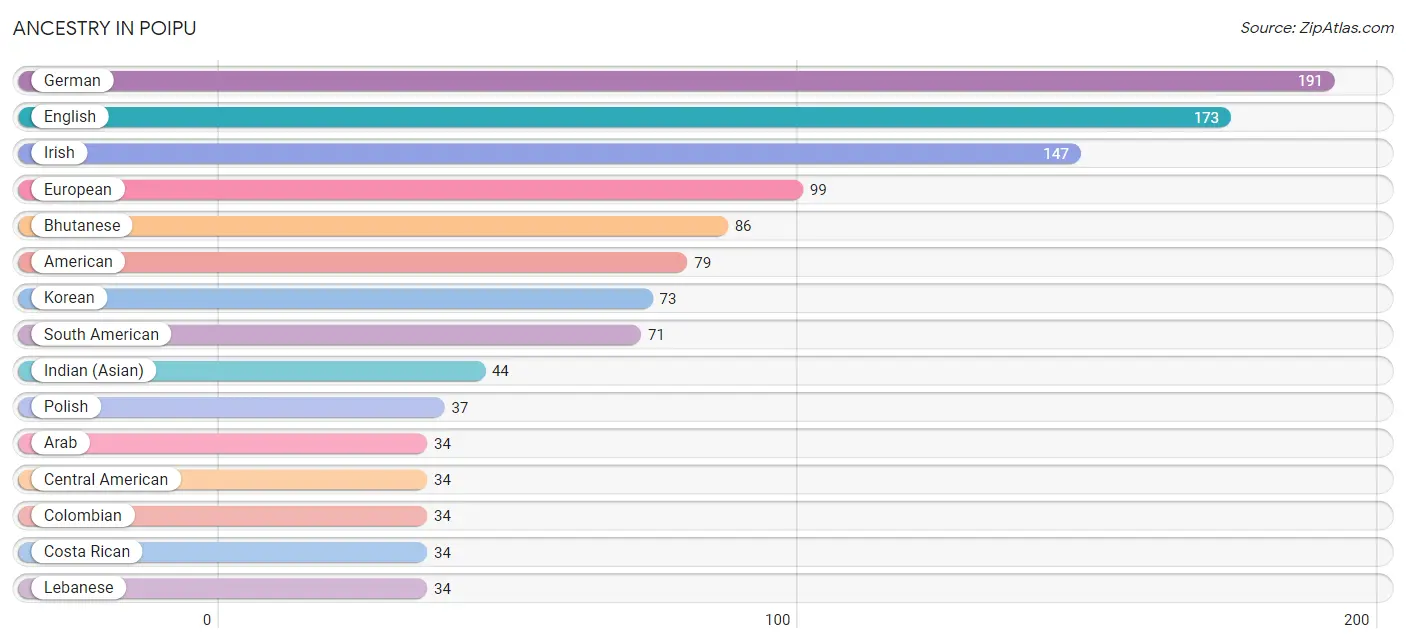
| Ancestry | # Population | % Population |
| American | 79 | 7.3% |
| Arab | 34 | 3.1% |
| Australian | 2 | 0.2% |
| Bhutanese | 86 | 7.9% |
| British | 18 | 1.7% |
| Canadian | 7 | 0.6% |
| Central American | 34 | 3.1% |
| Colombian | 34 | 3.1% |
| Costa Rican | 34 | 3.1% |
| Cuban | 7 | 0.6% |
| Czech | 3 | 0.3% |
| Danish | 13 | 1.2% |
| Dutch | 13 | 1.2% |
| English | 173 | 15.9% |
| European | 99 | 9.1% |
| Finnish | 3 | 0.3% |
| French | 30 | 2.8% |
| French Canadian | 3 | 0.3% |
| German | 191 | 17.6% |
| Greek | 4 | 0.4% |
| Indian (Asian) | 44 | 4.1% |
| Irish | 147 | 13.6% |
| Italian | 22 | 2.0% |
| Korean | 73 | 6.7% |
| Latvian | 5 | 0.5% |
| Lebanese | 34 | 3.1% |
| Mexican | 25 | 2.3% |
| Native Hawaiian | 33 | 3.0% |
| Norwegian | 27 | 2.5% |
| Peruvian | 17 | 1.6% |
| Polish | 37 | 3.4% |
| Portuguese | 3 | 0.3% |
| Potawatomi | 2 | 0.2% |
| Puerto Rican | 6 | 0.5% |
| Russian | 15 | 1.4% |
| Scandinavian | 8 | 0.7% |
| Scotch-Irish | 22 | 2.0% |
| Scottish | 11 | 1.0% |
| Slovak | 5 | 0.5% |
| South American | 71 | 6.5% |
| South American Indian | 17 | 1.6% |
| Sri Lankan | 2 | 0.2% |
| Swedish | 15 | 1.4% |
| Swiss | 1 | 0.1% |
| Thai | 5 | 0.5% |
| Ukrainian | 5 | 0.5% |
| Venezuelan | 20 | 1.8% |
| Welsh | 3 | 0.3% | View All 48 Rows |
Immigrants in Poipu
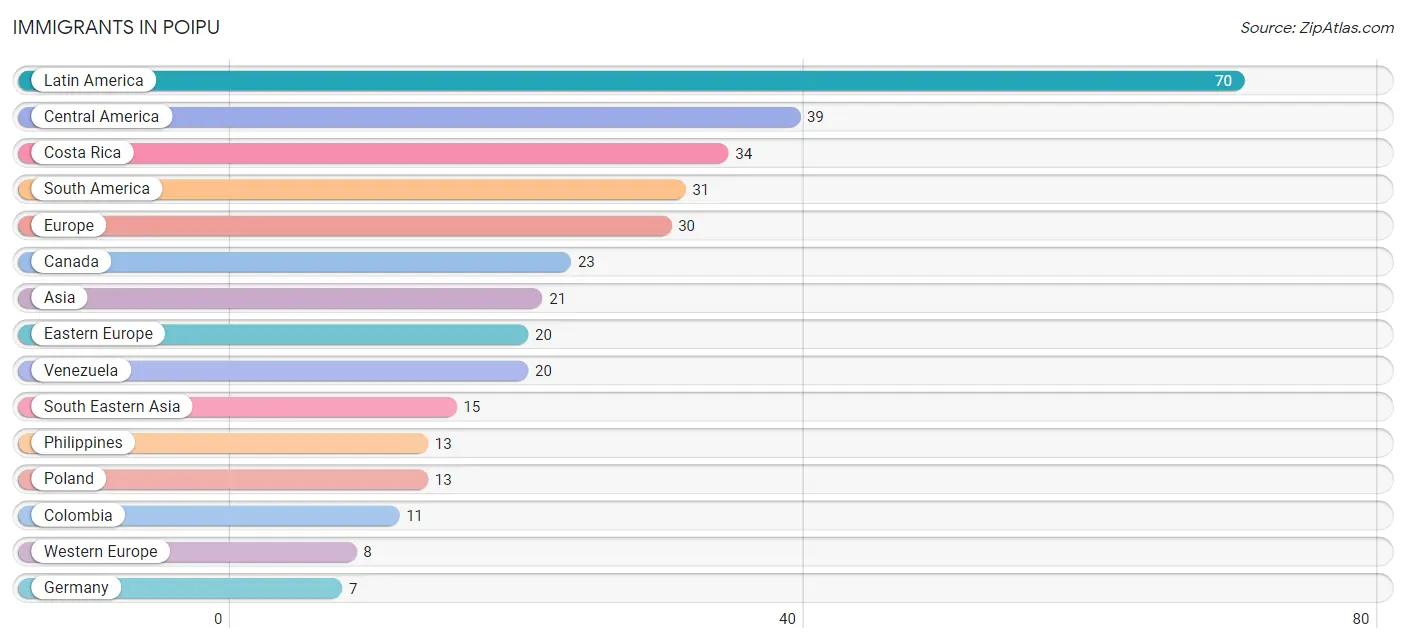
The most numerous immigrant groups reported in Poipu came from Latin America (70 | 6.5%), Central America (39 | 3.6%), Costa Rica (34 | 3.1%), South America (31 | 2.9%), and Europe (30 | 2.8%), together accounting for 18.8% of all Poipu residents.
| Immigration Origin | # Population | % Population |
| Asia | 21 | 1.9% |
| Australia | 2 | 0.2% |
| Canada | 23 | 2.1% |
| Central America | 39 | 3.6% |
| China | 6 | 0.5% |
| Colombia | 11 | 1.0% |
| Costa Rica | 34 | 3.1% |
| Eastern Asia | 6 | 0.5% |
| Eastern Europe | 20 | 1.8% |
| England | 2 | 0.2% |
| Europe | 30 | 2.8% |
| France | 1 | 0.1% |
| Germany | 7 | 0.6% |
| Latin America | 70 | 6.5% |
| Mexico | 5 | 0.5% |
| Northern Europe | 2 | 0.2% |
| Oceania | 2 | 0.2% |
| Philippines | 13 | 1.2% |
| Poland | 13 | 1.2% |
| Russia | 7 | 0.6% |
| South America | 31 | 2.9% |
| South Eastern Asia | 15 | 1.4% |
| Venezuela | 20 | 1.8% |
| Vietnam | 2 | 0.2% |
| Western Europe | 8 | 0.7% | View All 25 Rows |
Sex and Age in Poipu
Sex and Age in Poipu
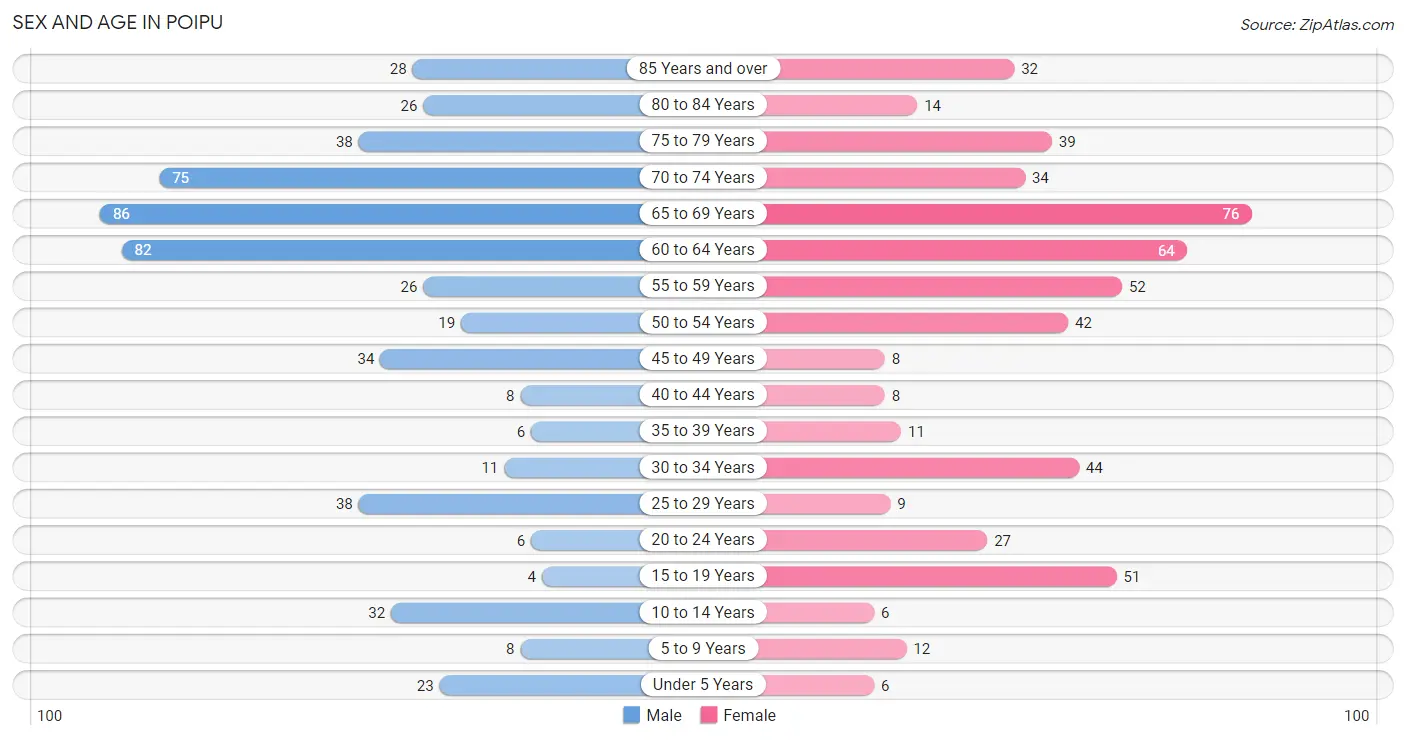
The most populous age groups in Poipu are 65 to 69 Years (86 | 15.6%) for men and 65 to 69 Years (76 | 14.2%) for women.
| Age Bracket | Male | Female |
| Under 5 Years | 23 (4.2%) | 6 (1.1%) |
| 5 to 9 Years | 8 (1.5%) | 12 (2.2%) |
| 10 to 14 Years | 32 (5.8%) | 6 (1.1%) |
| 15 to 19 Years | 4 (0.7%) | 51 (9.5%) |
| 20 to 24 Years | 6 (1.1%) | 27 (5.1%) |
| 25 to 29 Years | 38 (6.9%) | 9 (1.7%) |
| 30 to 34 Years | 11 (2.0%) | 44 (8.2%) |
| 35 to 39 Years | 6 (1.1%) | 11 (2.1%) |
| 40 to 44 Years | 8 (1.5%) | 8 (1.5%) |
| 45 to 49 Years | 34 (6.2%) | 8 (1.5%) |
| 50 to 54 Years | 19 (3.5%) | 42 (7.9%) |
| 55 to 59 Years | 26 (4.7%) | 52 (9.7%) |
| 60 to 64 Years | 82 (14.9%) | 64 (12.0%) |
| 65 to 69 Years | 86 (15.6%) | 76 (14.2%) |
| 70 to 74 Years | 75 (13.6%) | 34 (6.4%) |
| 75 to 79 Years | 38 (6.9%) | 39 (7.3%) |
| 80 to 84 Years | 26 (4.7%) | 14 (2.6%) |
| 85 Years and over | 28 (5.1%) | 32 (6.0%) |
| Total | 550 (100.0%) | 535 (100.0%) |
Families and Households in Poipu
Median Family Size in Poipu
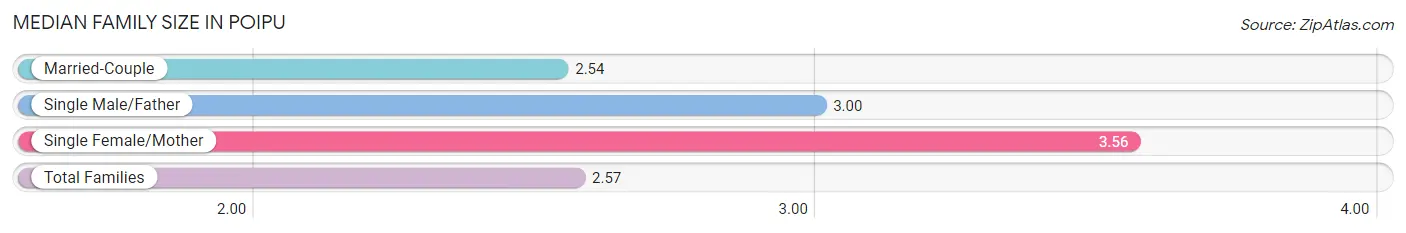
The median family size in Poipu is 2.57 persons per family, with single female/mother families (9 | 2.8%) accounting for the largest median family size of 3.56 persons per family. On the other hand, married-couple families (311 | 96.3%) represent the smallest median family size with 2.54 persons per family.
| Family Type | # Families | Family Size |
| Married-Couple | 311 (96.3%) | 2.54 |
| Single Male/Father | 3 (0.9%) | 3.00 |
| Single Female/Mother | 9 (2.8%) | 3.56 |
| Total Families | 323 (100.0%) | 2.57 |
Median Household Size in Poipu
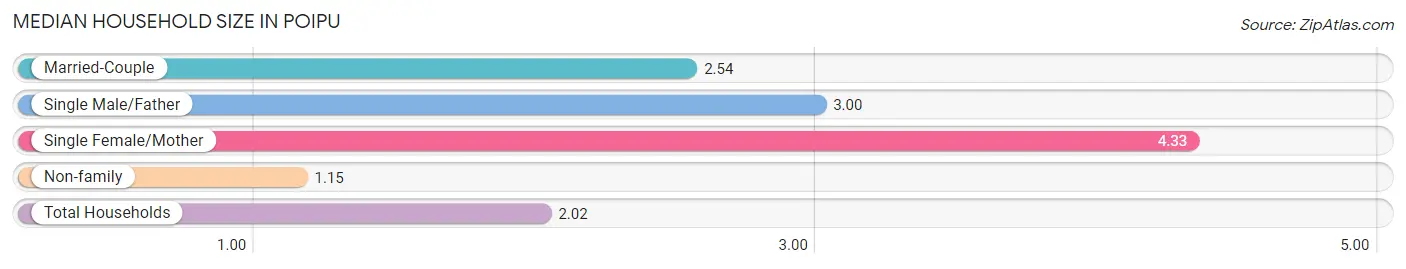
The median household size in Poipu is 2.02 persons per household, with single female/mother households (9 | 1.7%) accounting for the largest median household size of 4.33 persons per household. non-family households (215 | 40.0%) represent the smallest median household size with 1.15 persons per household.
| Household Type | # Households | Household Size |
| Married-Couple | 311 (57.8%) | 2.54 |
| Single Male/Father | 3 (0.6%) | 3.00 |
| Single Female/Mother | 9 (1.7%) | 4.33 |
| Non-family | 215 (40.0%) | 1.15 |
| Total Households | 538 (100.0%) | 2.02 |
Household Size by Marriage Status in Poipu
Out of a total of 538 households in Poipu, 323 (60.0%) are family households, while 215 (40.0%) are nonfamily households. The most numerous type of family households are 2-person households, comprising 239, and the most common type of nonfamily households are 1-person households, comprising 171.
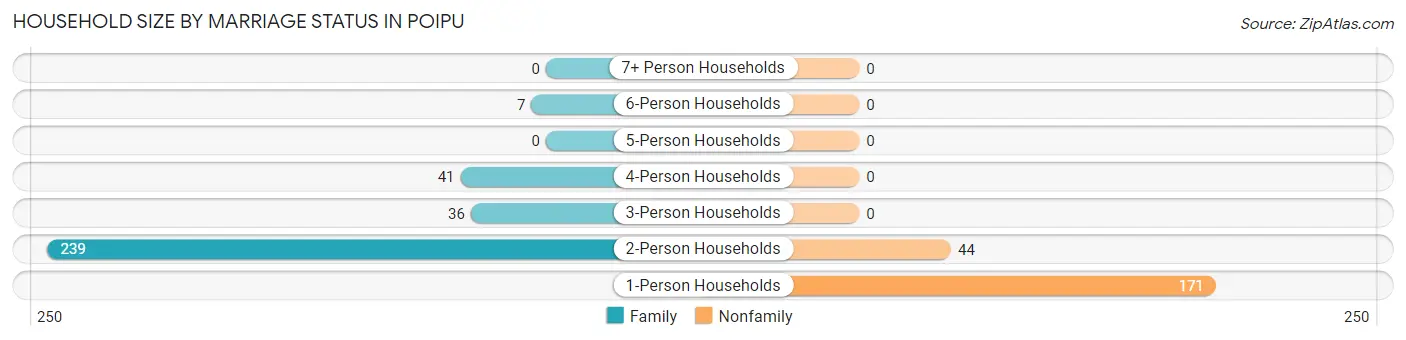
| Household Size | Family Households | Nonfamily Households |
| 1-Person Households | - | 171 (31.8%) |
| 2-Person Households | 239 (44.4%) | 44 (8.2%) |
| 3-Person Households | 36 (6.7%) | 0 (0.0%) |
| 4-Person Households | 41 (7.6%) | 0 (0.0%) |
| 5-Person Households | 0 (0.0%) | 0 (0.0%) |
| 6-Person Households | 7 (1.3%) | 0 (0.0%) |
| 7+ Person Households | 0 (0.0%) | 0 (0.0%) |
| Total | 323 (60.0%) | 215 (40.0%) |
Female Fertility in Poipu
Fertility by Age in Poipu
Average fertility rate in Poipu is 25.0 births per 1,000 women. Women in the age bracket of 20 to 34 years have the highest fertility rate with 50.0 births per 1,000 women. Women in the age bracket of 20 to 34 years acount for 100.0% of all women with births.
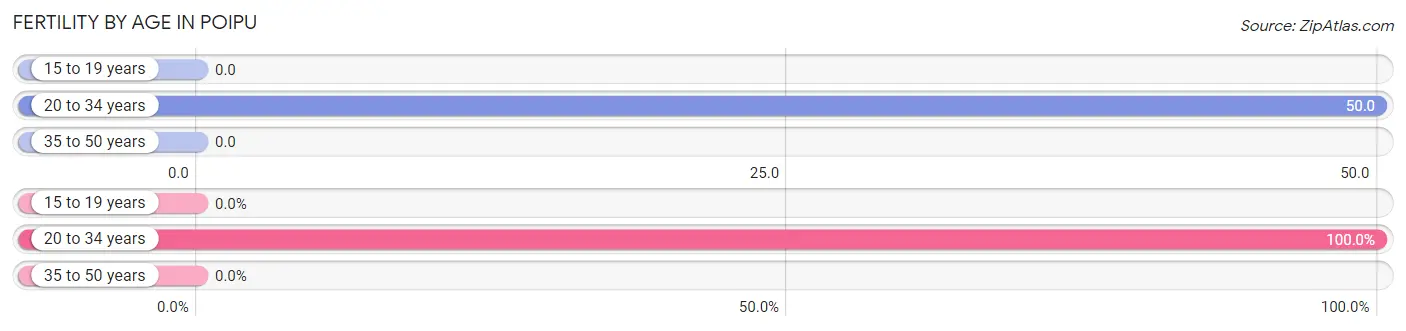
| Age Bracket | Women with Births | Births / 1,000 Women |
| 15 to 19 years | 0 (0.0%) | 0.0 |
| 20 to 34 years | 4 (100.0%) | 50.0 |
| 35 to 50 years | 0 (0.0%) | 0.0 |
| Total | 4 (100.0%) | 25.0 |
Fertility by Age by Marriage Status in Poipu
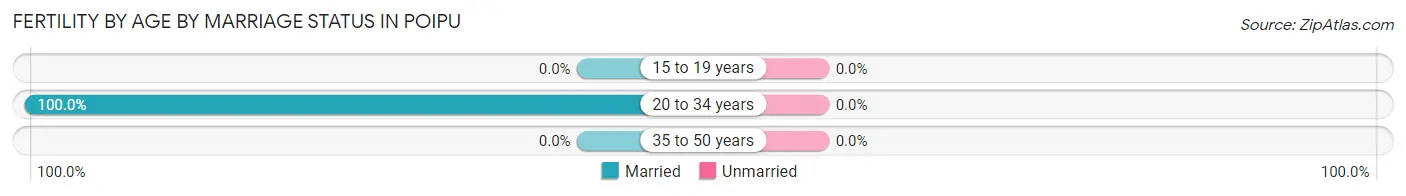
| Age Bracket | Married | Unmarried |
| 15 to 19 years | 0 (0.0%) | 0 (0.0%) |
| 20 to 34 years | 4 (100.0%) | 0 (0.0%) |
| 35 to 50 years | 0 (0.0%) | 0 (0.0%) |
| Total | 4 (100.0%) | 0 (0.0%) |
Fertility by Education in Poipu
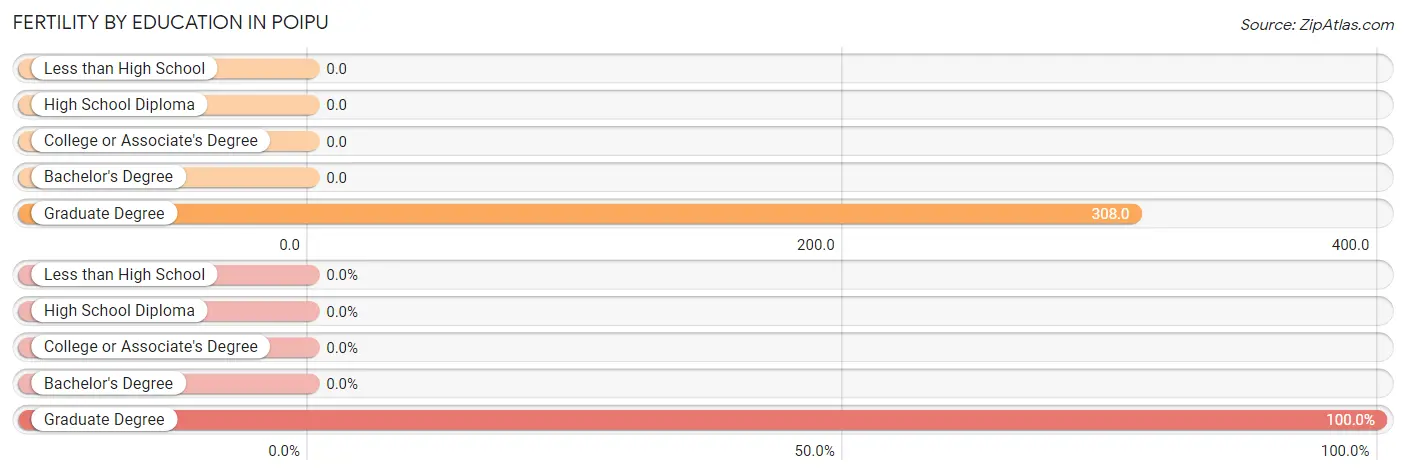
| Educational Attainment | Women with Births | Births / 1,000 Women |
| Less than High School | 0 (0.0%) | 0.0 |
| High School Diploma | 0 (0.0%) | 0.0 |
| College or Associate's Degree | 0 (0.0%) | 0.0 |
| Bachelor's Degree | 0 (0.0%) | 0.0 |
| Graduate Degree | 4 (100.0%) | 308.0 |
| Total | 4 (100.0%) | 25.0 |
Fertility by Education by Marriage Status in Poipu
| Educational Attainment | Married | Unmarried |
| Less than High School | 0 (0.0%) | 0 (0.0%) |
| High School Diploma | 0 (0.0%) | 0 (0.0%) |
| College or Associate's Degree | 0 (0.0%) | 0 (0.0%) |
| Bachelor's Degree | 0 (0.0%) | 0 (0.0%) |
| Graduate Degree | 4 (100.0%) | 0 (0.0%) |
| Total | 4 (100.0%) | 0 (0.0%) |
Employment Characteristics in Poipu
Employment by Class of Employer in Poipu
Among the 481 employed individuals in Poipu, private company employees (313 | 65.1%), self-employed (not incorporated) (75 | 15.6%), and self-employed (incorporated) (36 | 7.5%) make up the most common classes of employment.
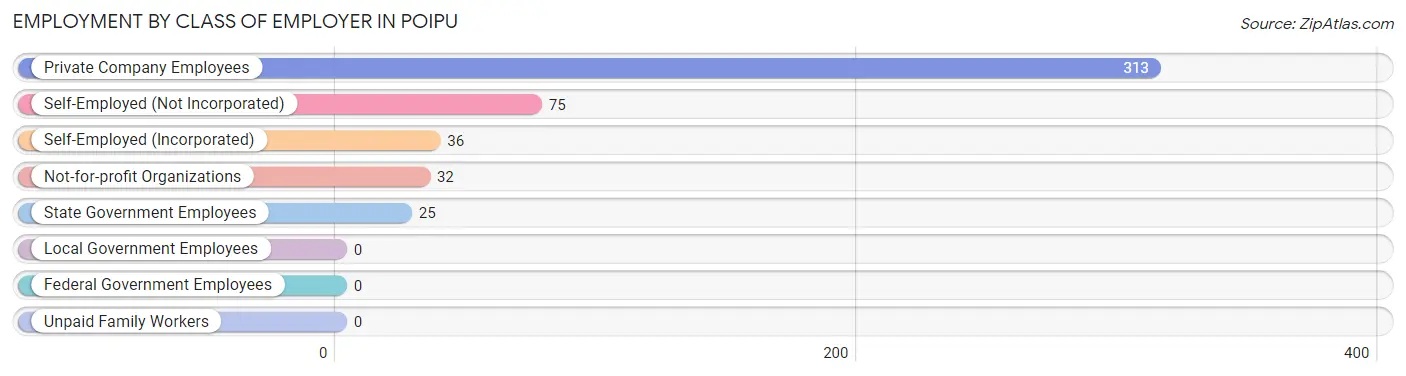
| Employer Class | # Employees | % Employees |
| Private Company Employees | 313 | 65.1% |
| Self-Employed (Incorporated) | 36 | 7.5% |
| Self-Employed (Not Incorporated) | 75 | 15.6% |
| Not-for-profit Organizations | 32 | 6.7% |
| Local Government Employees | 0 | 0.0% |
| State Government Employees | 25 | 5.2% |
| Federal Government Employees | 0 | 0.0% |
| Unpaid Family Workers | 0 | 0.0% |
| Total | 481 | 100.0% |
Employment Status by Age in Poipu
According to the labor force statistics for Poipu, out of the total population over 16 years of age (978), 53.1% or 519 individuals are in the labor force, with 2.3% or 12 of them unemployed. The age group with the highest labor force participation rate is 25 to 29 years, with 100.0% or 47 individuals in the labor force. Within the labor force, the 35 to 44 years age range has the highest percentage of unemployed individuals, with 18.2% or 6 of them being unemployed.
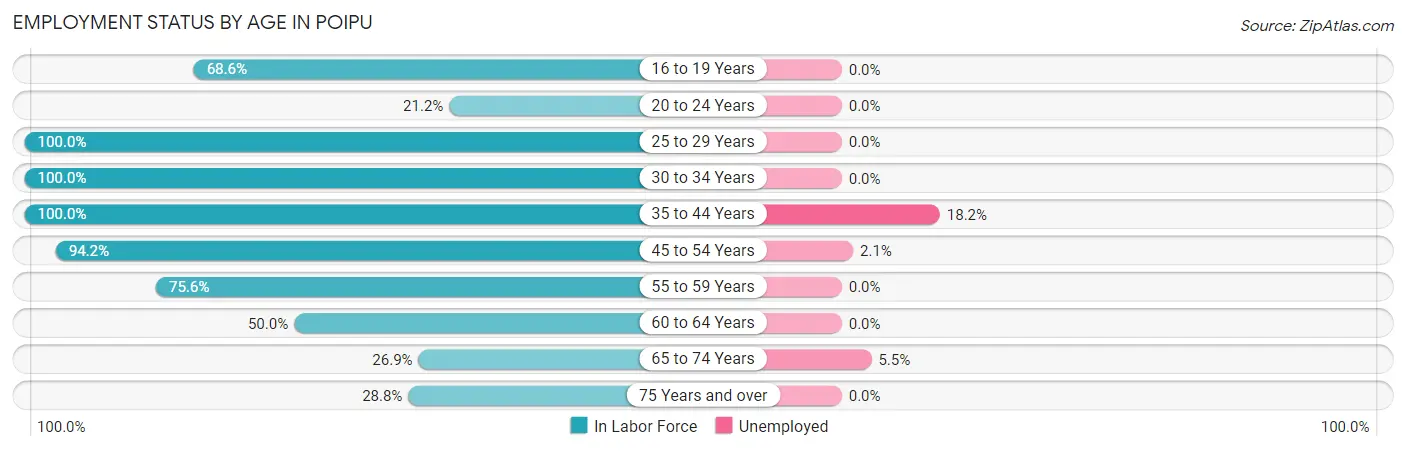
| Age Bracket | In Labor Force | Unemployed |
| 16 to 19 Years | 24 (68.6%) | 0 (0.0%) |
| 20 to 24 Years | 7 (21.2%) | 0 (0.0%) |
| 25 to 29 Years | 47 (100.0%) | 0 (0.0%) |
| 30 to 34 Years | 55 (100.0%) | 0 (0.0%) |
| 35 to 44 Years | 33 (100.0%) | 6 (18.2%) |
| 45 to 54 Years | 97 (94.2%) | 2 (2.1%) |
| 55 to 59 Years | 59 (75.6%) | 0 (0.0%) |
| 60 to 64 Years | 73 (50.0%) | 0 (0.0%) |
| 65 to 74 Years | 73 (26.9%) | 4 (5.5%) |
| 75 Years and over | 51 (28.8%) | 0 (0.0%) |
| Total | 519 (53.1%) | 12 (2.3%) |
Employment Status by Educational Attainment in Poipu
According to labor force statistics for Poipu, 78.8% of individuals (364) out of the total population between 25 and 64 years of age (462) are in the labor force, with 2.2% or 8 of them being unemployed. The group with the highest labor force participation rate are those with the educational attainment of bachelor's degree or higher, with 81.2% or 177 individuals in the labor force. Within the labor force, individuals with high school diploma education have the highest percentage of unemployment, with 12.0% or 6 of them being unemployed.
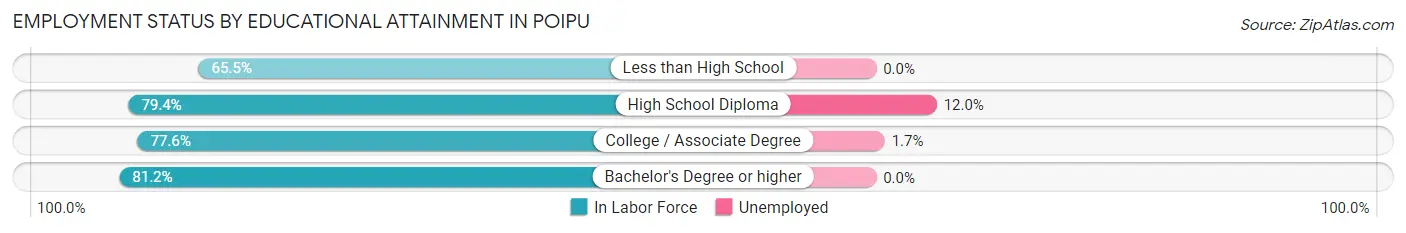
| Educational Attainment | In Labor Force | Unemployed |
| Less than High School | 19 (65.5%) | 0 (0.0%) |
| High School Diploma | 50 (79.4%) | 8 (12.0%) |
| College / Associate Degree | 118 (77.6%) | 3 (1.7%) |
| Bachelor's Degree or higher | 177 (81.2%) | 0 (0.0%) |
| Total | 364 (78.8%) | 10 (2.2%) |
Employment Occupations by Sex in Poipu
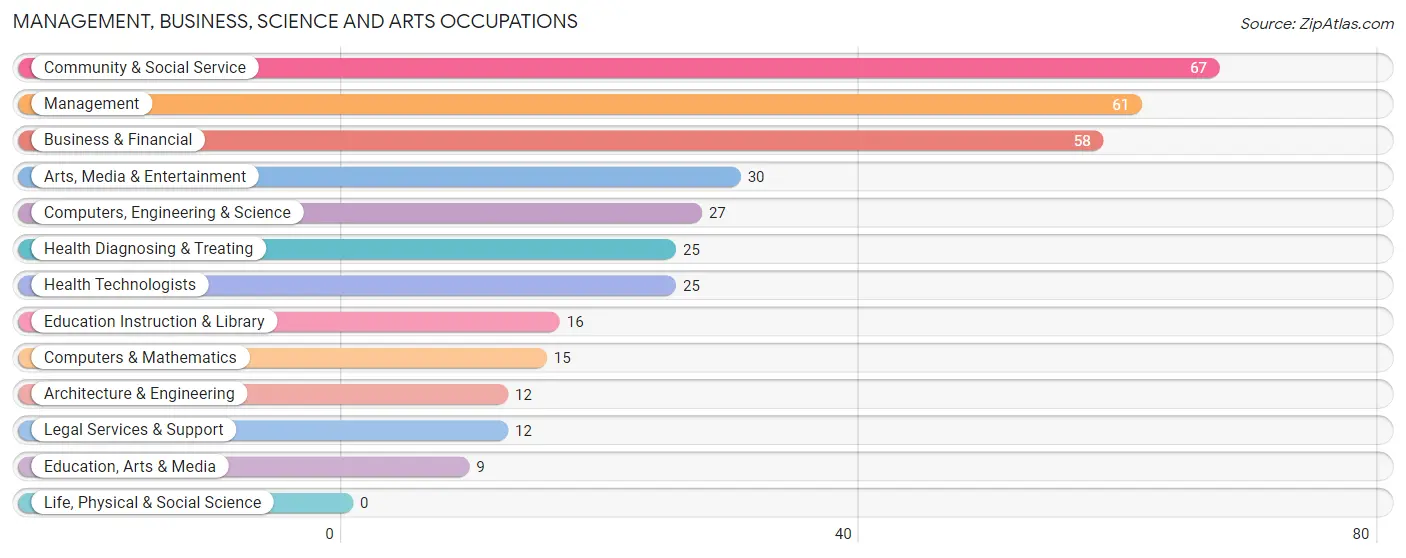
Management, Business, Science and Arts Occupations
The most common Management, Business, Science and Arts occupations in Poipu are Community & Social Service (67 | 13.2%), Management (61 | 12.0%), Business & Financial (58 | 11.4%), Arts, Media & Entertainment (30 | 5.9%), and Computers, Engineering & Science (27 | 5.3%).
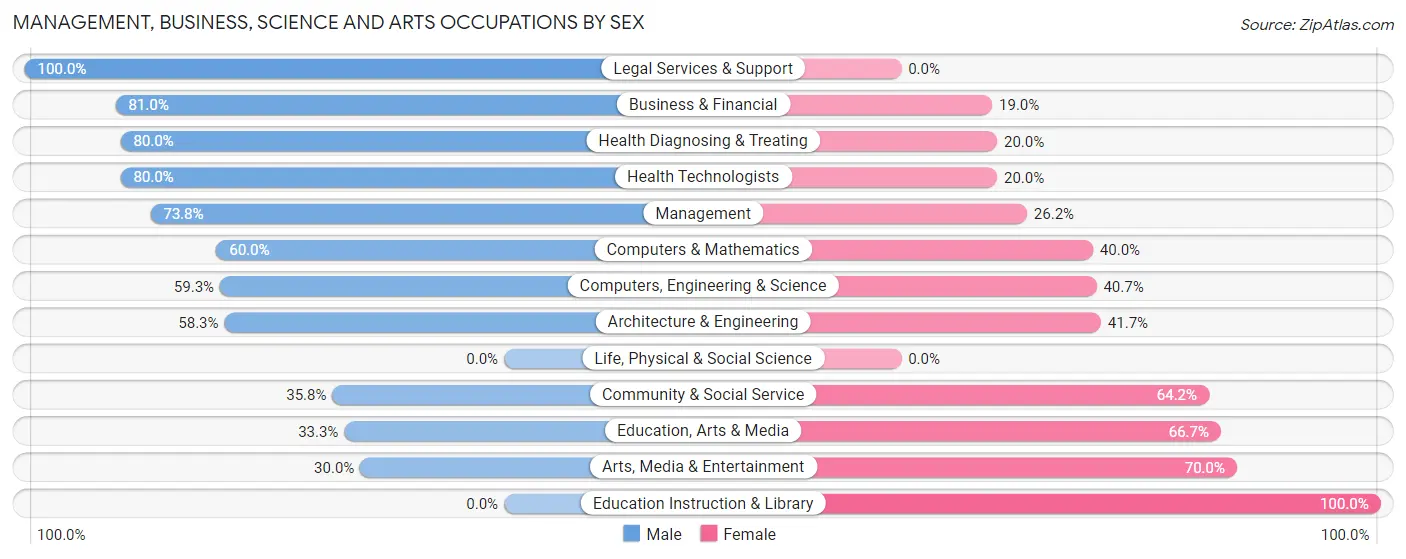
Management, Business, Science and Arts Occupations by Sex
Within the Management, Business, Science and Arts occupations in Poipu, the most male-oriented occupations are Legal Services & Support (100.0%), Business & Financial (81.0%), and Health Diagnosing & Treating (80.0%), while the most female-oriented occupations are Education Instruction & Library (100.0%), Arts, Media & Entertainment (70.0%), and Education, Arts & Media (66.7%).
| Occupation | Male | Female |
| Management | 45 (73.8%) | 16 (26.2%) |
| Business & Financial | 47 (81.0%) | 11 (19.0%) |
| Computers, Engineering & Science | 16 (59.3%) | 11 (40.7%) |
| Computers & Mathematics | 9 (60.0%) | 6 (40.0%) |
| Architecture & Engineering | 7 (58.3%) | 5 (41.7%) |
| Life, Physical & Social Science | 0 (0.0%) | 0 (0.0%) |
| Community & Social Service | 24 (35.8%) | 43 (64.2%) |
| Education, Arts & Media | 3 (33.3%) | 6 (66.7%) |
| Legal Services & Support | 12 (100.0%) | 0 (0.0%) |
| Education Instruction & Library | 0 (0.0%) | 16 (100.0%) |
| Arts, Media & Entertainment | 9 (30.0%) | 21 (70.0%) |
| Health Diagnosing & Treating | 20 (80.0%) | 5 (20.0%) |
| Health Technologists | 20 (80.0%) | 5 (20.0%) |
| Total (Category) | 152 (63.9%) | 86 (36.1%) |
| Total (Overall) | 253 (49.9%) | 254 (50.1%) |
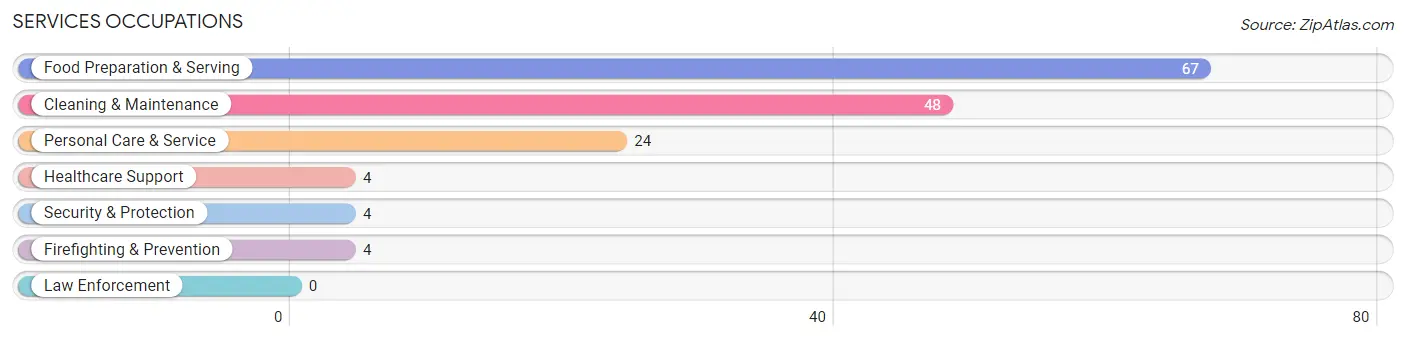
Services Occupations
The most common Services occupations in Poipu are Food Preparation & Serving (67 | 13.2%), Cleaning & Maintenance (48 | 9.5%), Personal Care & Service (24 | 4.7%), Healthcare Support (4 | 0.8%), and Security & Protection (4 | 0.8%).
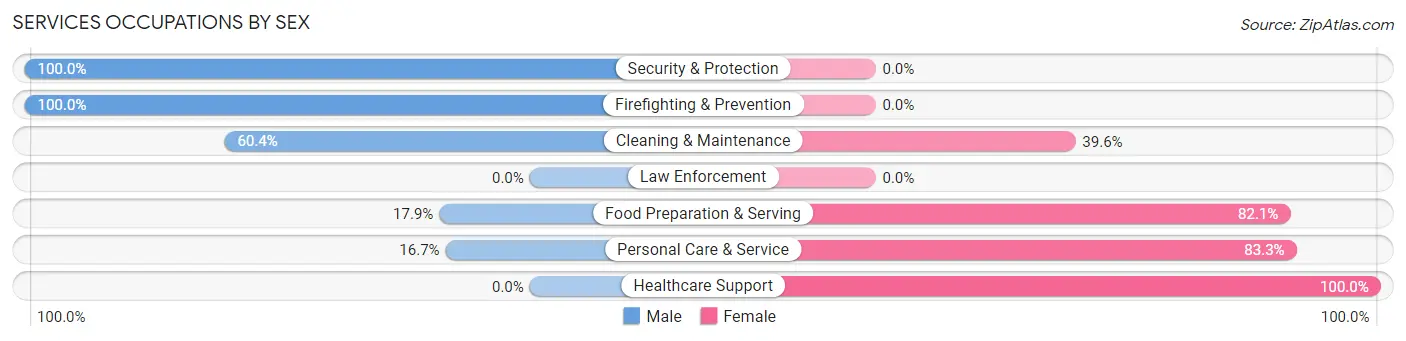
Services Occupations by Sex
Within the Services occupations in Poipu, the most male-oriented occupations are Security & Protection (100.0%), Firefighting & Prevention (100.0%), and Cleaning & Maintenance (60.4%), while the most female-oriented occupations are Healthcare Support (100.0%), Personal Care & Service (83.3%), and Food Preparation & Serving (82.1%).
| Occupation | Male | Female |
| Healthcare Support | 0 (0.0%) | 4 (100.0%) |
| Security & Protection | 4 (100.0%) | 0 (0.0%) |
| Firefighting & Prevention | 4 (100.0%) | 0 (0.0%) |
| Law Enforcement | 0 (0.0%) | 0 (0.0%) |
| Food Preparation & Serving | 12 (17.9%) | 55 (82.1%) |
| Cleaning & Maintenance | 29 (60.4%) | 19 (39.6%) |
| Personal Care & Service | 4 (16.7%) | 20 (83.3%) |
| Total (Category) | 49 (33.3%) | 98 (66.7%) |
| Total (Overall) | 253 (49.9%) | 254 (50.1%) |
Sales and Office Occupations
The most common Sales and Office occupations in Poipu are Sales & Related (72 | 14.2%), and Office & Administration (13 | 2.6%).
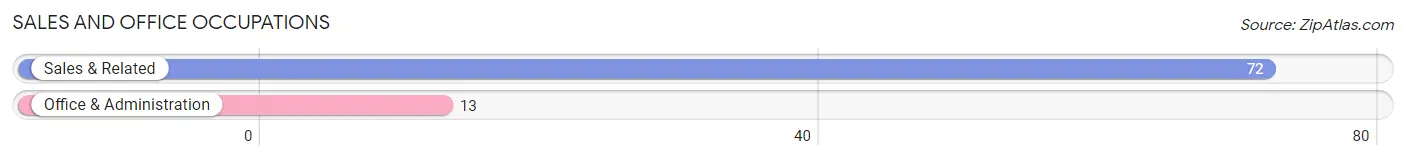
Sales and Office Occupations by Sex
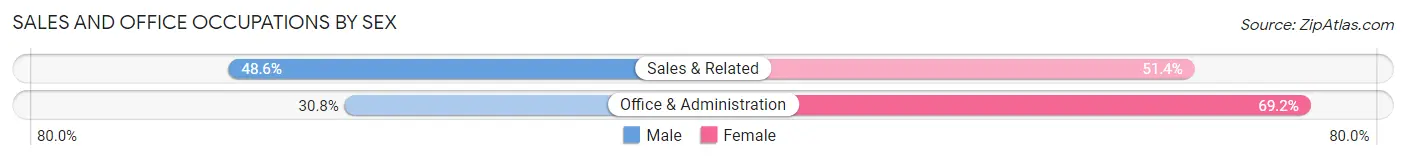
| Occupation | Male | Female |
| Sales & Related | 35 (48.6%) | 37 (51.4%) |
| Office & Administration | 4 (30.8%) | 9 (69.2%) |
| Total (Category) | 39 (45.9%) | 46 (54.1%) |
| Total (Overall) | 253 (49.9%) | 254 (50.1%) |
Natural Resources, Construction and Maintenance Occupations
The most common Natural Resources, Construction and Maintenance occupations in Poipu are Installation, Maintenance & Repair (10 | 2.0%), Construction & Extraction (9 | 1.8%), and Farming, Fishing & Forestry (4 | 0.8%).
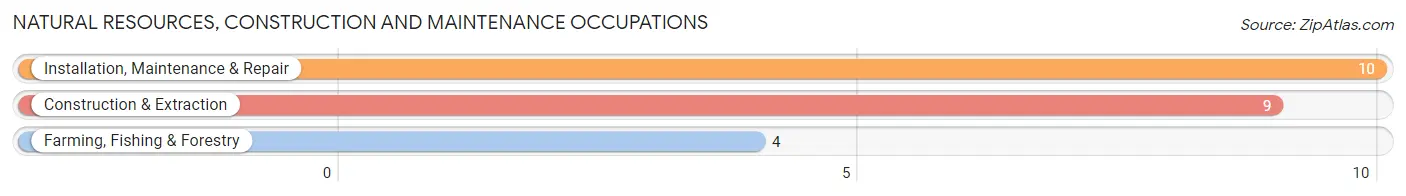
Natural Resources, Construction and Maintenance Occupations by Sex
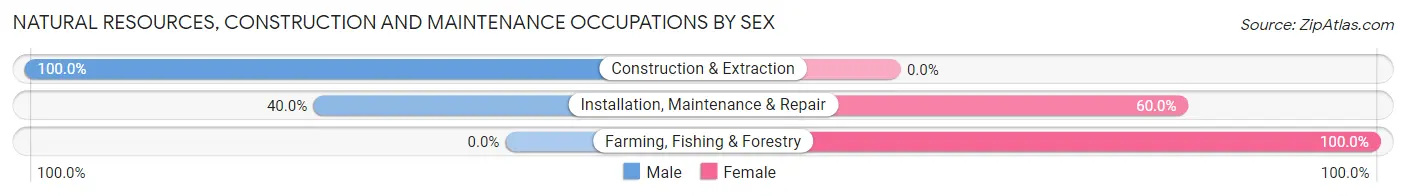
| Occupation | Male | Female |
| Farming, Fishing & Forestry | 0 (0.0%) | 4 (100.0%) |
| Construction & Extraction | 9 (100.0%) | 0 (0.0%) |
| Installation, Maintenance & Repair | 4 (40.0%) | 6 (60.0%) |
| Total (Category) | 13 (56.5%) | 10 (43.5%) |
| Total (Overall) | 253 (49.9%) | 254 (50.1%) |
Production, Transportation and Moving Occupations
The most common Production, Transportation and Moving occupations in Poipu are , and Production (14 | 2.8%).
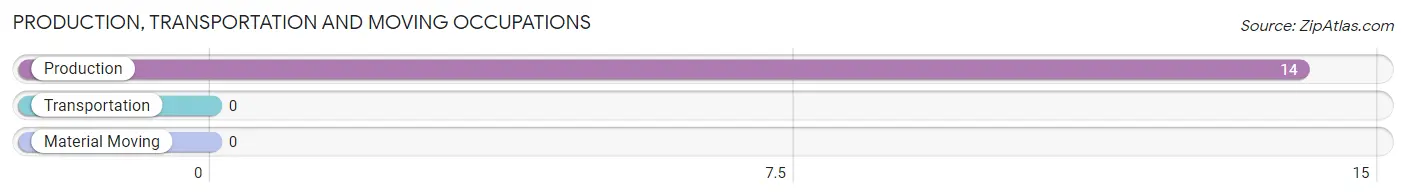
Production, Transportation and Moving Occupations by Sex
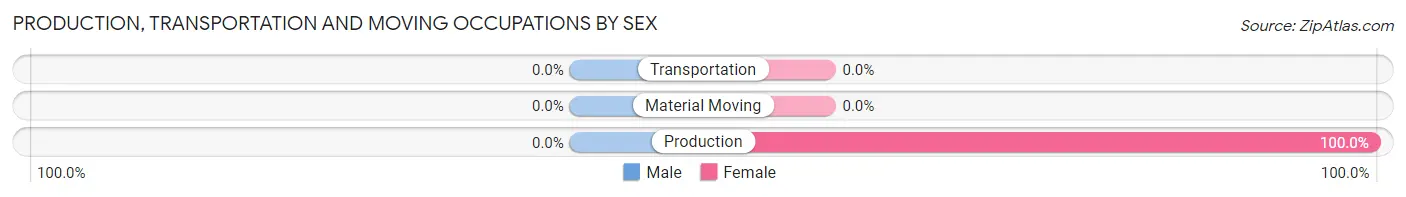
| Occupation | Male | Female |
| Production | 0 (0.0%) | 14 (100.0%) |
| Transportation | 0 (0.0%) | 0 (0.0%) |
| Material Moving | 0 (0.0%) | 0 (0.0%) |
| Total (Category) | 0 (0.0%) | 14 (100.0%) |
| Total (Overall) | 253 (49.9%) | 254 (50.1%) |
Employment Industries by Sex in Poipu
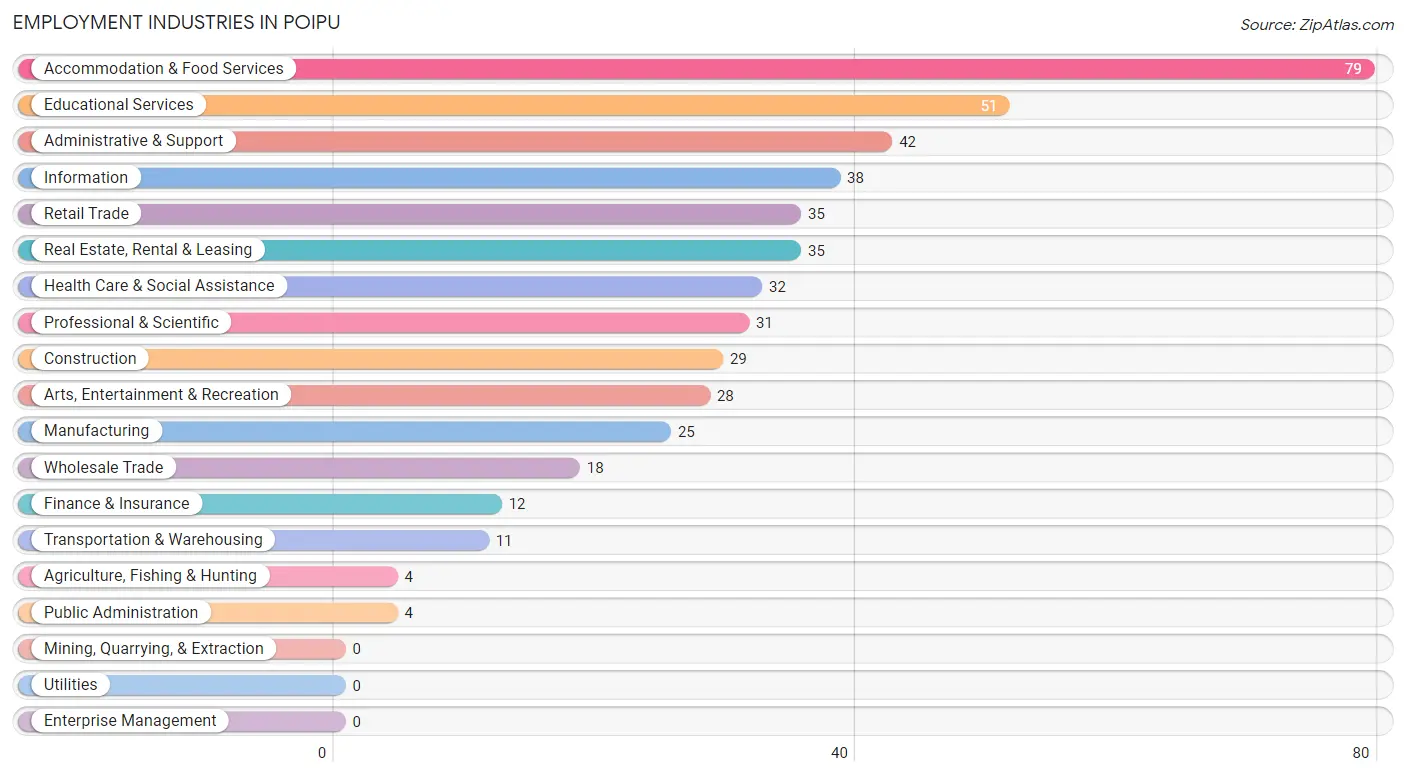
Employment Industries in Poipu
The major employment industries in Poipu include Accommodation & Food Services (79 | 15.6%), Educational Services (51 | 10.1%), Administrative & Support (42 | 8.3%), Information (38 | 7.5%), and Retail Trade (35 | 6.9%).
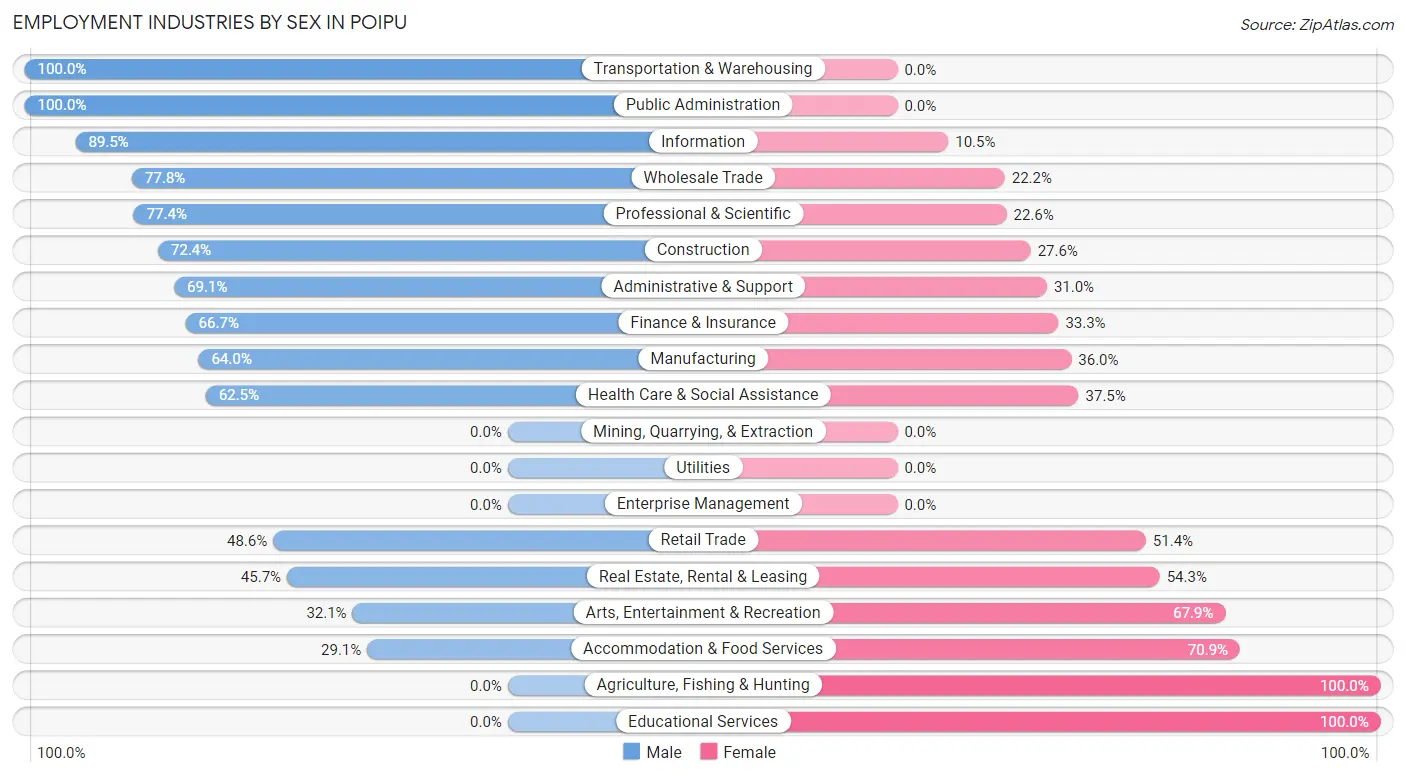
Employment Industries by Sex in Poipu
The Poipu industries that see more men than women are Transportation & Warehousing (100.0%), Public Administration (100.0%), and Information (89.5%), whereas the industries that tend to have a higher number of women are Agriculture, Fishing & Hunting (100.0%), Educational Services (100.0%), and Accommodation & Food Services (70.9%).
| Industry | Male | Female |
| Agriculture, Fishing & Hunting | 0 (0.0%) | 4 (100.0%) |
| Mining, Quarrying, & Extraction | 0 (0.0%) | 0 (0.0%) |
| Construction | 21 (72.4%) | 8 (27.6%) |
| Manufacturing | 16 (64.0%) | 9 (36.0%) |
| Wholesale Trade | 14 (77.8%) | 4 (22.2%) |
| Retail Trade | 17 (48.6%) | 18 (51.4%) |
| Transportation & Warehousing | 11 (100.0%) | 0 (0.0%) |
| Utilities | 0 (0.0%) | 0 (0.0%) |
| Information | 34 (89.5%) | 4 (10.5%) |
| Finance & Insurance | 8 (66.7%) | 4 (33.3%) |
| Real Estate, Rental & Leasing | 16 (45.7%) | 19 (54.3%) |
| Professional & Scientific | 24 (77.4%) | 7 (22.6%) |
| Enterprise Management | 0 (0.0%) | 0 (0.0%) |
| Administrative & Support | 29 (69.1%) | 13 (30.9%) |
| Educational Services | 0 (0.0%) | 51 (100.0%) |
| Health Care & Social Assistance | 20 (62.5%) | 12 (37.5%) |
| Arts, Entertainment & Recreation | 9 (32.1%) | 19 (67.9%) |
| Accommodation & Food Services | 23 (29.1%) | 56 (70.9%) |
| Public Administration | 4 (100.0%) | 0 (0.0%) |
| Total | 253 (49.9%) | 254 (50.1%) |
Education in Poipu
School Enrollment in Poipu
The most common levels of schooling among the 161 students in Poipu are high school (55 | 34.2%), middle school (38 | 23.6%), and graduate / professional (27 | 16.8%).
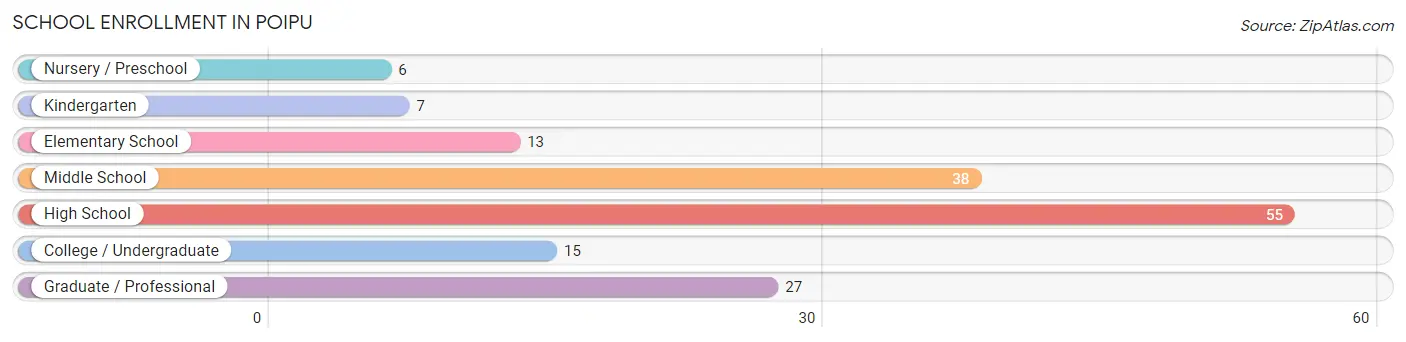
| School Level | # Students | % Students |
| Nursery / Preschool | 6 | 3.7% |
| Kindergarten | 7 | 4.3% |
| Elementary School | 13 | 8.1% |
| Middle School | 38 | 23.6% |
| High School | 55 | 34.2% |
| College / Undergraduate | 15 | 9.3% |
| Graduate / Professional | 27 | 16.8% |
| Total | 161 | 100.0% |
School Enrollment by Age by Funding Source in Poipu
Out of a total of 161 students who are enrolled in schools in Poipu, 54 (33.5%) attend a private institution, while the remaining 107 (66.5%) are enrolled in public schools. The age group of 3 to 4 year olds has the highest likelihood of being enrolled in private schools, with 6 (100.0% in the age bracket) enrolled. Conversely, the age group of 25 to 34 year olds has the lowest likelihood of being enrolled in a private school, with 15 (100.0% in the age bracket) attending a public institution.
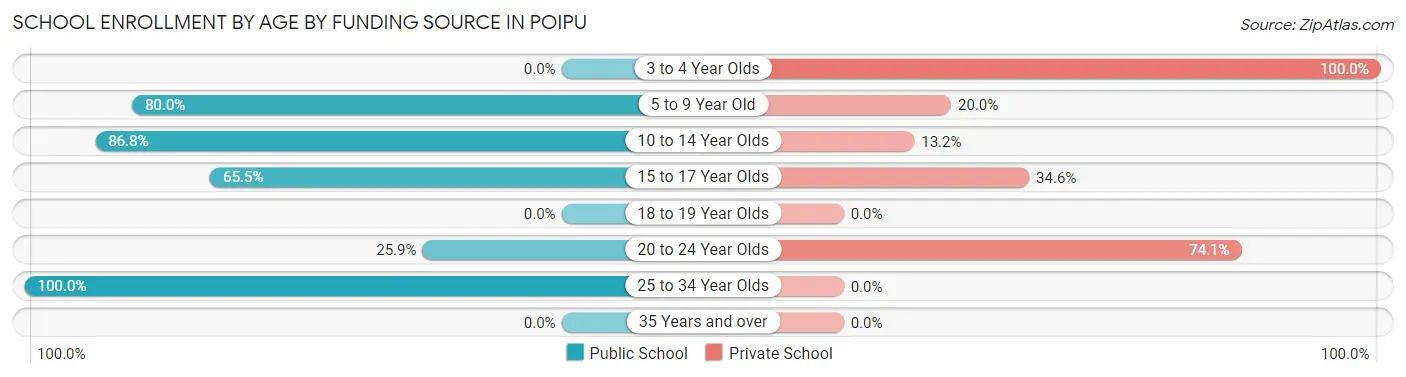
| Age Bracket | Public School | Private School |
| 3 to 4 Year Olds | 0 (0.0%) | 6 (100.0%) |
| 5 to 9 Year Old | 16 (80.0%) | 4 (20.0%) |
| 10 to 14 Year Olds | 33 (86.8%) | 5 (13.2%) |
| 15 to 17 Year Olds | 36 (65.4%) | 19 (34.5%) |
| 18 to 19 Year Olds | 0 (0.0%) | 0 (0.0%) |
| 20 to 24 Year Olds | 7 (25.9%) | 20 (74.1%) |
| 25 to 34 Year Olds | 15 (100.0%) | 0 (0.0%) |
| 35 Years and over | 0 (0.0%) | 0 (0.0%) |
| Total | 107 (66.5%) | 54 (33.5%) |
Educational Attainment by Field of Study in Poipu
Education (65 | 12.6%), science & technology (61 | 11.8%), psychology (58 | 11.2%), social sciences (55 | 10.6%), and bio, nature & agricultural (49 | 9.5%) are the most common fields of study among 517 individuals in Poipu who have obtained a bachelor's degree or higher.
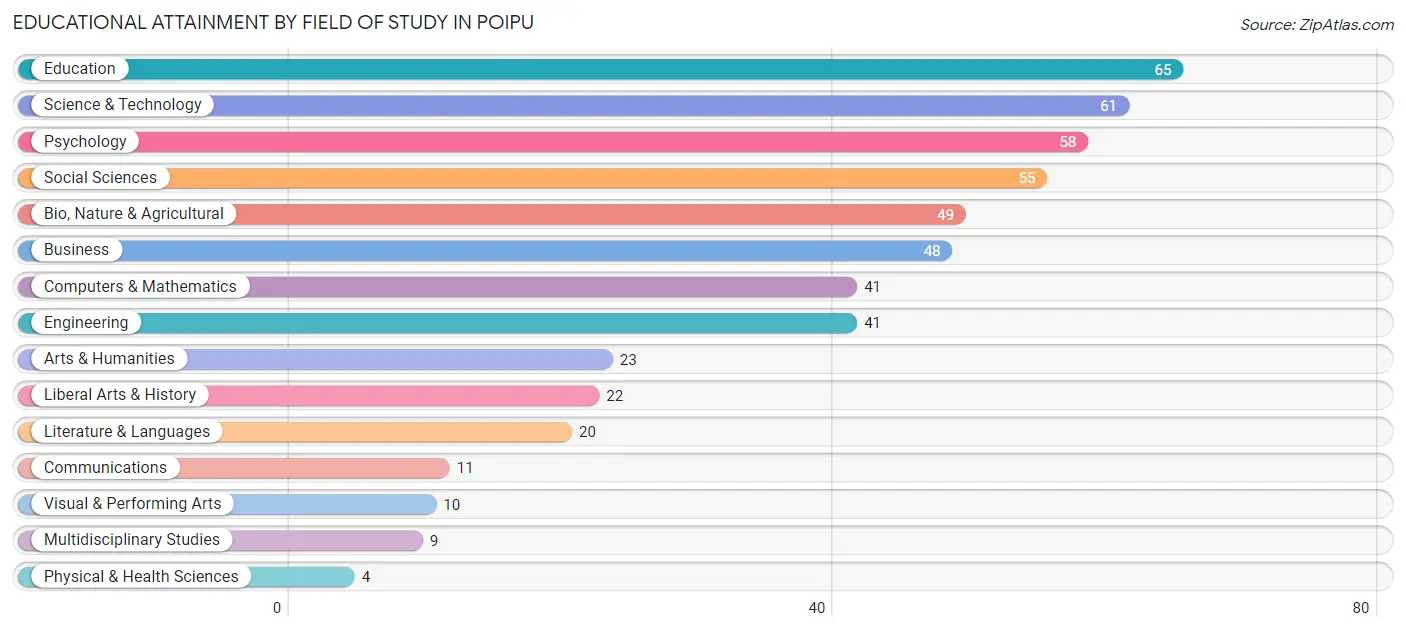
| Field of Study | # Graduates | % Graduates |
| Computers & Mathematics | 41 | 7.9% |
| Bio, Nature & Agricultural | 49 | 9.5% |
| Physical & Health Sciences | 4 | 0.8% |
| Psychology | 58 | 11.2% |
| Social Sciences | 55 | 10.6% |
| Engineering | 41 | 7.9% |
| Multidisciplinary Studies | 9 | 1.7% |
| Science & Technology | 61 | 11.8% |
| Business | 48 | 9.3% |
| Education | 65 | 12.6% |
| Literature & Languages | 20 | 3.9% |
| Liberal Arts & History | 22 | 4.3% |
| Visual & Performing Arts | 10 | 1.9% |
| Communications | 11 | 2.1% |
| Arts & Humanities | 23 | 4.4% |
| Total | 517 | 100.0% |
Transportation & Commute in Poipu
Vehicle Availability by Sex in Poipu
The most prevalent vehicle ownership categories in Poipu are males with 2 vehicles (79, accounting for 33.3%) and females with 2 vehicles (80, making up 32.4%).
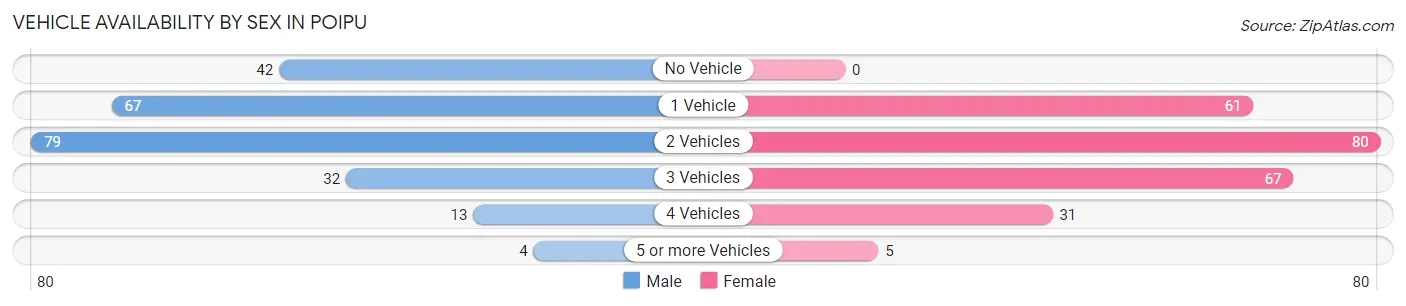
| Vehicles Available | Male | Female |
| No Vehicle | 42 (17.7%) | 0 (0.0%) |
| 1 Vehicle | 67 (28.3%) | 61 (25.0%) |
| 2 Vehicles | 79 (33.3%) | 80 (32.8%) |
| 3 Vehicles | 32 (13.5%) | 67 (27.5%) |
| 4 Vehicles | 13 (5.5%) | 31 (12.7%) |
| 5 or more Vehicles | 4 (1.7%) | 5 (2.1%) |
| Total | 237 (100.0%) | 244 (100.0%) |
Commute Time in Poipu
The most frequently occuring commute durations in Poipu are 5 to 9 minutes (107 commuters, 30.3%), 20 to 24 minutes (91 commuters, 25.8%), and 30 to 34 minutes (52 commuters, 14.7%).
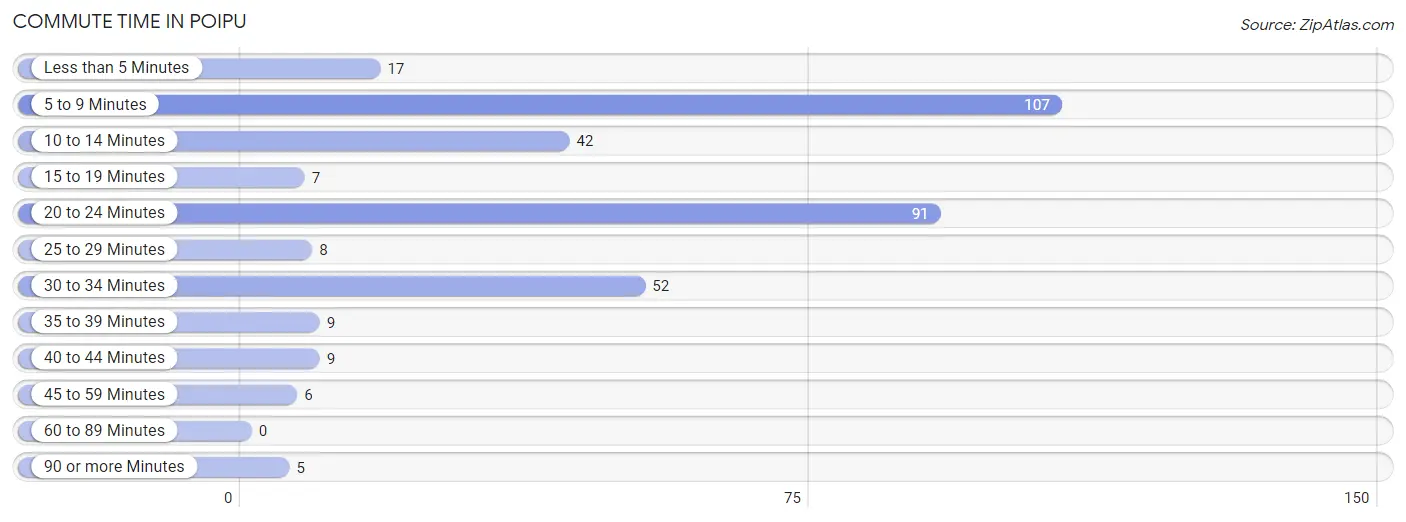
| Commute Time | # Commuters | % Commuters |
| Less than 5 Minutes | 17 | 4.8% |
| 5 to 9 Minutes | 107 | 30.3% |
| 10 to 14 Minutes | 42 | 11.9% |
| 15 to 19 Minutes | 7 | 2.0% |
| 20 to 24 Minutes | 91 | 25.8% |
| 25 to 29 Minutes | 8 | 2.3% |
| 30 to 34 Minutes | 52 | 14.7% |
| 35 to 39 Minutes | 9 | 2.5% |
| 40 to 44 Minutes | 9 | 2.5% |
| 45 to 59 Minutes | 6 | 1.7% |
| 60 to 89 Minutes | 0 | 0.0% |
| 90 or more Minutes | 5 | 1.4% |
Commute Time by Sex in Poipu
The most common commute times in Poipu are 20 to 24 minutes (39 commuters, 26.5%) for males and 5 to 9 minutes (72 commuters, 34.9%) for females.
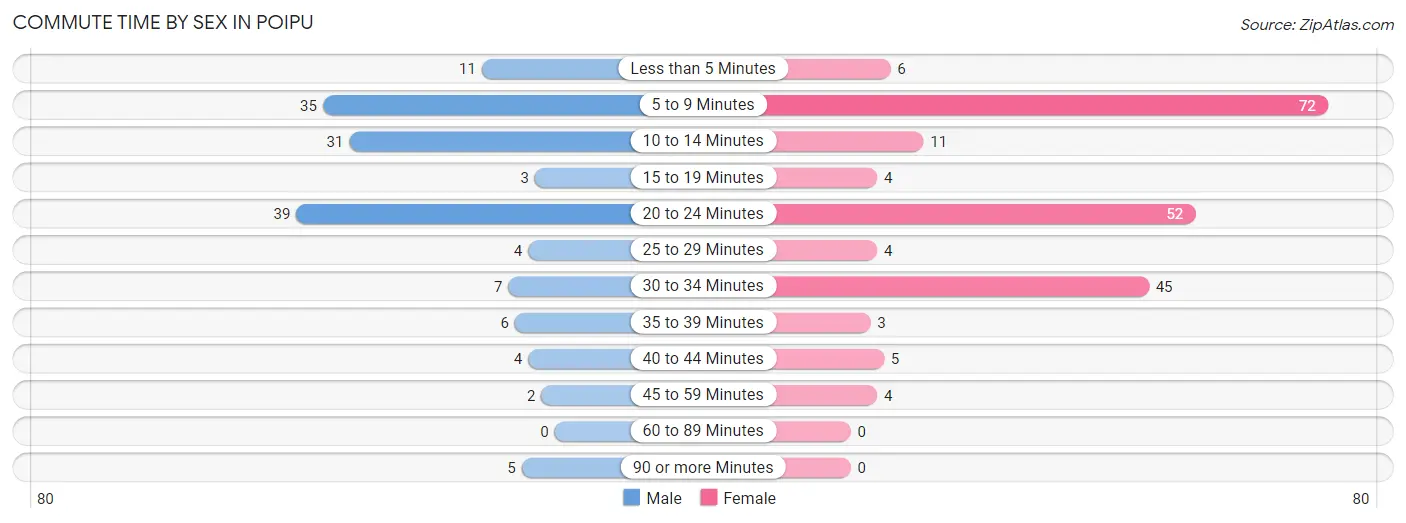
| Commute Time | Male | Female |
| Less than 5 Minutes | 11 (7.5%) | 6 (2.9%) |
| 5 to 9 Minutes | 35 (23.8%) | 72 (34.9%) |
| 10 to 14 Minutes | 31 (21.1%) | 11 (5.3%) |
| 15 to 19 Minutes | 3 (2.0%) | 4 (1.9%) |
| 20 to 24 Minutes | 39 (26.5%) | 52 (25.2%) |
| 25 to 29 Minutes | 4 (2.7%) | 4 (1.9%) |
| 30 to 34 Minutes | 7 (4.8%) | 45 (21.8%) |
| 35 to 39 Minutes | 6 (4.1%) | 3 (1.5%) |
| 40 to 44 Minutes | 4 (2.7%) | 5 (2.4%) |
| 45 to 59 Minutes | 2 (1.4%) | 4 (1.9%) |
| 60 to 89 Minutes | 0 (0.0%) | 0 (0.0%) |
| 90 or more Minutes | 5 (3.4%) | 0 (0.0%) |
Time of Departure to Work by Sex in Poipu
The most frequent times of departure to work in Poipu are 8:00 AM to 8:29 AM (37, 25.2%) for males and 12:00 PM to 3:59 PM (72, 34.9%) for females.
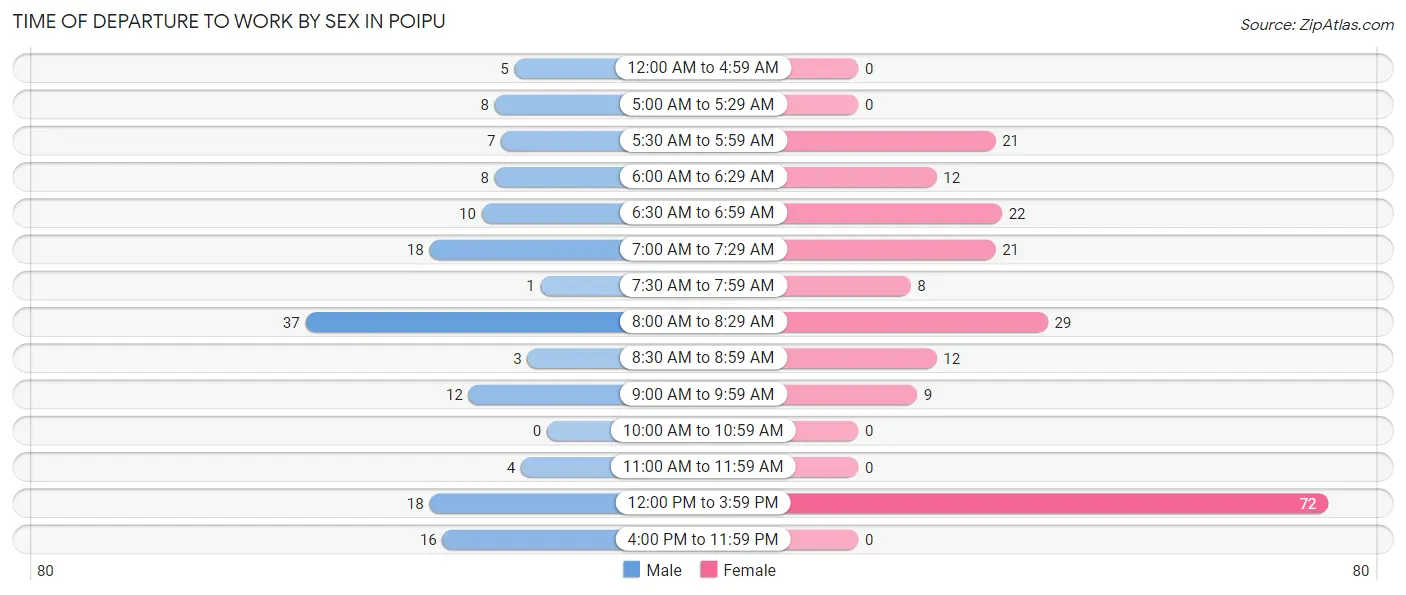
| Time of Departure | Male | Female |
| 12:00 AM to 4:59 AM | 5 (3.4%) | 0 (0.0%) |
| 5:00 AM to 5:29 AM | 8 (5.4%) | 0 (0.0%) |
| 5:30 AM to 5:59 AM | 7 (4.8%) | 21 (10.2%) |
| 6:00 AM to 6:29 AM | 8 (5.4%) | 12 (5.8%) |
| 6:30 AM to 6:59 AM | 10 (6.8%) | 22 (10.7%) |
| 7:00 AM to 7:29 AM | 18 (12.2%) | 21 (10.2%) |
| 7:30 AM to 7:59 AM | 1 (0.7%) | 8 (3.9%) |
| 8:00 AM to 8:29 AM | 37 (25.2%) | 29 (14.1%) |
| 8:30 AM to 8:59 AM | 3 (2.0%) | 12 (5.8%) |
| 9:00 AM to 9:59 AM | 12 (8.2%) | 9 (4.4%) |
| 10:00 AM to 10:59 AM | 0 (0.0%) | 0 (0.0%) |
| 11:00 AM to 11:59 AM | 4 (2.7%) | 0 (0.0%) |
| 12:00 PM to 3:59 PM | 18 (12.2%) | 72 (34.9%) |
| 4:00 PM to 11:59 PM | 16 (10.9%) | 0 (0.0%) |
| Total | 147 (100.0%) | 206 (100.0%) |
Housing Occupancy in Poipu
Occupancy by Ownership in Poipu
Of the total 538 dwellings in Poipu, owner-occupied units account for 398 (74.0%), while renter-occupied units make up 140 (26.0%).
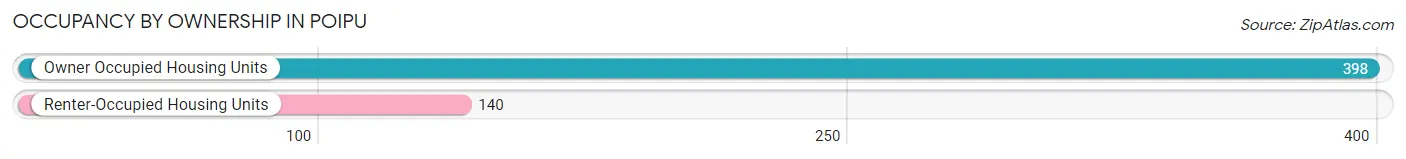
| Occupancy | # Housing Units | % Housing Units |
| Owner Occupied Housing Units | 398 | 74.0% |
| Renter-Occupied Housing Units | 140 | 26.0% |
| Total Occupied Housing Units | 538 | 100.0% |
Occupancy by Household Size in Poipu
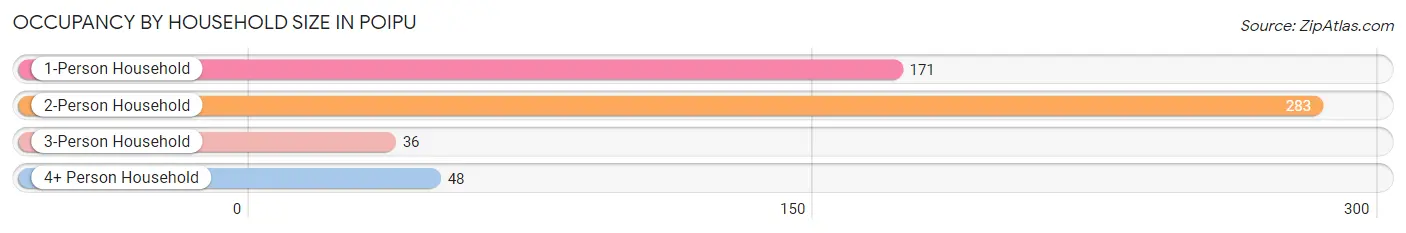
| Household Size | # Housing Units | % Housing Units |
| 1-Person Household | 171 | 31.8% |
| 2-Person Household | 283 | 52.6% |
| 3-Person Household | 36 | 6.7% |
| 4+ Person Household | 48 | 8.9% |
| Total Housing Units | 538 | 100.0% |
Occupancy by Ownership by Household Size in Poipu
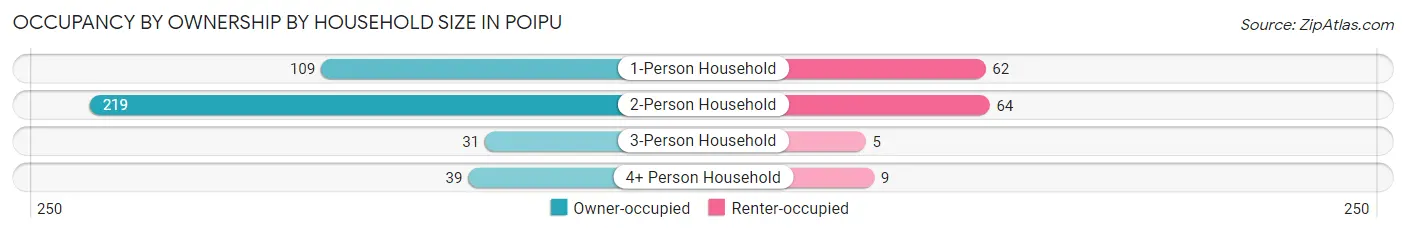
| Household Size | Owner-occupied | Renter-occupied |
| 1-Person Household | 109 (63.7%) | 62 (36.3%) |
| 2-Person Household | 219 (77.4%) | 64 (22.6%) |
| 3-Person Household | 31 (86.1%) | 5 (13.9%) |
| 4+ Person Household | 39 (81.2%) | 9 (18.8%) |
| Total Housing Units | 398 (74.0%) | 140 (26.0%) |
Occupancy by Educational Attainment in Poipu
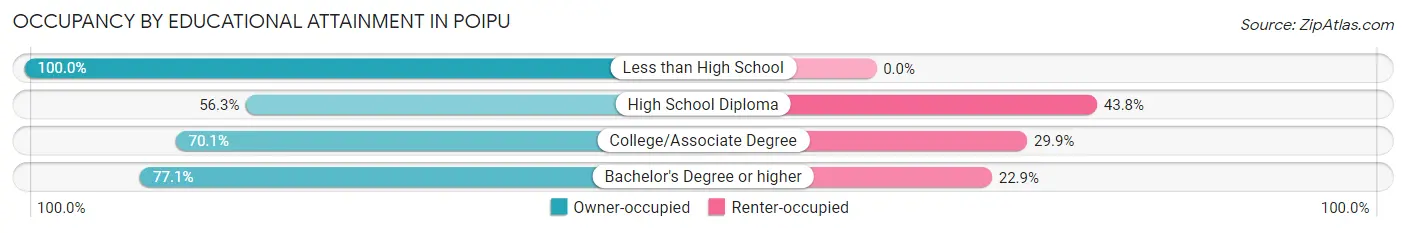
| Household Size | Owner-occupied | Renter-occupied |
| Less than High School | 25 (100.0%) | 0 (0.0%) |
| High School Diploma | 27 (56.2%) | 21 (43.8%) |
| College/Associate Degree | 124 (70.1%) | 53 (29.9%) |
| Bachelor's Degree or higher | 222 (77.1%) | 66 (22.9%) |
Occupancy by Age of Householder in Poipu
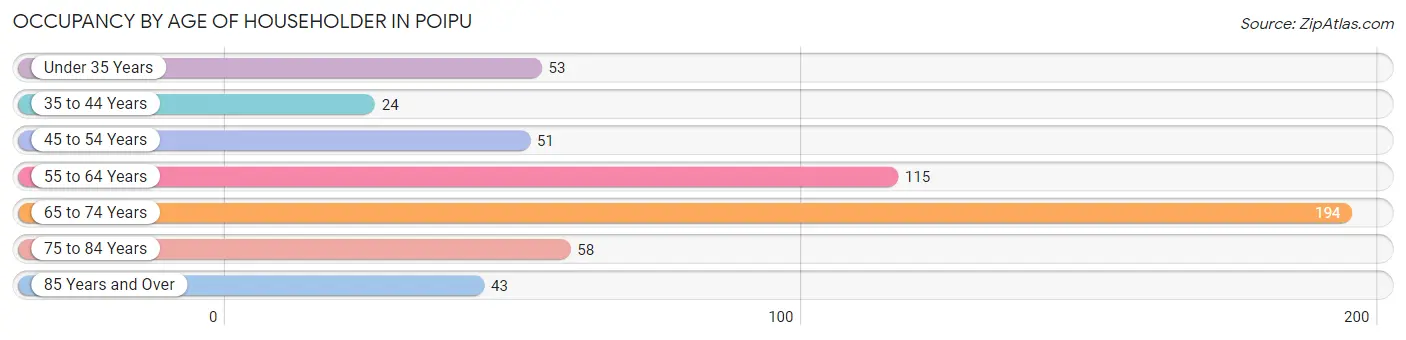
| Age Bracket | # Households | % Households |
| Under 35 Years | 53 | 9.9% |
| 35 to 44 Years | 24 | 4.5% |
| 45 to 54 Years | 51 | 9.5% |
| 55 to 64 Years | 115 | 21.4% |
| 65 to 74 Years | 194 | 36.1% |
| 75 to 84 Years | 58 | 10.8% |
| 85 Years and Over | 43 | 8.0% |
| Total | 538 | 100.0% |
Housing Finances in Poipu
Median Income by Occupancy in Poipu
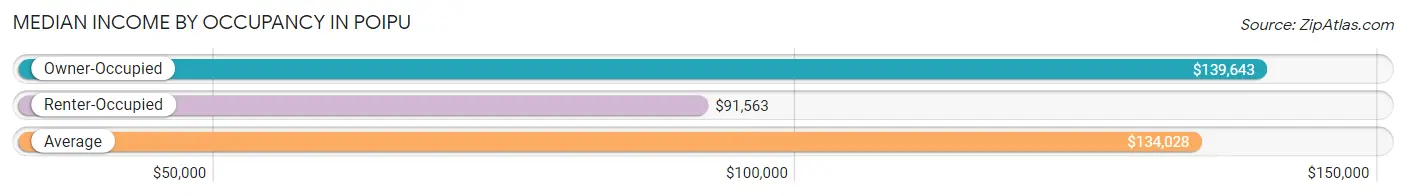
| Occupancy Type | # Households | Median Income |
| Owner-Occupied | 398 (74.0%) | $139,643 |
| Renter-Occupied | 140 (26.0%) | $91,563 |
| Average | 538 (100.0%) | $134,028 |
Occupancy by Householder Income Bracket in Poipu
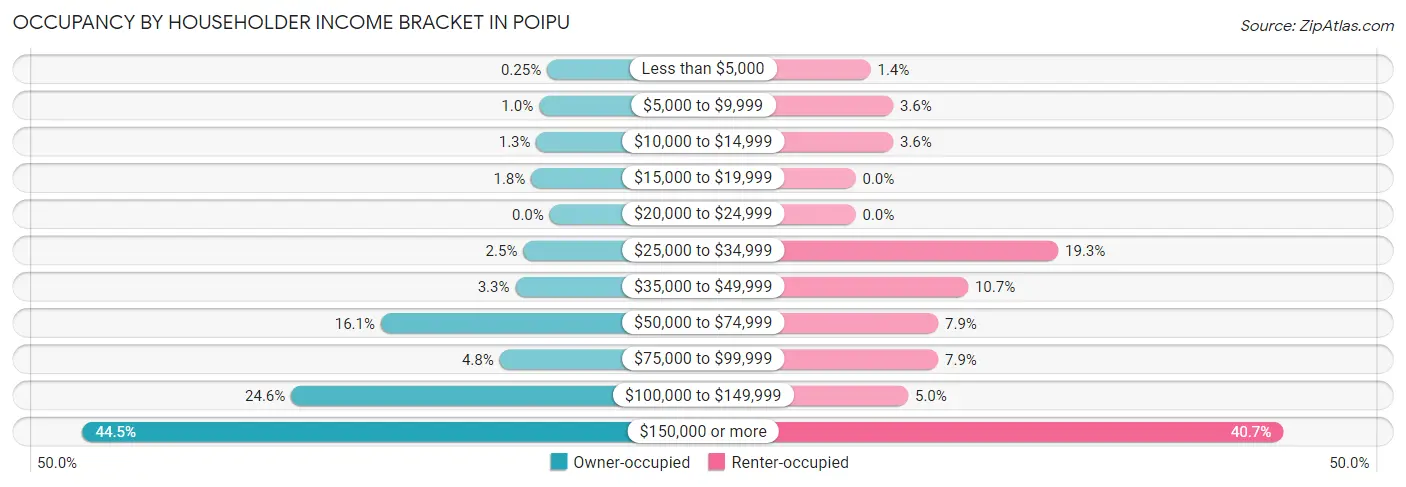
| Income Bracket | Owner-occupied | Renter-occupied |
| Less than $5,000 | 1 (0.3%) | 2 (1.4%) |
| $5,000 to $9,999 | 4 (1.0%) | 5 (3.6%) |
| $10,000 to $14,999 | 5 (1.3%) | 5 (3.6%) |
| $15,000 to $19,999 | 7 (1.8%) | 0 (0.0%) |
| $20,000 to $24,999 | 0 (0.0%) | 0 (0.0%) |
| $25,000 to $34,999 | 10 (2.5%) | 27 (19.3%) |
| $35,000 to $49,999 | 13 (3.3%) | 15 (10.7%) |
| $50,000 to $74,999 | 64 (16.1%) | 11 (7.9%) |
| $75,000 to $99,999 | 19 (4.8%) | 11 (7.9%) |
| $100,000 to $149,999 | 98 (24.6%) | 7 (5.0%) |
| $150,000 or more | 177 (44.5%) | 57 (40.7%) |
| Total | 398 (100.0%) | 140 (100.0%) |
Monthly Housing Cost Tiers in Poipu
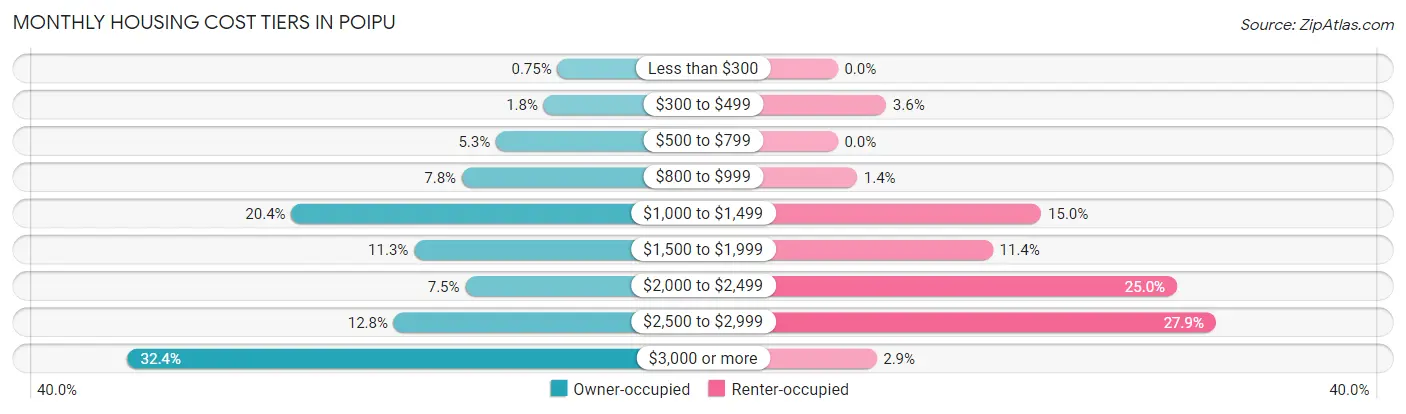
| Monthly Cost | Owner-occupied | Renter-occupied |
| Less than $300 | 3 (0.7%) | 0 (0.0%) |
| $300 to $499 | 7 (1.8%) | 5 (3.6%) |
| $500 to $799 | 21 (5.3%) | 0 (0.0%) |
| $800 to $999 | 31 (7.8%) | 2 (1.4%) |
| $1,000 to $1,499 | 81 (20.3%) | 21 (15.0%) |
| $1,500 to $1,999 | 45 (11.3%) | 16 (11.4%) |
| $2,000 to $2,499 | 30 (7.5%) | 35 (25.0%) |
| $2,500 to $2,999 | 51 (12.8%) | 39 (27.9%) |
| $3,000 or more | 129 (32.4%) | 4 (2.9%) |
| Total | 398 (100.0%) | 140 (100.0%) |
Physical Housing Characteristics in Poipu
Housing Structures in Poipu
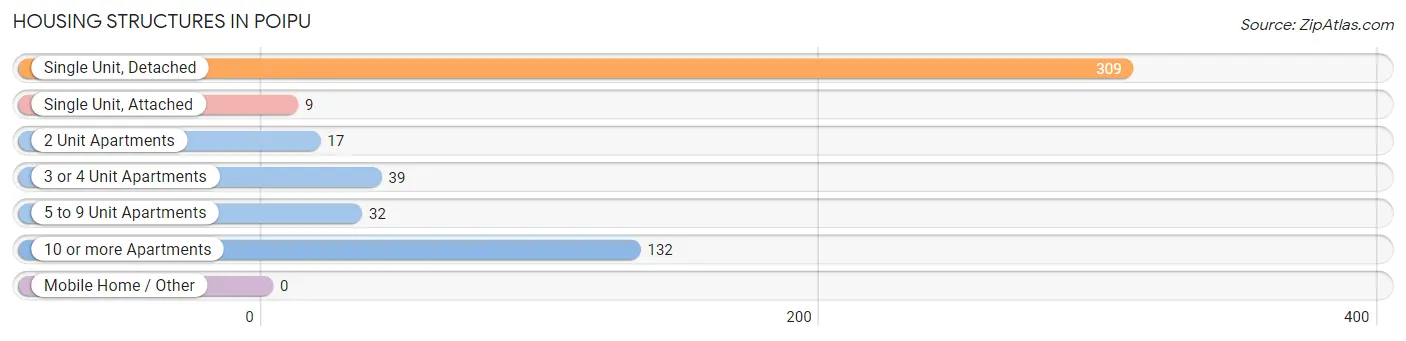
| Structure Type | # Housing Units | % Housing Units |
| Single Unit, Detached | 309 | 57.4% |
| Single Unit, Attached | 9 | 1.7% |
| 2 Unit Apartments | 17 | 3.2% |
| 3 or 4 Unit Apartments | 39 | 7.2% |
| 5 to 9 Unit Apartments | 32 | 5.9% |
| 10 or more Apartments | 132 | 24.5% |
| Mobile Home / Other | 0 | 0.0% |
| Total | 538 | 100.0% |
Housing Structures by Occupancy in Poipu
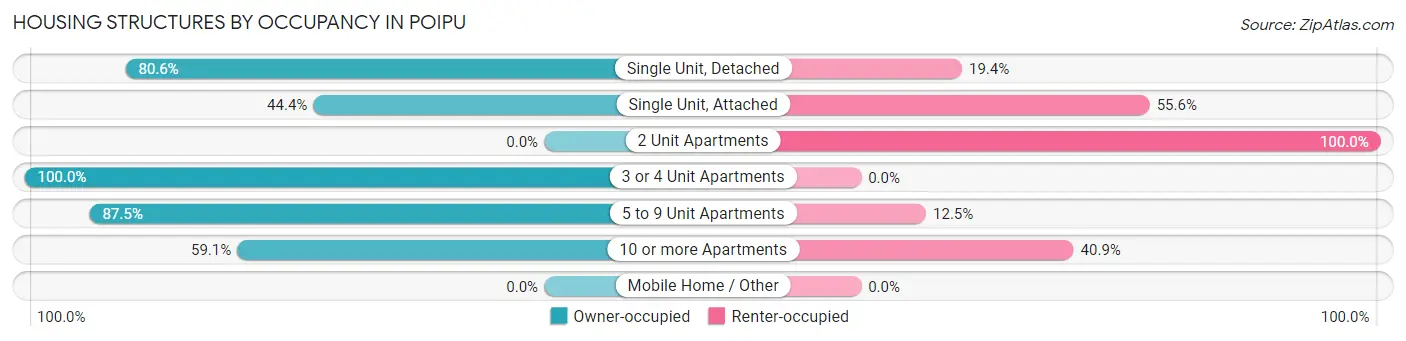
| Structure Type | Owner-occupied | Renter-occupied |
| Single Unit, Detached | 249 (80.6%) | 60 (19.4%) |
| Single Unit, Attached | 4 (44.4%) | 5 (55.6%) |
| 2 Unit Apartments | 0 (0.0%) | 17 (100.0%) |
| 3 or 4 Unit Apartments | 39 (100.0%) | 0 (0.0%) |
| 5 to 9 Unit Apartments | 28 (87.5%) | 4 (12.5%) |
| 10 or more Apartments | 78 (59.1%) | 54 (40.9%) |
| Mobile Home / Other | 0 (0.0%) | 0 (0.0%) |
| Total | 398 (74.0%) | 140 (26.0%) |
Housing Structures by Number of Rooms in Poipu
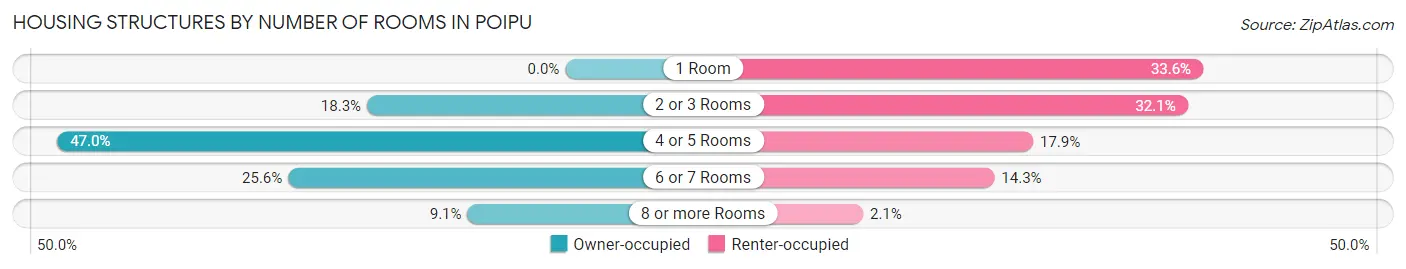
| Number of Rooms | Owner-occupied | Renter-occupied |
| 1 Room | 0 (0.0%) | 47 (33.6%) |
| 2 or 3 Rooms | 73 (18.3%) | 45 (32.1%) |
| 4 or 5 Rooms | 187 (47.0%) | 25 (17.9%) |
| 6 or 7 Rooms | 102 (25.6%) | 20 (14.3%) |
| 8 or more Rooms | 36 (9.0%) | 3 (2.1%) |
| Total | 398 (100.0%) | 140 (100.0%) |
Housing Structure by Heating Type in Poipu
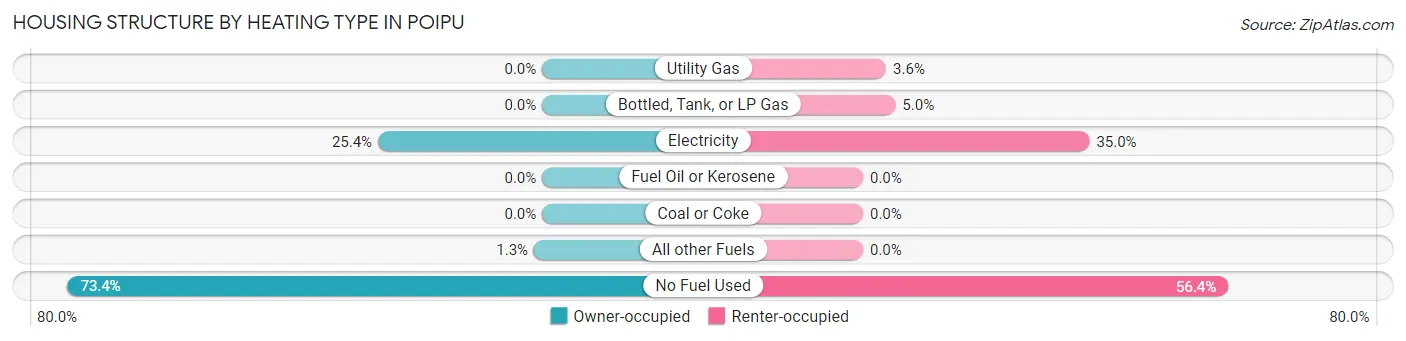
| Heating Type | Owner-occupied | Renter-occupied |
| Utility Gas | 0 (0.0%) | 5 (3.6%) |
| Bottled, Tank, or LP Gas | 0 (0.0%) | 7 (5.0%) |
| Electricity | 101 (25.4%) | 49 (35.0%) |
| Fuel Oil or Kerosene | 0 (0.0%) | 0 (0.0%) |
| Coal or Coke | 0 (0.0%) | 0 (0.0%) |
| All other Fuels | 5 (1.3%) | 0 (0.0%) |
| No Fuel Used | 292 (73.4%) | 79 (56.4%) |
| Total | 398 (100.0%) | 140 (100.0%) |
Household Vehicle Usage in Poipu
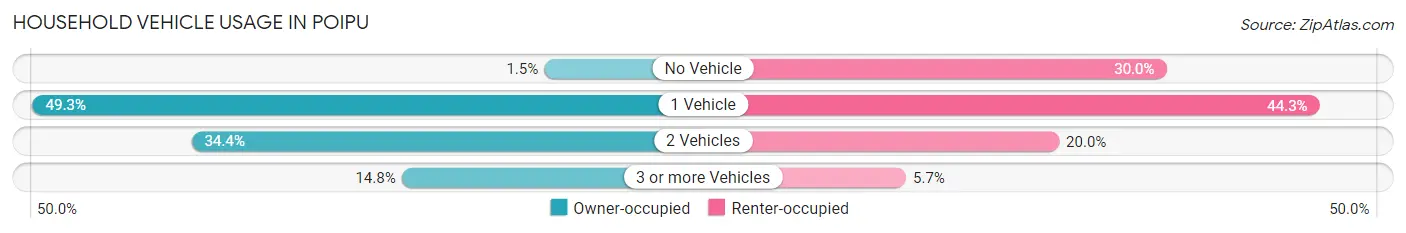
| Vehicles per Household | Owner-occupied | Renter-occupied |
| No Vehicle | 6 (1.5%) | 42 (30.0%) |
| 1 Vehicle | 196 (49.2%) | 62 (44.3%) |
| 2 Vehicles | 137 (34.4%) | 28 (20.0%) |
| 3 or more Vehicles | 59 (14.8%) | 8 (5.7%) |
| Total | 398 (100.0%) | 140 (100.0%) |
Real Estate & Mortgages in Poipu
Real Estate and Mortgage Overview in Poipu
| Characteristic | Without Mortgage | With Mortgage |
| Housing Units | 168 | 230 |
| Median Property Value | $1,118,400 | $1,116,900 |
| Median Household Income | $182,813 | $84 |
| Monthly Housing Costs | $1,311 | $118 |
| Real Estate Taxes | $3,250 | $0 |
Property Value by Mortgage Status in Poipu
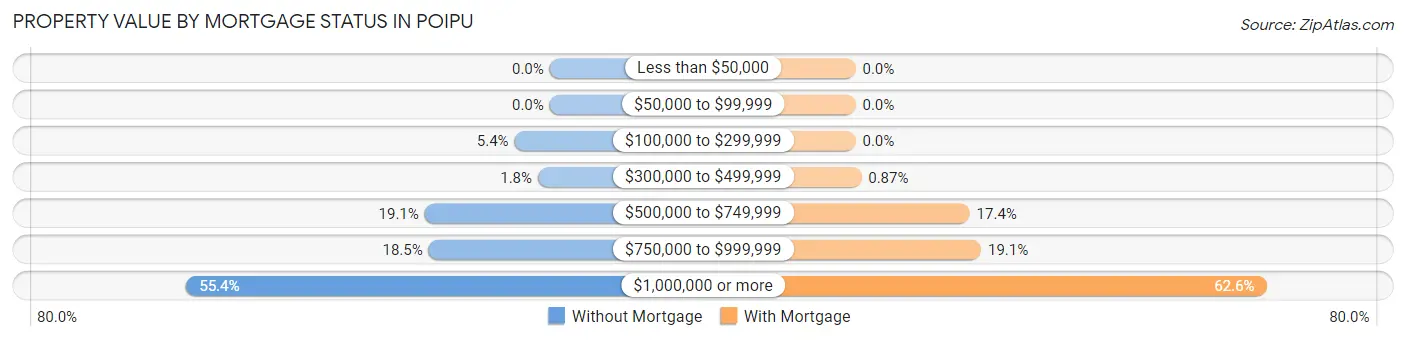
| Property Value | Without Mortgage | With Mortgage |
| Less than $50,000 | 0 (0.0%) | 0 (0.0%) |
| $50,000 to $99,999 | 0 (0.0%) | 0 (0.0%) |
| $100,000 to $299,999 | 9 (5.4%) | 0 (0.0%) |
| $300,000 to $499,999 | 3 (1.8%) | 2 (0.9%) |
| $500,000 to $749,999 | 32 (19.1%) | 40 (17.4%) |
| $750,000 to $999,999 | 31 (18.4%) | 44 (19.1%) |
| $1,000,000 or more | 93 (55.4%) | 144 (62.6%) |
| Total | 168 (100.0%) | 230 (100.0%) |
Household Income by Mortgage Status in Poipu
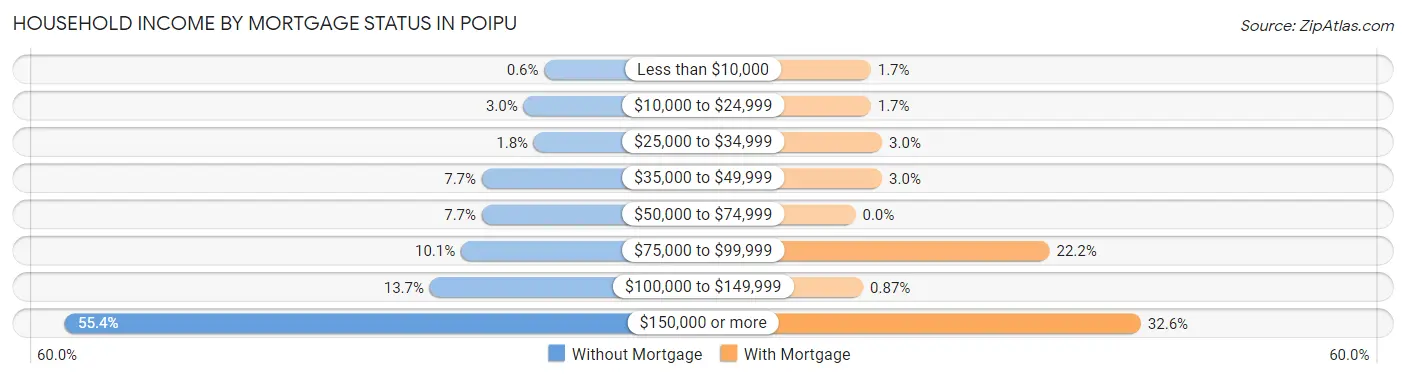
| Household Income | Without Mortgage | With Mortgage |
| Less than $10,000 | 1 (0.6%) | 4 (1.7%) |
| $10,000 to $24,999 | 5 (3.0%) | 4 (1.7%) |
| $25,000 to $34,999 | 3 (1.8%) | 7 (3.0%) |
| $35,000 to $49,999 | 13 (7.7%) | 7 (3.0%) |
| $50,000 to $74,999 | 13 (7.7%) | 0 (0.0%) |
| $75,000 to $99,999 | 17 (10.1%) | 51 (22.2%) |
| $100,000 to $149,999 | 23 (13.7%) | 2 (0.9%) |
| $150,000 or more | 93 (55.4%) | 75 (32.6%) |
| Total | 168 (100.0%) | 230 (100.0%) |
Property Value to Household Income Ratio in Poipu
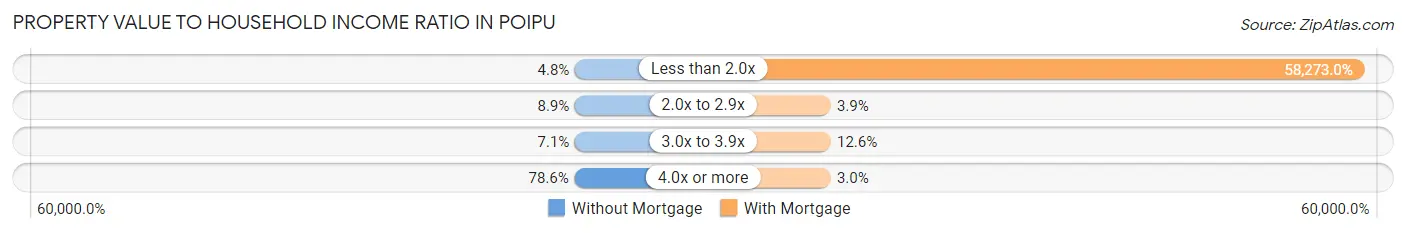
| Value-to-Income Ratio | Without Mortgage | With Mortgage |
| Less than 2.0x | 8 (4.8%) | 134,028 (58,273.0%) |
| 2.0x to 2.9x | 15 (8.9%) | 9 (3.9%) |
| 3.0x to 3.9x | 12 (7.1%) | 29 (12.6%) |
| 4.0x or more | 132 (78.6%) | 7 (3.0%) |
| Total | 168 (100.0%) | 230 (100.0%) |
Real Estate Taxes by Mortgage Status in Poipu
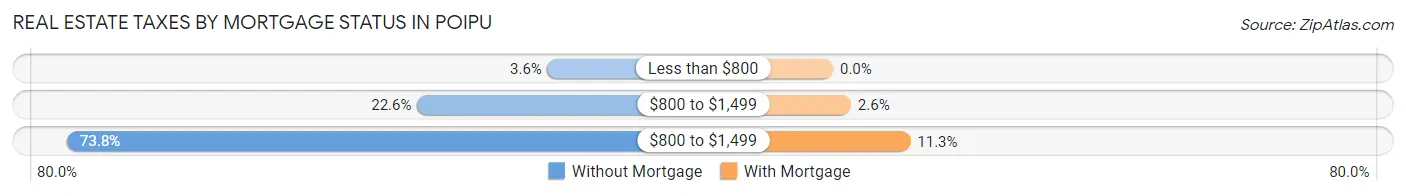
| Property Taxes | Without Mortgage | With Mortgage |
| Less than $800 | 6 (3.6%) | 0 (0.0%) |
| $800 to $1,499 | 38 (22.6%) | 6 (2.6%) |
| $800 to $1,499 | 124 (73.8%) | 26 (11.3%) |
| Total | 168 (100.0%) | 230 (100.0%) |
Health & Disability in Poipu
Health Insurance Coverage by Age in Poipu
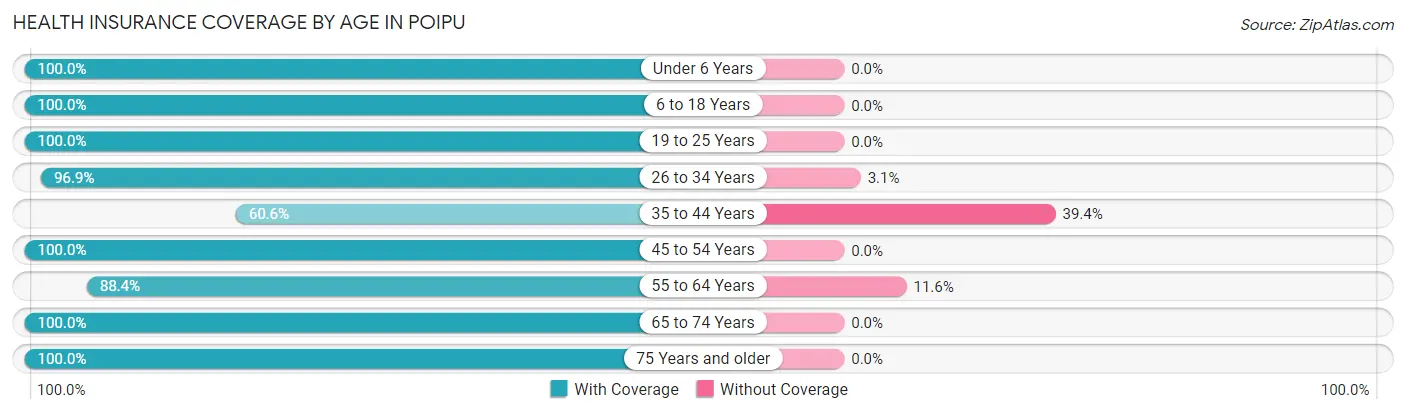
| Age Bracket | With Coverage | Without Coverage |
| Under 6 Years | 36 (100.0%) | 0 (0.0%) |
| 6 to 18 Years | 106 (100.0%) | 0 (0.0%) |
| 19 to 25 Years | 37 (100.0%) | 0 (0.0%) |
| 26 to 34 Years | 95 (96.9%) | 3 (3.1%) |
| 35 to 44 Years | 20 (60.6%) | 13 (39.4%) |
| 45 to 54 Years | 103 (100.0%) | 0 (0.0%) |
| 55 to 64 Years | 198 (88.4%) | 26 (11.6%) |
| 65 to 74 Years | 271 (100.0%) | 0 (0.0%) |
| 75 Years and older | 177 (100.0%) | 0 (0.0%) |
| Total | 1,043 (96.1%) | 42 (3.9%) |
Health Insurance Coverage by Citizenship Status in Poipu
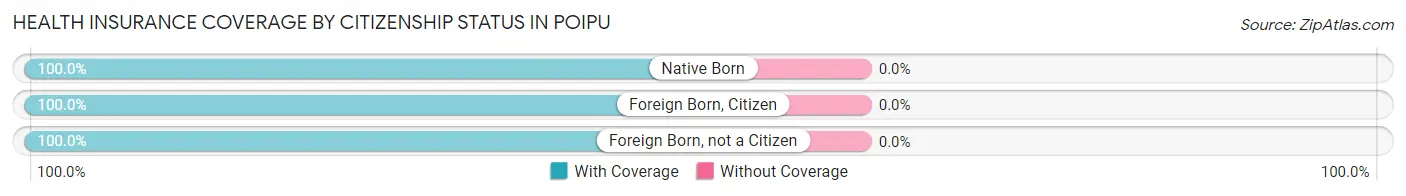
| Citizenship Status | With Coverage | Without Coverage |
| Native Born | 36 (100.0%) | 0 (0.0%) |
| Foreign Born, Citizen | 106 (100.0%) | 0 (0.0%) |
| Foreign Born, not a Citizen | 37 (100.0%) | 0 (0.0%) |
Health Insurance Coverage by Household Income in Poipu
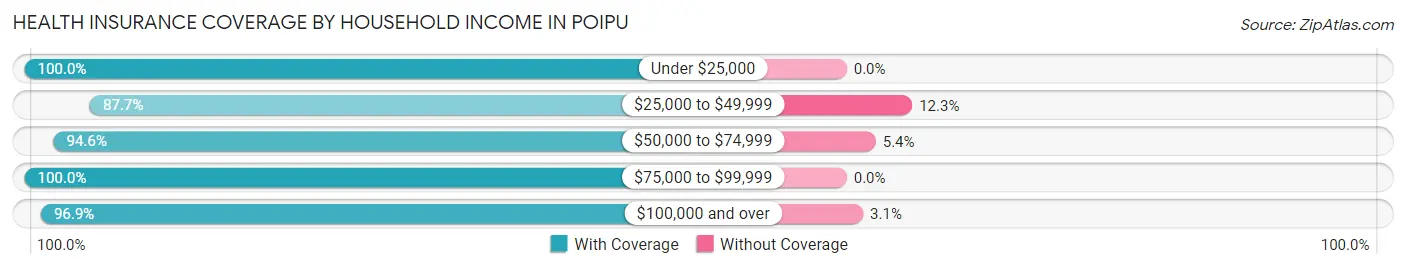
| Household Income | With Coverage | Without Coverage |
| Under $25,000 | 55 (100.0%) | 0 (0.0%) |
| $25,000 to $49,999 | 93 (87.7%) | 13 (12.3%) |
| $50,000 to $74,999 | 87 (94.6%) | 5 (5.4%) |
| $75,000 to $99,999 | 49 (100.0%) | 0 (0.0%) |
| $100,000 and over | 759 (96.9%) | 24 (3.1%) |
Public vs Private Health Insurance Coverage by Age in Poipu
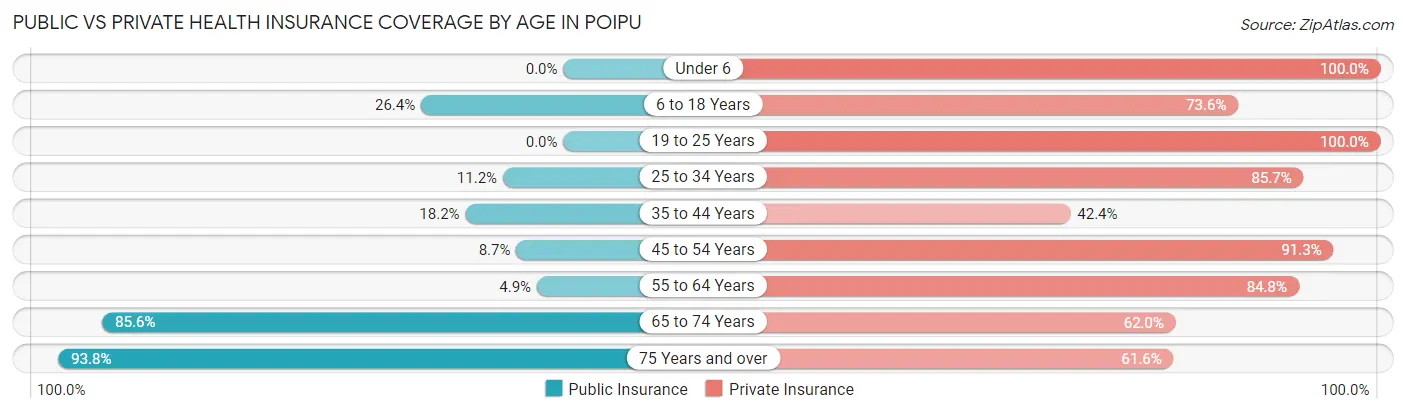
| Age Bracket | Public Insurance | Private Insurance |
| Under 6 | 0 (0.0%) | 36 (100.0%) |
| 6 to 18 Years | 28 (26.4%) | 78 (73.6%) |
| 19 to 25 Years | 0 (0.0%) | 37 (100.0%) |
| 25 to 34 Years | 11 (11.2%) | 84 (85.7%) |
| 35 to 44 Years | 6 (18.2%) | 14 (42.4%) |
| 45 to 54 Years | 9 (8.7%) | 94 (91.3%) |
| 55 to 64 Years | 11 (4.9%) | 190 (84.8%) |
| 65 to 74 Years | 232 (85.6%) | 168 (62.0%) |
| 75 Years and over | 166 (93.8%) | 109 (61.6%) |
| Total | 463 (42.7%) | 810 (74.7%) |
Disability Status by Sex by Age in Poipu
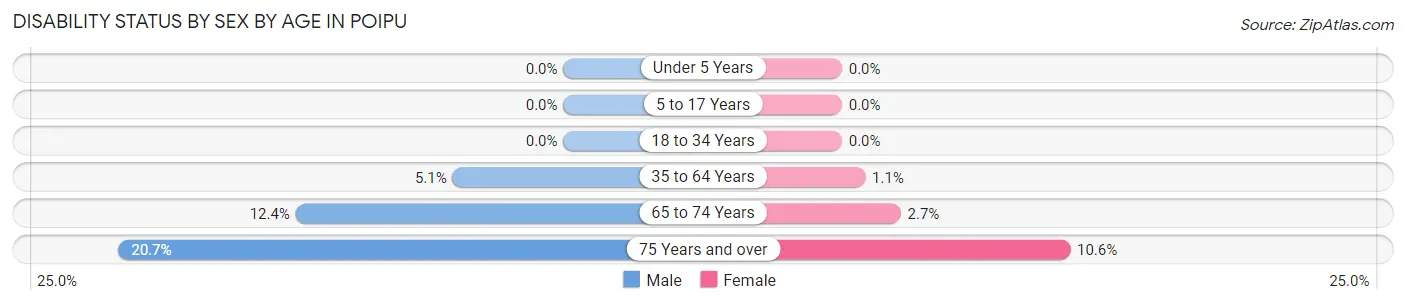
| Age Bracket | Male | Female |
| Under 5 Years | 0 (0.0%) | 0 (0.0%) |
| 5 to 17 Years | 0 (0.0%) | 0 (0.0%) |
| 18 to 34 Years | 0 (0.0%) | 0 (0.0%) |
| 35 to 64 Years | 9 (5.1%) | 2 (1.1%) |
| 65 to 74 Years | 20 (12.4%) | 3 (2.7%) |
| 75 Years and over | 19 (20.6%) | 9 (10.6%) |
Disability Class by Sex by Age in Poipu
Disability Class: Hearing Difficulty
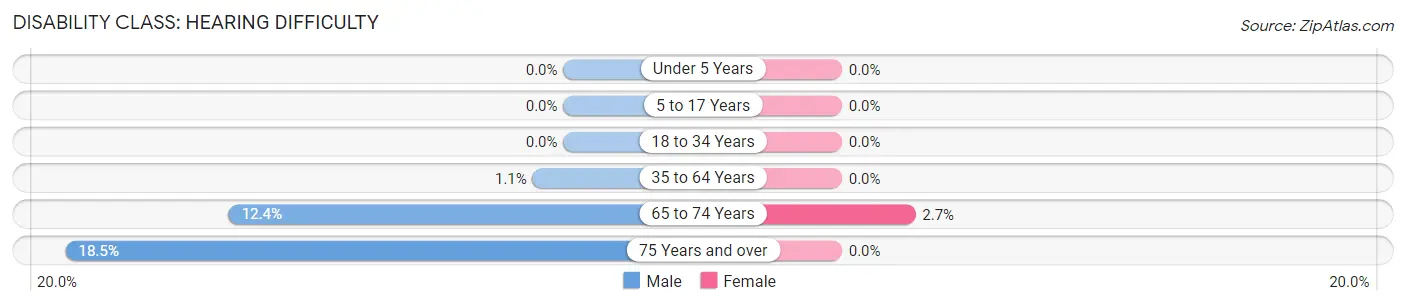
| Age Bracket | Male | Female |
| Under 5 Years | 0 (0.0%) | 0 (0.0%) |
| 5 to 17 Years | 0 (0.0%) | 0 (0.0%) |
| 18 to 34 Years | 0 (0.0%) | 0 (0.0%) |
| 35 to 64 Years | 2 (1.1%) | 0 (0.0%) |
| 65 to 74 Years | 20 (12.4%) | 3 (2.7%) |
| 75 Years and over | 17 (18.5%) | 0 (0.0%) |
Disability Class: Vision Difficulty
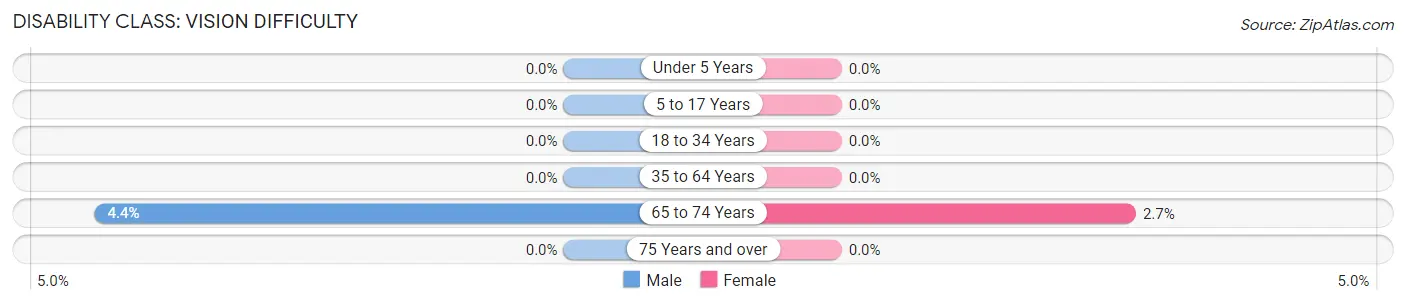
| Age Bracket | Male | Female |
| Under 5 Years | 0 (0.0%) | 0 (0.0%) |
| 5 to 17 Years | 0 (0.0%) | 0 (0.0%) |
| 18 to 34 Years | 0 (0.0%) | 0 (0.0%) |
| 35 to 64 Years | 0 (0.0%) | 0 (0.0%) |
| 65 to 74 Years | 7 (4.3%) | 3 (2.7%) |
| 75 Years and over | 0 (0.0%) | 0 (0.0%) |
Disability Class: Cognitive Difficulty
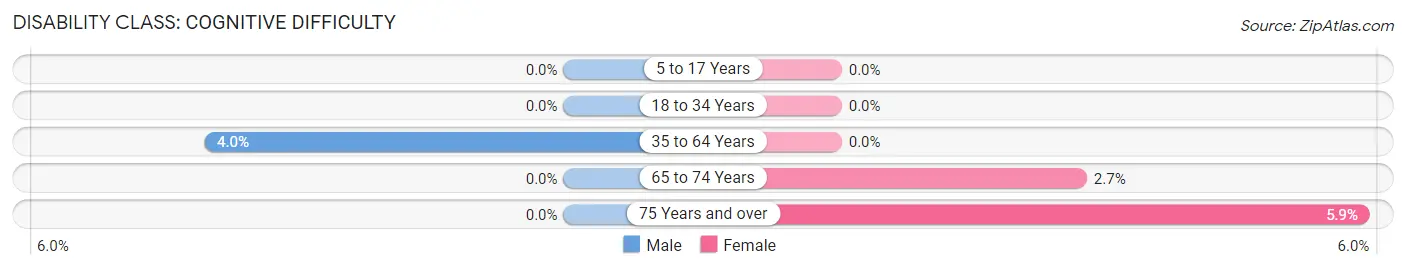
| Age Bracket | Male | Female |
| 5 to 17 Years | 0 (0.0%) | 0 (0.0%) |
| 18 to 34 Years | 0 (0.0%) | 0 (0.0%) |
| 35 to 64 Years | 7 (4.0%) | 0 (0.0%) |
| 65 to 74 Years | 0 (0.0%) | 3 (2.7%) |
| 75 Years and over | 0 (0.0%) | 5 (5.9%) |
Disability Class: Ambulatory Difficulty
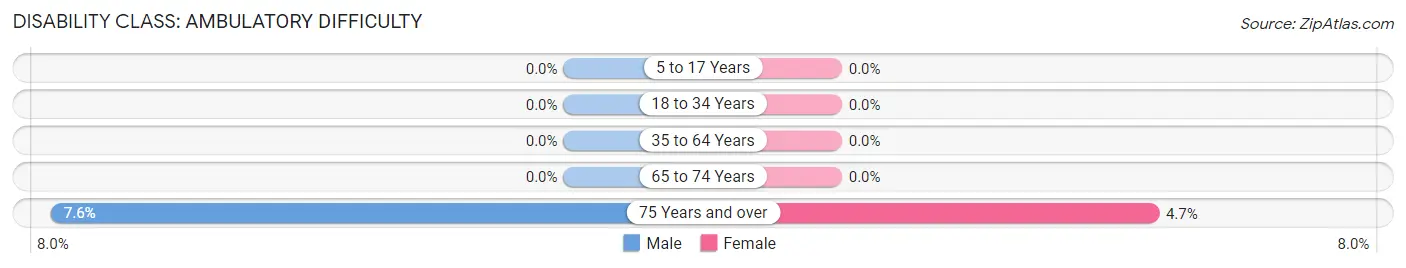
| Age Bracket | Male | Female |
| 5 to 17 Years | 0 (0.0%) | 0 (0.0%) |
| 18 to 34 Years | 0 (0.0%) | 0 (0.0%) |
| 35 to 64 Years | 0 (0.0%) | 0 (0.0%) |
| 65 to 74 Years | 0 (0.0%) | 0 (0.0%) |
| 75 Years and over | 7 (7.6%) | 4 (4.7%) |
Disability Class: Self-Care Difficulty
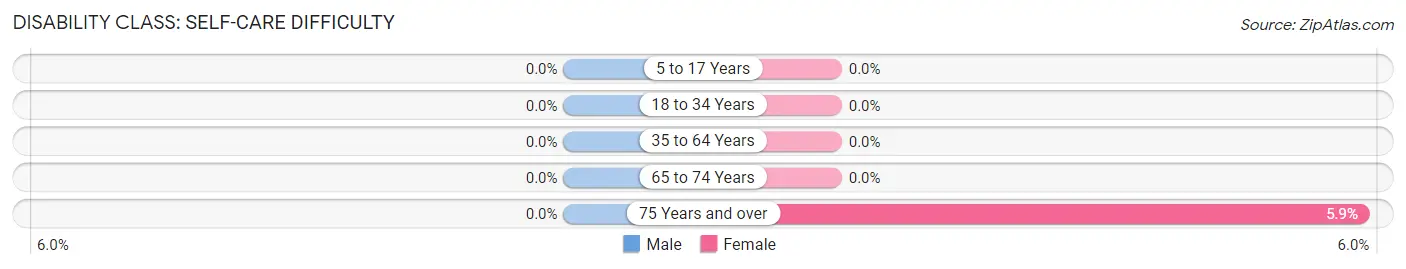
| Age Bracket | Male | Female |
| 5 to 17 Years | 0 (0.0%) | 0 (0.0%) |
| 18 to 34 Years | 0 (0.0%) | 0 (0.0%) |
| 35 to 64 Years | 0 (0.0%) | 0 (0.0%) |
| 65 to 74 Years | 0 (0.0%) | 0 (0.0%) |
| 75 Years and over | 0 (0.0%) | 5 (5.9%) |
Technology Access in Poipu
Computing Device Access in Poipu
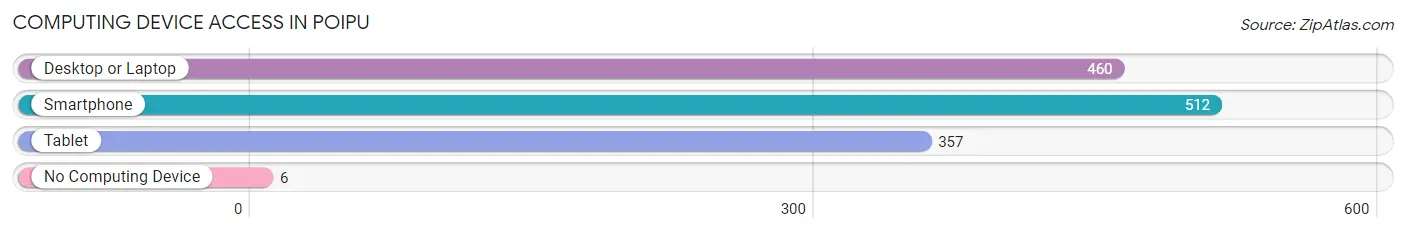
| Device Type | # Households | % Households |
| Desktop or Laptop | 460 | 85.5% |
| Smartphone | 512 | 95.2% |
| Tablet | 357 | 66.4% |
| No Computing Device | 6 | 1.1% |
| Total | 538 | 100.0% |
Internet Access in Poipu
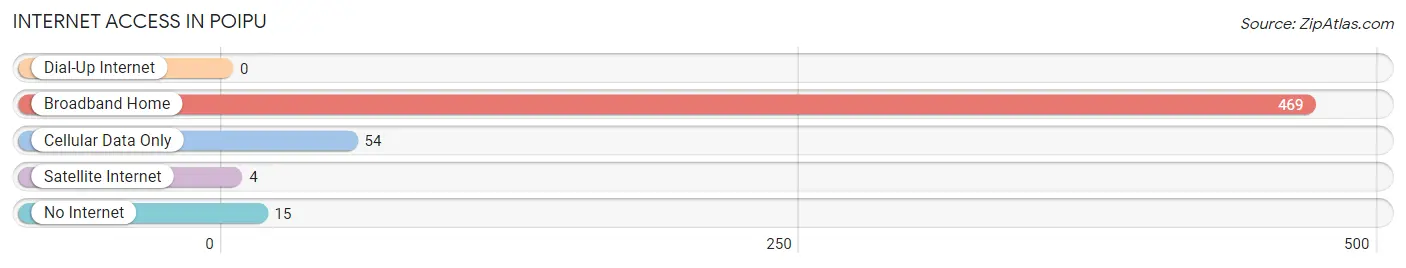
| Internet Type | # Households | % Households |
| Dial-Up Internet | 0 | 0.0% |
| Broadband Home | 469 | 87.2% |
| Cellular Data Only | 54 | 10.0% |
| Satellite Internet | 4 | 0.7% |
| No Internet | 15 | 2.8% |
| Total | 538 | 100.0% |
Poipu Summary
Poipu, HI is a small town located on the south shore of the Hawaiian island of Kauai. It is a popular tourist destination, known for its beautiful beaches, lush tropical landscape, and abundance of outdoor activities. The town is home to a variety of resorts, restaurants, and shops, as well as a number of historical sites.
History
The area now known as Poipu was originally inhabited by the native Hawaiian people. The first Europeans to visit the area were the Spanish, who arrived in 1778. The area was later settled by missionaries in the early 1800s. In 1835, King Kamehameha III granted the land to the missionary William Ellis, who established a sugar plantation. The plantation was later sold to the McBryde Sugar Company, which operated until the early 1900s.
In the late 1800s, the area began to attract tourists, and the first hotel was built in 1891. The town was officially established in the early 1900s, and the first post office was opened in 1910. In the 1950s, the area began to develop as a tourist destination, and the first resort was built in 1959.
Geography
Poipu is located on the south shore of Kauai, approximately 20 miles from the island’s capital, Lihue. The town is situated on a narrow strip of land between the Pacific Ocean and the Kiahuna Plantation. The area is known for its beautiful beaches, including Poipu Beach, which is one of the most popular beaches on the island. The town is also home to a variety of lush tropical vegetation, including palm trees, hibiscus, and bougainvillea.
Economy
The economy of Poipu is largely driven by tourism. The town is home to a variety of resorts, restaurants, and shops, as well as a number of historical sites. The area is also known for its abundance of outdoor activities, including surfing, snorkeling, and hiking. In addition, the town is home to a number of agricultural operations, including coffee and macadamia nut farms.
Demographics
As of the 2010 census, the population of Poipu was 1,711. The town is predominantly white, with a small percentage of Asian and Native Hawaiian residents. The median household income is $63,750, and the median home value is $717,000. The town has a high rate of homeownership, with nearly 80% of residents owning their own homes.
Common Questions
What is Per Capita Income in Poipu?
Per Capita income in Poipu is $115,240.
What is the Median Family Income in Poipu?
Median Family Income in Poipu is $158,021.
What is the Median Household income in Poipu?
Median Household Income in Poipu is $134,028.
What is Income or Wage Gap in Poipu?
Income or Wage Gap in Poipu is 65.3%.
Women in Poipu earn 34.7 cents for every dollar earned by a man.
What is Family Income Deficit in Poipu?
Family Income Deficit in Poipu is $11,378.
Families that are below poverty line in Poipu earn $11,378 less on average than the poverty threshold level.
What is Inequality or Gini Index in Poipu?
Inequality or Gini Index in Poipu is 0.57.
What is the Total Population of Poipu?
Total Population of Poipu is 1,085.
What is the Total Male Population of Poipu?
Total Male Population of Poipu is 550.
What is the Total Female Population of Poipu?
Total Female Population of Poipu is 535.
What is the Ratio of Males per 100 Females in Poipu?
There are 102.80 Males per 100 Females in Poipu.
What is the Ratio of Females per 100 Males in Poipu?
There are 97.27 Females per 100 Males in Poipu.
What is the Median Population Age in Poipu?
Median Population Age in Poipu is 62.2 Years.
What is the Average Family Size in Poipu
Average Family Size in Poipu is 2.6 People.
What is the Average Household Size in Poipu
Average Household Size in Poipu is 2.0 People.
How Large is the Labor Force in Poipu?
There are 519 People in the Labor Forcein in Poipu.
What is the Percentage of People in the Labor Force in Poipu?
53.1% of People are in the Labor Force in Poipu.
What is the Unemployment Rate in Poipu?
Unemployment Rate in Poipu is 2.3%.