Hoschton, GA Map & Demographics
Hoschton Map
Hoschton Overview
$37,846
PER CAPITA INCOME
$96,389
AVG FAMILY INCOME
$87,021
AVG HOUSEHOLD INCOME
33.1%
WAGE / INCOME GAP [ % ]
66.9¢/ $1
WAGE / INCOME GAP [ $ ]
0.37
INEQUALITY / GINI INDEX
3,099
TOTAL POPULATION
1,503
MALE POPULATION
1,596
FEMALE POPULATION
94.17
MALES / 100 FEMALES
106.19
FEMALES / 100 MALES
33.9
MEDIAN AGE
3.2
AVG FAMILY SIZE
2.8
AVG HOUSEHOLD SIZE
1,650
LABOR FORCE [ PEOPLE ]
70.3%
PERCENT IN LABOR FORCE
1.0%
UNEMPLOYMENT RATE
Hoschton Zip Codes
Hoschton Area Codes
Income in Hoschton
Income Overview in Hoschton
Per Capita Income in Hoschton is $37,846, while median incomes of families and households are $96,389 and $87,021 respectively.
| Characteristic | Number | Measure |
| Per Capita Income | 3,099 | $37,846 |
| Median Family Income | 834 | $96,389 |
| Mean Family Income | 834 | $117,706 |
| Median Household Income | 1,124 | $87,021 |
| Mean Household Income | 1,124 | $107,390 |
| Income Deficit | 834 | $0 |
| Wage / Income Gap (%) | 3,099 | 33.15% |
| Wage / Income Gap ($) | 3,099 | 66.85¢ per $1 |
| Gini / Inequality Index | 3,099 | 0.37 |
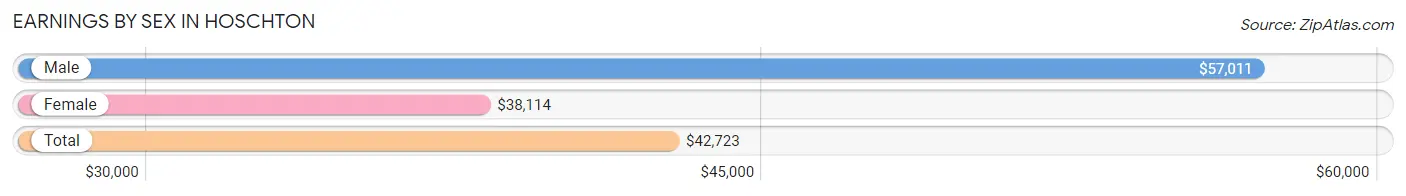
Earnings by Sex in Hoschton
Average Earnings in Hoschton are $42,723, $57,011 for men and $38,114 for women, a difference of 33.2%.
| Sex | Number | Average Earnings |
| Male | 793 (46.6%) | $57,011 |
| Female | 909 (53.4%) | $38,114 |
| Total | 1,702 (100.0%) | $42,723 |
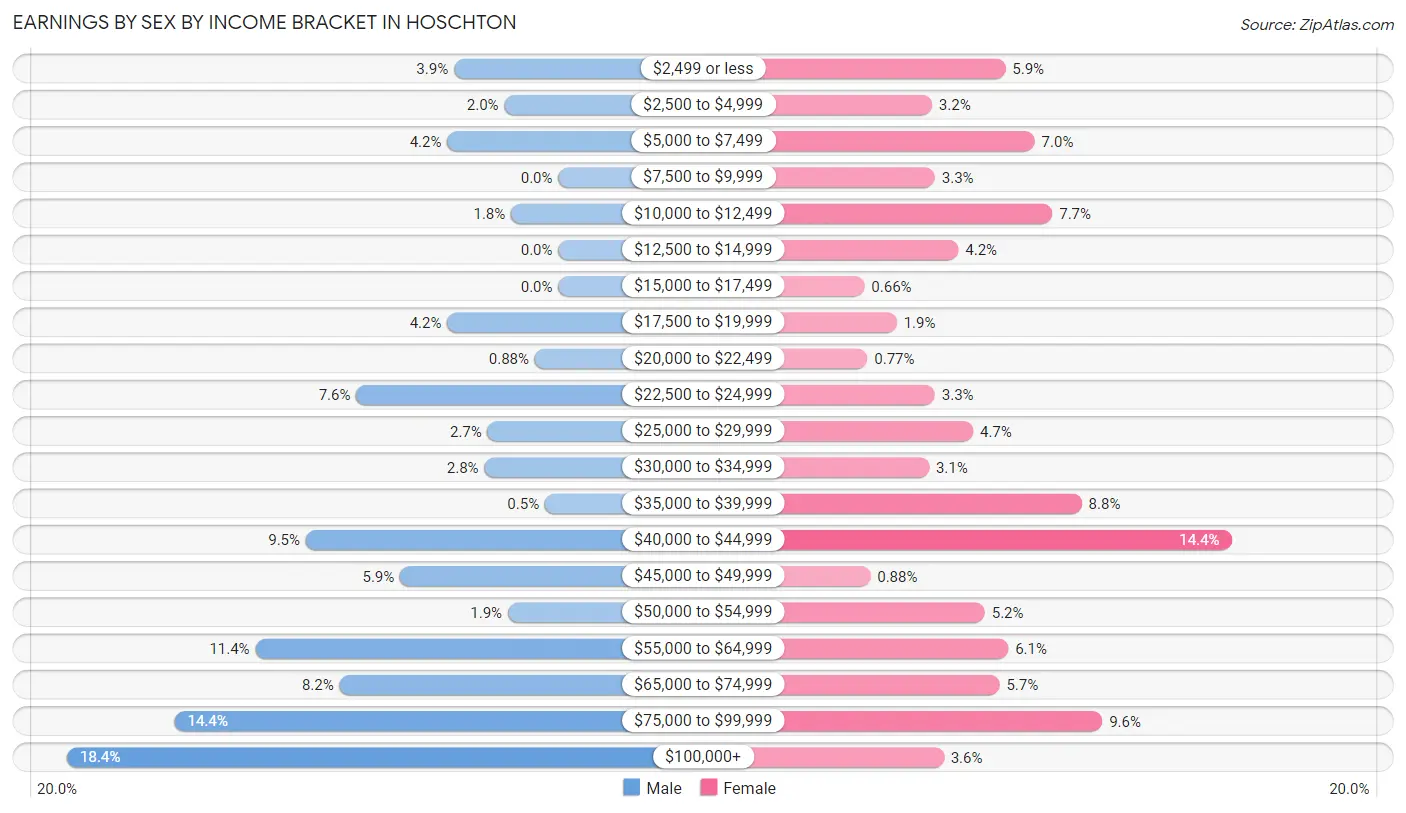
Earnings by Sex by Income Bracket in Hoschton
The most common earnings brackets in Hoschton are $100,000+ for men (146 | 18.4%) and $40,000 to $44,999 for women (131 | 14.4%).
| Income | Male | Female |
| $2,499 or less | 31 (3.9%) | 54 (5.9%) |
| $2,500 to $4,999 | 16 (2.0%) | 29 (3.2%) |
| $5,000 to $7,499 | 33 (4.2%) | 64 (7.0%) |
| $7,500 to $9,999 | 0 (0.0%) | 30 (3.3%) |
| $10,000 to $12,499 | 14 (1.8%) | 70 (7.7%) |
| $12,500 to $14,999 | 0 (0.0%) | 38 (4.2%) |
| $15,000 to $17,499 | 0 (0.0%) | 6 (0.7%) |
| $17,500 to $19,999 | 33 (4.2%) | 17 (1.9%) |
| $20,000 to $22,499 | 7 (0.9%) | 7 (0.8%) |
| $22,500 to $24,999 | 60 (7.6%) | 30 (3.3%) |
| $25,000 to $29,999 | 21 (2.6%) | 43 (4.7%) |
| $30,000 to $34,999 | 22 (2.8%) | 28 (3.1%) |
| $35,000 to $39,999 | 4 (0.5%) | 80 (8.8%) |
| $40,000 to $44,999 | 75 (9.5%) | 131 (14.4%) |
| $45,000 to $49,999 | 47 (5.9%) | 8 (0.9%) |
| $50,000 to $54,999 | 15 (1.9%) | 47 (5.2%) |
| $55,000 to $64,999 | 90 (11.4%) | 55 (6.0%) |
| $65,000 to $74,999 | 65 (8.2%) | 52 (5.7%) |
| $75,000 to $99,999 | 114 (14.4%) | 87 (9.6%) |
| $100,000+ | 146 (18.4%) | 33 (3.6%) |
| Total | 793 (100.0%) | 909 (100.0%) |
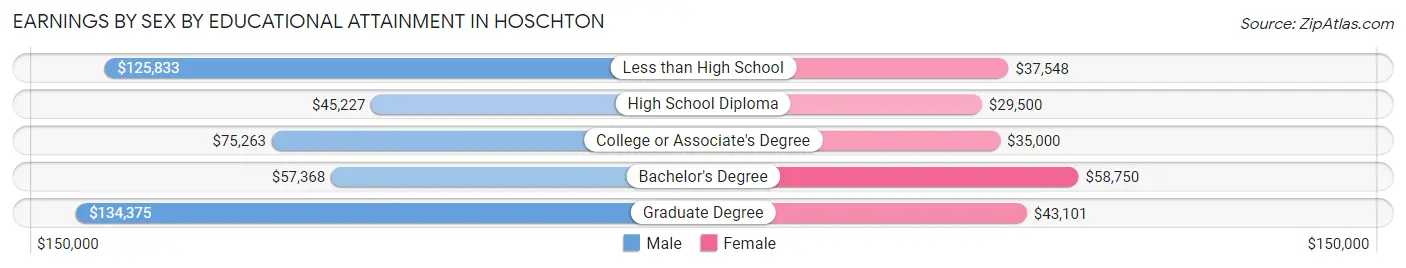
Earnings by Sex by Educational Attainment in Hoschton
Average earnings in Hoschton are $59,549 for men and $39,886 for women, a difference of 33.0%. Men with an educational attainment of graduate degree enjoy the highest average annual earnings of $134,375, while those with high school diploma education earn the least with $45,227. Women with an educational attainment of bachelor's degree earn the most with the average annual earnings of $58,750, while those with high school diploma education have the smallest earnings of $29,500.
| Educational Attainment | Male Income | Female Income |
| Less than High School | $125,833 | $37,548 |
| High School Diploma | $45,227 | $29,500 |
| College or Associate's Degree | $75,263 | $35,000 |
| Bachelor's Degree | $57,368 | $58,750 |
| Graduate Degree | $134,375 | $43,101 |
| Total | $59,549 | $39,886 |
Family Income in Hoschton
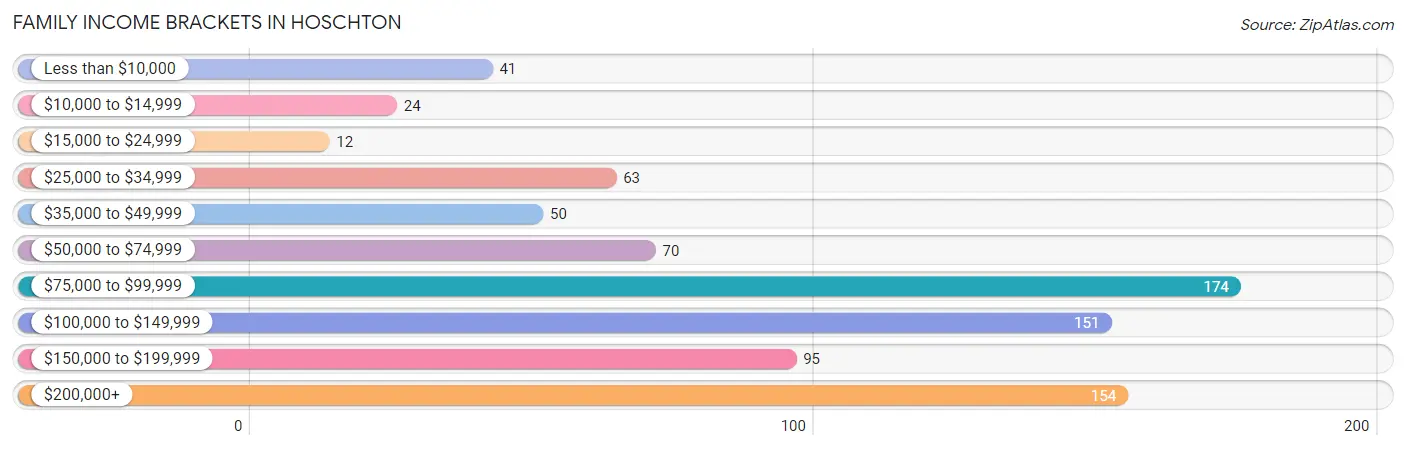
Family Income Brackets in Hoschton
According to the Hoschton family income data, there are 174 families falling into the $75,000 to $99,999 income range, which is the most common income bracket and makes up 20.9% of all families. Conversely, the $15,000 to $24,999 income bracket is the least frequent group with only 12 families (1.4%) belonging to this category.
| Income Bracket | # Families | % Families |
| Less than $10,000 | 41 | 4.9% |
| $10,000 to $14,999 | 24 | 2.9% |
| $15,000 to $24,999 | 12 | 1.4% |
| $25,000 to $34,999 | 63 | 7.6% |
| $35,000 to $49,999 | 50 | 6.0% |
| $50,000 to $74,999 | 70 | 8.4% |
| $75,000 to $99,999 | 174 | 20.9% |
| $100,000 to $149,999 | 151 | 18.1% |
| $150,000 to $199,999 | 95 | 11.4% |
| $200,000+ | 154 | 18.5% |
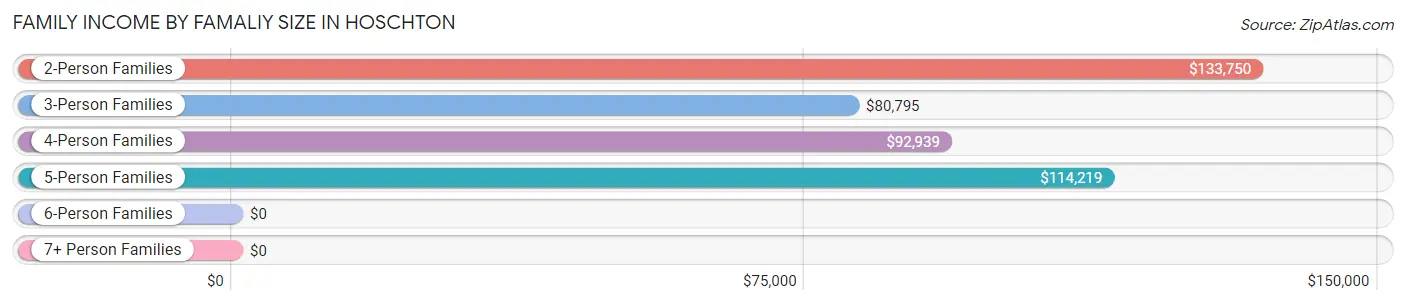
Family Income by Famaliy Size in Hoschton
2-person families (386 | 46.3%) account for the highest median family income in Hoschton with $133,750 per family, while 2-person families (386 | 46.3%) have the highest median income of $66,875 per family member.
| Income Bracket | # Families | Median Income |
| 2-Person Families | 386 (46.3%) | $133,750 |
| 3-Person Families | 170 (20.4%) | $80,795 |
| 4-Person Families | 221 (26.5%) | $92,939 |
| 5-Person Families | 45 (5.4%) | $114,219 |
| 6-Person Families | 8 (1.0%) | $0 |
| 7+ Person Families | 4 (0.5%) | $0 |
| Total | 834 (100.0%) | $96,389 |
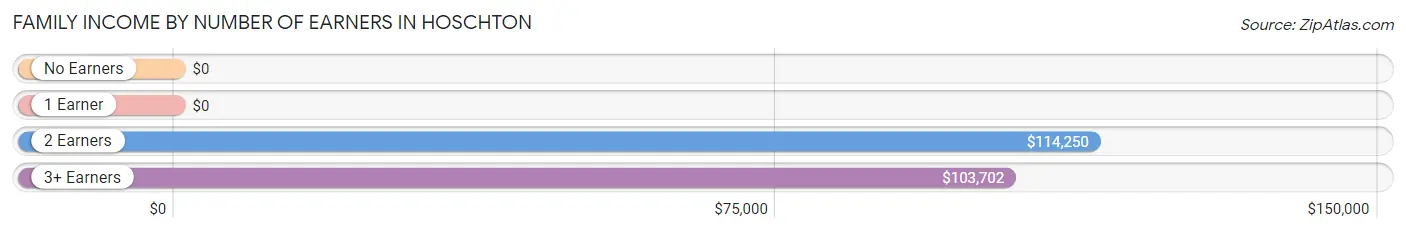
Family Income by Number of Earners in Hoschton
| Number of Earners | # Families | Median Income |
| No Earners | 121 (14.5%) | $0 |
| 1 Earner | 218 (26.1%) | $0 |
| 2 Earners | 416 (49.9%) | $114,250 |
| 3+ Earners | 79 (9.5%) | $103,702 |
| Total | 834 (100.0%) | $96,389 |
Household Income in Hoschton
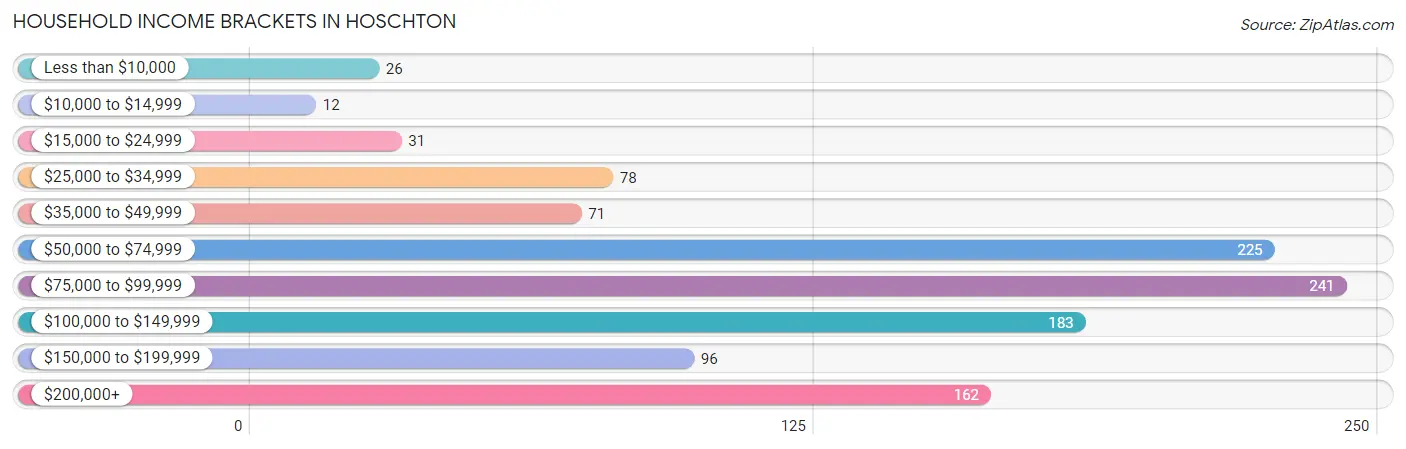
Household Income Brackets in Hoschton
With 241 households falling in the category, the $75,000 to $99,999 income range is the most frequent in Hoschton, accounting for 21.4% of all households. In contrast, only 12 households (1.1%) fall into the $10,000 to $14,999 income bracket, making it the least populous group.
| Income Bracket | # Households | % Households |
| Less than $10,000 | 26 | 2.3% |
| $10,000 to $14,999 | 12 | 1.1% |
| $15,000 to $24,999 | 31 | 2.8% |
| $25,000 to $34,999 | 78 | 6.9% |
| $35,000 to $49,999 | 71 | 6.3% |
| $50,000 to $74,999 | 225 | 20.0% |
| $75,000 to $99,999 | 241 | 21.4% |
| $100,000 to $149,999 | 183 | 16.3% |
| $150,000 to $199,999 | 96 | 8.5% |
| $200,000+ | 162 | 14.4% |
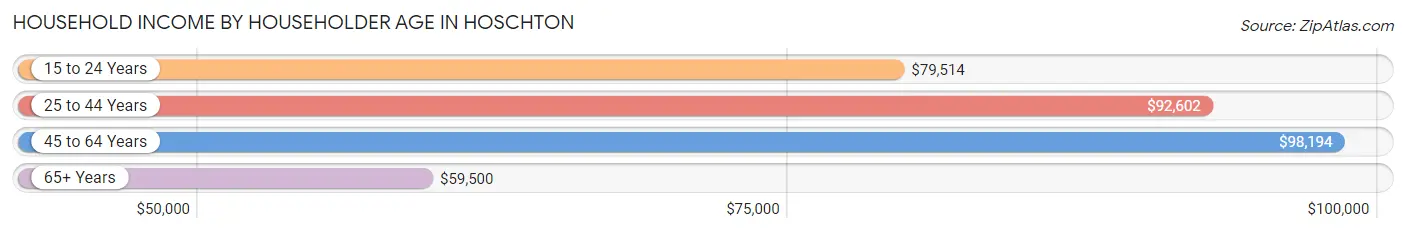
Household Income by Householder Age in Hoschton
The median household income in Hoschton is $87,021, with the highest median household income of $98,194 found in the 45 to 64 years age bracket for the primary householder. A total of 411 households (36.6%) fall into this category. Meanwhile, the 65+ years age bracket for the primary householder has the lowest median household income of $59,500, with 188 households (16.7%) in this group.
| Income Bracket | # Households | Median Income |
| 15 to 24 Years | 37 (3.3%) | $79,514 |
| 25 to 44 Years | 488 (43.4%) | $92,602 |
| 45 to 64 Years | 411 (36.6%) | $98,194 |
| 65+ Years | 188 (16.7%) | $59,500 |
| Total | 1,124 (100.0%) | $87,021 |
Poverty in Hoschton
Income Below Poverty by Sex and Age in Hoschton
With 11.7% poverty level for males and 12.4% for females among the residents of Hoschton, under 5 year old males and 18 to 24 year old females are the most vulnerable to poverty, with 49 males (39.5%) and 64 females (41.6%) in their respective age groups living below the poverty level.
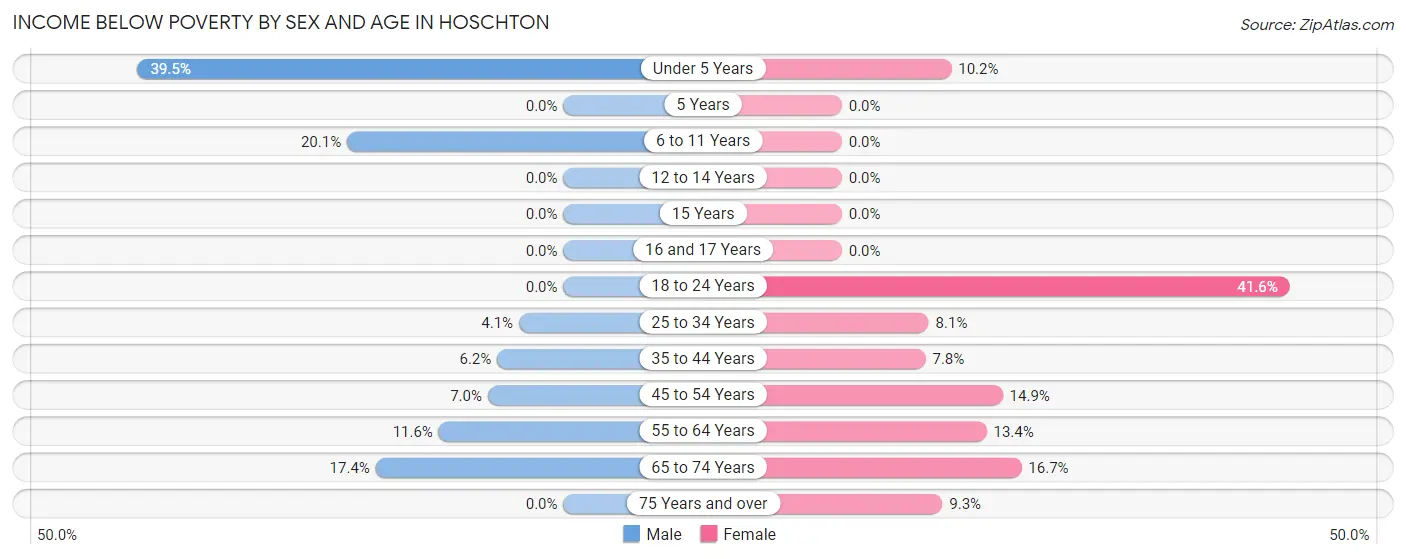
| Age Bracket | Male | Female |
| Under 5 Years | 49 (39.5%) | 13 (10.2%) |
| 5 Years | 0 (0.0%) | 0 (0.0%) |
| 6 to 11 Years | 51 (20.1%) | 0 (0.0%) |
| 12 to 14 Years | 0 (0.0%) | 0 (0.0%) |
| 15 Years | 0 (0.0%) | 0 (0.0%) |
| 16 and 17 Years | 0 (0.0%) | 0 (0.0%) |
| 18 to 24 Years | 0 (0.0%) | 64 (41.6%) |
| 25 to 34 Years | 12 (4.1%) | 20 (8.1%) |
| 35 to 44 Years | 12 (6.1%) | 23 (7.8%) |
| 45 to 54 Years | 11 (7.0%) | 20 (14.9%) |
| 55 to 64 Years | 14 (11.6%) | 29 (13.4%) |
| 65 to 74 Years | 27 (17.4%) | 21 (16.7%) |
| 75 Years and over | 0 (0.0%) | 7 (9.3%) |
| Total | 176 (11.7%) | 197 (12.4%) |
Income Above Poverty by Sex and Age in Hoschton
According to the poverty statistics in Hoschton, males aged 5 years and females aged 5 years are the age groups that are most secure financially, with 100.0% of males and 100.0% of females in these age groups living above the poverty line.
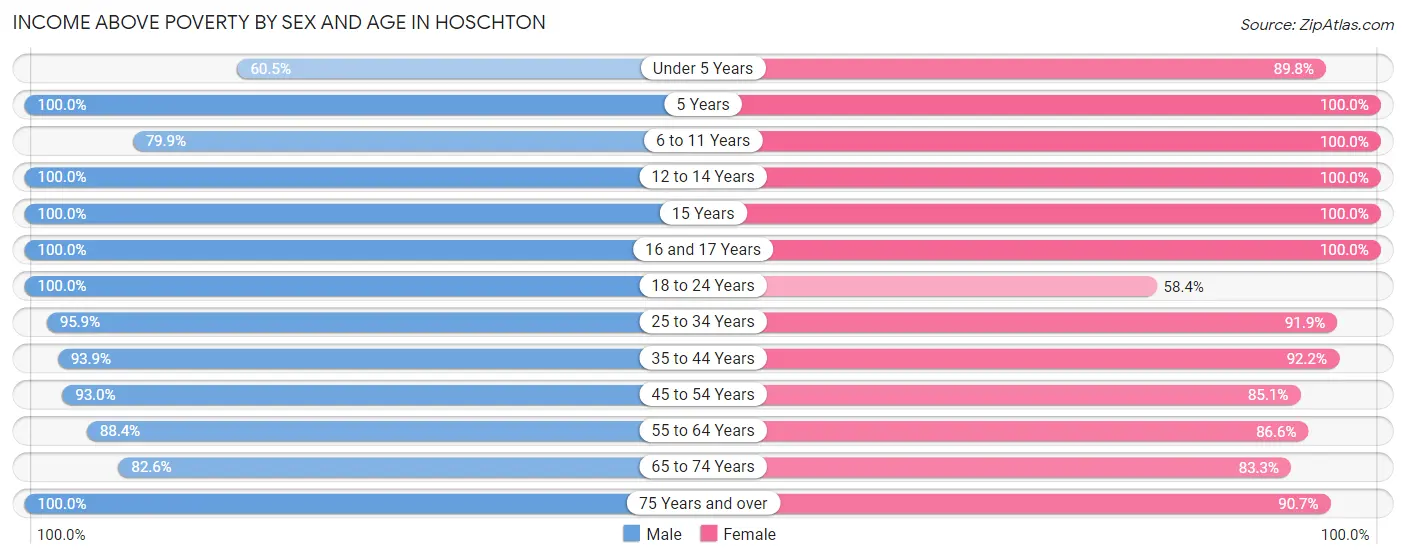
| Age Bracket | Male | Female |
| Under 5 Years | 75 (60.5%) | 115 (89.8%) |
| 5 Years | 22 (100.0%) | 27 (100.0%) |
| 6 to 11 Years | 203 (79.9%) | 91 (100.0%) |
| 12 to 14 Years | 29 (100.0%) | 49 (100.0%) |
| 15 Years | 9 (100.0%) | 11 (100.0%) |
| 16 and 17 Years | 22 (100.0%) | 37 (100.0%) |
| 18 to 24 Years | 87 (100.0%) | 90 (58.4%) |
| 25 to 34 Years | 279 (95.9%) | 228 (91.9%) |
| 35 to 44 Years | 183 (93.9%) | 273 (92.2%) |
| 45 to 54 Years | 146 (93.0%) | 114 (85.1%) |
| 55 to 64 Years | 107 (88.4%) | 187 (86.6%) |
| 65 to 74 Years | 128 (82.6%) | 105 (83.3%) |
| 75 Years and over | 33 (100.0%) | 68 (90.7%) |
| Total | 1,323 (88.3%) | 1,395 (87.6%) |
Income Below Poverty Among Married-Couple Families in Hoschton
The poverty statistics for married-couple families in Hoschton show that 3.6% or 22 of the total 614 families live below the poverty line. Families with no children have the highest poverty rate of 6.3%, comprising of 21 families. On the other hand, families with 3 or 4 children have the lowest poverty rate of 0.0%, which includes 0 families.
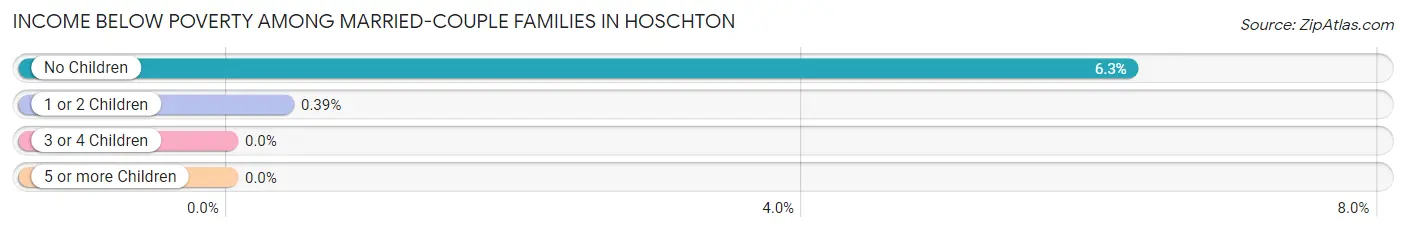
| Children | Above Poverty | Below Poverty |
| No Children | 314 (93.7%) | 21 (6.3%) |
| 1 or 2 Children | 256 (99.6%) | 1 (0.4%) |
| 3 or 4 Children | 18 (100.0%) | 0 (0.0%) |
| 5 or more Children | 4 (100.0%) | 0 (0.0%) |
| Total | 592 (96.4%) | 22 (3.6%) |
Income Below Poverty Among Single-Parent Households in Hoschton
According to the poverty data in Hoschton, 46.4% or 26 single-father households and 23.8% or 39 single-mother households are living below the poverty line. Among single-father households, those with no children have the highest poverty rate, with 14 households (48.3%) experiencing poverty. Likewise, among single-mother households, those with 3 or 4 children have the highest poverty rate, with 17 households (100.0%) falling below the poverty line.
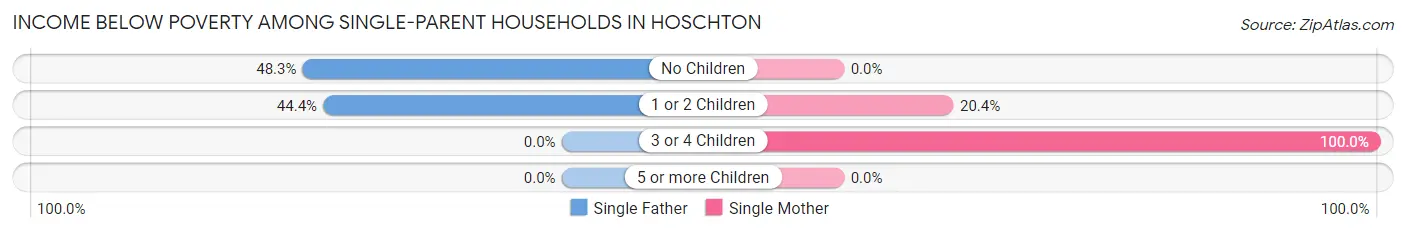
| Children | Single Father | Single Mother |
| No Children | 14 (48.3%) | 0 (0.0%) |
| 1 or 2 Children | 12 (44.4%) | 22 (20.4%) |
| 3 or 4 Children | 0 (0.0%) | 17 (100.0%) |
| 5 or more Children | 0 (0.0%) | 0 (0.0%) |
| Total | 26 (46.4%) | 39 (23.8%) |
Income Below Poverty Among Married-Couple vs Single-Parent Households in Hoschton
The poverty data for Hoschton shows that 22 of the married-couple family households (3.6%) and 65 of the single-parent households (29.5%) are living below the poverty level. Within the married-couple family households, those with no children have the highest poverty rate, with 21 households (6.3%) falling below the poverty line. Among the single-parent households, those with 3 or 4 children have the highest poverty rate, with 17 household (100.0%) living below poverty.
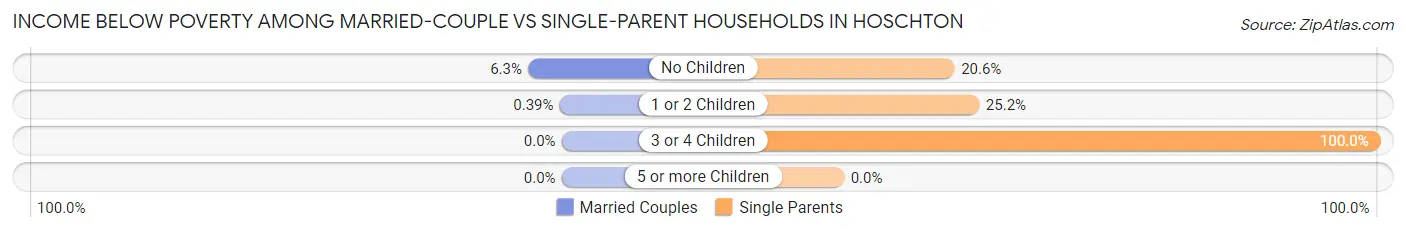
| Children | Married-Couple Families | Single-Parent Households |
| No Children | 21 (6.3%) | 14 (20.6%) |
| 1 or 2 Children | 1 (0.4%) | 34 (25.2%) |
| 3 or 4 Children | 0 (0.0%) | 17 (100.0%) |
| 5 or more Children | 0 (0.0%) | 0 (0.0%) |
| Total | 22 (3.6%) | 65 (29.5%) |
Race in Hoschton
The most populous races in Hoschton are White / Caucasian (2,574 | 83.1%), Hispanic or Latino (309 | 10.0%), and Two or more Races (274 | 8.8%).
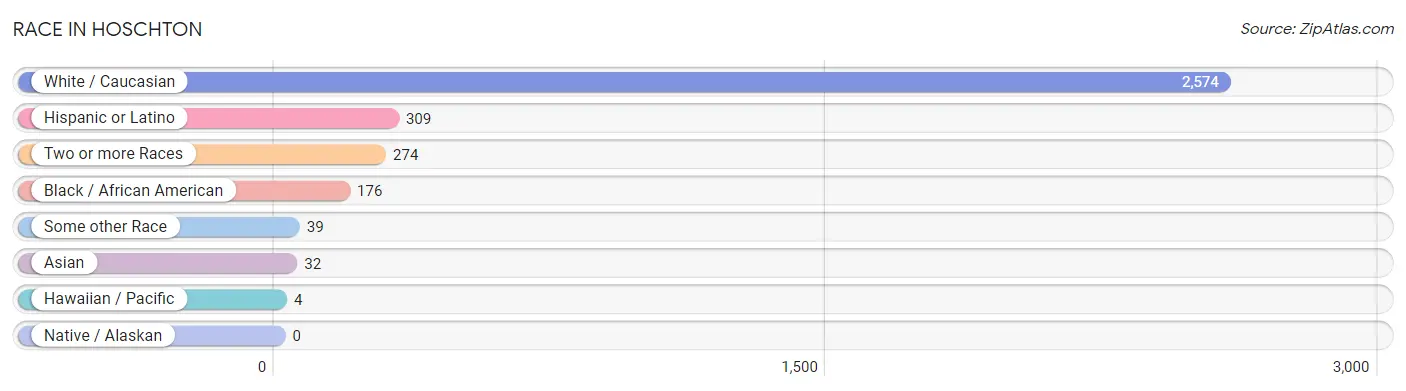
| Race | # Population | % Population |
| Asian | 32 | 1.0% |
| Black / African American | 176 | 5.7% |
| Hawaiian / Pacific | 4 | 0.1% |
| Hispanic or Latino | 309 | 10.0% |
| Native / Alaskan | 0 | 0.0% |
| White / Caucasian | 2,574 | 83.1% |
| Two or more Races | 274 | 8.8% |
| Some other Race | 39 | 1.3% |
| Total | 3,099 | 100.0% |
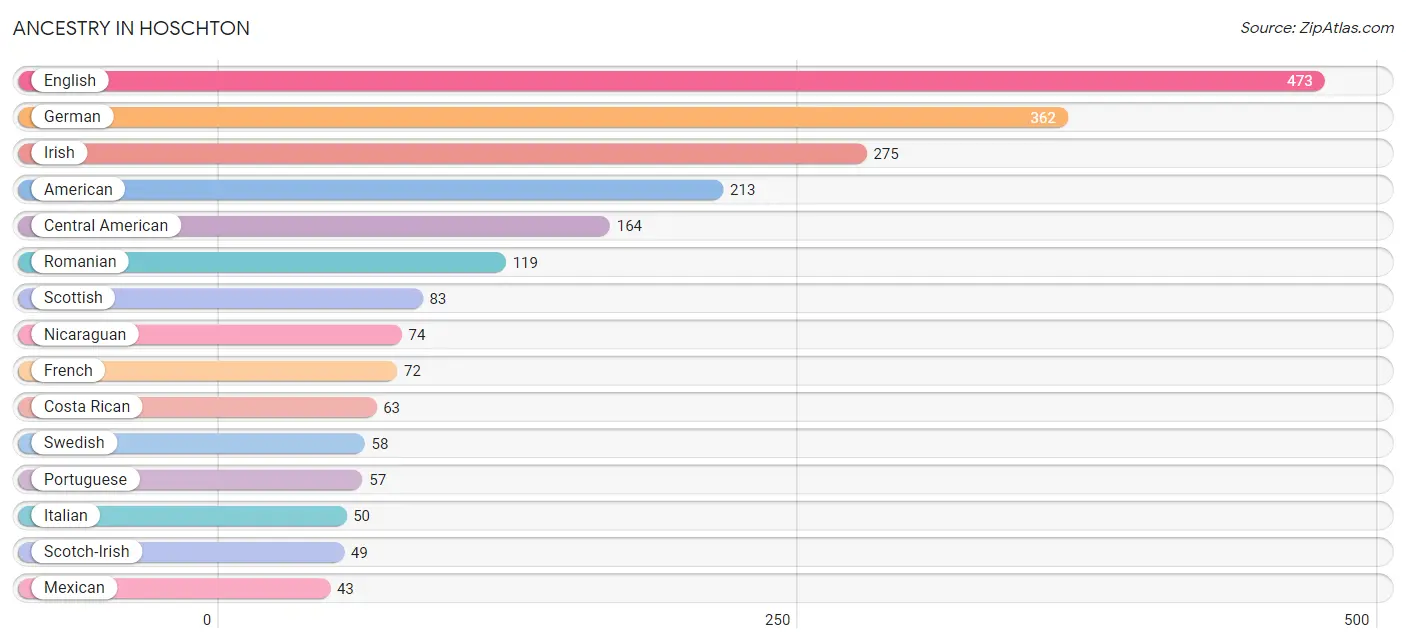
Ancestry in Hoschton
The most populous ancestries reported in Hoschton are English (473 | 15.3%), German (362 | 11.7%), Irish (275 | 8.9%), American (213 | 6.9%), and Central American (164 | 5.3%), together accounting for 48.0% of all Hoschton residents.
| Ancestry | # Population | % Population |
| African | 10 | 0.3% |
| American | 213 | 6.9% |
| Bangladeshi | 13 | 0.4% |
| Brazilian | 22 | 0.7% |
| British | 10 | 0.3% |
| Burmese | 19 | 0.6% |
| Central American | 164 | 5.3% |
| Cherokee | 6 | 0.2% |
| Colombian | 39 | 1.3% |
| Costa Rican | 63 | 2.0% |
| Cuban | 31 | 1.0% |
| Czechoslovakian | 3 | 0.1% |
| Dutch | 33 | 1.1% |
| Eastern European | 9 | 0.3% |
| English | 473 | 15.3% |
| European | 37 | 1.2% |
| French | 72 | 2.3% |
| French Canadian | 35 | 1.1% |
| German | 362 | 11.7% |
| Guamanian / Chamorro | 4 | 0.1% |
| Guatemalan | 4 | 0.1% |
| Indian (Asian) | 3 | 0.1% |
| Irish | 275 | 8.9% |
| Italian | 50 | 1.6% |
| Korean | 7 | 0.2% |
| Mexican | 43 | 1.4% |
| Nicaraguan | 74 | 2.4% |
| Norwegian | 19 | 0.6% |
| Portuguese | 57 | 1.8% |
| Romanian | 119 | 3.8% |
| Salvadoran | 23 | 0.7% |
| Scotch-Irish | 49 | 1.6% |
| Scottish | 83 | 2.7% |
| South American | 39 | 1.3% |
| Sri Lankan | 17 | 0.5% |
| Subsaharan African | 10 | 0.3% |
| Swedish | 58 | 1.9% |
| Swiss | 17 | 0.5% |
| Welsh | 12 | 0.4% | View All 39 Rows |
Immigrants in Hoschton
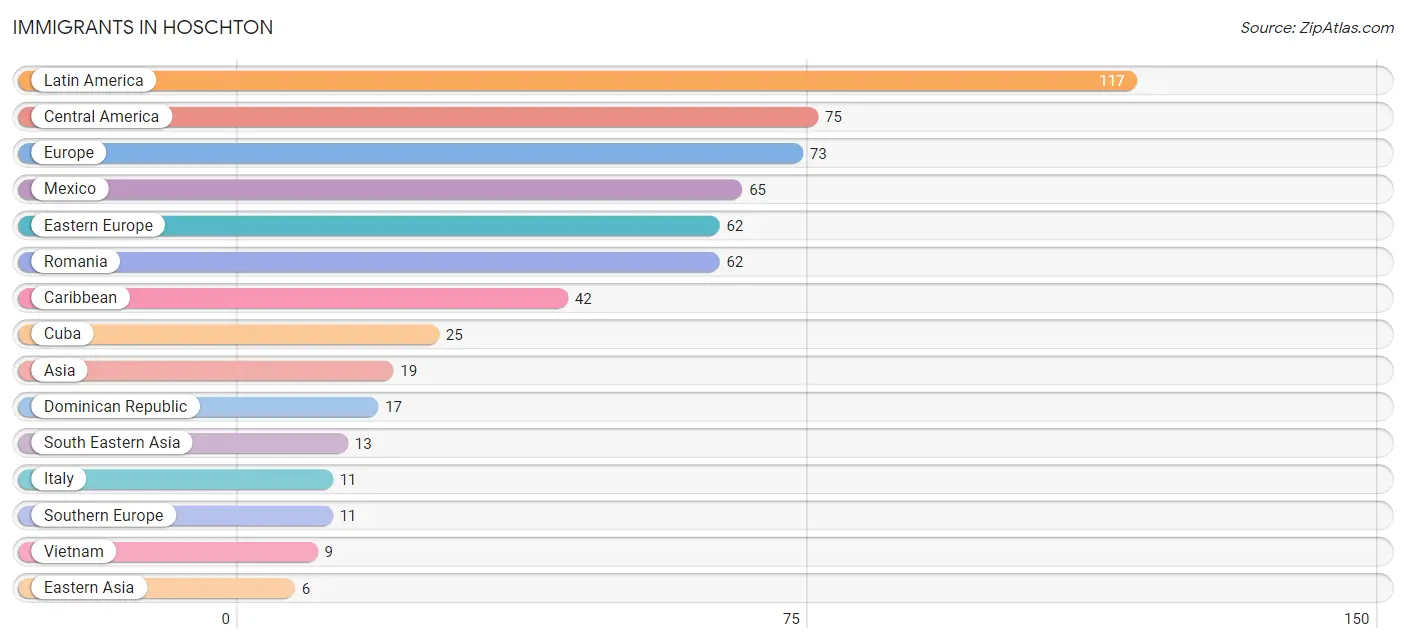
The most numerous immigrant groups reported in Hoschton came from Latin America (117 | 3.8%), Central America (75 | 2.4%), Europe (73 | 2.4%), Mexico (65 | 2.1%), and Eastern Europe (62 | 2.0%), together accounting for 12.7% of all Hoschton residents.
| Immigration Origin | # Population | % Population |
| Asia | 19 | 0.6% |
| Caribbean | 42 | 1.4% |
| Central America | 75 | 2.4% |
| China | 3 | 0.1% |
| Cuba | 25 | 0.8% |
| Dominican Republic | 17 | 0.5% |
| Eastern Asia | 6 | 0.2% |
| Eastern Europe | 62 | 2.0% |
| El Salvador | 6 | 0.2% |
| Europe | 73 | 2.4% |
| Guatemala | 4 | 0.1% |
| Italy | 11 | 0.4% |
| Korea | 3 | 0.1% |
| Laos | 4 | 0.1% |
| Latin America | 117 | 3.8% |
| Mexico | 65 | 2.1% |
| Romania | 62 | 2.0% |
| South Eastern Asia | 13 | 0.4% |
| Southern Europe | 11 | 0.4% |
| Vietnam | 9 | 0.3% | View All 20 Rows |
Sex and Age in Hoschton
Sex and Age in Hoschton
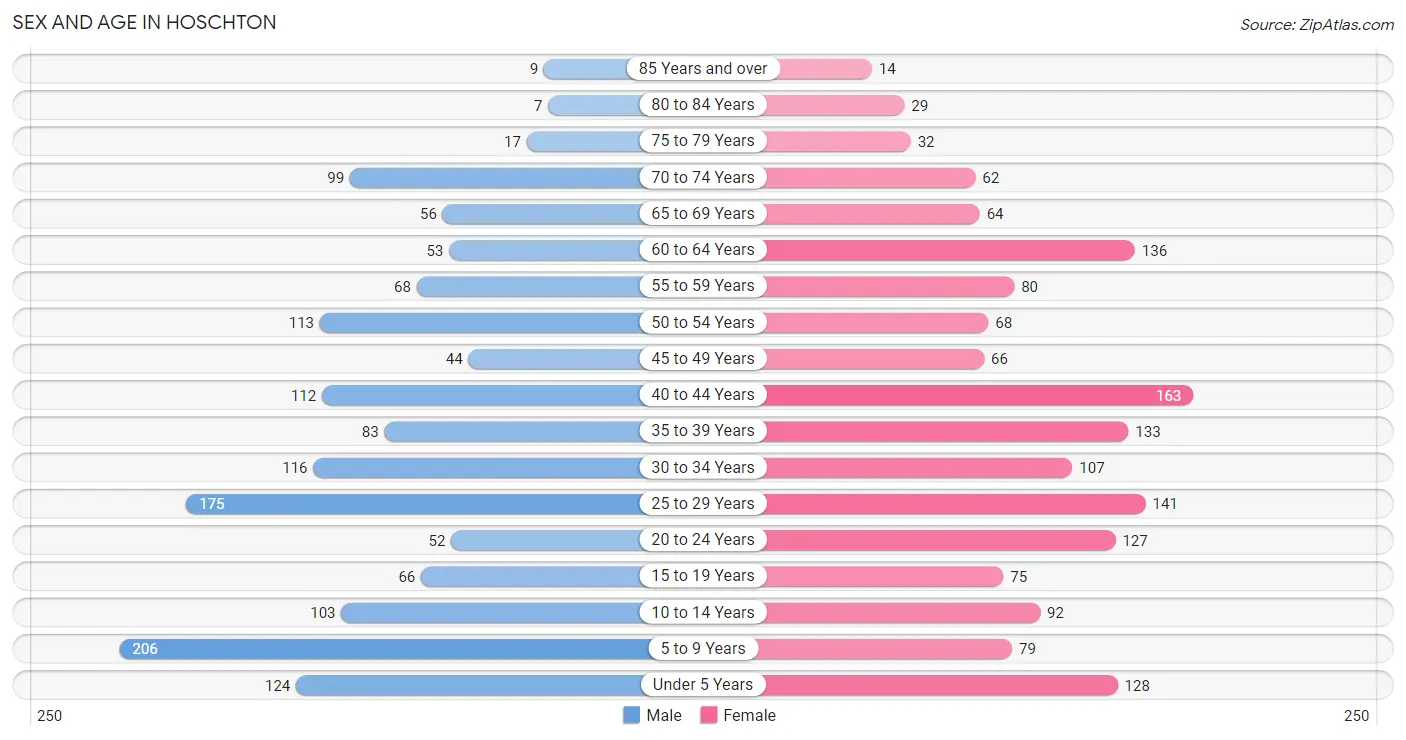
The most populous age groups in Hoschton are 5 to 9 Years (206 | 13.7%) for men and 40 to 44 Years (163 | 10.2%) for women.
| Age Bracket | Male | Female |
| Under 5 Years | 124 (8.3%) | 128 (8.0%) |
| 5 to 9 Years | 206 (13.7%) | 79 (5.0%) |
| 10 to 14 Years | 103 (6.9%) | 92 (5.8%) |
| 15 to 19 Years | 66 (4.4%) | 75 (4.7%) |
| 20 to 24 Years | 52 (3.5%) | 127 (8.0%) |
| 25 to 29 Years | 175 (11.6%) | 141 (8.8%) |
| 30 to 34 Years | 116 (7.7%) | 107 (6.7%) |
| 35 to 39 Years | 83 (5.5%) | 133 (8.3%) |
| 40 to 44 Years | 112 (7.4%) | 163 (10.2%) |
| 45 to 49 Years | 44 (2.9%) | 66 (4.1%) |
| 50 to 54 Years | 113 (7.5%) | 68 (4.3%) |
| 55 to 59 Years | 68 (4.5%) | 80 (5.0%) |
| 60 to 64 Years | 53 (3.5%) | 136 (8.5%) |
| 65 to 69 Years | 56 (3.7%) | 64 (4.0%) |
| 70 to 74 Years | 99 (6.6%) | 62 (3.9%) |
| 75 to 79 Years | 17 (1.1%) | 32 (2.0%) |
| 80 to 84 Years | 7 (0.5%) | 29 (1.8%) |
| 85 Years and over | 9 (0.6%) | 14 (0.9%) |
| Total | 1,503 (100.0%) | 1,596 (100.0%) |
Families and Households in Hoschton
Median Family Size in Hoschton
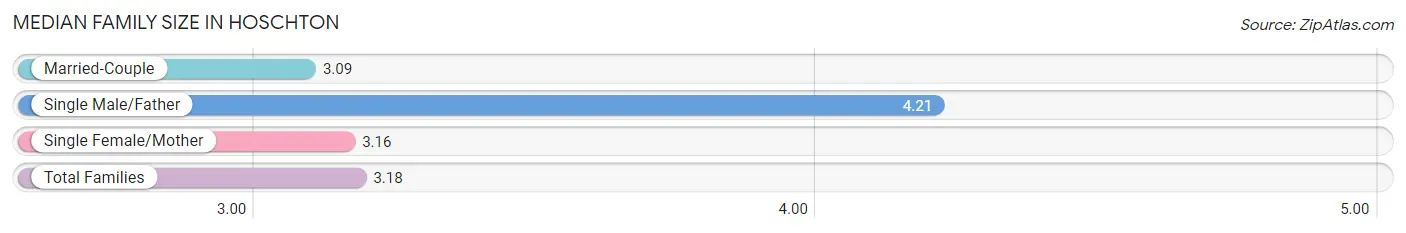
The median family size in Hoschton is 3.18 persons per family, with single male/father families (56 | 6.7%) accounting for the largest median family size of 4.21 persons per family. On the other hand, married-couple families (614 | 73.6%) represent the smallest median family size with 3.09 persons per family.
| Family Type | # Families | Family Size |
| Married-Couple | 614 (73.6%) | 3.09 |
| Single Male/Father | 56 (6.7%) | 4.21 |
| Single Female/Mother | 164 (19.7%) | 3.16 |
| Total Families | 834 (100.0%) | 3.18 |
Median Household Size in Hoschton
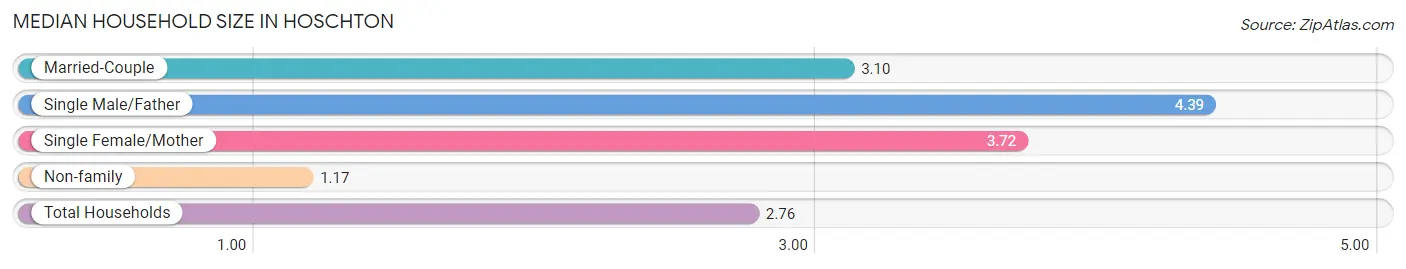
The median household size in Hoschton is 2.76 persons per household, with single male/father households (56 | 5.0%) accounting for the largest median household size of 4.39 persons per household. non-family households (290 | 25.8%) represent the smallest median household size with 1.17 persons per household.
| Household Type | # Households | Household Size |
| Married-Couple | 614 (54.6%) | 3.10 |
| Single Male/Father | 56 (5.0%) | 4.39 |
| Single Female/Mother | 164 (14.6%) | 3.72 |
| Non-family | 290 (25.8%) | 1.17 |
| Total Households | 1,124 (100.0%) | 2.76 |
Household Size by Marriage Status in Hoschton
Out of a total of 1,124 households in Hoschton, 834 (74.2%) are family households, while 290 (25.8%) are nonfamily households. The most numerous type of family households are 2-person households, comprising 372, and the most common type of nonfamily households are 1-person households, comprising 237.
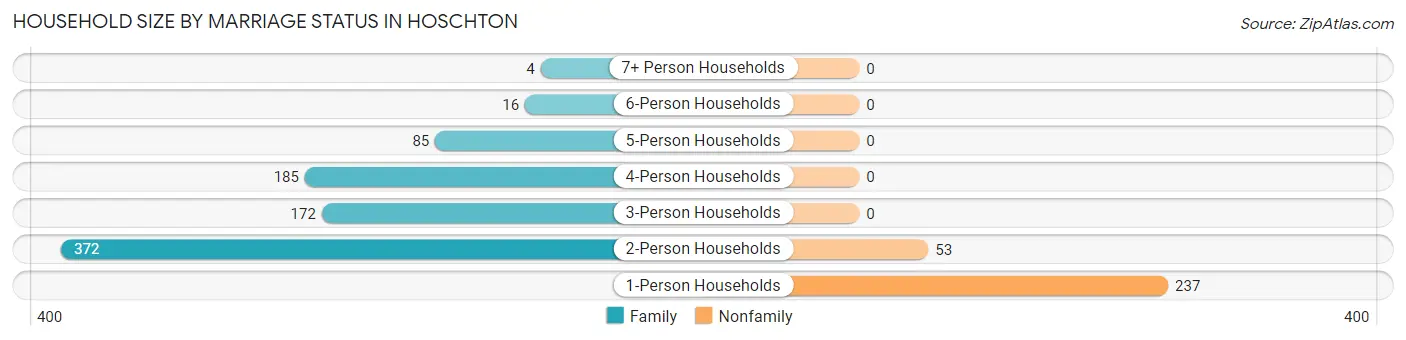
| Household Size | Family Households | Nonfamily Households |
| 1-Person Households | - | 237 (21.1%) |
| 2-Person Households | 372 (33.1%) | 53 (4.7%) |
| 3-Person Households | 172 (15.3%) | 0 (0.0%) |
| 4-Person Households | 185 (16.5%) | 0 (0.0%) |
| 5-Person Households | 85 (7.6%) | 0 (0.0%) |
| 6-Person Households | 16 (1.4%) | 0 (0.0%) |
| 7+ Person Households | 4 (0.4%) | 0 (0.0%) |
| Total | 834 (74.2%) | 290 (25.8%) |
Female Fertility in Hoschton
Fertility by Age in Hoschton
Average fertility rate in Hoschton is 107.0 births per 1,000 women. Women in the age bracket of 20 to 34 years have the highest fertility rate with 237.0 births per 1,000 women. Women in the age bracket of 20 to 34 years acount for 100.0% of all women with births.
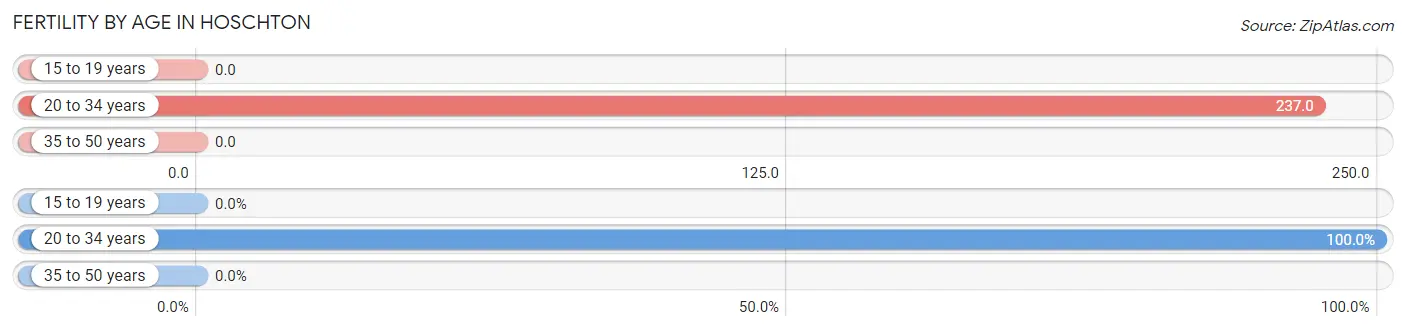
| Age Bracket | Women with Births | Births / 1,000 Women |
| 15 to 19 years | 0 (0.0%) | 0.0 |
| 20 to 34 years | 89 (100.0%) | 237.0 |
| 35 to 50 years | 0 (0.0%) | 0.0 |
| Total | 89 (100.0%) | 107.0 |
Fertility by Age by Marriage Status in Hoschton
20.2% of women with births (89) in Hoschton are married. The highest percentage of unmarried women with births falls into 20 to 34 years age bracket with 79.8% of them unmarried at the time of birth, while the lowest percentage of unmarried women with births belong to 20 to 34 years age bracket with 79.8% of them unmarried.
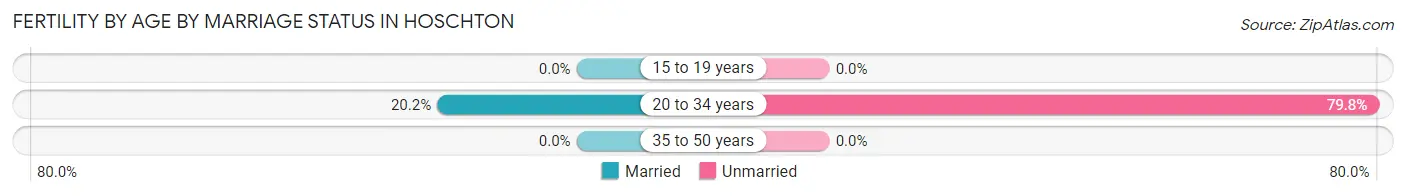
| Age Bracket | Married | Unmarried |
| 15 to 19 years | 0 (0.0%) | 0 (0.0%) |
| 20 to 34 years | 18 (20.2%) | 71 (79.8%) |
| 35 to 50 years | 0 (0.0%) | 0 (0.0%) |
| Total | 18 (20.2%) | 71 (79.8%) |
Fertility by Education in Hoschton
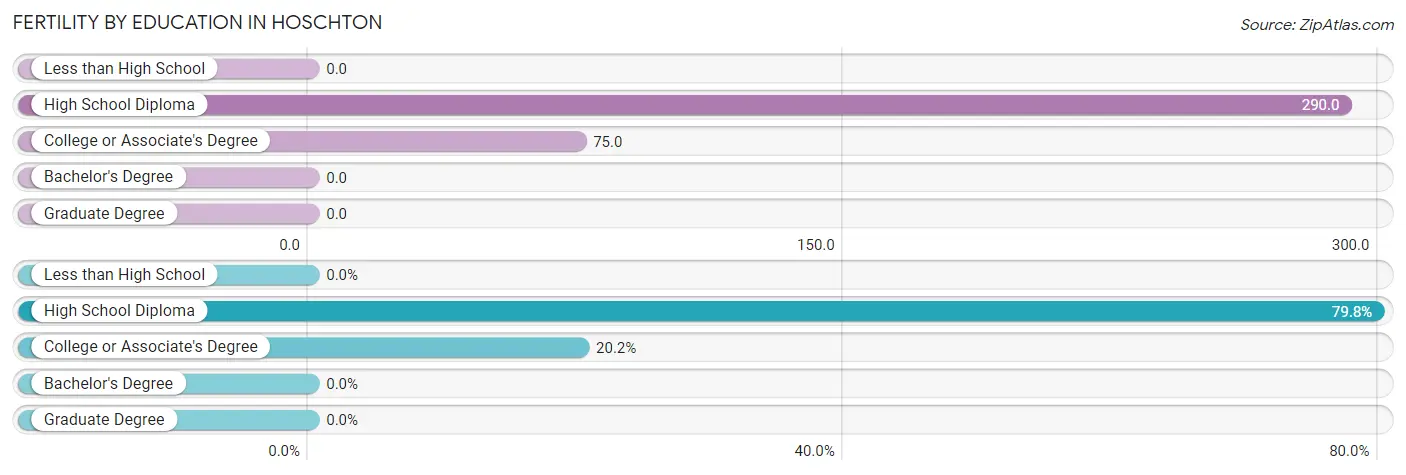
| Educational Attainment | Women with Births | Births / 1,000 Women |
| Less than High School | 0 (0.0%) | 0.0 |
| High School Diploma | 71 (79.8%) | 290.0 |
| College or Associate's Degree | 18 (20.2%) | 75.0 |
| Bachelor's Degree | 0 (0.0%) | 0.0 |
| Graduate Degree | 0 (0.0%) | 0.0 |
| Total | 89 (100.0%) | 107.0 |
Fertility by Education by Marriage Status in Hoschton
79.8% of women with births in Hoschton are unmarried. Women with the educational attainment of college or associate's degree are most likely to be married with 100.0% of them married at childbirth, while women with the educational attainment of high school diploma are least likely to be married with 100.0% of them unmarried at childbirth.
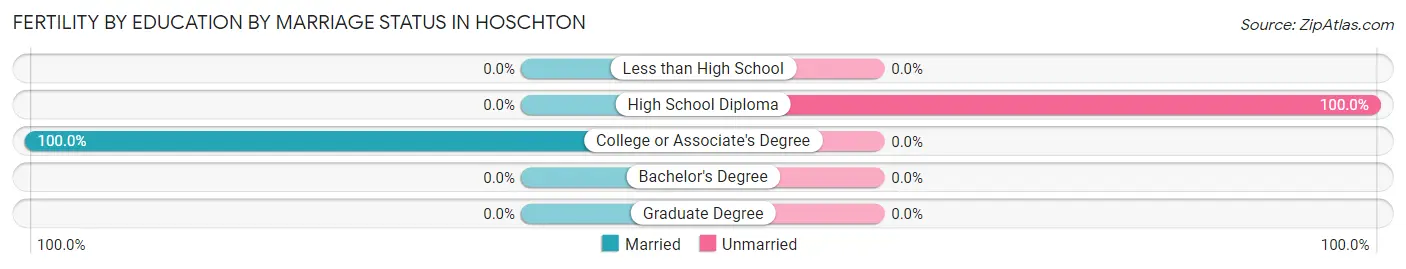
| Educational Attainment | Married | Unmarried |
| Less than High School | 0 (0.0%) | 0 (0.0%) |
| High School Diploma | 0 (0.0%) | 71 (100.0%) |
| College or Associate's Degree | 18 (100.0%) | 0 (0.0%) |
| Bachelor's Degree | 0 (0.0%) | 0 (0.0%) |
| Graduate Degree | 0 (0.0%) | 0 (0.0%) |
| Total | 18 (20.2%) | 71 (79.8%) |
Employment Characteristics in Hoschton
Employment by Class of Employer in Hoschton
Among the 1,634 employed individuals in Hoschton, private company employees (1,168 | 71.5%), local government employees (185 | 11.3%), and self-employed (not incorporated) (97 | 5.9%) make up the most common classes of employment.
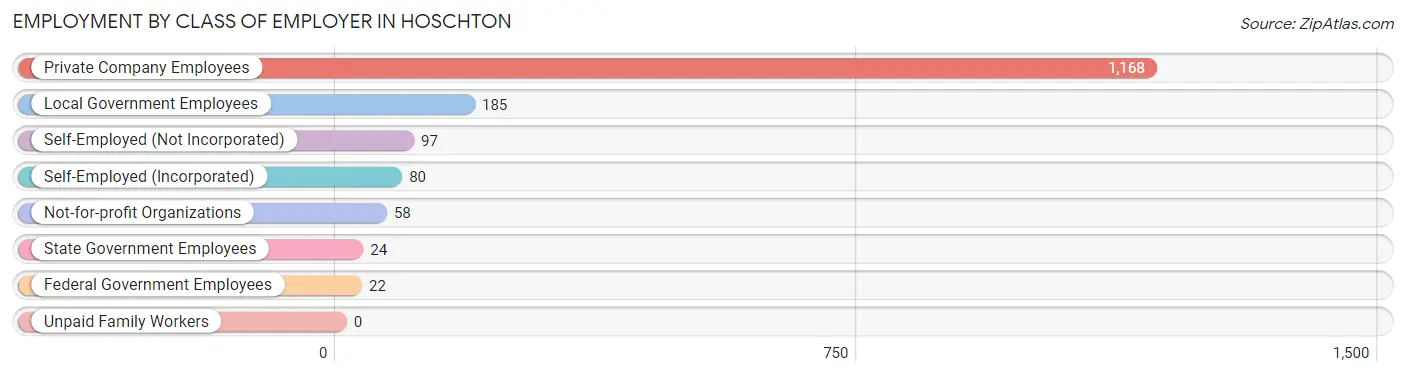
| Employer Class | # Employees | % Employees |
| Private Company Employees | 1,168 | 71.5% |
| Self-Employed (Incorporated) | 80 | 4.9% |
| Self-Employed (Not Incorporated) | 97 | 5.9% |
| Not-for-profit Organizations | 58 | 3.5% |
| Local Government Employees | 185 | 11.3% |
| State Government Employees | 24 | 1.5% |
| Federal Government Employees | 22 | 1.3% |
| Unpaid Family Workers | 0 | 0.0% |
| Total | 1,634 | 100.0% |
Employment Status by Age in Hoschton
According to the labor force statistics for Hoschton, out of the total population over 16 years of age (2,347), 70.3% or 1,650 individuals are in the labor force, with 1.0% or 16 of them unemployed. The age group with the highest labor force participation rate is 35 to 44 years, with 96.1% or 472 individuals in the labor force. Within the labor force, the 16 to 19 years age range has the highest percentage of unemployed individuals, with 15.4% or 12 of them being unemployed.
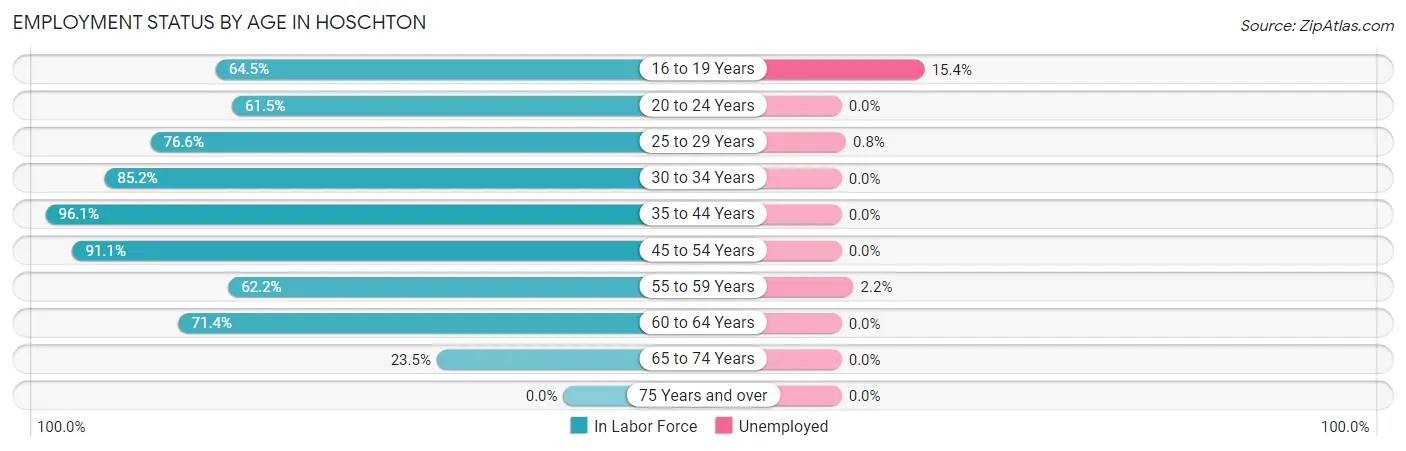
| Age Bracket | In Labor Force | Unemployed |
| 16 to 19 Years | 78 (64.5%) | 12 (15.4%) |
| 20 to 24 Years | 110 (61.5%) | 0 (0.0%) |
| 25 to 29 Years | 242 (76.6%) | 2 (0.8%) |
| 30 to 34 Years | 190 (85.2%) | 0 (0.0%) |
| 35 to 44 Years | 472 (96.1%) | 0 (0.0%) |
| 45 to 54 Years | 265 (91.1%) | 0 (0.0%) |
| 55 to 59 Years | 92 (62.2%) | 2 (2.2%) |
| 60 to 64 Years | 135 (71.4%) | 0 (0.0%) |
| 65 to 74 Years | 66 (23.5%) | 0 (0.0%) |
| 75 Years and over | 0 (0.0%) | 0 (0.0%) |
| Total | 1,650 (70.3%) | 16 (1.0%) |
Employment Status by Educational Attainment in Hoschton
According to labor force statistics for Hoschton, 84.2% of individuals (1,396) out of the total population between 25 and 64 years of age (1,658) are in the labor force, with 0.3% or 4 of them being unemployed. The group with the highest labor force participation rate are those with the educational attainment of bachelor's degree or higher, with 99.1% or 446 individuals in the labor force. Within the labor force, individuals with less than high school education have the highest percentage of unemployment, with 2.6% or 2 of them being unemployed.
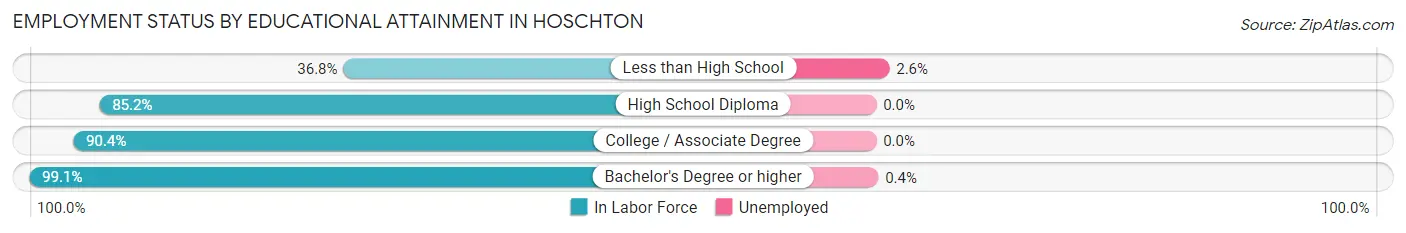
| Educational Attainment | In Labor Force | Unemployed |
| Less than High School | 78 (36.8%) | 6 (2.6%) |
| High School Diploma | 468 (85.2%) | 0 (0.0%) |
| College / Associate Degree | 404 (90.4%) | 0 (0.0%) |
| Bachelor's Degree or higher | 446 (99.1%) | 2 (0.4%) |
| Total | 1,396 (84.2%) | 5 (0.3%) |
Employment Occupations by Sex in Hoschton
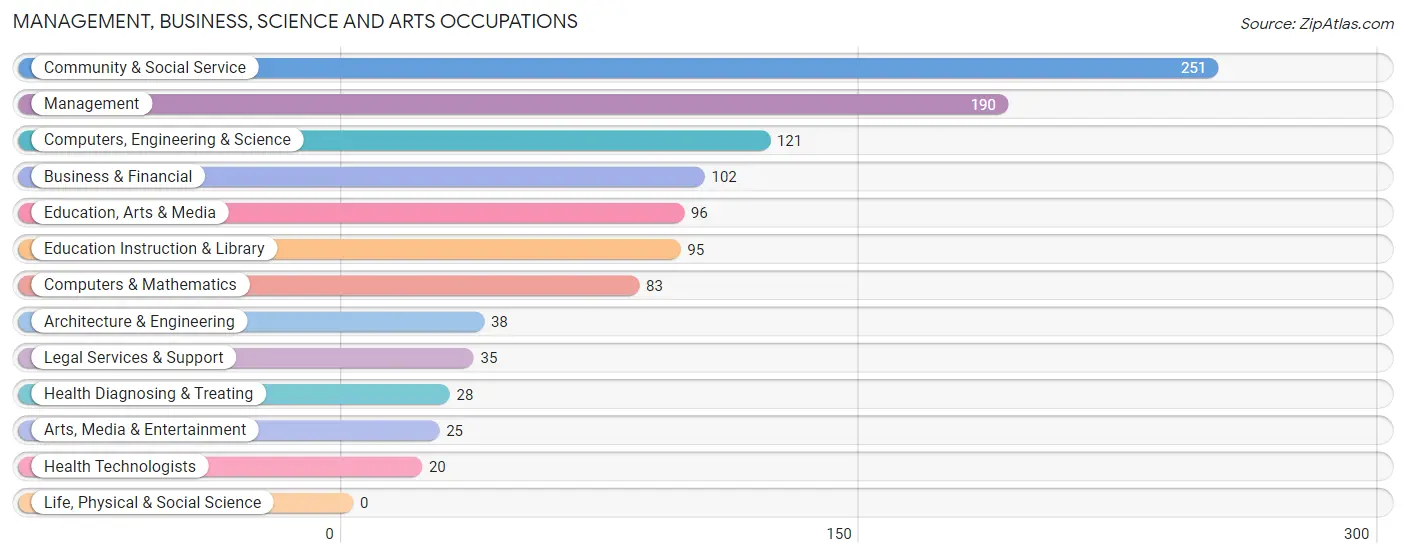
Management, Business, Science and Arts Occupations
The most common Management, Business, Science and Arts occupations in Hoschton are Community & Social Service (251 | 15.4%), Management (190 | 11.6%), Computers, Engineering & Science (121 | 7.4%), Business & Financial (102 | 6.2%), and Education, Arts & Media (96 | 5.9%).
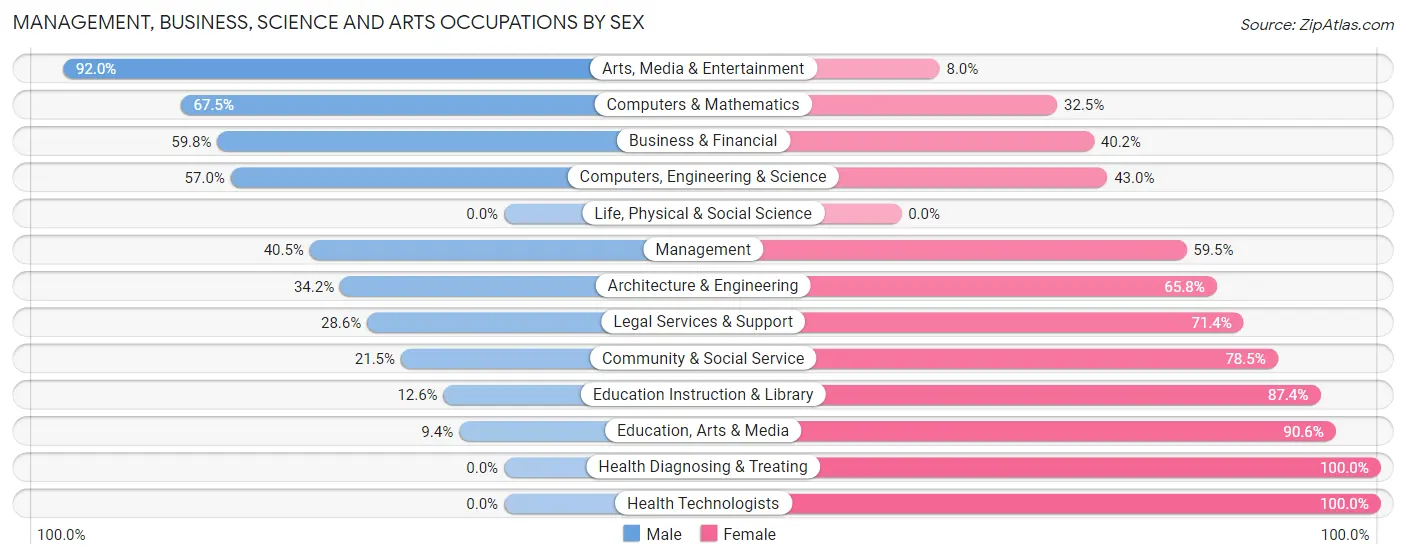
Management, Business, Science and Arts Occupations by Sex
Within the Management, Business, Science and Arts occupations in Hoschton, the most male-oriented occupations are Arts, Media & Entertainment (92.0%), Computers & Mathematics (67.5%), and Business & Financial (59.8%), while the most female-oriented occupations are Health Diagnosing & Treating (100.0%), Health Technologists (100.0%), and Education, Arts & Media (90.6%).
| Occupation | Male | Female |
| Management | 77 (40.5%) | 113 (59.5%) |
| Business & Financial | 61 (59.8%) | 41 (40.2%) |
| Computers, Engineering & Science | 69 (57.0%) | 52 (43.0%) |
| Computers & Mathematics | 56 (67.5%) | 27 (32.5%) |
| Architecture & Engineering | 13 (34.2%) | 25 (65.8%) |
| Life, Physical & Social Science | 0 (0.0%) | 0 (0.0%) |
| Community & Social Service | 54 (21.5%) | 197 (78.5%) |
| Education, Arts & Media | 9 (9.4%) | 87 (90.6%) |
| Legal Services & Support | 10 (28.6%) | 25 (71.4%) |
| Education Instruction & Library | 12 (12.6%) | 83 (87.4%) |
| Arts, Media & Entertainment | 23 (92.0%) | 2 (8.0%) |
| Health Diagnosing & Treating | 0 (0.0%) | 28 (100.0%) |
| Health Technologists | 0 (0.0%) | 20 (100.0%) |
| Total (Category) | 261 (37.7%) | 431 (62.3%) |
| Total (Overall) | 750 (45.9%) | 884 (54.1%) |
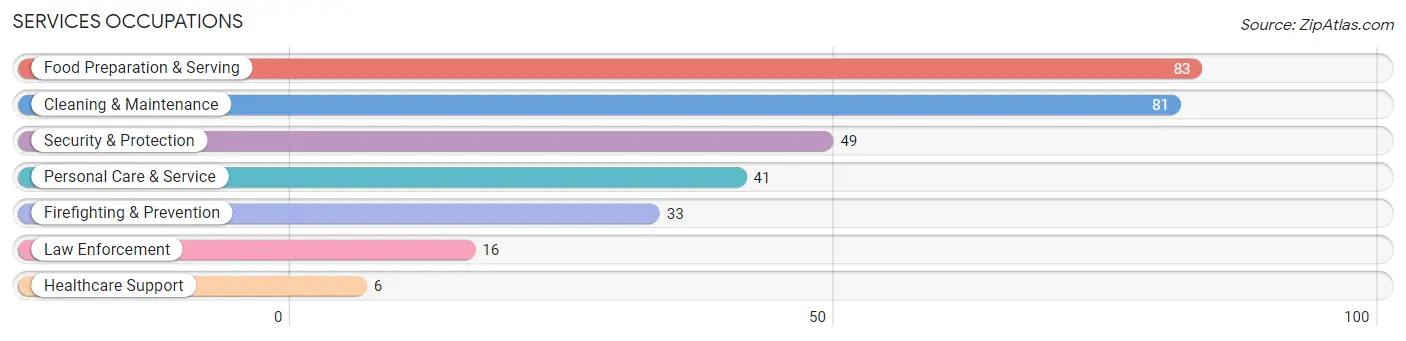
Services Occupations
The most common Services occupations in Hoschton are Food Preparation & Serving (83 | 5.1%), Cleaning & Maintenance (81 | 5.0%), Security & Protection (49 | 3.0%), Personal Care & Service (41 | 2.5%), and Firefighting & Prevention (33 | 2.0%).
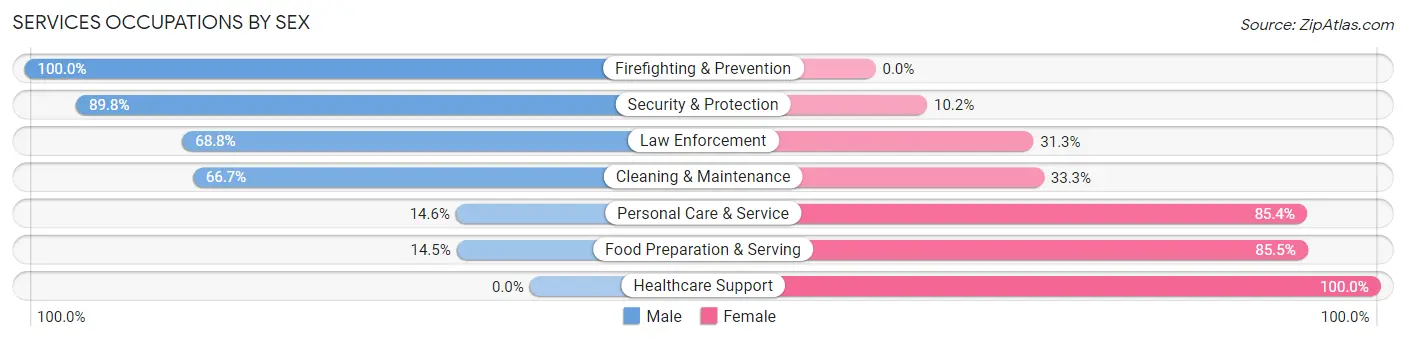
Services Occupations by Sex
Within the Services occupations in Hoschton, the most male-oriented occupations are Firefighting & Prevention (100.0%), Security & Protection (89.8%), and Law Enforcement (68.8%), while the most female-oriented occupations are Healthcare Support (100.0%), Food Preparation & Serving (85.5%), and Personal Care & Service (85.4%).
| Occupation | Male | Female |
| Healthcare Support | 0 (0.0%) | 6 (100.0%) |
| Security & Protection | 44 (89.8%) | 5 (10.2%) |
| Firefighting & Prevention | 33 (100.0%) | 0 (0.0%) |
| Law Enforcement | 11 (68.8%) | 5 (31.2%) |
| Food Preparation & Serving | 12 (14.5%) | 71 (85.5%) |
| Cleaning & Maintenance | 54 (66.7%) | 27 (33.3%) |
| Personal Care & Service | 6 (14.6%) | 35 (85.4%) |
| Total (Category) | 116 (44.6%) | 144 (55.4%) |
| Total (Overall) | 750 (45.9%) | 884 (54.1%) |
Sales and Office Occupations
The most common Sales and Office occupations in Hoschton are Office & Administration (256 | 15.7%), and Sales & Related (133 | 8.1%).
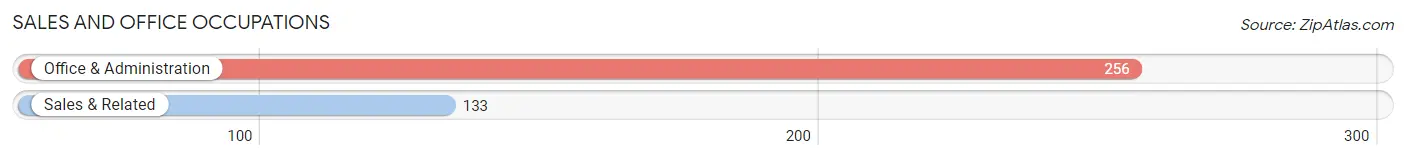
Sales and Office Occupations by Sex
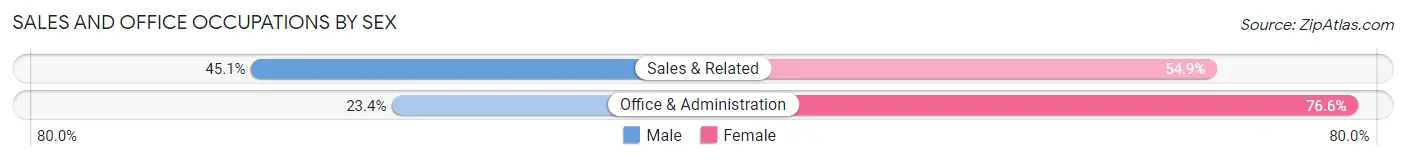
| Occupation | Male | Female |
| Sales & Related | 60 (45.1%) | 73 (54.9%) |
| Office & Administration | 60 (23.4%) | 196 (76.6%) |
| Total (Category) | 120 (30.8%) | 269 (69.2%) |
| Total (Overall) | 750 (45.9%) | 884 (54.1%) |
Natural Resources, Construction and Maintenance Occupations
The most common Natural Resources, Construction and Maintenance occupations in Hoschton are Construction & Extraction (67 | 4.1%), and Installation, Maintenance & Repair (18 | 1.1%).
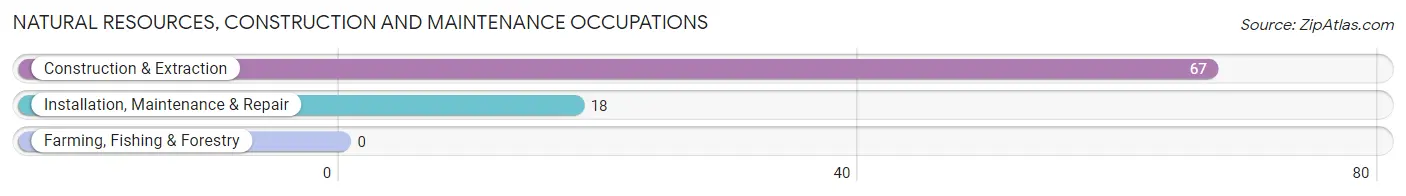
Natural Resources, Construction and Maintenance Occupations by Sex
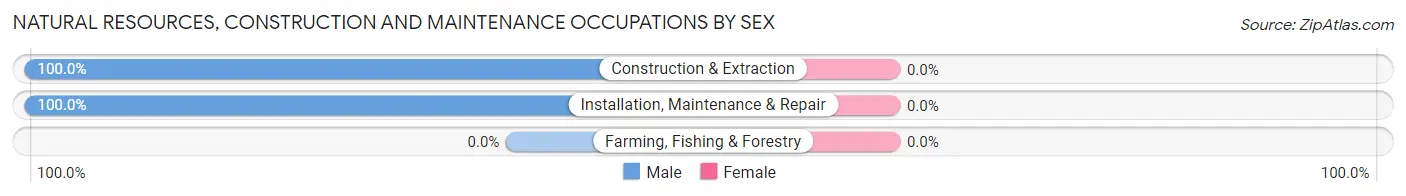
| Occupation | Male | Female |
| Farming, Fishing & Forestry | 0 (0.0%) | 0 (0.0%) |
| Construction & Extraction | 67 (100.0%) | 0 (0.0%) |
| Installation, Maintenance & Repair | 18 (100.0%) | 0 (0.0%) |
| Total (Category) | 85 (100.0%) | 0 (0.0%) |
| Total (Overall) | 750 (45.9%) | 884 (54.1%) |
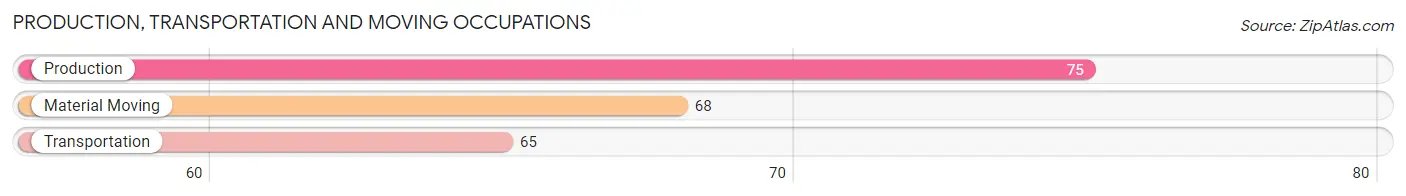
Production, Transportation and Moving Occupations
The most common Production, Transportation and Moving occupations in Hoschton are Production (75 | 4.6%), Material Moving (68 | 4.2%), and Transportation (65 | 4.0%).
Production, Transportation and Moving Occupations by Sex
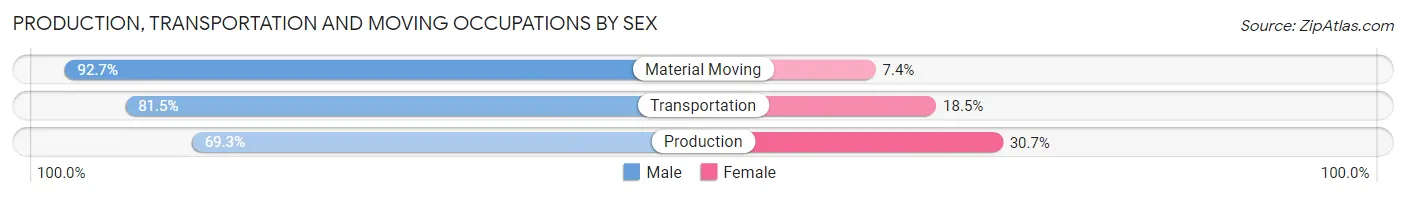
| Occupation | Male | Female |
| Production | 52 (69.3%) | 23 (30.7%) |
| Transportation | 53 (81.5%) | 12 (18.5%) |
| Material Moving | 63 (92.6%) | 5 (7.3%) |
| Total (Category) | 168 (80.8%) | 40 (19.2%) |
| Total (Overall) | 750 (45.9%) | 884 (54.1%) |
Employment Industries by Sex in Hoschton
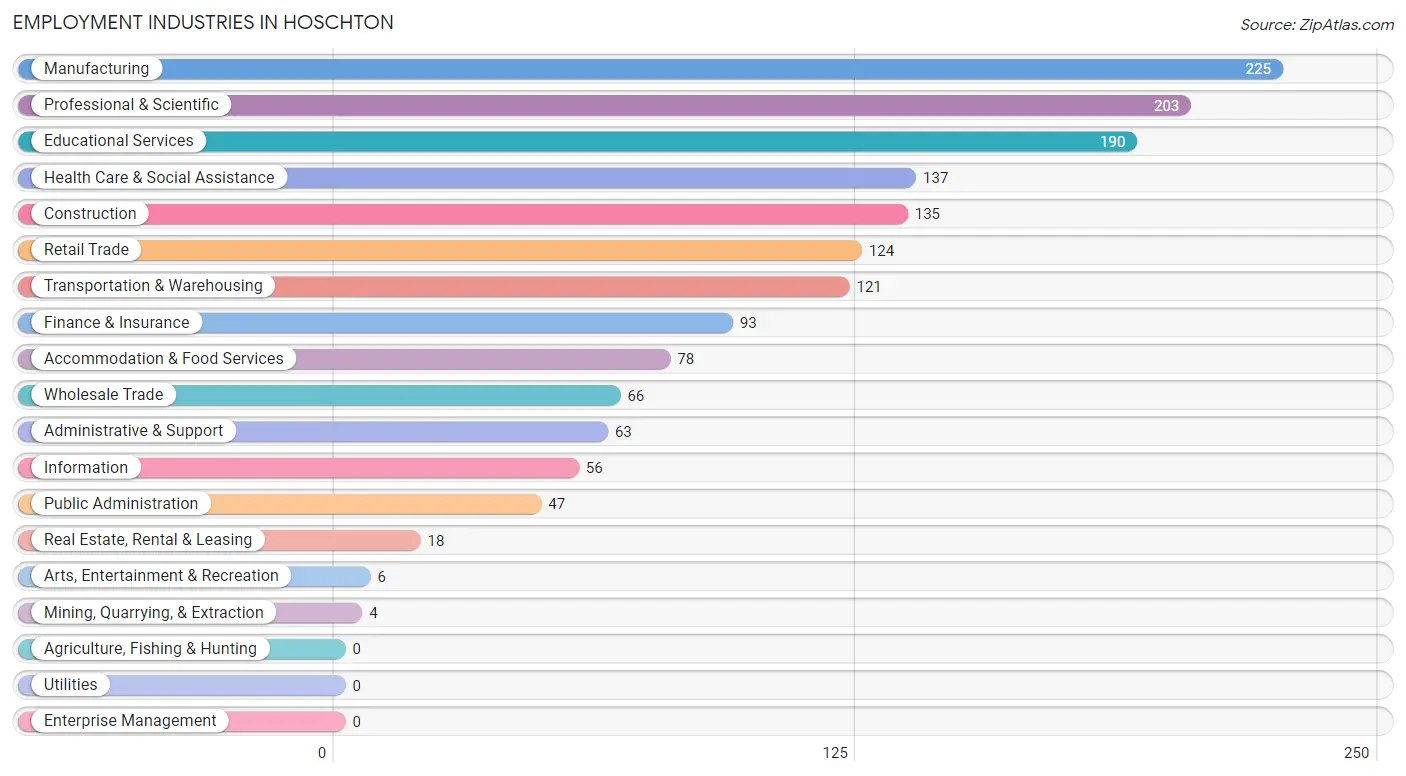
Employment Industries in Hoschton
The major employment industries in Hoschton include Manufacturing (225 | 13.8%), Professional & Scientific (203 | 12.4%), Educational Services (190 | 11.6%), Health Care & Social Assistance (137 | 8.4%), and Construction (135 | 8.3%).
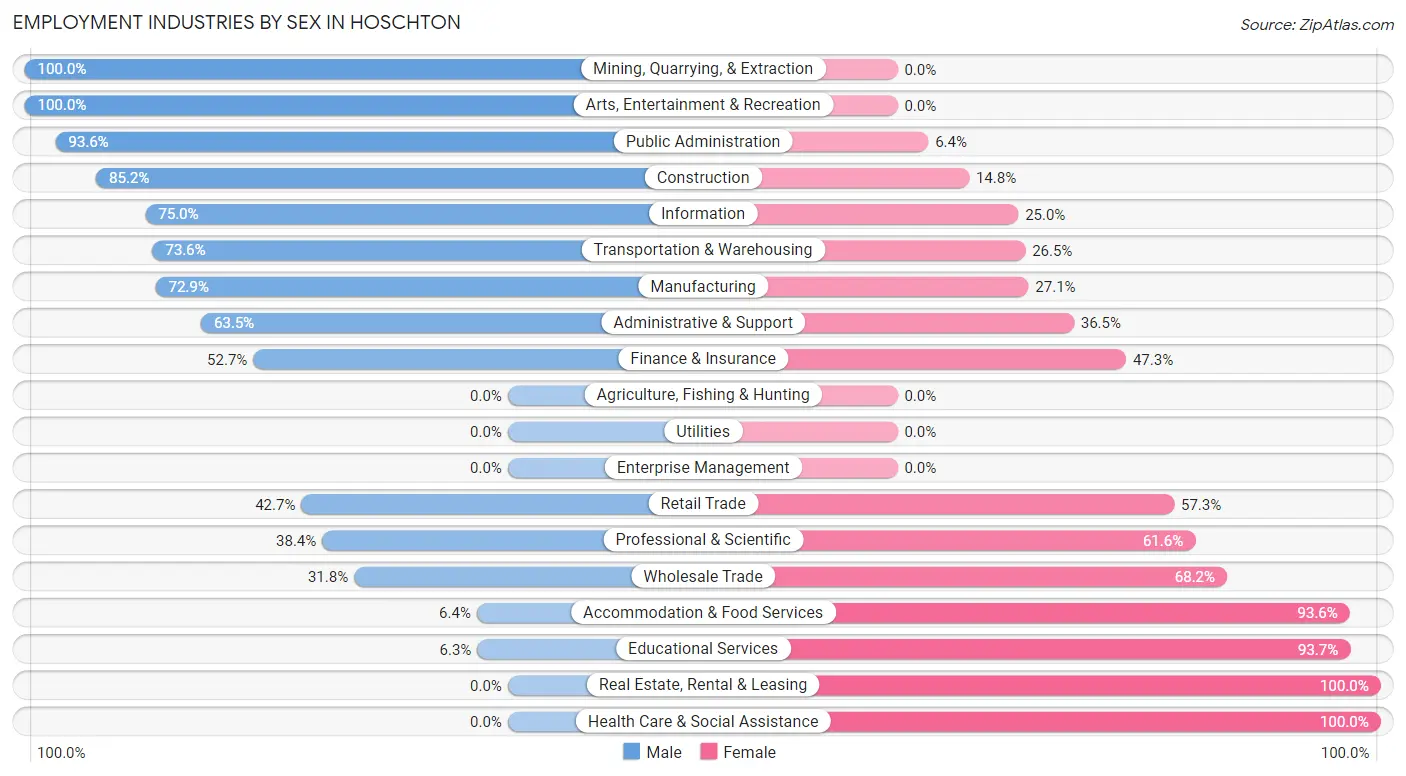
Employment Industries by Sex in Hoschton
The Hoschton industries that see more men than women are Mining, Quarrying, & Extraction (100.0%), Arts, Entertainment & Recreation (100.0%), and Public Administration (93.6%), whereas the industries that tend to have a higher number of women are Real Estate, Rental & Leasing (100.0%), Health Care & Social Assistance (100.0%), and Educational Services (93.7%).
| Industry | Male | Female |
| Agriculture, Fishing & Hunting | 0 (0.0%) | 0 (0.0%) |
| Mining, Quarrying, & Extraction | 4 (100.0%) | 0 (0.0%) |
| Construction | 115 (85.2%) | 20 (14.8%) |
| Manufacturing | 164 (72.9%) | 61 (27.1%) |
| Wholesale Trade | 21 (31.8%) | 45 (68.2%) |
| Retail Trade | 53 (42.7%) | 71 (57.3%) |
| Transportation & Warehousing | 89 (73.6%) | 32 (26.5%) |
| Utilities | 0 (0.0%) | 0 (0.0%) |
| Information | 42 (75.0%) | 14 (25.0%) |
| Finance & Insurance | 49 (52.7%) | 44 (47.3%) |
| Real Estate, Rental & Leasing | 0 (0.0%) | 18 (100.0%) |
| Professional & Scientific | 78 (38.4%) | 125 (61.6%) |
| Enterprise Management | 0 (0.0%) | 0 (0.0%) |
| Administrative & Support | 40 (63.5%) | 23 (36.5%) |
| Educational Services | 12 (6.3%) | 178 (93.7%) |
| Health Care & Social Assistance | 0 (0.0%) | 137 (100.0%) |
| Arts, Entertainment & Recreation | 6 (100.0%) | 0 (0.0%) |
| Accommodation & Food Services | 5 (6.4%) | 73 (93.6%) |
| Public Administration | 44 (93.6%) | 3 (6.4%) |
| Total | 750 (45.9%) | 884 (54.1%) |
Education in Hoschton
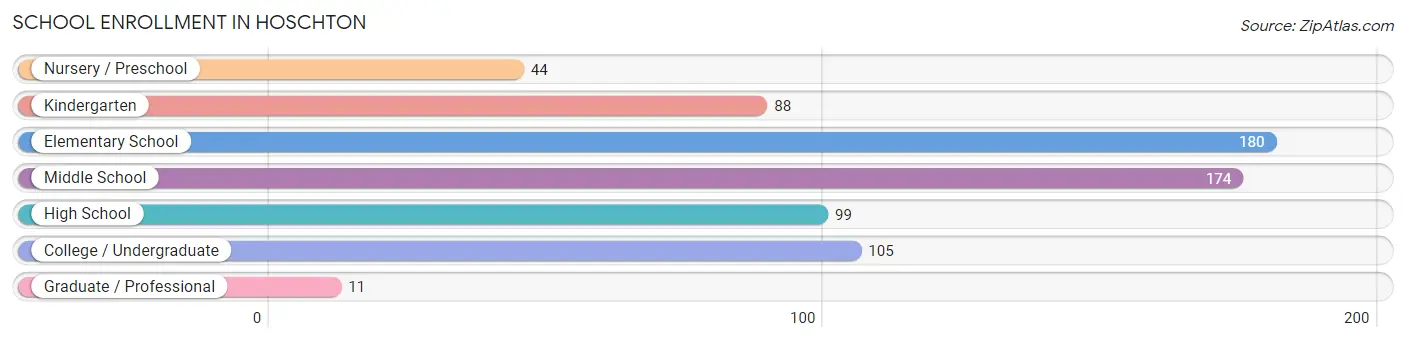
School Enrollment in Hoschton
The most common levels of schooling among the 701 students in Hoschton are elementary school (180 | 25.7%), middle school (174 | 24.8%), and college / undergraduate (105 | 15.0%).
| School Level | # Students | % Students |
| Nursery / Preschool | 44 | 6.3% |
| Kindergarten | 88 | 12.6% |
| Elementary School | 180 | 25.7% |
| Middle School | 174 | 24.8% |
| High School | 99 | 14.1% |
| College / Undergraduate | 105 | 15.0% |
| Graduate / Professional | 11 | 1.6% |
| Total | 701 | 100.0% |
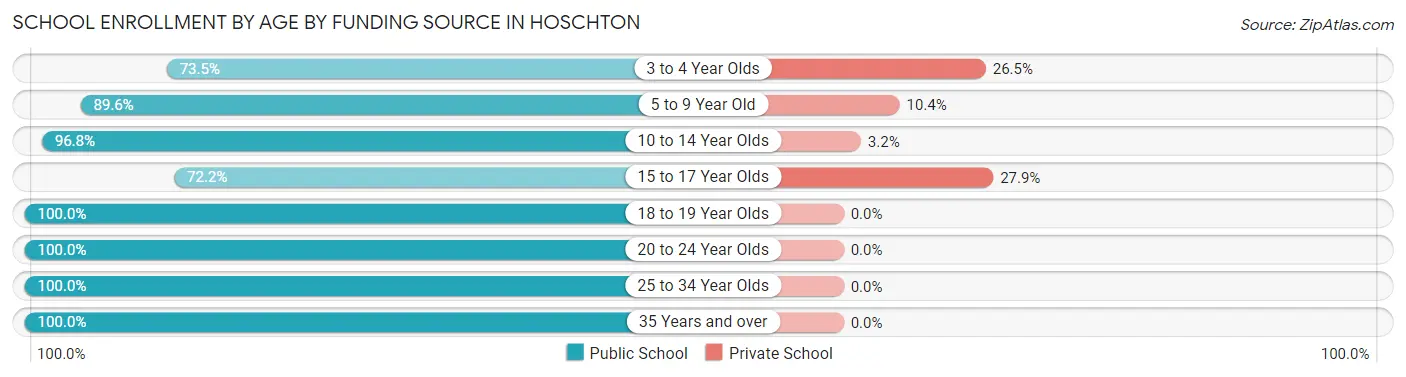
School Enrollment by Age by Funding Source in Hoschton
Out of a total of 701 students who are enrolled in schools in Hoschton, 65 (9.3%) attend a private institution, while the remaining 636 (90.7%) are enrolled in public schools. The age group of 15 to 17 year olds has the highest likelihood of being enrolled in private schools, with 22 (27.9% in the age bracket) enrolled. Conversely, the age group of 18 to 19 year olds has the lowest likelihood of being enrolled in a private school, with 54 (100.0% in the age bracket) attending a public institution.
| Age Bracket | Public School | Private School |
| 3 to 4 Year Olds | 25 (73.5%) | 9 (26.5%) |
| 5 to 9 Year Old | 241 (89.6%) | 28 (10.4%) |
| 10 to 14 Year Olds | 181 (96.8%) | 6 (3.2%) |
| 15 to 17 Year Olds | 57 (72.2%) | 22 (27.9%) |
| 18 to 19 Year Olds | 54 (100.0%) | 0 (0.0%) |
| 20 to 24 Year Olds | 46 (100.0%) | 0 (0.0%) |
| 25 to 34 Year Olds | 20 (100.0%) | 0 (0.0%) |
| 35 Years and over | 12 (100.0%) | 0 (0.0%) |
| Total | 636 (90.7%) | 65 (9.3%) |
Educational Attainment by Field of Study in Hoschton
Education (157 | 21.0%), social sciences (112 | 15.0%), business (107 | 14.3%), arts & humanities (96 | 12.9%), and science & technology (78 | 10.4%) are the most common fields of study among 747 individuals in Hoschton who have obtained a bachelor's degree or higher.
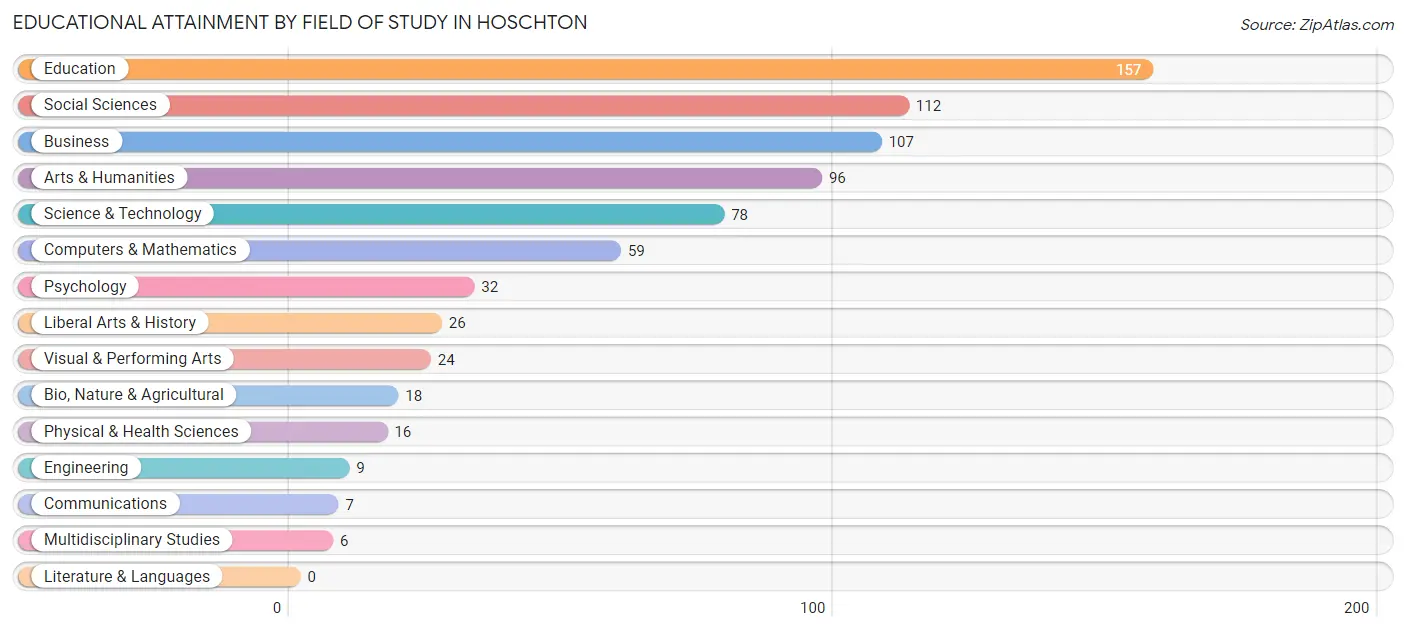
| Field of Study | # Graduates | % Graduates |
| Computers & Mathematics | 59 | 7.9% |
| Bio, Nature & Agricultural | 18 | 2.4% |
| Physical & Health Sciences | 16 | 2.1% |
| Psychology | 32 | 4.3% |
| Social Sciences | 112 | 15.0% |
| Engineering | 9 | 1.2% |
| Multidisciplinary Studies | 6 | 0.8% |
| Science & Technology | 78 | 10.4% |
| Business | 107 | 14.3% |
| Education | 157 | 21.0% |
| Literature & Languages | 0 | 0.0% |
| Liberal Arts & History | 26 | 3.5% |
| Visual & Performing Arts | 24 | 3.2% |
| Communications | 7 | 0.9% |
| Arts & Humanities | 96 | 12.9% |
| Total | 747 | 100.0% |
Transportation & Commute in Hoschton
Vehicle Availability by Sex in Hoschton
The most prevalent vehicle ownership categories in Hoschton are males with 2 vehicles (493, accounting for 65.7%) and females with 2 vehicles (492, making up 55.8%).
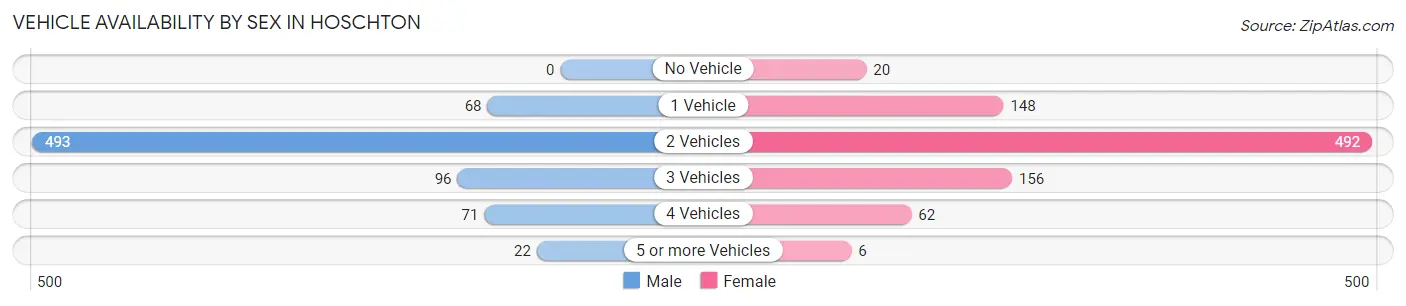
| Vehicles Available | Male | Female |
| No Vehicle | 0 (0.0%) | 20 (2.3%) |
| 1 Vehicle | 68 (9.1%) | 148 (16.7%) |
| 2 Vehicles | 493 (65.7%) | 492 (55.7%) |
| 3 Vehicles | 96 (12.8%) | 156 (17.6%) |
| 4 Vehicles | 71 (9.5%) | 62 (7.0%) |
| 5 or more Vehicles | 22 (2.9%) | 6 (0.7%) |
| Total | 750 (100.0%) | 884 (100.0%) |
Commute Time in Hoschton
The most frequently occuring commute durations in Hoschton are 30 to 34 minutes (282 commuters, 19.5%), 45 to 59 minutes (230 commuters, 15.9%), and 60 to 89 minutes (203 commuters, 14.1%).
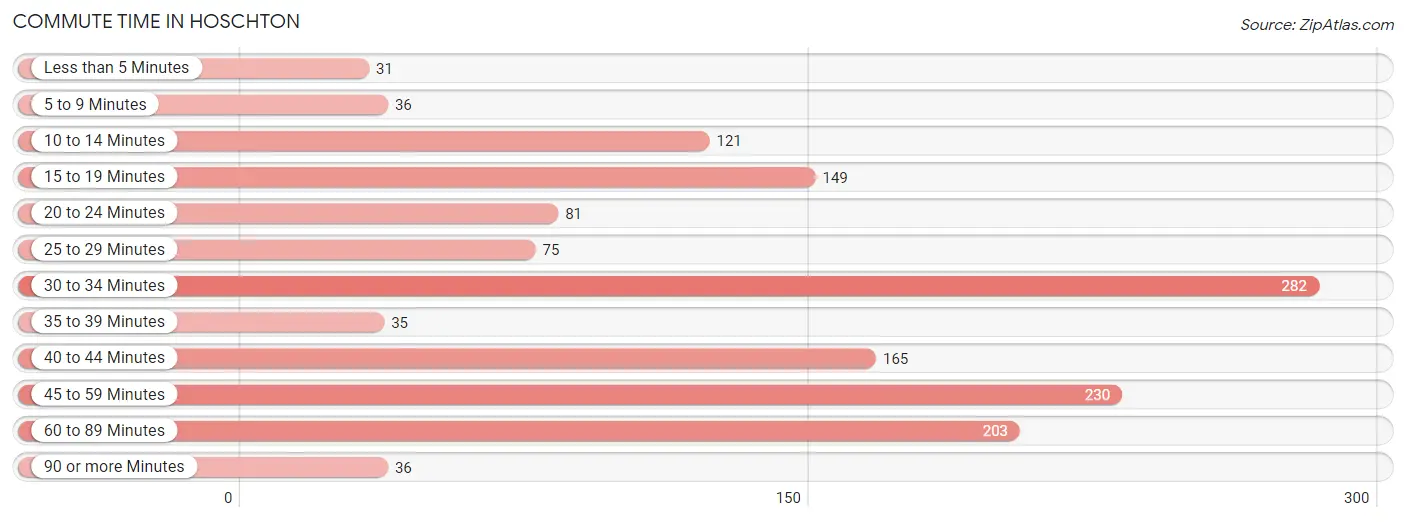
| Commute Time | # Commuters | % Commuters |
| Less than 5 Minutes | 31 | 2.1% |
| 5 to 9 Minutes | 36 | 2.5% |
| 10 to 14 Minutes | 121 | 8.4% |
| 15 to 19 Minutes | 149 | 10.3% |
| 20 to 24 Minutes | 81 | 5.6% |
| 25 to 29 Minutes | 75 | 5.2% |
| 30 to 34 Minutes | 282 | 19.5% |
| 35 to 39 Minutes | 35 | 2.4% |
| 40 to 44 Minutes | 165 | 11.4% |
| 45 to 59 Minutes | 230 | 15.9% |
| 60 to 89 Minutes | 203 | 14.1% |
| 90 or more Minutes | 36 | 2.5% |
Commute Time by Sex in Hoschton
The most common commute times in Hoschton are 30 to 34 minutes (133 commuters, 19.3%) for males and 30 to 34 minutes (149 commuters, 19.8%) for females.
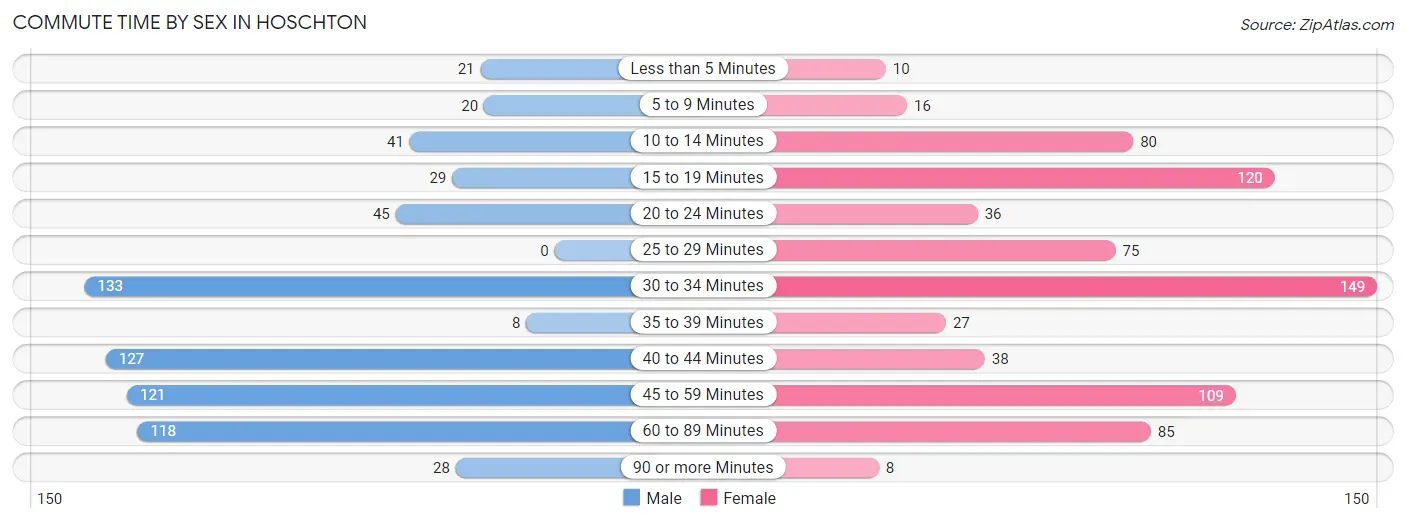
| Commute Time | Male | Female |
| Less than 5 Minutes | 21 (3.0%) | 10 (1.3%) |
| 5 to 9 Minutes | 20 (2.9%) | 16 (2.1%) |
| 10 to 14 Minutes | 41 (5.9%) | 80 (10.6%) |
| 15 to 19 Minutes | 29 (4.2%) | 120 (15.9%) |
| 20 to 24 Minutes | 45 (6.5%) | 36 (4.8%) |
| 25 to 29 Minutes | 0 (0.0%) | 75 (10.0%) |
| 30 to 34 Minutes | 133 (19.3%) | 149 (19.8%) |
| 35 to 39 Minutes | 8 (1.2%) | 27 (3.6%) |
| 40 to 44 Minutes | 127 (18.4%) | 38 (5.1%) |
| 45 to 59 Minutes | 121 (17.5%) | 109 (14.5%) |
| 60 to 89 Minutes | 118 (17.1%) | 85 (11.3%) |
| 90 or more Minutes | 28 (4.1%) | 8 (1.1%) |
Time of Departure to Work by Sex in Hoschton
The most frequent times of departure to work in Hoschton are 6:30 AM to 6:59 AM (116, 16.8%) for males and 7:00 AM to 7:29 AM (126, 16.7%) for females.
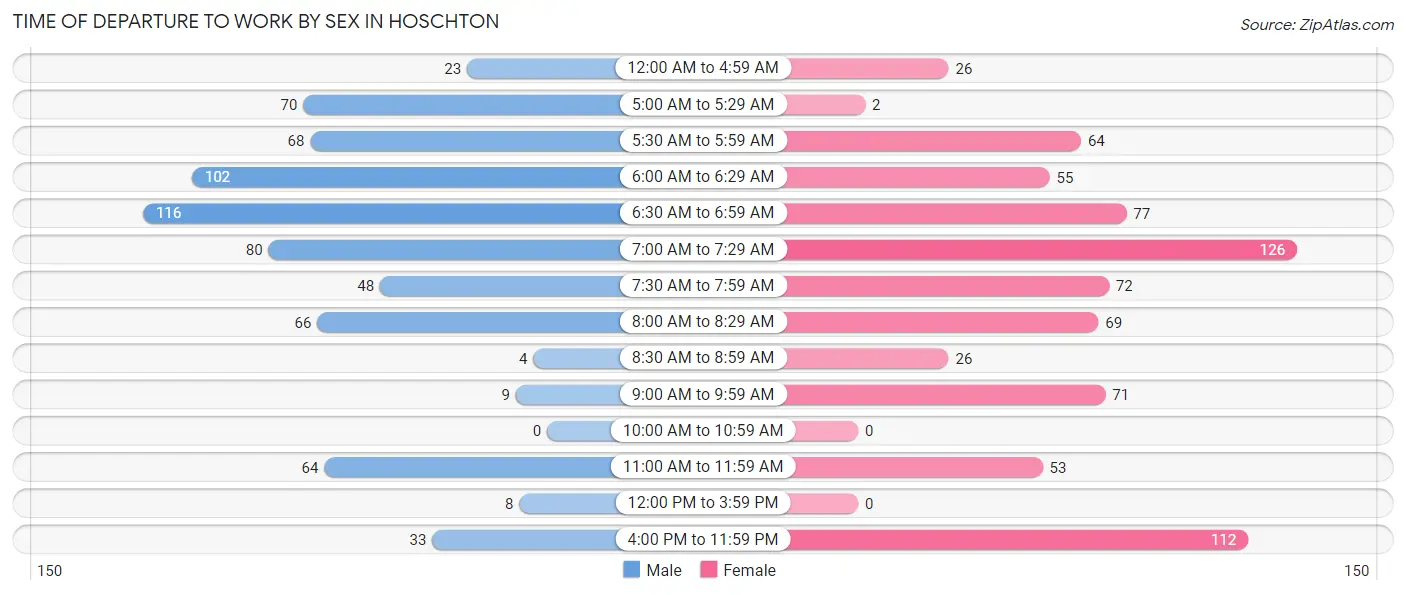
| Time of Departure | Male | Female |
| 12:00 AM to 4:59 AM | 23 (3.3%) | 26 (3.5%) |
| 5:00 AM to 5:29 AM | 70 (10.1%) | 2 (0.3%) |
| 5:30 AM to 5:59 AM | 68 (9.8%) | 64 (8.5%) |
| 6:00 AM to 6:29 AM | 102 (14.8%) | 55 (7.3%) |
| 6:30 AM to 6:59 AM | 116 (16.8%) | 77 (10.2%) |
| 7:00 AM to 7:29 AM | 80 (11.6%) | 126 (16.7%) |
| 7:30 AM to 7:59 AM | 48 (7.0%) | 72 (9.6%) |
| 8:00 AM to 8:29 AM | 66 (9.6%) | 69 (9.2%) |
| 8:30 AM to 8:59 AM | 4 (0.6%) | 26 (3.5%) |
| 9:00 AM to 9:59 AM | 9 (1.3%) | 71 (9.4%) |
| 10:00 AM to 10:59 AM | 0 (0.0%) | 0 (0.0%) |
| 11:00 AM to 11:59 AM | 64 (9.3%) | 53 (7.0%) |
| 12:00 PM to 3:59 PM | 8 (1.2%) | 0 (0.0%) |
| 4:00 PM to 11:59 PM | 33 (4.8%) | 112 (14.9%) |
| Total | 691 (100.0%) | 753 (100.0%) |
Housing Occupancy in Hoschton
Occupancy by Ownership in Hoschton
Of the total 1,124 dwellings in Hoschton, owner-occupied units account for 892 (79.4%), while renter-occupied units make up 232 (20.6%).
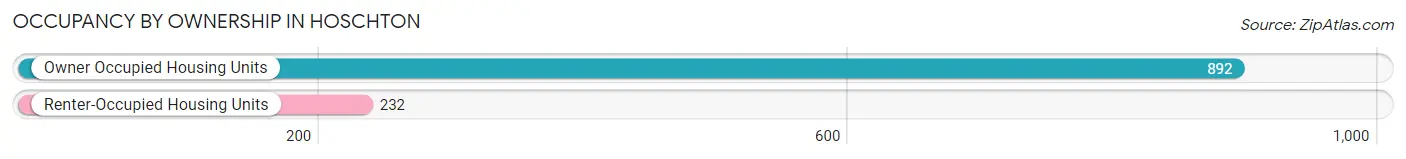
| Occupancy | # Housing Units | % Housing Units |
| Owner Occupied Housing Units | 892 | 79.4% |
| Renter-Occupied Housing Units | 232 | 20.6% |
| Total Occupied Housing Units | 1,124 | 100.0% |
Occupancy by Household Size in Hoschton
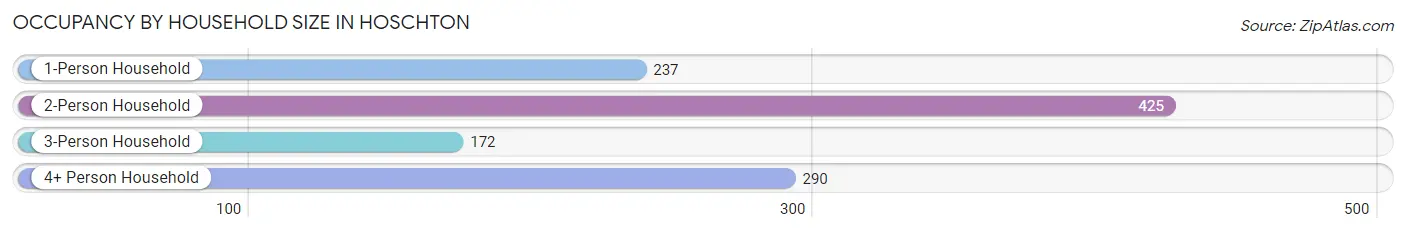
| Household Size | # Housing Units | % Housing Units |
| 1-Person Household | 237 | 21.1% |
| 2-Person Household | 425 | 37.8% |
| 3-Person Household | 172 | 15.3% |
| 4+ Person Household | 290 | 25.8% |
| Total Housing Units | 1,124 | 100.0% |
Occupancy by Ownership by Household Size in Hoschton
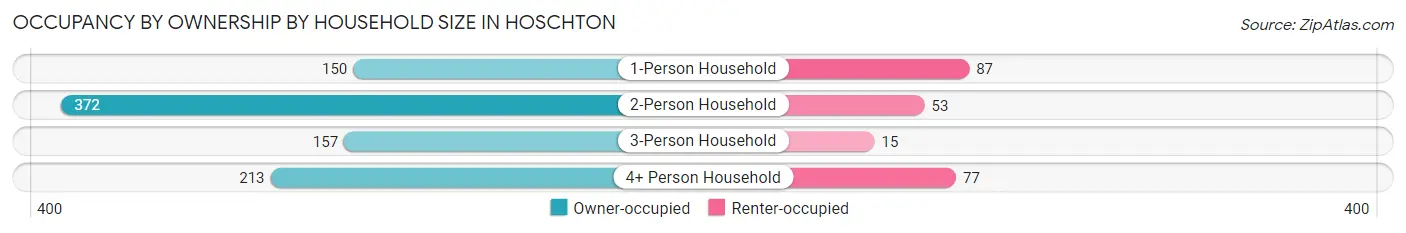
| Household Size | Owner-occupied | Renter-occupied |
| 1-Person Household | 150 (63.3%) | 87 (36.7%) |
| 2-Person Household | 372 (87.5%) | 53 (12.5%) |
| 3-Person Household | 157 (91.3%) | 15 (8.7%) |
| 4+ Person Household | 213 (73.5%) | 77 (26.6%) |
| Total Housing Units | 892 (79.4%) | 232 (20.6%) |
Occupancy by Educational Attainment in Hoschton
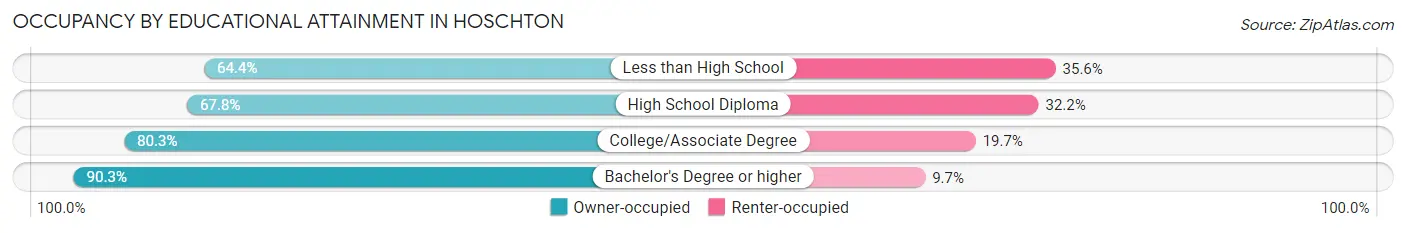
| Household Size | Owner-occupied | Renter-occupied |
| Less than High School | 67 (64.4%) | 37 (35.6%) |
| High School Diploma | 179 (67.8%) | 85 (32.2%) |
| College/Associate Degree | 293 (80.3%) | 72 (19.7%) |
| Bachelor's Degree or higher | 353 (90.3%) | 38 (9.7%) |
Occupancy by Age of Householder in Hoschton
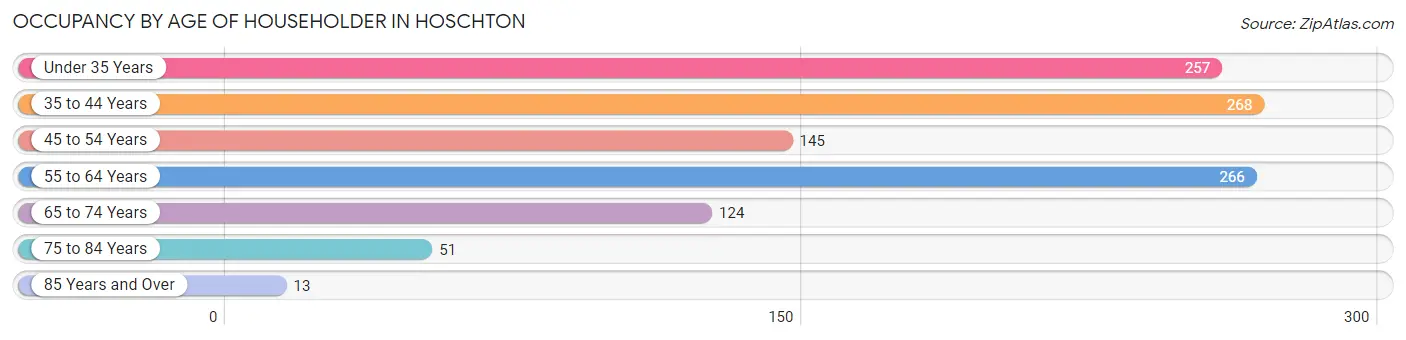
| Age Bracket | # Households | % Households |
| Under 35 Years | 257 | 22.9% |
| 35 to 44 Years | 268 | 23.8% |
| 45 to 54 Years | 145 | 12.9% |
| 55 to 64 Years | 266 | 23.7% |
| 65 to 74 Years | 124 | 11.0% |
| 75 to 84 Years | 51 | 4.5% |
| 85 Years and Over | 13 | 1.2% |
| Total | 1,124 | 100.0% |
Housing Finances in Hoschton
Median Income by Occupancy in Hoschton
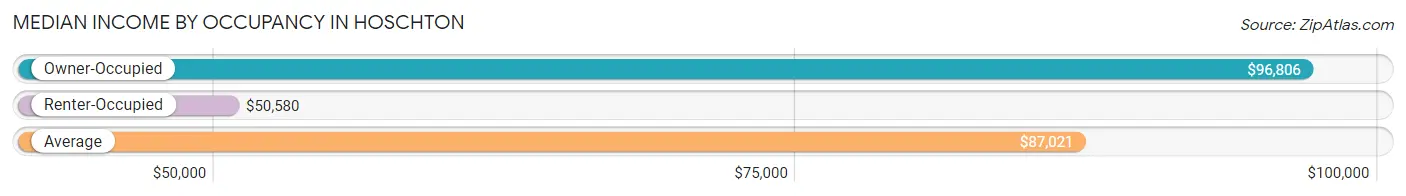
| Occupancy Type | # Households | Median Income |
| Owner-Occupied | 892 (79.4%) | $96,806 |
| Renter-Occupied | 232 (20.6%) | $50,580 |
| Average | 1,124 (100.0%) | $87,021 |
Occupancy by Householder Income Bracket in Hoschton
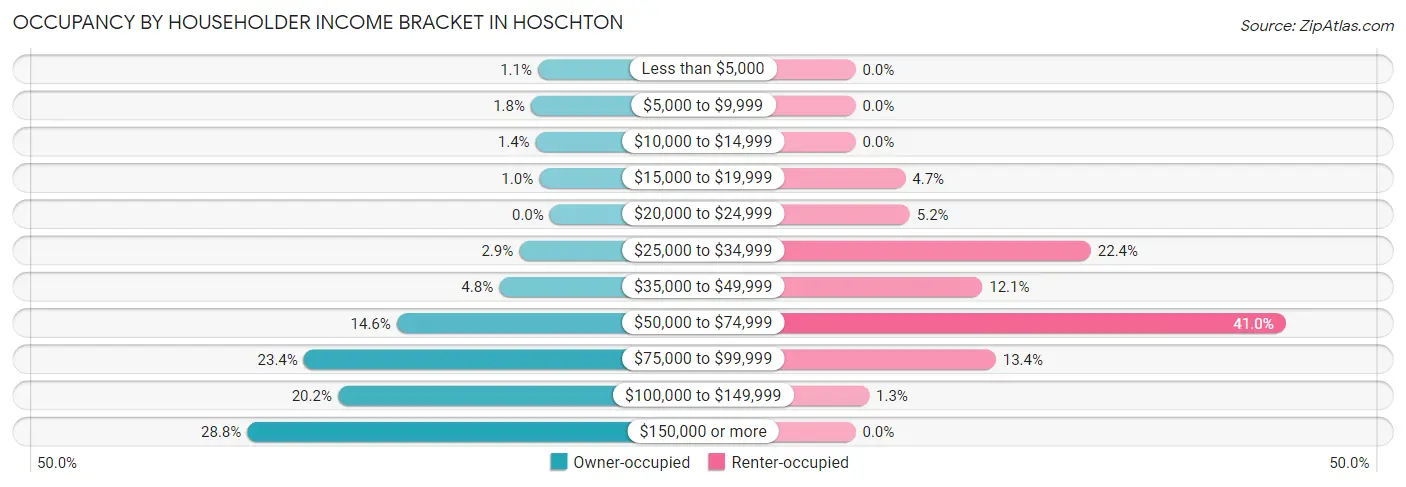
| Income Bracket | Owner-occupied | Renter-occupied |
| Less than $5,000 | 10 (1.1%) | 0 (0.0%) |
| $5,000 to $9,999 | 16 (1.8%) | 0 (0.0%) |
| $10,000 to $14,999 | 12 (1.3%) | 0 (0.0%) |
| $15,000 to $19,999 | 9 (1.0%) | 11 (4.7%) |
| $20,000 to $24,999 | 0 (0.0%) | 12 (5.2%) |
| $25,000 to $34,999 | 26 (2.9%) | 52 (22.4%) |
| $35,000 to $49,999 | 43 (4.8%) | 28 (12.1%) |
| $50,000 to $74,999 | 130 (14.6%) | 95 (40.9%) |
| $75,000 to $99,999 | 209 (23.4%) | 31 (13.4%) |
| $100,000 to $149,999 | 180 (20.2%) | 3 (1.3%) |
| $150,000 or more | 257 (28.8%) | 0 (0.0%) |
| Total | 892 (100.0%) | 232 (100.0%) |
Monthly Housing Cost Tiers in Hoschton
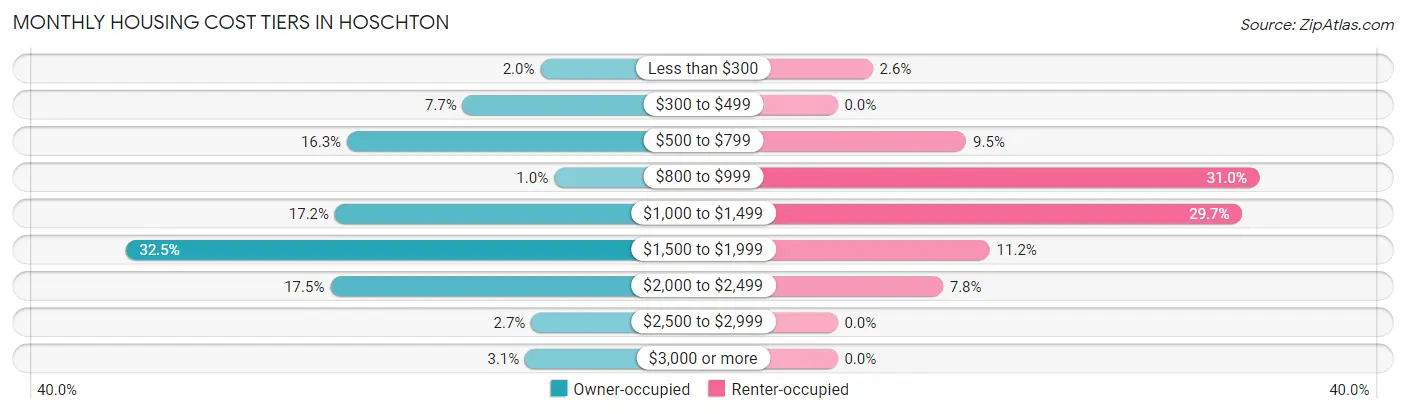
| Monthly Cost | Owner-occupied | Renter-occupied |
| Less than $300 | 18 (2.0%) | 6 (2.6%) |
| $300 to $499 | 69 (7.7%) | 0 (0.0%) |
| $500 to $799 | 145 (16.3%) | 22 (9.5%) |
| $800 to $999 | 9 (1.0%) | 72 (31.0%) |
| $1,000 to $1,499 | 153 (17.2%) | 69 (29.7%) |
| $1,500 to $1,999 | 290 (32.5%) | 26 (11.2%) |
| $2,000 to $2,499 | 156 (17.5%) | 18 (7.8%) |
| $2,500 to $2,999 | 24 (2.7%) | 0 (0.0%) |
| $3,000 or more | 28 (3.1%) | 0 (0.0%) |
| Total | 892 (100.0%) | 232 (100.0%) |
Physical Housing Characteristics in Hoschton
Housing Structures in Hoschton
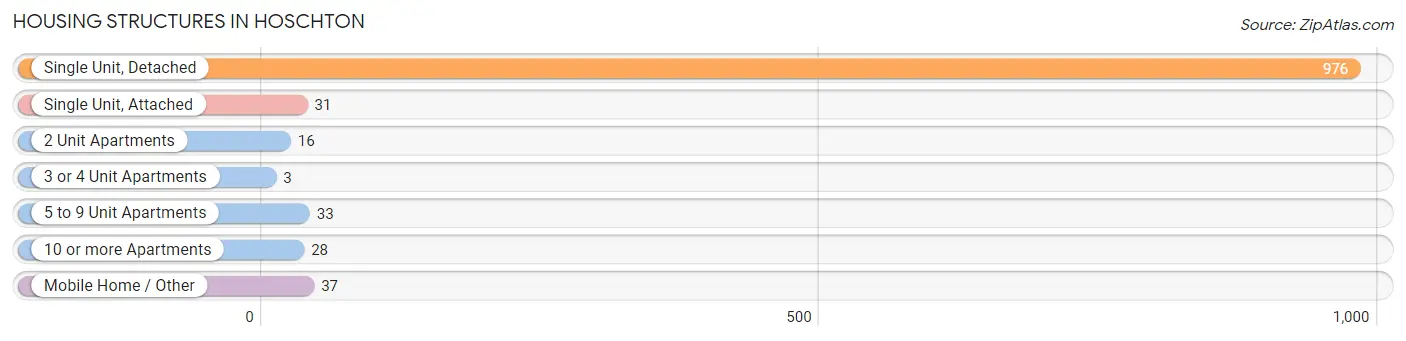
| Structure Type | # Housing Units | % Housing Units |
| Single Unit, Detached | 976 | 86.8% |
| Single Unit, Attached | 31 | 2.8% |
| 2 Unit Apartments | 16 | 1.4% |
| 3 or 4 Unit Apartments | 3 | 0.3% |
| 5 to 9 Unit Apartments | 33 | 2.9% |
| 10 or more Apartments | 28 | 2.5% |
| Mobile Home / Other | 37 | 3.3% |
| Total | 1,124 | 100.0% |
Housing Structures by Occupancy in Hoschton
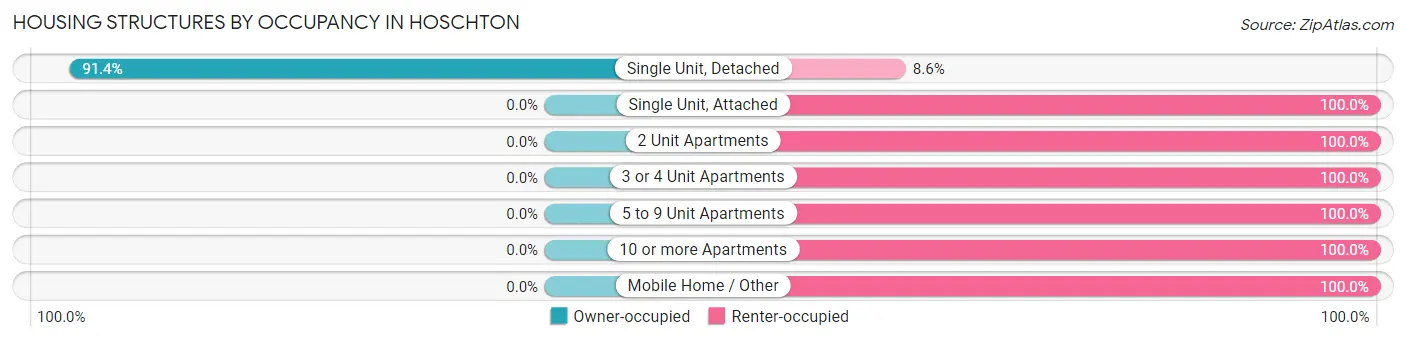
| Structure Type | Owner-occupied | Renter-occupied |
| Single Unit, Detached | 892 (91.4%) | 84 (8.6%) |
| Single Unit, Attached | 0 (0.0%) | 31 (100.0%) |
| 2 Unit Apartments | 0 (0.0%) | 16 (100.0%) |
| 3 or 4 Unit Apartments | 0 (0.0%) | 3 (100.0%) |
| 5 to 9 Unit Apartments | 0 (0.0%) | 33 (100.0%) |
| 10 or more Apartments | 0 (0.0%) | 28 (100.0%) |
| Mobile Home / Other | 0 (0.0%) | 37 (100.0%) |
| Total | 892 (79.4%) | 232 (20.6%) |
Housing Structures by Number of Rooms in Hoschton
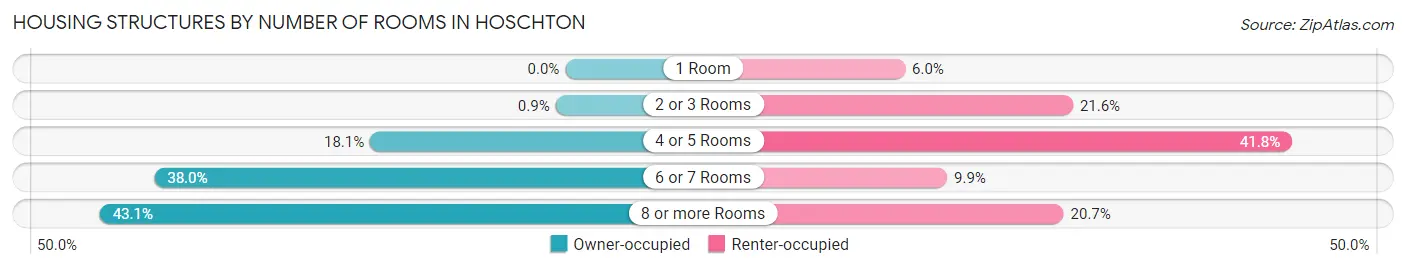
| Number of Rooms | Owner-occupied | Renter-occupied |
| 1 Room | 0 (0.0%) | 14 (6.0%) |
| 2 or 3 Rooms | 8 (0.9%) | 50 (21.5%) |
| 4 or 5 Rooms | 161 (18.0%) | 97 (41.8%) |
| 6 or 7 Rooms | 339 (38.0%) | 23 (9.9%) |
| 8 or more Rooms | 384 (43.0%) | 48 (20.7%) |
| Total | 892 (100.0%) | 232 (100.0%) |
Housing Structure by Heating Type in Hoschton
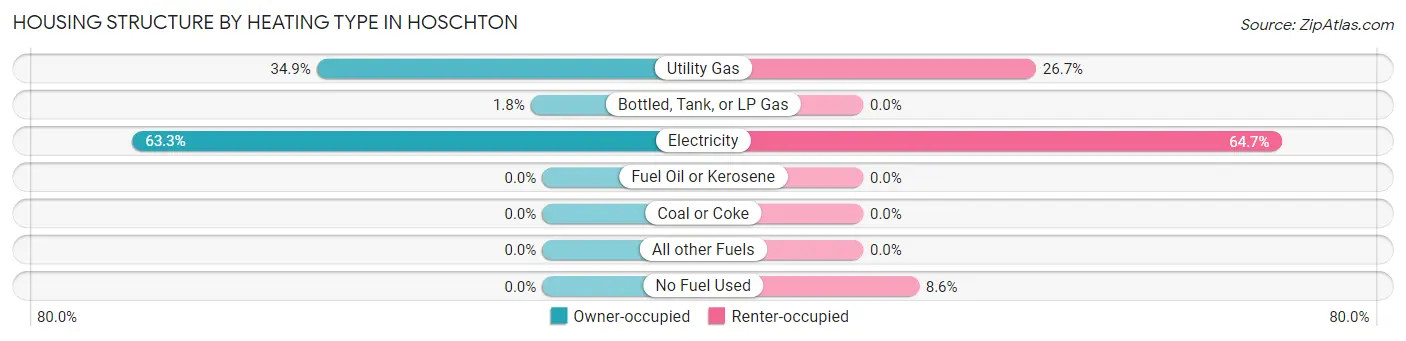
| Heating Type | Owner-occupied | Renter-occupied |
| Utility Gas | 311 (34.9%) | 62 (26.7%) |
| Bottled, Tank, or LP Gas | 16 (1.8%) | 0 (0.0%) |
| Electricity | 565 (63.3%) | 150 (64.7%) |
| Fuel Oil or Kerosene | 0 (0.0%) | 0 (0.0%) |
| Coal or Coke | 0 (0.0%) | 0 (0.0%) |
| All other Fuels | 0 (0.0%) | 0 (0.0%) |
| No Fuel Used | 0 (0.0%) | 20 (8.6%) |
| Total | 892 (100.0%) | 232 (100.0%) |
Household Vehicle Usage in Hoschton
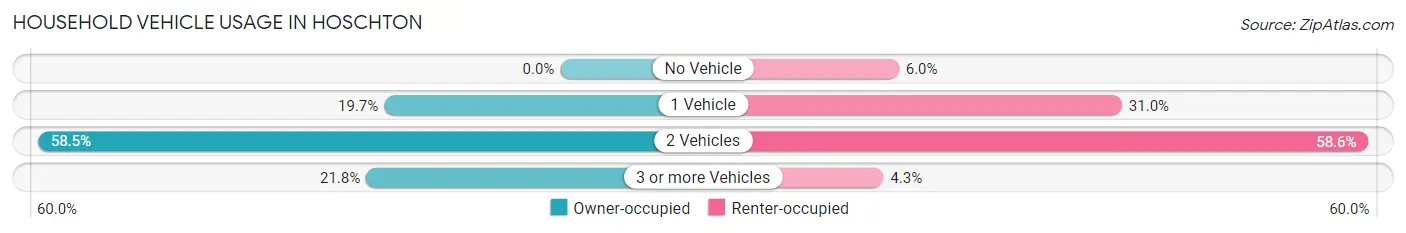
| Vehicles per Household | Owner-occupied | Renter-occupied |
| No Vehicle | 0 (0.0%) | 14 (6.0%) |
| 1 Vehicle | 176 (19.7%) | 72 (31.0%) |
| 2 Vehicles | 522 (58.5%) | 136 (58.6%) |
| 3 or more Vehicles | 194 (21.7%) | 10 (4.3%) |
| Total | 892 (100.0%) | 232 (100.0%) |
Real Estate & Mortgages in Hoschton
Real Estate and Mortgage Overview in Hoschton
| Characteristic | Without Mortgage | With Mortgage |
| Housing Units | 213 | 679 |
| Median Property Value | $264,600 | $316,700 |
| Median Household Income | $74,792 | $225 |
| Monthly Housing Costs | $611 | $28 |
| Real Estate Taxes | $2,418 | $32 |
Property Value by Mortgage Status in Hoschton
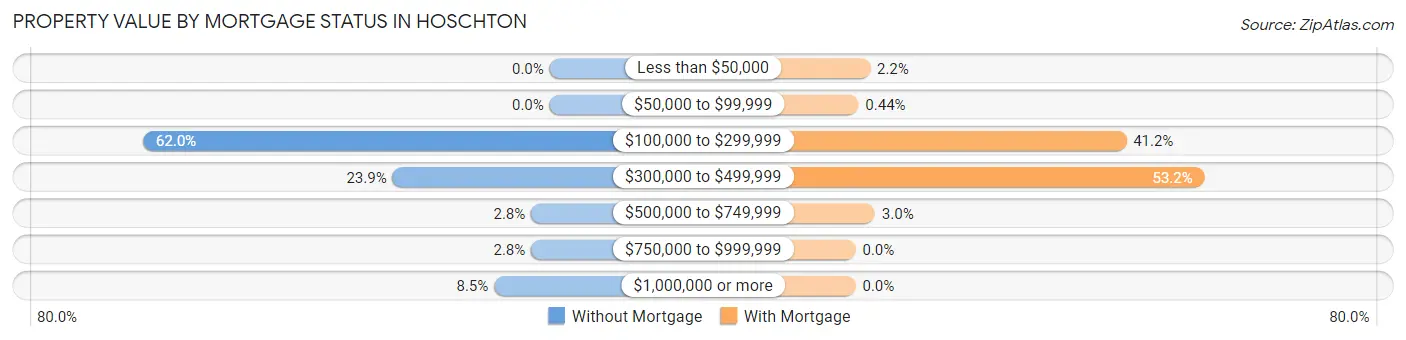
| Property Value | Without Mortgage | With Mortgage |
| Less than $50,000 | 0 (0.0%) | 15 (2.2%) |
| $50,000 to $99,999 | 0 (0.0%) | 3 (0.4%) |
| $100,000 to $299,999 | 132 (62.0%) | 280 (41.2%) |
| $300,000 to $499,999 | 51 (23.9%) | 361 (53.2%) |
| $500,000 to $749,999 | 6 (2.8%) | 20 (2.9%) |
| $750,000 to $999,999 | 6 (2.8%) | 0 (0.0%) |
| $1,000,000 or more | 18 (8.5%) | 0 (0.0%) |
| Total | 213 (100.0%) | 679 (100.0%) |
Household Income by Mortgage Status in Hoschton
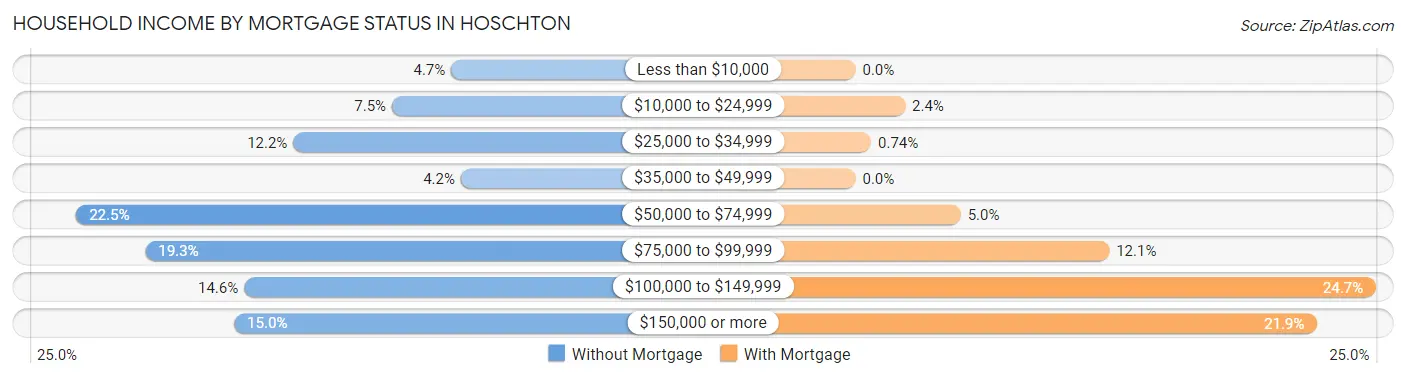
| Household Income | Without Mortgage | With Mortgage |
| Less than $10,000 | 10 (4.7%) | 0 (0.0%) |
| $10,000 to $24,999 | 16 (7.5%) | 16 (2.4%) |
| $25,000 to $34,999 | 26 (12.2%) | 5 (0.7%) |
| $35,000 to $49,999 | 9 (4.2%) | 0 (0.0%) |
| $50,000 to $74,999 | 48 (22.5%) | 34 (5.0%) |
| $75,000 to $99,999 | 41 (19.3%) | 82 (12.1%) |
| $100,000 to $149,999 | 31 (14.5%) | 168 (24.7%) |
| $150,000 or more | 32 (15.0%) | 149 (21.9%) |
| Total | 213 (100.0%) | 679 (100.0%) |
Property Value to Household Income Ratio in Hoschton
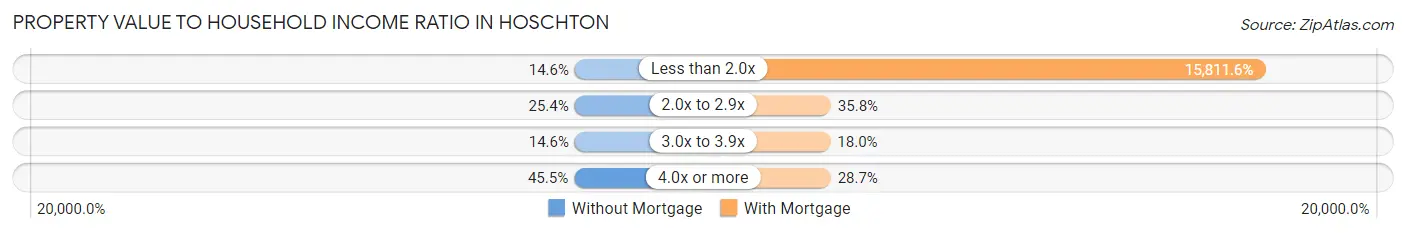
| Value-to-Income Ratio | Without Mortgage | With Mortgage |
| Less than 2.0x | 31 (14.5%) | 107,361 (15,811.6%) |
| 2.0x to 2.9x | 54 (25.4%) | 243 (35.8%) |
| 3.0x to 3.9x | 31 (14.5%) | 122 (18.0%) |
| 4.0x or more | 97 (45.5%) | 195 (28.7%) |
| Total | 213 (100.0%) | 679 (100.0%) |
Real Estate Taxes by Mortgage Status in Hoschton
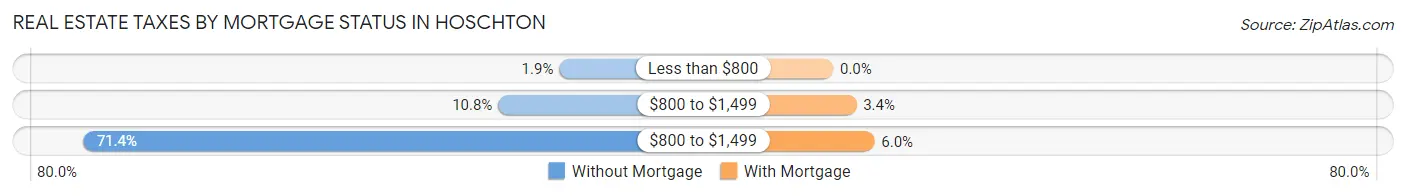
| Property Taxes | Without Mortgage | With Mortgage |
| Less than $800 | 4 (1.9%) | 0 (0.0%) |
| $800 to $1,499 | 23 (10.8%) | 23 (3.4%) |
| $800 to $1,499 | 152 (71.4%) | 41 (6.0%) |
| Total | 213 (100.0%) | 679 (100.0%) |
Health & Disability in Hoschton
Health Insurance Coverage by Age in Hoschton
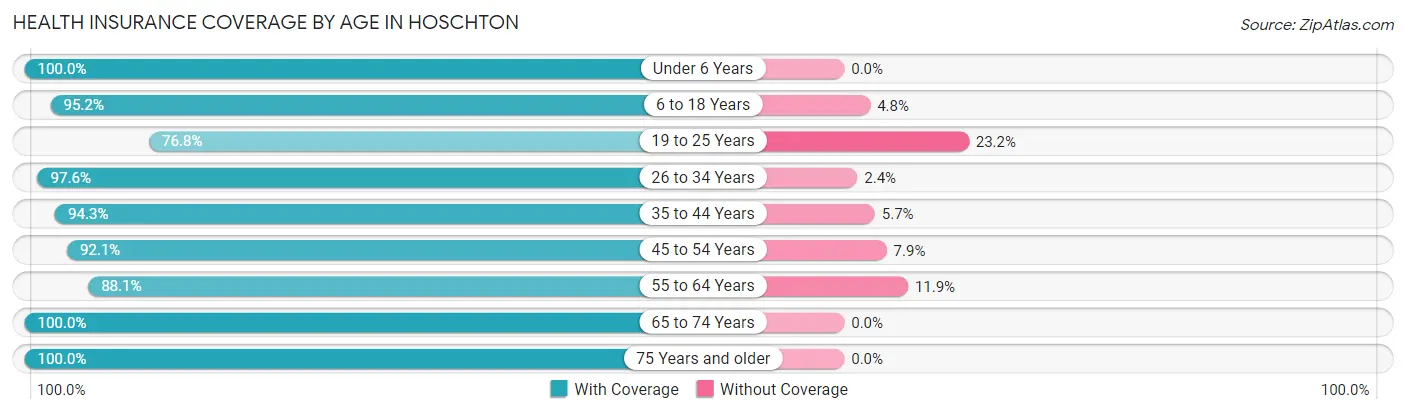
| Age Bracket | With Coverage | Without Coverage |
| Under 6 Years | 301 (100.0%) | 0 (0.0%) |
| 6 to 18 Years | 531 (95.2%) | 27 (4.8%) |
| 19 to 25 Years | 248 (76.8%) | 75 (23.2%) |
| 26 to 34 Years | 399 (97.6%) | 10 (2.4%) |
| 35 to 44 Years | 463 (94.3%) | 28 (5.7%) |
| 45 to 54 Years | 268 (92.1%) | 23 (7.9%) |
| 55 to 64 Years | 297 (88.1%) | 40 (11.9%) |
| 65 to 74 Years | 281 (100.0%) | 0 (0.0%) |
| 75 Years and older | 108 (100.0%) | 0 (0.0%) |
| Total | 2,896 (93.4%) | 203 (6.6%) |
Health Insurance Coverage by Citizenship Status in Hoschton
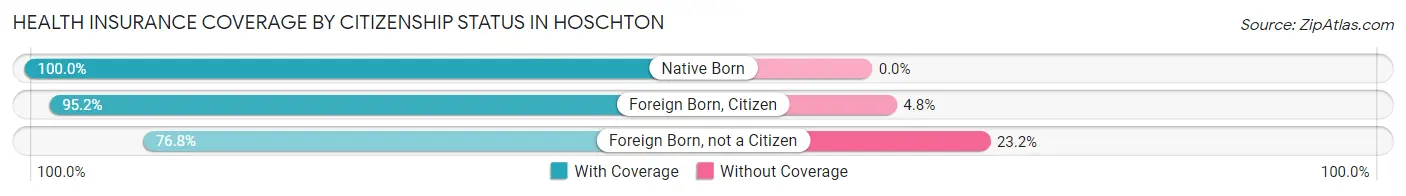
| Citizenship Status | With Coverage | Without Coverage |
| Native Born | 301 (100.0%) | 0 (0.0%) |
| Foreign Born, Citizen | 531 (95.2%) | 27 (4.8%) |
| Foreign Born, not a Citizen | 248 (76.8%) | 75 (23.2%) |
Health Insurance Coverage by Household Income in Hoschton
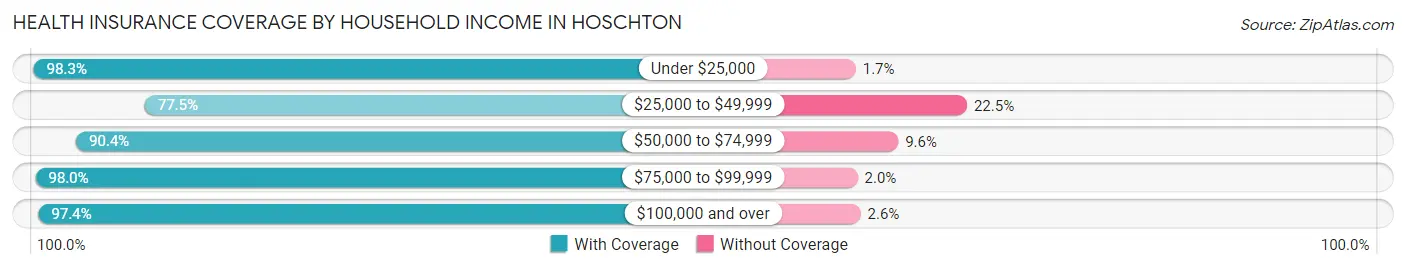
| Household Income | With Coverage | Without Coverage |
| Under $25,000 | 117 (98.3%) | 2 (1.7%) |
| $25,000 to $49,999 | 351 (77.5%) | 102 (22.5%) |
| $50,000 to $74,999 | 488 (90.4%) | 52 (9.6%) |
| $75,000 to $99,999 | 775 (98.0%) | 16 (2.0%) |
| $100,000 and over | 1,165 (97.4%) | 31 (2.6%) |
Public vs Private Health Insurance Coverage by Age in Hoschton
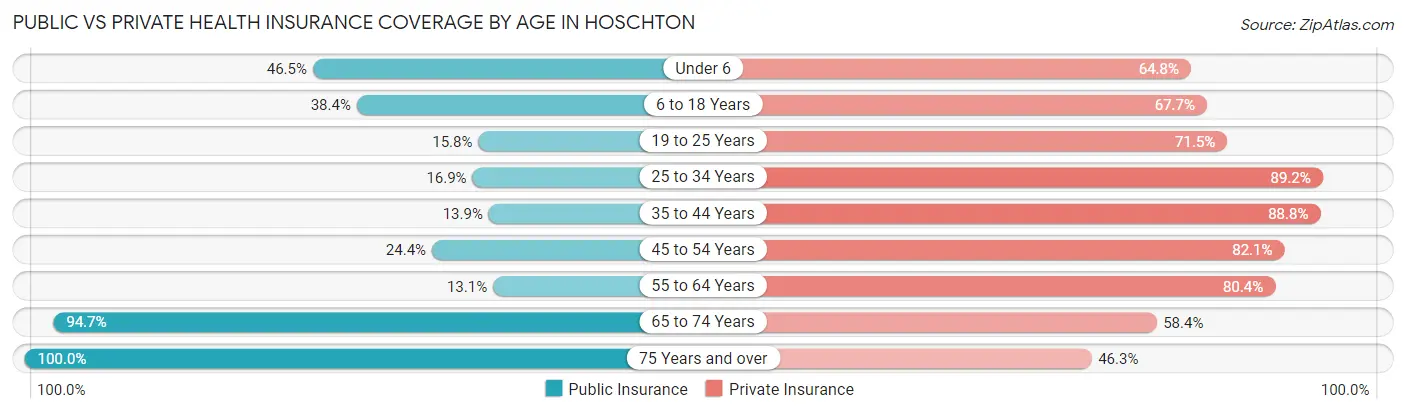
| Age Bracket | Public Insurance | Private Insurance |
| Under 6 | 140 (46.5%) | 195 (64.8%) |
| 6 to 18 Years | 214 (38.4%) | 378 (67.7%) |
| 19 to 25 Years | 51 (15.8%) | 231 (71.5%) |
| 25 to 34 Years | 69 (16.9%) | 365 (89.2%) |
| 35 to 44 Years | 68 (13.9%) | 436 (88.8%) |
| 45 to 54 Years | 71 (24.4%) | 239 (82.1%) |
| 55 to 64 Years | 44 (13.1%) | 271 (80.4%) |
| 65 to 74 Years | 266 (94.7%) | 164 (58.4%) |
| 75 Years and over | 108 (100.0%) | 50 (46.3%) |
| Total | 1,031 (33.3%) | 2,329 (75.1%) |
Disability Status by Sex by Age in Hoschton
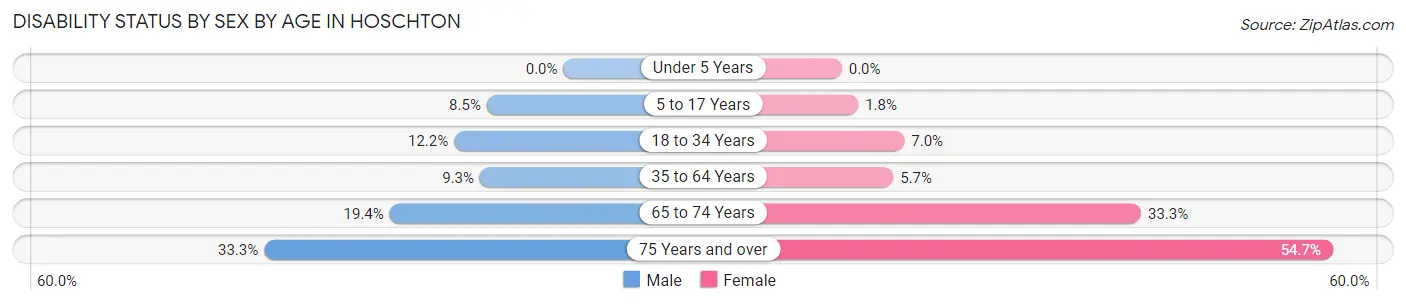
| Age Bracket | Male | Female |
| Under 5 Years | 0 (0.0%) | 0 (0.0%) |
| 5 to 17 Years | 29 (8.5%) | 4 (1.8%) |
| 18 to 34 Years | 46 (12.2%) | 28 (7.0%) |
| 35 to 64 Years | 44 (9.3%) | 37 (5.7%) |
| 65 to 74 Years | 30 (19.4%) | 42 (33.3%) |
| 75 Years and over | 11 (33.3%) | 41 (54.7%) |
Disability Class by Sex by Age in Hoschton
Disability Class: Hearing Difficulty
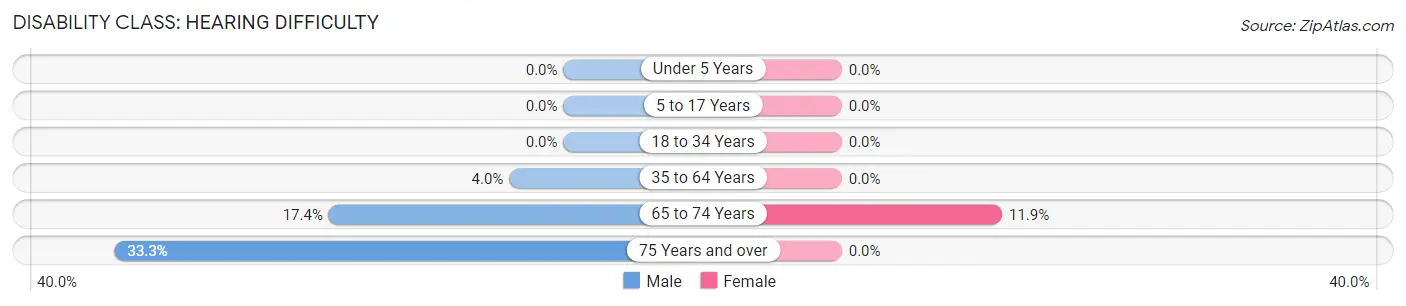
| Age Bracket | Male | Female |
| Under 5 Years | 0 (0.0%) | 0 (0.0%) |
| 5 to 17 Years | 0 (0.0%) | 0 (0.0%) |
| 18 to 34 Years | 0 (0.0%) | 0 (0.0%) |
| 35 to 64 Years | 19 (4.0%) | 0 (0.0%) |
| 65 to 74 Years | 27 (17.4%) | 15 (11.9%) |
| 75 Years and over | 11 (33.3%) | 0 (0.0%) |
Disability Class: Vision Difficulty
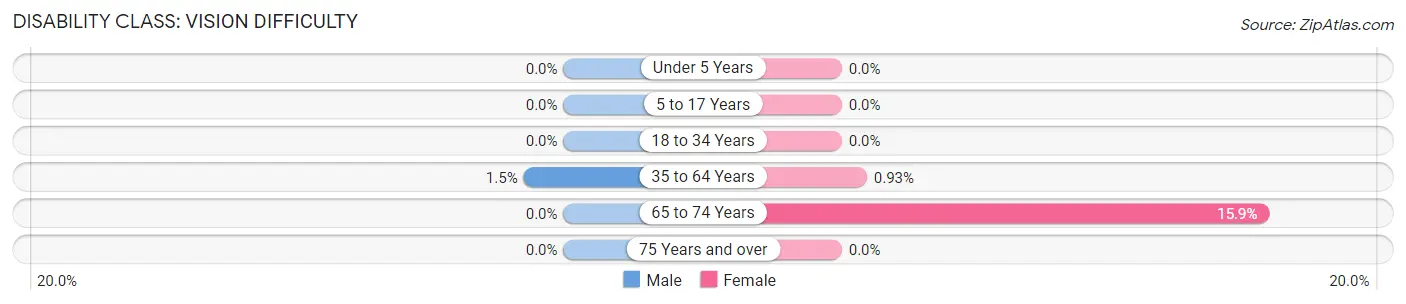
| Age Bracket | Male | Female |
| Under 5 Years | 0 (0.0%) | 0 (0.0%) |
| 5 to 17 Years | 0 (0.0%) | 0 (0.0%) |
| 18 to 34 Years | 0 (0.0%) | 0 (0.0%) |
| 35 to 64 Years | 7 (1.5%) | 6 (0.9%) |
| 65 to 74 Years | 0 (0.0%) | 20 (15.9%) |
| 75 Years and over | 0 (0.0%) | 0 (0.0%) |
Disability Class: Cognitive Difficulty
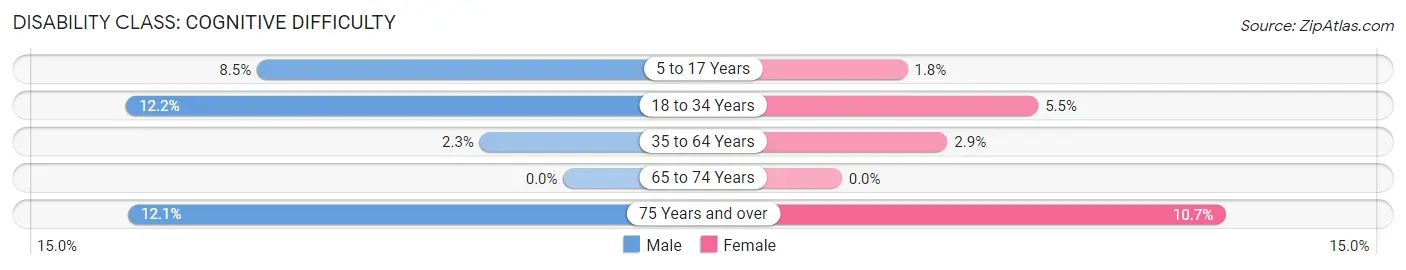
| Age Bracket | Male | Female |
| 5 to 17 Years | 29 (8.5%) | 4 (1.8%) |
| 18 to 34 Years | 46 (12.2%) | 22 (5.5%) |
| 35 to 64 Years | 11 (2.3%) | 19 (2.9%) |
| 65 to 74 Years | 0 (0.0%) | 0 (0.0%) |
| 75 Years and over | 4 (12.1%) | 8 (10.7%) |
Disability Class: Ambulatory Difficulty
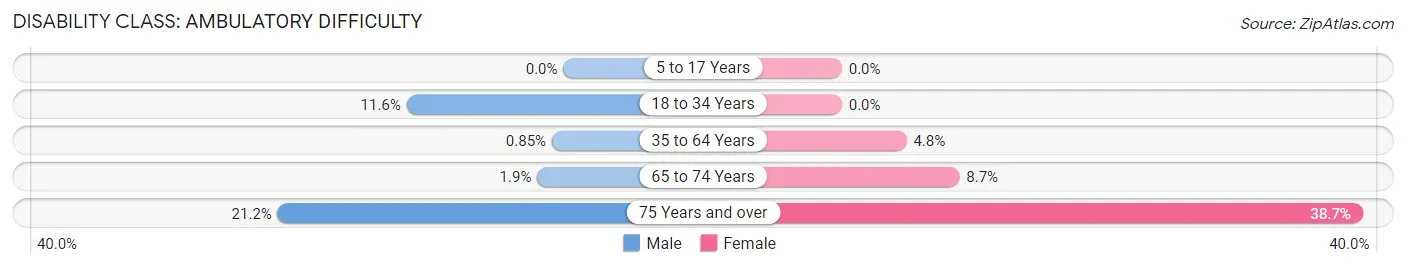
| Age Bracket | Male | Female |
| 5 to 17 Years | 0 (0.0%) | 0 (0.0%) |
| 18 to 34 Years | 44 (11.6%) | 0 (0.0%) |
| 35 to 64 Years | 4 (0.9%) | 31 (4.8%) |
| 65 to 74 Years | 3 (1.9%) | 11 (8.7%) |
| 75 Years and over | 7 (21.2%) | 29 (38.7%) |
Disability Class: Self-Care Difficulty
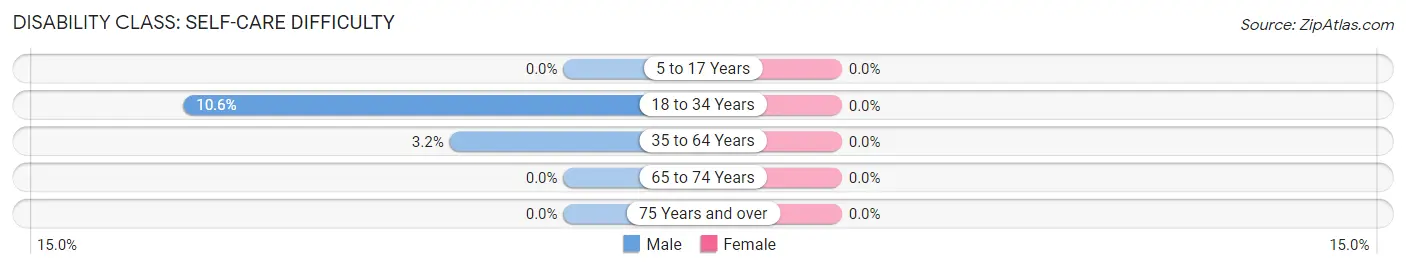
| Age Bracket | Male | Female |
| 5 to 17 Years | 0 (0.0%) | 0 (0.0%) |
| 18 to 34 Years | 40 (10.6%) | 0 (0.0%) |
| 35 to 64 Years | 15 (3.2%) | 0 (0.0%) |
| 65 to 74 Years | 0 (0.0%) | 0 (0.0%) |
| 75 Years and over | 0 (0.0%) | 0 (0.0%) |
Technology Access in Hoschton
Computing Device Access in Hoschton
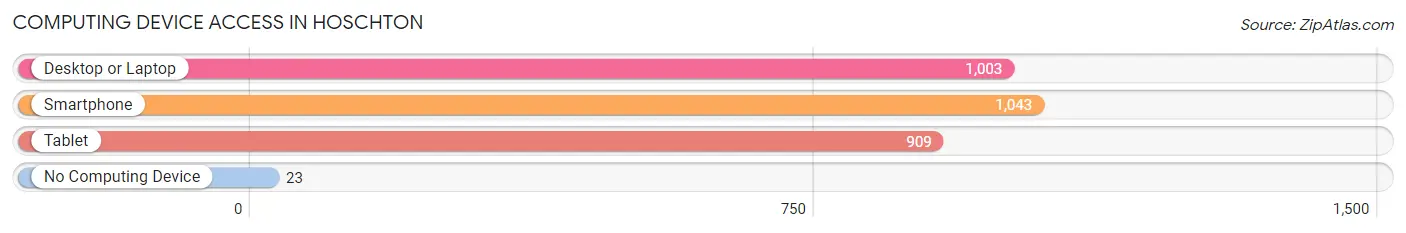
| Device Type | # Households | % Households |
| Desktop or Laptop | 1,003 | 89.2% |
| Smartphone | 1,043 | 92.8% |
| Tablet | 909 | 80.9% |
| No Computing Device | 23 | 2.1% |
| Total | 1,124 | 100.0% |
Internet Access in Hoschton
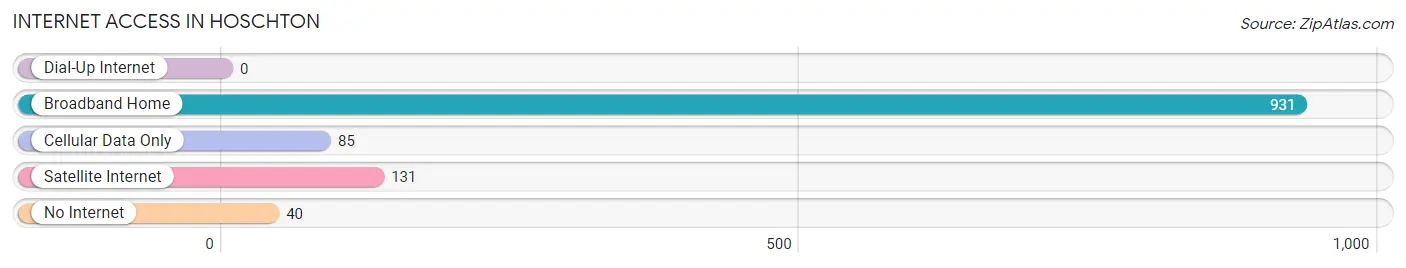
| Internet Type | # Households | % Households |
| Dial-Up Internet | 0 | 0.0% |
| Broadband Home | 931 | 82.8% |
| Cellular Data Only | 85 | 7.6% |
| Satellite Internet | 131 | 11.7% |
| No Internet | 40 | 3.6% |
| Total | 1,124 | 100.0% |
Hoschton Summary
Hoschton is a small city located in Jackson County, Georgia, United States. It is situated about 50 miles northeast of Atlanta and is part of the Gainesville, Georgia Metropolitan Statistical Area. The city was incorporated in 1906 and has a population of 1,719 as of the 2010 census.
History
Hoschton was founded in 1883 by German immigrants, who named the city after their leader, John Hosch. The city was incorporated in 1906 and has remained a small, rural community ever since. The city was home to a large German-American population until the early 20th century, when many of the German immigrants moved away.
Geography
Hoschton is located in Jackson County, Georgia, at the intersection of Georgia State Route 11 and Georgia State Route 53. The city is situated about 50 miles northeast of Atlanta and is part of the Gainesville, Georgia Metropolitan Statistical Area. The city has a total area of 1.3 square miles, all of which is land.
Economy
Hoschton is a small, rural community with a primarily agricultural economy. The city is home to several small businesses, including a grocery store, a hardware store, and a few restaurants. The city also has a few light industrial businesses, such as a plastics manufacturer and a printing company.
Demographics
As of the 2010 census, Hoschton had a population of 1,719. The racial makeup of the city was 87.3% White, 8.2% African American, 0.3% Native American, 0.7% Asian, 0.1% Pacific Islander, 1.2% from other races, and 2.4% from two or more races. Hispanic or Latino of any race were 3.2% of the population.
The median income for a household in the city was $45,000, and the median income for a family was $50,000. The per capita income for the city was $20,000. About 10.2% of families and 12.2% of the population were below the poverty line, including 16.2% of those under age 18 and 8.3% of those age 65 or over.
Common Questions
What is Per Capita Income in Hoschton?
Per Capita income in Hoschton is $37,846.
What is the Median Family Income in Hoschton?
Median Family Income in Hoschton is $96,389.
What is the Median Household income in Hoschton?
Median Household Income in Hoschton is $87,021.
What is Income or Wage Gap in Hoschton?
Income or Wage Gap in Hoschton is 33.1%.
Women in Hoschton earn 66.9 cents for every dollar earned by a man.
What is Inequality or Gini Index in Hoschton?
Inequality or Gini Index in Hoschton is 0.37.
What is the Total Population of Hoschton?
Total Population of Hoschton is 3,099.
What is the Total Male Population of Hoschton?
Total Male Population of Hoschton is 1,503.
What is the Total Female Population of Hoschton?
Total Female Population of Hoschton is 1,596.
What is the Ratio of Males per 100 Females in Hoschton?
There are 94.17 Males per 100 Females in Hoschton.
What is the Ratio of Females per 100 Males in Hoschton?
There are 106.19 Females per 100 Males in Hoschton.
What is the Median Population Age in Hoschton?
Median Population Age in Hoschton is 33.9 Years.
What is the Average Family Size in Hoschton
Average Family Size in Hoschton is 3.2 People.
What is the Average Household Size in Hoschton
Average Household Size in Hoschton is 2.8 People.
How Large is the Labor Force in Hoschton?
There are 1,650 People in the Labor Forcein in Hoschton.
What is the Percentage of People in the Labor Force in Hoschton?
70.3% of People are in the Labor Force in Hoschton.
What is the Unemployment Rate in Hoschton?
Unemployment Rate in Hoschton is 1.0%.