Pine Manor, FL Map & Demographics
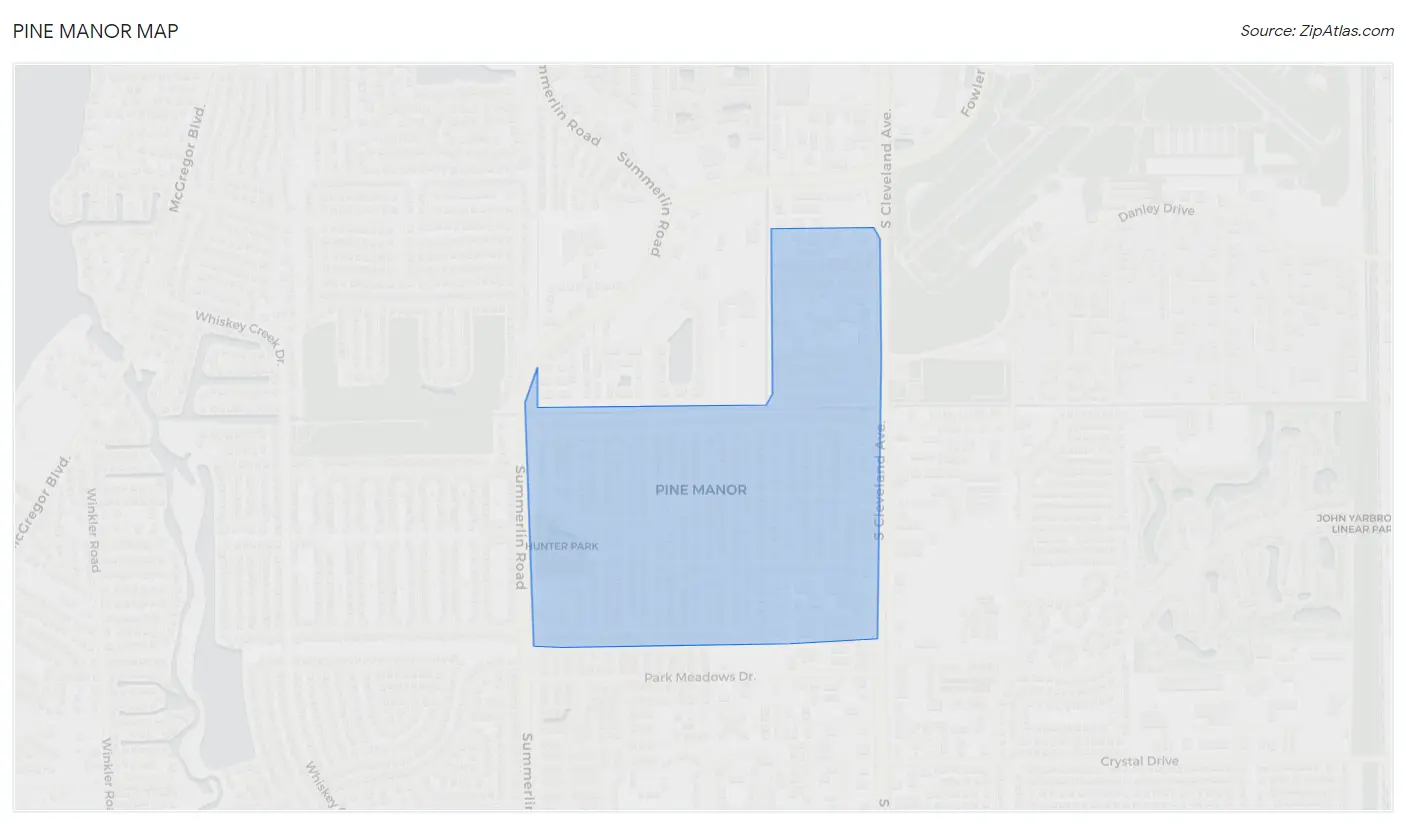
Pine Manor Map
Pine Manor Overview
$16,822
PER CAPITA INCOME
$43,517
AVG FAMILY INCOME
$31,796
AVG HOUSEHOLD INCOME
50.2%
WAGE / INCOME GAP [ % ]
49.8¢/ $1
WAGE / INCOME GAP [ $ ]
0.41
INEQUALITY / GINI INDEX
3,944
TOTAL POPULATION
2,651
MALE POPULATION
1,293
FEMALE POPULATION
205.03
MALES / 100 FEMALES
48.77
FEMALES / 100 MALES
30.6
MEDIAN AGE
3.7
AVG FAMILY SIZE
2.9
AVG HOUSEHOLD SIZE
1,837
LABOR FORCE [ PEOPLE ]
59.7%
PERCENT IN LABOR FORCE
11.7%
UNEMPLOYMENT RATE
Income in Pine Manor
Income Overview in Pine Manor
Per Capita Income in Pine Manor is $16,822, while median incomes of families and households are $43,517 and $31,796 respectively.
| Characteristic | Number | Measure |
| Per Capita Income | 3,944 | $16,822 |
| Median Family Income | 675 | $43,517 |
| Mean Family Income | 675 | $45,268 |
| Median Household Income | 1,312 | $31,796 |
| Mean Household Income | 1,312 | $41,831 |
| Income Deficit | 675 | $0 |
| Wage / Income Gap (%) | 3,944 | 50.22% |
| Wage / Income Gap ($) | 3,944 | 49.78¢ per $1 |
| Gini / Inequality Index | 3,944 | 0.41 |
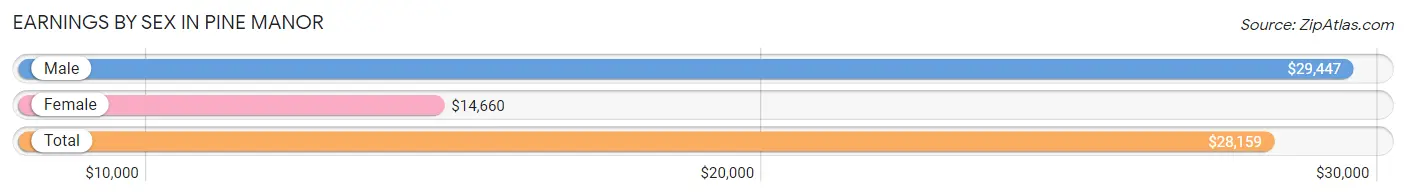
Earnings by Sex in Pine Manor
Average Earnings in Pine Manor are $28,159, $29,447 for men and $14,660 for women, a difference of 50.2%.
| Sex | Number | Average Earnings |
| Male | 1,454 (78.9%) | $29,447 |
| Female | 389 (21.1%) | $14,660 |
| Total | 1,843 (100.0%) | $28,159 |
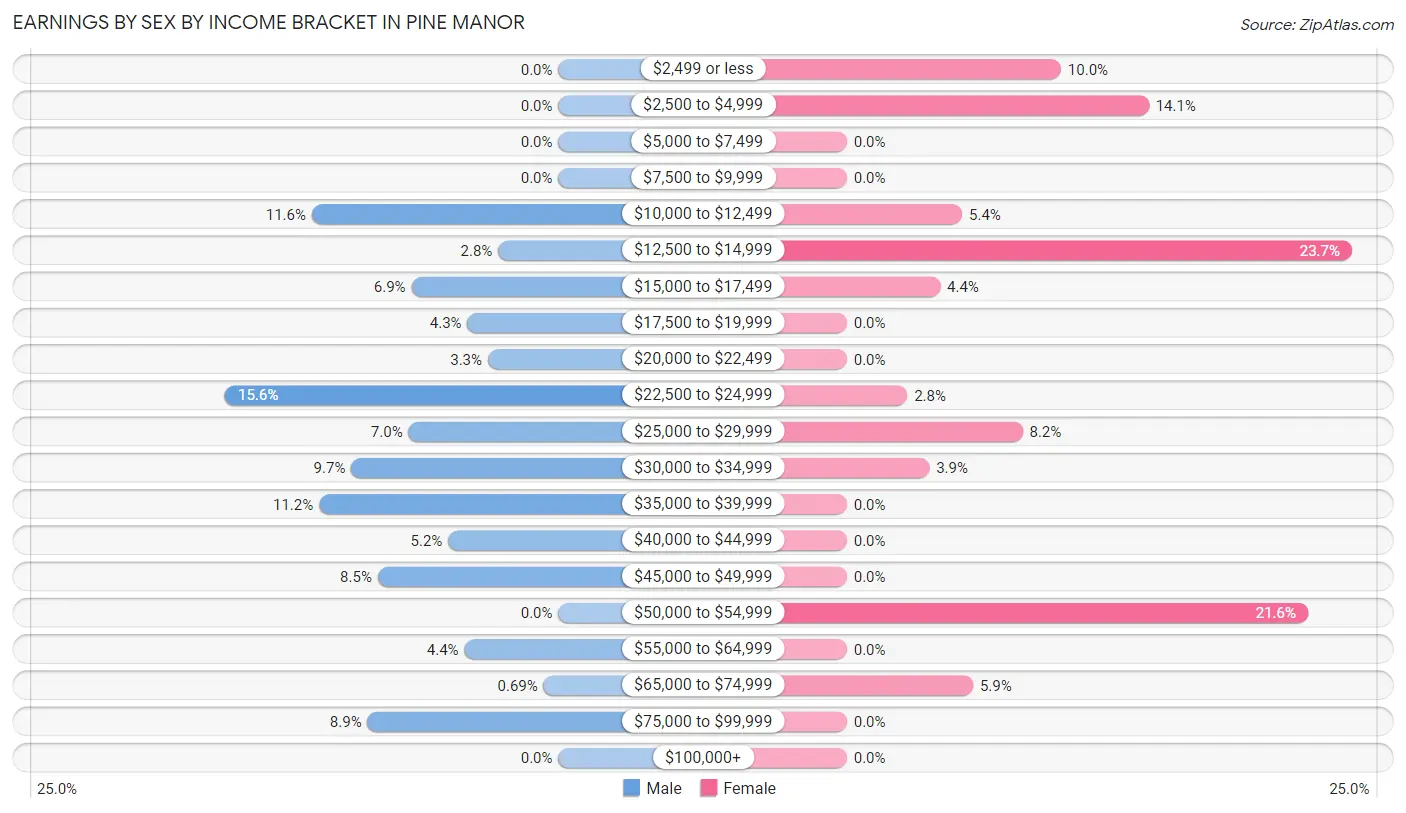
Earnings by Sex by Income Bracket in Pine Manor
The most common earnings brackets in Pine Manor are $22,500 to $24,999 for men (227 | 15.6%) and $12,500 to $14,999 for women (92 | 23.6%).
| Income | Male | Female |
| $2,499 or less | 0 (0.0%) | 39 (10.0%) |
| $2,500 to $4,999 | 0 (0.0%) | 55 (14.1%) |
| $5,000 to $7,499 | 0 (0.0%) | 0 (0.0%) |
| $7,500 to $9,999 | 0 (0.0%) | 0 (0.0%) |
| $10,000 to $12,499 | 168 (11.6%) | 21 (5.4%) |
| $12,500 to $14,999 | 41 (2.8%) | 92 (23.6%) |
| $15,000 to $17,499 | 100 (6.9%) | 17 (4.4%) |
| $17,500 to $19,999 | 62 (4.3%) | 0 (0.0%) |
| $20,000 to $22,499 | 48 (3.3%) | 0 (0.0%) |
| $22,500 to $24,999 | 227 (15.6%) | 11 (2.8%) |
| $25,000 to $29,999 | 102 (7.0%) | 32 (8.2%) |
| $30,000 to $34,999 | 141 (9.7%) | 15 (3.9%) |
| $35,000 to $39,999 | 163 (11.2%) | 0 (0.0%) |
| $40,000 to $44,999 | 75 (5.2%) | 0 (0.0%) |
| $45,000 to $49,999 | 123 (8.5%) | 0 (0.0%) |
| $50,000 to $54,999 | 0 (0.0%) | 84 (21.6%) |
| $55,000 to $64,999 | 64 (4.4%) | 0 (0.0%) |
| $65,000 to $74,999 | 10 (0.7%) | 23 (5.9%) |
| $75,000 to $99,999 | 130 (8.9%) | 0 (0.0%) |
| $100,000+ | 0 (0.0%) | 0 (0.0%) |
| Total | 1,454 (100.0%) | 389 (100.0%) |
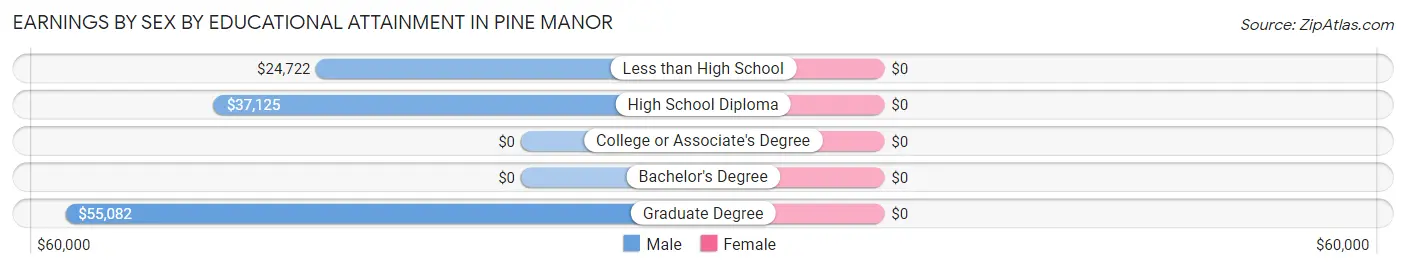
Earnings by Sex by Educational Attainment in Pine Manor
| Educational Attainment | Male Income | Female Income |
| Less than High School | $24,722 | $0 |
| High School Diploma | $37,125 | $0 |
| College or Associate's Degree | - | - |
| Bachelor's Degree | - | - |
| Graduate Degree | $55,082 | $0 |
| Total | $35,019 | $0 |
Family Income in Pine Manor
Family Income Brackets in Pine Manor
According to the Pine Manor family income data, there are 196 families falling into the $35,000 to $49,999 income range, which is the most common income bracket and makes up 29.0% of all families.
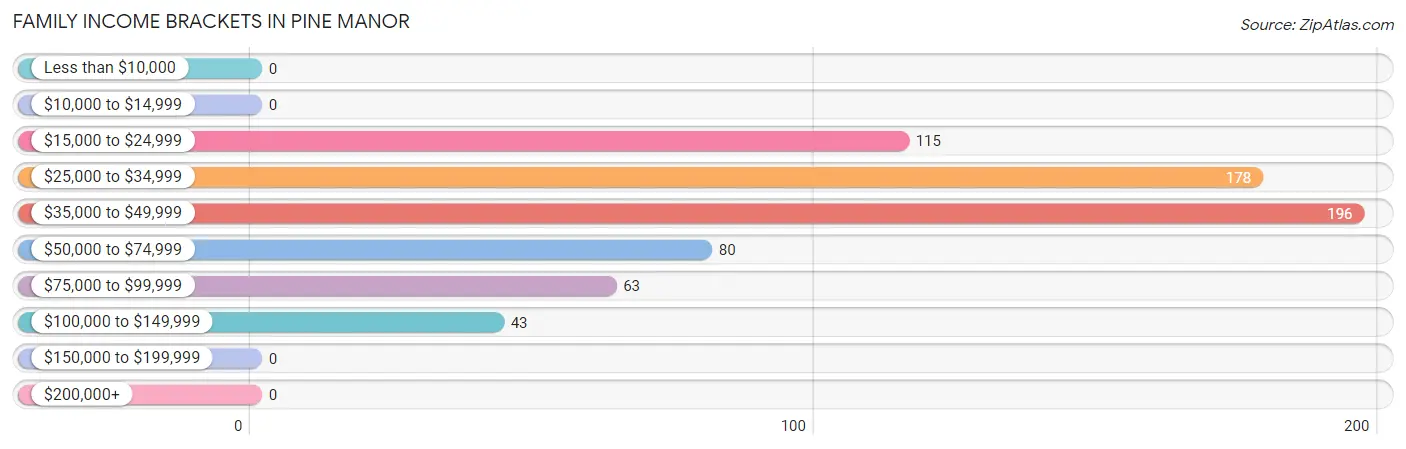
| Income Bracket | # Families | % Families |
| Less than $10,000 | 0 | 0.0% |
| $10,000 to $14,999 | 0 | 0.0% |
| $15,000 to $24,999 | 115 | 17.0% |
| $25,000 to $34,999 | 178 | 26.4% |
| $35,000 to $49,999 | 196 | 29.0% |
| $50,000 to $74,999 | 80 | 11.9% |
| $75,000 to $99,999 | 63 | 9.3% |
| $100,000 to $149,999 | 43 | 6.4% |
| $150,000 to $199,999 | 0 | 0.0% |
| $200,000+ | 0 | 0.0% |
Family Income by Famaliy Size in Pine Manor
4-person families (123 | 18.2%) account for the highest median family income in Pine Manor with $81,659 per family, while 4-person families (123 | 18.2%) have the highest median income of $20,415 per family member.
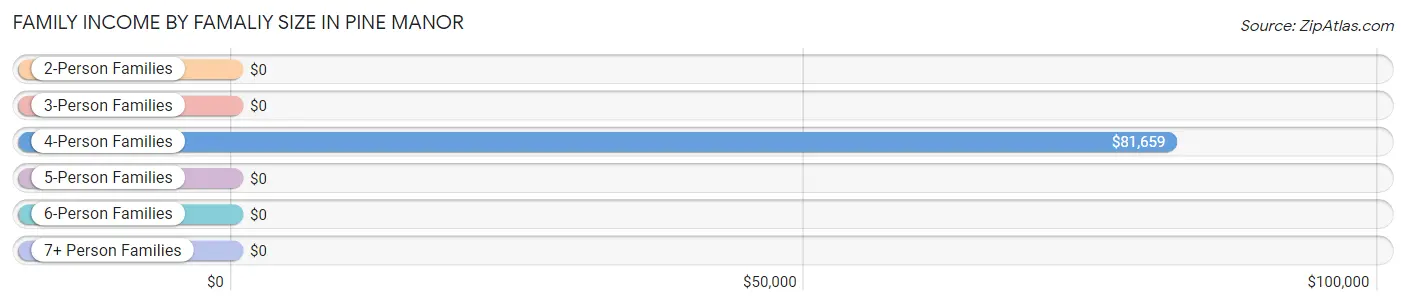
| Income Bracket | # Families | Median Income |
| 2-Person Families | 314 (46.5%) | $0 |
| 3-Person Families | 82 (12.1%) | $0 |
| 4-Person Families | 123 (18.2%) | $81,659 |
| 5-Person Families | 0 (0.0%) | $0 |
| 6-Person Families | 120 (17.8%) | $0 |
| 7+ Person Families | 36 (5.3%) | $0 |
| Total | 675 (100.0%) | $43,517 |
Family Income by Number of Earners in Pine Manor
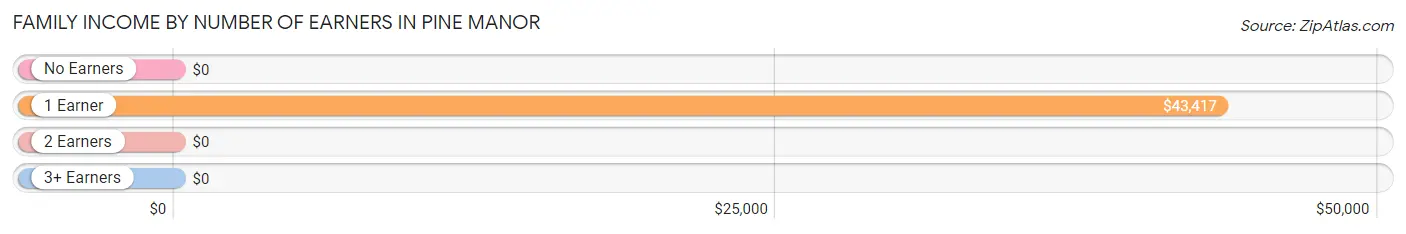
| Number of Earners | # Families | Median Income |
| No Earners | 0 (0.0%) | $0 |
| 1 Earner | 563 (83.4%) | $43,417 |
| 2 Earners | 112 (16.6%) | $0 |
| 3+ Earners | 0 (0.0%) | $0 |
| Total | 675 (100.0%) | $43,517 |
Household Income in Pine Manor
Household Income Brackets in Pine Manor
With 300 households falling in the category, the $35,000 to $49,999 income range is the most frequent in Pine Manor, accounting for 22.9% of all households.
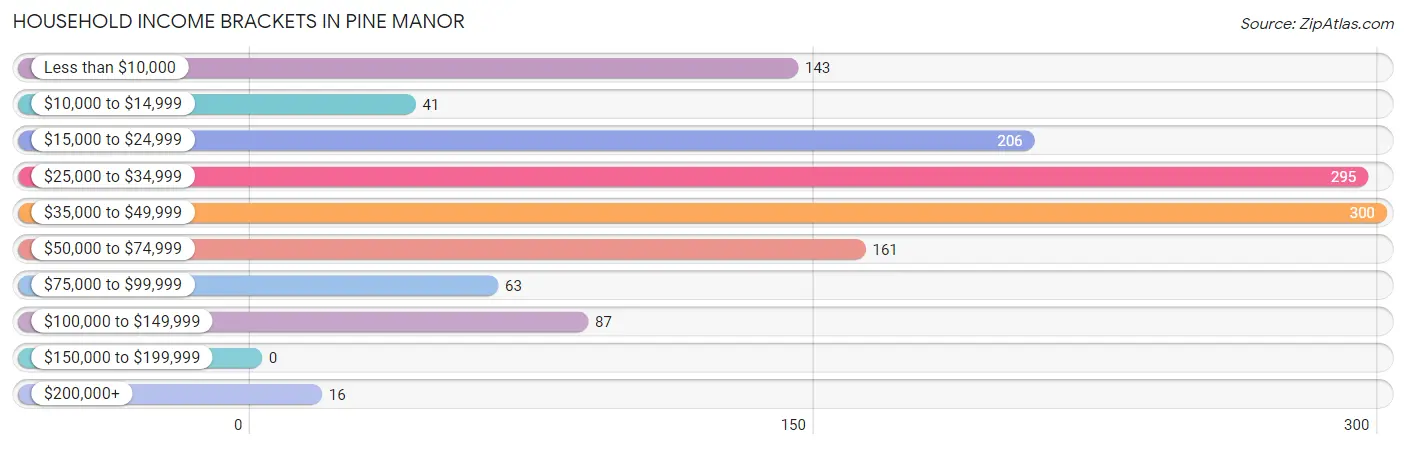
| Income Bracket | # Households | % Households |
| Less than $10,000 | 143 | 10.9% |
| $10,000 to $14,999 | 41 | 3.1% |
| $15,000 to $24,999 | 206 | 15.7% |
| $25,000 to $34,999 | 295 | 22.5% |
| $35,000 to $49,999 | 300 | 22.9% |
| $50,000 to $74,999 | 161 | 12.3% |
| $75,000 to $99,999 | 63 | 4.8% |
| $100,000 to $149,999 | 87 | 6.6% |
| $150,000 to $199,999 | 0 | 0.0% |
| $200,000+ | 16 | 1.2% |
Household Income by Householder Age in Pine Manor
The median household income in Pine Manor is $31,796, with the highest median household income of $45,409 found in the 25 to 44 years age bracket for the primary householder. A total of 731 households (55.7%) fall into this category.
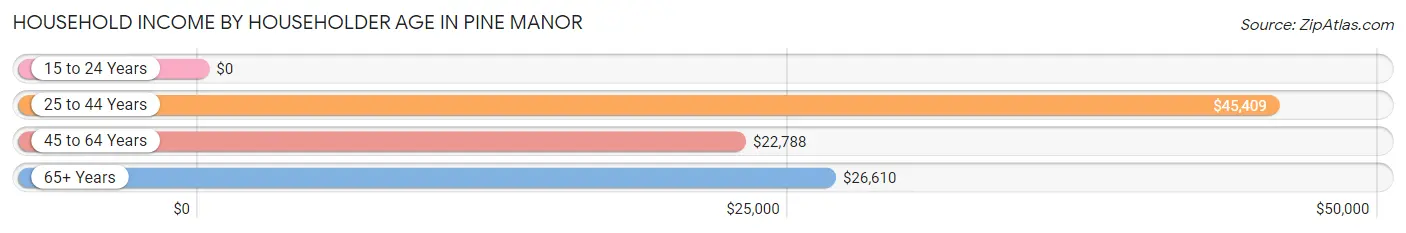
| Income Bracket | # Households | Median Income |
| 15 to 24 Years | 0 (0.0%) | $0 |
| 25 to 44 Years | 731 (55.7%) | $45,409 |
| 45 to 64 Years | 363 (27.7%) | $22,788 |
| 65+ Years | 218 (16.6%) | $26,610 |
| Total | 1,312 (100.0%) | $31,796 |
Poverty in Pine Manor
Income Below Poverty by Sex and Age in Pine Manor
With 27.2% poverty level for males and 24.3% for females among the residents of Pine Manor, 5 year old males and 16 and 17 year old females are the most vulnerable to poverty, with 33 males (100.0%) and 32 females (100.0%) in their respective age groups living below the poverty level.
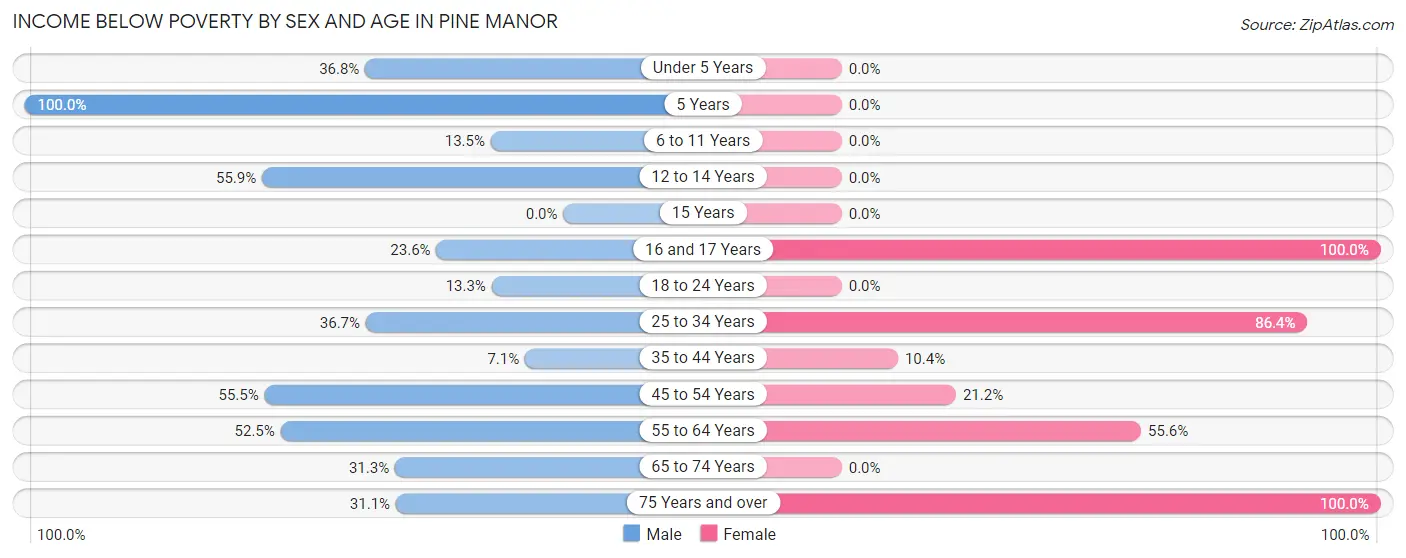
| Age Bracket | Male | Female |
| Under 5 Years | 32 (36.8%) | 0 (0.0%) |
| 5 Years | 33 (100.0%) | 0 (0.0%) |
| 6 to 11 Years | 33 (13.5%) | 0 (0.0%) |
| 12 to 14 Years | 33 (55.9%) | 0 (0.0%) |
| 15 Years | 0 (0.0%) | 0 (0.0%) |
| 16 and 17 Years | 45 (23.6%) | 32 (100.0%) |
| 18 to 24 Years | 50 (13.3%) | 0 (0.0%) |
| 25 to 34 Years | 217 (36.7%) | 159 (86.4%) |
| 35 to 44 Years | 36 (7.1%) | 17 (10.4%) |
| 45 to 54 Years | 127 (55.5%) | 32 (21.2%) |
| 55 to 64 Years | 53 (52.5%) | 50 (55.6%) |
| 65 to 74 Years | 15 (31.2%) | 0 (0.0%) |
| 75 Years and over | 23 (31.1%) | 12 (100.0%) |
| Total | 697 (27.2%) | 302 (24.3%) |
Income Above Poverty by Sex and Age in Pine Manor
According to the poverty statistics in Pine Manor, males aged 15 years and females aged under 5 years are the age groups that are most secure financially, with 100.0% of males and 100.0% of females in these age groups living above the poverty line.
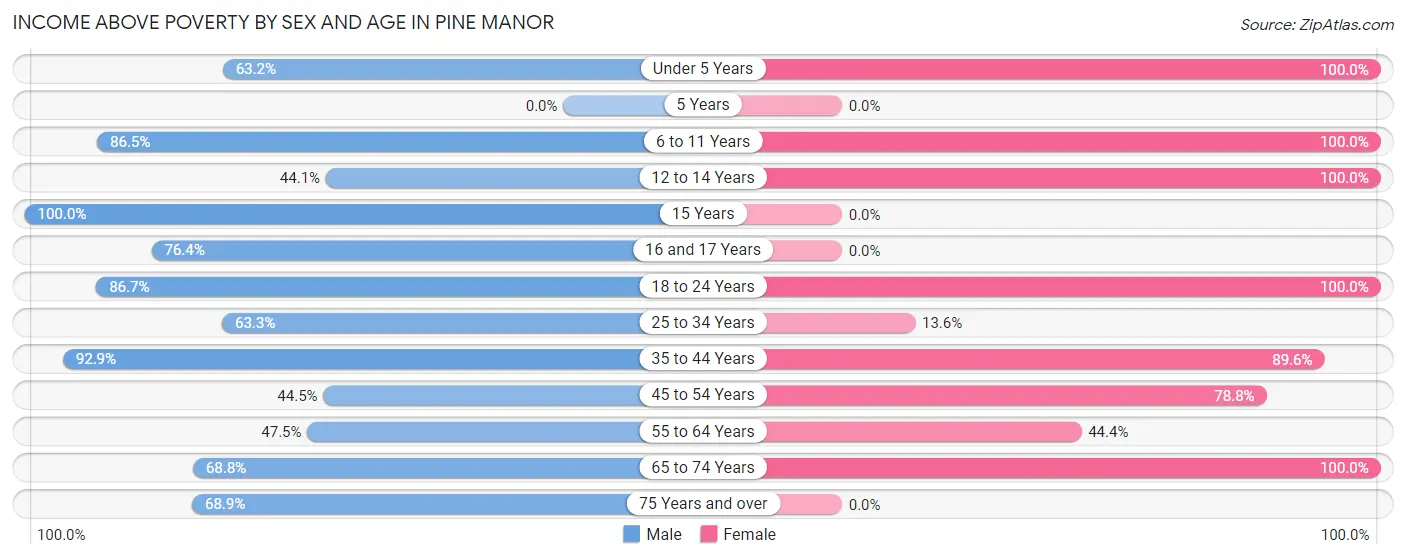
| Age Bracket | Male | Female |
| Under 5 Years | 55 (63.2%) | 58 (100.0%) |
| 5 Years | 0 (0.0%) | 0 (0.0%) |
| 6 to 11 Years | 212 (86.5%) | 192 (100.0%) |
| 12 to 14 Years | 26 (44.1%) | 113 (100.0%) |
| 15 Years | 23 (100.0%) | 0 (0.0%) |
| 16 and 17 Years | 146 (76.4%) | 0 (0.0%) |
| 18 to 24 Years | 326 (86.7%) | 43 (100.0%) |
| 25 to 34 Years | 375 (63.3%) | 25 (13.6%) |
| 35 to 44 Years | 470 (92.9%) | 146 (89.6%) |
| 45 to 54 Years | 102 (44.5%) | 119 (78.8%) |
| 55 to 64 Years | 48 (47.5%) | 40 (44.4%) |
| 65 to 74 Years | 33 (68.8%) | 203 (100.0%) |
| 75 Years and over | 51 (68.9%) | 0 (0.0%) |
| Total | 1,867 (72.8%) | 939 (75.7%) |
Income Below Poverty Among Married-Couple Families in Pine Manor
The poverty statistics for married-couple families in Pine Manor show that 15.5% or 39 of the total 251 families live below the poverty line. Families with no children have the highest poverty rate of 40.2%, comprising of 39 families. On the other hand, families with 1 or 2 children have the lowest poverty rate of 0.0%, which includes 0 families.
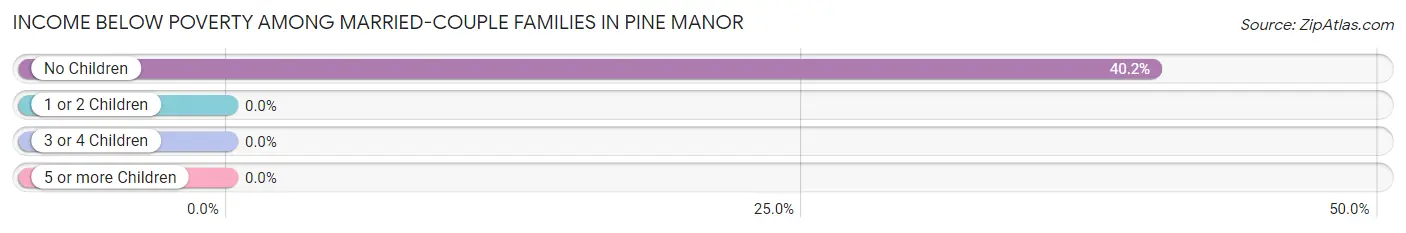
| Children | Above Poverty | Below Poverty |
| No Children | 58 (59.8%) | 39 (40.2%) |
| 1 or 2 Children | 80 (100.0%) | 0 (0.0%) |
| 3 or 4 Children | 74 (100.0%) | 0 (0.0%) |
| 5 or more Children | 0 (0.0%) | 0 (0.0%) |
| Total | 212 (84.5%) | 39 (15.5%) |
Income Below Poverty Among Single-Parent Households in Pine Manor
According to the poverty data in Pine Manor, 20.3% or 48 single-father households and 9.0% or 17 single-mother households are living below the poverty line. Among single-father households, those with 5 or more children have the highest poverty rate, with 36 households (43.9%) experiencing poverty. Likewise, among single-mother households, those with 1 or 2 children have the highest poverty rate, with 17 households (60.7%) falling below the poverty line.
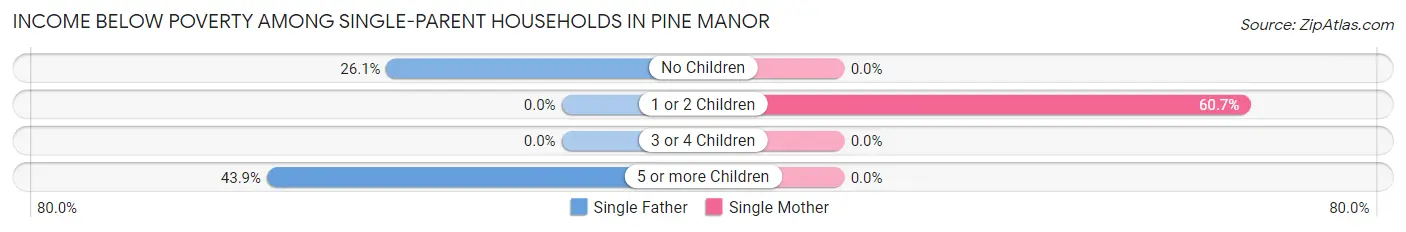
| Children | Single Father | Single Mother |
| No Children | 12 (26.1%) | 0 (0.0%) |
| 1 or 2 Children | 0 (0.0%) | 17 (60.7%) |
| 3 or 4 Children | 0 (0.0%) | 0 (0.0%) |
| 5 or more Children | 36 (43.9%) | 0 (0.0%) |
| Total | 48 (20.3%) | 17 (9.0%) |
Income Below Poverty Among Married-Couple vs Single-Parent Households in Pine Manor
The poverty data for Pine Manor shows that 39 of the married-couple family households (15.5%) and 65 of the single-parent households (15.3%) are living below the poverty level. Within the married-couple family households, those with no children have the highest poverty rate, with 39 households (40.2%) falling below the poverty line. Among the single-parent households, those with 5 or more children have the highest poverty rate, with 36 household (43.9%) living below poverty.
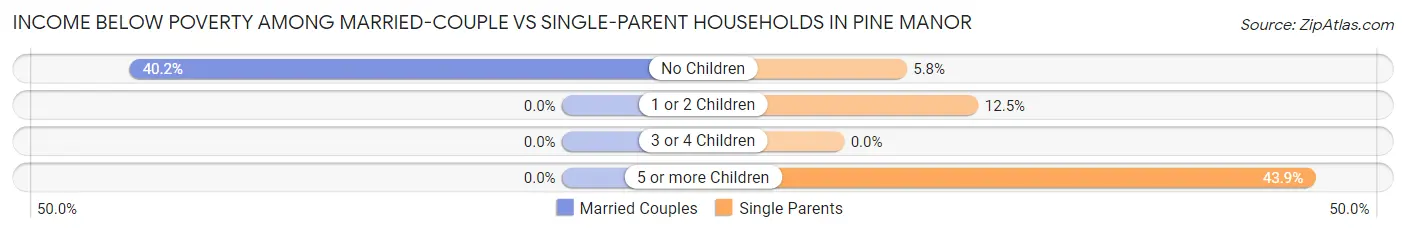
| Children | Married-Couple Families | Single-Parent Households |
| No Children | 39 (40.2%) | 12 (5.8%) |
| 1 or 2 Children | 0 (0.0%) | 17 (12.5%) |
| 3 or 4 Children | 0 (0.0%) | 0 (0.0%) |
| 5 or more Children | 0 (0.0%) | 36 (43.9%) |
| Total | 39 (15.5%) | 65 (15.3%) |
Race in Pine Manor
The most populous races in Pine Manor are Hispanic or Latino (2,473 | 62.7%), White / Caucasian (1,730 | 43.9%), and Two or more Races (1,290 | 32.7%).
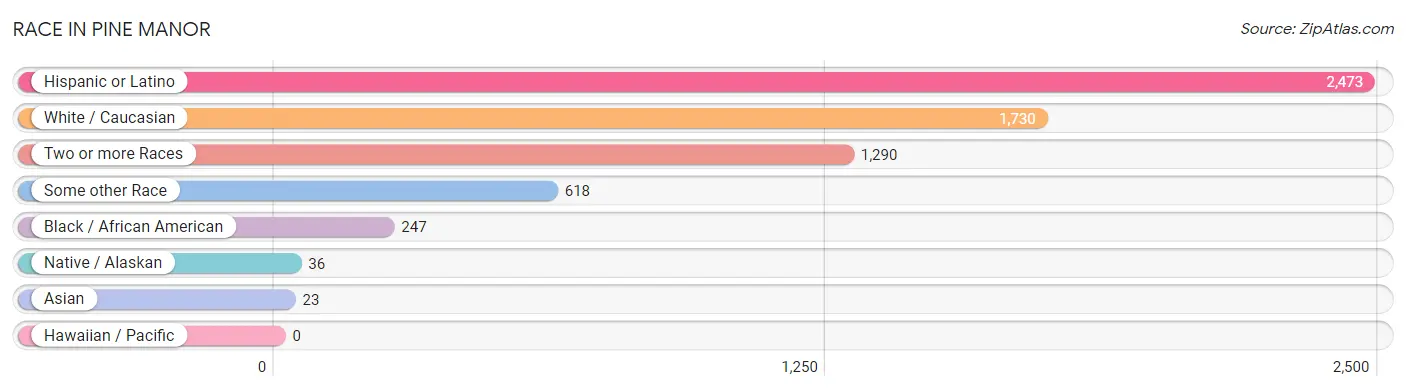
| Race | # Population | % Population |
| Asian | 23 | 0.6% |
| Black / African American | 247 | 6.3% |
| Hawaiian / Pacific | 0 | 0.0% |
| Hispanic or Latino | 2,473 | 62.7% |
| Native / Alaskan | 36 | 0.9% |
| White / Caucasian | 1,730 | 43.9% |
| Two or more Races | 1,290 | 32.7% |
| Some other Race | 618 | 15.7% |
| Total | 3,944 | 100.0% |
Ancestry in Pine Manor
The most populous ancestries reported in Pine Manor are Mexican (1,470 | 37.3%), Central American (510 | 12.9%), American (358 | 9.1%), Irish (349 | 8.8%), and Puerto Rican (298 | 7.6%), together accounting for 75.7% of all Pine Manor residents.
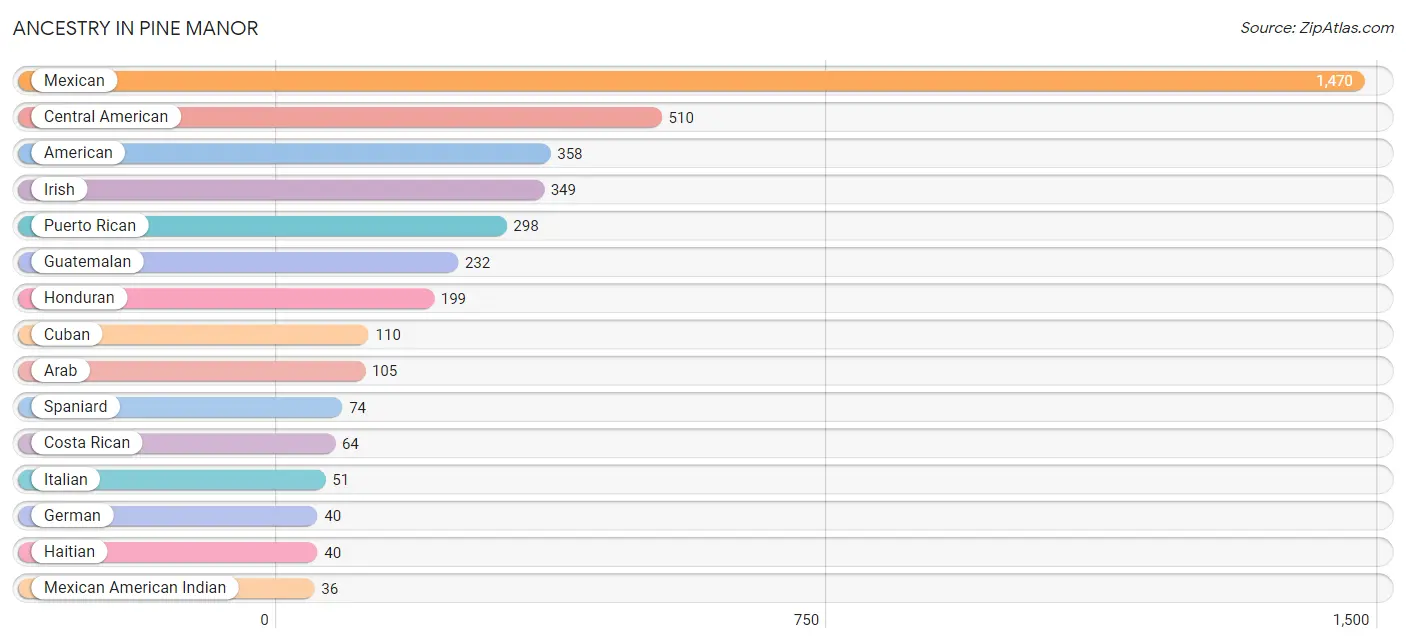
| Ancestry | # Population | % Population |
| American | 358 | 9.1% |
| Arab | 105 | 2.7% |
| British | 6 | 0.2% |
| Central American | 510 | 12.9% |
| Costa Rican | 64 | 1.6% |
| Cuban | 110 | 2.8% |
| Dutch | 18 | 0.5% |
| German | 40 | 1.0% |
| Guatemalan | 232 | 5.9% |
| Haitian | 40 | 1.0% |
| Honduran | 199 | 5.1% |
| Irish | 349 | 8.8% |
| Italian | 51 | 1.3% |
| Malaysian | 23 | 0.6% |
| Mexican | 1,470 | 37.3% |
| Mexican American Indian | 36 | 0.9% |
| Portuguese | 34 | 0.9% |
| Puerto Rican | 298 | 7.6% |
| Salvadoran | 15 | 0.4% |
| Scotch-Irish | 7 | 0.2% |
| Spaniard | 74 | 1.9% | View All 21 Rows |
Immigrants in Pine Manor
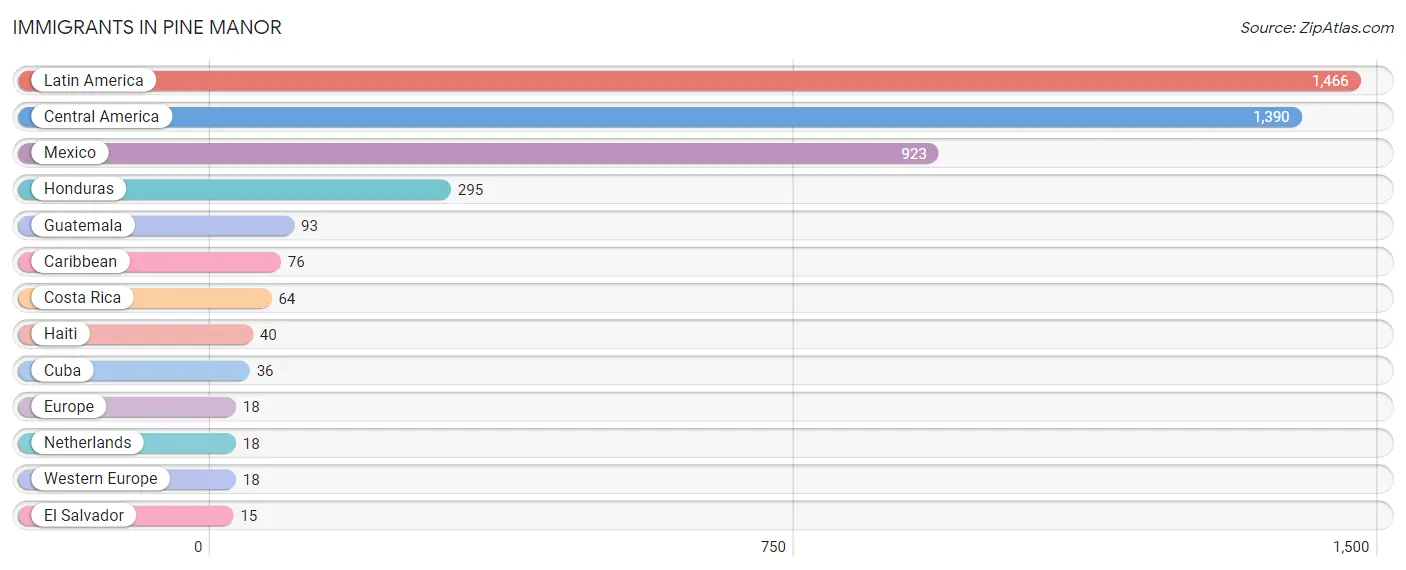
The most numerous immigrant groups reported in Pine Manor came from Latin America (1,466 | 37.2%), Central America (1,390 | 35.2%), Mexico (923 | 23.4%), Honduras (295 | 7.5%), and Guatemala (93 | 2.4%), together accounting for 105.6% of all Pine Manor residents.
| Immigration Origin | # Population | % Population |
| Caribbean | 76 | 1.9% |
| Central America | 1,390 | 35.2% |
| Costa Rica | 64 | 1.6% |
| Cuba | 36 | 0.9% |
| El Salvador | 15 | 0.4% |
| Europe | 18 | 0.5% |
| Guatemala | 93 | 2.4% |
| Haiti | 40 | 1.0% |
| Honduras | 295 | 7.5% |
| Latin America | 1,466 | 37.2% |
| Mexico | 923 | 23.4% |
| Netherlands | 18 | 0.5% |
| Western Europe | 18 | 0.5% | View All 13 Rows |
Sex and Age in Pine Manor
Sex and Age in Pine Manor
The most populous age groups in Pine Manor are 20 to 24 Years (376 | 14.2%) for men and 70 to 74 Years (203 | 15.7%) for women.
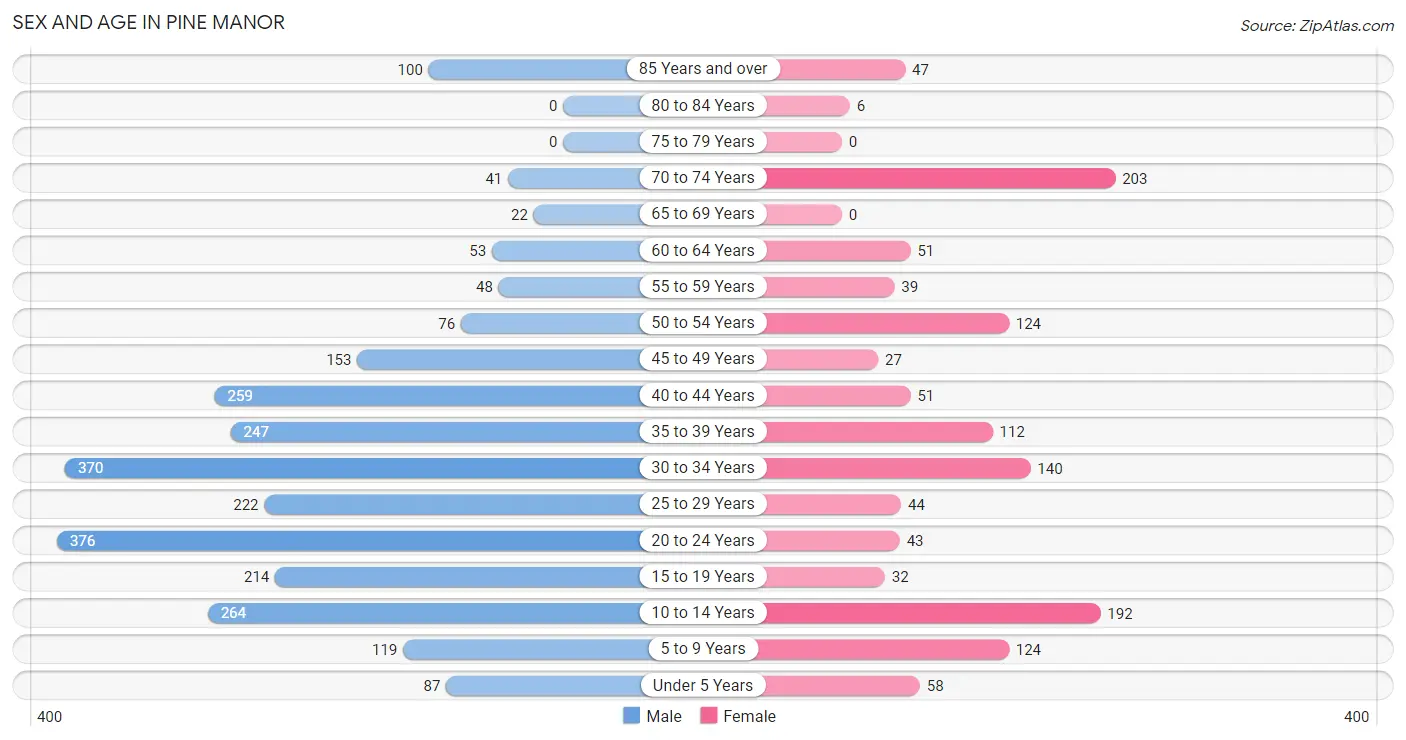
| Age Bracket | Male | Female |
| Under 5 Years | 87 (3.3%) | 58 (4.5%) |
| 5 to 9 Years | 119 (4.5%) | 124 (9.6%) |
| 10 to 14 Years | 264 (10.0%) | 192 (14.8%) |
| 15 to 19 Years | 214 (8.1%) | 32 (2.5%) |
| 20 to 24 Years | 376 (14.2%) | 43 (3.3%) |
| 25 to 29 Years | 222 (8.4%) | 44 (3.4%) |
| 30 to 34 Years | 370 (14.0%) | 140 (10.8%) |
| 35 to 39 Years | 247 (9.3%) | 112 (8.7%) |
| 40 to 44 Years | 259 (9.8%) | 51 (3.9%) |
| 45 to 49 Years | 153 (5.8%) | 27 (2.1%) |
| 50 to 54 Years | 76 (2.9%) | 124 (9.6%) |
| 55 to 59 Years | 48 (1.8%) | 39 (3.0%) |
| 60 to 64 Years | 53 (2.0%) | 51 (3.9%) |
| 65 to 69 Years | 22 (0.8%) | 0 (0.0%) |
| 70 to 74 Years | 41 (1.5%) | 203 (15.7%) |
| 75 to 79 Years | 0 (0.0%) | 0 (0.0%) |
| 80 to 84 Years | 0 (0.0%) | 6 (0.5%) |
| 85 Years and over | 100 (3.8%) | 47 (3.6%) |
| Total | 2,651 (100.0%) | 1,293 (100.0%) |
Families and Households in Pine Manor
Median Family Size in Pine Manor
The median family size in Pine Manor is 3.67 persons per family, with married-couple families (251 | 37.2%) accounting for the largest median family size of 4.53 persons per family. On the other hand, single female/mother families (188 | 27.9%) represent the smallest median family size with 2.37 persons per family.
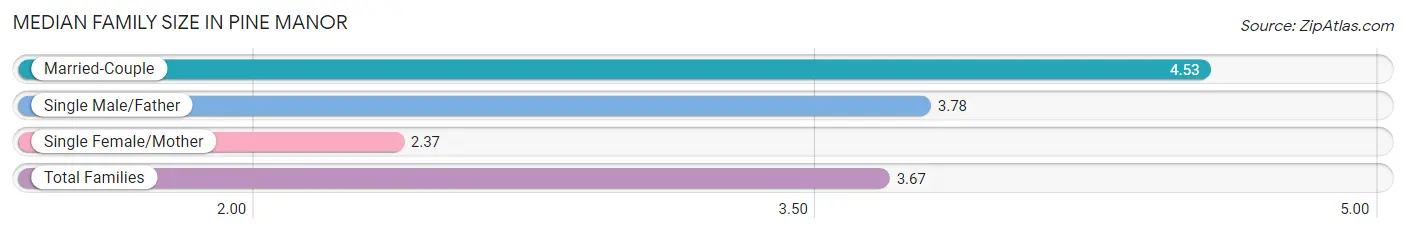
| Family Type | # Families | Family Size |
| Married-Couple | 251 (37.2%) | 4.53 |
| Single Male/Father | 236 (35.0%) | 3.78 |
| Single Female/Mother | 188 (27.9%) | 2.37 |
| Total Families | 675 (100.0%) | 3.67 |
Median Household Size in Pine Manor
The median household size in Pine Manor is 2.88 persons per household, with married-couple households (251 | 19.1%) accounting for the largest median household size of 4.99 persons per household. non-family households (637 | 48.5%) represent the smallest median household size with 1.47 persons per household.
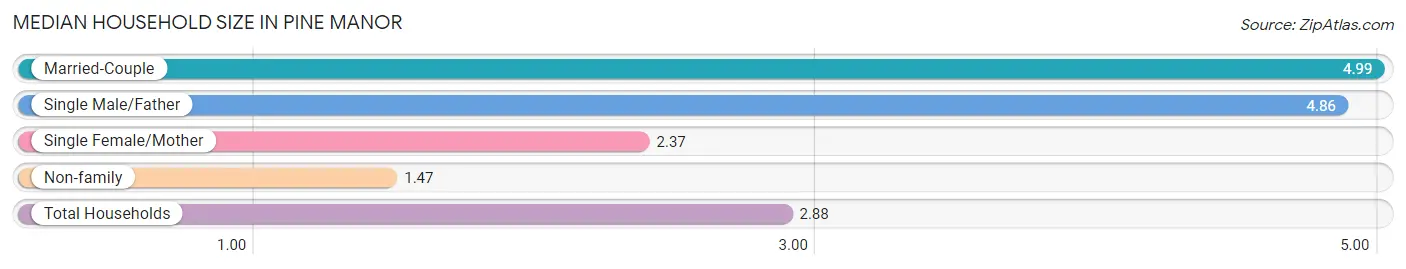
| Household Type | # Households | Household Size |
| Married-Couple | 251 (19.1%) | 4.99 |
| Single Male/Father | 236 (18.0%) | 4.86 |
| Single Female/Mother | 188 (14.3%) | 2.37 |
| Non-family | 637 (48.5%) | 1.47 |
| Total Households | 1,312 (100.0%) | 2.88 |
Household Size by Marriage Status in Pine Manor
Out of a total of 1,312 households in Pine Manor, 675 (51.4%) are family households, while 637 (48.5%) are nonfamily households. The most numerous type of family households are 2-person households, comprising 298, and the most common type of nonfamily households are 1-person households, comprising 439.
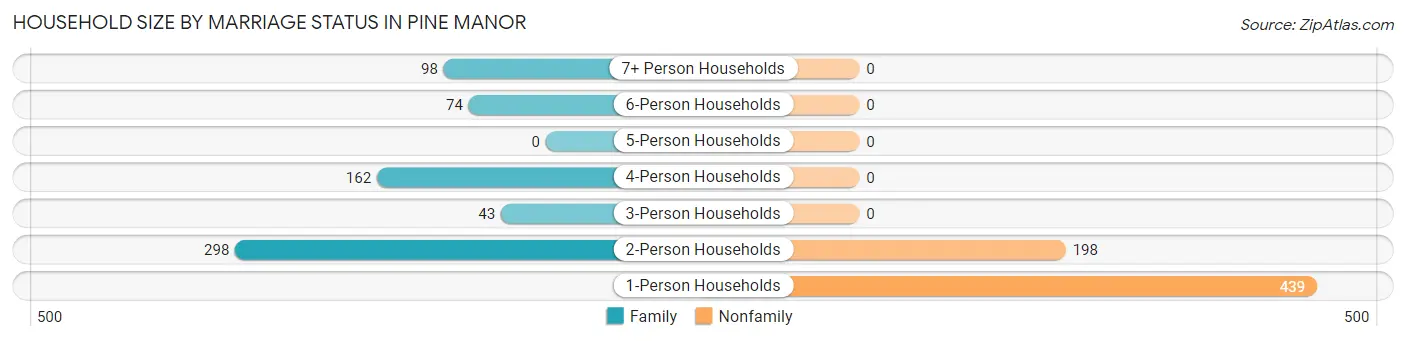
| Household Size | Family Households | Nonfamily Households |
| 1-Person Households | - | 439 (33.5%) |
| 2-Person Households | 298 (22.7%) | 198 (15.1%) |
| 3-Person Households | 43 (3.3%) | 0 (0.0%) |
| 4-Person Households | 162 (12.3%) | 0 (0.0%) |
| 5-Person Households | 0 (0.0%) | 0 (0.0%) |
| 6-Person Households | 74 (5.6%) | 0 (0.0%) |
| 7+ Person Households | 98 (7.5%) | 0 (0.0%) |
| Total | 675 (51.4%) | 637 (48.5%) |
Female Fertility in Pine Manor
Fertility by Age in Pine Manor
| Age Bracket | Women with Births | Births / 1,000 Women |
| 15 to 19 years | 0 (0.0%) | 0.0 |
| 20 to 34 years | 0 (0.0%) | 0.0 |
| 35 to 50 years | 0 (0.0%) | 0.0 |
| Total | 0 (0.0%) | 0.0 |
Fertility by Age by Marriage Status in Pine Manor
| Age Bracket | Married | Unmarried |
| 15 to 19 years | 0 (0.0%) | 0 (0.0%) |
| 20 to 34 years | 0 (0.0%) | 0 (0.0%) |
| 35 to 50 years | 0 (0.0%) | 0 (0.0%) |
| Total | 0 (0.0%) | 0 (0.0%) |
Fertility by Education in Pine Manor
| Educational Attainment | Women with Births | Births / 1,000 Women |
| Less than High School | 0 (0.0%) | 0.0 |
| High School Diploma | 0 (0.0%) | 0.0 |
| College or Associate's Degree | 0 (0.0%) | 0.0 |
| Bachelor's Degree | 0 (0.0%) | 0.0 |
| Graduate Degree | 0 (0.0%) | 0.0 |
| Total | 0 (0.0%) | 0.0 |
Fertility by Education by Marriage Status in Pine Manor
| Educational Attainment | Married | Unmarried |
| Less than High School | 0 (0.0%) | 0 (0.0%) |
| High School Diploma | 0 (0.0%) | 0 (0.0%) |
| College or Associate's Degree | 0 (0.0%) | 0 (0.0%) |
| Bachelor's Degree | 0 (0.0%) | 0 (0.0%) |
| Graduate Degree | 0 (0.0%) | 0 (0.0%) |
| Total | 0 (0.0%) | 0 (0.0%) |
Employment Characteristics in Pine Manor
Employment by Class of Employer in Pine Manor
Among the 1,623 employed individuals in Pine Manor, private company employees (1,326 | 81.7%), self-employed (incorporated) (134 | 8.3%), and self-employed (not incorporated) (70 | 4.3%) make up the most common classes of employment.
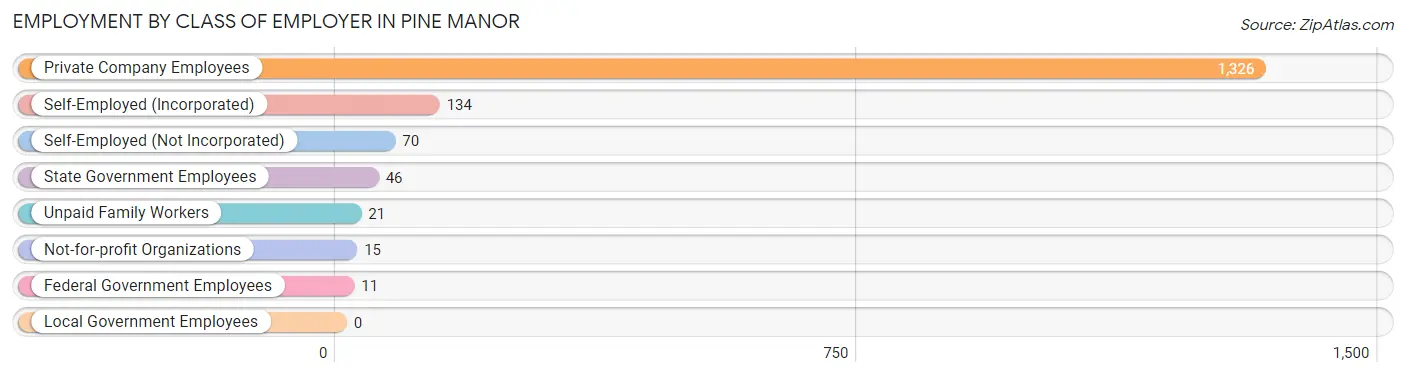
| Employer Class | # Employees | % Employees |
| Private Company Employees | 1,326 | 81.7% |
| Self-Employed (Incorporated) | 134 | 8.3% |
| Self-Employed (Not Incorporated) | 70 | 4.3% |
| Not-for-profit Organizations | 15 | 0.9% |
| Local Government Employees | 0 | 0.0% |
| State Government Employees | 46 | 2.8% |
| Federal Government Employees | 11 | 0.7% |
| Unpaid Family Workers | 21 | 1.3% |
| Total | 1,623 | 100.0% |
Employment Status by Age in Pine Manor
According to the labor force statistics for Pine Manor, out of the total population over 16 years of age (3,077), 59.7% or 1,837 individuals are in the labor force, with 11.7% or 215 of them unemployed. The age group with the highest labor force participation rate is 55 to 59 years, with 100.0% or 87 individuals in the labor force. Within the labor force, the 30 to 34 years age range has the highest percentage of unemployed individuals, with 46.8% or 116 of them being unemployed.
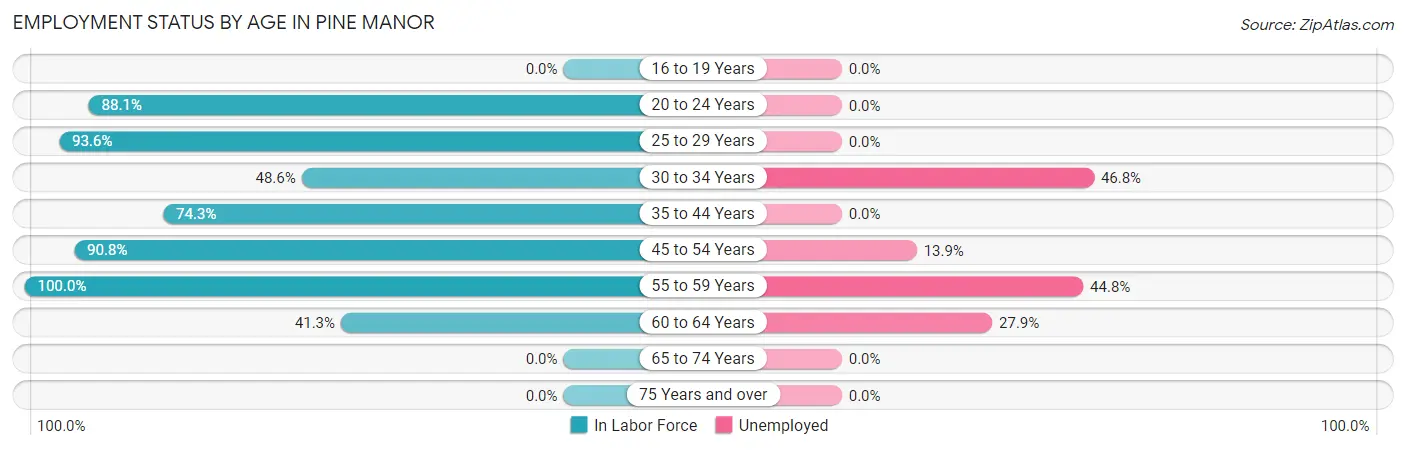
| Age Bracket | In Labor Force | Unemployed |
| 16 to 19 Years | 0 (0.0%) | 0 (0.0%) |
| 20 to 24 Years | 369 (88.1%) | 0 (0.0%) |
| 25 to 29 Years | 249 (93.6%) | 0 (0.0%) |
| 30 to 34 Years | 248 (48.6%) | 116 (46.8%) |
| 35 to 44 Years | 497 (74.3%) | 0 (0.0%) |
| 45 to 54 Years | 345 (90.8%) | 48 (13.9%) |
| 55 to 59 Years | 87 (100.0%) | 39 (44.8%) |
| 60 to 64 Years | 43 (41.3%) | 12 (27.9%) |
| 65 to 74 Years | 0 (0.0%) | 0 (0.0%) |
| 75 Years and over | 0 (0.0%) | 0 (0.0%) |
| Total | 1,837 (59.7%) | 215 (11.7%) |
Employment Status by Educational Attainment in Pine Manor
According to labor force statistics for Pine Manor, 72.9% of individuals (1,470) out of the total population between 25 and 64 years of age (2,016) are in the labor force, with 14.6% or 215 of them being unemployed. The group with the highest labor force participation rate are those with the educational attainment of college / associate degree, with 100.0% or 141 individuals in the labor force. Within the labor force, individuals with high school diploma education have the highest percentage of unemployment, with 39.6% or 215 of them being unemployed.
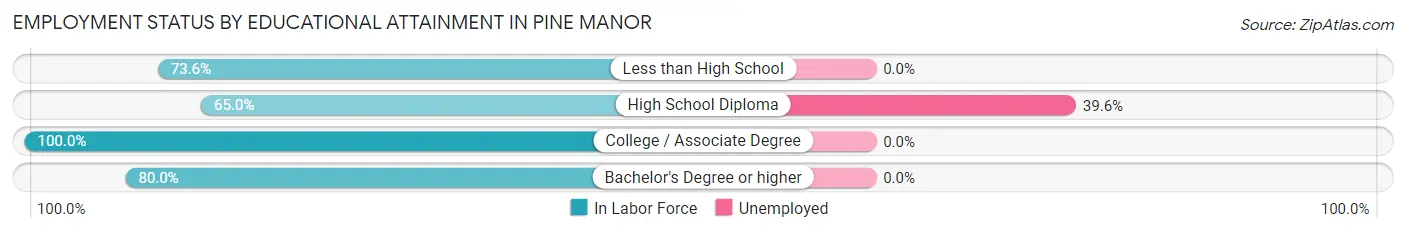
| Educational Attainment | In Labor Force | Unemployed |
| Less than High School | 529 (73.6%) | 0 (0.0%) |
| High School Diploma | 543 (65.0%) | 331 (39.6%) |
| College / Associate Degree | 141 (100.0%) | 0 (0.0%) |
| Bachelor's Degree or higher | 256 (80.0%) | 0 (0.0%) |
| Total | 1,470 (72.9%) | 294 (14.6%) |
Employment Occupations by Sex in Pine Manor
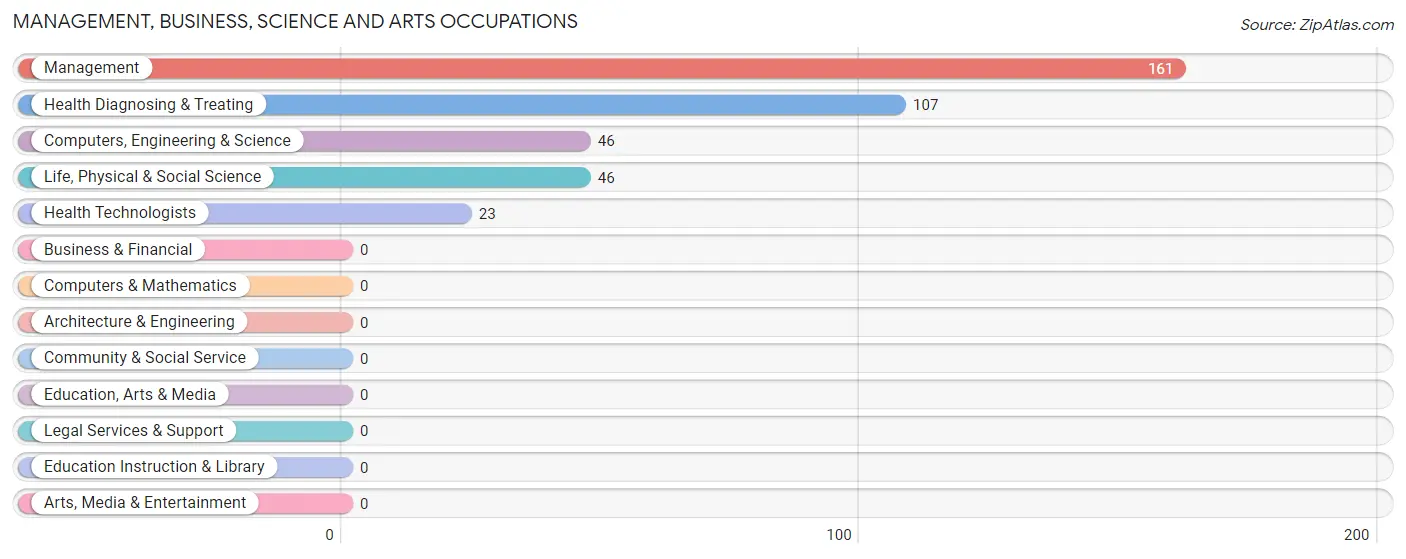
Management, Business, Science and Arts Occupations
The most common Management, Business, Science and Arts occupations in Pine Manor are Management (161 | 9.9%), Health Diagnosing & Treating (107 | 6.6%), Computers, Engineering & Science (46 | 2.8%), Life, Physical & Social Science (46 | 2.8%), and Health Technologists (23 | 1.4%).
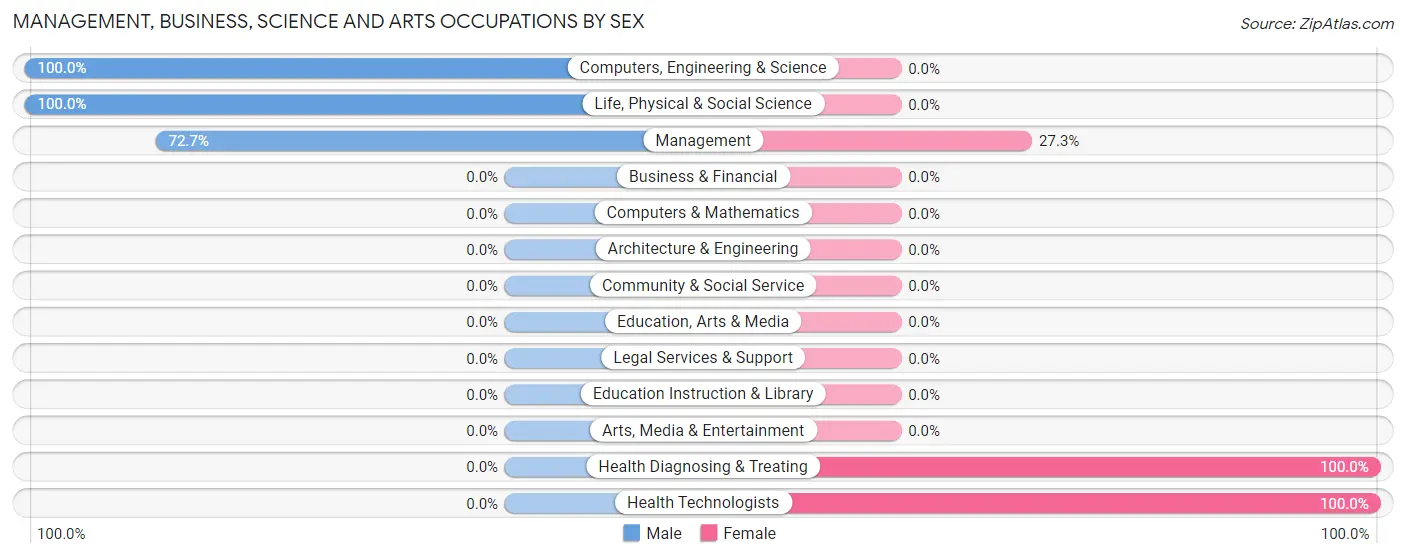
Management, Business, Science and Arts Occupations by Sex
Within the Management, Business, Science and Arts occupations in Pine Manor, the most male-oriented occupations are Computers, Engineering & Science (100.0%), Life, Physical & Social Science (100.0%), and Management (72.7%), while the most female-oriented occupations are Health Diagnosing & Treating (100.0%), Health Technologists (100.0%), and Management (27.3%).
| Occupation | Male | Female |
| Management | 117 (72.7%) | 44 (27.3%) |
| Business & Financial | 0 (0.0%) | 0 (0.0%) |
| Computers, Engineering & Science | 46 (100.0%) | 0 (0.0%) |
| Computers & Mathematics | 0 (0.0%) | 0 (0.0%) |
| Architecture & Engineering | 0 (0.0%) | 0 (0.0%) |
| Life, Physical & Social Science | 46 (100.0%) | 0 (0.0%) |
| Community & Social Service | 0 (0.0%) | 0 (0.0%) |
| Education, Arts & Media | 0 (0.0%) | 0 (0.0%) |
| Legal Services & Support | 0 (0.0%) | 0 (0.0%) |
| Education Instruction & Library | 0 (0.0%) | 0 (0.0%) |
| Arts, Media & Entertainment | 0 (0.0%) | 0 (0.0%) |
| Health Diagnosing & Treating | 0 (0.0%) | 107 (100.0%) |
| Health Technologists | 0 (0.0%) | 23 (100.0%) |
| Total (Category) | 163 (51.9%) | 151 (48.1%) |
| Total (Overall) | 1,290 (79.5%) | 333 (20.5%) |
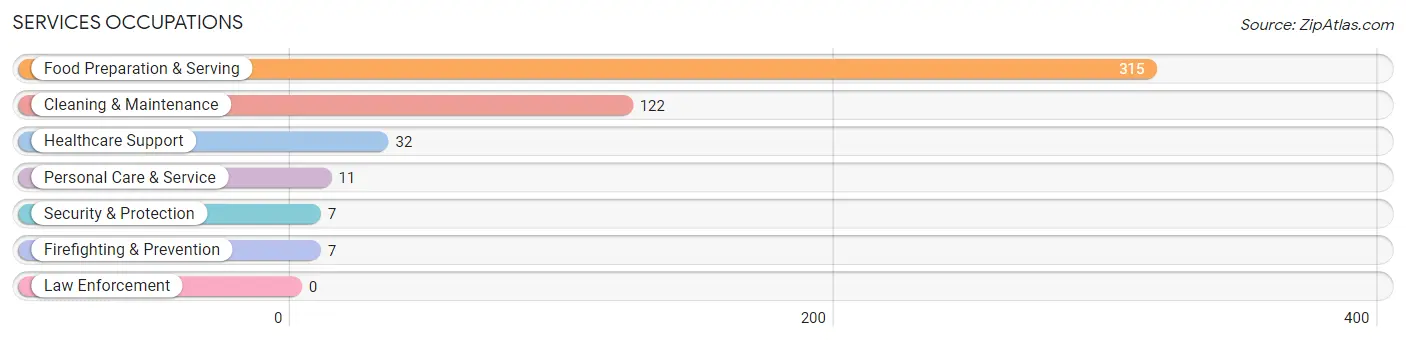
Services Occupations
The most common Services occupations in Pine Manor are Food Preparation & Serving (315 | 19.4%), Cleaning & Maintenance (122 | 7.5%), Healthcare Support (32 | 2.0%), Personal Care & Service (11 | 0.7%), and Security & Protection (7 | 0.4%).
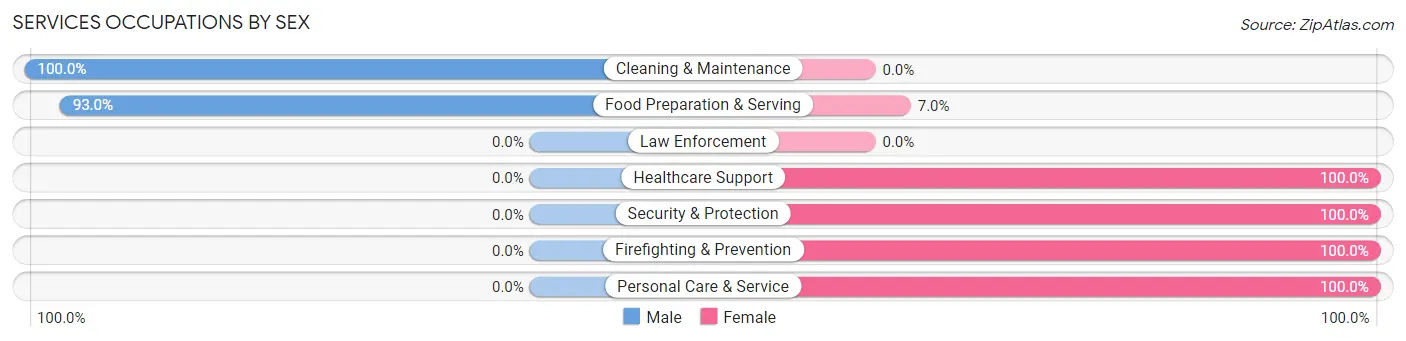
Services Occupations by Sex
Within the Services occupations in Pine Manor, the most male-oriented occupations are Cleaning & Maintenance (100.0%), and Food Preparation & Serving (93.0%), while the most female-oriented occupations are Healthcare Support (100.0%), Security & Protection (100.0%), and Firefighting & Prevention (100.0%).
| Occupation | Male | Female |
| Healthcare Support | 0 (0.0%) | 32 (100.0%) |
| Security & Protection | 0 (0.0%) | 7 (100.0%) |
| Firefighting & Prevention | 0 (0.0%) | 7 (100.0%) |
| Law Enforcement | 0 (0.0%) | 0 (0.0%) |
| Food Preparation & Serving | 293 (93.0%) | 22 (7.0%) |
| Cleaning & Maintenance | 122 (100.0%) | 0 (0.0%) |
| Personal Care & Service | 0 (0.0%) | 11 (100.0%) |
| Total (Category) | 415 (85.2%) | 72 (14.8%) |
| Total (Overall) | 1,290 (79.5%) | 333 (20.5%) |
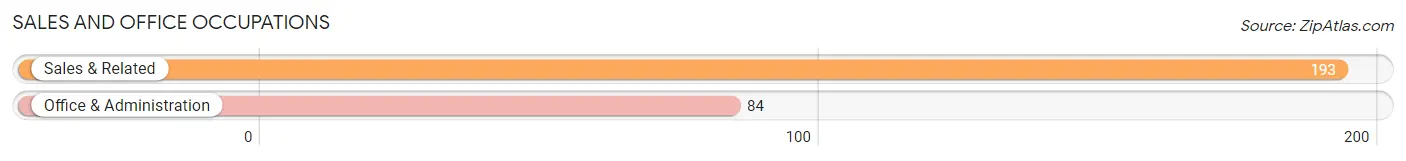
Sales and Office Occupations
The most common Sales and Office occupations in Pine Manor are Sales & Related (193 | 11.9%), and Office & Administration (84 | 5.2%).
Sales and Office Occupations by Sex
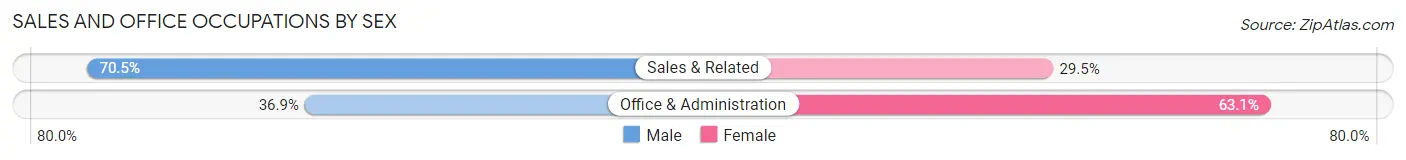
| Occupation | Male | Female |
| Sales & Related | 136 (70.5%) | 57 (29.5%) |
| Office & Administration | 31 (36.9%) | 53 (63.1%) |
| Total (Category) | 167 (60.3%) | 110 (39.7%) |
| Total (Overall) | 1,290 (79.5%) | 333 (20.5%) |
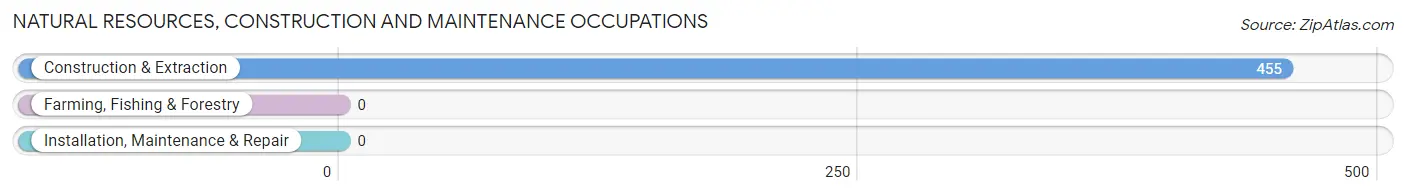
Natural Resources, Construction and Maintenance Occupations
The most common Natural Resources, Construction and Maintenance occupations in Pine Manor are , and Construction & Extraction (455 | 28.0%).
Natural Resources, Construction and Maintenance Occupations by Sex
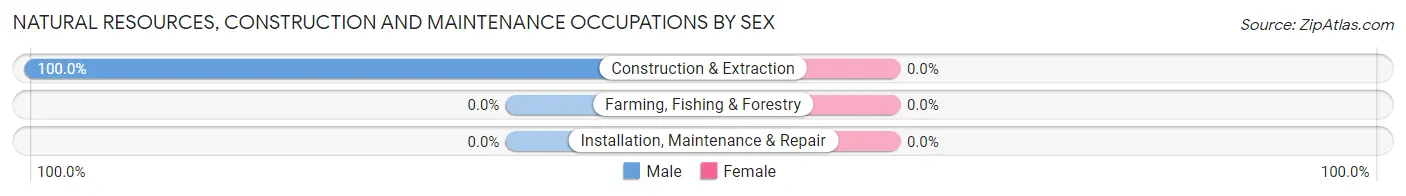
| Occupation | Male | Female |
| Farming, Fishing & Forestry | 0 (0.0%) | 0 (0.0%) |
| Construction & Extraction | 455 (100.0%) | 0 (0.0%) |
| Installation, Maintenance & Repair | 0 (0.0%) | 0 (0.0%) |
| Total (Category) | 455 (100.0%) | 0 (0.0%) |
| Total (Overall) | 1,290 (79.5%) | 333 (20.5%) |
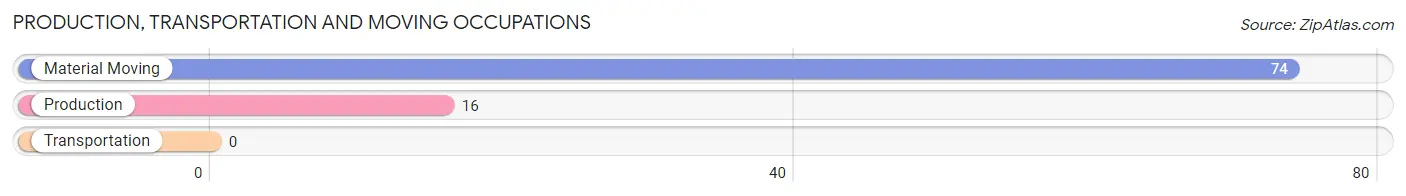
Production, Transportation and Moving Occupations
The most common Production, Transportation and Moving occupations in Pine Manor are Material Moving (74 | 4.6%), and Production (16 | 1.0%).
Production, Transportation and Moving Occupations by Sex
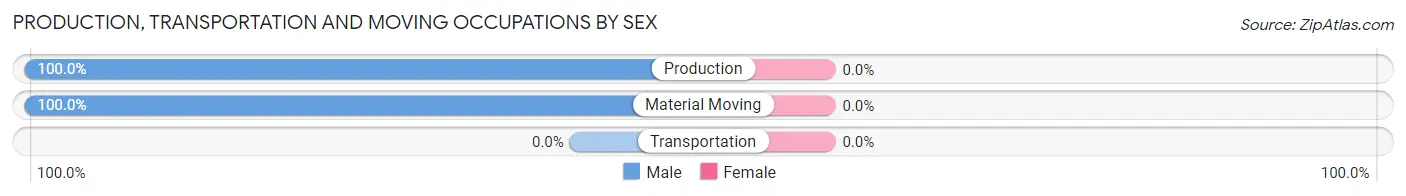
| Occupation | Male | Female |
| Production | 16 (100.0%) | 0 (0.0%) |
| Transportation | 0 (0.0%) | 0 (0.0%) |
| Material Moving | 74 (100.0%) | 0 (0.0%) |
| Total (Category) | 90 (100.0%) | 0 (0.0%) |
| Total (Overall) | 1,290 (79.5%) | 333 (20.5%) |
Employment Industries by Sex in Pine Manor
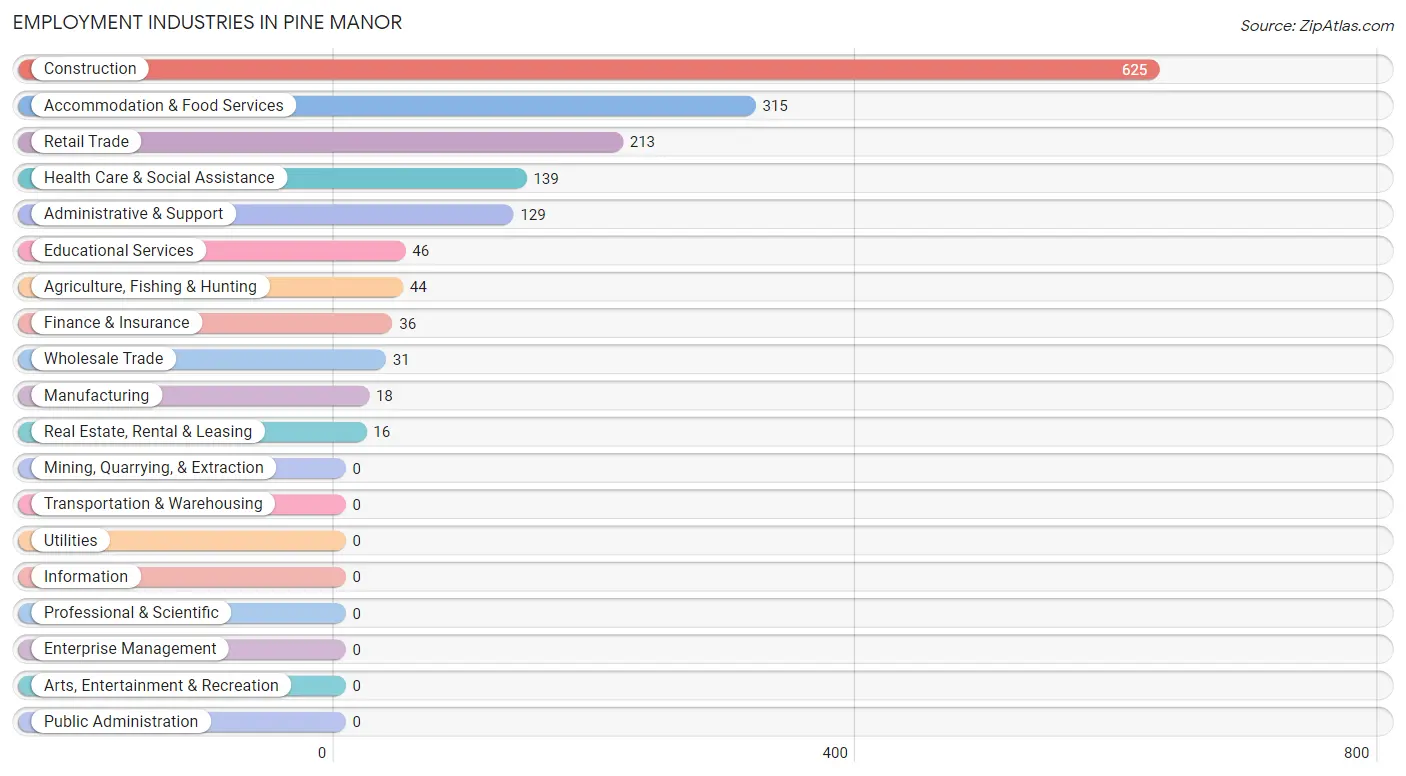
Employment Industries in Pine Manor
The major employment industries in Pine Manor include Construction (625 | 38.5%), Accommodation & Food Services (315 | 19.4%), Retail Trade (213 | 13.1%), Health Care & Social Assistance (139 | 8.6%), and Administrative & Support (129 | 8.0%).
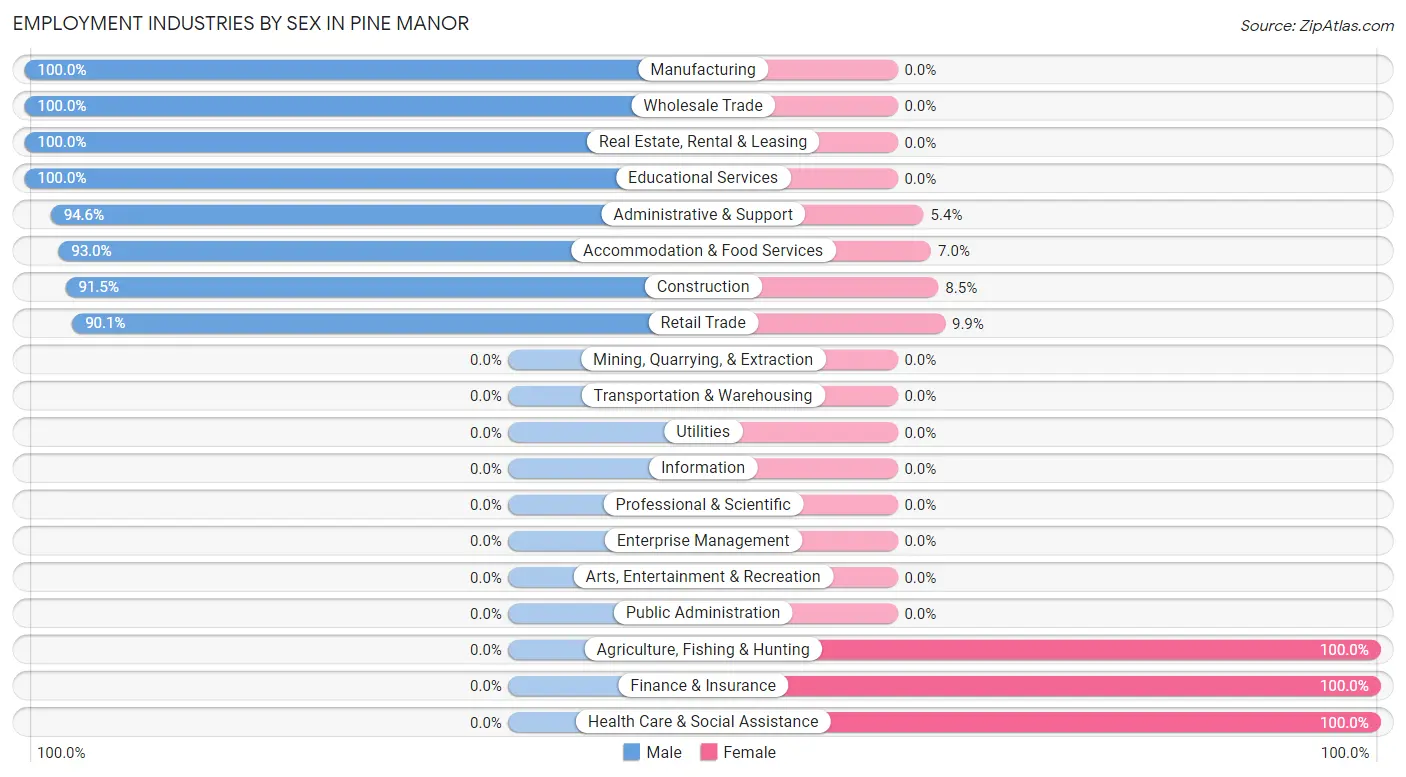
Employment Industries by Sex in Pine Manor
The Pine Manor industries that see more men than women are Manufacturing (100.0%), Wholesale Trade (100.0%), and Real Estate, Rental & Leasing (100.0%), whereas the industries that tend to have a higher number of women are Agriculture, Fishing & Hunting (100.0%), Finance & Insurance (100.0%), and Health Care & Social Assistance (100.0%).
| Industry | Male | Female |
| Agriculture, Fishing & Hunting | 0 (0.0%) | 44 (100.0%) |
| Mining, Quarrying, & Extraction | 0 (0.0%) | 0 (0.0%) |
| Construction | 572 (91.5%) | 53 (8.5%) |
| Manufacturing | 18 (100.0%) | 0 (0.0%) |
| Wholesale Trade | 31 (100.0%) | 0 (0.0%) |
| Retail Trade | 192 (90.1%) | 21 (9.9%) |
| Transportation & Warehousing | 0 (0.0%) | 0 (0.0%) |
| Utilities | 0 (0.0%) | 0 (0.0%) |
| Information | 0 (0.0%) | 0 (0.0%) |
| Finance & Insurance | 0 (0.0%) | 36 (100.0%) |
| Real Estate, Rental & Leasing | 16 (100.0%) | 0 (0.0%) |
| Professional & Scientific | 0 (0.0%) | 0 (0.0%) |
| Enterprise Management | 0 (0.0%) | 0 (0.0%) |
| Administrative & Support | 122 (94.6%) | 7 (5.4%) |
| Educational Services | 46 (100.0%) | 0 (0.0%) |
| Health Care & Social Assistance | 0 (0.0%) | 139 (100.0%) |
| Arts, Entertainment & Recreation | 0 (0.0%) | 0 (0.0%) |
| Accommodation & Food Services | 293 (93.0%) | 22 (7.0%) |
| Public Administration | 0 (0.0%) | 0 (0.0%) |
| Total | 1,290 (79.5%) | 333 (20.5%) |
Education in Pine Manor
School Enrollment in Pine Manor
The most common levels of schooling among the 1,154 students in Pine Manor are high school (302 | 26.2%), middle school (300 | 26.0%), and kindergarten (215 | 18.6%).
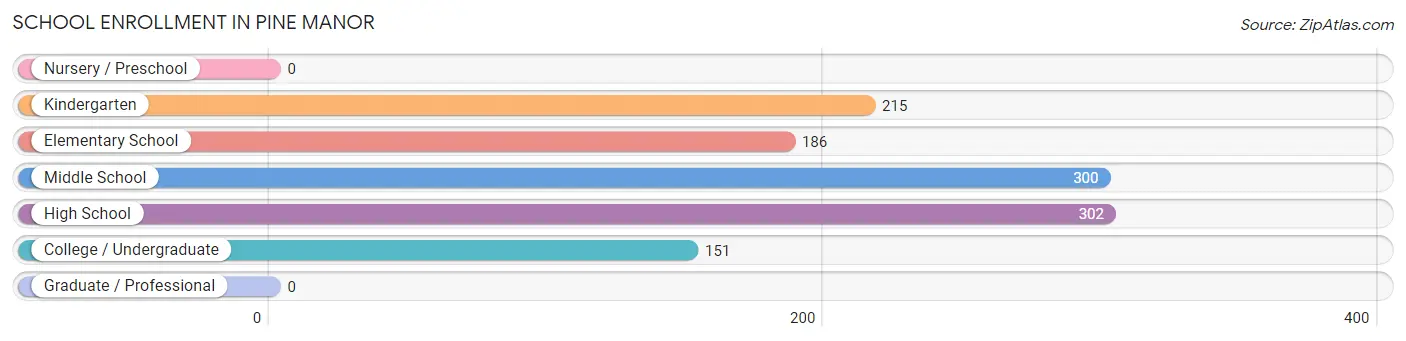
| School Level | # Students | % Students |
| Nursery / Preschool | 0 | 0.0% |
| Kindergarten | 215 | 18.6% |
| Elementary School | 186 | 16.1% |
| Middle School | 300 | 26.0% |
| High School | 302 | 26.2% |
| College / Undergraduate | 151 | 13.1% |
| Graduate / Professional | 0 | 0.0% |
| Total | 1,154 | 100.0% |
School Enrollment by Age by Funding Source in Pine Manor
Out of a total of 1,154 students who are enrolled in schools in Pine Manor, 63 (5.5%) attend a private institution, while the remaining 1,091 (94.5%) are enrolled in public schools. The age group of 25 to 34 year olds has the highest likelihood of being enrolled in private schools, with 53 (100.0% in the age bracket) enrolled. Conversely, the age group of 3 to 4 year olds has the lowest likelihood of being enrolled in a private school, with 58 (100.0% in the age bracket) attending a public institution.
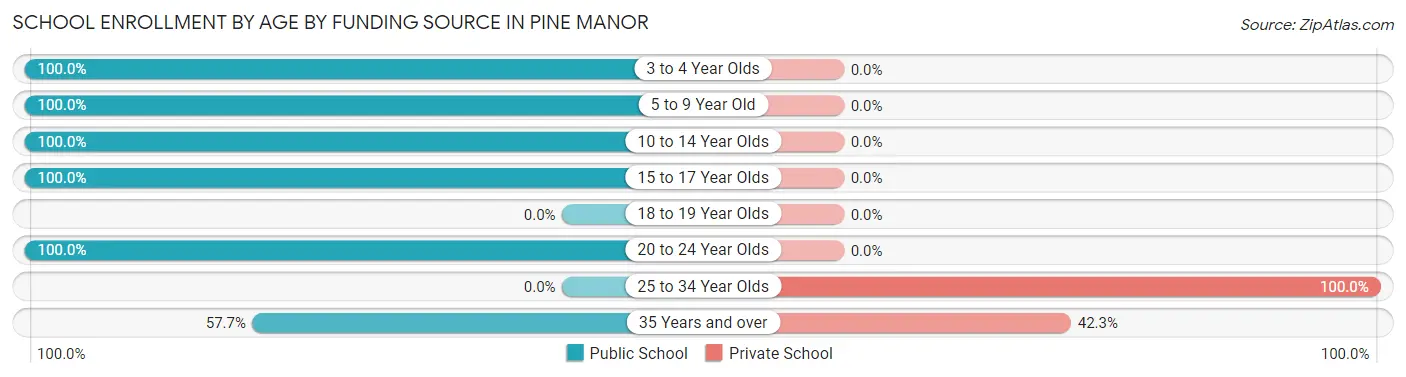
| Age Bracket | Public School | Private School |
| 3 to 4 Year Olds | 58 (100.0%) | 0 (0.0%) |
| 5 to 9 Year Old | 243 (100.0%) | 0 (0.0%) |
| 10 to 14 Year Olds | 456 (100.0%) | 0 (0.0%) |
| 15 to 17 Year Olds | 246 (100.0%) | 0 (0.0%) |
| 18 to 19 Year Olds | 0 (0.0%) | 0 (0.0%) |
| 20 to 24 Year Olds | 72 (100.0%) | 0 (0.0%) |
| 25 to 34 Year Olds | 0 (0.0%) | 53 (100.0%) |
| 35 Years and over | 15 (57.7%) | 11 (42.3%) |
| Total | 1,091 (94.5%) | 63 (5.5%) |
Educational Attainment by Field of Study in Pine Manor
Communications (105 | 30.3%), arts & humanities (74 | 21.3%), education (64 | 18.4%), psychology (46 | 13.3%), and engineering (40 | 11.5%) are the most common fields of study among 347 individuals in Pine Manor who have obtained a bachelor's degree or higher.
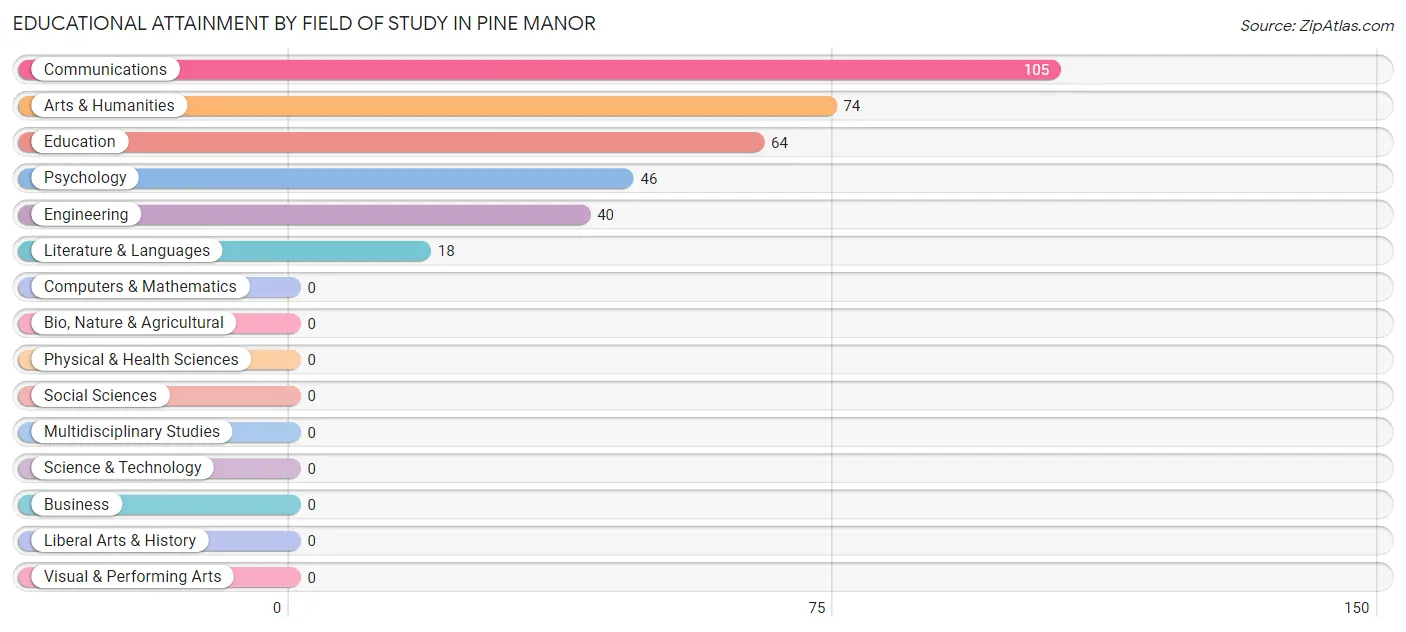
| Field of Study | # Graduates | % Graduates |
| Computers & Mathematics | 0 | 0.0% |
| Bio, Nature & Agricultural | 0 | 0.0% |
| Physical & Health Sciences | 0 | 0.0% |
| Psychology | 46 | 13.3% |
| Social Sciences | 0 | 0.0% |
| Engineering | 40 | 11.5% |
| Multidisciplinary Studies | 0 | 0.0% |
| Science & Technology | 0 | 0.0% |
| Business | 0 | 0.0% |
| Education | 64 | 18.4% |
| Literature & Languages | 18 | 5.2% |
| Liberal Arts & History | 0 | 0.0% |
| Visual & Performing Arts | 0 | 0.0% |
| Communications | 105 | 30.3% |
| Arts & Humanities | 74 | 21.3% |
| Total | 347 | 100.0% |
Transportation & Commute in Pine Manor
Vehicle Availability by Sex in Pine Manor
The most prevalent vehicle ownership categories in Pine Manor are males with 2 vehicles (557, accounting for 43.2%) and females with 2 vehicles (11, making up 167.3%).
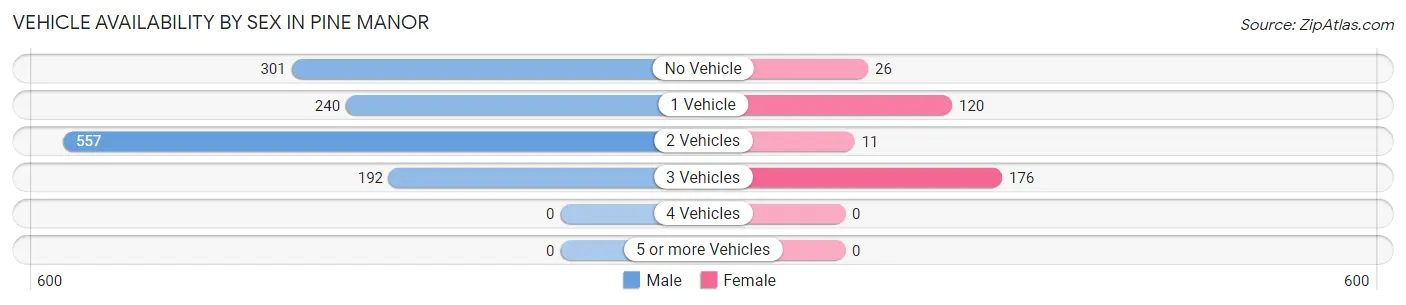
| Vehicles Available | Male | Female |
| No Vehicle | 301 (23.3%) | 26 (7.8%) |
| 1 Vehicle | 240 (18.6%) | 120 (36.0%) |
| 2 Vehicles | 557 (43.2%) | 11 (3.3%) |
| 3 Vehicles | 192 (14.9%) | 176 (52.8%) |
| 4 Vehicles | 0 (0.0%) | 0 (0.0%) |
| 5 or more Vehicles | 0 (0.0%) | 0 (0.0%) |
| Total | 1,290 (100.0%) | 333 (100.0%) |
Commute Time in Pine Manor
The most frequently occuring commute durations in Pine Manor are 15 to 19 minutes (514 commuters, 33.3%), 20 to 24 minutes (183 commuters, 11.8%), and 45 to 59 minutes (154 commuters, 10.0%).
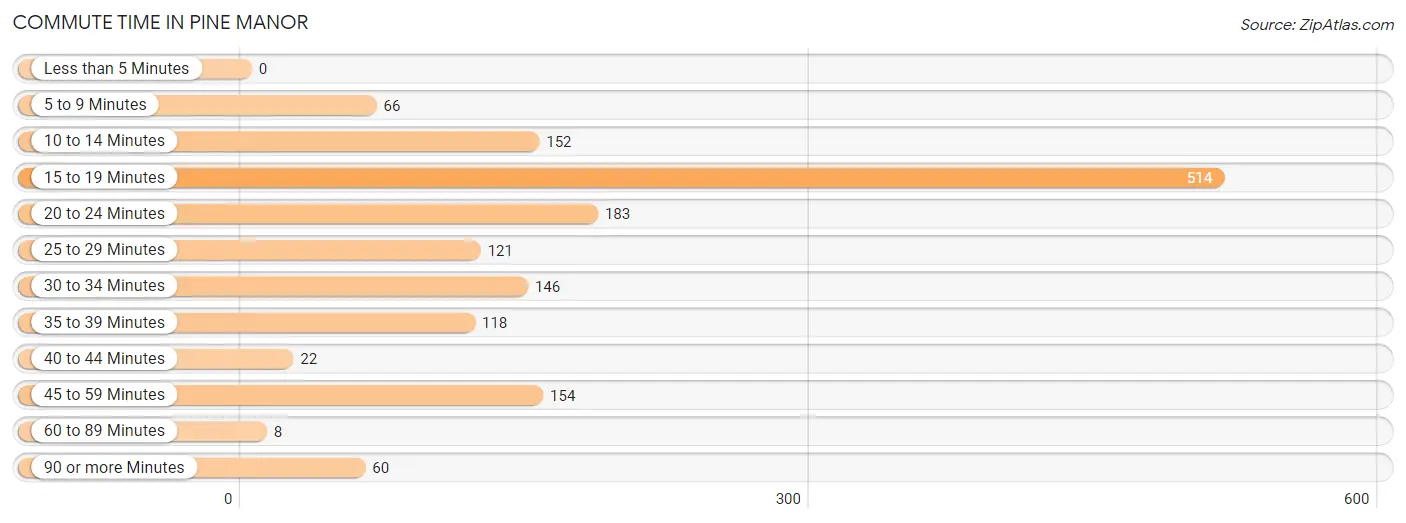
| Commute Time | # Commuters | % Commuters |
| Less than 5 Minutes | 0 | 0.0% |
| 5 to 9 Minutes | 66 | 4.3% |
| 10 to 14 Minutes | 152 | 9.8% |
| 15 to 19 Minutes | 514 | 33.3% |
| 20 to 24 Minutes | 183 | 11.8% |
| 25 to 29 Minutes | 121 | 7.8% |
| 30 to 34 Minutes | 146 | 9.5% |
| 35 to 39 Minutes | 118 | 7.6% |
| 40 to 44 Minutes | 22 | 1.4% |
| 45 to 59 Minutes | 154 | 10.0% |
| 60 to 89 Minutes | 8 | 0.5% |
| 90 or more Minutes | 60 | 3.9% |
Commute Time by Sex in Pine Manor
The most common commute times in Pine Manor are 15 to 19 minutes (394 commuters, 32.5%) for males and 15 to 19 minutes (120 commuters, 36.0%) for females.
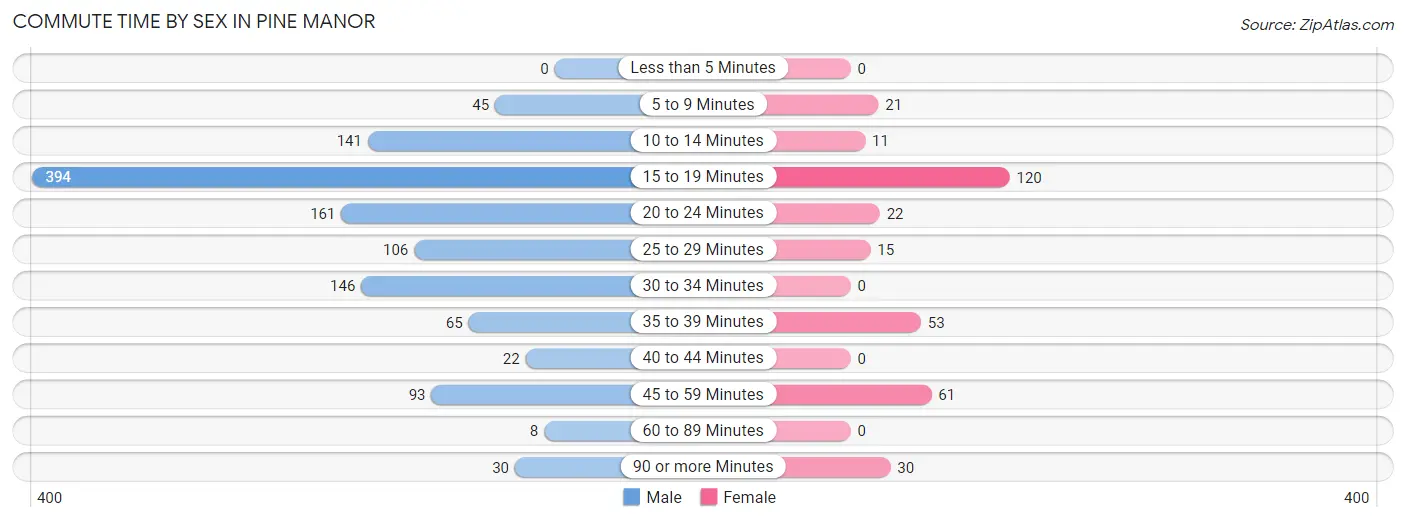
| Commute Time | Male | Female |
| Less than 5 Minutes | 0 (0.0%) | 0 (0.0%) |
| 5 to 9 Minutes | 45 (3.7%) | 21 (6.3%) |
| 10 to 14 Minutes | 141 (11.6%) | 11 (3.3%) |
| 15 to 19 Minutes | 394 (32.5%) | 120 (36.0%) |
| 20 to 24 Minutes | 161 (13.3%) | 22 (6.6%) |
| 25 to 29 Minutes | 106 (8.7%) | 15 (4.5%) |
| 30 to 34 Minutes | 146 (12.1%) | 0 (0.0%) |
| 35 to 39 Minutes | 65 (5.4%) | 53 (15.9%) |
| 40 to 44 Minutes | 22 (1.8%) | 0 (0.0%) |
| 45 to 59 Minutes | 93 (7.7%) | 61 (18.3%) |
| 60 to 89 Minutes | 8 (0.7%) | 0 (0.0%) |
| 90 or more Minutes | 30 (2.5%) | 30 (9.0%) |
Time of Departure to Work by Sex in Pine Manor
The most frequent times of departure to work in Pine Manor are 6:00 AM to 6:29 AM (268, 22.1%) for males and 6:00 AM to 6:29 AM (114, 34.2%) for females.
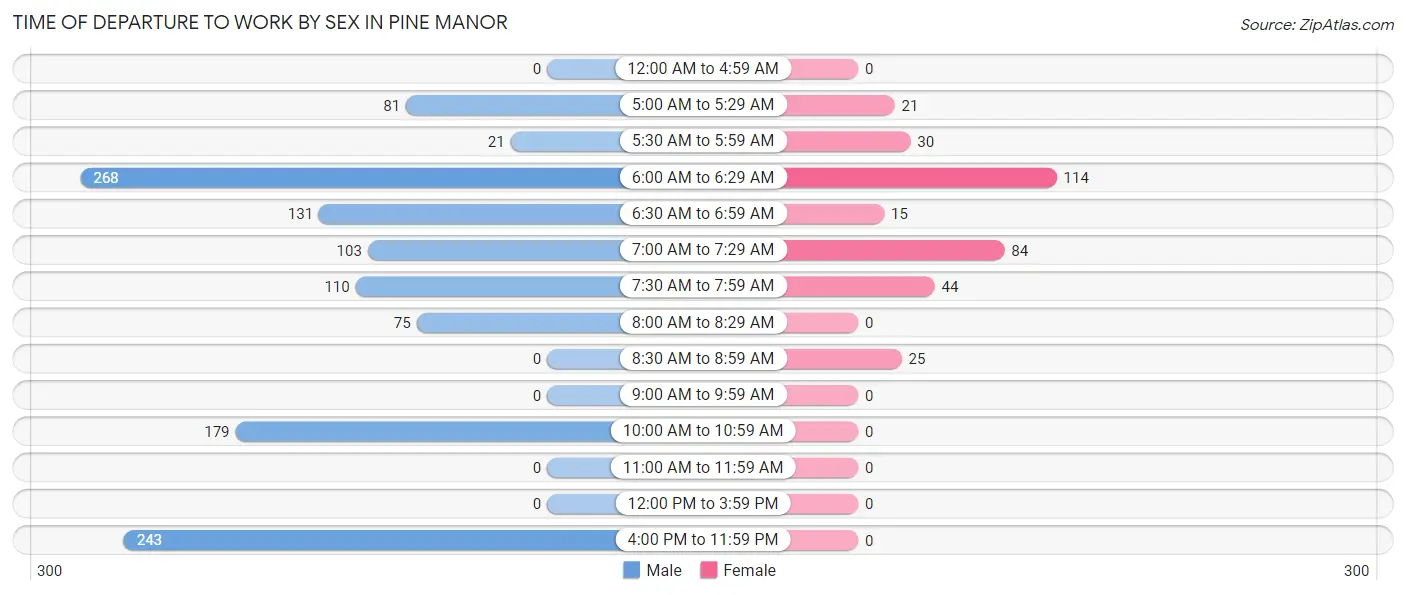
| Time of Departure | Male | Female |
| 12:00 AM to 4:59 AM | 0 (0.0%) | 0 (0.0%) |
| 5:00 AM to 5:29 AM | 81 (6.7%) | 21 (6.3%) |
| 5:30 AM to 5:59 AM | 21 (1.7%) | 30 (9.0%) |
| 6:00 AM to 6:29 AM | 268 (22.1%) | 114 (34.2%) |
| 6:30 AM to 6:59 AM | 131 (10.8%) | 15 (4.5%) |
| 7:00 AM to 7:29 AM | 103 (8.5%) | 84 (25.2%) |
| 7:30 AM to 7:59 AM | 110 (9.1%) | 44 (13.2%) |
| 8:00 AM to 8:29 AM | 75 (6.2%) | 0 (0.0%) |
| 8:30 AM to 8:59 AM | 0 (0.0%) | 25 (7.5%) |
| 9:00 AM to 9:59 AM | 0 (0.0%) | 0 (0.0%) |
| 10:00 AM to 10:59 AM | 179 (14.8%) | 0 (0.0%) |
| 11:00 AM to 11:59 AM | 0 (0.0%) | 0 (0.0%) |
| 12:00 PM to 3:59 PM | 0 (0.0%) | 0 (0.0%) |
| 4:00 PM to 11:59 PM | 243 (20.1%) | 0 (0.0%) |
| Total | 1,211 (100.0%) | 333 (100.0%) |
Housing Occupancy in Pine Manor
Occupancy by Ownership in Pine Manor
Of the total 1,312 dwellings in Pine Manor, owner-occupied units account for 201 (15.3%), while renter-occupied units make up 1,111 (84.7%).
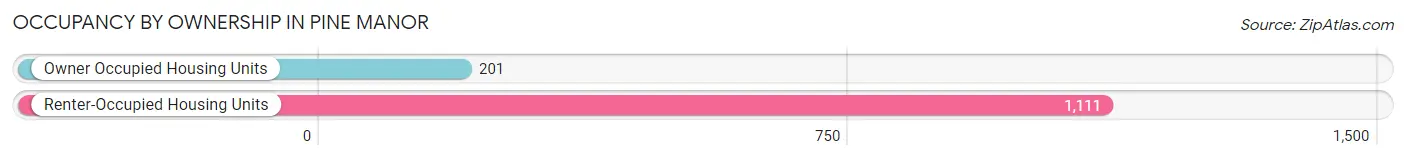
| Occupancy | # Housing Units | % Housing Units |
| Owner Occupied Housing Units | 201 | 15.3% |
| Renter-Occupied Housing Units | 1,111 | 84.7% |
| Total Occupied Housing Units | 1,312 | 100.0% |
Occupancy by Household Size in Pine Manor
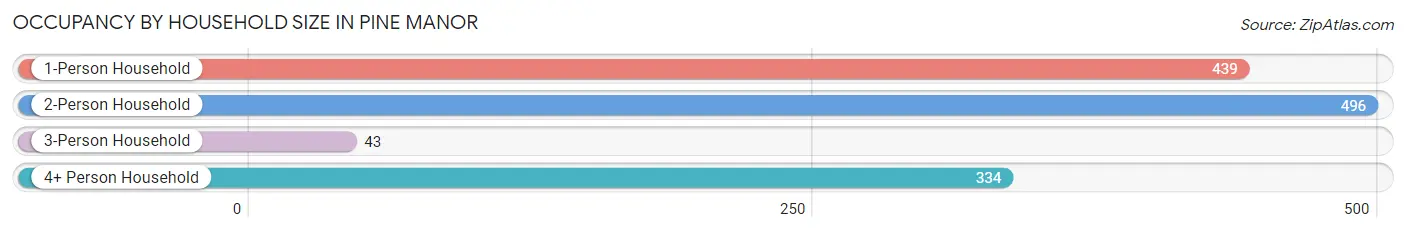
| Household Size | # Housing Units | % Housing Units |
| 1-Person Household | 439 | 33.5% |
| 2-Person Household | 496 | 37.8% |
| 3-Person Household | 43 | 3.3% |
| 4+ Person Household | 334 | 25.5% |
| Total Housing Units | 1,312 | 100.0% |
Occupancy by Ownership by Household Size in Pine Manor
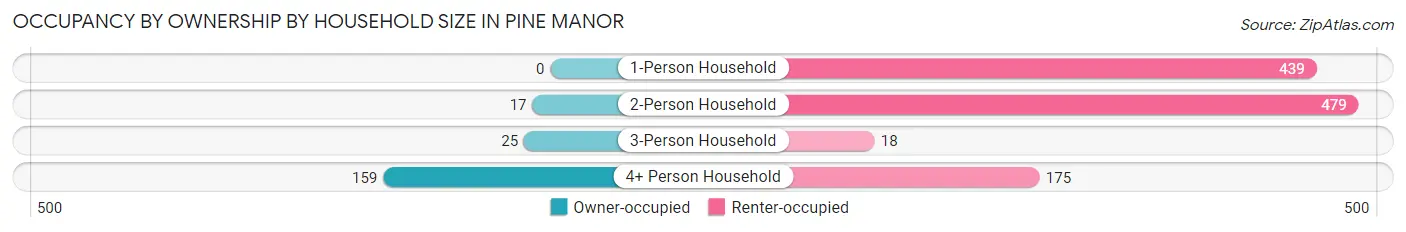
| Household Size | Owner-occupied | Renter-occupied |
| 1-Person Household | 0 (0.0%) | 439 (100.0%) |
| 2-Person Household | 17 (3.4%) | 479 (96.6%) |
| 3-Person Household | 25 (58.1%) | 18 (41.9%) |
| 4+ Person Household | 159 (47.6%) | 175 (52.4%) |
| Total Housing Units | 201 (15.3%) | 1,111 (84.7%) |
Occupancy by Educational Attainment in Pine Manor
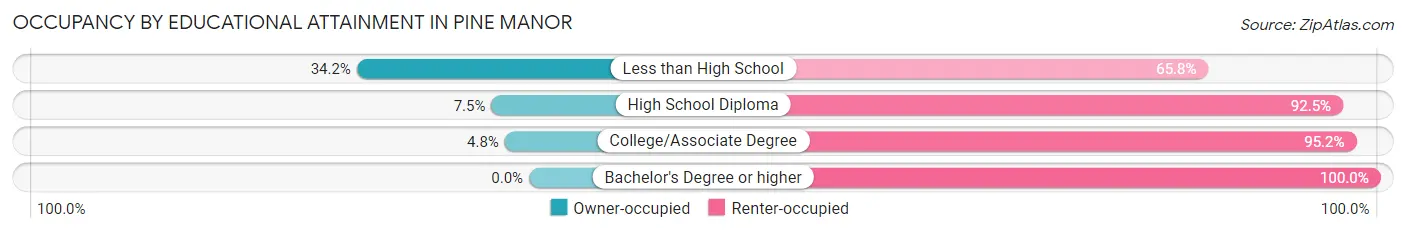
| Household Size | Owner-occupied | Renter-occupied |
| Less than High School | 151 (34.2%) | 291 (65.8%) |
| High School Diploma | 39 (7.5%) | 483 (92.5%) |
| College/Associate Degree | 11 (4.8%) | 217 (95.2%) |
| Bachelor's Degree or higher | 0 (0.0%) | 120 (100.0%) |
Occupancy by Age of Householder in Pine Manor
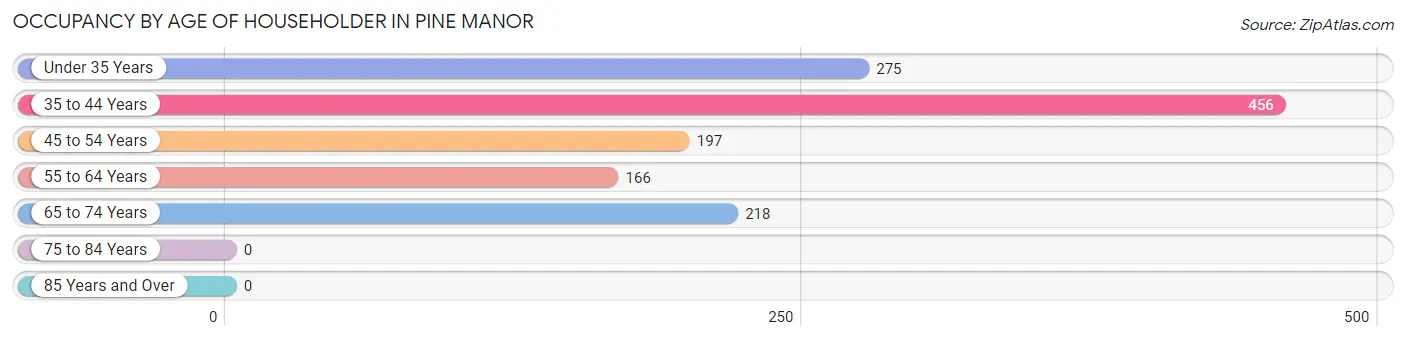
| Age Bracket | # Households | % Households |
| Under 35 Years | 275 | 21.0% |
| 35 to 44 Years | 456 | 34.8% |
| 45 to 54 Years | 197 | 15.0% |
| 55 to 64 Years | 166 | 12.7% |
| 65 to 74 Years | 218 | 16.6% |
| 75 to 84 Years | 0 | 0.0% |
| 85 Years and Over | 0 | 0.0% |
| Total | 1,312 | 100.0% |
Housing Finances in Pine Manor
Median Income by Occupancy in Pine Manor
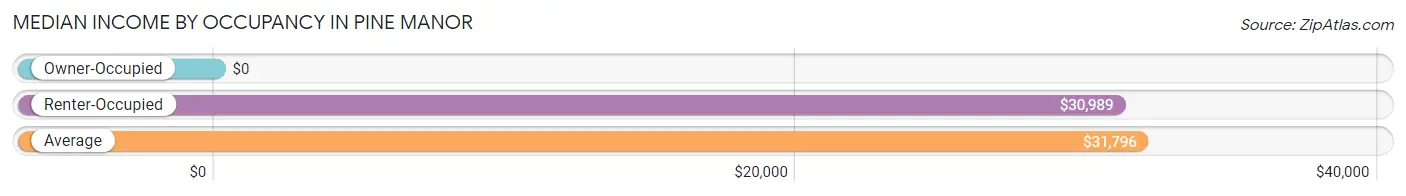
| Occupancy Type | # Households | Median Income |
| Owner-Occupied | 201 (15.3%) | $0 |
| Renter-Occupied | 1,111 (84.7%) | $30,989 |
| Average | 1,312 (100.0%) | $31,796 |
Occupancy by Householder Income Bracket in Pine Manor
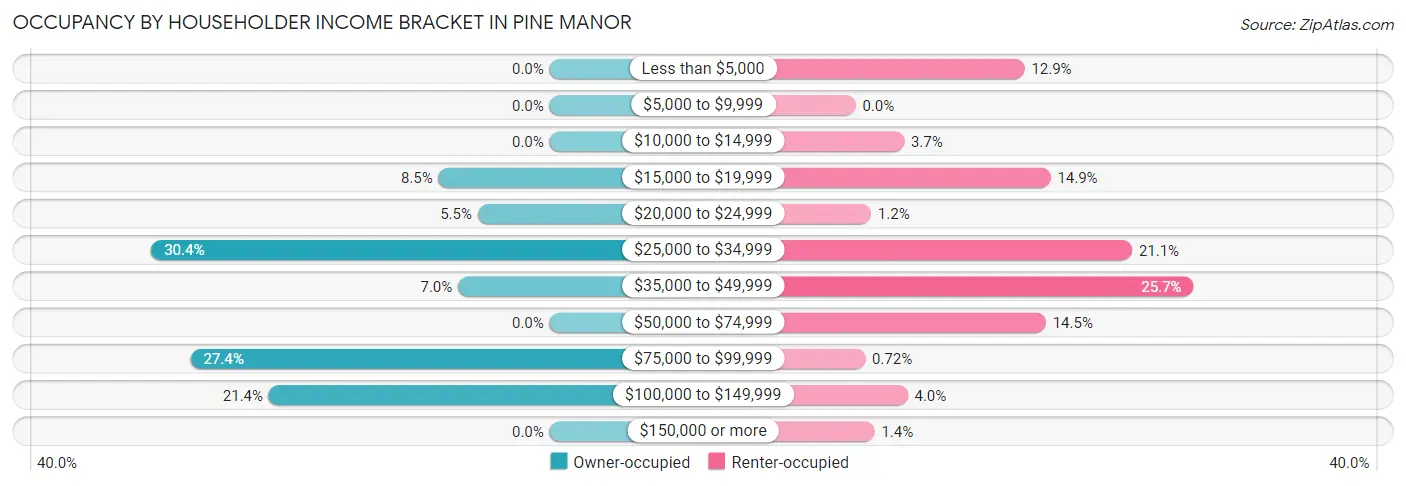
| Income Bracket | Owner-occupied | Renter-occupied |
| Less than $5,000 | 0 (0.0%) | 143 (12.9%) |
| $5,000 to $9,999 | 0 (0.0%) | 0 (0.0%) |
| $10,000 to $14,999 | 0 (0.0%) | 41 (3.7%) |
| $15,000 to $19,999 | 17 (8.5%) | 165 (14.8%) |
| $20,000 to $24,999 | 11 (5.5%) | 13 (1.2%) |
| $25,000 to $34,999 | 61 (30.3%) | 234 (21.1%) |
| $35,000 to $49,999 | 14 (7.0%) | 286 (25.7%) |
| $50,000 to $74,999 | 0 (0.0%) | 161 (14.5%) |
| $75,000 to $99,999 | 55 (27.4%) | 8 (0.7%) |
| $100,000 to $149,999 | 43 (21.4%) | 44 (4.0%) |
| $150,000 or more | 0 (0.0%) | 16 (1.4%) |
| Total | 201 (100.0%) | 1,111 (100.0%) |
Monthly Housing Cost Tiers in Pine Manor
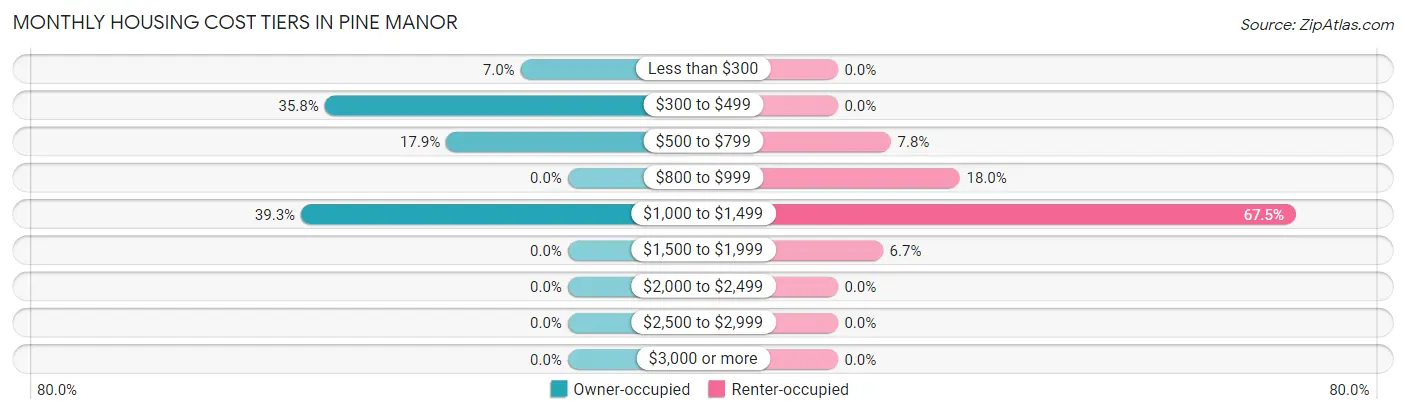
| Monthly Cost | Owner-occupied | Renter-occupied |
| Less than $300 | 14 (7.0%) | 0 (0.0%) |
| $300 to $499 | 72 (35.8%) | 0 (0.0%) |
| $500 to $799 | 36 (17.9%) | 87 (7.8%) |
| $800 to $999 | 0 (0.0%) | 200 (18.0%) |
| $1,000 to $1,499 | 79 (39.3%) | 750 (67.5%) |
| $1,500 to $1,999 | 0 (0.0%) | 74 (6.7%) |
| $2,000 to $2,499 | 0 (0.0%) | 0 (0.0%) |
| $2,500 to $2,999 | 0 (0.0%) | 0 (0.0%) |
| $3,000 or more | 0 (0.0%) | 0 (0.0%) |
| Total | 201 (100.0%) | 1,111 (100.0%) |
Physical Housing Characteristics in Pine Manor
Housing Structures in Pine Manor
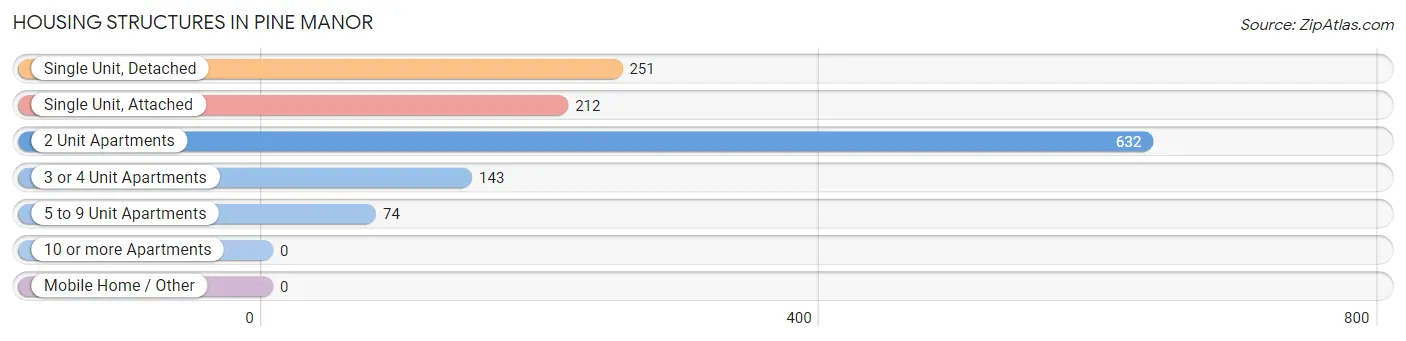
| Structure Type | # Housing Units | % Housing Units |
| Single Unit, Detached | 251 | 19.1% |
| Single Unit, Attached | 212 | 16.2% |
| 2 Unit Apartments | 632 | 48.2% |
| 3 or 4 Unit Apartments | 143 | 10.9% |
| 5 to 9 Unit Apartments | 74 | 5.6% |
| 10 or more Apartments | 0 | 0.0% |
| Mobile Home / Other | 0 | 0.0% |
| Total | 1,312 | 100.0% |
Housing Structures by Occupancy in Pine Manor
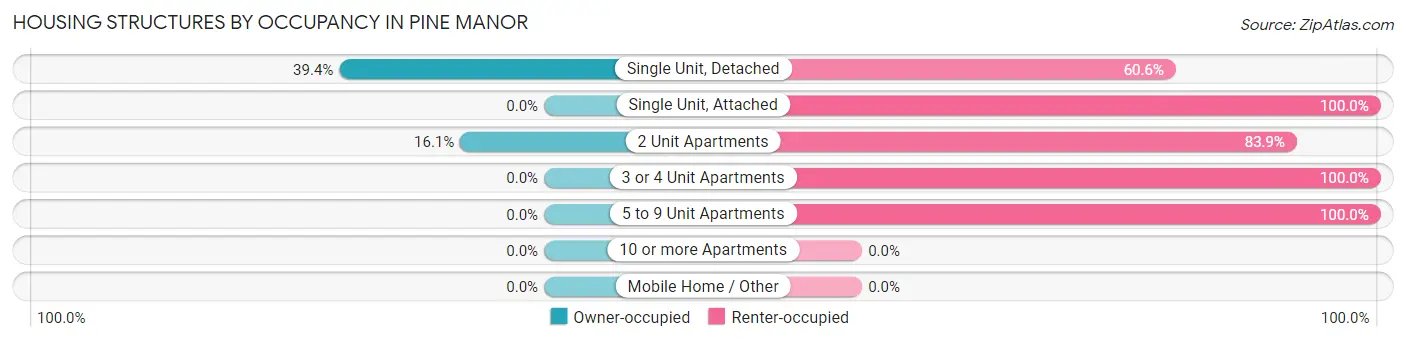
| Structure Type | Owner-occupied | Renter-occupied |
| Single Unit, Detached | 99 (39.4%) | 152 (60.6%) |
| Single Unit, Attached | 0 (0.0%) | 212 (100.0%) |
| 2 Unit Apartments | 102 (16.1%) | 530 (83.9%) |
| 3 or 4 Unit Apartments | 0 (0.0%) | 143 (100.0%) |
| 5 to 9 Unit Apartments | 0 (0.0%) | 74 (100.0%) |
| 10 or more Apartments | 0 (0.0%) | 0 (0.0%) |
| Mobile Home / Other | 0 (0.0%) | 0 (0.0%) |
| Total | 201 (15.3%) | 1,111 (84.7%) |
Housing Structures by Number of Rooms in Pine Manor
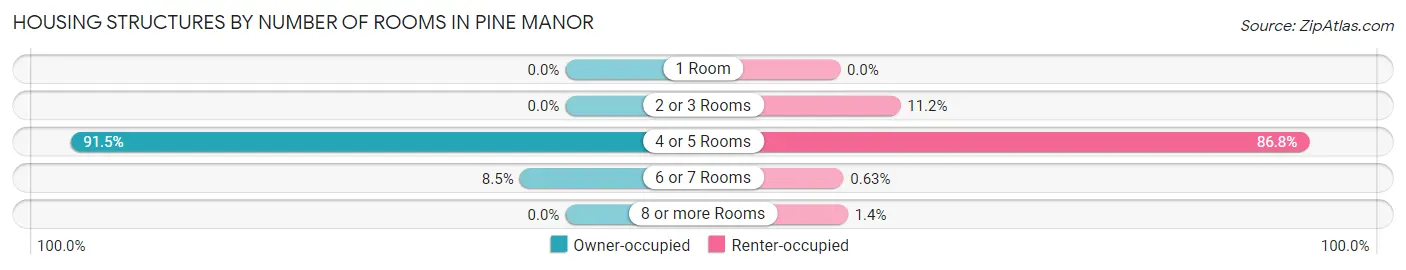
| Number of Rooms | Owner-occupied | Renter-occupied |
| 1 Room | 0 (0.0%) | 0 (0.0%) |
| 2 or 3 Rooms | 0 (0.0%) | 124 (11.2%) |
| 4 or 5 Rooms | 184 (91.5%) | 964 (86.8%) |
| 6 or 7 Rooms | 17 (8.5%) | 7 (0.6%) |
| 8 or more Rooms | 0 (0.0%) | 16 (1.4%) |
| Total | 201 (100.0%) | 1,111 (100.0%) |
Housing Structure by Heating Type in Pine Manor
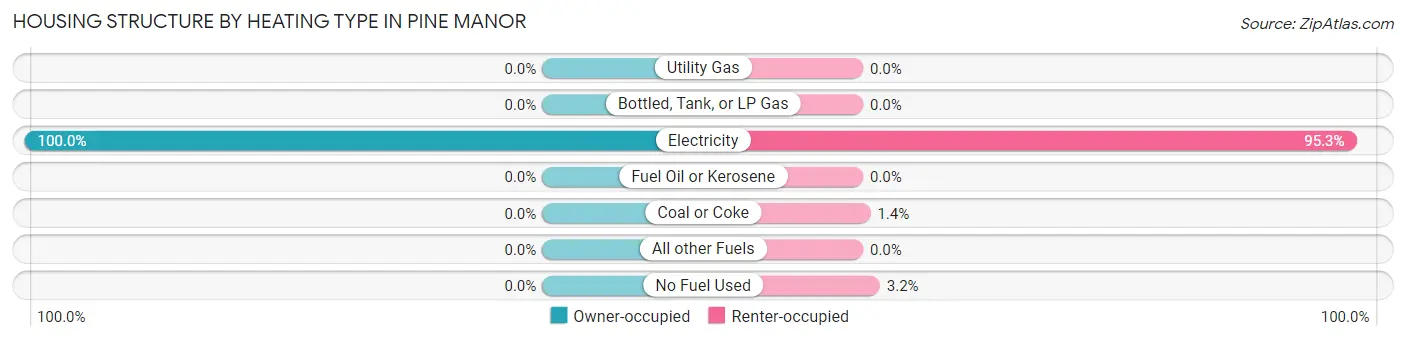
| Heating Type | Owner-occupied | Renter-occupied |
| Utility Gas | 0 (0.0%) | 0 (0.0%) |
| Bottled, Tank, or LP Gas | 0 (0.0%) | 0 (0.0%) |
| Electricity | 201 (100.0%) | 1,059 (95.3%) |
| Fuel Oil or Kerosene | 0 (0.0%) | 0 (0.0%) |
| Coal or Coke | 0 (0.0%) | 16 (1.4%) |
| All other Fuels | 0 (0.0%) | 0 (0.0%) |
| No Fuel Used | 0 (0.0%) | 36 (3.2%) |
| Total | 201 (100.0%) | 1,111 (100.0%) |
Household Vehicle Usage in Pine Manor
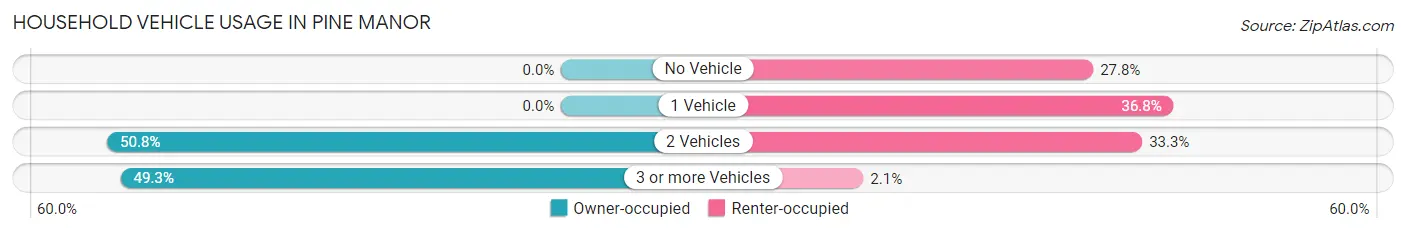
| Vehicles per Household | Owner-occupied | Renter-occupied |
| No Vehicle | 0 (0.0%) | 309 (27.8%) |
| 1 Vehicle | 0 (0.0%) | 409 (36.8%) |
| 2 Vehicles | 102 (50.7%) | 370 (33.3%) |
| 3 or more Vehicles | 99 (49.2%) | 23 (2.1%) |
| Total | 201 (100.0%) | 1,111 (100.0%) |
Real Estate & Mortgages in Pine Manor
Real Estate and Mortgage Overview in Pine Manor
| Characteristic | Without Mortgage | With Mortgage |
| Housing Units | 122 | 79 |
| Median Property Value | $153,600 | $271,000 |
| Median Household Income | - | - |
| Monthly Housing Costs | $393 | $0 |
| Real Estate Taxes | $1,165 | $0 |
Property Value by Mortgage Status in Pine Manor
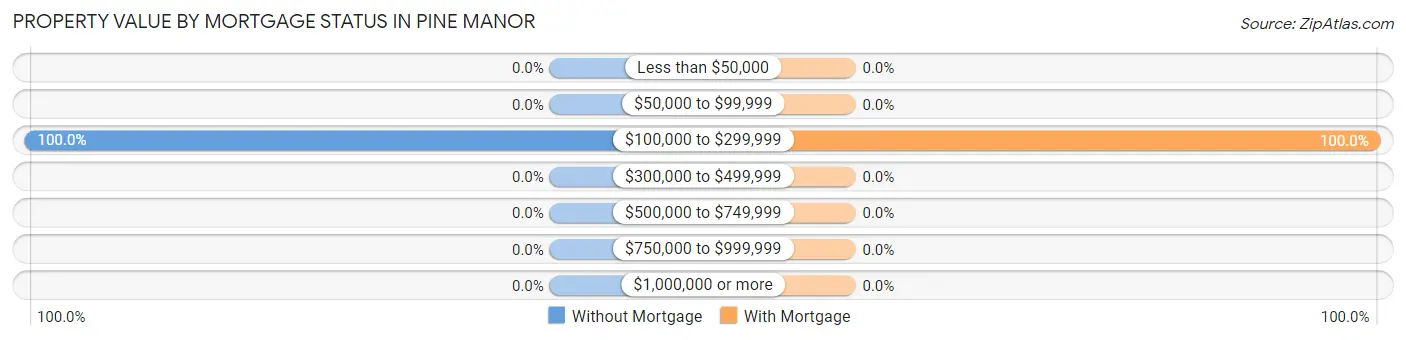
| Property Value | Without Mortgage | With Mortgage |
| Less than $50,000 | 0 (0.0%) | 0 (0.0%) |
| $50,000 to $99,999 | 0 (0.0%) | 0 (0.0%) |
| $100,000 to $299,999 | 122 (100.0%) | 79 (100.0%) |
| $300,000 to $499,999 | 0 (0.0%) | 0 (0.0%) |
| $500,000 to $749,999 | 0 (0.0%) | 0 (0.0%) |
| $750,000 to $999,999 | 0 (0.0%) | 0 (0.0%) |
| $1,000,000 or more | 0 (0.0%) | 0 (0.0%) |
| Total | 122 (100.0%) | 79 (100.0%) |
Household Income by Mortgage Status in Pine Manor
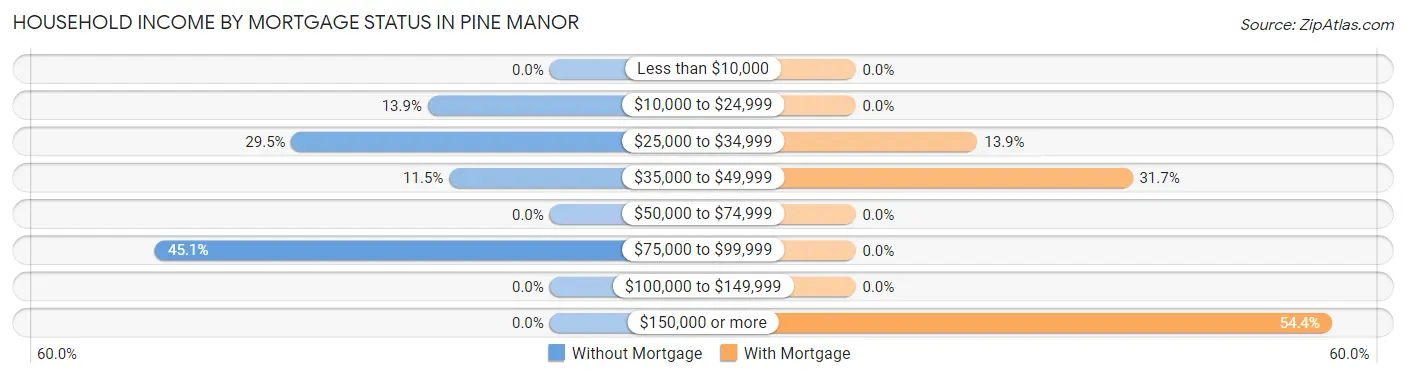
| Household Income | Without Mortgage | With Mortgage |
| Less than $10,000 | 0 (0.0%) | 0 (0.0%) |
| $10,000 to $24,999 | 17 (13.9%) | 0 (0.0%) |
| $25,000 to $34,999 | 36 (29.5%) | 11 (13.9%) |
| $35,000 to $49,999 | 14 (11.5%) | 25 (31.7%) |
| $50,000 to $74,999 | 0 (0.0%) | 0 (0.0%) |
| $75,000 to $99,999 | 55 (45.1%) | 0 (0.0%) |
| $100,000 to $149,999 | 0 (0.0%) | 0 (0.0%) |
| $150,000 or more | 0 (0.0%) | 43 (54.4%) |
| Total | 122 (100.0%) | 79 (100.0%) |
Property Value to Household Income Ratio in Pine Manor
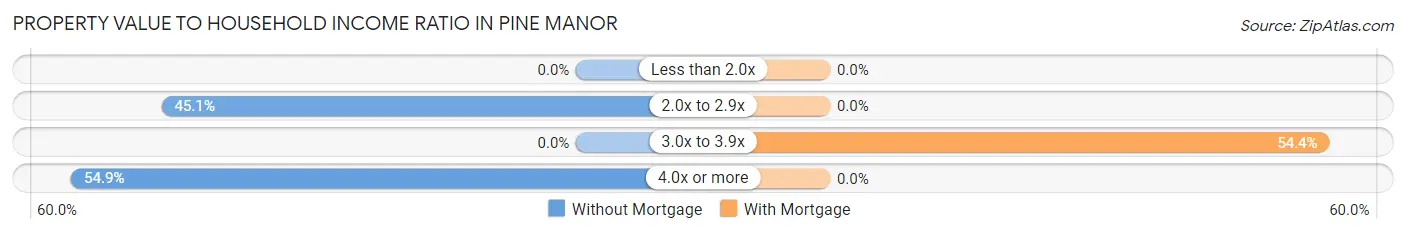
| Value-to-Income Ratio | Without Mortgage | With Mortgage |
| Less than 2.0x | 0 (0.0%) | 0 (0.0%) |
| 2.0x to 2.9x | 55 (45.1%) | 0 (0.0%) |
| 3.0x to 3.9x | 0 (0.0%) | 43 (54.4%) |
| 4.0x or more | 67 (54.9%) | 0 (0.0%) |
| Total | 122 (100.0%) | 79 (100.0%) |
Real Estate Taxes by Mortgage Status in Pine Manor
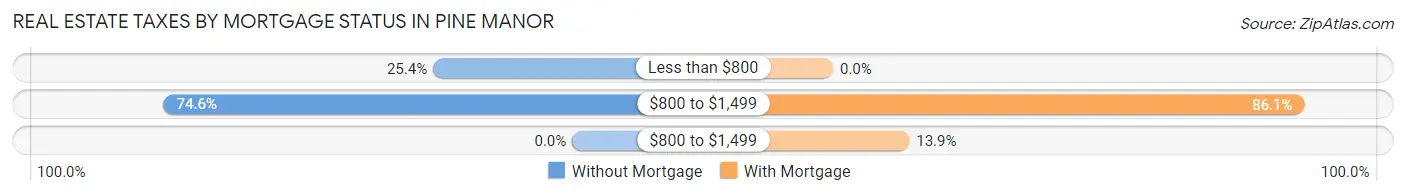
| Property Taxes | Without Mortgage | With Mortgage |
| Less than $800 | 31 (25.4%) | 0 (0.0%) |
| $800 to $1,499 | 91 (74.6%) | 68 (86.1%) |
| $800 to $1,499 | 0 (0.0%) | 11 (13.9%) |
| Total | 122 (100.0%) | 79 (100.0%) |
Health & Disability in Pine Manor
Health Insurance Coverage by Age in Pine Manor
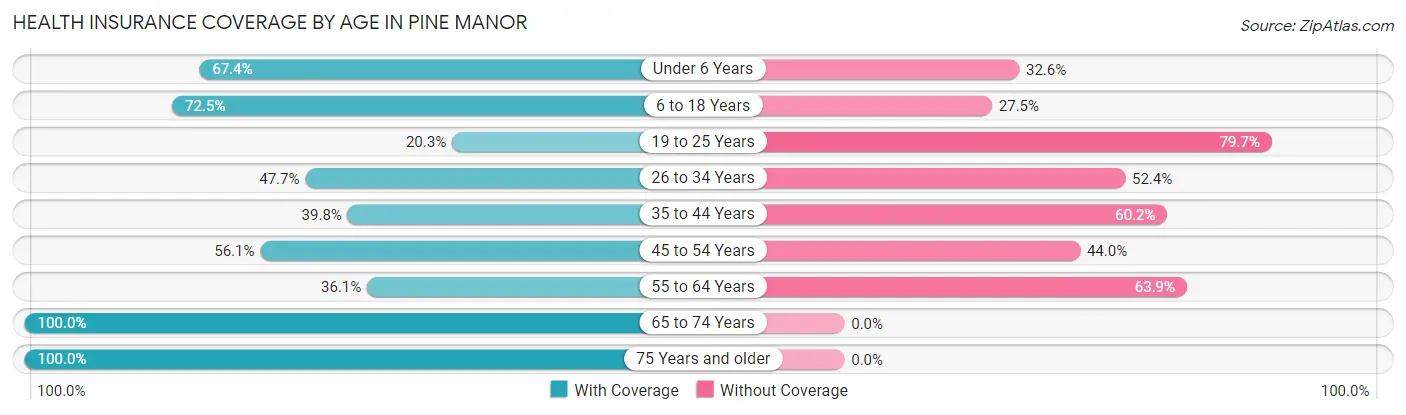
| Age Bracket | With Coverage | Without Coverage |
| Under 6 Years | 120 (67.4%) | 58 (32.6%) |
| 6 to 18 Years | 661 (72.5%) | 251 (27.5%) |
| 19 to 25 Years | 96 (20.3%) | 377 (79.7%) |
| 26 to 34 Years | 344 (47.6%) | 378 (52.3%) |
| 35 to 44 Years | 266 (39.8%) | 403 (60.2%) |
| 45 to 54 Years | 213 (56.0%) | 167 (44.0%) |
| 55 to 64 Years | 69 (36.1%) | 122 (63.9%) |
| 65 to 74 Years | 251 (100.0%) | 0 (0.0%) |
| 75 Years and older | 86 (100.0%) | 0 (0.0%) |
| Total | 2,106 (54.5%) | 1,756 (45.5%) |
Health Insurance Coverage by Citizenship Status in Pine Manor
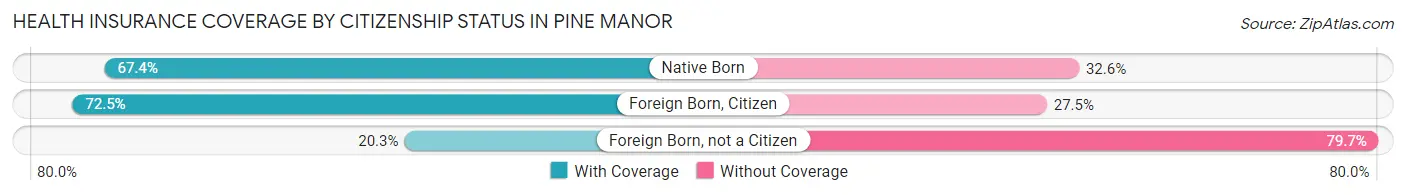
| Citizenship Status | With Coverage | Without Coverage |
| Native Born | 120 (67.4%) | 58 (32.6%) |
| Foreign Born, Citizen | 661 (72.5%) | 251 (27.5%) |
| Foreign Born, not a Citizen | 96 (20.3%) | 377 (79.7%) |
Health Insurance Coverage by Household Income in Pine Manor
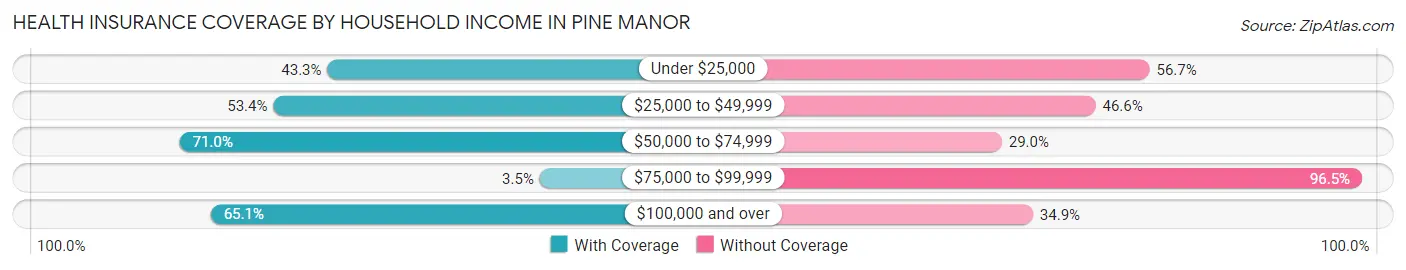
| Household Income | With Coverage | Without Coverage |
| Under $25,000 | 251 (43.3%) | 329 (56.7%) |
| $25,000 to $49,999 | 942 (53.4%) | 822 (46.6%) |
| $50,000 to $74,999 | 457 (71.0%) | 187 (29.0%) |
| $75,000 to $99,999 | 8 (3.5%) | 221 (96.5%) |
| $100,000 and over | 368 (65.1%) | 197 (34.9%) |
Public vs Private Health Insurance Coverage by Age in Pine Manor
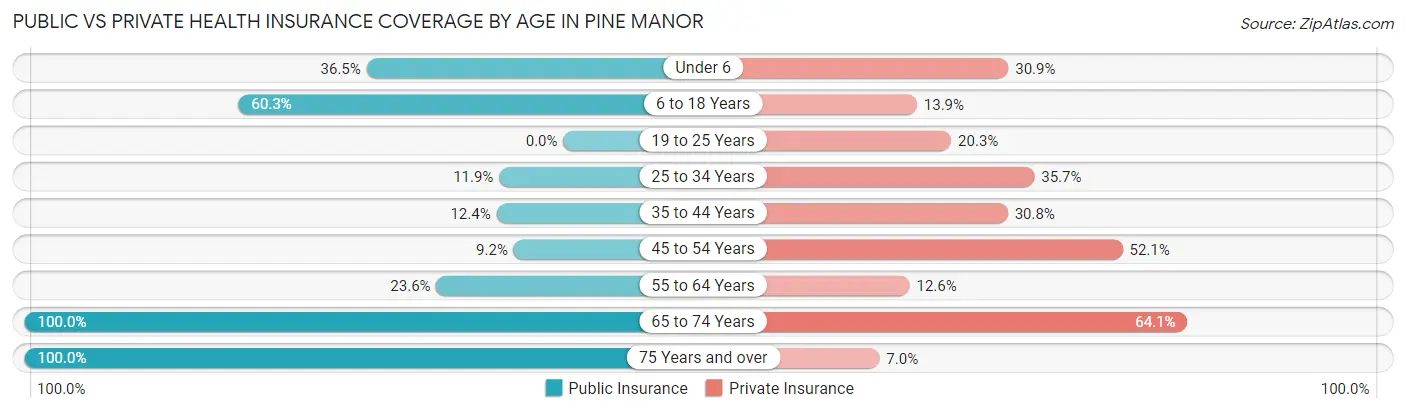
| Age Bracket | Public Insurance | Private Insurance |
| Under 6 | 65 (36.5%) | 55 (30.9%) |
| 6 to 18 Years | 550 (60.3%) | 127 (13.9%) |
| 19 to 25 Years | 0 (0.0%) | 96 (20.3%) |
| 25 to 34 Years | 86 (11.9%) | 258 (35.7%) |
| 35 to 44 Years | 83 (12.4%) | 206 (30.8%) |
| 45 to 54 Years | 35 (9.2%) | 198 (52.1%) |
| 55 to 64 Years | 45 (23.6%) | 24 (12.6%) |
| 65 to 74 Years | 251 (100.0%) | 161 (64.1%) |
| 75 Years and over | 86 (100.0%) | 6 (7.0%) |
| Total | 1,201 (31.1%) | 1,131 (29.3%) |
Disability Status by Sex by Age in Pine Manor
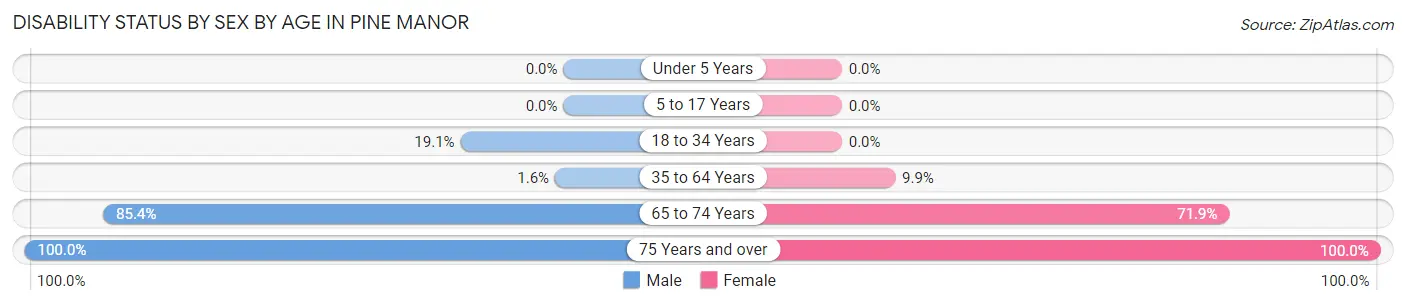
| Age Bracket | Male | Female |
| Under 5 Years | 0 (0.0%) | 0 (0.0%) |
| 5 to 17 Years | 0 (0.0%) | 0 (0.0%) |
| 18 to 34 Years | 185 (19.1%) | 0 (0.0%) |
| 35 to 64 Years | 13 (1.6%) | 40 (9.9%) |
| 65 to 74 Years | 41 (85.4%) | 146 (71.9%) |
| 75 Years and over | 74 (100.0%) | 12 (100.0%) |
Disability Class by Sex by Age in Pine Manor
Disability Class: Hearing Difficulty
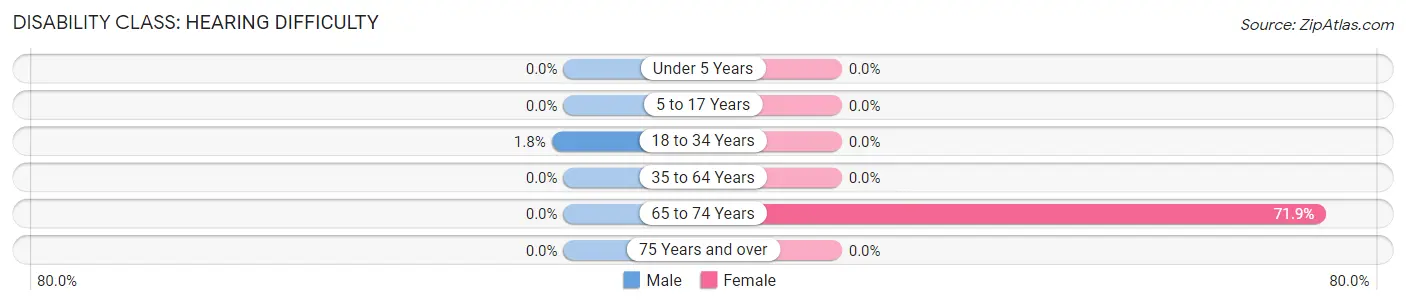
| Age Bracket | Male | Female |
| Under 5 Years | 0 (0.0%) | 0 (0.0%) |
| 5 to 17 Years | 0 (0.0%) | 0 (0.0%) |
| 18 to 34 Years | 17 (1.8%) | 0 (0.0%) |
| 35 to 64 Years | 0 (0.0%) | 0 (0.0%) |
| 65 to 74 Years | 0 (0.0%) | 146 (71.9%) |
| 75 Years and over | 0 (0.0%) | 0 (0.0%) |
Disability Class: Vision Difficulty
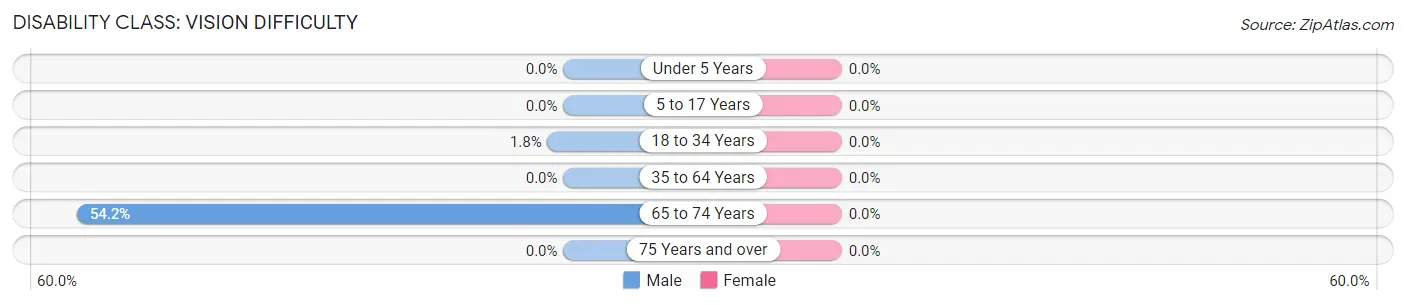
| Age Bracket | Male | Female |
| Under 5 Years | 0 (0.0%) | 0 (0.0%) |
| 5 to 17 Years | 0 (0.0%) | 0 (0.0%) |
| 18 to 34 Years | 17 (1.8%) | 0 (0.0%) |
| 35 to 64 Years | 0 (0.0%) | 0 (0.0%) |
| 65 to 74 Years | 26 (54.2%) | 0 (0.0%) |
| 75 Years and over | 0 (0.0%) | 0 (0.0%) |
Disability Class: Cognitive Difficulty
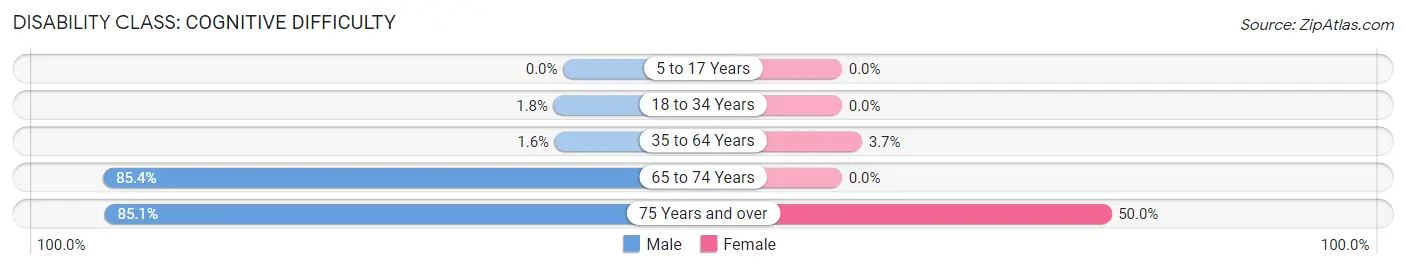
| Age Bracket | Male | Female |
| 5 to 17 Years | 0 (0.0%) | 0 (0.0%) |
| 18 to 34 Years | 17 (1.8%) | 0 (0.0%) |
| 35 to 64 Years | 13 (1.6%) | 15 (3.7%) |
| 65 to 74 Years | 41 (85.4%) | 0 (0.0%) |
| 75 Years and over | 63 (85.1%) | 6 (50.0%) |
Disability Class: Ambulatory Difficulty
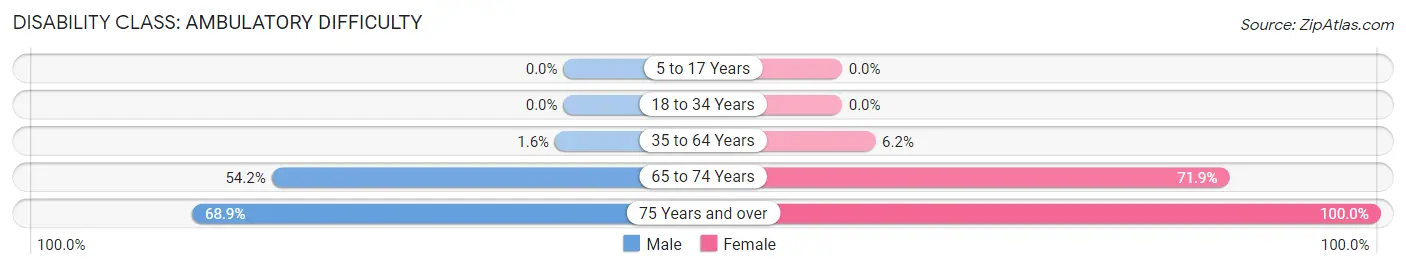
| Age Bracket | Male | Female |
| 5 to 17 Years | 0 (0.0%) | 0 (0.0%) |
| 18 to 34 Years | 0 (0.0%) | 0 (0.0%) |
| 35 to 64 Years | 13 (1.6%) | 25 (6.2%) |
| 65 to 74 Years | 26 (54.2%) | 146 (71.9%) |
| 75 Years and over | 51 (68.9%) | 12 (100.0%) |
Disability Class: Self-Care Difficulty
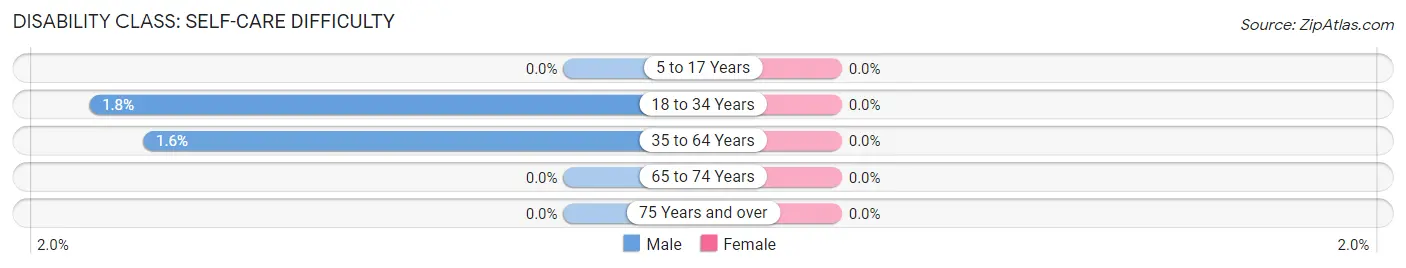
| Age Bracket | Male | Female |
| 5 to 17 Years | 0 (0.0%) | 0 (0.0%) |
| 18 to 34 Years | 17 (1.8%) | 0 (0.0%) |
| 35 to 64 Years | 13 (1.6%) | 0 (0.0%) |
| 65 to 74 Years | 0 (0.0%) | 0 (0.0%) |
| 75 Years and over | 0 (0.0%) | 0 (0.0%) |
Technology Access in Pine Manor
Computing Device Access in Pine Manor
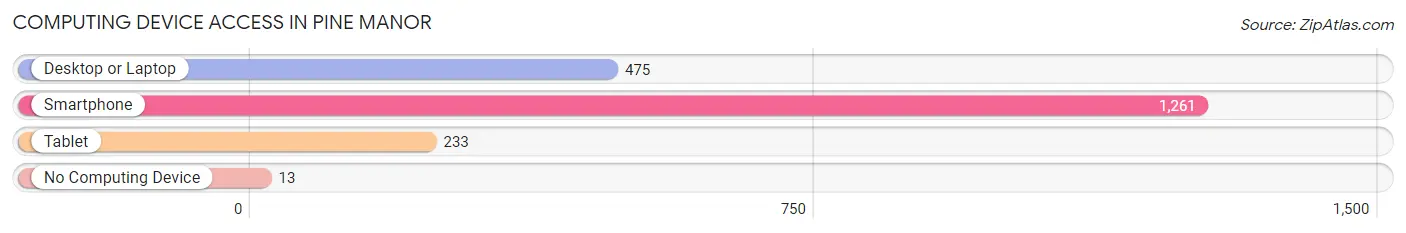
| Device Type | # Households | % Households |
| Desktop or Laptop | 475 | 36.2% |
| Smartphone | 1,261 | 96.1% |
| Tablet | 233 | 17.8% |
| No Computing Device | 13 | 1.0% |
| Total | 1,312 | 100.0% |
Internet Access in Pine Manor
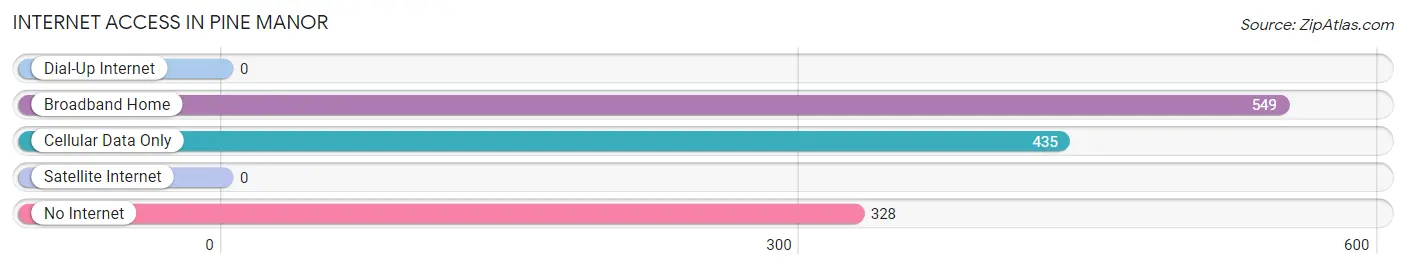
| Internet Type | # Households | % Households |
| Dial-Up Internet | 0 | 0.0% |
| Broadband Home | 549 | 41.8% |
| Cellular Data Only | 435 | 33.2% |
| Satellite Internet | 0 | 0.0% |
| No Internet | 328 | 25.0% |
| Total | 1,312 | 100.0% |
Pine Manor Summary
Pine Manor is a small unincorporated community located in Lee County, Florida, United States. It is situated on the northern edge of Fort Myers, just south of the Caloosahatchee River. The community is bordered by the city of Fort Myers to the north, the city of Cape Coral to the west, and the city of Sanibel to the south.
History
Pine Manor was originally settled in the late 1800s by a group of settlers from the Midwest. The settlers were attracted to the area due to its abundance of pine trees, which were used to build homes and other structures. The community was officially established in 1887, when the first post office was opened.
The community was originally known as Pine Manor Station, but the name was changed to Pine Manor in 1895. The name was chosen to reflect the abundance of pine trees in the area.
Geography
Pine Manor is located in Lee County, Florida, just south of the Caloosahatchee River. The community is bordered by the city of Fort Myers to the north, the city of Cape Coral to the west, and the city of Sanibel to the south.
The community is situated on a flat, sandy plain, with an elevation of just 10 feet above sea level. The area is characterized by a humid subtropical climate, with hot, humid summers and mild, dry winters.
Economy
Pine Manor is primarily a residential community, with no major industries or businesses located within its borders. The majority of the population is employed in the nearby cities of Fort Myers and Cape Coral.
The community is home to several small businesses, including a convenience store, a gas station, and a few restaurants. There is also a small marina located on the Caloosahatchee River.
Demographics
As of the 2010 census, Pine Manor had a population of 1,845. The racial makeup of the community was 79.3% White, 11.2% African American, 0.7% Native American, 0.7% Asian, 0.1% Pacific Islander, and 6.9% from other races. Hispanic or Latino of any race were 16.2% of the population.
The median household income in Pine Manor was $37,917, and the median family income was $41,917. The per capita income was $19,917. About 11.2% of families and 14.2% of the population were below the poverty line, including 19.2% of those under age 18 and 8.2% of those age 65 or over.
Common Questions
What is Per Capita Income in Pine Manor?
Per Capita income in Pine Manor is $16,822.
What is the Median Family Income in Pine Manor?
Median Family Income in Pine Manor is $43,517.
What is the Median Household income in Pine Manor?
Median Household Income in Pine Manor is $31,796.
What is Income or Wage Gap in Pine Manor?
Income or Wage Gap in Pine Manor is 50.2%.
Women in Pine Manor earn 49.8 cents for every dollar earned by a man.
What is Inequality or Gini Index in Pine Manor?
Inequality or Gini Index in Pine Manor is 0.41.
What is the Total Population of Pine Manor?
Total Population of Pine Manor is 3,944.
What is the Total Male Population of Pine Manor?
Total Male Population of Pine Manor is 2,651.
What is the Total Female Population of Pine Manor?
Total Female Population of Pine Manor is 1,293.
What is the Ratio of Males per 100 Females in Pine Manor?
There are 205.03 Males per 100 Females in Pine Manor.
What is the Ratio of Females per 100 Males in Pine Manor?
There are 48.77 Females per 100 Males in Pine Manor.
What is the Median Population Age in Pine Manor?
Median Population Age in Pine Manor is 30.6 Years.
What is the Average Family Size in Pine Manor
Average Family Size in Pine Manor is 3.7 People.
What is the Average Household Size in Pine Manor
Average Household Size in Pine Manor is 2.9 People.
How Large is the Labor Force in Pine Manor?
There are 1,837 People in the Labor Forcein in Pine Manor.
What is the Percentage of People in the Labor Force in Pine Manor?
59.7% of People are in the Labor Force in Pine Manor.
What is the Unemployment Rate in Pine Manor?
Unemployment Rate in Pine Manor is 11.7%.