Mulberry, NC Map & Demographics
Mulberry Map
Mulberry Overview
$31,936
PER CAPITA INCOME
$65,417
AVG FAMILY INCOME
$51,750
AVG HOUSEHOLD INCOME
14.4%
WAGE / INCOME GAP [ % ]
85.6¢/ $1
WAGE / INCOME GAP [ $ ]
0.39
INEQUALITY / GINI INDEX
1,980
TOTAL POPULATION
1,126
MALE POPULATION
854
FEMALE POPULATION
131.85
MALES / 100 FEMALES
75.84
FEMALES / 100 MALES
54.8
MEDIAN AGE
2.4
AVG FAMILY SIZE
2.2
AVG HOUSEHOLD SIZE
796
LABOR FORCE [ PEOPLE ]
43.0%
PERCENT IN LABOR FORCE
9.5%
UNEMPLOYMENT RATE
Income in Mulberry
Income Overview in Mulberry
Per Capita Income in Mulberry is $31,936, while median incomes of families and households are $65,417 and $51,750 respectively.
| Characteristic | Number | Measure |
| Per Capita Income | 1,980 | $31,936 |
| Median Family Income | 744 | $65,417 |
| Mean Family Income | 744 | $75,442 |
| Median Household Income | 900 | $51,750 |
| Mean Household Income | 900 | $70,830 |
| Income Deficit | 744 | $0 |
| Wage / Income Gap (%) | 1,980 | 14.39% |
| Wage / Income Gap ($) | 1,980 | 85.61¢ per $1 |
| Gini / Inequality Index | 1,980 | 0.39 |
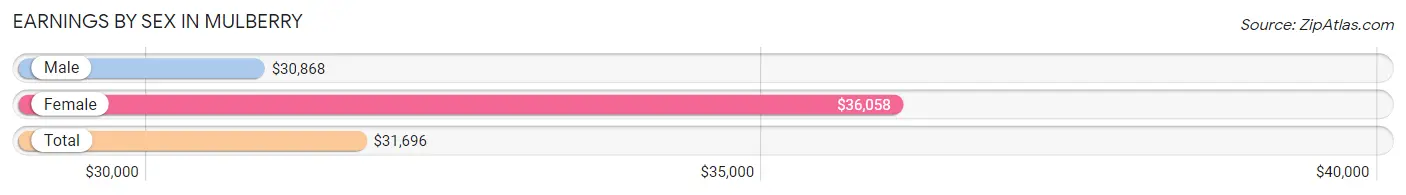
Earnings by Sex in Mulberry
Average Earnings in Mulberry are $31,696, $30,868 for men and $36,058 for women, a difference of 14.4%.
| Sex | Number | Average Earnings |
| Male | 637 (64.3%) | $30,868 |
| Female | 353 (35.7%) | $36,058 |
| Total | 990 (100.0%) | $31,696 |
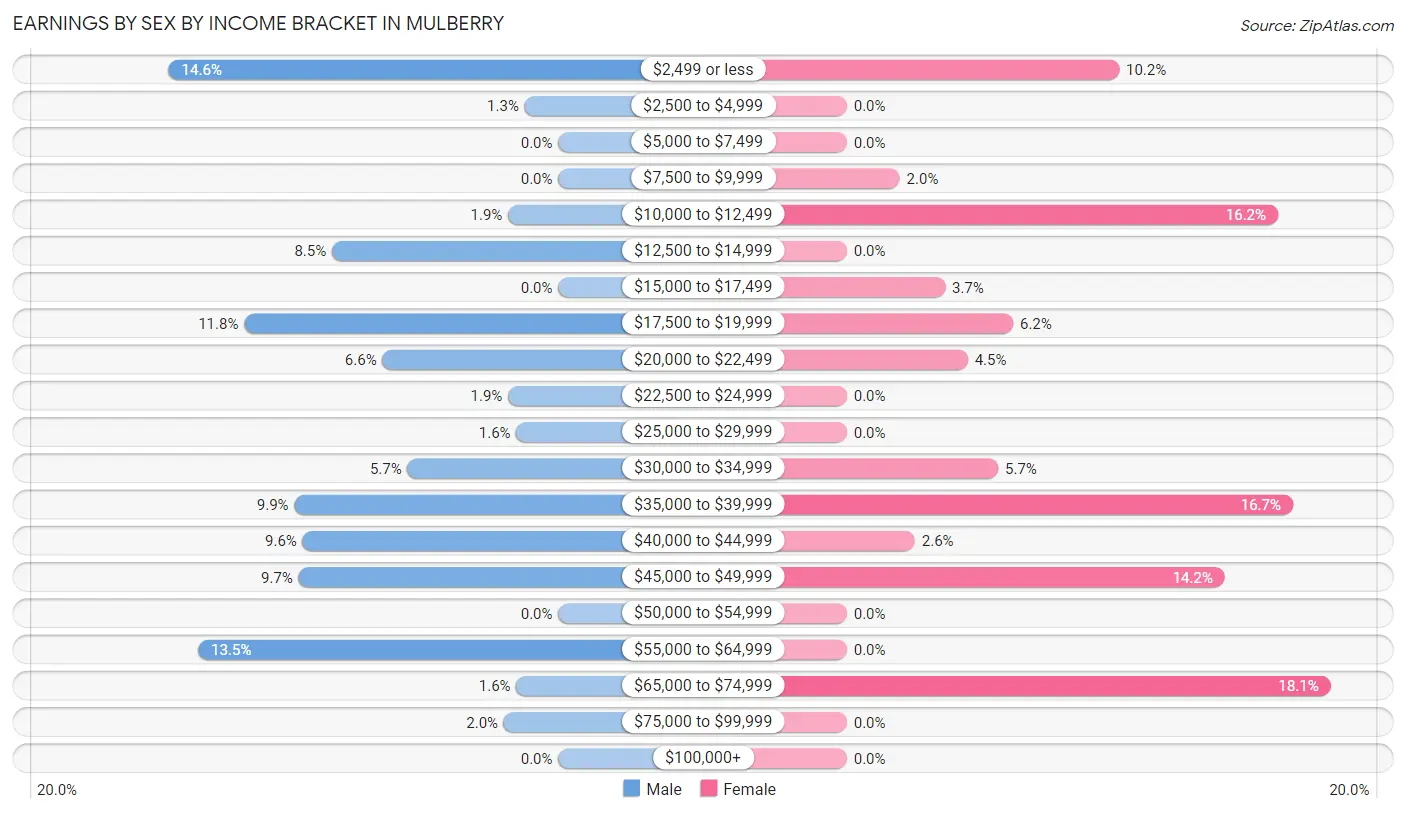
Earnings by Sex by Income Bracket in Mulberry
The most common earnings brackets in Mulberry are $2,499 or less for men (93 | 14.6%) and $65,000 to $74,999 for women (64 | 18.1%).
| Income | Male | Female |
| $2,499 or less | 93 (14.6%) | 36 (10.2%) |
| $2,500 to $4,999 | 8 (1.3%) | 0 (0.0%) |
| $5,000 to $7,499 | 0 (0.0%) | 0 (0.0%) |
| $7,500 to $9,999 | 0 (0.0%) | 7 (2.0%) |
| $10,000 to $12,499 | 12 (1.9%) | 57 (16.2%) |
| $12,500 to $14,999 | 54 (8.5%) | 0 (0.0%) |
| $15,000 to $17,499 | 0 (0.0%) | 13 (3.7%) |
| $17,500 to $19,999 | 75 (11.8%) | 22 (6.2%) |
| $20,000 to $22,499 | 42 (6.6%) | 16 (4.5%) |
| $22,500 to $24,999 | 12 (1.9%) | 0 (0.0%) |
| $25,000 to $29,999 | 10 (1.6%) | 0 (0.0%) |
| $30,000 to $34,999 | 36 (5.7%) | 20 (5.7%) |
| $35,000 to $39,999 | 63 (9.9%) | 59 (16.7%) |
| $40,000 to $44,999 | 61 (9.6%) | 9 (2.5%) |
| $45,000 to $49,999 | 62 (9.7%) | 50 (14.2%) |
| $50,000 to $54,999 | 0 (0.0%) | 0 (0.0%) |
| $55,000 to $64,999 | 86 (13.5%) | 0 (0.0%) |
| $65,000 to $74,999 | 10 (1.6%) | 64 (18.1%) |
| $75,000 to $99,999 | 13 (2.0%) | 0 (0.0%) |
| $100,000+ | 0 (0.0%) | 0 (0.0%) |
| Total | 637 (100.0%) | 353 (100.0%) |
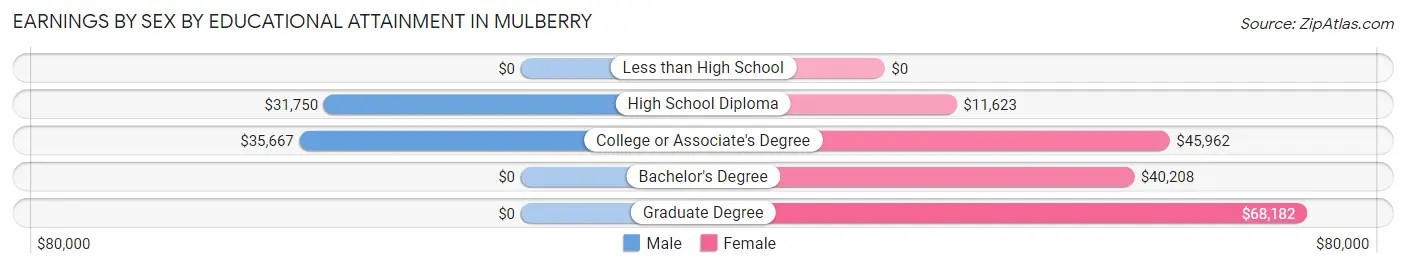
Earnings by Sex by Educational Attainment in Mulberry
Average earnings in Mulberry are $36,211 for men and $37,656 for women, a difference of 3.8%. Men with an educational attainment of college or associate's degree enjoy the highest average annual earnings of $35,667, while those with high school diploma education earn the least with $31,750. Women with an educational attainment of graduate degree earn the most with the average annual earnings of $68,182, while those with high school diploma education have the smallest earnings of $11,623.
| Educational Attainment | Male Income | Female Income |
| Less than High School | - | - |
| High School Diploma | $31,750 | $11,623 |
| College or Associate's Degree | $35,667 | $45,962 |
| Bachelor's Degree | - | - |
| Graduate Degree | - | - |
| Total | $36,211 | $37,656 |
Family Income in Mulberry
Family Income Brackets in Mulberry
According to the Mulberry family income data, there are 193 families falling into the $35,000 to $49,999 income range, which is the most common income bracket and makes up 25.9% of all families.
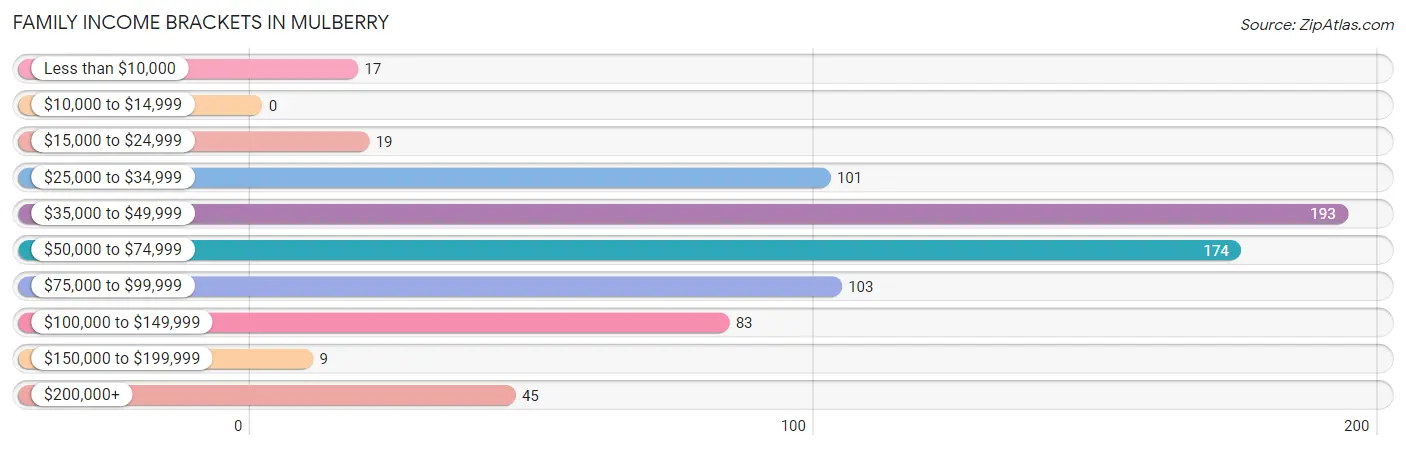
| Income Bracket | # Families | % Families |
| Less than $10,000 | 17 | 2.3% |
| $10,000 to $14,999 | 0 | 0.0% |
| $15,000 to $24,999 | 19 | 2.6% |
| $25,000 to $34,999 | 101 | 13.6% |
| $35,000 to $49,999 | 193 | 25.9% |
| $50,000 to $74,999 | 174 | 23.4% |
| $75,000 to $99,999 | 103 | 13.8% |
| $100,000 to $149,999 | 83 | 11.2% |
| $150,000 to $199,999 | 9 | 1.2% |
| $200,000+ | 45 | 6.0% |
Family Income by Famaliy Size in Mulberry
3-person families (192 | 25.8%) account for the highest median family income in Mulberry with $87,262 per family, while 3-person families (192 | 25.8%) have the highest median income of $29,087 per family member.
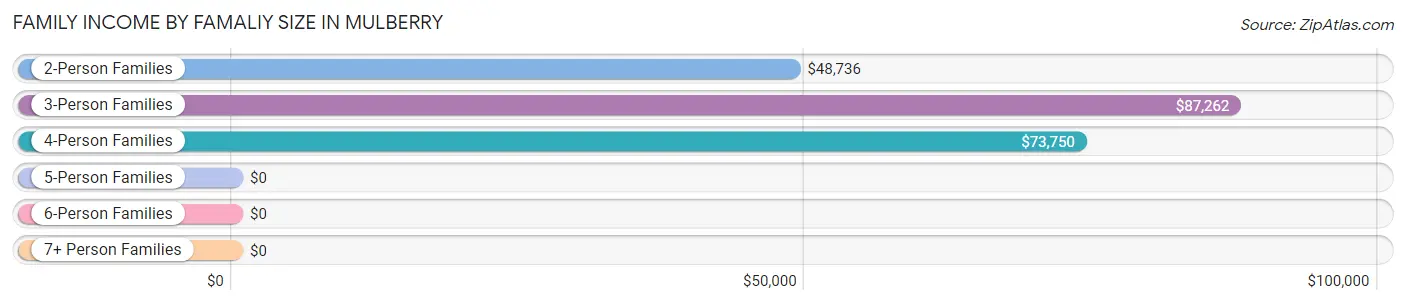
| Income Bracket | # Families | Median Income |
| 2-Person Families | 506 (68.0%) | $48,736 |
| 3-Person Families | 192 (25.8%) | $87,262 |
| 4-Person Families | 46 (6.2%) | $73,750 |
| 5-Person Families | 0 (0.0%) | $0 |
| 6-Person Families | 0 (0.0%) | $0 |
| 7+ Person Families | 0 (0.0%) | $0 |
| Total | 744 (100.0%) | $65,417 |
Family Income by Number of Earners in Mulberry
The median family income in Mulberry is $65,417, with families comprising 3+ earners (98) having the highest median family income of $86,607, while families with 1 earner (106) have the lowest median family income of $48,214, accounting for 13.2% and 14.2% of families, respectively.
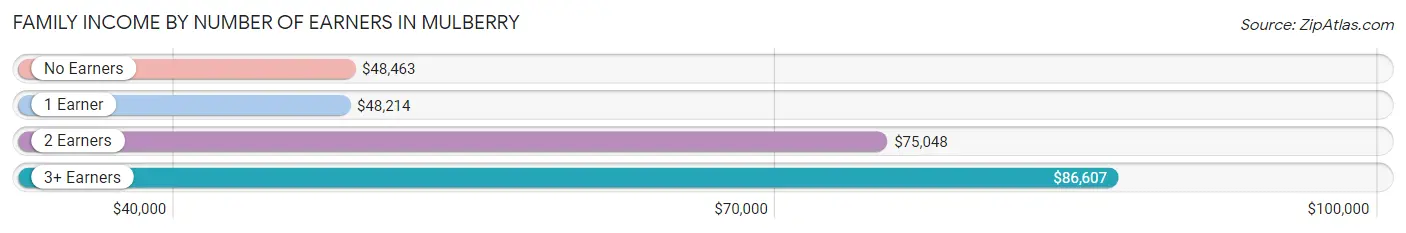
| Number of Earners | # Families | Median Income |
| No Earners | 323 (43.4%) | $48,463 |
| 1 Earner | 106 (14.2%) | $48,214 |
| 2 Earners | 217 (29.2%) | $75,048 |
| 3+ Earners | 98 (13.2%) | $86,607 |
| Total | 744 (100.0%) | $65,417 |
Household Income in Mulberry
Household Income Brackets in Mulberry
With 220 households falling in the category, the $35,000 to $49,999 income range is the most frequent in Mulberry, accounting for 24.4% of all households. In contrast, only 9 households (1.0%) fall into the $150,000 to $199,999 income bracket, making it the least populous group.
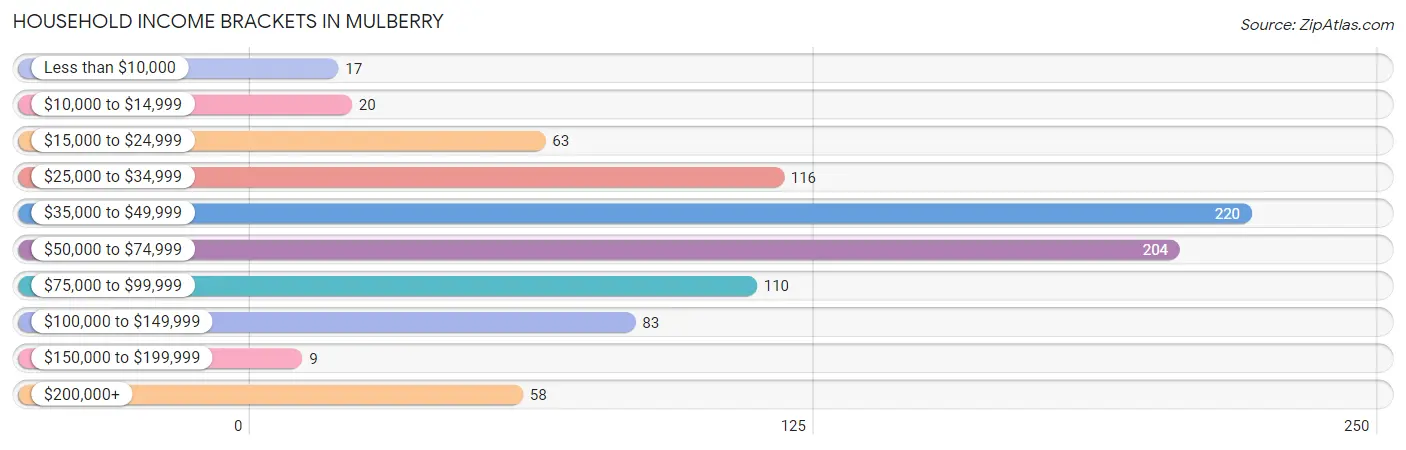
| Income Bracket | # Households | % Households |
| Less than $10,000 | 17 | 1.9% |
| $10,000 to $14,999 | 20 | 2.2% |
| $15,000 to $24,999 | 63 | 7.0% |
| $25,000 to $34,999 | 116 | 12.9% |
| $35,000 to $49,999 | 220 | 24.4% |
| $50,000 to $74,999 | 204 | 22.7% |
| $75,000 to $99,999 | 110 | 12.2% |
| $100,000 to $149,999 | 83 | 9.2% |
| $150,000 to $199,999 | 9 | 1.0% |
| $200,000+ | 58 | 6.4% |
Household Income by Householder Age in Mulberry
The median household income in Mulberry is $51,750, with the highest median household income of $86,726 found in the 45 to 64 years age bracket for the primary householder. A total of 242 households (26.9%) fall into this category. Meanwhile, the 25 to 44 years age bracket for the primary householder has the lowest median household income of $0, with 111 households (12.3%) in this group.
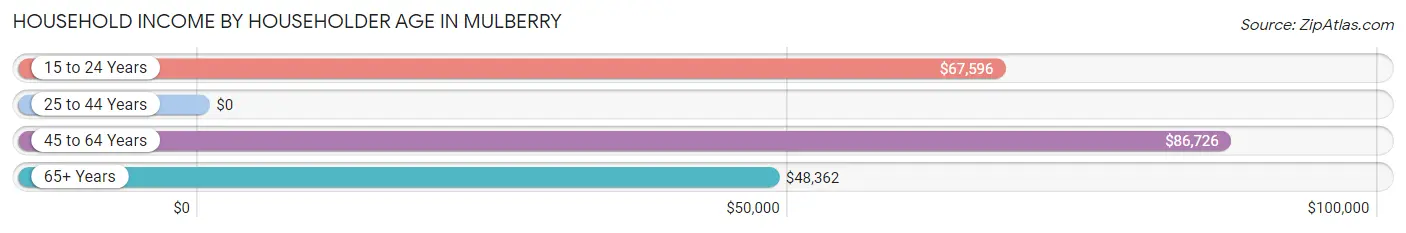
| Income Bracket | # Households | Median Income |
| 15 to 24 Years | 53 (5.9%) | $67,596 |
| 25 to 44 Years | 111 (12.3%) | $0 |
| 45 to 64 Years | 242 (26.9%) | $86,726 |
| 65+ Years | 494 (54.9%) | $48,362 |
| Total | 900 (100.0%) | $51,750 |
Poverty in Mulberry
Income Below Poverty by Sex and Age in Mulberry
With 1.5% poverty level for males and 4.2% for females among the residents of Mulberry, 65 to 74 year old males and 55 to 64 year old females are the most vulnerable to poverty, with 17 males (12.7%) and 16 females (17.0%) in their respective age groups living below the poverty level.
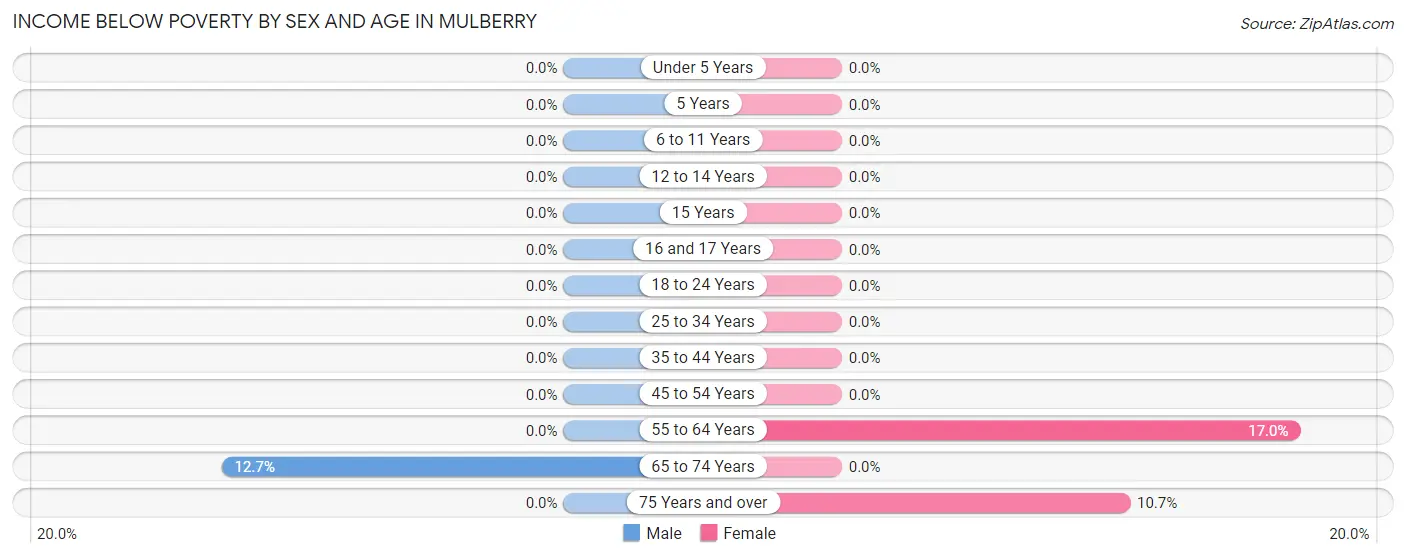
| Age Bracket | Male | Female |
| Under 5 Years | 0 (0.0%) | 0 (0.0%) |
| 5 Years | 0 (0.0%) | 0 (0.0%) |
| 6 to 11 Years | 0 (0.0%) | 0 (0.0%) |
| 12 to 14 Years | 0 (0.0%) | 0 (0.0%) |
| 15 Years | 0 (0.0%) | 0 (0.0%) |
| 16 and 17 Years | 0 (0.0%) | 0 (0.0%) |
| 18 to 24 Years | 0 (0.0%) | 0 (0.0%) |
| 25 to 34 Years | 0 (0.0%) | 0 (0.0%) |
| 35 to 44 Years | 0 (0.0%) | 0 (0.0%) |
| 45 to 54 Years | 0 (0.0%) | 0 (0.0%) |
| 55 to 64 Years | 0 (0.0%) | 16 (17.0%) |
| 65 to 74 Years | 17 (12.7%) | 0 (0.0%) |
| 75 Years and over | 0 (0.0%) | 20 (10.7%) |
| Total | 17 (1.5%) | 36 (4.2%) |
Income Above Poverty by Sex and Age in Mulberry
According to the poverty statistics in Mulberry, males aged under 5 years and females aged under 5 years are the age groups that are most secure financially, with 100.0% of males and 100.0% of females in these age groups living above the poverty line.
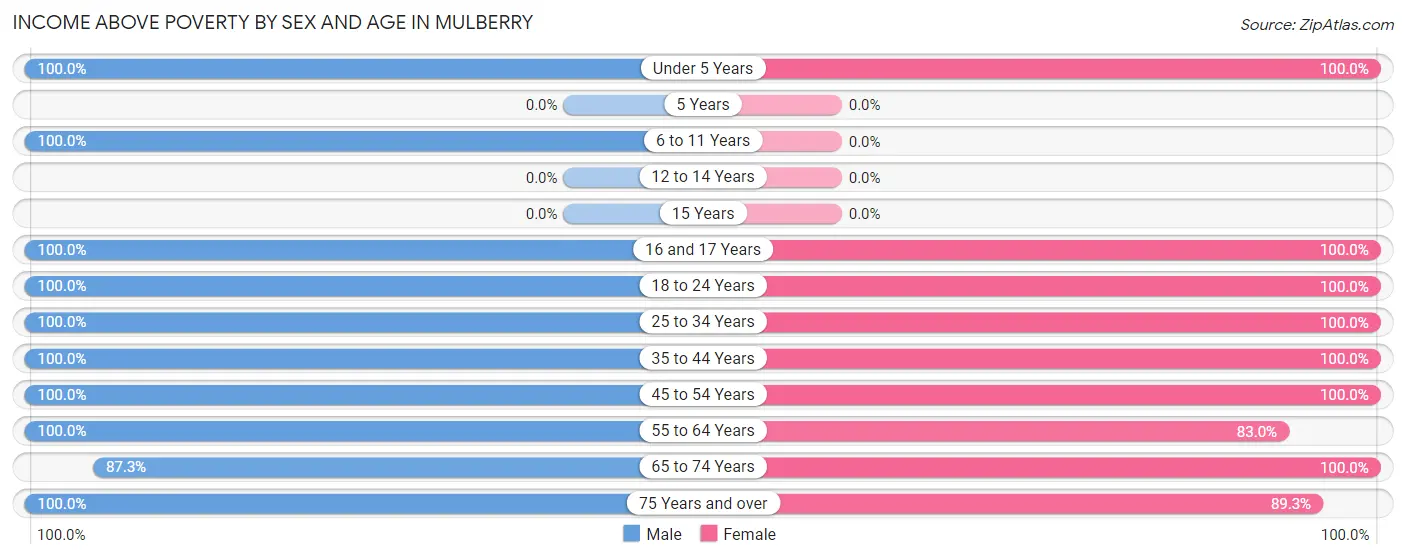
| Age Bracket | Male | Female |
| Under 5 Years | 84 (100.0%) | 15 (100.0%) |
| 5 Years | 0 (0.0%) | 0 (0.0%) |
| 6 to 11 Years | 31 (100.0%) | 0 (0.0%) |
| 12 to 14 Years | 0 (0.0%) | 0 (0.0%) |
| 15 Years | 0 (0.0%) | 0 (0.0%) |
| 16 and 17 Years | 45 (100.0%) | 15 (100.0%) |
| 18 to 24 Years | 177 (100.0%) | 73 (100.0%) |
| 25 to 34 Years | 96 (100.0%) | 85 (100.0%) |
| 35 to 44 Years | 9 (100.0%) | 29 (100.0%) |
| 45 to 54 Years | 147 (100.0%) | 187 (100.0%) |
| 55 to 64 Years | 154 (100.0%) | 78 (83.0%) |
| 65 to 74 Years | 117 (87.3%) | 169 (100.0%) |
| 75 Years and over | 249 (100.0%) | 167 (89.3%) |
| Total | 1,109 (98.5%) | 818 (95.8%) |
Income Below Poverty Among Married-Couple Families in Mulberry
The poverty statistics for married-couple families in Mulberry show that 2.5% or 17 of the total 687 families live below the poverty line. Families with no children have the highest poverty rate of 3.1%, comprising of 17 families. On the other hand, families with 1 or 2 children have the lowest poverty rate of 0.0%, which includes 0 families.
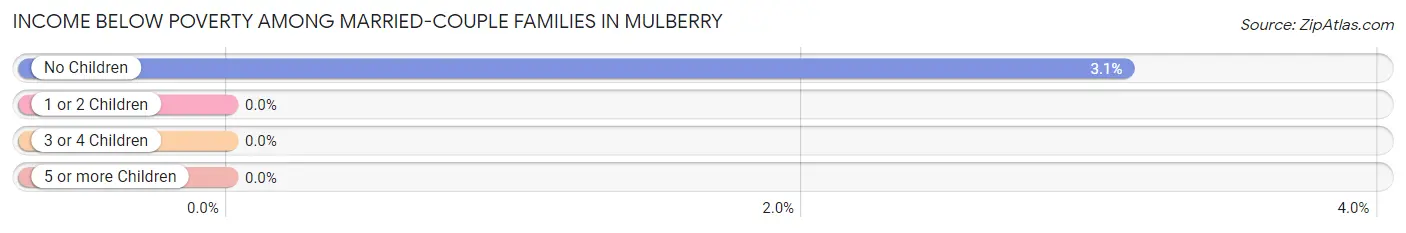
| Children | Above Poverty | Below Poverty |
| No Children | 527 (96.9%) | 17 (3.1%) |
| 1 or 2 Children | 143 (100.0%) | 0 (0.0%) |
| 3 or 4 Children | 0 (0.0%) | 0 (0.0%) |
| 5 or more Children | 0 (0.0%) | 0 (0.0%) |
| Total | 670 (97.5%) | 17 (2.5%) |
Income Below Poverty Among Single-Parent Households in Mulberry
| Children | Single Father | Single Mother |
| No Children | 0 (0.0%) | 0 (0.0%) |
| 1 or 2 Children | 0 (0.0%) | 0 (0.0%) |
| 3 or 4 Children | 0 (0.0%) | 0 (0.0%) |
| 5 or more Children | 0 (0.0%) | 0 (0.0%) |
| Total | 0 (0.0%) | 0 (0.0%) |
Income Below Poverty Among Married-Couple vs Single-Parent Households in Mulberry
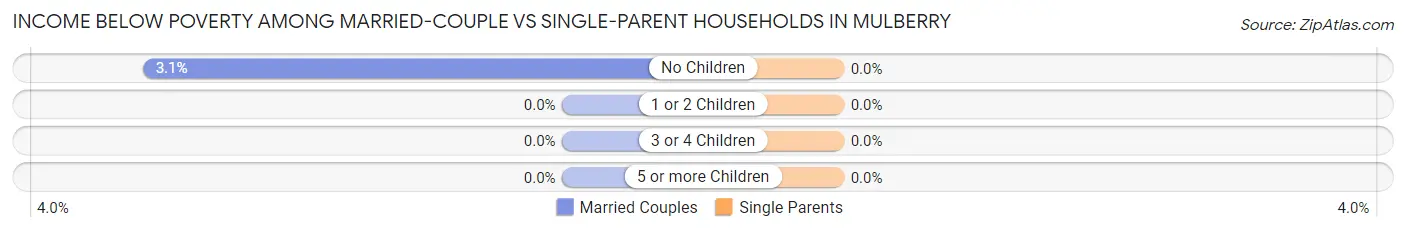
| Children | Married-Couple Families | Single-Parent Households |
| No Children | 17 (3.1%) | 0 (0.0%) |
| 1 or 2 Children | 0 (0.0%) | 0 (0.0%) |
| 3 or 4 Children | 0 (0.0%) | 0 (0.0%) |
| 5 or more Children | 0 (0.0%) | 0 (0.0%) |
| Total | 17 (2.5%) | 0 (0.0%) |
Race in Mulberry
The most populous races in Mulberry are White / Caucasian (1,868 | 94.3%), Hispanic or Latino (109 | 5.5%), and Two or more Races (92 | 4.6%).
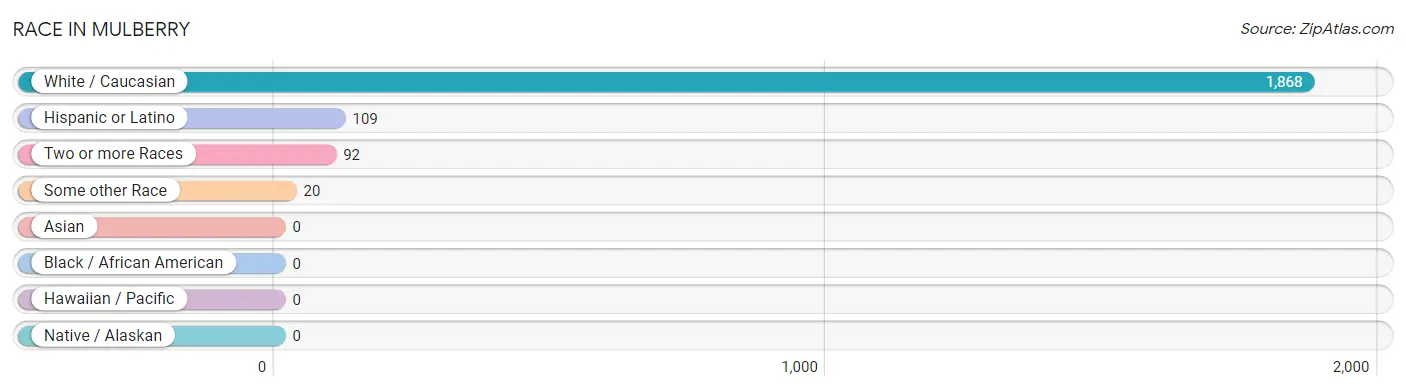
| Race | # Population | % Population |
| Asian | 0 | 0.0% |
| Black / African American | 0 | 0.0% |
| Hawaiian / Pacific | 0 | 0.0% |
| Hispanic or Latino | 109 | 5.5% |
| Native / Alaskan | 0 | 0.0% |
| White / Caucasian | 1,868 | 94.3% |
| Two or more Races | 92 | 4.6% |
| Some other Race | 20 | 1.0% |
| Total | 1,980 | 100.0% |
Ancestry in Mulberry
The most populous ancestries reported in Mulberry are German (410 | 20.7%), French (308 | 15.6%), American (295 | 14.9%), English (273 | 13.8%), and Irish (190 | 9.6%), together accounting for 74.6% of all Mulberry residents.
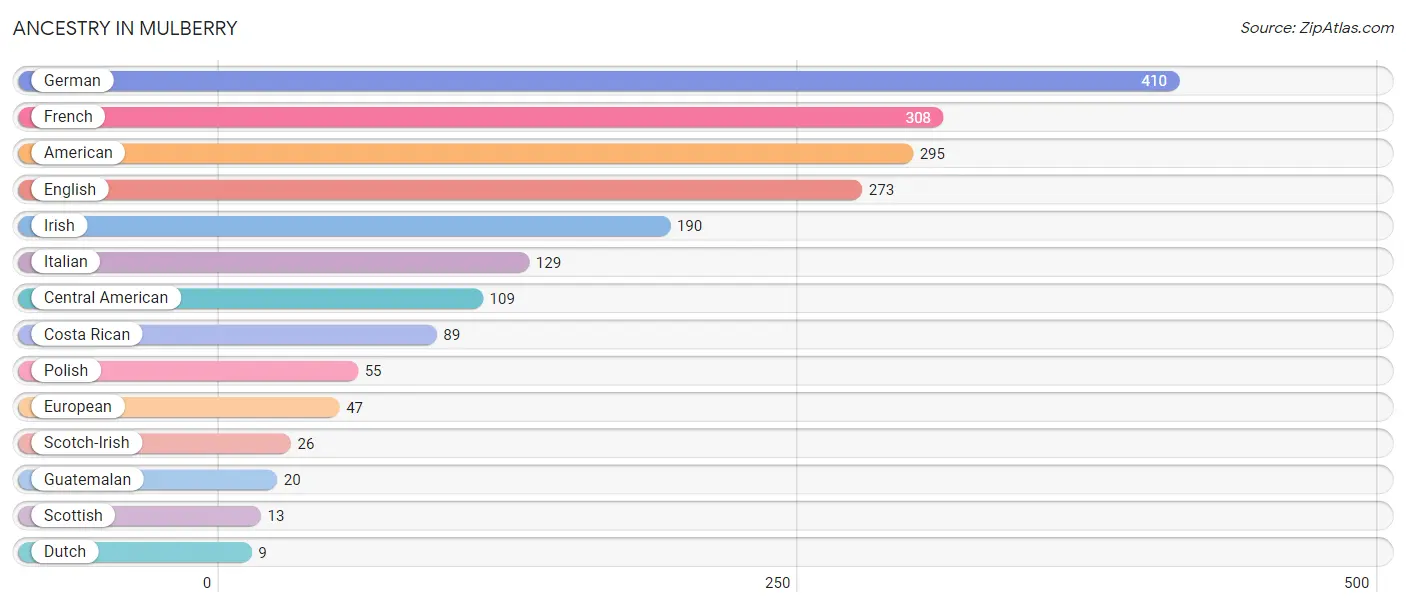
| Ancestry | # Population | % Population |
| American | 295 | 14.9% |
| Central American | 109 | 5.5% |
| Costa Rican | 89 | 4.5% |
| Dutch | 9 | 0.4% |
| English | 273 | 13.8% |
| European | 47 | 2.4% |
| French | 308 | 15.6% |
| German | 410 | 20.7% |
| Guatemalan | 20 | 1.0% |
| Irish | 190 | 9.6% |
| Italian | 129 | 6.5% |
| Polish | 55 | 2.8% |
| Scotch-Irish | 26 | 1.3% |
| Scottish | 13 | 0.7% | View All 14 Rows |
Immigrants in Mulberry
The most numerous immigrant groups reported in Mulberry came from Central America (109 | 5.5%), Latin America (109 | 5.5%), Costa Rica (89 | 4.5%), and Guatemala (20 | 1.0%), together accounting for 16.5% of all Mulberry residents.
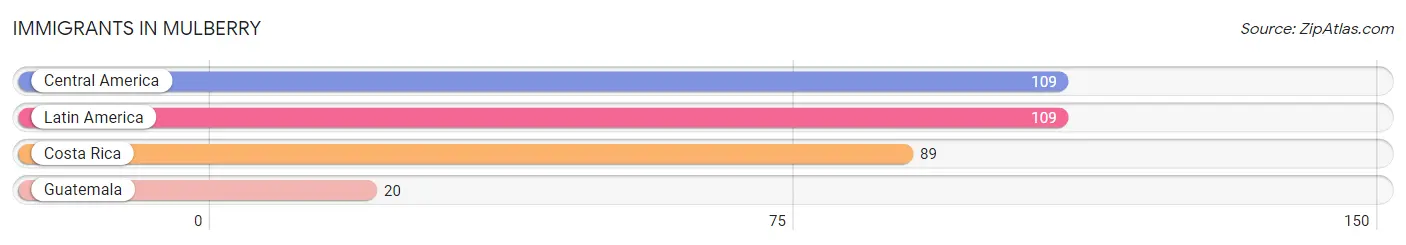
| Immigration Origin | # Population | % Population |
| Central America | 109 | 5.5% |
| Costa Rica | 89 | 4.5% |
| Guatemala | 20 | 1.0% |
| Latin America | 109 | 5.5% | View All 4 Rows |
Sex and Age in Mulberry
Sex and Age in Mulberry
The most populous age groups in Mulberry are 20 to 24 Years (152 | 13.5%) for men and 50 to 54 Years (110 | 12.9%) for women.
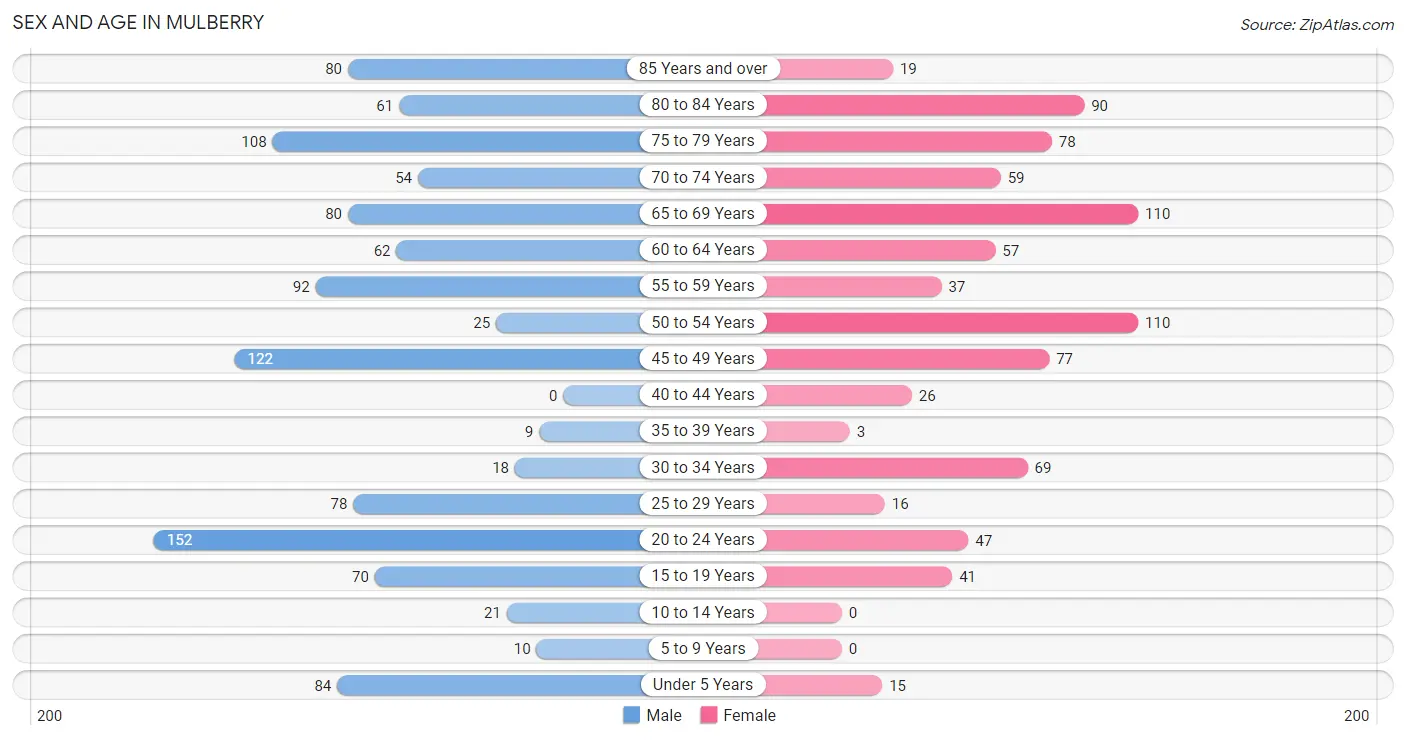
| Age Bracket | Male | Female |
| Under 5 Years | 84 (7.5%) | 15 (1.8%) |
| 5 to 9 Years | 10 (0.9%) | 0 (0.0%) |
| 10 to 14 Years | 21 (1.9%) | 0 (0.0%) |
| 15 to 19 Years | 70 (6.2%) | 41 (4.8%) |
| 20 to 24 Years | 152 (13.5%) | 47 (5.5%) |
| 25 to 29 Years | 78 (6.9%) | 16 (1.9%) |
| 30 to 34 Years | 18 (1.6%) | 69 (8.1%) |
| 35 to 39 Years | 9 (0.8%) | 3 (0.4%) |
| 40 to 44 Years | 0 (0.0%) | 26 (3.0%) |
| 45 to 49 Years | 122 (10.8%) | 77 (9.0%) |
| 50 to 54 Years | 25 (2.2%) | 110 (12.9%) |
| 55 to 59 Years | 92 (8.2%) | 37 (4.3%) |
| 60 to 64 Years | 62 (5.5%) | 57 (6.7%) |
| 65 to 69 Years | 80 (7.1%) | 110 (12.9%) |
| 70 to 74 Years | 54 (4.8%) | 59 (6.9%) |
| 75 to 79 Years | 108 (9.6%) | 78 (9.1%) |
| 80 to 84 Years | 61 (5.4%) | 90 (10.5%) |
| 85 Years and over | 80 (7.1%) | 19 (2.2%) |
| Total | 1,126 (100.0%) | 854 (100.0%) |
Families and Households in Mulberry
Median Family Size in Mulberry
The median family size in Mulberry is 2.42 persons per family, with single male/father families (25 | 3.4%) accounting for the largest median family size of 3.52 persons per family. On the other hand, married-couple families (687 | 92.3%) represent the smallest median family size with 2.35 persons per family.
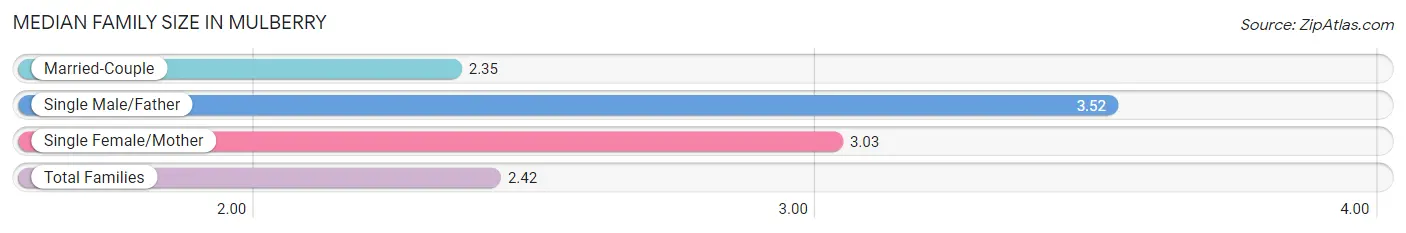
| Family Type | # Families | Family Size |
| Married-Couple | 687 (92.3%) | 2.35 |
| Single Male/Father | 25 (3.4%) | 3.52 |
| Single Female/Mother | 32 (4.3%) | 3.03 |
| Total Families | 744 (100.0%) | 2.42 |
Median Household Size in Mulberry
The median household size in Mulberry is 2.20 persons per household, with single male/father households (25 | 2.8%) accounting for the largest median household size of 3.52 persons per household. non-family households (156 | 17.3%) represent the smallest median household size with 1.08 persons per household.
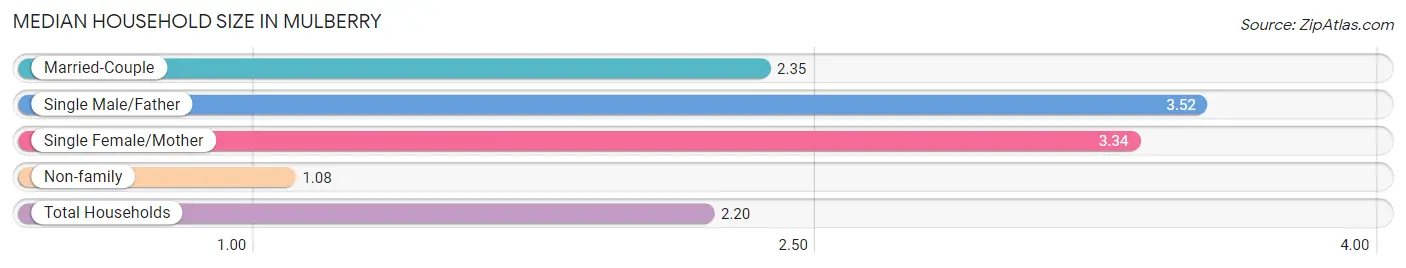
| Household Type | # Households | Household Size |
| Married-Couple | 687 (76.3%) | 2.35 |
| Single Male/Father | 25 (2.8%) | 3.52 |
| Single Female/Mother | 32 (3.6%) | 3.34 |
| Non-family | 156 (17.3%) | 1.08 |
| Total Households | 900 (100.0%) | 2.20 |
Household Size by Marriage Status in Mulberry
Out of a total of 900 households in Mulberry, 744 (82.7%) are family households, while 156 (17.3%) are nonfamily households. The most numerous type of family households are 2-person households, comprising 499, and the most common type of nonfamily households are 1-person households, comprising 143.
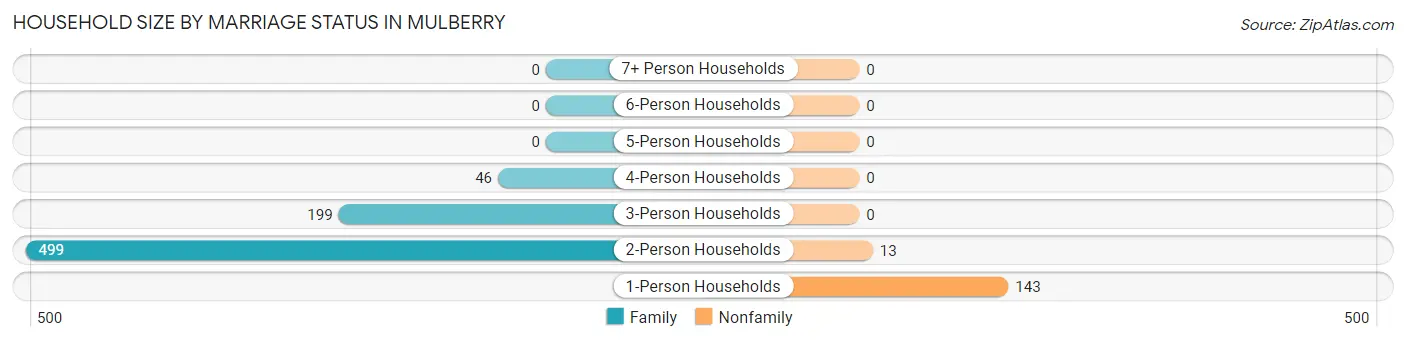
| Household Size | Family Households | Nonfamily Households |
| 1-Person Households | - | 143 (15.9%) |
| 2-Person Households | 499 (55.4%) | 13 (1.4%) |
| 3-Person Households | 199 (22.1%) | 0 (0.0%) |
| 4-Person Households | 46 (5.1%) | 0 (0.0%) |
| 5-Person Households | 0 (0.0%) | 0 (0.0%) |
| 6-Person Households | 0 (0.0%) | 0 (0.0%) |
| 7+ Person Households | 0 (0.0%) | 0 (0.0%) |
| Total | 744 (82.7%) | 156 (17.3%) |
Female Fertility in Mulberry
Fertility by Age in Mulberry
Average fertility rate in Mulberry is 78.0 births per 1,000 women. Women in the age bracket of 15 to 19 years have the highest fertility rate with 634.0 births per 1,000 women. Women in the age bracket of 15 to 19 years acount for 100.0% of all women with births.
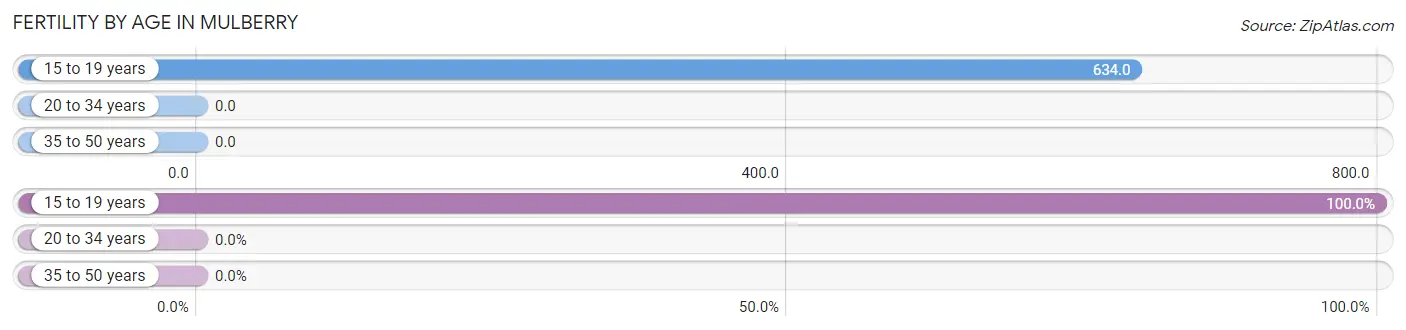
| Age Bracket | Women with Births | Births / 1,000 Women |
| 15 to 19 years | 26 (100.0%) | 634.0 |
| 20 to 34 years | 0 (0.0%) | 0.0 |
| 35 to 50 years | 0 (0.0%) | 0.0 |
| Total | 26 (100.0%) | 78.0 |
Fertility by Age by Marriage Status in Mulberry
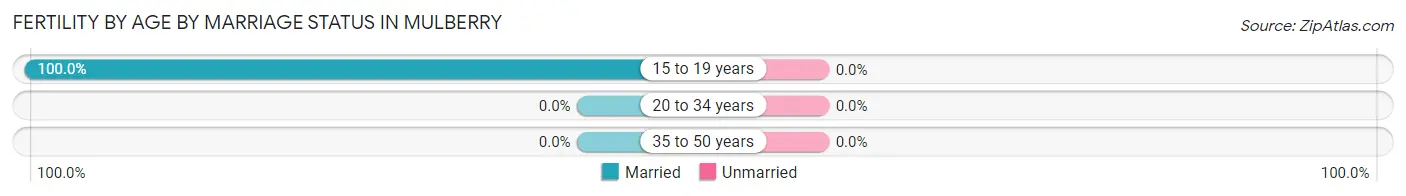
| Age Bracket | Married | Unmarried |
| 15 to 19 years | 26 (100.0%) | 0 (0.0%) |
| 20 to 34 years | 0 (0.0%) | 0 (0.0%) |
| 35 to 50 years | 0 (0.0%) | 0 (0.0%) |
| Total | 26 (100.0%) | 0 (0.0%) |
Fertility by Education in Mulberry
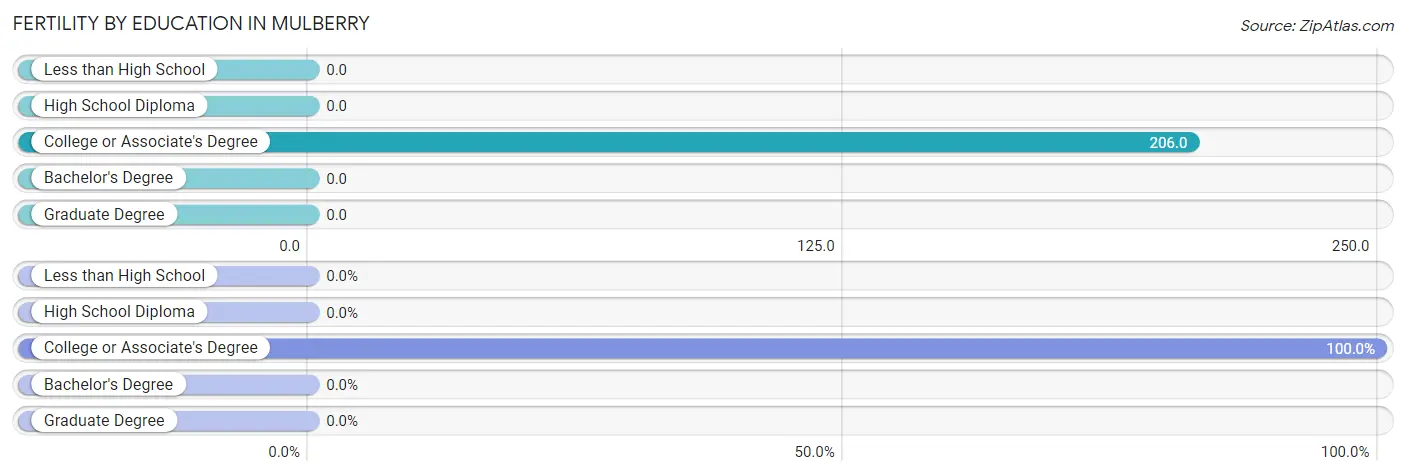
| Educational Attainment | Women with Births | Births / 1,000 Women |
| Less than High School | 0 (0.0%) | 0.0 |
| High School Diploma | 0 (0.0%) | 0.0 |
| College or Associate's Degree | 26 (100.0%) | 206.0 |
| Bachelor's Degree | 0 (0.0%) | 0.0 |
| Graduate Degree | 0 (0.0%) | 0.0 |
| Total | 26 (100.0%) | 78.0 |
Fertility by Education by Marriage Status in Mulberry
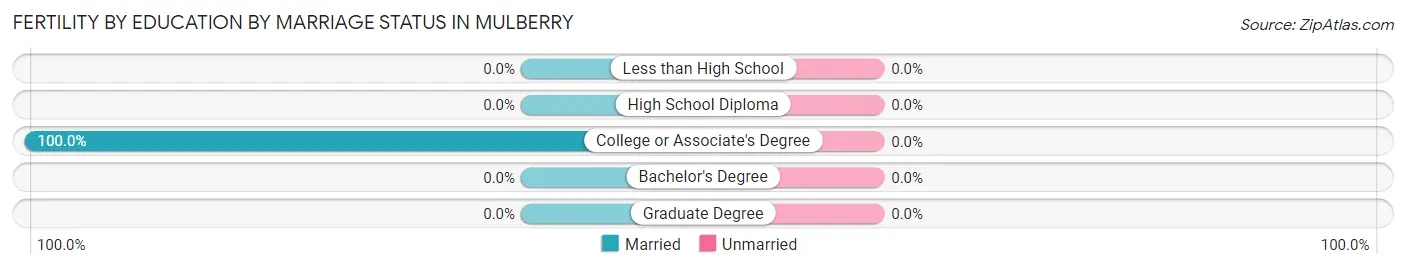
| Educational Attainment | Married | Unmarried |
| Less than High School | 0 (0.0%) | 0 (0.0%) |
| High School Diploma | 0 (0.0%) | 0 (0.0%) |
| College or Associate's Degree | 26 (100.0%) | 0 (0.0%) |
| Bachelor's Degree | 0 (0.0%) | 0 (0.0%) |
| Graduate Degree | 0 (0.0%) | 0 (0.0%) |
| Total | 26 (100.0%) | 0 (0.0%) |
Employment Characteristics in Mulberry
Employment by Class of Employer in Mulberry
Among the 686 employed individuals in Mulberry, private company employees (431 | 62.8%), federal government employees (102 | 14.9%), and state government employees (43 | 6.3%) make up the most common classes of employment.
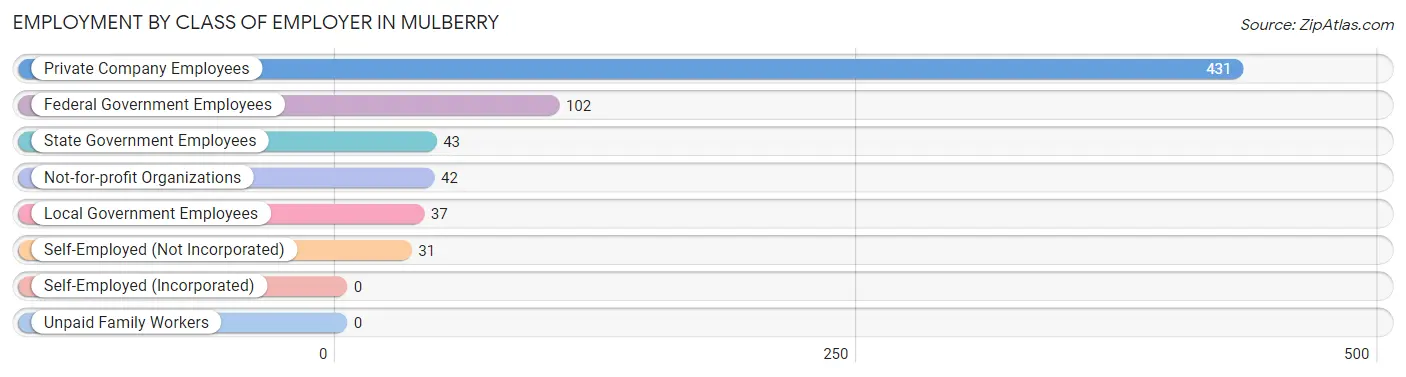
| Employer Class | # Employees | % Employees |
| Private Company Employees | 431 | 62.8% |
| Self-Employed (Incorporated) | 0 | 0.0% |
| Self-Employed (Not Incorporated) | 31 | 4.5% |
| Not-for-profit Organizations | 42 | 6.1% |
| Local Government Employees | 37 | 5.4% |
| State Government Employees | 43 | 6.3% |
| Federal Government Employees | 102 | 14.9% |
| Unpaid Family Workers | 0 | 0.0% |
| Total | 686 | 100.0% |
Employment Status by Age in Mulberry
According to the labor force statistics for Mulberry, out of the total population over 16 years of age (1,850), 43.0% or 796 individuals are in the labor force, with 9.5% or 76 of them unemployed. The age group with the highest labor force participation rate is 20 to 24 years, with 100.0% or 199 individuals in the labor force. Within the labor force, the 30 to 34 years age range has the highest percentage of unemployed individuals, with 66.7% or 20 of them being unemployed.
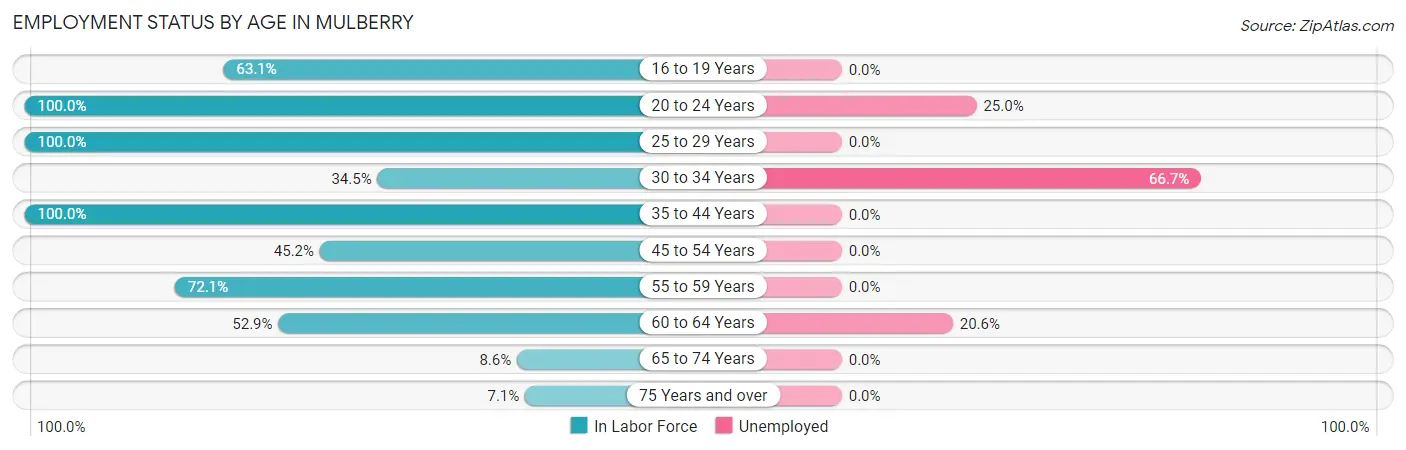
| Age Bracket | In Labor Force | Unemployed |
| 16 to 19 Years | 70 (63.1%) | 0 (0.0%) |
| 20 to 24 Years | 199 (100.0%) | 50 (25.0%) |
| 25 to 29 Years | 94 (100.0%) | 0 (0.0%) |
| 30 to 34 Years | 30 (34.5%) | 20 (66.7%) |
| 35 to 44 Years | 38 (100.0%) | 0 (0.0%) |
| 45 to 54 Years | 151 (45.2%) | 0 (0.0%) |
| 55 to 59 Years | 93 (72.1%) | 0 (0.0%) |
| 60 to 64 Years | 63 (52.9%) | 13 (20.6%) |
| 65 to 74 Years | 26 (8.6%) | 0 (0.0%) |
| 75 Years and over | 31 (7.1%) | 0 (0.0%) |
| Total | 796 (43.0%) | 76 (9.5%) |
Employment Status by Educational Attainment in Mulberry
According to labor force statistics for Mulberry, 58.6% of individuals (469) out of the total population between 25 and 64 years of age (801) are in the labor force, with 7.0% or 33 of them being unemployed. The group with the highest labor force participation rate are those with the educational attainment of high school diploma, with 71.4% or 180 individuals in the labor force. Within the labor force, individuals with less than high school education have the highest percentage of unemployment, with 21.3% or 13 of them being unemployed.
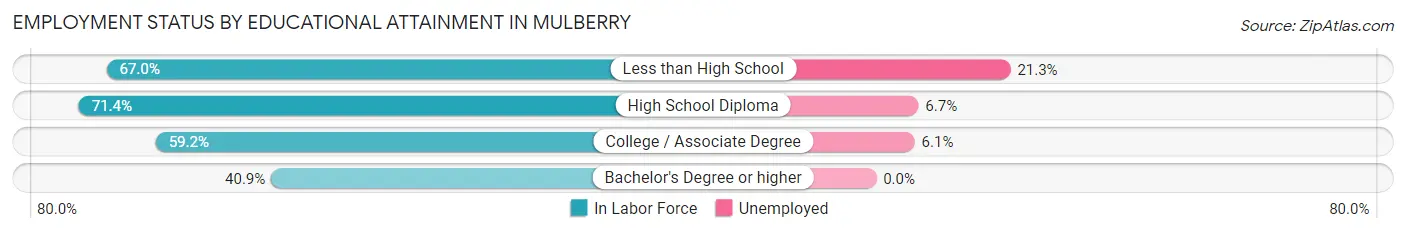
| Educational Attainment | In Labor Force | Unemployed |
| Less than High School | 61 (67.0%) | 19 (21.3%) |
| High School Diploma | 180 (71.4%) | 17 (6.7%) |
| College / Associate Degree | 132 (59.2%) | 14 (6.1%) |
| Bachelor's Degree or higher | 96 (40.9%) | 0 (0.0%) |
| Total | 469 (58.6%) | 56 (7.0%) |
Employment Occupations by Sex in Mulberry
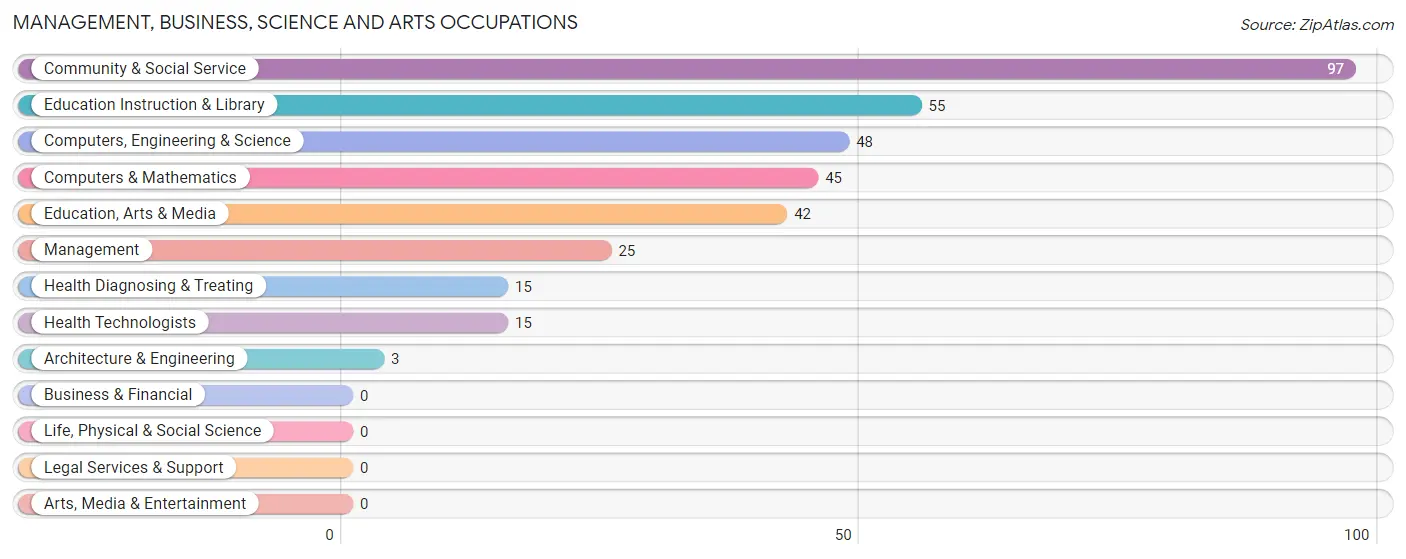
Management, Business, Science and Arts Occupations
The most common Management, Business, Science and Arts occupations in Mulberry are Community & Social Service (97 | 14.3%), Education Instruction & Library (55 | 8.1%), Computers, Engineering & Science (48 | 7.1%), Computers & Mathematics (45 | 6.7%), and Education, Arts & Media (42 | 6.2%).
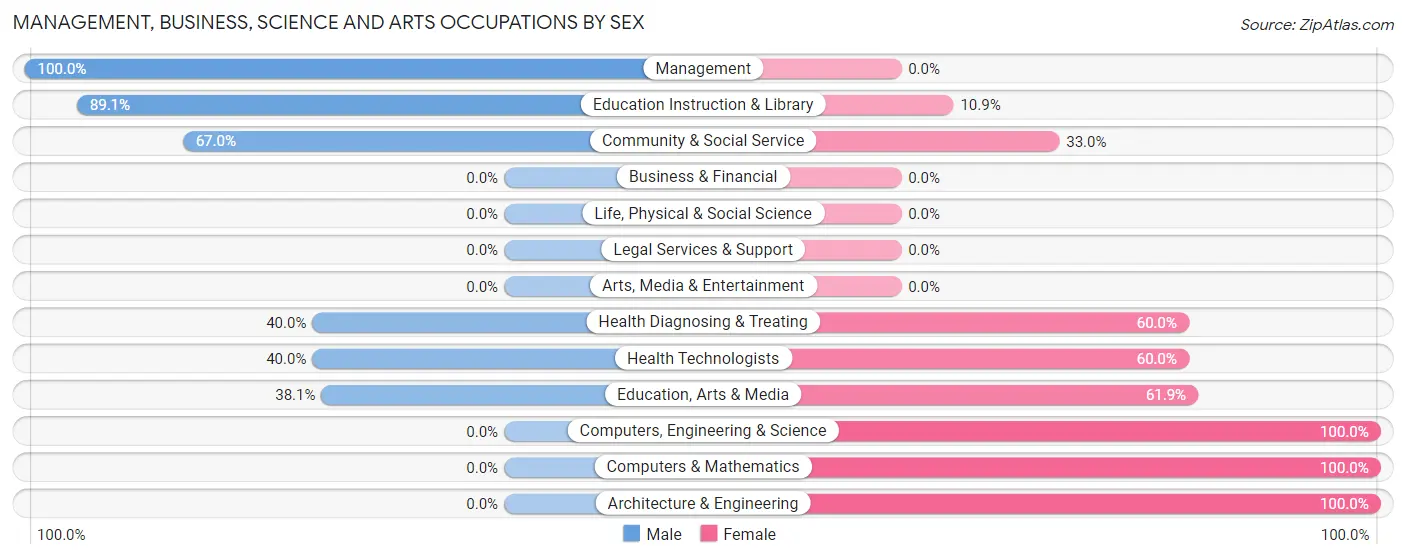
Management, Business, Science and Arts Occupations by Sex
Within the Management, Business, Science and Arts occupations in Mulberry, the most male-oriented occupations are Management (100.0%), Education Instruction & Library (89.1%), and Community & Social Service (67.0%), while the most female-oriented occupations are Computers, Engineering & Science (100.0%), Computers & Mathematics (100.0%), and Architecture & Engineering (100.0%).
| Occupation | Male | Female |
| Management | 25 (100.0%) | 0 (0.0%) |
| Business & Financial | 0 (0.0%) | 0 (0.0%) |
| Computers, Engineering & Science | 0 (0.0%) | 48 (100.0%) |
| Computers & Mathematics | 0 (0.0%) | 45 (100.0%) |
| Architecture & Engineering | 0 (0.0%) | 3 (100.0%) |
| Life, Physical & Social Science | 0 (0.0%) | 0 (0.0%) |
| Community & Social Service | 65 (67.0%) | 32 (33.0%) |
| Education, Arts & Media | 16 (38.1%) | 26 (61.9%) |
| Legal Services & Support | 0 (0.0%) | 0 (0.0%) |
| Education Instruction & Library | 49 (89.1%) | 6 (10.9%) |
| Arts, Media & Entertainment | 0 (0.0%) | 0 (0.0%) |
| Health Diagnosing & Treating | 6 (40.0%) | 9 (60.0%) |
| Health Technologists | 6 (40.0%) | 9 (60.0%) |
| Total (Category) | 96 (51.9%) | 89 (48.1%) |
| Total (Overall) | 456 (67.4%) | 221 (32.6%) |
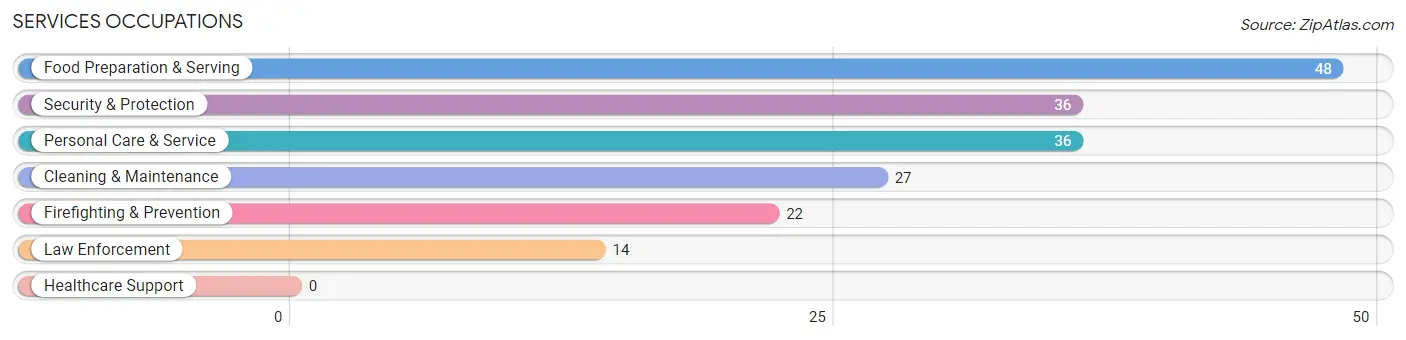
Services Occupations
The most common Services occupations in Mulberry are Food Preparation & Serving (48 | 7.1%), Security & Protection (36 | 5.3%), Personal Care & Service (36 | 5.3%), Cleaning & Maintenance (27 | 4.0%), and Firefighting & Prevention (22 | 3.3%).
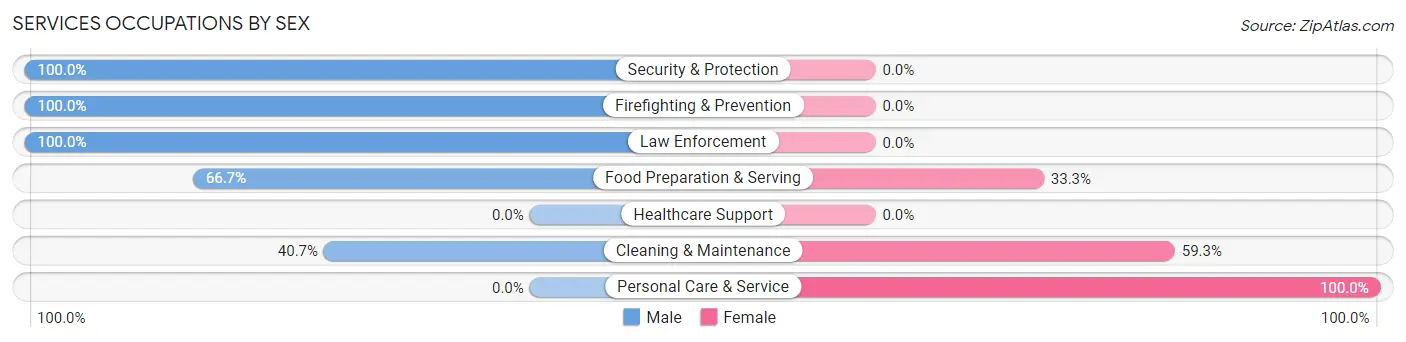
Services Occupations by Sex
Within the Services occupations in Mulberry, the most male-oriented occupations are Security & Protection (100.0%), Firefighting & Prevention (100.0%), and Law Enforcement (100.0%), while the most female-oriented occupations are Personal Care & Service (100.0%), Cleaning & Maintenance (59.3%), and Food Preparation & Serving (33.3%).
| Occupation | Male | Female |
| Healthcare Support | 0 (0.0%) | 0 (0.0%) |
| Security & Protection | 36 (100.0%) | 0 (0.0%) |
| Firefighting & Prevention | 22 (100.0%) | 0 (0.0%) |
| Law Enforcement | 14 (100.0%) | 0 (0.0%) |
| Food Preparation & Serving | 32 (66.7%) | 16 (33.3%) |
| Cleaning & Maintenance | 11 (40.7%) | 16 (59.3%) |
| Personal Care & Service | 0 (0.0%) | 36 (100.0%) |
| Total (Category) | 79 (53.7%) | 68 (46.3%) |
| Total (Overall) | 456 (67.4%) | 221 (32.6%) |
Sales and Office Occupations
The most common Sales and Office occupations in Mulberry are Sales & Related (141 | 20.8%), and Office & Administration (109 | 16.1%).

Sales and Office Occupations by Sex

| Occupation | Male | Female |
| Sales & Related | 128 (90.8%) | 13 (9.2%) |
| Office & Administration | 78 (71.6%) | 31 (28.4%) |
| Total (Category) | 206 (82.4%) | 44 (17.6%) |
| Total (Overall) | 456 (67.4%) | 221 (32.6%) |
Natural Resources, Construction and Maintenance Occupations

Natural Resources, Construction and Maintenance Occupations by Sex
| Occupation | Male | Female |
| Farming, Fishing & Forestry | 0 (0.0%) | 0 (0.0%) |
| Construction & Extraction | 0 (0.0%) | 0 (0.0%) |
| Installation, Maintenance & Repair | 0 (0.0%) | 0 (0.0%) |
| Total (Category) | 0 (0.0%) | 0 (0.0%) |
| Total (Overall) | 456 (67.4%) | 221 (32.6%) |
Production, Transportation and Moving Occupations
The most common Production, Transportation and Moving occupations in Mulberry are Material Moving (60 | 8.9%), and Production (35 | 5.2%).
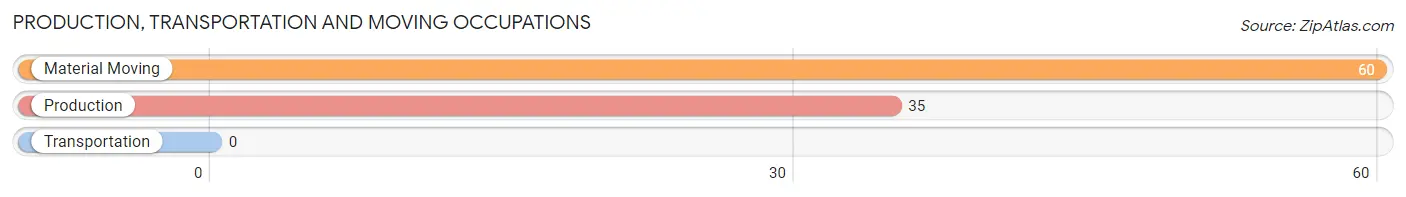
Production, Transportation and Moving Occupations by Sex
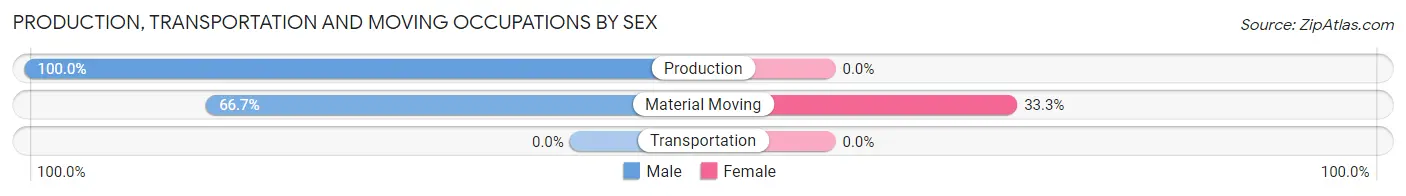
| Occupation | Male | Female |
| Production | 35 (100.0%) | 0 (0.0%) |
| Transportation | 0 (0.0%) | 0 (0.0%) |
| Material Moving | 40 (66.7%) | 20 (33.3%) |
| Total (Category) | 75 (78.9%) | 20 (21.0%) |
| Total (Overall) | 456 (67.4%) | 221 (32.6%) |
Employment Industries by Sex in Mulberry
Employment Industries in Mulberry
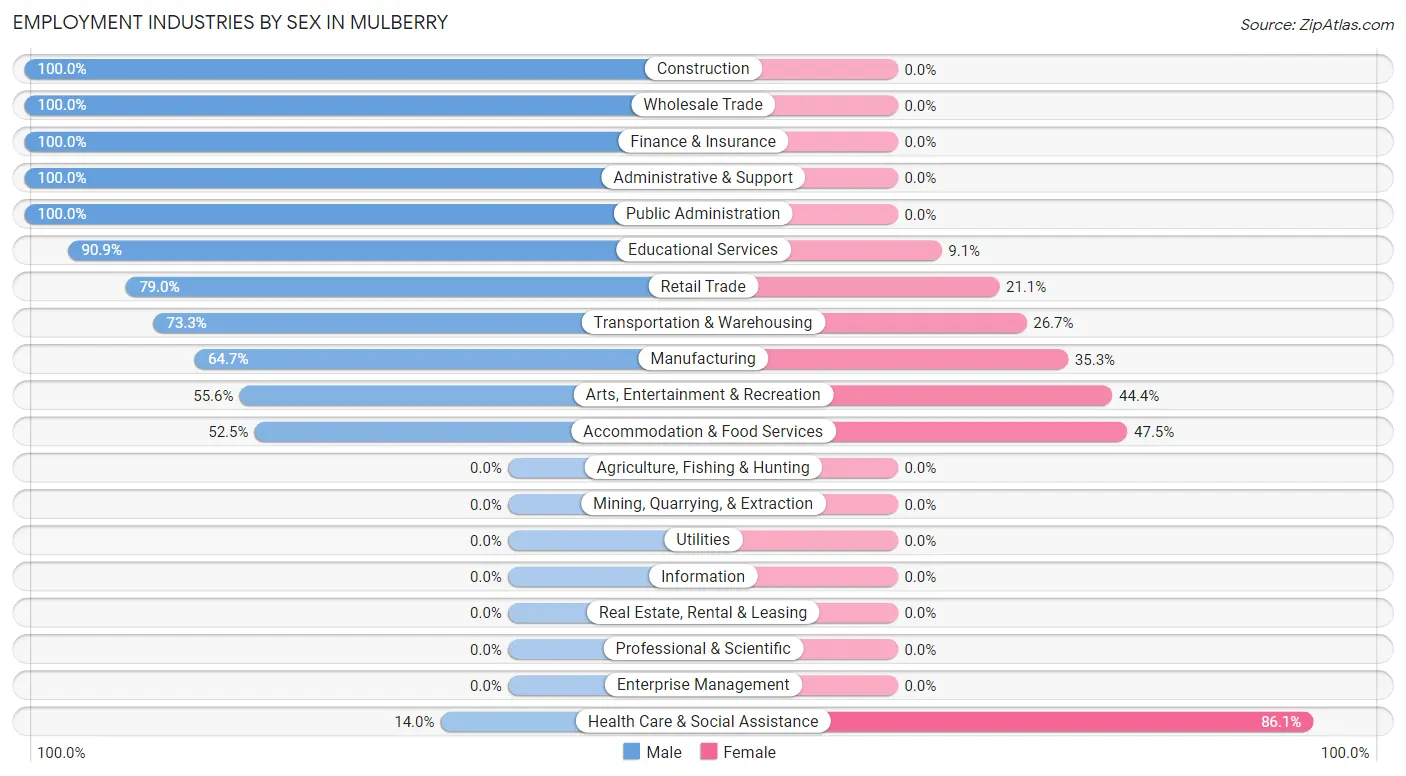
The major employment industries in Mulberry include Manufacturing (136 | 20.1%), Retail Trade (95 | 14.0%), Transportation & Warehousing (75 | 11.1%), Educational Services (66 | 9.8%), and Accommodation & Food Services (61 | 9.0%).
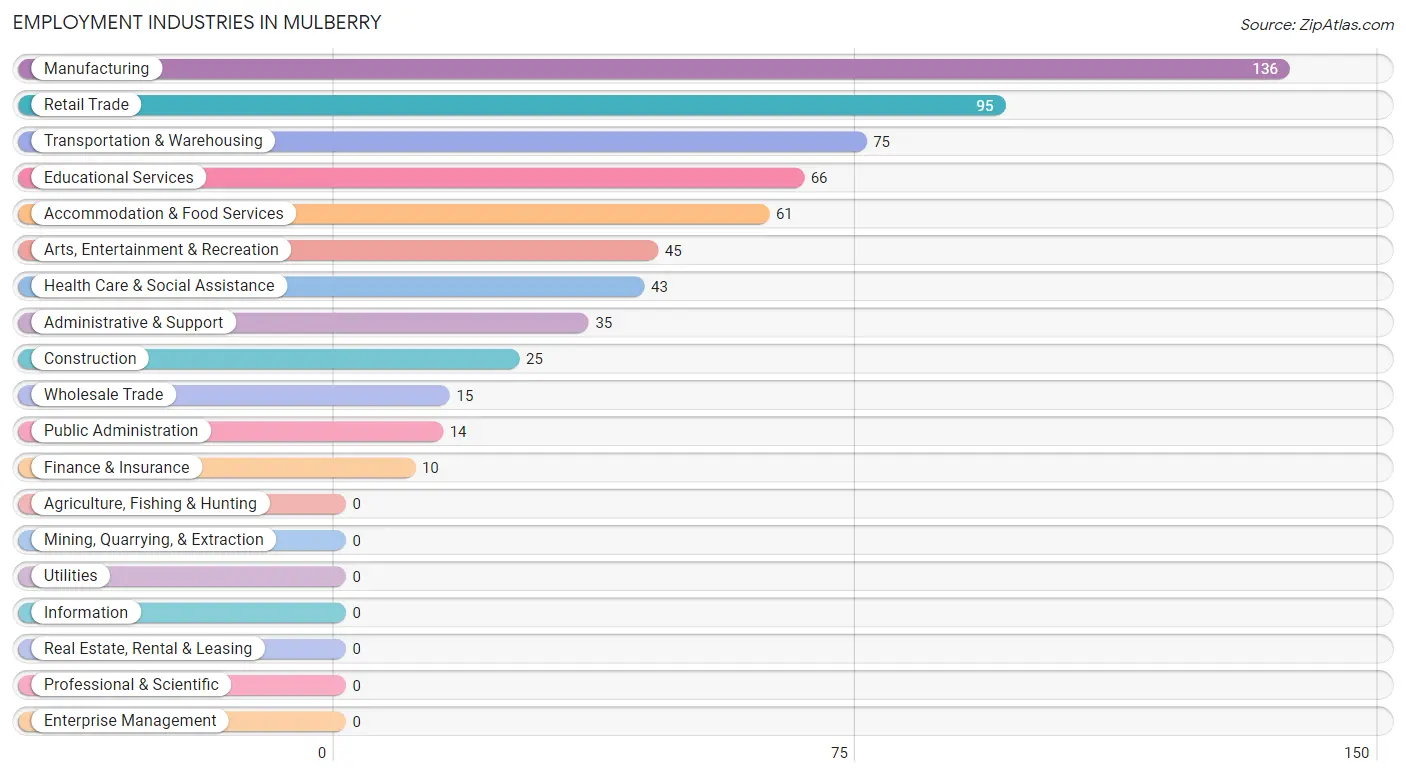
Employment Industries by Sex in Mulberry
The Mulberry industries that see more men than women are Construction (100.0%), Wholesale Trade (100.0%), and Finance & Insurance (100.0%), whereas the industries that tend to have a higher number of women are Health Care & Social Assistance (86.1%), Accommodation & Food Services (47.5%), and Arts, Entertainment & Recreation (44.4%).
| Industry | Male | Female |
| Agriculture, Fishing & Hunting | 0 (0.0%) | 0 (0.0%) |
| Mining, Quarrying, & Extraction | 0 (0.0%) | 0 (0.0%) |
| Construction | 25 (100.0%) | 0 (0.0%) |
| Manufacturing | 88 (64.7%) | 48 (35.3%) |
| Wholesale Trade | 15 (100.0%) | 0 (0.0%) |
| Retail Trade | 75 (78.9%) | 20 (21.0%) |
| Transportation & Warehousing | 55 (73.3%) | 20 (26.7%) |
| Utilities | 0 (0.0%) | 0 (0.0%) |
| Information | 0 (0.0%) | 0 (0.0%) |
| Finance & Insurance | 10 (100.0%) | 0 (0.0%) |
| Real Estate, Rental & Leasing | 0 (0.0%) | 0 (0.0%) |
| Professional & Scientific | 0 (0.0%) | 0 (0.0%) |
| Enterprise Management | 0 (0.0%) | 0 (0.0%) |
| Administrative & Support | 35 (100.0%) | 0 (0.0%) |
| Educational Services | 60 (90.9%) | 6 (9.1%) |
| Health Care & Social Assistance | 6 (14.0%) | 37 (86.1%) |
| Arts, Entertainment & Recreation | 25 (55.6%) | 20 (44.4%) |
| Accommodation & Food Services | 32 (52.5%) | 29 (47.5%) |
| Public Administration | 14 (100.0%) | 0 (0.0%) |
| Total | 456 (67.4%) | 221 (32.6%) |
Education in Mulberry
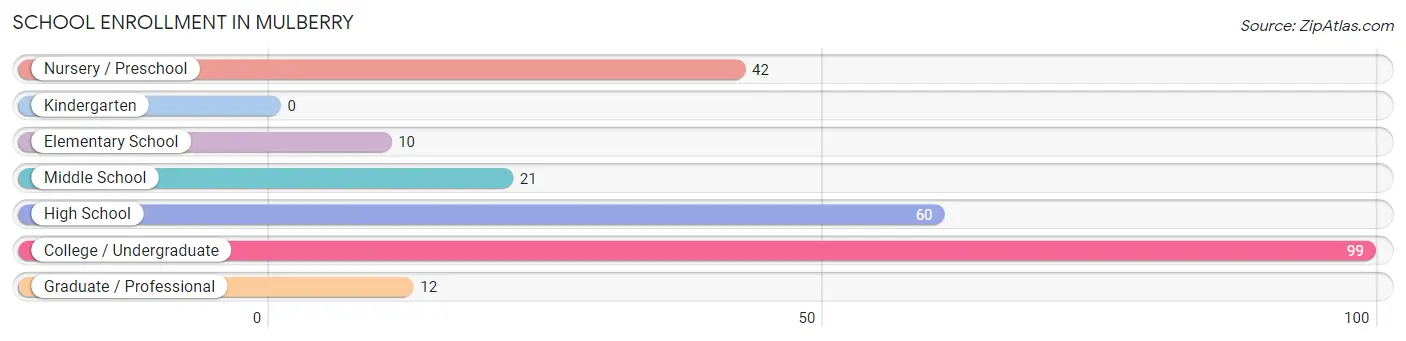
School Enrollment in Mulberry
The most common levels of schooling among the 244 students in Mulberry are college / undergraduate (99 | 40.6%), high school (60 | 24.6%), and nursery / preschool (42 | 17.2%).
| School Level | # Students | % Students |
| Nursery / Preschool | 42 | 17.2% |
| Kindergarten | 0 | 0.0% |
| Elementary School | 10 | 4.1% |
| Middle School | 21 | 8.6% |
| High School | 60 | 24.6% |
| College / Undergraduate | 99 | 40.6% |
| Graduate / Professional | 12 | 4.9% |
| Total | 244 | 100.0% |
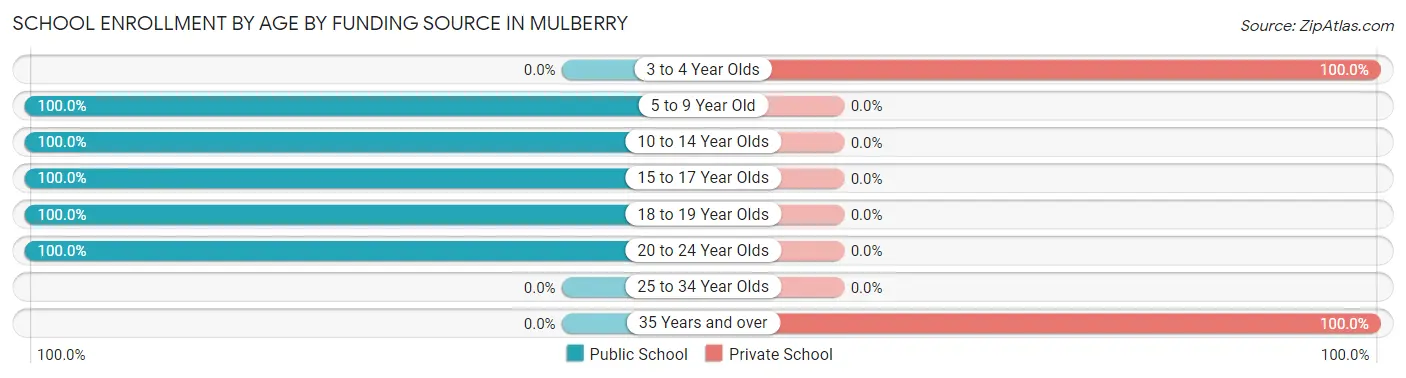
School Enrollment by Age by Funding Source in Mulberry
Out of a total of 244 students who are enrolled in schools in Mulberry, 54 (22.1%) attend a private institution, while the remaining 190 (77.9%) are enrolled in public schools. The age group of 3 to 4 year olds has the highest likelihood of being enrolled in private schools, with 42 (100.0% in the age bracket) enrolled. Conversely, the age group of 5 to 9 year old has the lowest likelihood of being enrolled in a private school, with 10 (100.0% in the age bracket) attending a public institution.
| Age Bracket | Public School | Private School |
| 3 to 4 Year Olds | 0 (0.0%) | 42 (100.0%) |
| 5 to 9 Year Old | 10 (100.0%) | 0 (0.0%) |
| 10 to 14 Year Olds | 21 (100.0%) | 0 (0.0%) |
| 15 to 17 Year Olds | 60 (100.0%) | 0 (0.0%) |
| 18 to 19 Year Olds | 12 (100.0%) | 0 (0.0%) |
| 20 to 24 Year Olds | 87 (100.0%) | 0 (0.0%) |
| 25 to 34 Year Olds | 0 (0.0%) | 0 (0.0%) |
| 35 Years and over | 0 (0.0%) | 12 (100.0%) |
| Total | 190 (77.9%) | 54 (22.1%) |
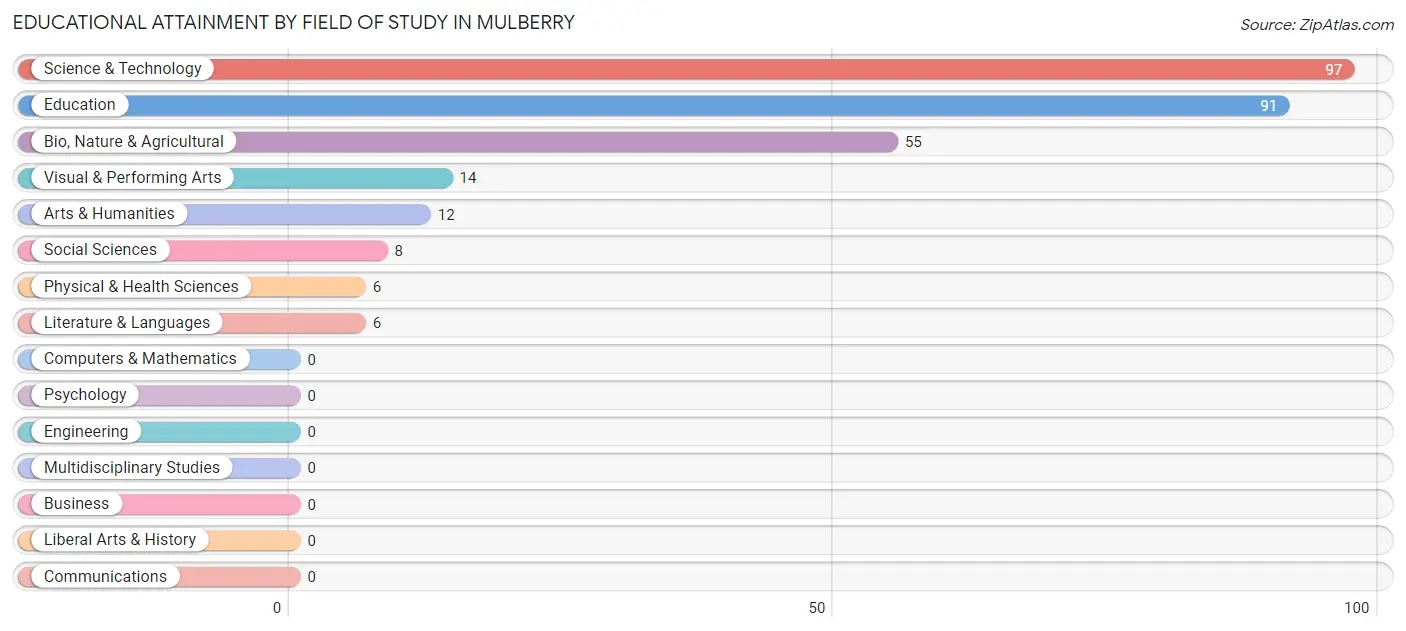
Educational Attainment by Field of Study in Mulberry
Science & technology (97 | 33.6%), education (91 | 31.5%), bio, nature & agricultural (55 | 19.0%), visual & performing arts (14 | 4.8%), and arts & humanities (12 | 4.2%) are the most common fields of study among 289 individuals in Mulberry who have obtained a bachelor's degree or higher.
| Field of Study | # Graduates | % Graduates |
| Computers & Mathematics | 0 | 0.0% |
| Bio, Nature & Agricultural | 55 | 19.0% |
| Physical & Health Sciences | 6 | 2.1% |
| Psychology | 0 | 0.0% |
| Social Sciences | 8 | 2.8% |
| Engineering | 0 | 0.0% |
| Multidisciplinary Studies | 0 | 0.0% |
| Science & Technology | 97 | 33.6% |
| Business | 0 | 0.0% |
| Education | 91 | 31.5% |
| Literature & Languages | 6 | 2.1% |
| Liberal Arts & History | 0 | 0.0% |
| Visual & Performing Arts | 14 | 4.8% |
| Communications | 0 | 0.0% |
| Arts & Humanities | 12 | 4.2% |
| Total | 289 | 100.0% |
Transportation & Commute in Mulberry
Vehicle Availability by Sex in Mulberry
The most prevalent vehicle ownership categories in Mulberry are males with 3 vehicles (179, accounting for 37.2%) and females with 3 vehicles (61, making up 87.3%).
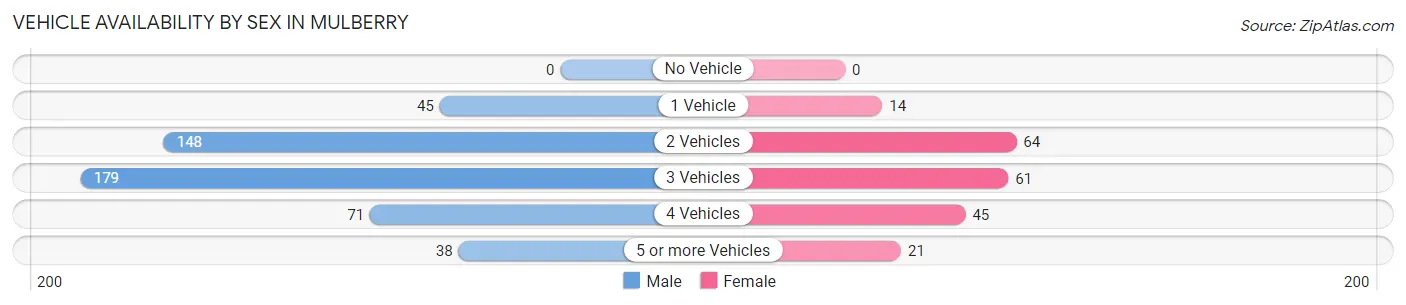
| Vehicles Available | Male | Female |
| No Vehicle | 0 (0.0%) | 0 (0.0%) |
| 1 Vehicle | 45 (9.4%) | 14 (6.8%) |
| 2 Vehicles | 148 (30.8%) | 64 (31.2%) |
| 3 Vehicles | 179 (37.2%) | 61 (29.8%) |
| 4 Vehicles | 71 (14.8%) | 45 (22.0%) |
| 5 or more Vehicles | 38 (7.9%) | 21 (10.2%) |
| Total | 481 (100.0%) | 205 (100.0%) |
Commute Time in Mulberry
The most frequently occuring commute durations in Mulberry are 20 to 24 minutes (178 commuters, 26.9%), 15 to 19 minutes (150 commuters, 22.7%), and 10 to 14 minutes (103 commuters, 15.6%).
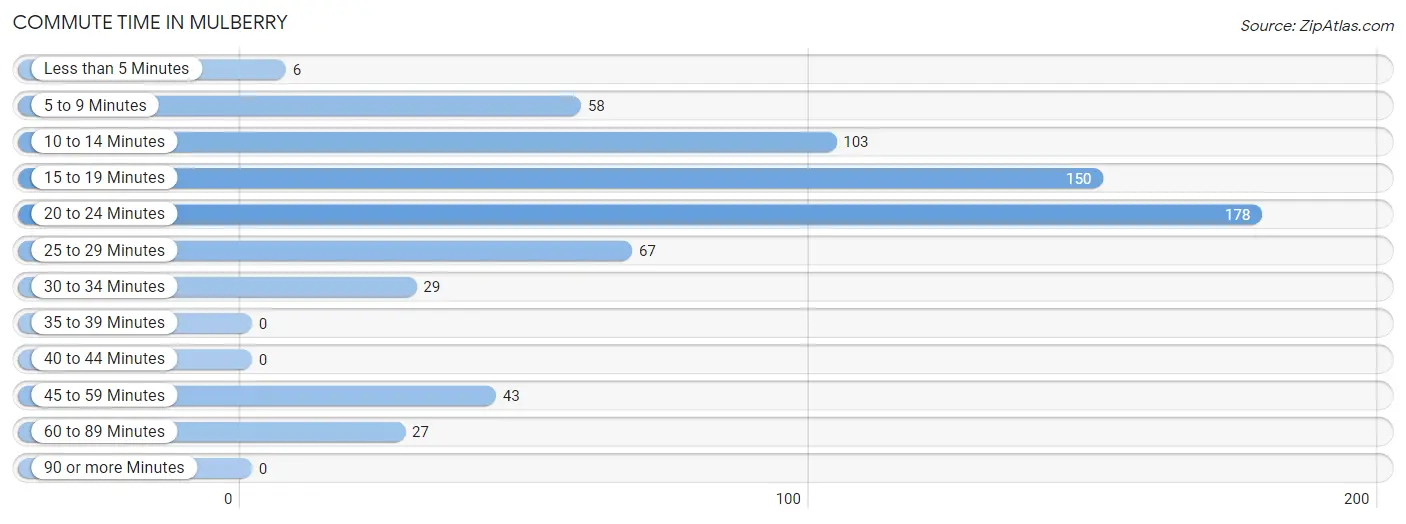
| Commute Time | # Commuters | % Commuters |
| Less than 5 Minutes | 6 | 0.9% |
| 5 to 9 Minutes | 58 | 8.8% |
| 10 to 14 Minutes | 103 | 15.6% |
| 15 to 19 Minutes | 150 | 22.7% |
| 20 to 24 Minutes | 178 | 26.9% |
| 25 to 29 Minutes | 67 | 10.1% |
| 30 to 34 Minutes | 29 | 4.4% |
| 35 to 39 Minutes | 0 | 0.0% |
| 40 to 44 Minutes | 0 | 0.0% |
| 45 to 59 Minutes | 43 | 6.5% |
| 60 to 89 Minutes | 27 | 4.1% |
| 90 or more Minutes | 0 | 0.0% |
Commute Time by Sex in Mulberry
The most common commute times in Mulberry are 20 to 24 minutes (178 commuters, 39.0%) for males and 15 to 19 minutes (80 commuters, 39.0%) for females.
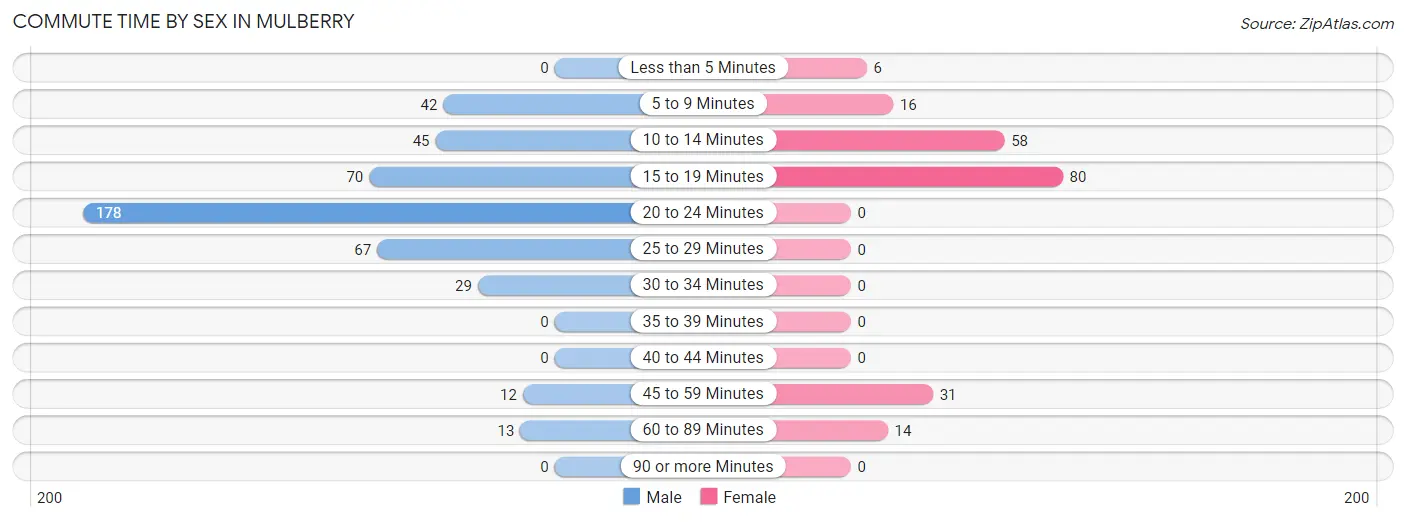
| Commute Time | Male | Female |
| Less than 5 Minutes | 0 (0.0%) | 6 (2.9%) |
| 5 to 9 Minutes | 42 (9.2%) | 16 (7.8%) |
| 10 to 14 Minutes | 45 (9.9%) | 58 (28.3%) |
| 15 to 19 Minutes | 70 (15.3%) | 80 (39.0%) |
| 20 to 24 Minutes | 178 (39.0%) | 0 (0.0%) |
| 25 to 29 Minutes | 67 (14.7%) | 0 (0.0%) |
| 30 to 34 Minutes | 29 (6.4%) | 0 (0.0%) |
| 35 to 39 Minutes | 0 (0.0%) | 0 (0.0%) |
| 40 to 44 Minutes | 0 (0.0%) | 0 (0.0%) |
| 45 to 59 Minutes | 12 (2.6%) | 31 (15.1%) |
| 60 to 89 Minutes | 13 (2.9%) | 14 (6.8%) |
| 90 or more Minutes | 0 (0.0%) | 0 (0.0%) |
Time of Departure to Work by Sex in Mulberry
The most frequent times of departure to work in Mulberry are 7:00 AM to 7:29 AM (122, 26.8%) for males and 7:30 AM to 7:59 AM (51, 24.9%) for females.
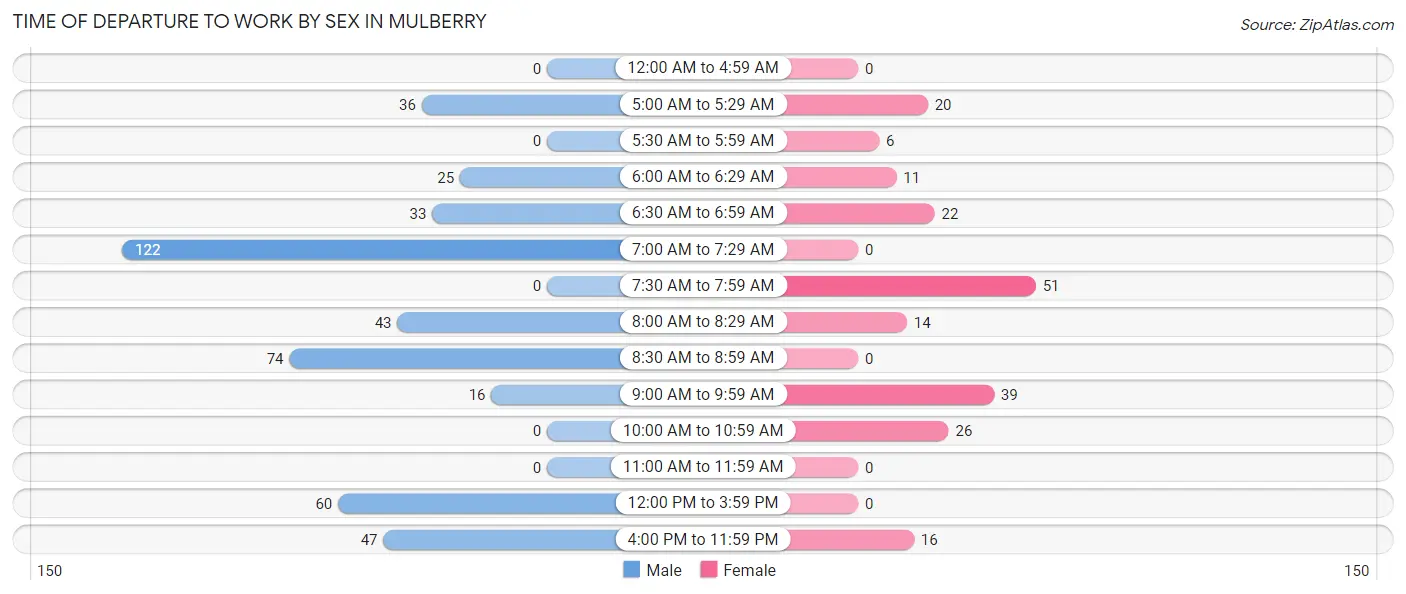
| Time of Departure | Male | Female |
| 12:00 AM to 4:59 AM | 0 (0.0%) | 0 (0.0%) |
| 5:00 AM to 5:29 AM | 36 (7.9%) | 20 (9.8%) |
| 5:30 AM to 5:59 AM | 0 (0.0%) | 6 (2.9%) |
| 6:00 AM to 6:29 AM | 25 (5.5%) | 11 (5.4%) |
| 6:30 AM to 6:59 AM | 33 (7.2%) | 22 (10.7%) |
| 7:00 AM to 7:29 AM | 122 (26.8%) | 0 (0.0%) |
| 7:30 AM to 7:59 AM | 0 (0.0%) | 51 (24.9%) |
| 8:00 AM to 8:29 AM | 43 (9.4%) | 14 (6.8%) |
| 8:30 AM to 8:59 AM | 74 (16.2%) | 0 (0.0%) |
| 9:00 AM to 9:59 AM | 16 (3.5%) | 39 (19.0%) |
| 10:00 AM to 10:59 AM | 0 (0.0%) | 26 (12.7%) |
| 11:00 AM to 11:59 AM | 0 (0.0%) | 0 (0.0%) |
| 12:00 PM to 3:59 PM | 60 (13.2%) | 0 (0.0%) |
| 4:00 PM to 11:59 PM | 47 (10.3%) | 16 (7.8%) |
| Total | 456 (100.0%) | 205 (100.0%) |
Housing Occupancy in Mulberry
Occupancy by Ownership in Mulberry
Of the total 900 dwellings in Mulberry, owner-occupied units account for 708 (78.7%), while renter-occupied units make up 192 (21.3%).
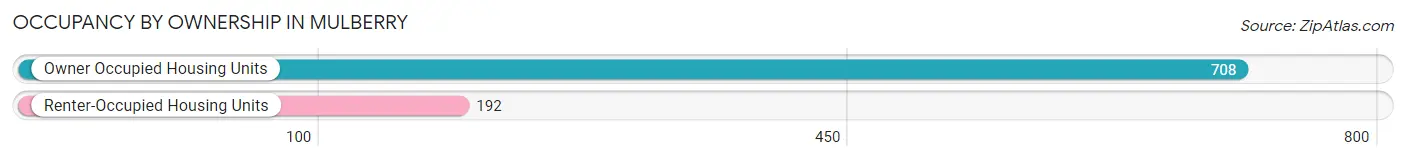
| Occupancy | # Housing Units | % Housing Units |
| Owner Occupied Housing Units | 708 | 78.7% |
| Renter-Occupied Housing Units | 192 | 21.3% |
| Total Occupied Housing Units | 900 | 100.0% |
Occupancy by Household Size in Mulberry
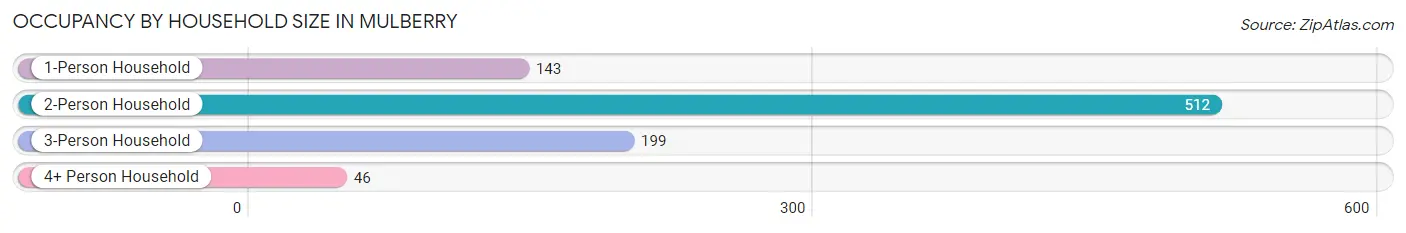
| Household Size | # Housing Units | % Housing Units |
| 1-Person Household | 143 | 15.9% |
| 2-Person Household | 512 | 56.9% |
| 3-Person Household | 199 | 22.1% |
| 4+ Person Household | 46 | 5.1% |
| Total Housing Units | 900 | 100.0% |
Occupancy by Ownership by Household Size in Mulberry
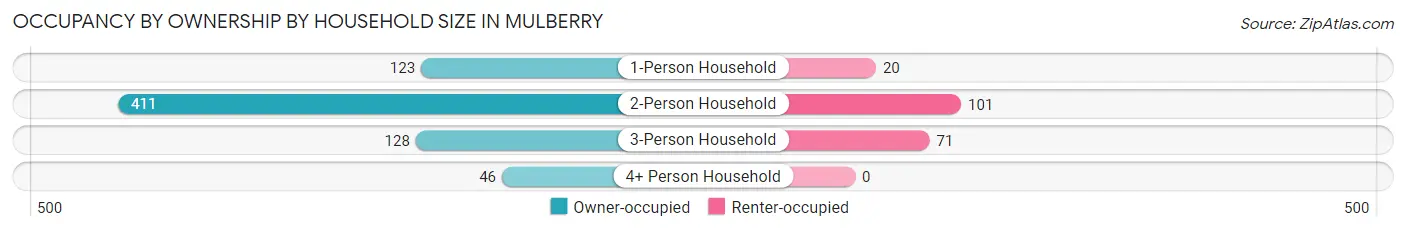
| Household Size | Owner-occupied | Renter-occupied |
| 1-Person Household | 123 (86.0%) | 20 (14.0%) |
| 2-Person Household | 411 (80.3%) | 101 (19.7%) |
| 3-Person Household | 128 (64.3%) | 71 (35.7%) |
| 4+ Person Household | 46 (100.0%) | 0 (0.0%) |
| Total Housing Units | 708 (78.7%) | 192 (21.3%) |
Occupancy by Educational Attainment in Mulberry
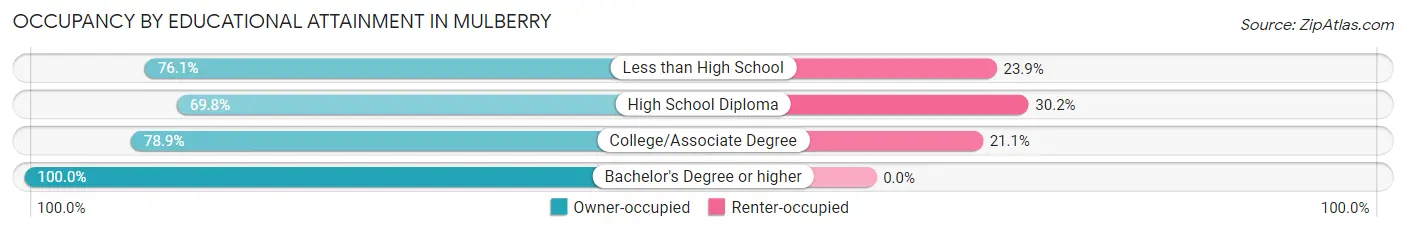
| Household Size | Owner-occupied | Renter-occupied |
| Less than High School | 118 (76.1%) | 37 (23.9%) |
| High School Diploma | 236 (69.8%) | 102 (30.2%) |
| College/Associate Degree | 198 (78.9%) | 53 (21.1%) |
| Bachelor's Degree or higher | 156 (100.0%) | 0 (0.0%) |
Occupancy by Age of Householder in Mulberry
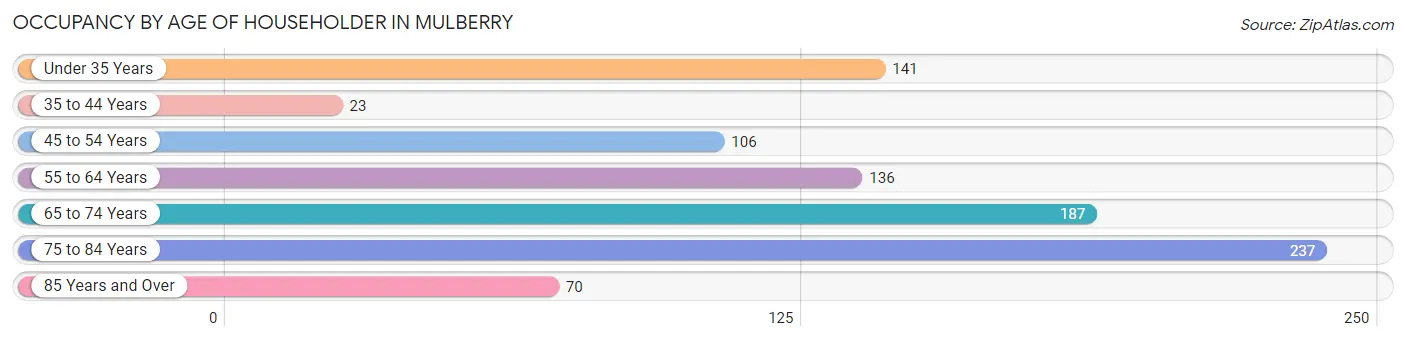
| Age Bracket | # Households | % Households |
| Under 35 Years | 141 | 15.7% |
| 35 to 44 Years | 23 | 2.6% |
| 45 to 54 Years | 106 | 11.8% |
| 55 to 64 Years | 136 | 15.1% |
| 65 to 74 Years | 187 | 20.8% |
| 75 to 84 Years | 237 | 26.3% |
| 85 Years and Over | 70 | 7.8% |
| Total | 900 | 100.0% |
Housing Finances in Mulberry
Median Income by Occupancy in Mulberry
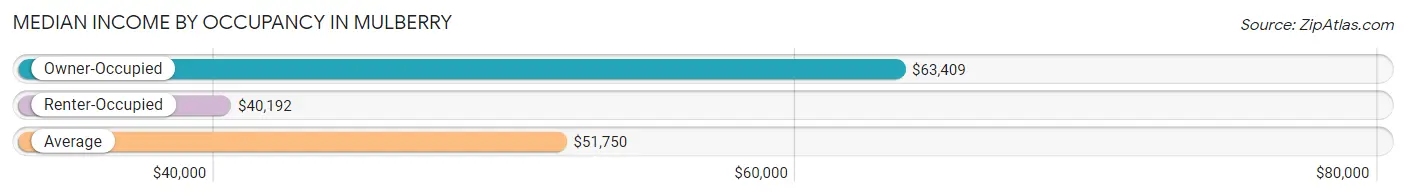
| Occupancy Type | # Households | Median Income |
| Owner-Occupied | 708 (78.7%) | $63,409 |
| Renter-Occupied | 192 (21.3%) | $40,192 |
| Average | 900 (100.0%) | $51,750 |
Occupancy by Householder Income Bracket in Mulberry
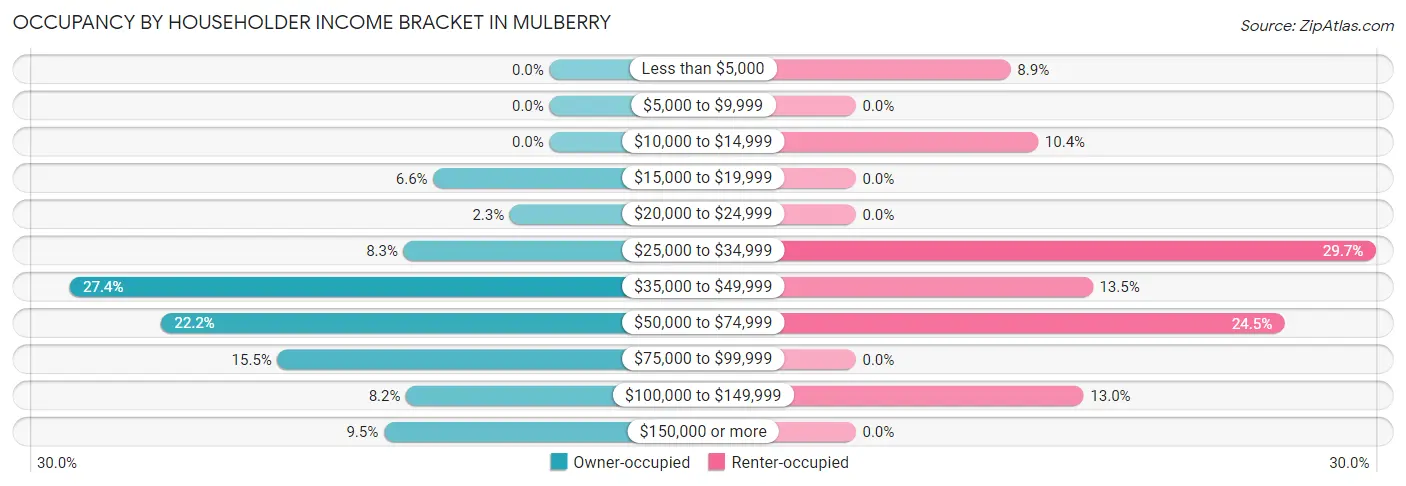
| Income Bracket | Owner-occupied | Renter-occupied |
| Less than $5,000 | 0 (0.0%) | 17 (8.8%) |
| $5,000 to $9,999 | 0 (0.0%) | 0 (0.0%) |
| $10,000 to $14,999 | 0 (0.0%) | 20 (10.4%) |
| $15,000 to $19,999 | 47 (6.6%) | 0 (0.0%) |
| $20,000 to $24,999 | 16 (2.3%) | 0 (0.0%) |
| $25,000 to $34,999 | 59 (8.3%) | 57 (29.7%) |
| $35,000 to $49,999 | 194 (27.4%) | 26 (13.5%) |
| $50,000 to $74,999 | 157 (22.2%) | 47 (24.5%) |
| $75,000 to $99,999 | 110 (15.5%) | 0 (0.0%) |
| $100,000 to $149,999 | 58 (8.2%) | 25 (13.0%) |
| $150,000 or more | 67 (9.5%) | 0 (0.0%) |
| Total | 708 (100.0%) | 192 (100.0%) |
Monthly Housing Cost Tiers in Mulberry
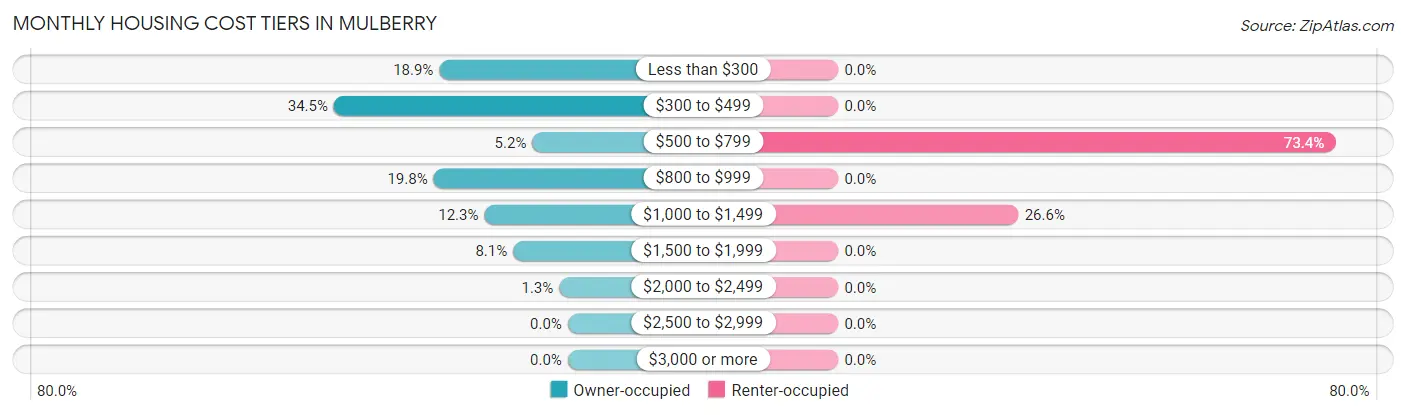
| Monthly Cost | Owner-occupied | Renter-occupied |
| Less than $300 | 134 (18.9%) | 0 (0.0%) |
| $300 to $499 | 244 (34.5%) | 0 (0.0%) |
| $500 to $799 | 37 (5.2%) | 141 (73.4%) |
| $800 to $999 | 140 (19.8%) | 0 (0.0%) |
| $1,000 to $1,499 | 87 (12.3%) | 51 (26.6%) |
| $1,500 to $1,999 | 57 (8.1%) | 0 (0.0%) |
| $2,000 to $2,499 | 9 (1.3%) | 0 (0.0%) |
| $2,500 to $2,999 | 0 (0.0%) | 0 (0.0%) |
| $3,000 or more | 0 (0.0%) | 0 (0.0%) |
| Total | 708 (100.0%) | 192 (100.0%) |
Physical Housing Characteristics in Mulberry
Housing Structures in Mulberry
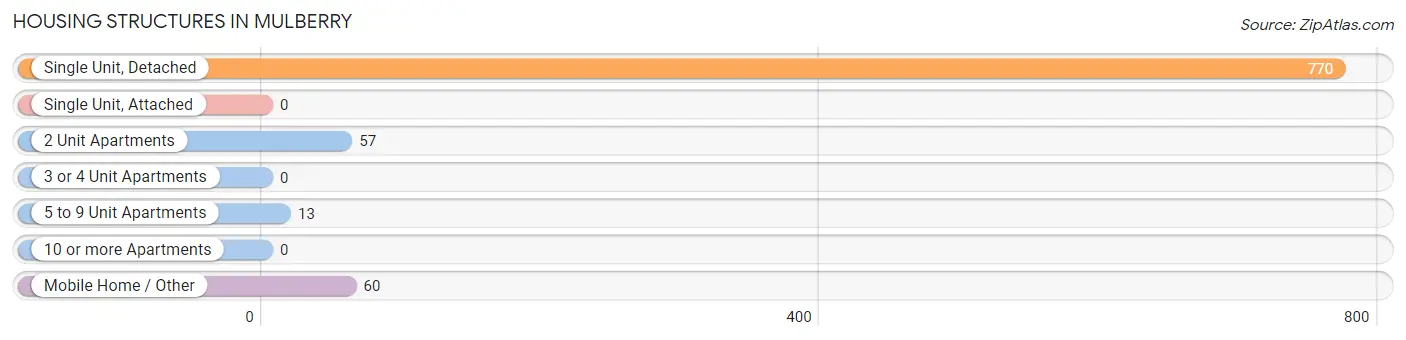
| Structure Type | # Housing Units | % Housing Units |
| Single Unit, Detached | 770 | 85.6% |
| Single Unit, Attached | 0 | 0.0% |
| 2 Unit Apartments | 57 | 6.3% |
| 3 or 4 Unit Apartments | 0 | 0.0% |
| 5 to 9 Unit Apartments | 13 | 1.4% |
| 10 or more Apartments | 0 | 0.0% |
| Mobile Home / Other | 60 | 6.7% |
| Total | 900 | 100.0% |
Housing Structures by Occupancy in Mulberry
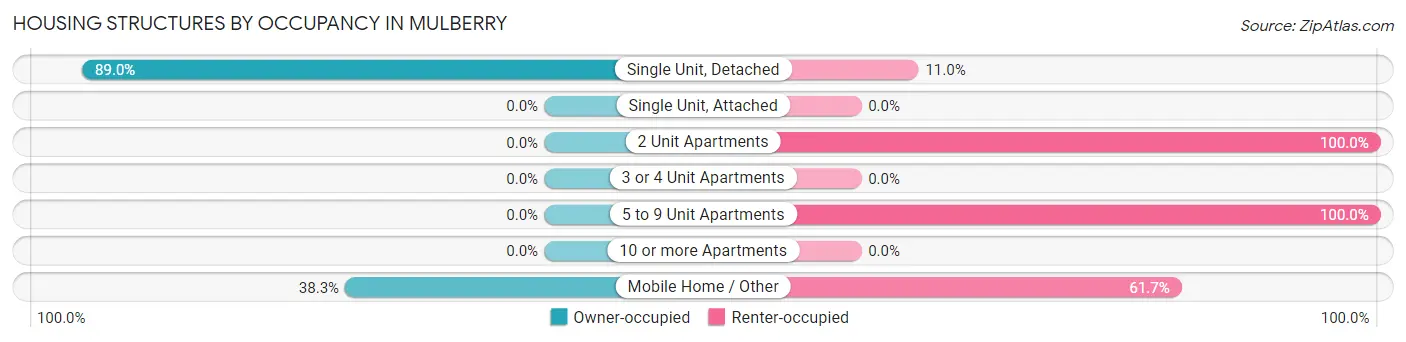
| Structure Type | Owner-occupied | Renter-occupied |
| Single Unit, Detached | 685 (89.0%) | 85 (11.0%) |
| Single Unit, Attached | 0 (0.0%) | 0 (0.0%) |
| 2 Unit Apartments | 0 (0.0%) | 57 (100.0%) |
| 3 or 4 Unit Apartments | 0 (0.0%) | 0 (0.0%) |
| 5 to 9 Unit Apartments | 0 (0.0%) | 13 (100.0%) |
| 10 or more Apartments | 0 (0.0%) | 0 (0.0%) |
| Mobile Home / Other | 23 (38.3%) | 37 (61.7%) |
| Total | 708 (78.7%) | 192 (21.3%) |
Housing Structures by Number of Rooms in Mulberry
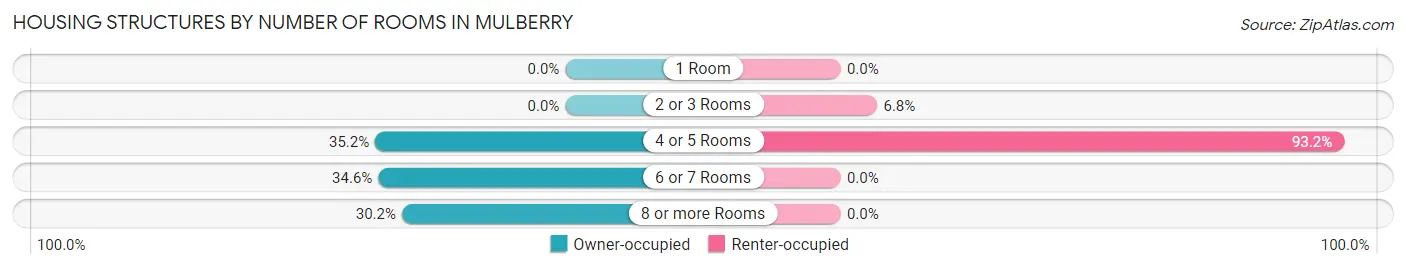
| Number of Rooms | Owner-occupied | Renter-occupied |
| 1 Room | 0 (0.0%) | 0 (0.0%) |
| 2 or 3 Rooms | 0 (0.0%) | 13 (6.8%) |
| 4 or 5 Rooms | 249 (35.2%) | 179 (93.2%) |
| 6 or 7 Rooms | 245 (34.6%) | 0 (0.0%) |
| 8 or more Rooms | 214 (30.2%) | 0 (0.0%) |
| Total | 708 (100.0%) | 192 (100.0%) |
Housing Structure by Heating Type in Mulberry
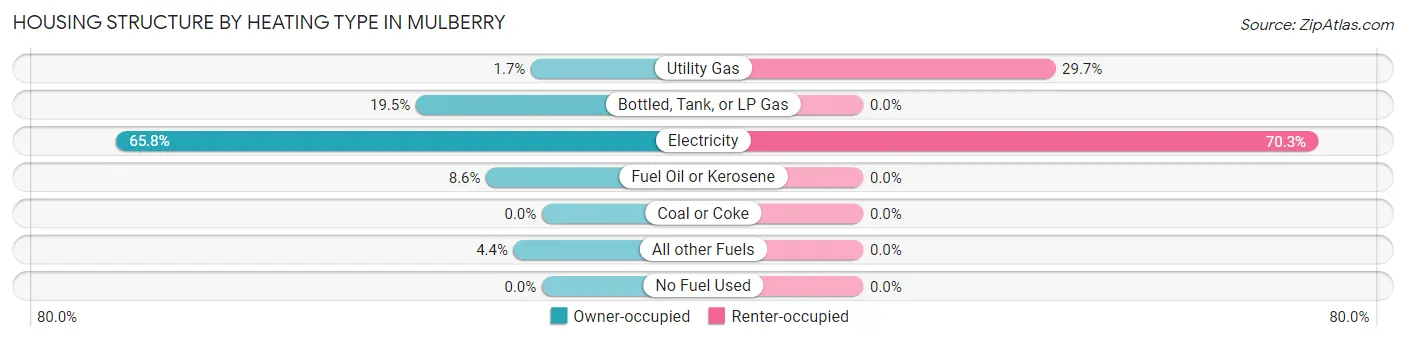
| Heating Type | Owner-occupied | Renter-occupied |
| Utility Gas | 12 (1.7%) | 57 (29.7%) |
| Bottled, Tank, or LP Gas | 138 (19.5%) | 0 (0.0%) |
| Electricity | 466 (65.8%) | 135 (70.3%) |
| Fuel Oil or Kerosene | 61 (8.6%) | 0 (0.0%) |
| Coal or Coke | 0 (0.0%) | 0 (0.0%) |
| All other Fuels | 31 (4.4%) | 0 (0.0%) |
| No Fuel Used | 0 (0.0%) | 0 (0.0%) |
| Total | 708 (100.0%) | 192 (100.0%) |
Household Vehicle Usage in Mulberry
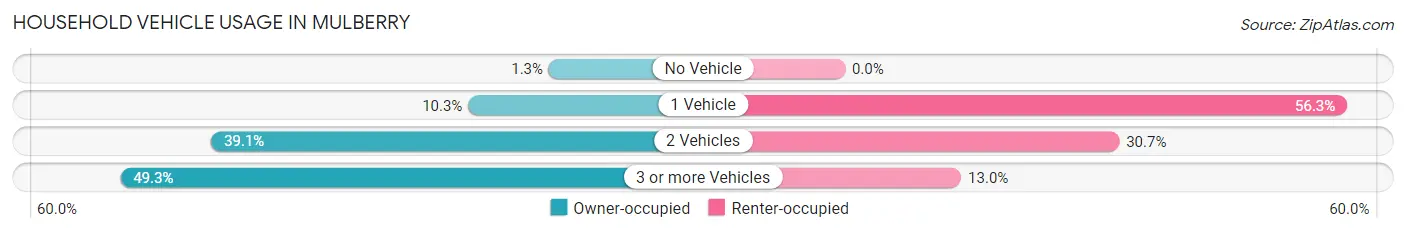
| Vehicles per Household | Owner-occupied | Renter-occupied |
| No Vehicle | 9 (1.3%) | 0 (0.0%) |
| 1 Vehicle | 73 (10.3%) | 108 (56.2%) |
| 2 Vehicles | 277 (39.1%) | 59 (30.7%) |
| 3 or more Vehicles | 349 (49.3%) | 25 (13.0%) |
| Total | 708 (100.0%) | 192 (100.0%) |
Real Estate & Mortgages in Mulberry
Real Estate and Mortgage Overview in Mulberry
| Characteristic | Without Mortgage | With Mortgage |
| Housing Units | 396 | 312 |
| Median Property Value | $146,100 | $150,700 |
| Median Household Income | $57,279 | $0 |
| Monthly Housing Costs | $369 | $0 |
| Real Estate Taxes | $870 | $24 |
Property Value by Mortgage Status in Mulberry

| Property Value | Without Mortgage | With Mortgage |
| Less than $50,000 | 26 (6.6%) | 9 (2.9%) |
| $50,000 to $99,999 | 41 (10.3%) | 49 (15.7%) |
| $100,000 to $299,999 | 265 (66.9%) | 237 (76.0%) |
| $300,000 to $499,999 | 19 (4.8%) | 9 (2.9%) |
| $500,000 to $749,999 | 45 (11.4%) | 0 (0.0%) |
| $750,000 to $999,999 | 0 (0.0%) | 8 (2.6%) |
| $1,000,000 or more | 0 (0.0%) | 0 (0.0%) |
| Total | 396 (100.0%) | 312 (100.0%) |
Household Income by Mortgage Status in Mulberry
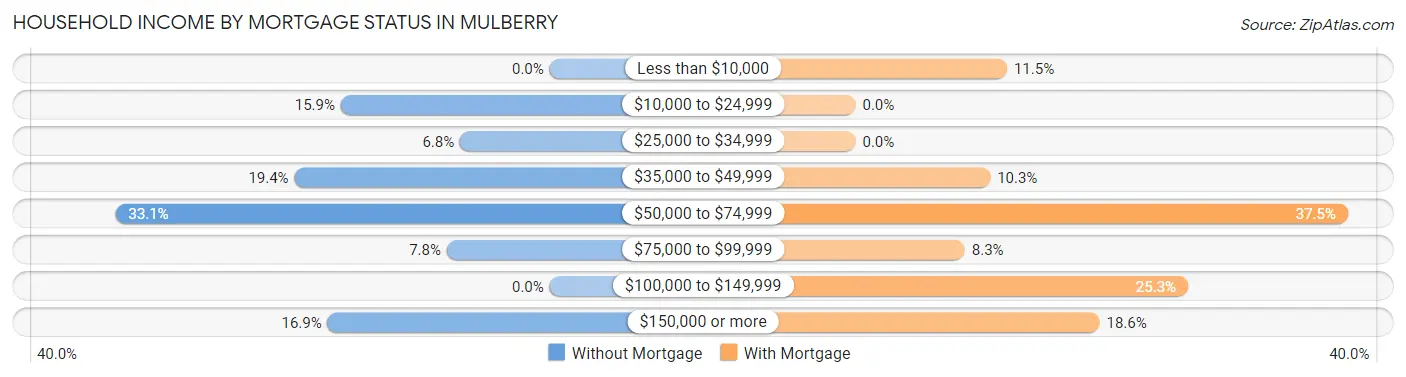
| Household Income | Without Mortgage | With Mortgage |
| Less than $10,000 | 0 (0.0%) | 36 (11.5%) |
| $10,000 to $24,999 | 63 (15.9%) | 0 (0.0%) |
| $25,000 to $34,999 | 27 (6.8%) | 0 (0.0%) |
| $35,000 to $49,999 | 77 (19.4%) | 32 (10.3%) |
| $50,000 to $74,999 | 131 (33.1%) | 117 (37.5%) |
| $75,000 to $99,999 | 31 (7.8%) | 26 (8.3%) |
| $100,000 to $149,999 | 0 (0.0%) | 79 (25.3%) |
| $150,000 or more | 67 (16.9%) | 58 (18.6%) |
| Total | 396 (100.0%) | 312 (100.0%) |
Property Value to Household Income Ratio in Mulberry
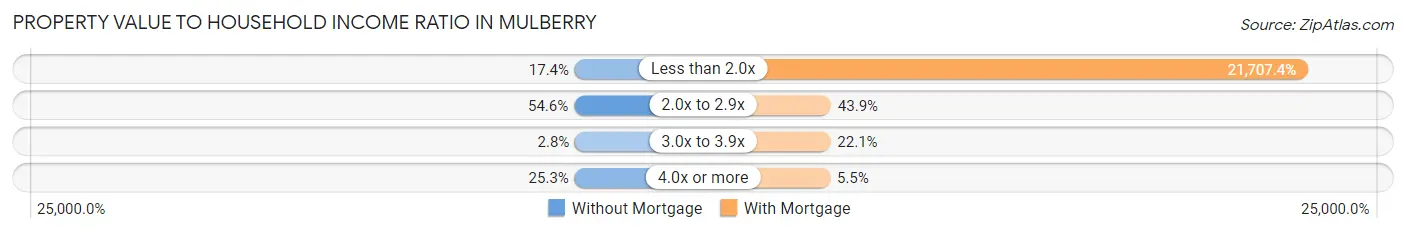
| Value-to-Income Ratio | Without Mortgage | With Mortgage |
| Less than 2.0x | 69 (17.4%) | 67,727 (21,707.4%) |
| 2.0x to 2.9x | 216 (54.5%) | 137 (43.9%) |
| 3.0x to 3.9x | 11 (2.8%) | 69 (22.1%) |
| 4.0x or more | 100 (25.3%) | 17 (5.4%) |
| Total | 396 (100.0%) | 312 (100.0%) |
Real Estate Taxes by Mortgage Status in Mulberry
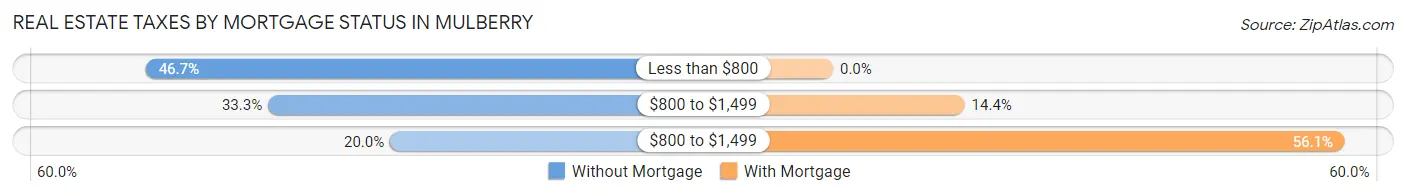
| Property Taxes | Without Mortgage | With Mortgage |
| Less than $800 | 185 (46.7%) | 0 (0.0%) |
| $800 to $1,499 | 132 (33.3%) | 45 (14.4%) |
| $800 to $1,499 | 79 (20.0%) | 175 (56.1%) |
| Total | 396 (100.0%) | 312 (100.0%) |
Health & Disability in Mulberry
Health Insurance Coverage by Age in Mulberry
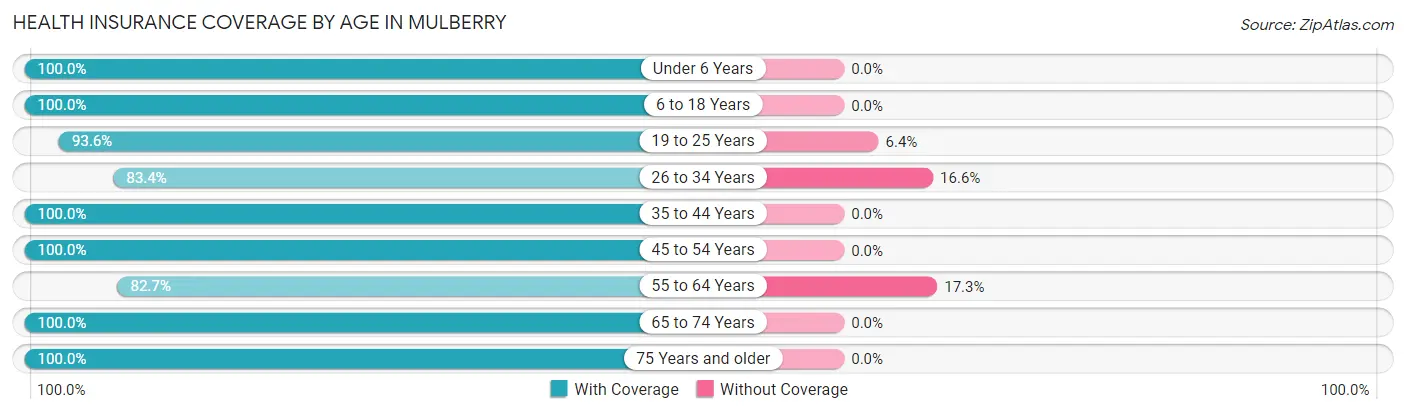
| Age Bracket | With Coverage | Without Coverage |
| Under 6 Years | 99 (100.0%) | 0 (0.0%) |
| 6 to 18 Years | 91 (100.0%) | 0 (0.0%) |
| 19 to 25 Years | 190 (93.6%) | 13 (6.4%) |
| 26 to 34 Years | 151 (83.4%) | 30 (16.6%) |
| 35 to 44 Years | 38 (100.0%) | 0 (0.0%) |
| 45 to 54 Years | 334 (100.0%) | 0 (0.0%) |
| 55 to 64 Years | 205 (82.7%) | 43 (17.3%) |
| 65 to 74 Years | 303 (100.0%) | 0 (0.0%) |
| 75 Years and older | 436 (100.0%) | 0 (0.0%) |
| Total | 1,847 (95.6%) | 86 (4.4%) |
Health Insurance Coverage by Citizenship Status in Mulberry

| Citizenship Status | With Coverage | Without Coverage |
| Native Born | 99 (100.0%) | 0 (0.0%) |
| Foreign Born, Citizen | 91 (100.0%) | 0 (0.0%) |
| Foreign Born, not a Citizen | 190 (93.6%) | 13 (6.4%) |
Health Insurance Coverage by Household Income in Mulberry
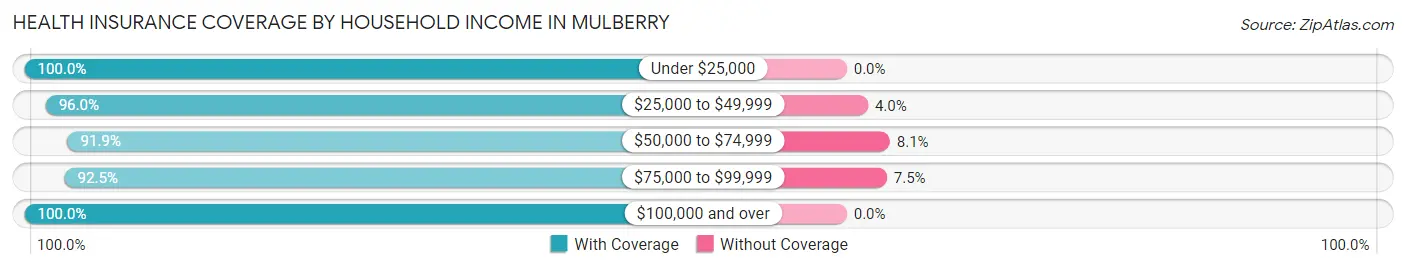
| Household Income | With Coverage | Without Coverage |
| Under $25,000 | 134 (100.0%) | 0 (0.0%) |
| $25,000 to $49,999 | 581 (96.0%) | 24 (4.0%) |
| $50,000 to $74,999 | 422 (91.9%) | 37 (8.1%) |
| $75,000 to $99,999 | 308 (92.5%) | 25 (7.5%) |
| $100,000 and over | 402 (100.0%) | 0 (0.0%) |
Public vs Private Health Insurance Coverage by Age in Mulberry
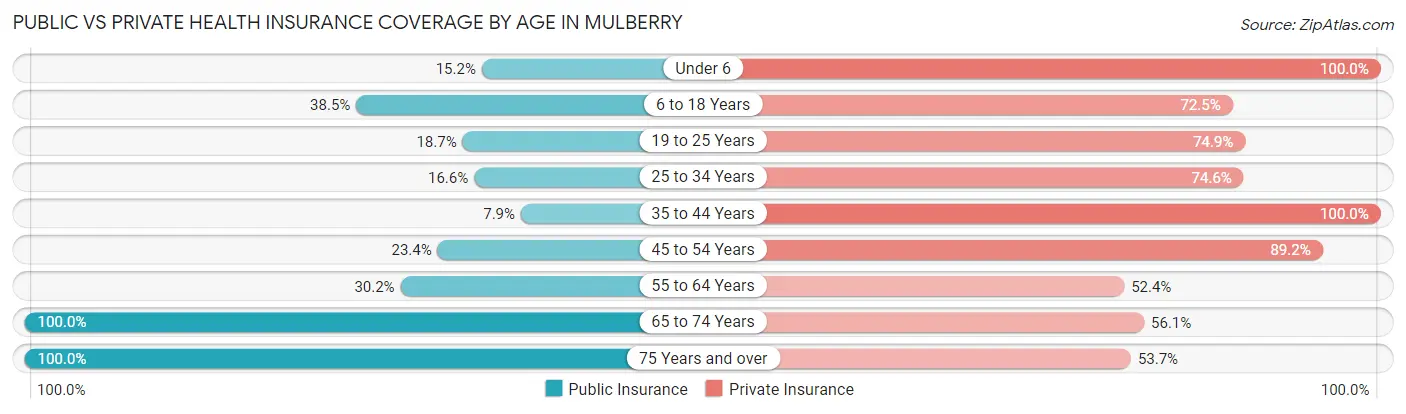
| Age Bracket | Public Insurance | Private Insurance |
| Under 6 | 15 (15.1%) | 99 (100.0%) |
| 6 to 18 Years | 35 (38.5%) | 66 (72.5%) |
| 19 to 25 Years | 38 (18.7%) | 152 (74.9%) |
| 25 to 34 Years | 30 (16.6%) | 135 (74.6%) |
| 35 to 44 Years | 3 (7.9%) | 38 (100.0%) |
| 45 to 54 Years | 78 (23.4%) | 298 (89.2%) |
| 55 to 64 Years | 75 (30.2%) | 130 (52.4%) |
| 65 to 74 Years | 303 (100.0%) | 170 (56.1%) |
| 75 Years and over | 436 (100.0%) | 234 (53.7%) |
| Total | 1,013 (52.4%) | 1,322 (68.4%) |
Disability Status by Sex by Age in Mulberry
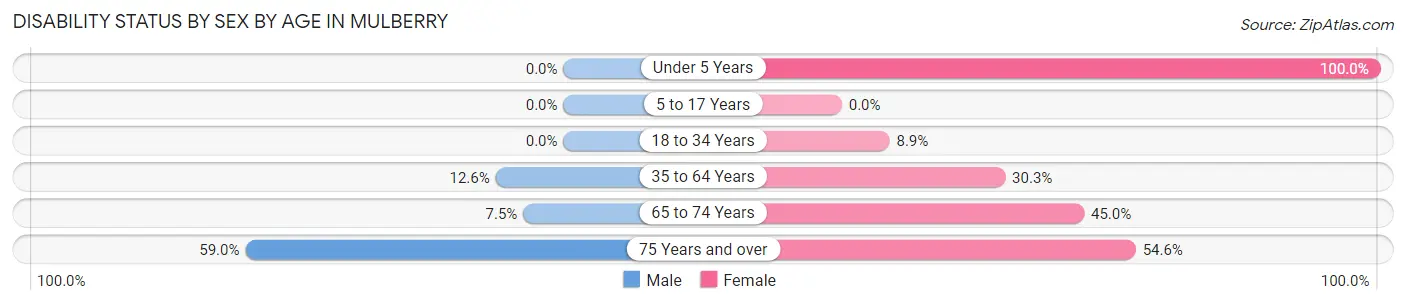
| Age Bracket | Male | Female |
| Under 5 Years | 0 (0.0%) | 15 (100.0%) |
| 5 to 17 Years | 0 (0.0%) | 0 (0.0%) |
| 18 to 34 Years | 0 (0.0%) | 14 (8.9%) |
| 35 to 64 Years | 39 (12.6%) | 94 (30.3%) |
| 65 to 74 Years | 10 (7.5%) | 76 (45.0%) |
| 75 Years and over | 147 (59.0%) | 102 (54.5%) |
Disability Class by Sex by Age in Mulberry
Disability Class: Hearing Difficulty
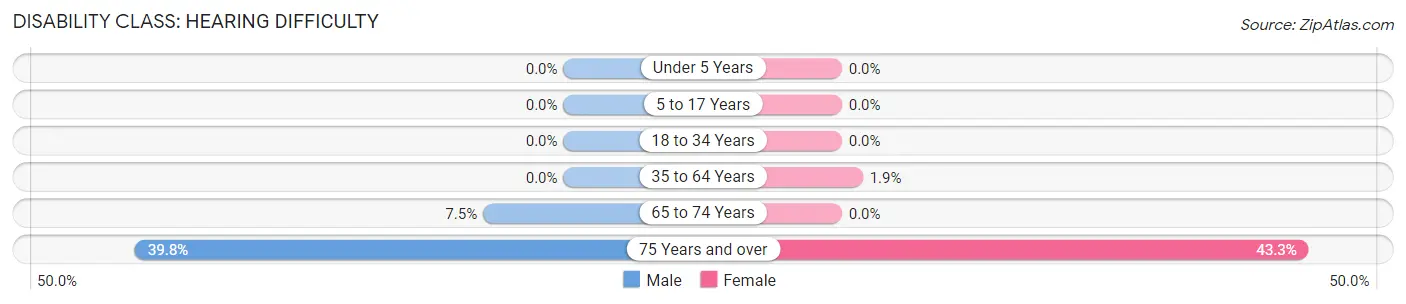
| Age Bracket | Male | Female |
| Under 5 Years | 0 (0.0%) | 0 (0.0%) |
| 5 to 17 Years | 0 (0.0%) | 0 (0.0%) |
| 18 to 34 Years | 0 (0.0%) | 0 (0.0%) |
| 35 to 64 Years | 0 (0.0%) | 6 (1.9%) |
| 65 to 74 Years | 10 (7.5%) | 0 (0.0%) |
| 75 Years and over | 99 (39.8%) | 81 (43.3%) |
Disability Class: Vision Difficulty
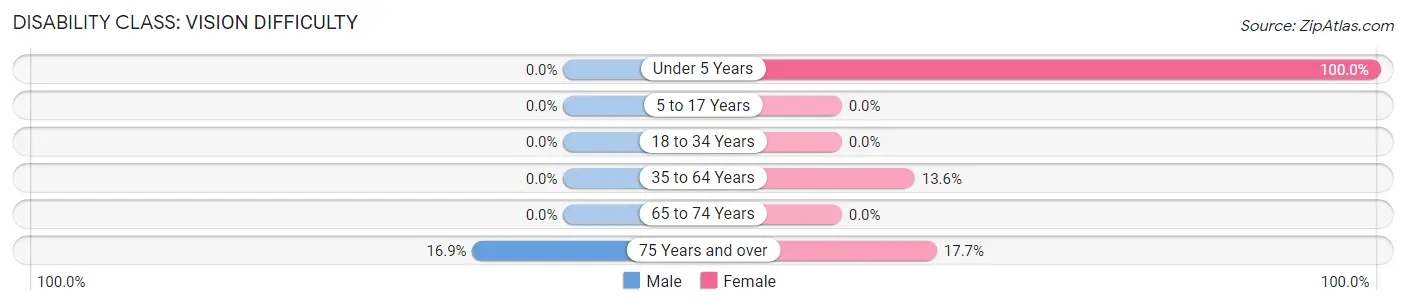
| Age Bracket | Male | Female |
| Under 5 Years | 0 (0.0%) | 15 (100.0%) |
| 5 to 17 Years | 0 (0.0%) | 0 (0.0%) |
| 18 to 34 Years | 0 (0.0%) | 0 (0.0%) |
| 35 to 64 Years | 0 (0.0%) | 42 (13.6%) |
| 65 to 74 Years | 0 (0.0%) | 0 (0.0%) |
| 75 Years and over | 42 (16.9%) | 33 (17.6%) |
Disability Class: Cognitive Difficulty
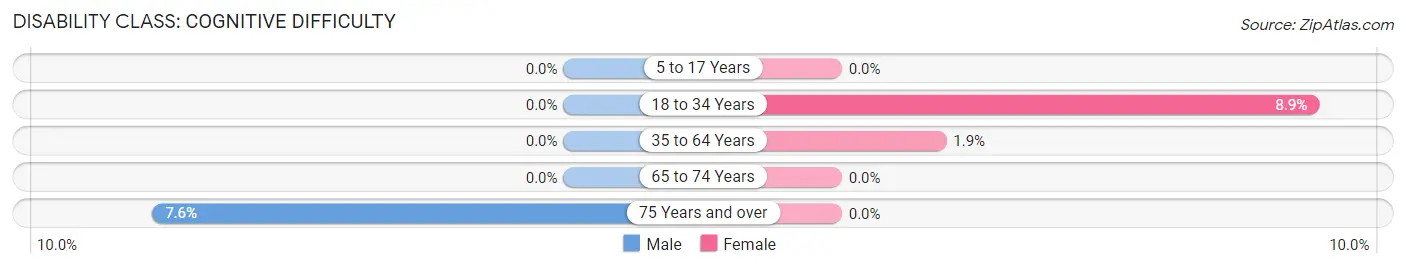
| Age Bracket | Male | Female |
| 5 to 17 Years | 0 (0.0%) | 0 (0.0%) |
| 18 to 34 Years | 0 (0.0%) | 14 (8.9%) |
| 35 to 64 Years | 0 (0.0%) | 6 (1.9%) |
| 65 to 74 Years | 0 (0.0%) | 0 (0.0%) |
| 75 Years and over | 19 (7.6%) | 0 (0.0%) |
Disability Class: Ambulatory Difficulty
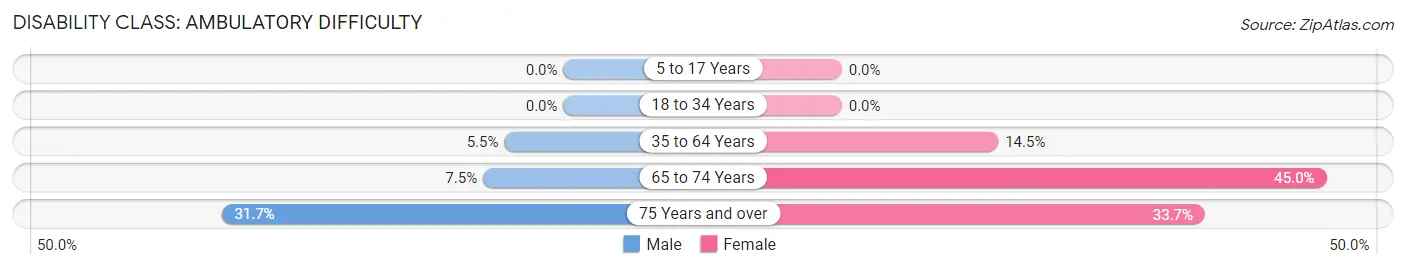
| Age Bracket | Male | Female |
| 5 to 17 Years | 0 (0.0%) | 0 (0.0%) |
| 18 to 34 Years | 0 (0.0%) | 0 (0.0%) |
| 35 to 64 Years | 17 (5.5%) | 45 (14.5%) |
| 65 to 74 Years | 10 (7.5%) | 76 (45.0%) |
| 75 Years and over | 79 (31.7%) | 63 (33.7%) |
Disability Class: Self-Care Difficulty
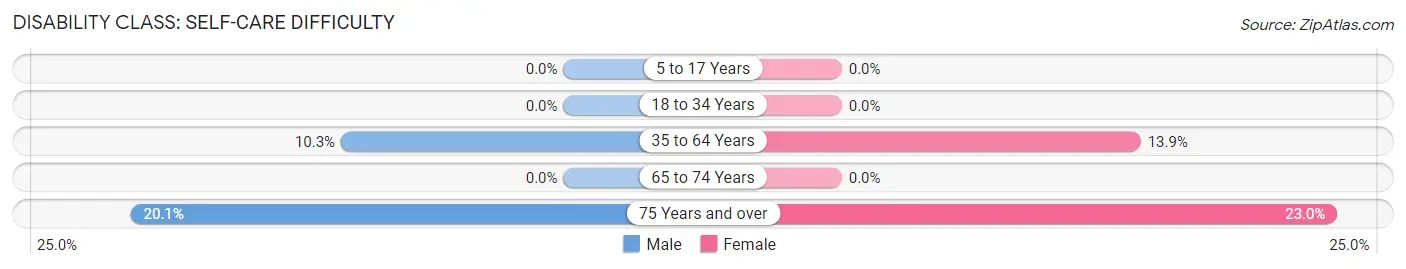
| Age Bracket | Male | Female |
| 5 to 17 Years | 0 (0.0%) | 0 (0.0%) |
| 18 to 34 Years | 0 (0.0%) | 0 (0.0%) |
| 35 to 64 Years | 32 (10.3%) | 43 (13.9%) |
| 65 to 74 Years | 0 (0.0%) | 0 (0.0%) |
| 75 Years and over | 50 (20.1%) | 43 (23.0%) |
Technology Access in Mulberry
Computing Device Access in Mulberry
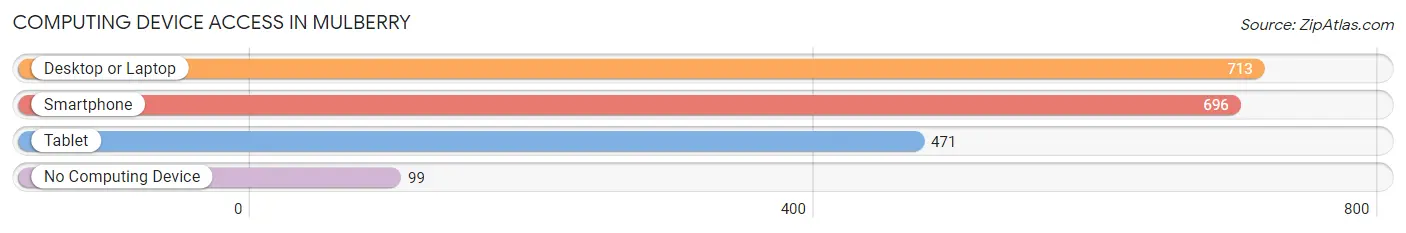
| Device Type | # Households | % Households |
| Desktop or Laptop | 713 | 79.2% |
| Smartphone | 696 | 77.3% |
| Tablet | 471 | 52.3% |
| No Computing Device | 99 | 11.0% |
| Total | 900 | 100.0% |
Internet Access in Mulberry
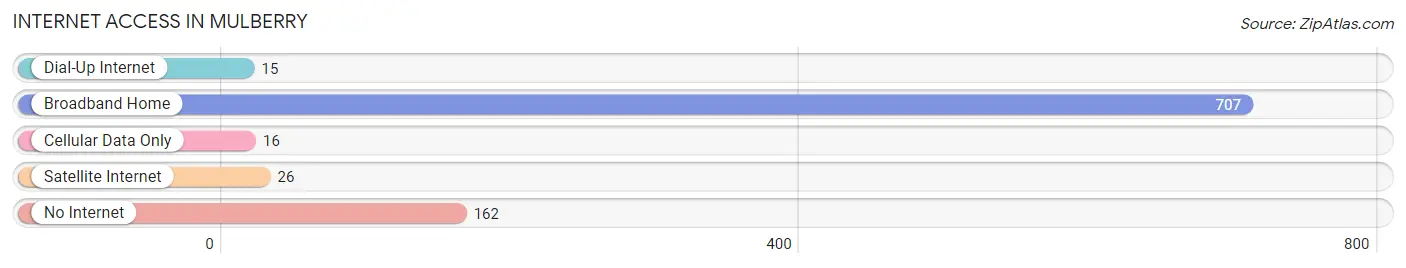
| Internet Type | # Households | % Households |
| Dial-Up Internet | 15 | 1.7% |
| Broadband Home | 707 | 78.6% |
| Cellular Data Only | 16 | 1.8% |
| Satellite Internet | 26 | 2.9% |
| No Internet | 162 | 18.0% |
| Total | 900 | 100.0% |
Mulberry Summary
Mulberry is a small town located in the foothills of the Blue Ridge Mountains in North Carolina. It is situated in the southwestern corner of the state, near the border with Tennessee and Georgia. The town has a population of just over 1,000 people and is part of the larger Rutherford County.
Geography
Mulberry is located in the foothills of the Blue Ridge Mountains, which are part of the Appalachian Mountains. The town is situated in the southwestern corner of North Carolina, near the border with Tennessee and Georgia. The town is located at an elevation of 1,400 feet above sea level. The town is surrounded by rolling hills and forests, and is home to several creeks and streams. The nearest major city is Asheville, which is located about 40 miles to the east.
Climate
Mulberry has a humid subtropical climate, with hot summers and mild winters. The average high temperature in the summer is around 85 degrees Fahrenheit, while the average low temperature in the winter is around 40 degrees Fahrenheit. The town receives an average of 45 inches of precipitation per year, with most of it falling in the form of rain.
Demographics
As of the 2010 census, Mulberry had a population of 1,072 people. The racial makeup of the town was 95.3% White, 1.2% African American, 0.3% Native American, 0.2% Asian, 0.1% Pacific Islander, and 2.9% from other races. The median household income was $30,938, and the median family income was $37,813.
Economy
Mulberry’s economy is largely based on agriculture and tourism. The town is home to several farms, which produce a variety of crops, including corn, soybeans, and tobacco. The town is also home to several small businesses, including restaurants, shops, and a few bed and breakfasts. Tourism is also an important part of the local economy, as the town is located near several popular attractions, including the Great Smoky Mountains National Park and the Blue Ridge Parkway.
History
Mulberry was first settled in the late 1700s by settlers from Virginia and North Carolina. The town was originally known as “Mulberry Gap”, and was named after the mulberry trees that grew in the area. The town was officially incorporated in 1891, and the first post office was established in 1892. The town grew slowly over the years, and by the early 1900s, it had become a popular tourist destination. The town was also home to several mills, which produced lumber and other goods.
In the late 20th century, the town began to decline as the mills closed and the population began to decline. However, in recent years, the town has seen a resurgence in tourism and economic activity. The town is now home to several small businesses, and is a popular destination for outdoor enthusiasts.
Mulberry is a small town with a rich history and a bright future. The town is home to a diverse population, and is surrounded by beautiful scenery. The town is also home to several small businesses, and is a popular destination for outdoor enthusiasts. With its close proximity to major cities and attractions, Mulberry is an ideal place to live, work, and play.
Common Questions
What is Per Capita Income in Mulberry?
Per Capita income in Mulberry is $31,936.
What is the Median Family Income in Mulberry?
Median Family Income in Mulberry is $65,417.
What is the Median Household income in Mulberry?
Median Household Income in Mulberry is $51,750.
What is Income or Wage Gap in Mulberry?
Income or Wage Gap in Mulberry is 14.4%.
Women in Mulberry earn 85.6 cents for every dollar earned by a man.
What is Inequality or Gini Index in Mulberry?
Inequality or Gini Index in Mulberry is 0.39.
What is the Total Population of Mulberry?
Total Population of Mulberry is 1,980.
What is the Total Male Population of Mulberry?
Total Male Population of Mulberry is 1,126.
What is the Total Female Population of Mulberry?
Total Female Population of Mulberry is 854.
What is the Ratio of Males per 100 Females in Mulberry?
There are 131.85 Males per 100 Females in Mulberry.
What is the Ratio of Females per 100 Males in Mulberry?
There are 75.84 Females per 100 Males in Mulberry.
What is the Median Population Age in Mulberry?
Median Population Age in Mulberry is 54.8 Years.
What is the Average Family Size in Mulberry
Average Family Size in Mulberry is 2.4 People.
What is the Average Household Size in Mulberry
Average Household Size in Mulberry is 2.2 People.
How Large is the Labor Force in Mulberry?
There are 796 People in the Labor Forcein in Mulberry.
What is the Percentage of People in the Labor Force in Mulberry?
43.0% of People are in the Labor Force in Mulberry.
What is the Unemployment Rate in Mulberry?
Unemployment Rate in Mulberry is 9.5%.