Mount Vernon, AR Map & Demographics
Mount Vernon Map
Mount Vernon Overview
$15,976
PER CAPITA INCOME
$53,750
AVG FAMILY INCOME
$48,625
AVG HOUSEHOLD INCOME
0.37
INEQUALITY / GINI INDEX
277
TOTAL POPULATION
174
MALE POPULATION
103
FEMALE POPULATION
168.93
MALES / 100 FEMALES
59.20
FEMALES / 100 MALES
30.6
MEDIAN AGE
4.3
AVG FAMILY SIZE
3.8
AVG HOUSEHOLD SIZE
92
LABOR FORCE [ PEOPLE ]
58.2%
PERCENT IN LABOR FORCE
5.4%
UNEMPLOYMENT RATE
Mount Vernon Zip Codes
Mount Vernon Area Codes
Income in Mount Vernon
Income Overview in Mount Vernon
Per Capita Income in Mount Vernon is $15,976, while median incomes of families and households are $53,750 and $48,625 respectively.
| Characteristic | Number | Measure |
| Per Capita Income | 277 | $15,976 |
| Median Family Income | 61 | $53,750 |
| Mean Family Income | 61 | $64,721 |
| Median Household Income | 73 | $48,625 |
| Mean Household Income | 73 | $57,586 |
| Income Deficit | 61 | $0 |
| Wage / Income Gap (%) | 277 | 0.00% |
| Wage / Income Gap ($) | 277 | 100.00¢ per $1 |
| Gini / Inequality Index | 277 | 0.37 |
Earnings by Sex in Mount Vernon
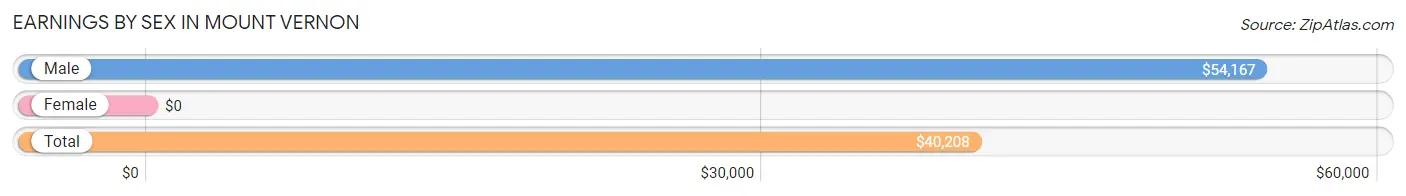
| Sex | Number | Average Earnings |
| Male | 60 (61.2%) | $54,167 |
| Female | 38 (38.8%) | $0 |
| Total | 98 (100.0%) | $40,208 |
Earnings by Sex by Income Bracket in Mount Vernon
The most common earnings brackets in Mount Vernon are $55,000 to $64,999 for men (18 | 30.0%) and $5,000 to $7,499 for women (16 | 42.1%).
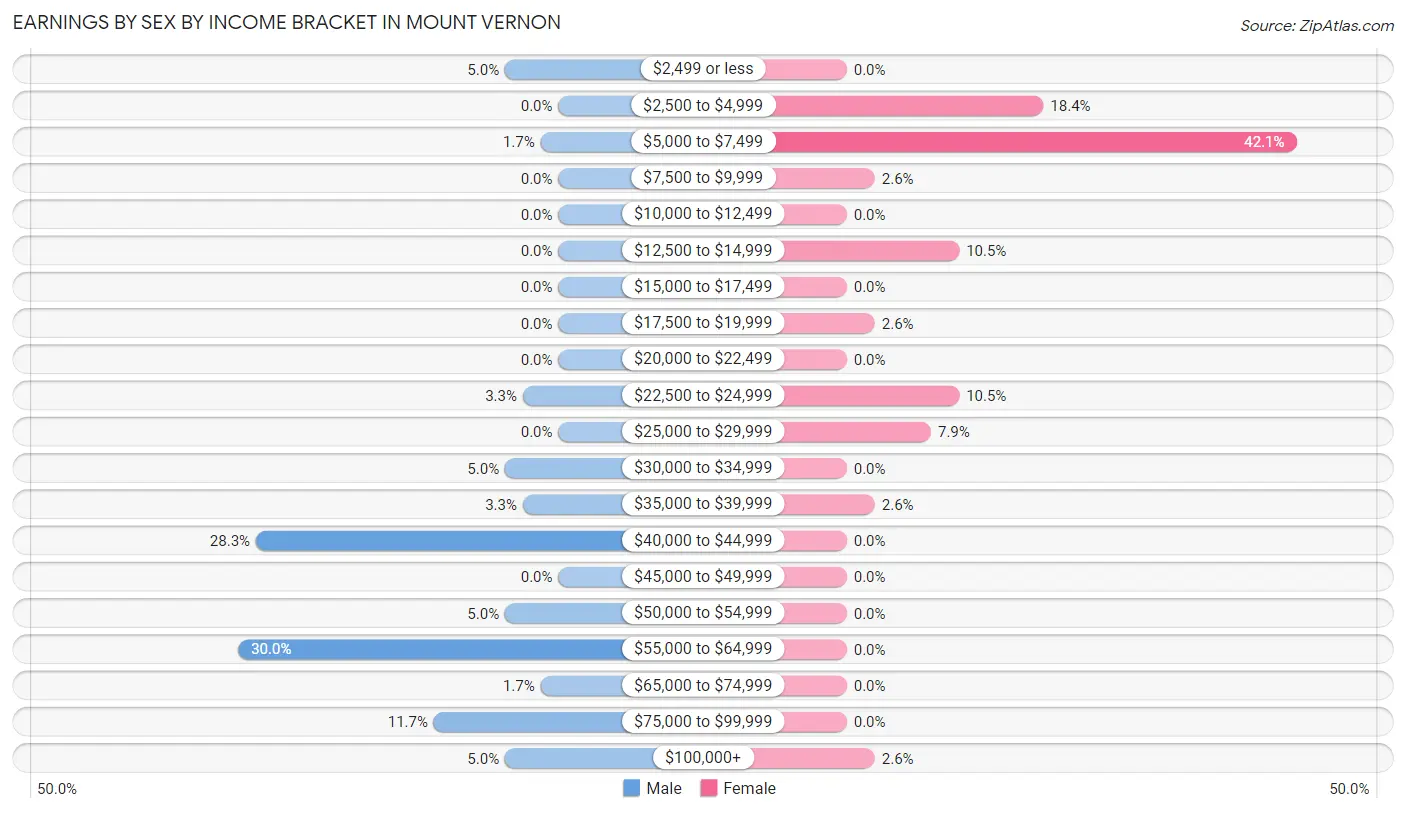
| Income | Male | Female |
| $2,499 or less | 3 (5.0%) | 0 (0.0%) |
| $2,500 to $4,999 | 0 (0.0%) | 7 (18.4%) |
| $5,000 to $7,499 | 1 (1.7%) | 16 (42.1%) |
| $7,500 to $9,999 | 0 (0.0%) | 1 (2.6%) |
| $10,000 to $12,499 | 0 (0.0%) | 0 (0.0%) |
| $12,500 to $14,999 | 0 (0.0%) | 4 (10.5%) |
| $15,000 to $17,499 | 0 (0.0%) | 0 (0.0%) |
| $17,500 to $19,999 | 0 (0.0%) | 1 (2.6%) |
| $20,000 to $22,499 | 0 (0.0%) | 0 (0.0%) |
| $22,500 to $24,999 | 2 (3.3%) | 4 (10.5%) |
| $25,000 to $29,999 | 0 (0.0%) | 3 (7.9%) |
| $30,000 to $34,999 | 3 (5.0%) | 0 (0.0%) |
| $35,000 to $39,999 | 2 (3.3%) | 1 (2.6%) |
| $40,000 to $44,999 | 17 (28.3%) | 0 (0.0%) |
| $45,000 to $49,999 | 0 (0.0%) | 0 (0.0%) |
| $50,000 to $54,999 | 3 (5.0%) | 0 (0.0%) |
| $55,000 to $64,999 | 18 (30.0%) | 0 (0.0%) |
| $65,000 to $74,999 | 1 (1.7%) | 0 (0.0%) |
| $75,000 to $99,999 | 7 (11.7%) | 0 (0.0%) |
| $100,000+ | 3 (5.0%) | 1 (2.6%) |
| Total | 60 (100.0%) | 38 (100.0%) |
Earnings by Sex by Educational Attainment in Mount Vernon
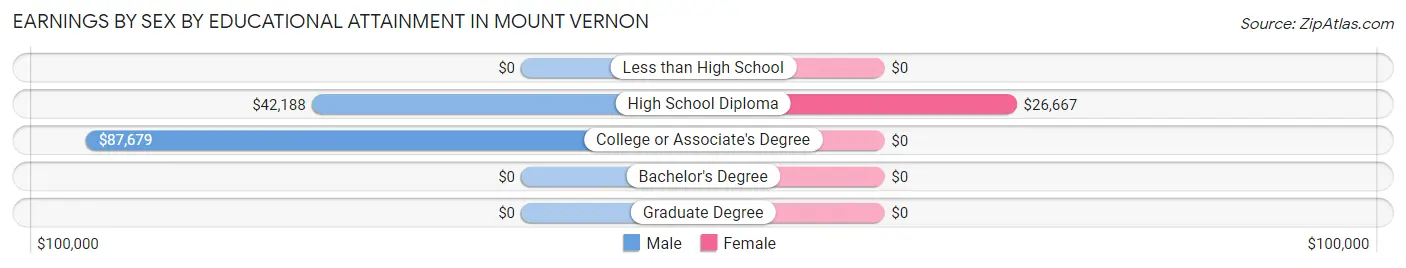
| Educational Attainment | Male Income | Female Income |
| Less than High School | - | - |
| High School Diploma | $42,188 | $26,667 |
| College or Associate's Degree | $87,679 | $0 |
| Bachelor's Degree | - | - |
| Graduate Degree | - | - |
| Total | $54,583 | $0 |
Family Income in Mount Vernon
Family Income Brackets in Mount Vernon
According to the Mount Vernon family income data, there are 19 families falling into the $50,000 to $74,999 income range, which is the most common income bracket and makes up 31.1% of all families.
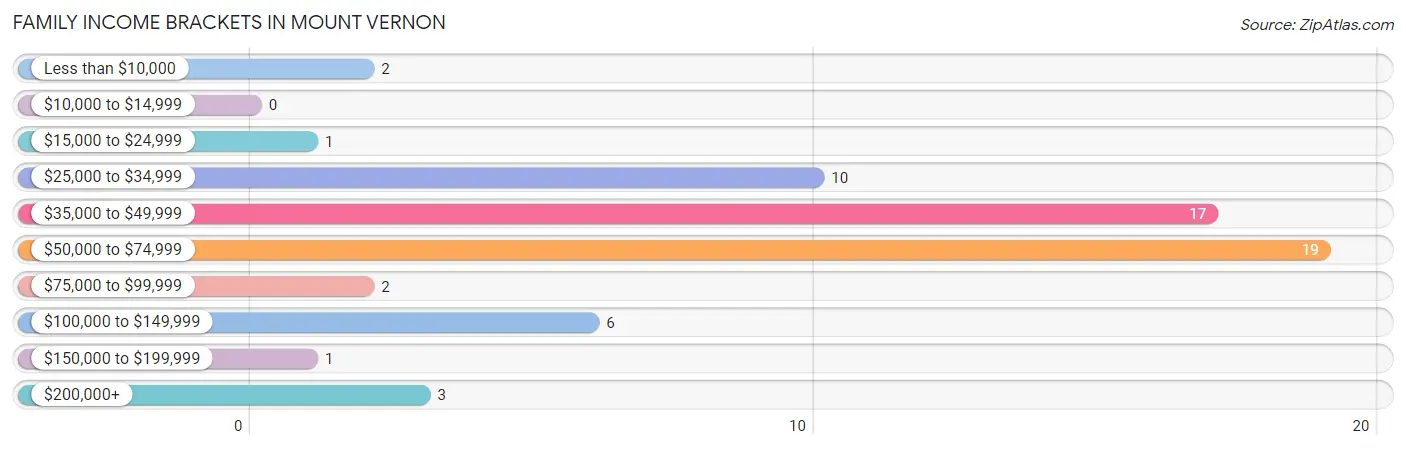
| Income Bracket | # Families | % Families |
| Less than $10,000 | 2 | 3.3% |
| $10,000 to $14,999 | 0 | 0.0% |
| $15,000 to $24,999 | 1 | 1.6% |
| $25,000 to $34,999 | 10 | 16.4% |
| $35,000 to $49,999 | 17 | 27.9% |
| $50,000 to $74,999 | 19 | 31.1% |
| $75,000 to $99,999 | 2 | 3.3% |
| $100,000 to $149,999 | 6 | 9.8% |
| $150,000 to $199,999 | 1 | 1.6% |
| $200,000+ | 3 | 4.9% |
Family Income by Famaliy Size in Mount Vernon
3-person families (12 | 19.7%) account for the highest median family income in Mount Vernon with $87,500 per family, while 3-person families (12 | 19.7%) have the highest median income of $29,167 per family member.
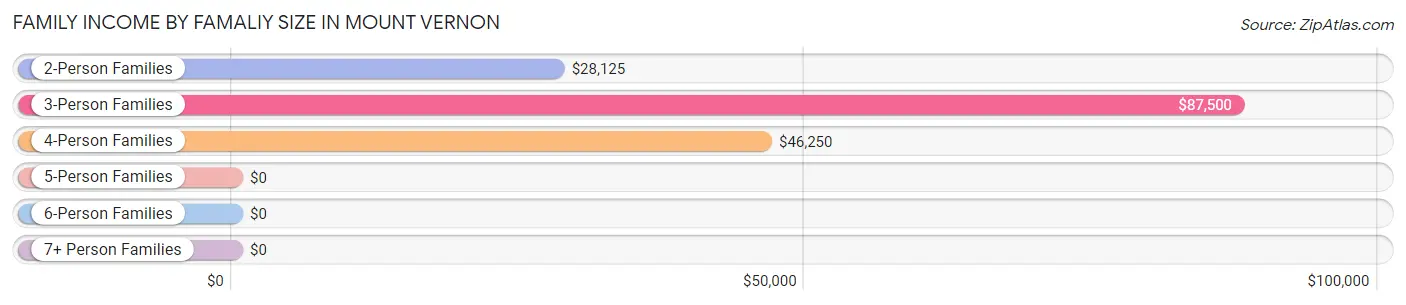
| Income Bracket | # Families | Median Income |
| 2-Person Families | 11 (18.0%) | $28,125 |
| 3-Person Families | 12 (19.7%) | $87,500 |
| 4-Person Families | 13 (21.3%) | $46,250 |
| 5-Person Families | 14 (23.0%) | $0 |
| 6-Person Families | 10 (16.4%) | $0 |
| 7+ Person Families | 1 (1.6%) | $0 |
| Total | 61 (100.0%) | $53,750 |
Family Income by Number of Earners in Mount Vernon
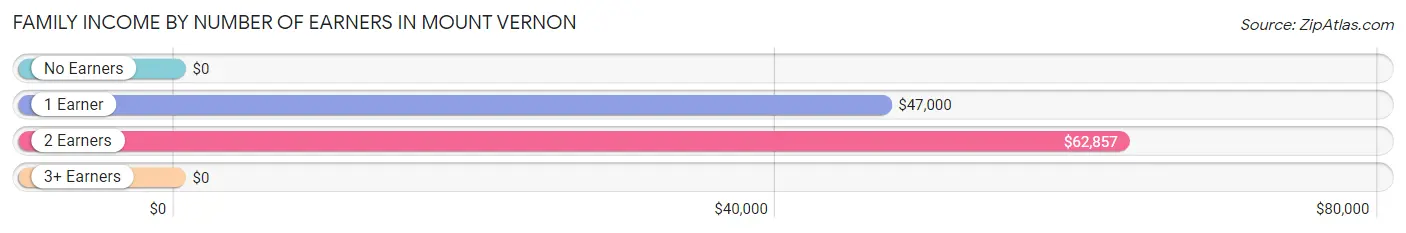
| Number of Earners | # Families | Median Income |
| No Earners | 7 (11.5%) | $0 |
| 1 Earner | 24 (39.3%) | $47,000 |
| 2 Earners | 26 (42.6%) | $62,857 |
| 3+ Earners | 4 (6.6%) | $0 |
| Total | 61 (100.0%) | $53,750 |
Household Income in Mount Vernon
Household Income Brackets in Mount Vernon
With 19 households falling in the category, the $50,000 to $74,999 income range is the most frequent in Mount Vernon, accounting for 26.0% of all households. In contrast, only 1 households (1.4%) fall into the $10,000 to $14,999 income bracket, making it the least populous group.
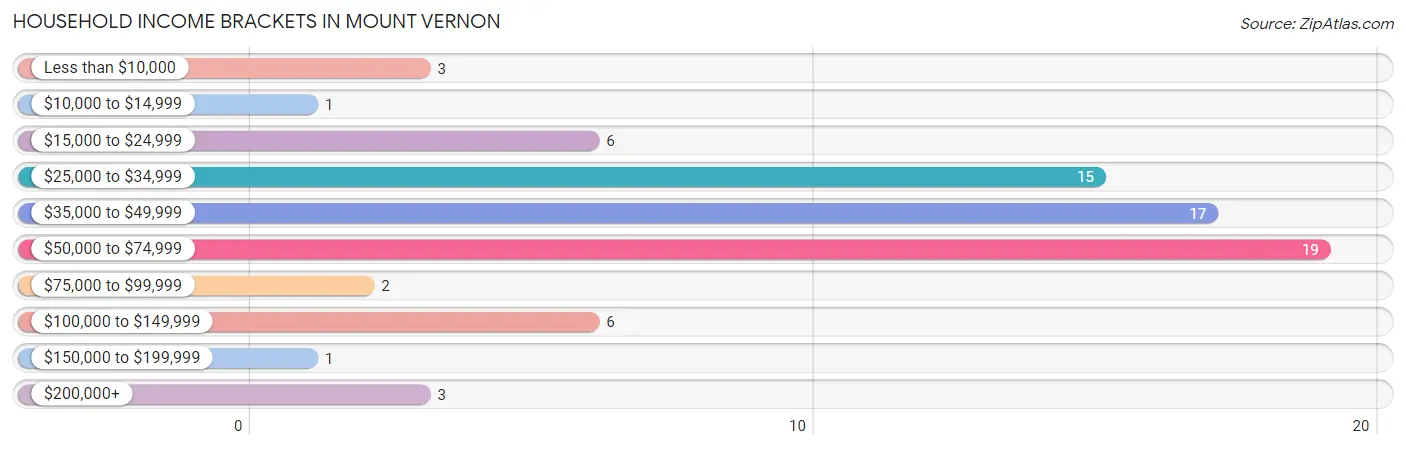
| Income Bracket | # Households | % Households |
| Less than $10,000 | 3 | 4.1% |
| $10,000 to $14,999 | 1 | 1.4% |
| $15,000 to $24,999 | 6 | 8.2% |
| $25,000 to $34,999 | 15 | 20.5% |
| $35,000 to $49,999 | 17 | 23.3% |
| $50,000 to $74,999 | 19 | 26.0% |
| $75,000 to $99,999 | 2 | 2.7% |
| $100,000 to $149,999 | 6 | 8.2% |
| $150,000 to $199,999 | 1 | 1.4% |
| $200,000+ | 3 | 4.1% |
Household Income by Householder Age in Mount Vernon
The median household income in Mount Vernon is $48,625, with the highest median household income of $65,625 found in the 45 to 64 years age bracket for the primary householder. A total of 18 households (24.7%) fall into this category. Meanwhile, the 15 to 24 years age bracket for the primary householder has the lowest median household income of $0, with 2 households (2.7%) in this group.
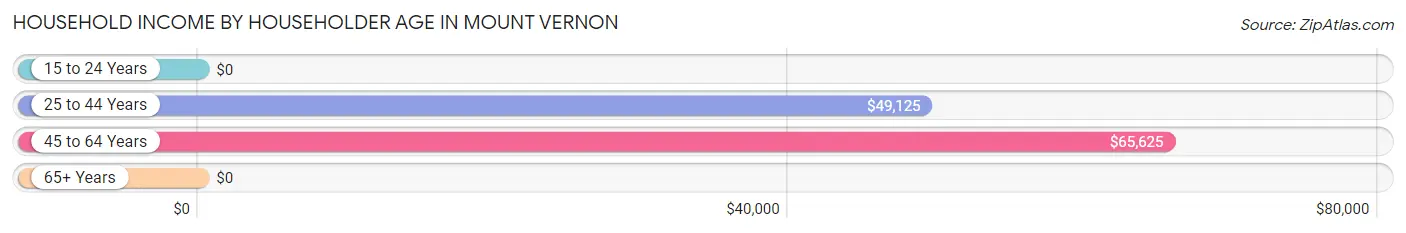
| Income Bracket | # Households | Median Income |
| 15 to 24 Years | 2 (2.7%) | $0 |
| 25 to 44 Years | 35 (47.9%) | $49,125 |
| 45 to 64 Years | 18 (24.7%) | $65,625 |
| 65+ Years | 18 (24.7%) | $0 |
| Total | 73 (100.0%) | $48,625 |
Poverty in Mount Vernon
Income Below Poverty by Sex and Age in Mount Vernon
With 1.1% poverty level for males and 8.7% for females among the residents of Mount Vernon, 65 to 74 year old males and 18 to 24 year old females are the most vulnerable to poverty, with 1 males (14.3%) and 2 females (100.0%) in their respective age groups living below the poverty level.
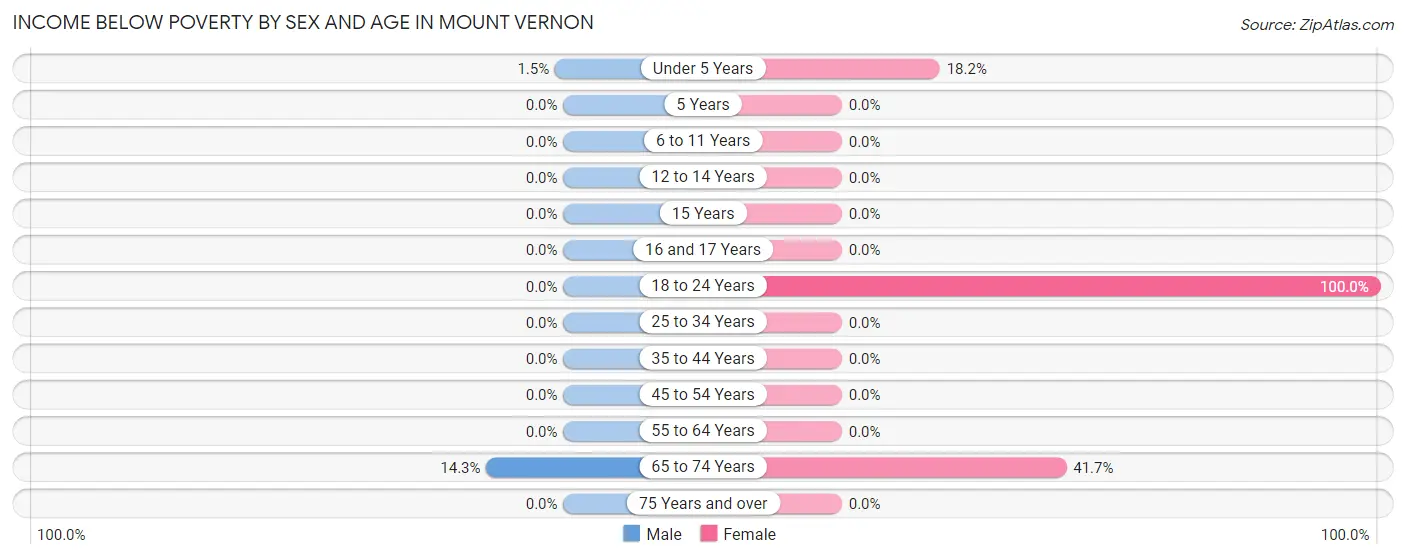
| Age Bracket | Male | Female |
| Under 5 Years | 1 (1.5%) | 2 (18.2%) |
| 5 Years | 0 (0.0%) | 0 (0.0%) |
| 6 to 11 Years | 0 (0.0%) | 0 (0.0%) |
| 12 to 14 Years | 0 (0.0%) | 0 (0.0%) |
| 15 Years | 0 (0.0%) | 0 (0.0%) |
| 16 and 17 Years | 0 (0.0%) | 0 (0.0%) |
| 18 to 24 Years | 0 (0.0%) | 2 (100.0%) |
| 25 to 34 Years | 0 (0.0%) | 0 (0.0%) |
| 35 to 44 Years | 0 (0.0%) | 0 (0.0%) |
| 45 to 54 Years | 0 (0.0%) | 0 (0.0%) |
| 55 to 64 Years | 0 (0.0%) | 0 (0.0%) |
| 65 to 74 Years | 1 (14.3%) | 5 (41.7%) |
| 75 Years and over | 0 (0.0%) | 0 (0.0%) |
| Total | 2 (1.1%) | 9 (8.7%) |
Income Above Poverty by Sex and Age in Mount Vernon
According to the poverty statistics in Mount Vernon, males aged 6 to 11 years and females aged 6 to 11 years are the age groups that are most secure financially, with 100.0% of males and 100.0% of females in these age groups living above the poverty line.
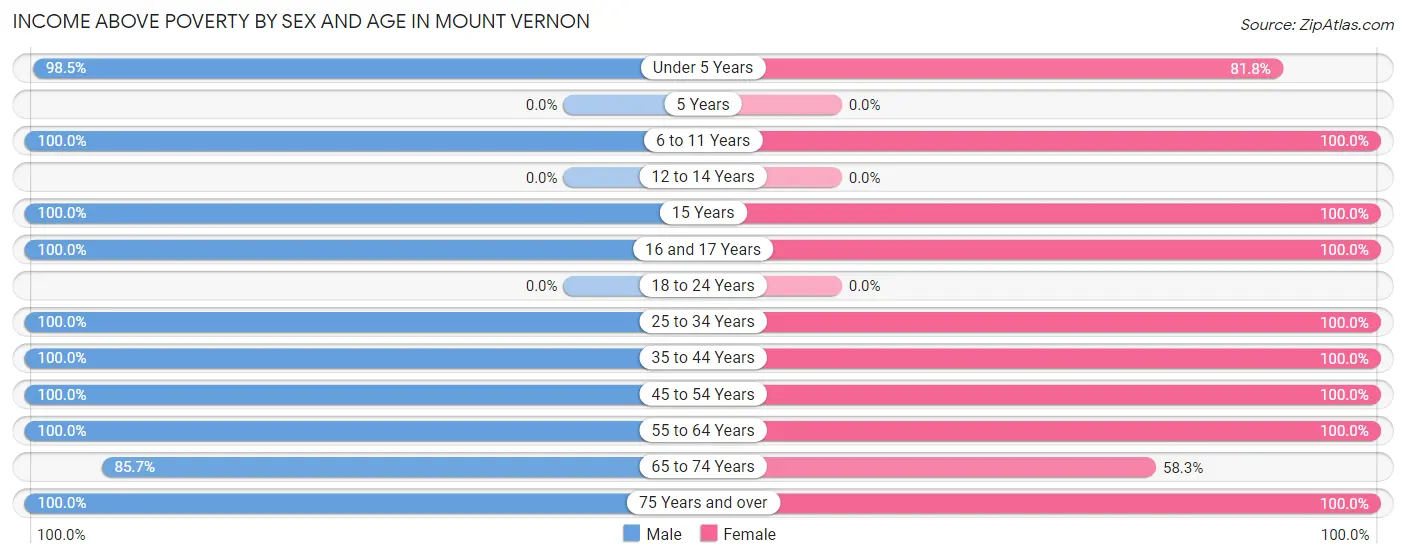
| Age Bracket | Male | Female |
| Under 5 Years | 64 (98.5%) | 9 (81.8%) |
| 5 Years | 0 (0.0%) | 0 (0.0%) |
| 6 to 11 Years | 14 (100.0%) | 21 (100.0%) |
| 12 to 14 Years | 0 (0.0%) | 0 (0.0%) |
| 15 Years | 2 (100.0%) | 6 (100.0%) |
| 16 and 17 Years | 5 (100.0%) | 1 (100.0%) |
| 18 to 24 Years | 0 (0.0%) | 0 (0.0%) |
| 25 to 34 Years | 22 (100.0%) | 24 (100.0%) |
| 35 to 44 Years | 17 (100.0%) | 12 (100.0%) |
| 45 to 54 Years | 20 (100.0%) | 2 (100.0%) |
| 55 to 64 Years | 17 (100.0%) | 9 (100.0%) |
| 65 to 74 Years | 6 (85.7%) | 7 (58.3%) |
| 75 Years and over | 5 (100.0%) | 3 (100.0%) |
| Total | 172 (98.9%) | 94 (91.3%) |
Income Below Poverty Among Married-Couple Families in Mount Vernon
The poverty statistics for married-couple families in Mount Vernon show that 1.9% or 1 of the total 53 families live below the poverty line. Families with no children have the highest poverty rate of 6.7%, comprising of 1 families. On the other hand, families with 1 or 2 children have the lowest poverty rate of 0.0%, which includes 0 families.
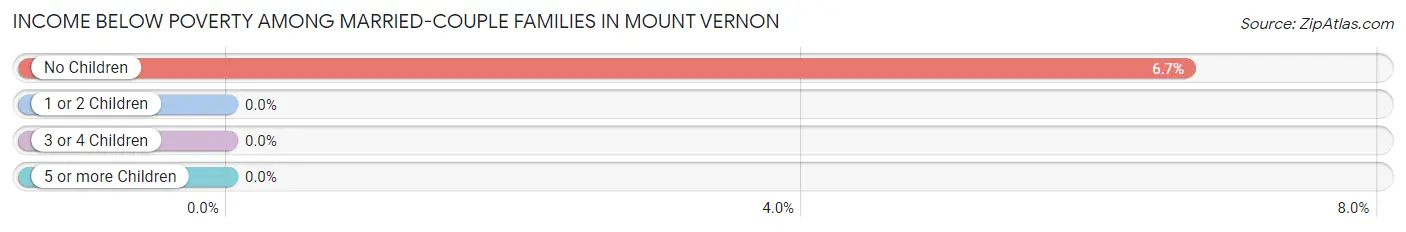
| Children | Above Poverty | Below Poverty |
| No Children | 14 (93.3%) | 1 (6.7%) |
| 1 or 2 Children | 13 (100.0%) | 0 (0.0%) |
| 3 or 4 Children | 25 (100.0%) | 0 (0.0%) |
| 5 or more Children | 0 (0.0%) | 0 (0.0%) |
| Total | 52 (98.1%) | 1 (1.9%) |
Income Below Poverty Among Single-Parent Households in Mount Vernon
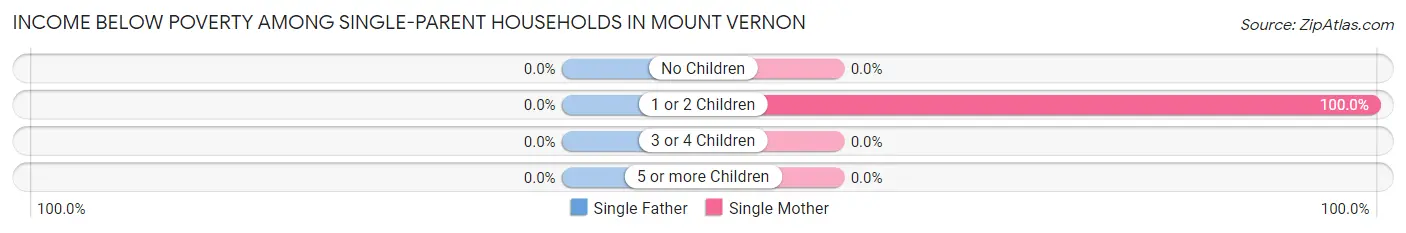
| Children | Single Father | Single Mother |
| No Children | 0 (0.0%) | 0 (0.0%) |
| 1 or 2 Children | 0 (0.0%) | 2 (100.0%) |
| 3 or 4 Children | 0 (0.0%) | 0 (0.0%) |
| 5 or more Children | 0 (0.0%) | 0 (0.0%) |
| Total | 0 (0.0%) | 2 (50.0%) |
Income Below Poverty Among Married-Couple vs Single-Parent Households in Mount Vernon
The poverty data for Mount Vernon shows that 1 of the married-couple family households (1.9%) and 2 of the single-parent households (25.0%) are living below the poverty level. Within the married-couple family households, those with no children have the highest poverty rate, with 1 households (6.7%) falling below the poverty line. Among the single-parent households, those with 1 or 2 children have the highest poverty rate, with 2 household (33.3%) living below poverty.
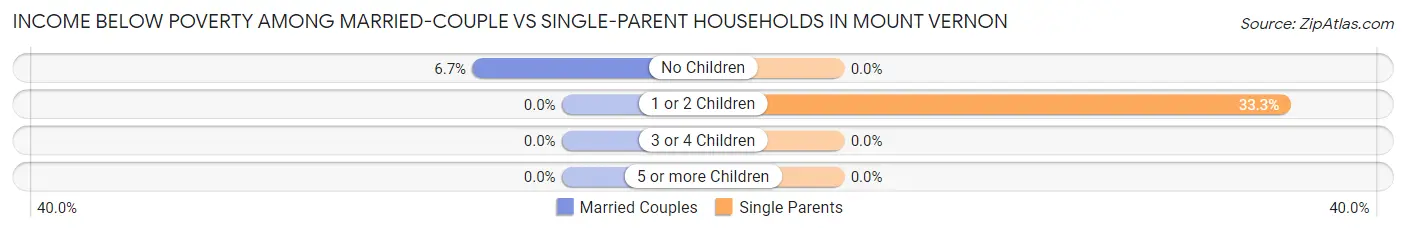
| Children | Married-Couple Families | Single-Parent Households |
| No Children | 1 (6.7%) | 0 (0.0%) |
| 1 or 2 Children | 0 (0.0%) | 2 (33.3%) |
| 3 or 4 Children | 0 (0.0%) | 0 (0.0%) |
| 5 or more Children | 0 (0.0%) | 0 (0.0%) |
| Total | 1 (1.9%) | 2 (25.0%) |
Race in Mount Vernon
The most populous races in Mount Vernon are White / Caucasian (255 | 92.1%), Hispanic or Latino (22 | 7.9%), and Black / African American (19 | 6.9%).
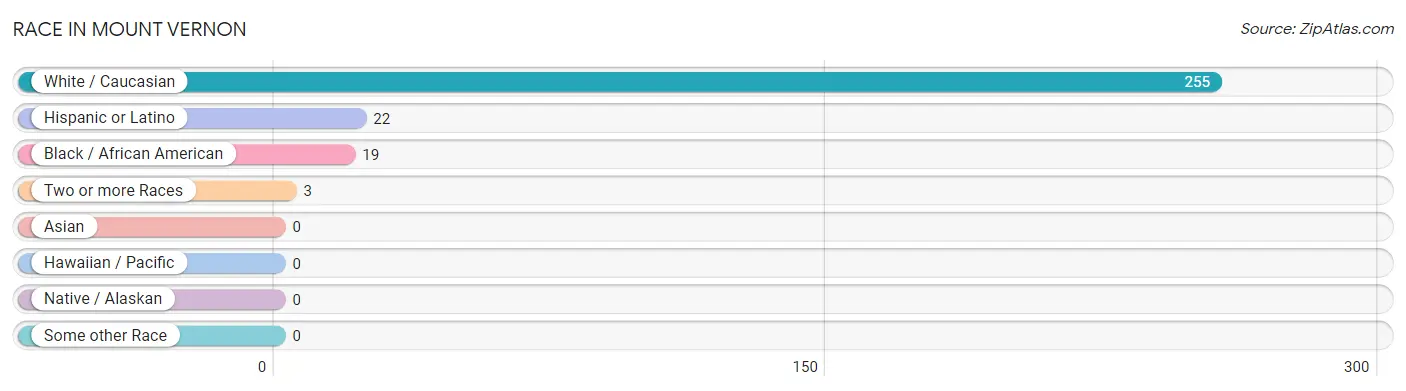
| Race | # Population | % Population |
| Asian | 0 | 0.0% |
| Black / African American | 19 | 6.9% |
| Hawaiian / Pacific | 0 | 0.0% |
| Hispanic or Latino | 22 | 7.9% |
| Native / Alaskan | 0 | 0.0% |
| White / Caucasian | 255 | 92.1% |
| Two or more Races | 3 | 1.1% |
| Some other Race | 0 | 0.0% |
| Total | 277 | 100.0% |
Ancestry in Mount Vernon
The most populous ancestries reported in Mount Vernon are German (46 | 16.6%), English (35 | 12.6%), Irish (35 | 12.6%), Central American (19 | 6.9%), and American (15 | 5.4%), together accounting for 54.2% of all Mount Vernon residents.
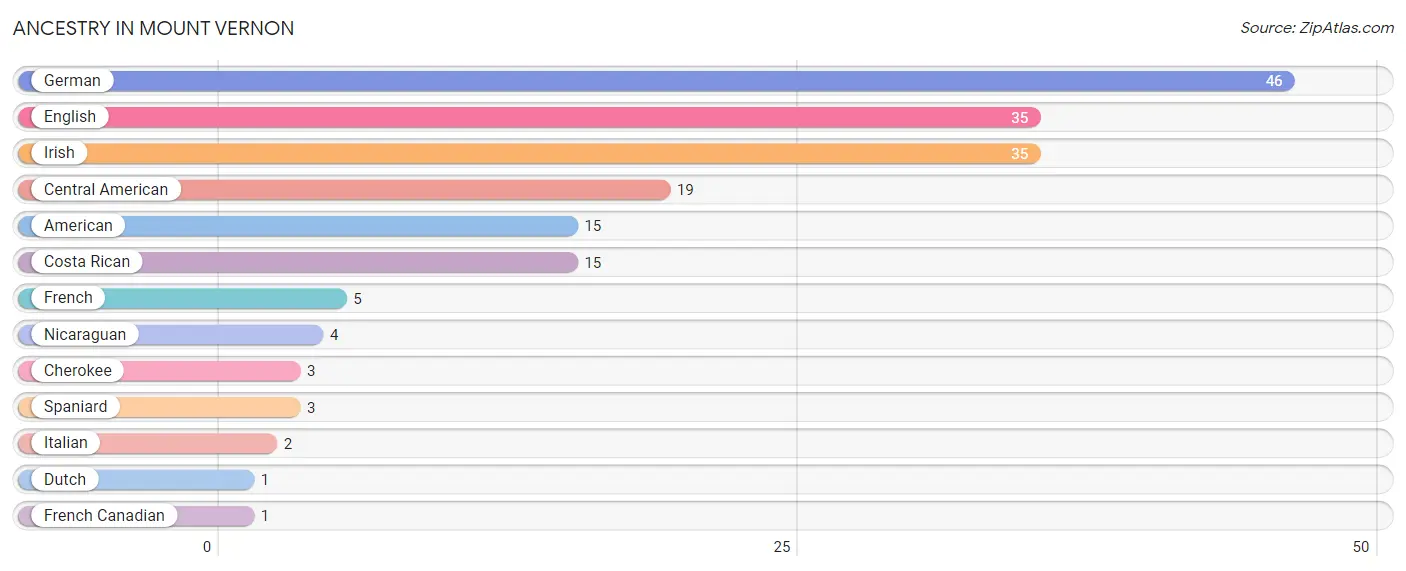
| Ancestry | # Population | % Population |
| American | 15 | 5.4% |
| Central American | 19 | 6.9% |
| Cherokee | 3 | 1.1% |
| Costa Rican | 15 | 5.4% |
| Dutch | 1 | 0.4% |
| English | 35 | 12.6% |
| French | 5 | 1.8% |
| French Canadian | 1 | 0.4% |
| German | 46 | 16.6% |
| Irish | 35 | 12.6% |
| Italian | 2 | 0.7% |
| Nicaraguan | 4 | 1.4% |
| Spaniard | 3 | 1.1% | View All 13 Rows |
Immigrants in Mount Vernon
The most numerous immigrant groups reported in Mount Vernon came from Europe (16 | 5.8%), Germany (16 | 5.8%), Western Europe (16 | 5.8%), Central America (8 | 2.9%), and Latin America (8 | 2.9%), together accounting for 23.1% of all Mount Vernon residents.
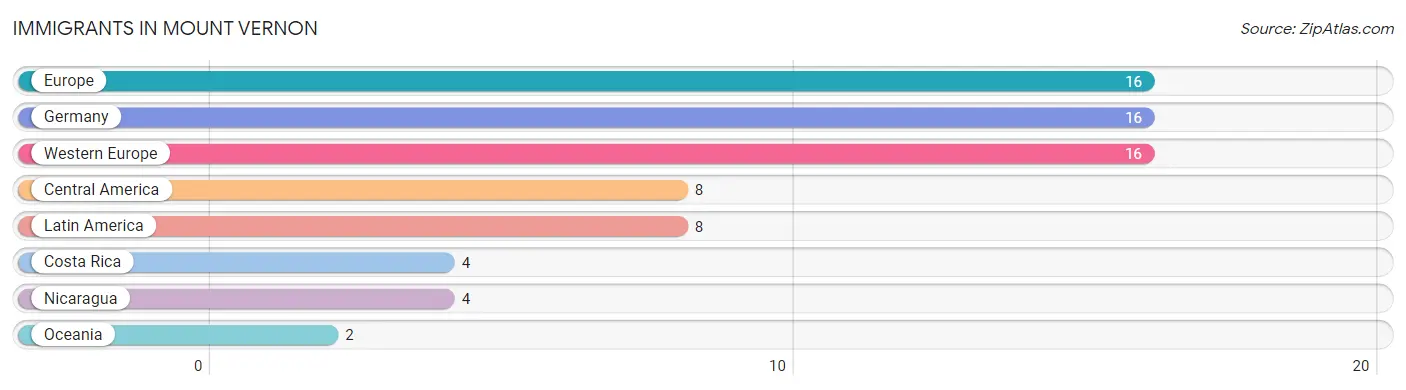
| Immigration Origin | # Population | % Population |
| Central America | 8 | 2.9% |
| Costa Rica | 4 | 1.4% |
| Europe | 16 | 5.8% |
| Germany | 16 | 5.8% |
| Latin America | 8 | 2.9% |
| Nicaragua | 4 | 1.4% |
| Oceania | 2 | 0.7% |
| Western Europe | 16 | 5.8% | View All 8 Rows |
Sex and Age in Mount Vernon
Sex and Age in Mount Vernon
The most populous age groups in Mount Vernon are Under 5 Years (65 | 37.4%) for men and 30 to 34 Years (23 | 22.3%) for women.
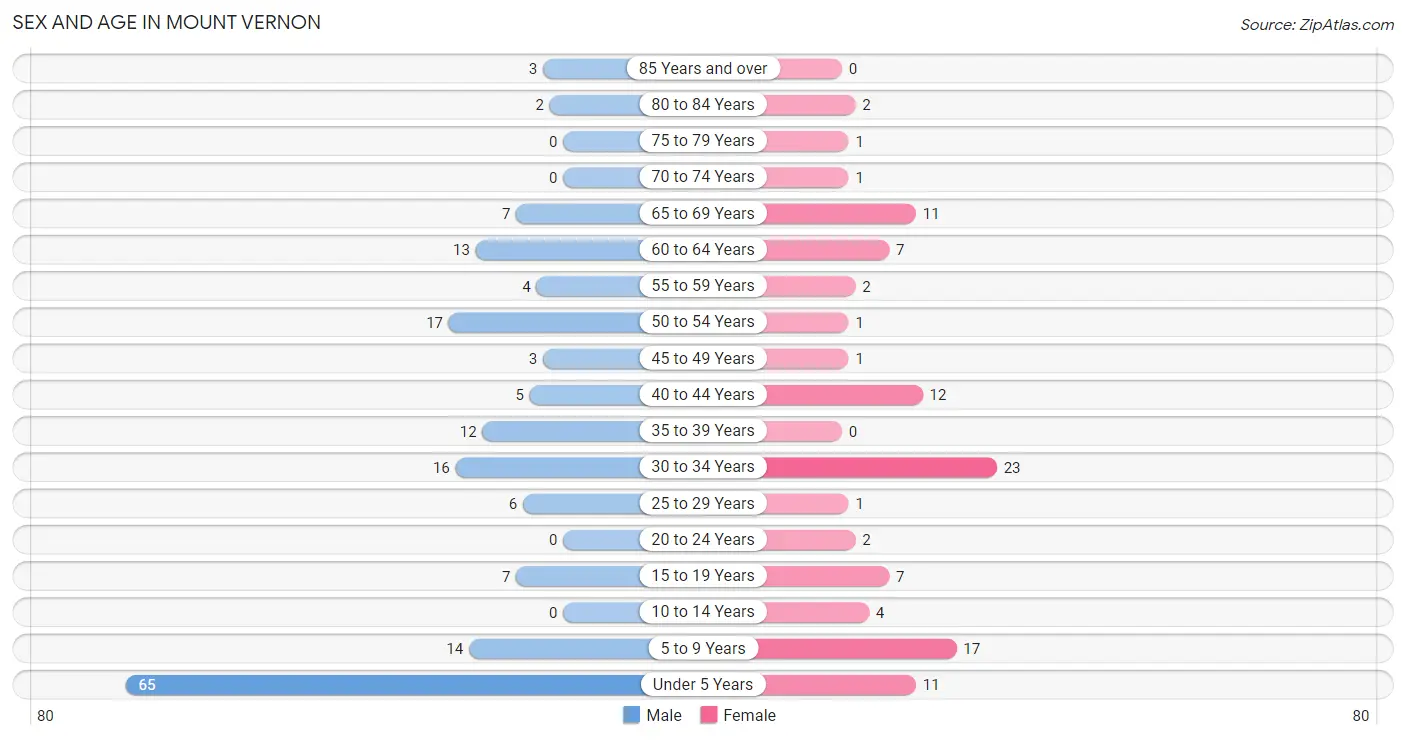
| Age Bracket | Male | Female |
| Under 5 Years | 65 (37.4%) | 11 (10.7%) |
| 5 to 9 Years | 14 (8.1%) | 17 (16.5%) |
| 10 to 14 Years | 0 (0.0%) | 4 (3.9%) |
| 15 to 19 Years | 7 (4.0%) | 7 (6.8%) |
| 20 to 24 Years | 0 (0.0%) | 2 (1.9%) |
| 25 to 29 Years | 6 (3.5%) | 1 (1.0%) |
| 30 to 34 Years | 16 (9.2%) | 23 (22.3%) |
| 35 to 39 Years | 12 (6.9%) | 0 (0.0%) |
| 40 to 44 Years | 5 (2.9%) | 12 (11.7%) |
| 45 to 49 Years | 3 (1.7%) | 1 (1.0%) |
| 50 to 54 Years | 17 (9.8%) | 1 (1.0%) |
| 55 to 59 Years | 4 (2.3%) | 2 (1.9%) |
| 60 to 64 Years | 13 (7.5%) | 7 (6.8%) |
| 65 to 69 Years | 7 (4.0%) | 11 (10.7%) |
| 70 to 74 Years | 0 (0.0%) | 1 (1.0%) |
| 75 to 79 Years | 0 (0.0%) | 1 (1.0%) |
| 80 to 84 Years | 2 (1.1%) | 2 (1.9%) |
| 85 Years and over | 3 (1.7%) | 0 (0.0%) |
| Total | 174 (100.0%) | 103 (100.0%) |
Families and Households in Mount Vernon
Median Family Size in Mount Vernon
The median family size in Mount Vernon is 4.31 persons per family, with married-couple families (53 | 86.9%) accounting for the largest median family size of 4.6 persons per family. On the other hand, single male/father families (4 | 6.6%) represent the smallest median family size with 2.25 persons per family.
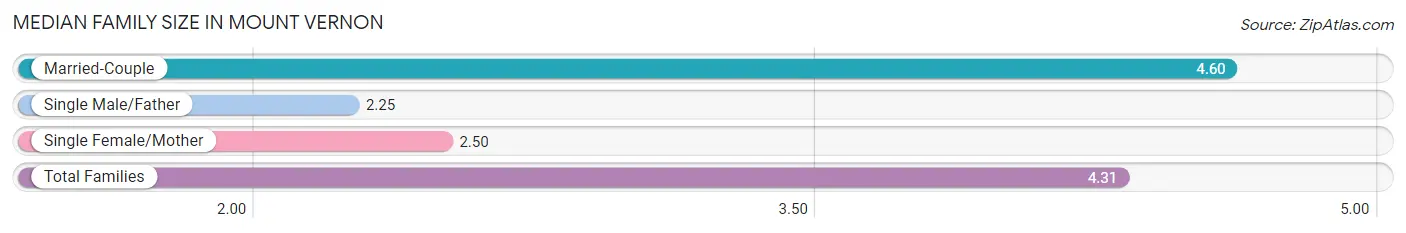
| Family Type | # Families | Family Size |
| Married-Couple | 53 (86.9%) | 4.60 |
| Single Male/Father | 4 (6.6%) | 2.25 |
| Single Female/Mother | 4 (6.6%) | 2.50 |
| Total Families | 61 (100.0%) | 4.31 |
Median Household Size in Mount Vernon
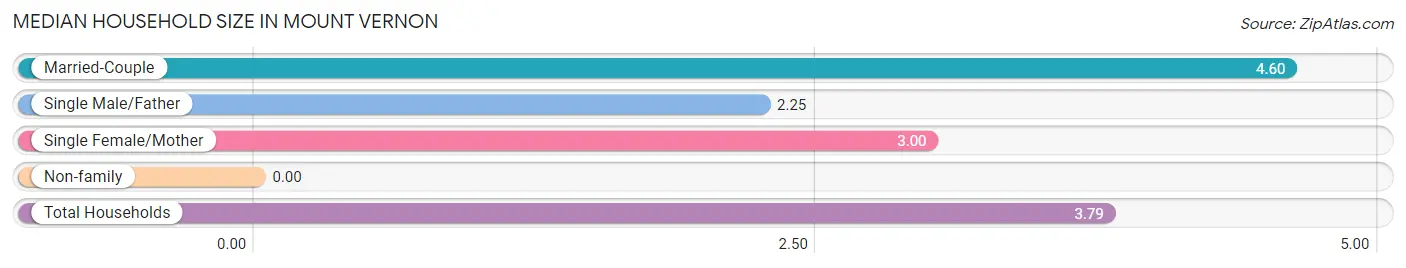
| Household Type | # Households | Household Size |
| Married-Couple | 53 (72.6%) | 4.60 |
| Single Male/Father | 4 (5.5%) | 2.25 |
| Single Female/Mother | 4 (5.5%) | 3.00 |
| Non-family | 12 (16.4%) | - |
| Total Households | 73 (100.0%) | 3.79 |
Household Size by Marriage Status in Mount Vernon
Out of a total of 73 households in Mount Vernon, 61 (83.6%) are family households, while 12 (16.4%) are nonfamily households. The most numerous type of family households are 4-person households, comprising 15, and the most common type of nonfamily households are 1-person households, comprising 12.
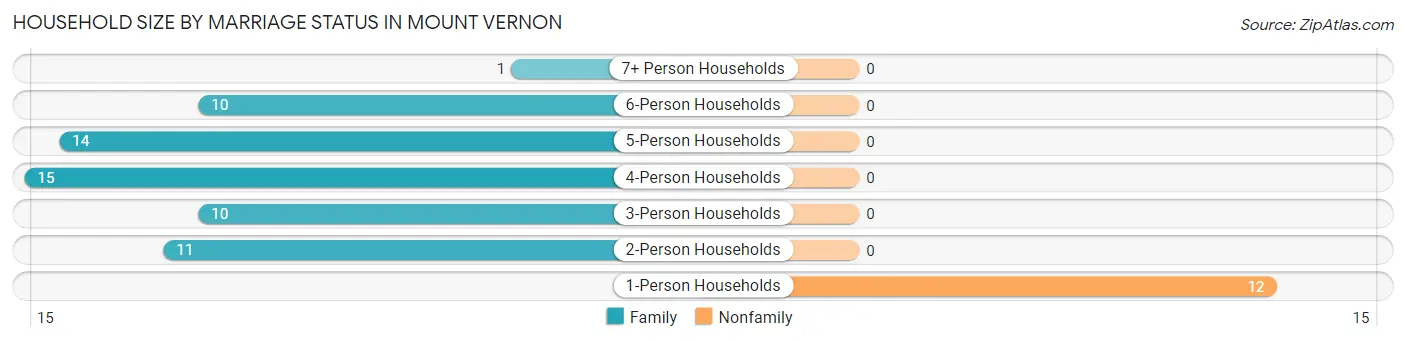
| Household Size | Family Households | Nonfamily Households |
| 1-Person Households | - | 12 (16.4%) |
| 2-Person Households | 11 (15.1%) | 0 (0.0%) |
| 3-Person Households | 10 (13.7%) | 0 (0.0%) |
| 4-Person Households | 15 (20.5%) | 0 (0.0%) |
| 5-Person Households | 14 (19.2%) | 0 (0.0%) |
| 6-Person Households | 10 (13.7%) | 0 (0.0%) |
| 7+ Person Households | 1 (1.4%) | 0 (0.0%) |
| Total | 61 (83.6%) | 12 (16.4%) |
Female Fertility in Mount Vernon
Fertility by Age in Mount Vernon
Average fertility rate in Mount Vernon is 239.0 births per 1,000 women. Women in the age bracket of 35 to 50 years have the highest fertility rate with 308.0 births per 1,000 women. Women in the age bracket of 20 to 34 years acount for 63.6% of all women with births.
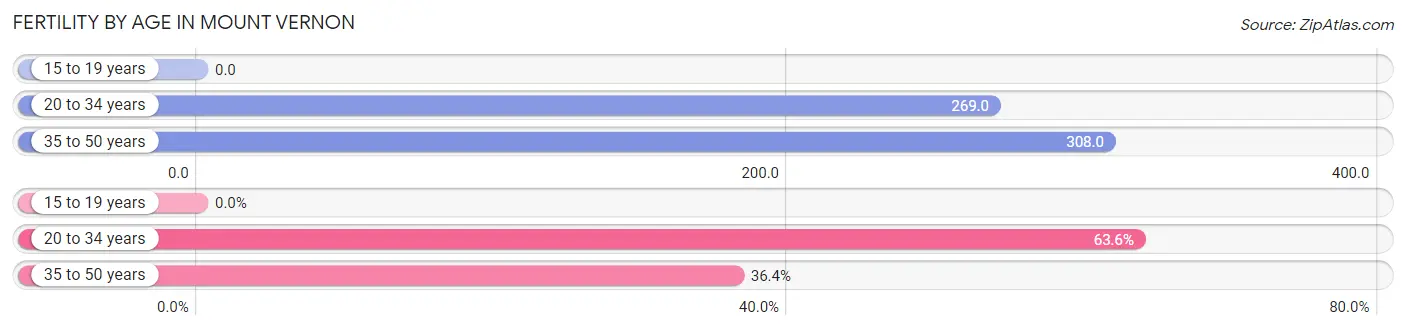
| Age Bracket | Women with Births | Births / 1,000 Women |
| 15 to 19 years | 0 (0.0%) | 0.0 |
| 20 to 34 years | 7 (63.6%) | 269.0 |
| 35 to 50 years | 4 (36.4%) | 308.0 |
| Total | 11 (100.0%) | 239.0 |
Fertility by Age by Marriage Status in Mount Vernon
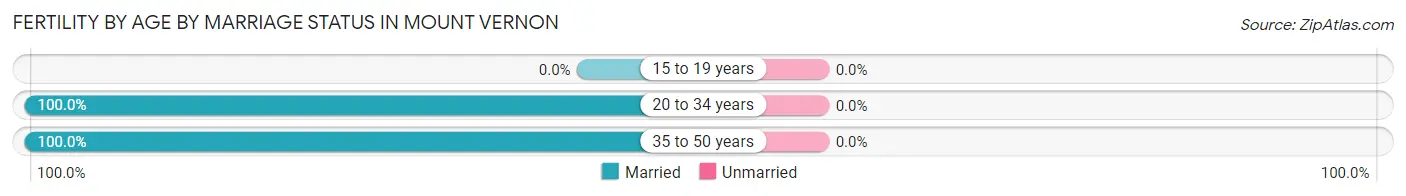
| Age Bracket | Married | Unmarried |
| 15 to 19 years | 0 (0.0%) | 0 (0.0%) |
| 20 to 34 years | 7 (100.0%) | 0 (0.0%) |
| 35 to 50 years | 4 (100.0%) | 0 (0.0%) |
| Total | 11 (100.0%) | 0 (0.0%) |
Fertility by Education in Mount Vernon
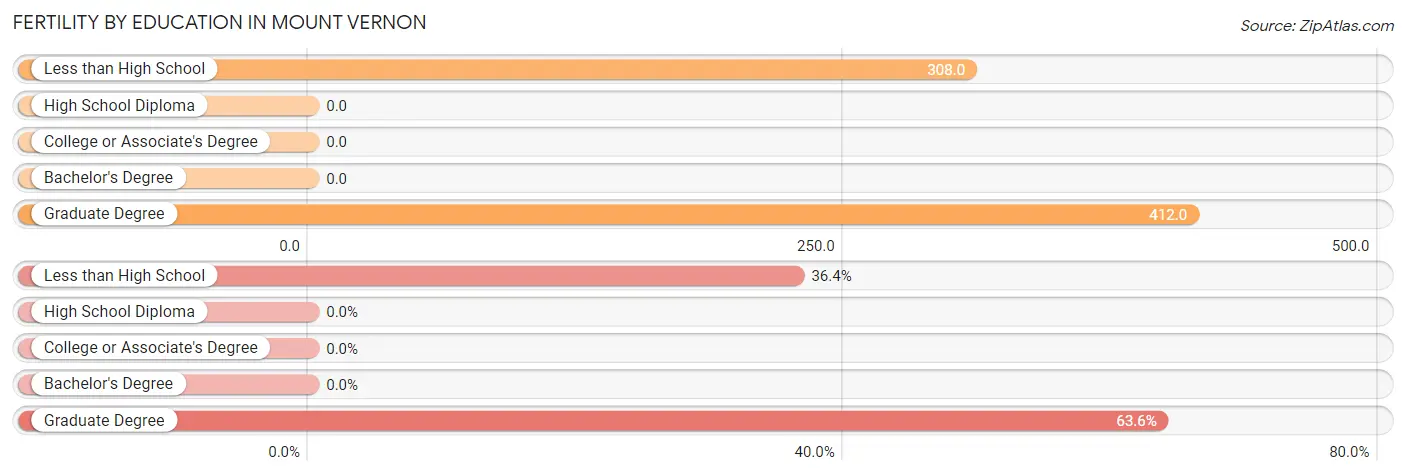
| Educational Attainment | Women with Births | Births / 1,000 Women |
| Less than High School | 4 (36.4%) | 308.0 |
| High School Diploma | 0 (0.0%) | 0.0 |
| College or Associate's Degree | 0 (0.0%) | 0.0 |
| Bachelor's Degree | 0 (0.0%) | 0.0 |
| Graduate Degree | 7 (63.6%) | 412.0 |
| Total | 11 (100.0%) | 239.0 |
Fertility by Education by Marriage Status in Mount Vernon
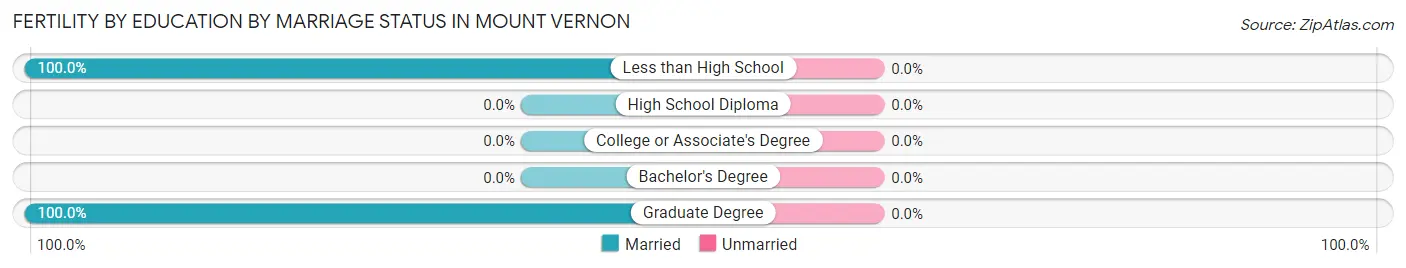
| Educational Attainment | Married | Unmarried |
| Less than High School | 4 (100.0%) | 0 (0.0%) |
| High School Diploma | 0 (0.0%) | 0 (0.0%) |
| College or Associate's Degree | 0 (0.0%) | 0 (0.0%) |
| Bachelor's Degree | 0 (0.0%) | 0 (0.0%) |
| Graduate Degree | 7 (100.0%) | 0 (0.0%) |
| Total | 11 (100.0%) | 0 (0.0%) |
Employment Characteristics in Mount Vernon
Employment by Class of Employer in Mount Vernon
Among the 87 employed individuals in Mount Vernon, private company employees (51 | 58.6%), self-employed (incorporated) (17 | 19.5%), and self-employed (not incorporated) (8 | 9.2%) make up the most common classes of employment.
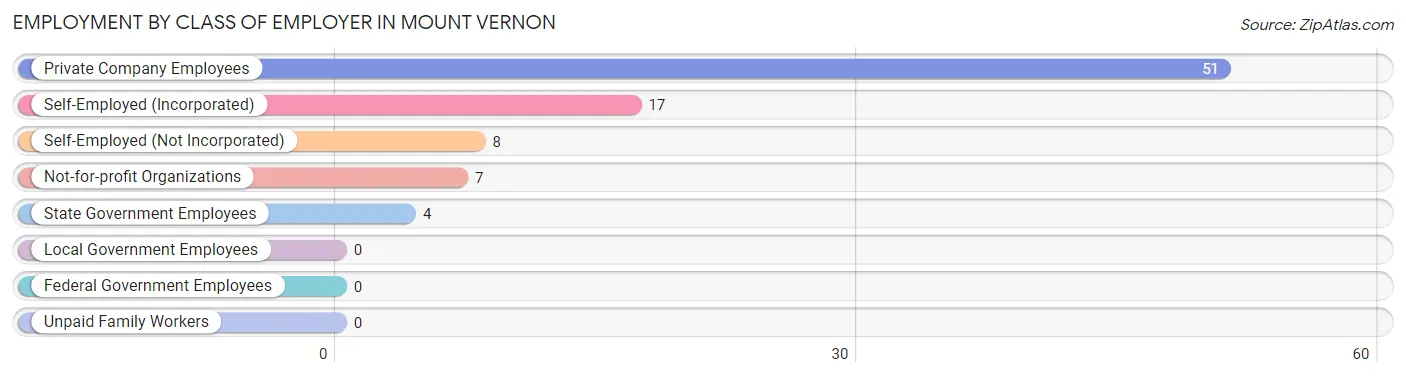
| Employer Class | # Employees | % Employees |
| Private Company Employees | 51 | 58.6% |
| Self-Employed (Incorporated) | 17 | 19.5% |
| Self-Employed (Not Incorporated) | 8 | 9.2% |
| Not-for-profit Organizations | 7 | 8.1% |
| Local Government Employees | 0 | 0.0% |
| State Government Employees | 4 | 4.6% |
| Federal Government Employees | 0 | 0.0% |
| Unpaid Family Workers | 0 | 0.0% |
| Total | 87 | 100.0% |
Employment Status by Age in Mount Vernon
According to the labor force statistics for Mount Vernon, out of the total population over 16 years of age (158), 58.2% or 92 individuals are in the labor force, with 5.4% or 5 of them unemployed. The age group with the highest labor force participation rate is 20 to 24 years, with 100.0% or 2 individuals in the labor force. Within the labor force, the 20 to 24 years age range has the highest percentage of unemployed individuals, with 100.0% or 2 of them being unemployed.
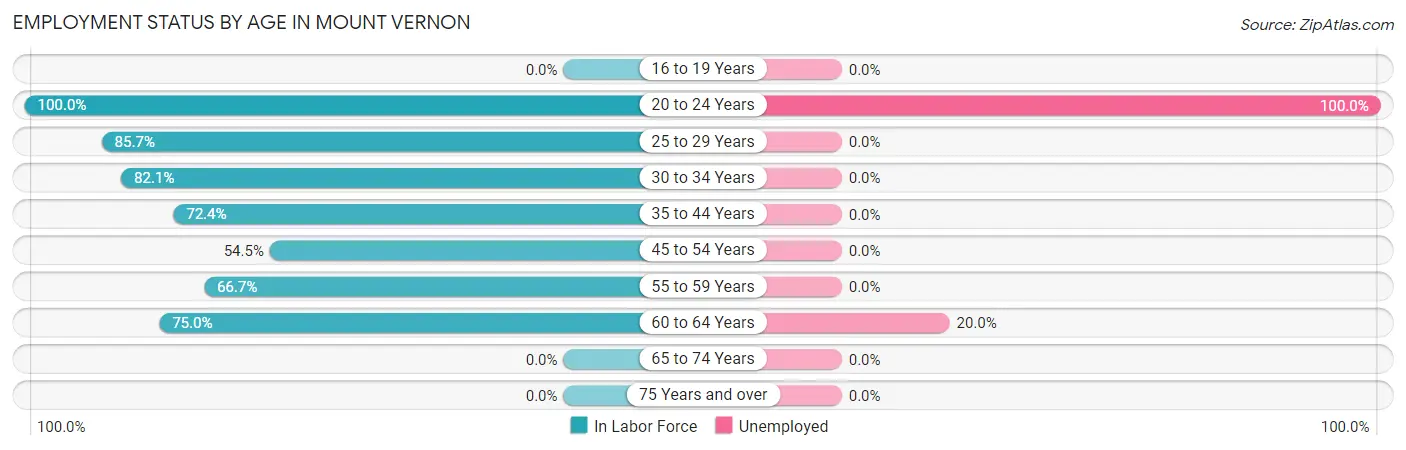
| Age Bracket | In Labor Force | Unemployed |
| 16 to 19 Years | 0 (0.0%) | 0 (0.0%) |
| 20 to 24 Years | 2 (100.0%) | 2 (100.0%) |
| 25 to 29 Years | 6 (85.7%) | 0 (0.0%) |
| 30 to 34 Years | 32 (82.1%) | 0 (0.0%) |
| 35 to 44 Years | 21 (72.4%) | 0 (0.0%) |
| 45 to 54 Years | 12 (54.5%) | 0 (0.0%) |
| 55 to 59 Years | 4 (66.7%) | 0 (0.0%) |
| 60 to 64 Years | 15 (75.0%) | 3 (20.0%) |
| 65 to 74 Years | 0 (0.0%) | 0 (0.0%) |
| 75 Years and over | 0 (0.0%) | 0 (0.0%) |
| Total | 92 (58.2%) | 5 (5.4%) |
Employment Status by Educational Attainment in Mount Vernon
According to labor force statistics for Mount Vernon, 73.2% of individuals (90) out of the total population between 25 and 64 years of age (123) are in the labor force, with 3.3% or 3 of them being unemployed. The group with the highest labor force participation rate are those with the educational attainment of college / associate degree, with 88.5% or 23 individuals in the labor force. Within the labor force, individuals with bachelor's degree or higher education have the highest percentage of unemployment, with 11.1% or 3 of them being unemployed.
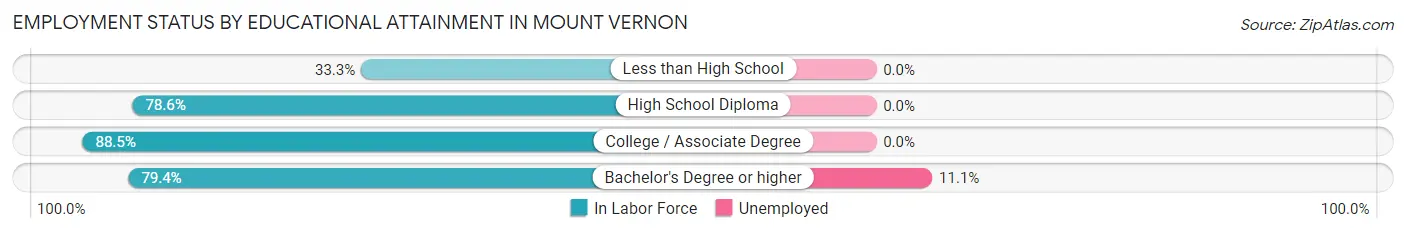
| Educational Attainment | In Labor Force | Unemployed |
| Less than High School | 7 (33.3%) | 0 (0.0%) |
| High School Diploma | 33 (78.6%) | 0 (0.0%) |
| College / Associate Degree | 23 (88.5%) | 0 (0.0%) |
| Bachelor's Degree or higher | 27 (79.4%) | 4 (11.1%) |
| Total | 90 (73.2%) | 4 (3.3%) |
Employment Occupations by Sex in Mount Vernon
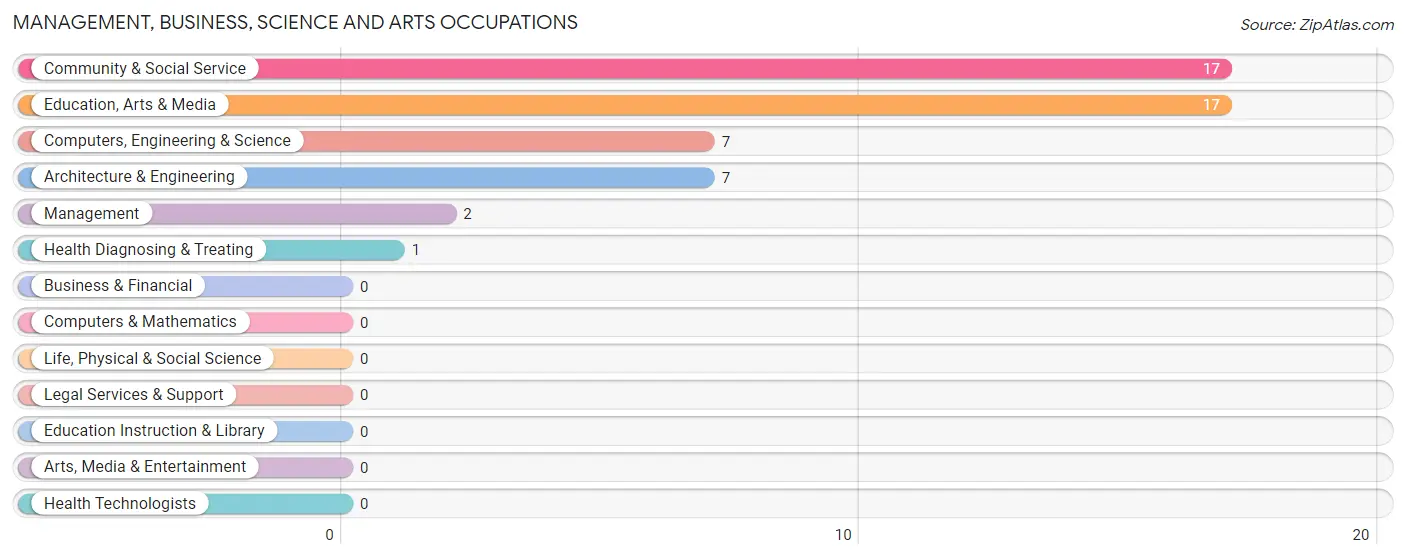
Management, Business, Science and Arts Occupations
The most common Management, Business, Science and Arts occupations in Mount Vernon are Community & Social Service (17 | 19.5%), Education, Arts & Media (17 | 19.5%), Computers, Engineering & Science (7 | 8.1%), Architecture & Engineering (7 | 8.1%), and Management (2 | 2.3%).
Management, Business, Science and Arts Occupations by Sex
Within the Management, Business, Science and Arts occupations in Mount Vernon, the most male-oriented occupations are Computers, Engineering & Science (100.0%), Architecture & Engineering (100.0%), and Management (50.0%), while the most female-oriented occupations are Health Diagnosing & Treating (100.0%), Community & Social Service (58.8%), and Education, Arts & Media (58.8%).
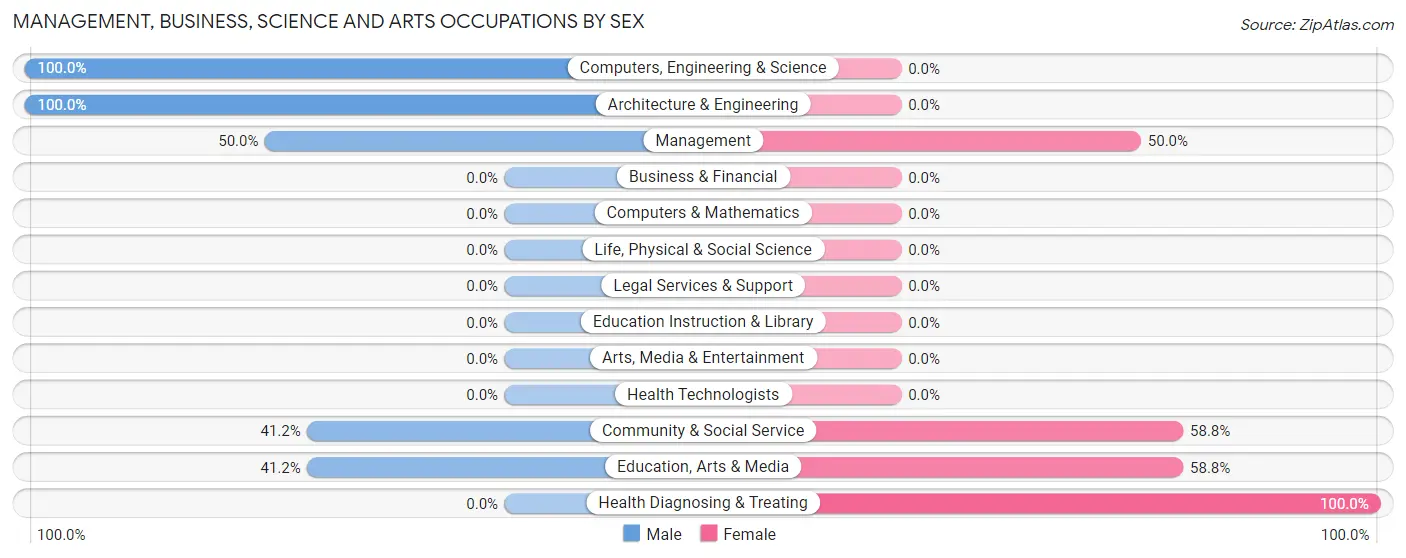
| Occupation | Male | Female |
| Management | 1 (50.0%) | 1 (50.0%) |
| Business & Financial | 0 (0.0%) | 0 (0.0%) |
| Computers, Engineering & Science | 7 (100.0%) | 0 (0.0%) |
| Computers & Mathematics | 0 (0.0%) | 0 (0.0%) |
| Architecture & Engineering | 7 (100.0%) | 0 (0.0%) |
| Life, Physical & Social Science | 0 (0.0%) | 0 (0.0%) |
| Community & Social Service | 7 (41.2%) | 10 (58.8%) |
| Education, Arts & Media | 7 (41.2%) | 10 (58.8%) |
| Legal Services & Support | 0 (0.0%) | 0 (0.0%) |
| Education Instruction & Library | 0 (0.0%) | 0 (0.0%) |
| Arts, Media & Entertainment | 0 (0.0%) | 0 (0.0%) |
| Health Diagnosing & Treating | 0 (0.0%) | 1 (100.0%) |
| Health Technologists | 0 (0.0%) | 0 (0.0%) |
| Total (Category) | 15 (55.6%) | 12 (44.4%) |
| Total (Overall) | 56 (64.4%) | 31 (35.6%) |
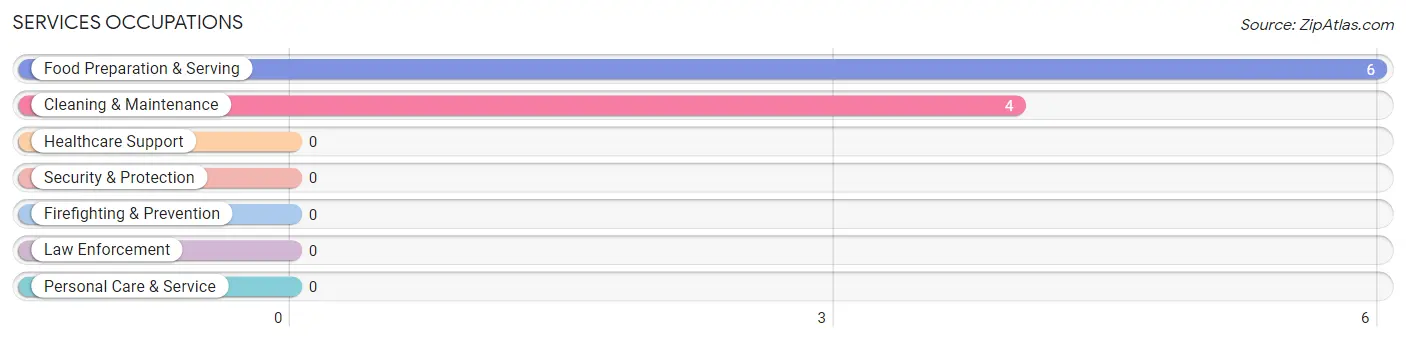
Services Occupations
The most common Services occupations in Mount Vernon are Food Preparation & Serving (6 | 6.9%), and Cleaning & Maintenance (4 | 4.6%).
Services Occupations by Sex
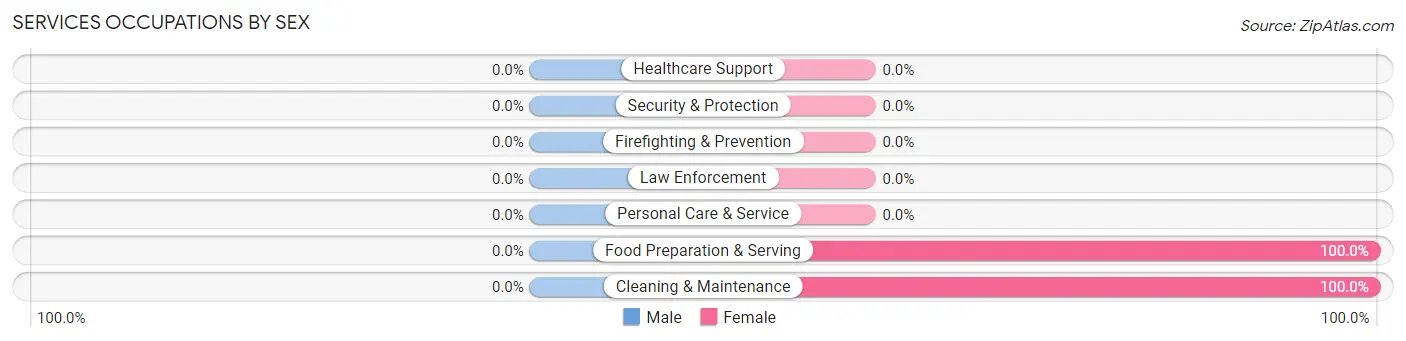
| Occupation | Male | Female |
| Healthcare Support | 0 (0.0%) | 0 (0.0%) |
| Security & Protection | 0 (0.0%) | 0 (0.0%) |
| Firefighting & Prevention | 0 (0.0%) | 0 (0.0%) |
| Law Enforcement | 0 (0.0%) | 0 (0.0%) |
| Food Preparation & Serving | 0 (0.0%) | 6 (100.0%) |
| Cleaning & Maintenance | 0 (0.0%) | 4 (100.0%) |
| Personal Care & Service | 0 (0.0%) | 0 (0.0%) |
| Total (Category) | 0 (0.0%) | 10 (100.0%) |
| Total (Overall) | 56 (64.4%) | 31 (35.6%) |
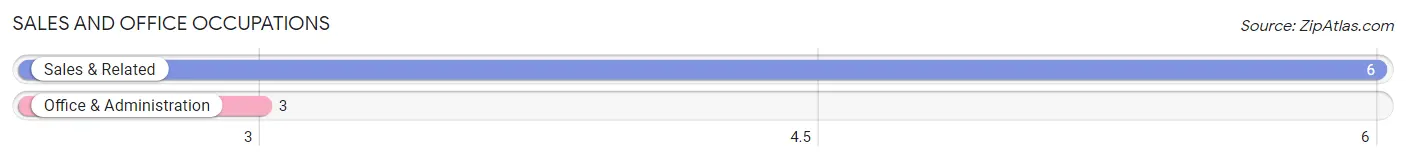
Sales and Office Occupations
The most common Sales and Office occupations in Mount Vernon are Sales & Related (6 | 6.9%), and Office & Administration (3 | 3.5%).
Sales and Office Occupations by Sex
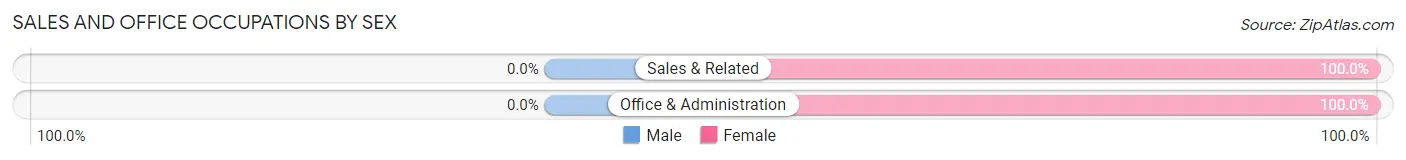
| Occupation | Male | Female |
| Sales & Related | 0 (0.0%) | 6 (100.0%) |
| Office & Administration | 0 (0.0%) | 3 (100.0%) |
| Total (Category) | 0 (0.0%) | 9 (100.0%) |
| Total (Overall) | 56 (64.4%) | 31 (35.6%) |
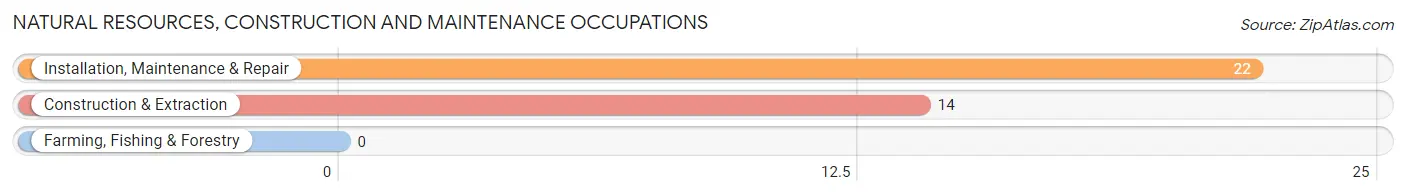
Natural Resources, Construction and Maintenance Occupations
The most common Natural Resources, Construction and Maintenance occupations in Mount Vernon are Installation, Maintenance & Repair (22 | 25.3%), and Construction & Extraction (14 | 16.1%).
Natural Resources, Construction and Maintenance Occupations by Sex
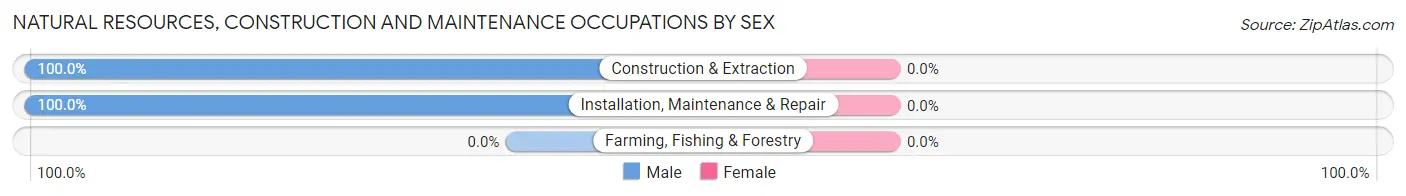
| Occupation | Male | Female |
| Farming, Fishing & Forestry | 0 (0.0%) | 0 (0.0%) |
| Construction & Extraction | 14 (100.0%) | 0 (0.0%) |
| Installation, Maintenance & Repair | 22 (100.0%) | 0 (0.0%) |
| Total (Category) | 36 (100.0%) | 0 (0.0%) |
| Total (Overall) | 56 (64.4%) | 31 (35.6%) |
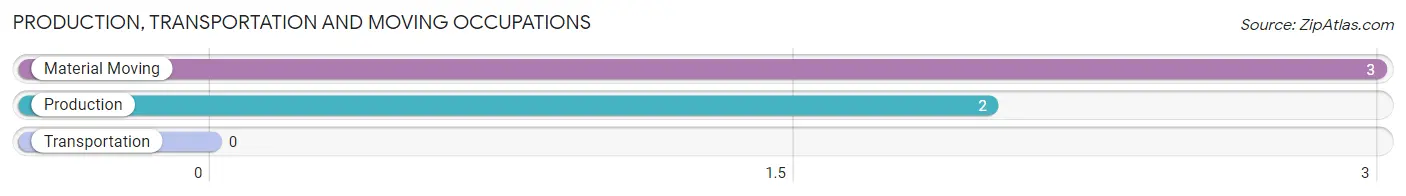
Production, Transportation and Moving Occupations
The most common Production, Transportation and Moving occupations in Mount Vernon are Material Moving (3 | 3.5%), and Production (2 | 2.3%).
Production, Transportation and Moving Occupations by Sex
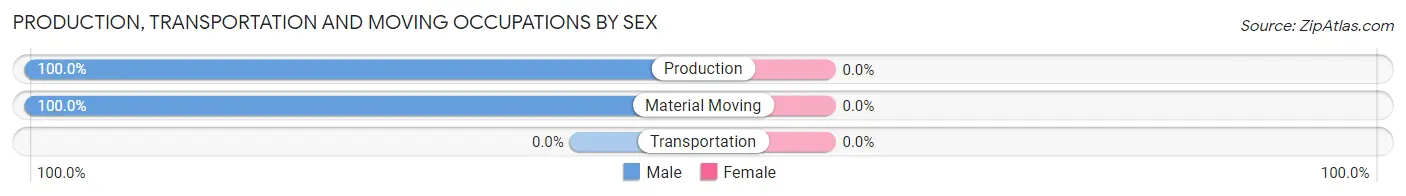
| Occupation | Male | Female |
| Production | 2 (100.0%) | 0 (0.0%) |
| Transportation | 0 (0.0%) | 0 (0.0%) |
| Material Moving | 3 (100.0%) | 0 (0.0%) |
| Total (Category) | 5 (100.0%) | 0 (0.0%) |
| Total (Overall) | 56 (64.4%) | 31 (35.6%) |
Employment Industries by Sex in Mount Vernon
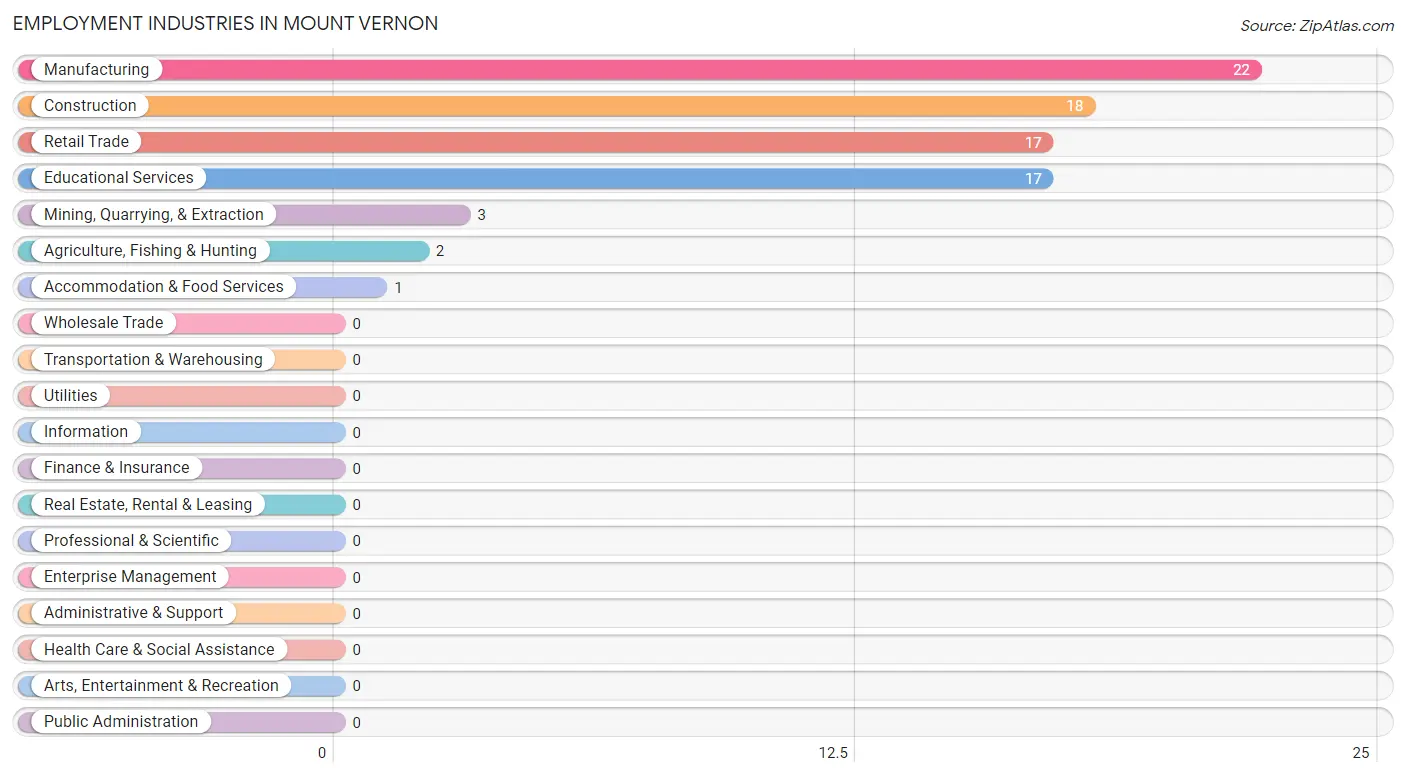
Employment Industries in Mount Vernon
The major employment industries in Mount Vernon include Manufacturing (22 | 25.3%), Construction (18 | 20.7%), Retail Trade (17 | 19.5%), Educational Services (17 | 19.5%), and Mining, Quarrying, & Extraction (3 | 3.5%).
Employment Industries by Sex in Mount Vernon
The Mount Vernon industries that see more men than women are Mining, Quarrying, & Extraction (100.0%), Construction (100.0%), and Manufacturing (100.0%), whereas the industries that tend to have a higher number of women are Educational Services (100.0%), Accommodation & Food Services (100.0%), and Retail Trade (70.6%).
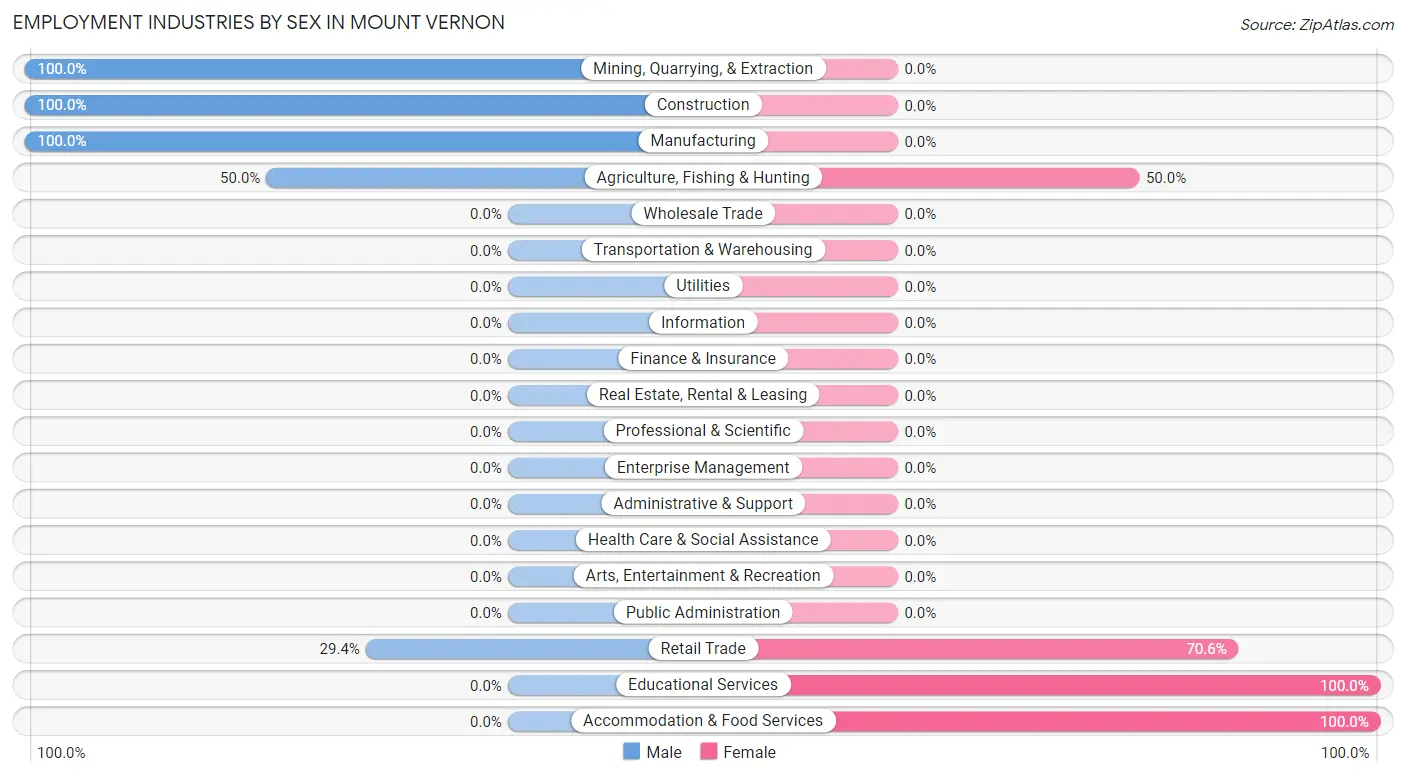
| Industry | Male | Female |
| Agriculture, Fishing & Hunting | 1 (50.0%) | 1 (50.0%) |
| Mining, Quarrying, & Extraction | 3 (100.0%) | 0 (0.0%) |
| Construction | 18 (100.0%) | 0 (0.0%) |
| Manufacturing | 22 (100.0%) | 0 (0.0%) |
| Wholesale Trade | 0 (0.0%) | 0 (0.0%) |
| Retail Trade | 5 (29.4%) | 12 (70.6%) |
| Transportation & Warehousing | 0 (0.0%) | 0 (0.0%) |
| Utilities | 0 (0.0%) | 0 (0.0%) |
| Information | 0 (0.0%) | 0 (0.0%) |
| Finance & Insurance | 0 (0.0%) | 0 (0.0%) |
| Real Estate, Rental & Leasing | 0 (0.0%) | 0 (0.0%) |
| Professional & Scientific | 0 (0.0%) | 0 (0.0%) |
| Enterprise Management | 0 (0.0%) | 0 (0.0%) |
| Administrative & Support | 0 (0.0%) | 0 (0.0%) |
| Educational Services | 0 (0.0%) | 17 (100.0%) |
| Health Care & Social Assistance | 0 (0.0%) | 0 (0.0%) |
| Arts, Entertainment & Recreation | 0 (0.0%) | 0 (0.0%) |
| Accommodation & Food Services | 0 (0.0%) | 1 (100.0%) |
| Public Administration | 0 (0.0%) | 0 (0.0%) |
| Total | 56 (64.4%) | 31 (35.6%) |
Education in Mount Vernon
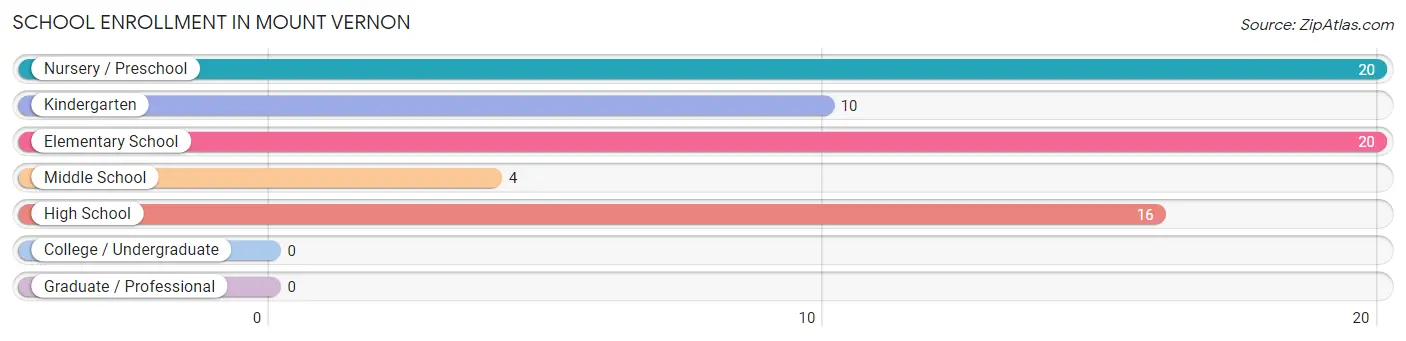
School Enrollment in Mount Vernon
The most common levels of schooling among the 70 students in Mount Vernon are nursery / preschool (20 | 28.6%), elementary school (20 | 28.6%), and high school (16 | 22.9%).
| School Level | # Students | % Students |
| Nursery / Preschool | 20 | 28.6% |
| Kindergarten | 10 | 14.3% |
| Elementary School | 20 | 28.6% |
| Middle School | 4 | 5.7% |
| High School | 16 | 22.9% |
| College / Undergraduate | 0 | 0.0% |
| Graduate / Professional | 0 | 0.0% |
| Total | 70 | 100.0% |
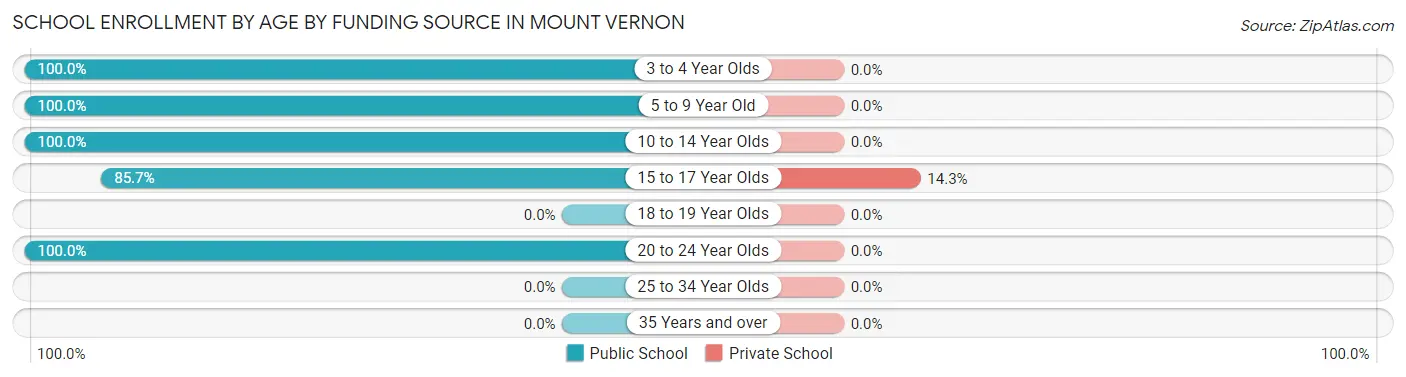
School Enrollment by Age by Funding Source in Mount Vernon
Out of a total of 70 students who are enrolled in schools in Mount Vernon, 2 (2.9%) attend a private institution, while the remaining 68 (97.1%) are enrolled in public schools. The age group of 15 to 17 year olds has the highest likelihood of being enrolled in private schools, with 2 (14.3% in the age bracket) enrolled. Conversely, the age group of 3 to 4 year olds has the lowest likelihood of being enrolled in a private school, with 20 (100.0% in the age bracket) attending a public institution.
| Age Bracket | Public School | Private School |
| 3 to 4 Year Olds | 20 (100.0%) | 0 (0.0%) |
| 5 to 9 Year Old | 30 (100.0%) | 0 (0.0%) |
| 10 to 14 Year Olds | 4 (100.0%) | 0 (0.0%) |
| 15 to 17 Year Olds | 12 (85.7%) | 2 (14.3%) |
| 18 to 19 Year Olds | 0 (0.0%) | 0 (0.0%) |
| 20 to 24 Year Olds | 2 (100.0%) | 0 (0.0%) |
| 25 to 34 Year Olds | 0 (0.0%) | 0 (0.0%) |
| 35 Years and over | 0 (0.0%) | 0 (0.0%) |
| Total | 68 (97.1%) | 2 (2.9%) |
Educational Attainment by Field of Study in Mount Vernon
Psychology (17 | 38.6%), social sciences (10 | 22.7%), liberal arts & history (10 | 22.7%), and science & technology (7 | 15.9%) are the most common fields of study among 44 individuals in Mount Vernon who have obtained a bachelor's degree or higher.
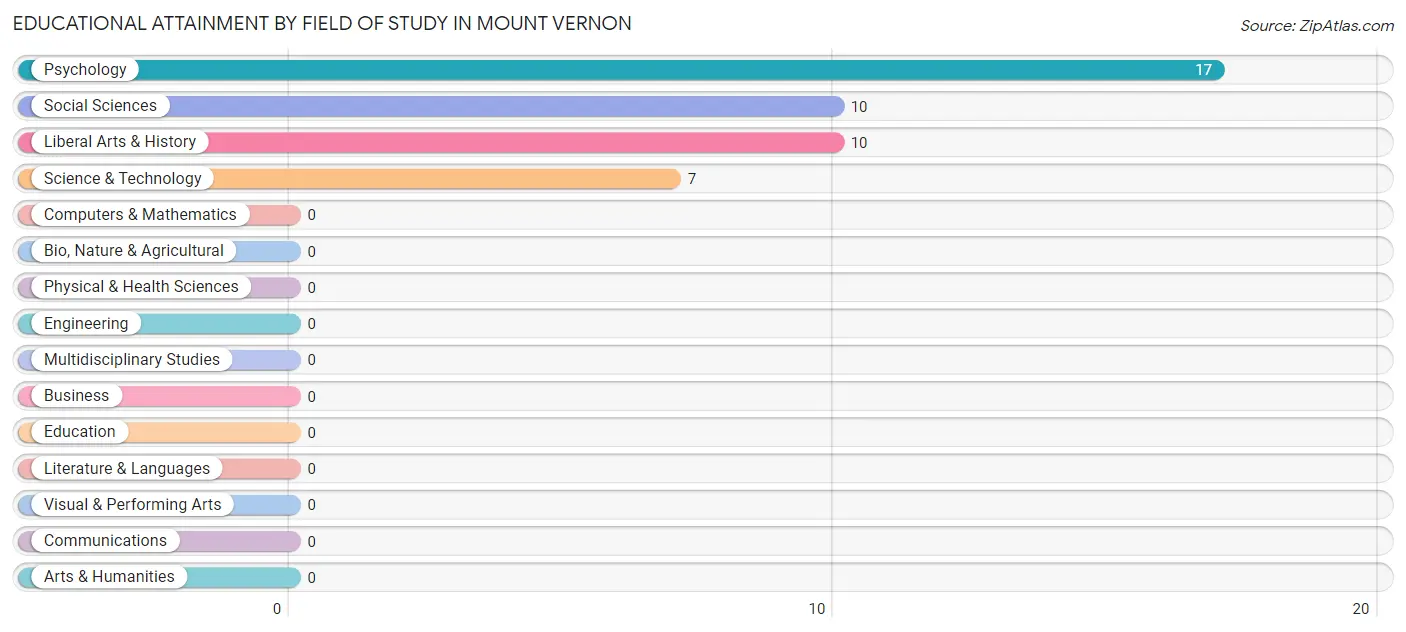
| Field of Study | # Graduates | % Graduates |
| Computers & Mathematics | 0 | 0.0% |
| Bio, Nature & Agricultural | 0 | 0.0% |
| Physical & Health Sciences | 0 | 0.0% |
| Psychology | 17 | 38.6% |
| Social Sciences | 10 | 22.7% |
| Engineering | 0 | 0.0% |
| Multidisciplinary Studies | 0 | 0.0% |
| Science & Technology | 7 | 15.9% |
| Business | 0 | 0.0% |
| Education | 0 | 0.0% |
| Literature & Languages | 0 | 0.0% |
| Liberal Arts & History | 10 | 22.7% |
| Visual & Performing Arts | 0 | 0.0% |
| Communications | 0 | 0.0% |
| Arts & Humanities | 0 | 0.0% |
| Total | 44 | 100.0% |
Transportation & Commute in Mount Vernon
Vehicle Availability by Sex in Mount Vernon
The most prevalent vehicle ownership categories in Mount Vernon are males with 3 vehicles (33, accounting for 58.9%) and females with 3 vehicles (12, making up 106.5%).
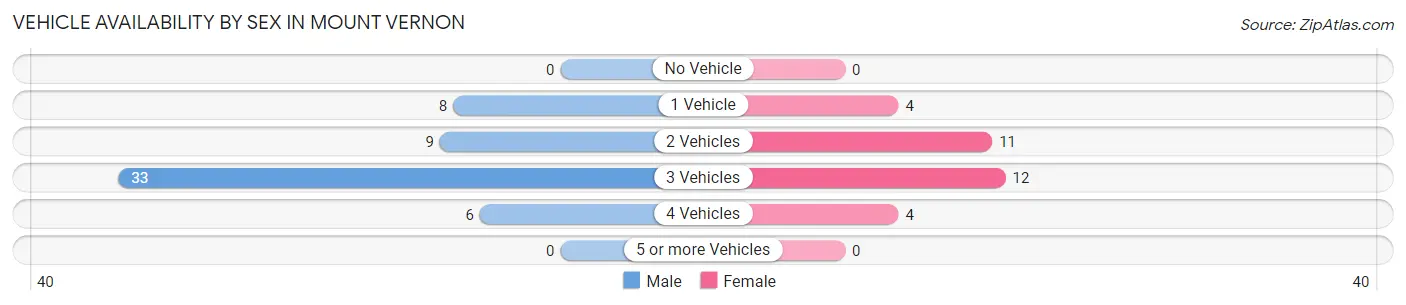
| Vehicles Available | Male | Female |
| No Vehicle | 0 (0.0%) | 0 (0.0%) |
| 1 Vehicle | 8 (14.3%) | 4 (12.9%) |
| 2 Vehicles | 9 (16.1%) | 11 (35.5%) |
| 3 Vehicles | 33 (58.9%) | 12 (38.7%) |
| 4 Vehicles | 6 (10.7%) | 4 (12.9%) |
| 5 or more Vehicles | 0 (0.0%) | 0 (0.0%) |
| Total | 56 (100.0%) | 31 (100.0%) |
Commute Time in Mount Vernon
The most frequently occuring commute durations in Mount Vernon are 30 to 34 minutes (20 commuters, 33.9%), less than 5 minutes (19 commuters, 32.2%), and 10 to 14 minutes (7 commuters, 11.9%).
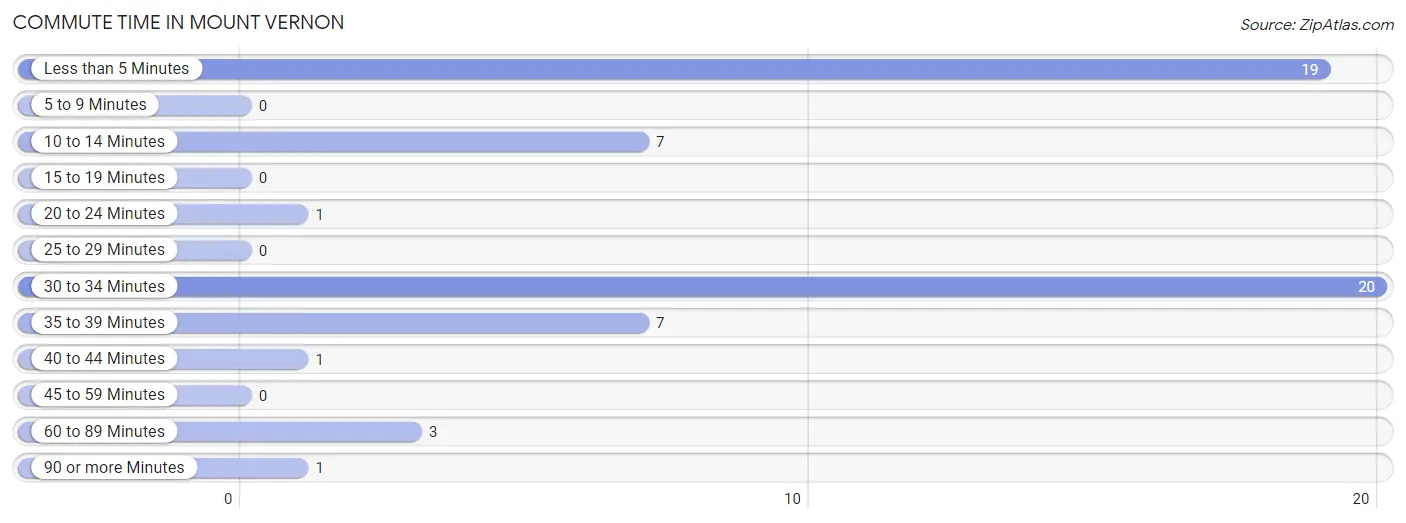
| Commute Time | # Commuters | % Commuters |
| Less than 5 Minutes | 19 | 32.2% |
| 5 to 9 Minutes | 0 | 0.0% |
| 10 to 14 Minutes | 7 | 11.9% |
| 15 to 19 Minutes | 0 | 0.0% |
| 20 to 24 Minutes | 1 | 1.7% |
| 25 to 29 Minutes | 0 | 0.0% |
| 30 to 34 Minutes | 20 | 33.9% |
| 35 to 39 Minutes | 7 | 11.9% |
| 40 to 44 Minutes | 1 | 1.7% |
| 45 to 59 Minutes | 0 | 0.0% |
| 60 to 89 Minutes | 3 | 5.1% |
| 90 or more Minutes | 1 | 1.7% |
Commute Time by Sex in Mount Vernon
The most common commute times in Mount Vernon are 30 to 34 minutes (19 commuters, 43.2%) for males and 10 to 14 minutes (7 commuters, 46.7%) for females.
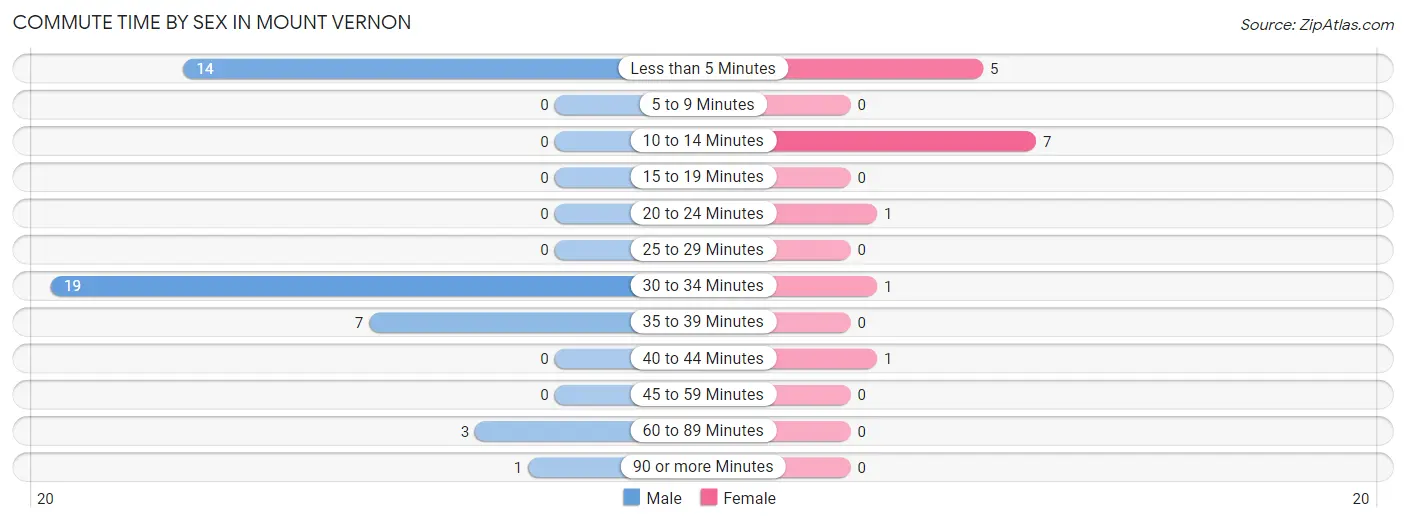
| Commute Time | Male | Female |
| Less than 5 Minutes | 14 (31.8%) | 5 (33.3%) |
| 5 to 9 Minutes | 0 (0.0%) | 0 (0.0%) |
| 10 to 14 Minutes | 0 (0.0%) | 7 (46.7%) |
| 15 to 19 Minutes | 0 (0.0%) | 0 (0.0%) |
| 20 to 24 Minutes | 0 (0.0%) | 1 (6.7%) |
| 25 to 29 Minutes | 0 (0.0%) | 0 (0.0%) |
| 30 to 34 Minutes | 19 (43.2%) | 1 (6.7%) |
| 35 to 39 Minutes | 7 (15.9%) | 0 (0.0%) |
| 40 to 44 Minutes | 0 (0.0%) | 1 (6.7%) |
| 45 to 59 Minutes | 0 (0.0%) | 0 (0.0%) |
| 60 to 89 Minutes | 3 (6.8%) | 0 (0.0%) |
| 90 or more Minutes | 1 (2.3%) | 0 (0.0%) |
Time of Departure to Work by Sex in Mount Vernon
The most frequent times of departure to work in Mount Vernon are 6:00 AM to 6:29 AM (18, 40.9%) for males and 7:00 AM to 7:29 AM (8, 53.3%) for females.
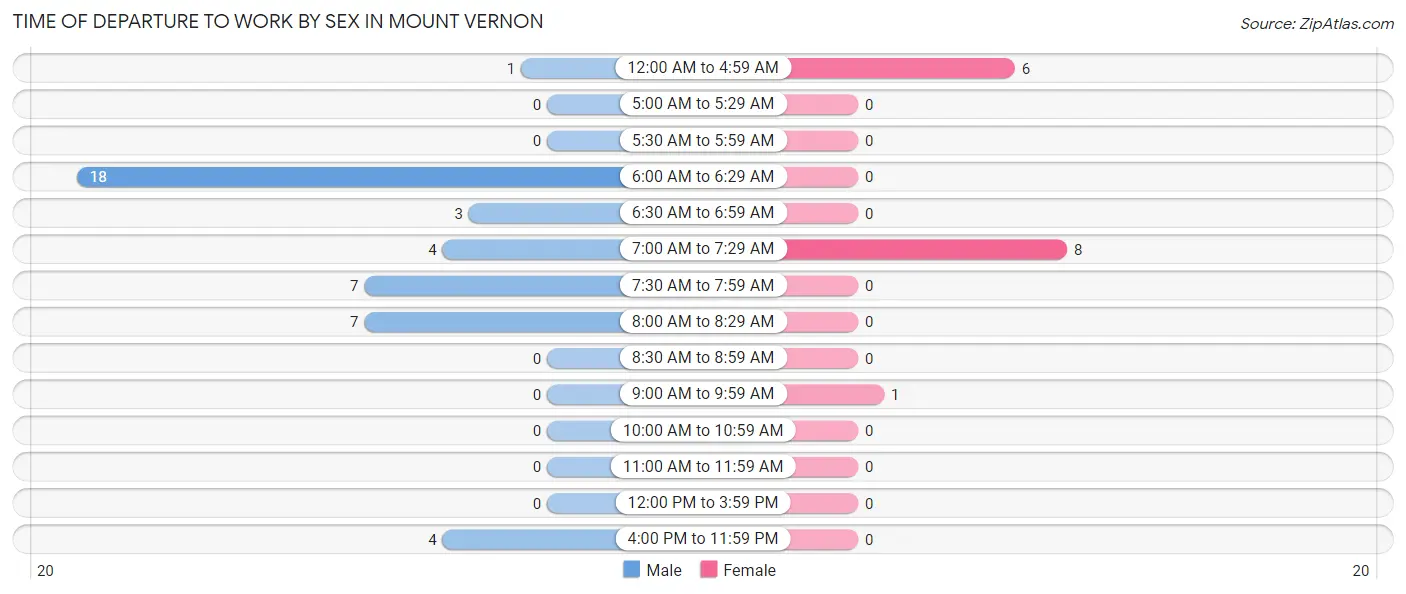
| Time of Departure | Male | Female |
| 12:00 AM to 4:59 AM | 1 (2.3%) | 6 (40.0%) |
| 5:00 AM to 5:29 AM | 0 (0.0%) | 0 (0.0%) |
| 5:30 AM to 5:59 AM | 0 (0.0%) | 0 (0.0%) |
| 6:00 AM to 6:29 AM | 18 (40.9%) | 0 (0.0%) |
| 6:30 AM to 6:59 AM | 3 (6.8%) | 0 (0.0%) |
| 7:00 AM to 7:29 AM | 4 (9.1%) | 8 (53.3%) |
| 7:30 AM to 7:59 AM | 7 (15.9%) | 0 (0.0%) |
| 8:00 AM to 8:29 AM | 7 (15.9%) | 0 (0.0%) |
| 8:30 AM to 8:59 AM | 0 (0.0%) | 0 (0.0%) |
| 9:00 AM to 9:59 AM | 0 (0.0%) | 1 (6.7%) |
| 10:00 AM to 10:59 AM | 0 (0.0%) | 0 (0.0%) |
| 11:00 AM to 11:59 AM | 0 (0.0%) | 0 (0.0%) |
| 12:00 PM to 3:59 PM | 0 (0.0%) | 0 (0.0%) |
| 4:00 PM to 11:59 PM | 4 (9.1%) | 0 (0.0%) |
| Total | 44 (100.0%) | 15 (100.0%) |
Housing Occupancy in Mount Vernon
Occupancy by Ownership in Mount Vernon
Of the total 73 dwellings in Mount Vernon, owner-occupied units account for 34 (46.6%), while renter-occupied units make up 39 (53.4%).
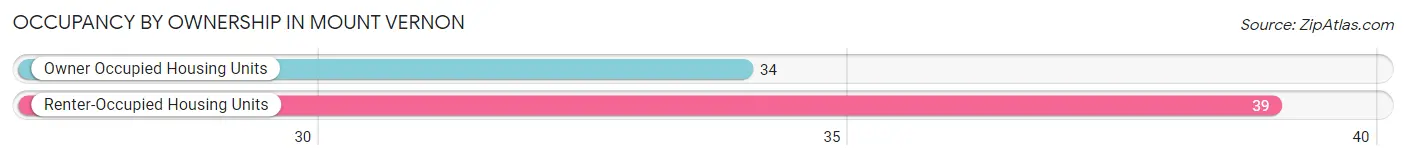
| Occupancy | # Housing Units | % Housing Units |
| Owner Occupied Housing Units | 34 | 46.6% |
| Renter-Occupied Housing Units | 39 | 53.4% |
| Total Occupied Housing Units | 73 | 100.0% |
Occupancy by Household Size in Mount Vernon
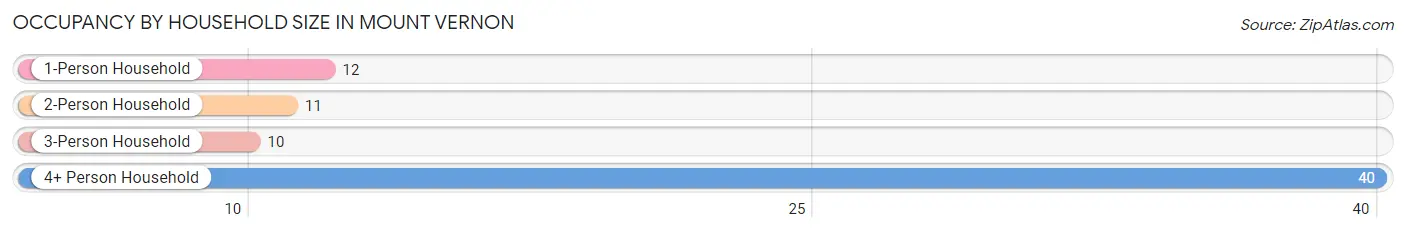
| Household Size | # Housing Units | % Housing Units |
| 1-Person Household | 12 | 16.4% |
| 2-Person Household | 11 | 15.1% |
| 3-Person Household | 10 | 13.7% |
| 4+ Person Household | 40 | 54.8% |
| Total Housing Units | 73 | 100.0% |
Occupancy by Ownership by Household Size in Mount Vernon
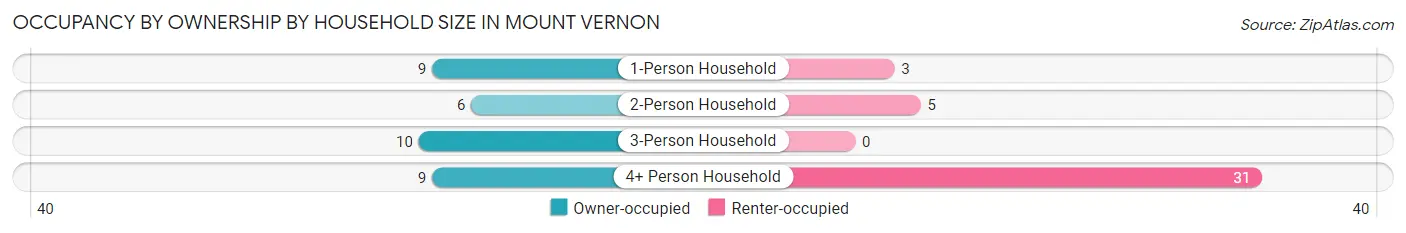
| Household Size | Owner-occupied | Renter-occupied |
| 1-Person Household | 9 (75.0%) | 3 (25.0%) |
| 2-Person Household | 6 (54.5%) | 5 (45.5%) |
| 3-Person Household | 10 (100.0%) | 0 (0.0%) |
| 4+ Person Household | 9 (22.5%) | 31 (77.5%) |
| Total Housing Units | 34 (46.6%) | 39 (53.4%) |
Occupancy by Educational Attainment in Mount Vernon
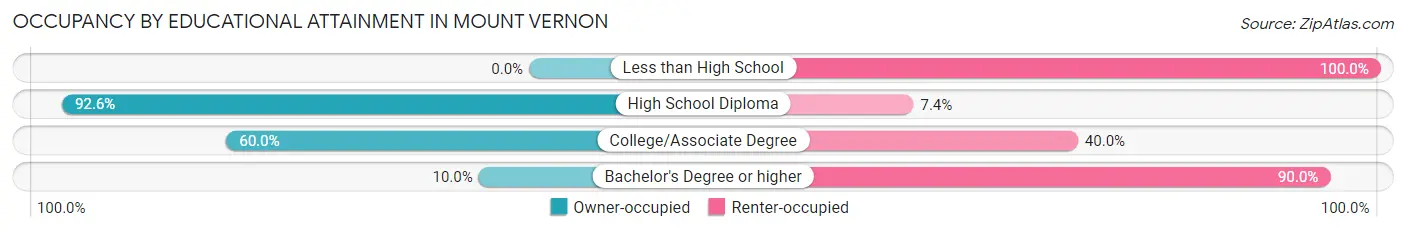
| Household Size | Owner-occupied | Renter-occupied |
| Less than High School | 0 (0.0%) | 6 (100.0%) |
| High School Diploma | 25 (92.6%) | 2 (7.4%) |
| College/Associate Degree | 6 (60.0%) | 4 (40.0%) |
| Bachelor's Degree or higher | 3 (10.0%) | 27 (90.0%) |
Occupancy by Age of Householder in Mount Vernon
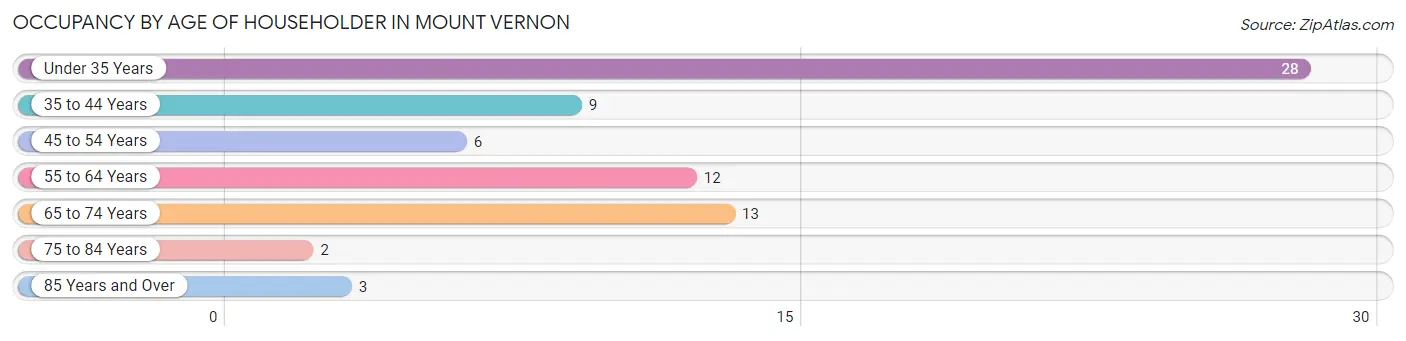
| Age Bracket | # Households | % Households |
| Under 35 Years | 28 | 38.4% |
| 35 to 44 Years | 9 | 12.3% |
| 45 to 54 Years | 6 | 8.2% |
| 55 to 64 Years | 12 | 16.4% |
| 65 to 74 Years | 13 | 17.8% |
| 75 to 84 Years | 2 | 2.7% |
| 85 Years and Over | 3 | 4.1% |
| Total | 73 | 100.0% |
Housing Finances in Mount Vernon
Median Income by Occupancy in Mount Vernon
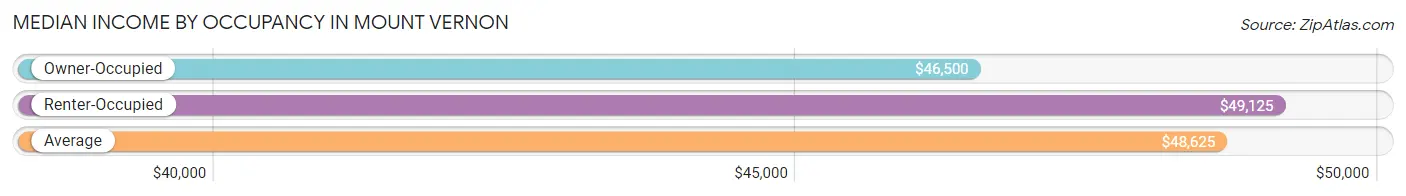
| Occupancy Type | # Households | Median Income |
| Owner-Occupied | 34 (46.6%) | $46,500 |
| Renter-Occupied | 39 (53.4%) | $49,125 |
| Average | 73 (100.0%) | $48,625 |
Occupancy by Householder Income Bracket in Mount Vernon
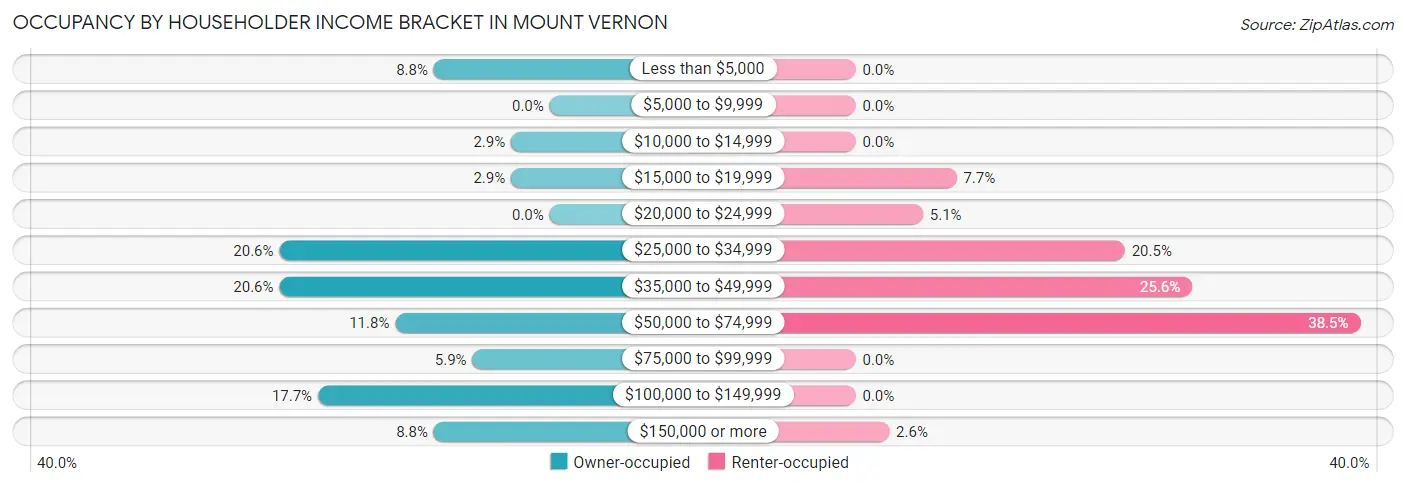
| Income Bracket | Owner-occupied | Renter-occupied |
| Less than $5,000 | 3 (8.8%) | 0 (0.0%) |
| $5,000 to $9,999 | 0 (0.0%) | 0 (0.0%) |
| $10,000 to $14,999 | 1 (2.9%) | 0 (0.0%) |
| $15,000 to $19,999 | 1 (2.9%) | 3 (7.7%) |
| $20,000 to $24,999 | 0 (0.0%) | 2 (5.1%) |
| $25,000 to $34,999 | 7 (20.6%) | 8 (20.5%) |
| $35,000 to $49,999 | 7 (20.6%) | 10 (25.6%) |
| $50,000 to $74,999 | 4 (11.8%) | 15 (38.5%) |
| $75,000 to $99,999 | 2 (5.9%) | 0 (0.0%) |
| $100,000 to $149,999 | 6 (17.6%) | 0 (0.0%) |
| $150,000 or more | 3 (8.8%) | 1 (2.6%) |
| Total | 34 (100.0%) | 39 (100.0%) |
Monthly Housing Cost Tiers in Mount Vernon
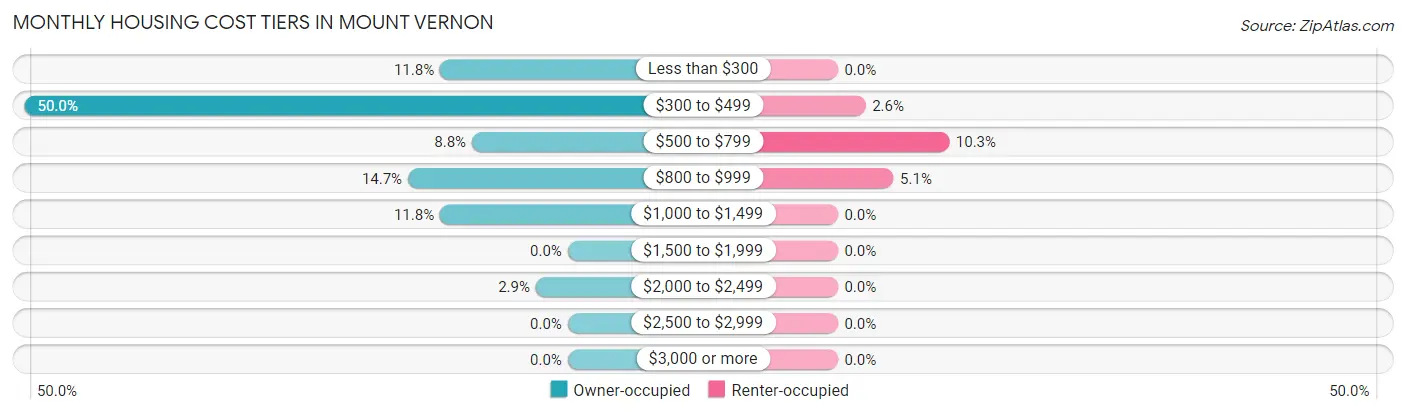
| Monthly Cost | Owner-occupied | Renter-occupied |
| Less than $300 | 4 (11.8%) | 0 (0.0%) |
| $300 to $499 | 17 (50.0%) | 1 (2.6%) |
| $500 to $799 | 3 (8.8%) | 4 (10.3%) |
| $800 to $999 | 5 (14.7%) | 2 (5.1%) |
| $1,000 to $1,499 | 4 (11.8%) | 0 (0.0%) |
| $1,500 to $1,999 | 0 (0.0%) | 0 (0.0%) |
| $2,000 to $2,499 | 1 (2.9%) | 0 (0.0%) |
| $2,500 to $2,999 | 0 (0.0%) | 0 (0.0%) |
| $3,000 or more | 0 (0.0%) | 0 (0.0%) |
| Total | 34 (100.0%) | 39 (100.0%) |
Physical Housing Characteristics in Mount Vernon
Housing Structures in Mount Vernon
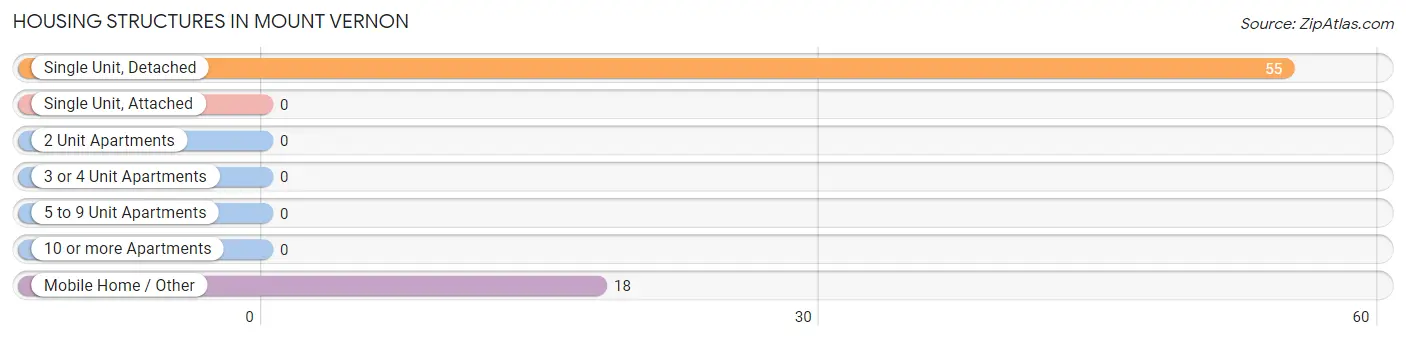
| Structure Type | # Housing Units | % Housing Units |
| Single Unit, Detached | 55 | 75.3% |
| Single Unit, Attached | 0 | 0.0% |
| 2 Unit Apartments | 0 | 0.0% |
| 3 or 4 Unit Apartments | 0 | 0.0% |
| 5 to 9 Unit Apartments | 0 | 0.0% |
| 10 or more Apartments | 0 | 0.0% |
| Mobile Home / Other | 18 | 24.7% |
| Total | 73 | 100.0% |
Housing Structures by Occupancy in Mount Vernon
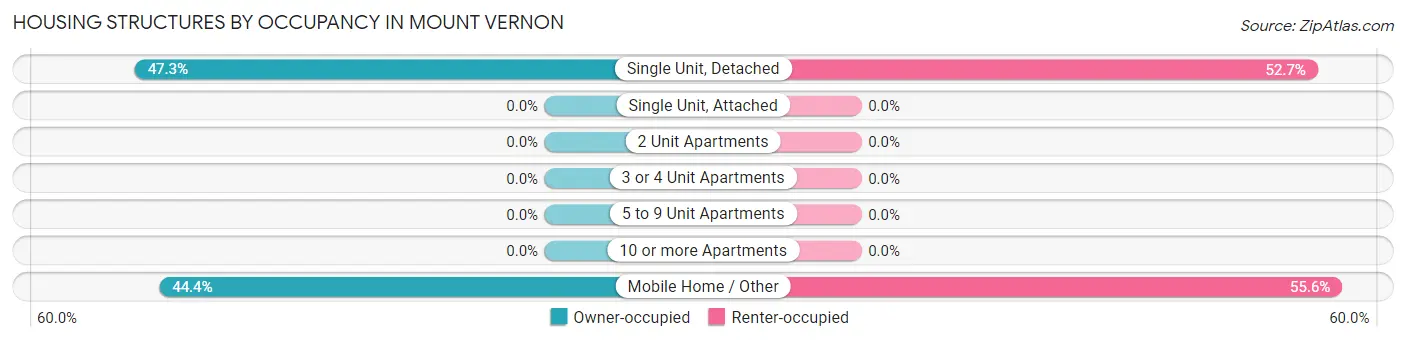
| Structure Type | Owner-occupied | Renter-occupied |
| Single Unit, Detached | 26 (47.3%) | 29 (52.7%) |
| Single Unit, Attached | 0 (0.0%) | 0 (0.0%) |
| 2 Unit Apartments | 0 (0.0%) | 0 (0.0%) |
| 3 or 4 Unit Apartments | 0 (0.0%) | 0 (0.0%) |
| 5 to 9 Unit Apartments | 0 (0.0%) | 0 (0.0%) |
| 10 or more Apartments | 0 (0.0%) | 0 (0.0%) |
| Mobile Home / Other | 8 (44.4%) | 10 (55.6%) |
| Total | 34 (46.6%) | 39 (53.4%) |
Housing Structures by Number of Rooms in Mount Vernon
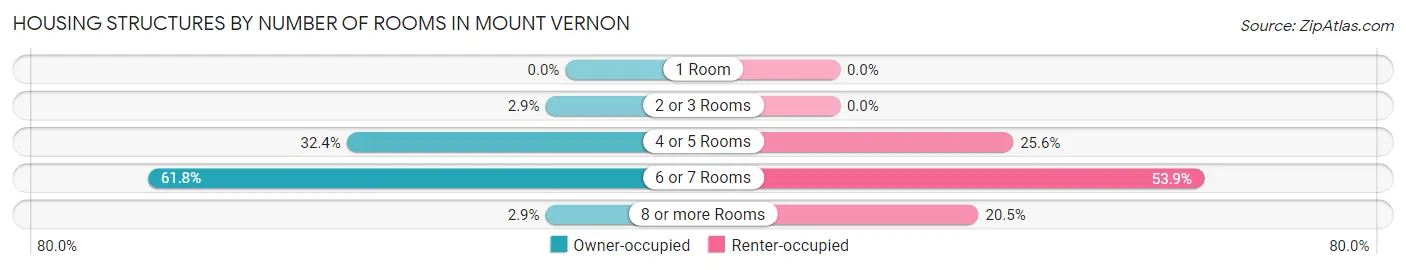
| Number of Rooms | Owner-occupied | Renter-occupied |
| 1 Room | 0 (0.0%) | 0 (0.0%) |
| 2 or 3 Rooms | 1 (2.9%) | 0 (0.0%) |
| 4 or 5 Rooms | 11 (32.4%) | 10 (25.6%) |
| 6 or 7 Rooms | 21 (61.8%) | 21 (53.8%) |
| 8 or more Rooms | 1 (2.9%) | 8 (20.5%) |
| Total | 34 (100.0%) | 39 (100.0%) |
Housing Structure by Heating Type in Mount Vernon
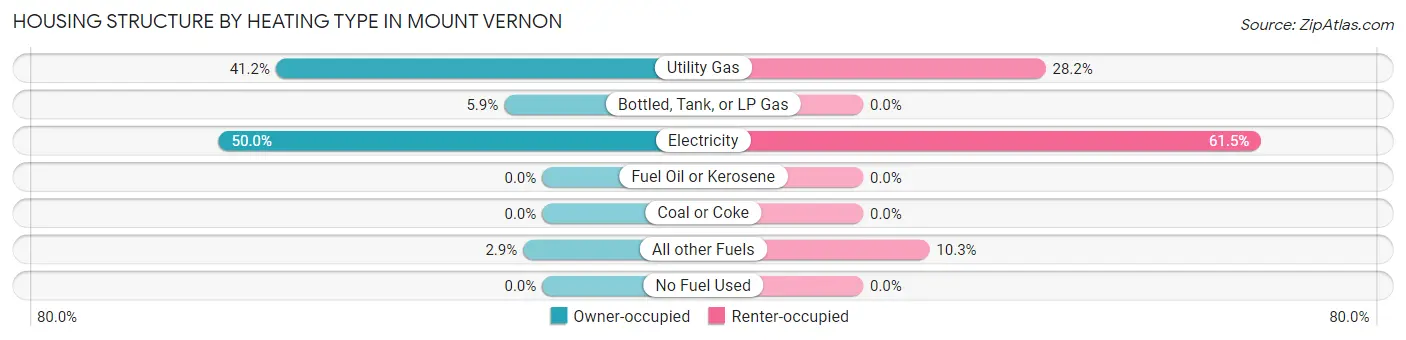
| Heating Type | Owner-occupied | Renter-occupied |
| Utility Gas | 14 (41.2%) | 11 (28.2%) |
| Bottled, Tank, or LP Gas | 2 (5.9%) | 0 (0.0%) |
| Electricity | 17 (50.0%) | 24 (61.5%) |
| Fuel Oil or Kerosene | 0 (0.0%) | 0 (0.0%) |
| Coal or Coke | 0 (0.0%) | 0 (0.0%) |
| All other Fuels | 1 (2.9%) | 4 (10.3%) |
| No Fuel Used | 0 (0.0%) | 0 (0.0%) |
| Total | 34 (100.0%) | 39 (100.0%) |
Household Vehicle Usage in Mount Vernon
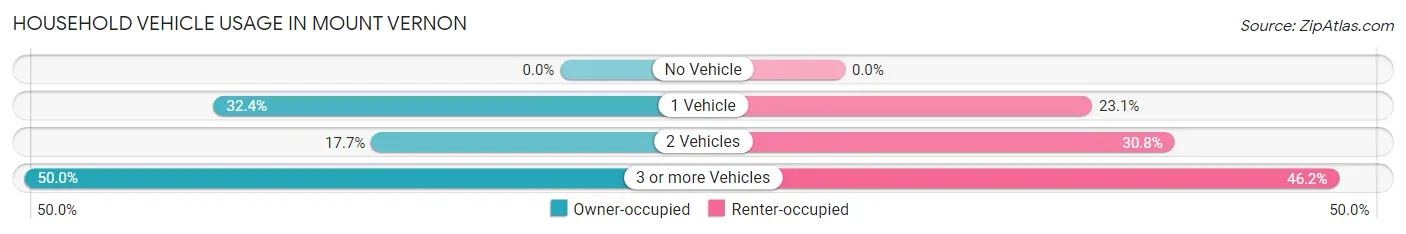
| Vehicles per Household | Owner-occupied | Renter-occupied |
| No Vehicle | 0 (0.0%) | 0 (0.0%) |
| 1 Vehicle | 11 (32.4%) | 9 (23.1%) |
| 2 Vehicles | 6 (17.6%) | 12 (30.8%) |
| 3 or more Vehicles | 17 (50.0%) | 18 (46.2%) |
| Total | 34 (100.0%) | 39 (100.0%) |
Real Estate & Mortgages in Mount Vernon
Real Estate and Mortgage Overview in Mount Vernon
| Characteristic | Without Mortgage | With Mortgage |
| Housing Units | 21 | 13 |
| Median Property Value | $110,400 | $97,500 |
| Median Household Income | $45,750 | $3 |
| Monthly Housing Costs | $355 | $0 |
| Real Estate Taxes | $622 | $0 |
Property Value by Mortgage Status in Mount Vernon
| Property Value | Without Mortgage | With Mortgage |
| Less than $50,000 | 3 (14.3%) | 2 (15.4%) |
| $50,000 to $99,999 | 5 (23.8%) | 6 (46.2%) |
| $100,000 to $299,999 | 12 (57.1%) | 4 (30.8%) |
| $300,000 to $499,999 | 1 (4.8%) | 1 (7.7%) |
| $500,000 to $749,999 | 0 (0.0%) | 0 (0.0%) |
| $750,000 to $999,999 | 0 (0.0%) | 0 (0.0%) |
| $1,000,000 or more | 0 (0.0%) | 0 (0.0%) |
| Total | 21 (100.0%) | 13 (100.0%) |
Household Income by Mortgage Status in Mount Vernon
| Household Income | Without Mortgage | With Mortgage |
| Less than $10,000 | 0 (0.0%) | 0 (0.0%) |
| $10,000 to $24,999 | 2 (9.5%) | 3 (23.1%) |
| $25,000 to $34,999 | 5 (23.8%) | 0 (0.0%) |
| $35,000 to $49,999 | 7 (33.3%) | 2 (15.4%) |
| $50,000 to $74,999 | 0 (0.0%) | 0 (0.0%) |
| $75,000 to $99,999 | 1 (4.8%) | 4 (30.8%) |
| $100,000 to $149,999 | 6 (28.6%) | 1 (7.7%) |
| $150,000 or more | 0 (0.0%) | 0 (0.0%) |
| Total | 21 (100.0%) | 13 (100.0%) |
Property Value to Household Income Ratio in Mount Vernon
| Value-to-Income Ratio | Without Mortgage | With Mortgage |
| Less than 2.0x | 14 (66.7%) | 65,938 (507,215.4%) |
| 2.0x to 2.9x | 0 (0.0%) | 5 (38.5%) |
| 3.0x to 3.9x | 0 (0.0%) | 4 (30.8%) |
| 4.0x or more | 7 (33.3%) | 0 (0.0%) |
| Total | 21 (100.0%) | 13 (100.0%) |
Real Estate Taxes by Mortgage Status in Mount Vernon
| Property Taxes | Without Mortgage | With Mortgage |
| Less than $800 | 18 (85.7%) | 3 (23.1%) |
| $800 to $1,499 | 2 (9.5%) | 9 (69.2%) |
| $800 to $1,499 | 0 (0.0%) | 3 (23.1%) |
| Total | 21 (100.0%) | 13 (100.0%) |
Health & Disability in Mount Vernon
Health Insurance Coverage by Age in Mount Vernon
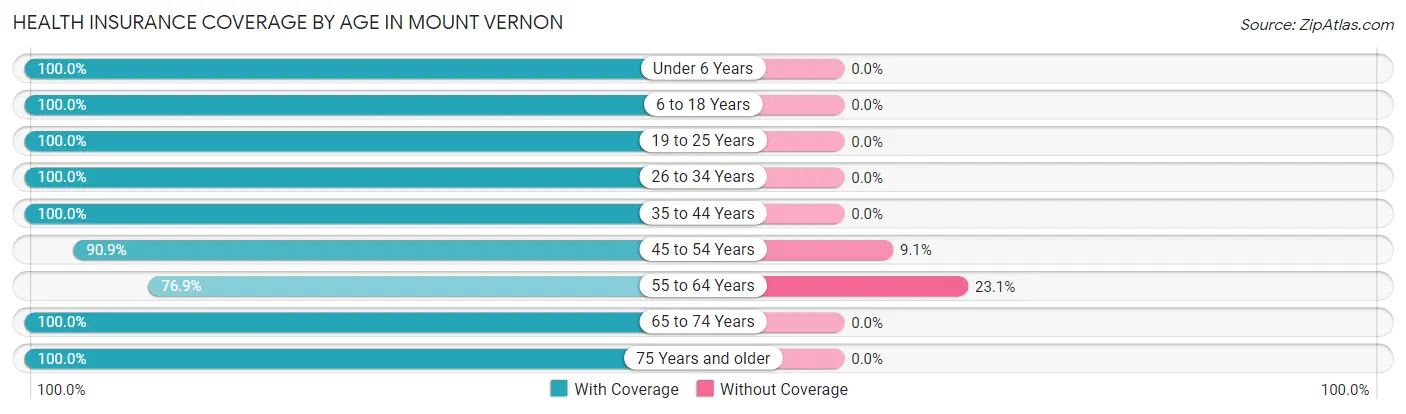
| Age Bracket | With Coverage | Without Coverage |
| Under 6 Years | 76 (100.0%) | 0 (0.0%) |
| 6 to 18 Years | 49 (100.0%) | 0 (0.0%) |
| 19 to 25 Years | 3 (100.0%) | 0 (0.0%) |
| 26 to 34 Years | 45 (100.0%) | 0 (0.0%) |
| 35 to 44 Years | 29 (100.0%) | 0 (0.0%) |
| 45 to 54 Years | 20 (90.9%) | 2 (9.1%) |
| 55 to 64 Years | 20 (76.9%) | 6 (23.1%) |
| 65 to 74 Years | 19 (100.0%) | 0 (0.0%) |
| 75 Years and older | 8 (100.0%) | 0 (0.0%) |
| Total | 269 (97.1%) | 8 (2.9%) |
Health Insurance Coverage by Citizenship Status in Mount Vernon
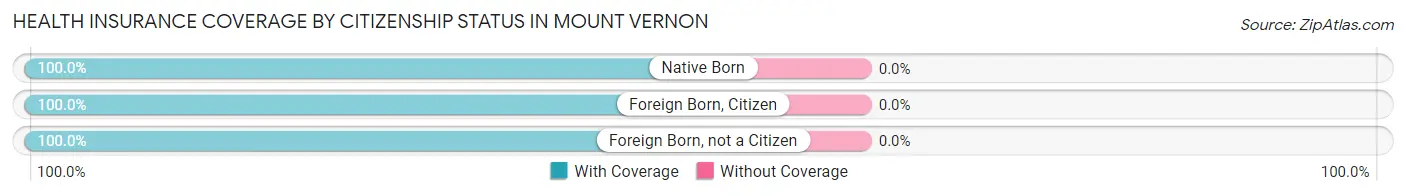
| Citizenship Status | With Coverage | Without Coverage |
| Native Born | 76 (100.0%) | 0 (0.0%) |
| Foreign Born, Citizen | 49 (100.0%) | 0 (0.0%) |
| Foreign Born, not a Citizen | 3 (100.0%) | 0 (0.0%) |
Health Insurance Coverage by Household Income in Mount Vernon
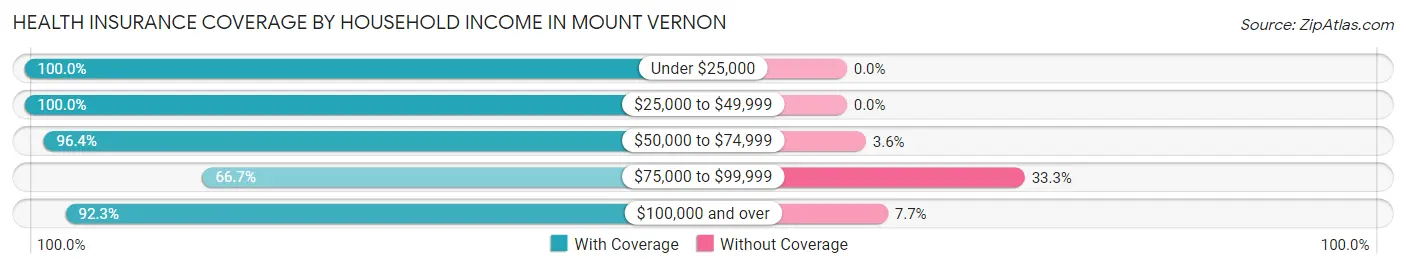
| Household Income | With Coverage | Without Coverage |
| Under $25,000 | 16 (100.0%) | 0 (0.0%) |
| $25,000 to $49,999 | 132 (100.0%) | 0 (0.0%) |
| $50,000 to $74,999 | 81 (96.4%) | 3 (3.6%) |
| $75,000 to $99,999 | 4 (66.7%) | 2 (33.3%) |
| $100,000 and over | 36 (92.3%) | 3 (7.7%) |
Public vs Private Health Insurance Coverage by Age in Mount Vernon
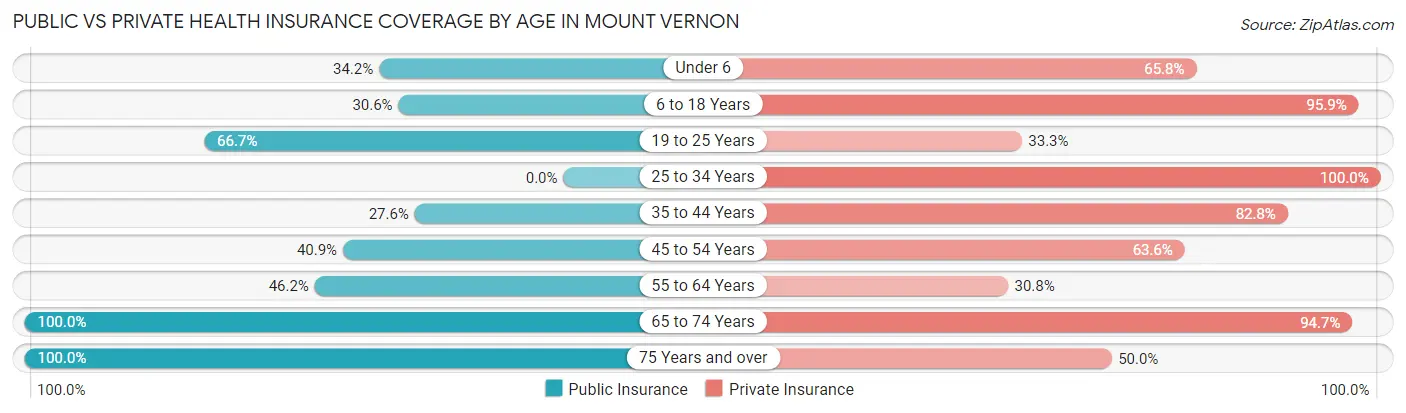
| Age Bracket | Public Insurance | Private Insurance |
| Under 6 | 26 (34.2%) | 50 (65.8%) |
| 6 to 18 Years | 15 (30.6%) | 47 (95.9%) |
| 19 to 25 Years | 2 (66.7%) | 1 (33.3%) |
| 25 to 34 Years | 0 (0.0%) | 45 (100.0%) |
| 35 to 44 Years | 8 (27.6%) | 24 (82.8%) |
| 45 to 54 Years | 9 (40.9%) | 14 (63.6%) |
| 55 to 64 Years | 12 (46.2%) | 8 (30.8%) |
| 65 to 74 Years | 19 (100.0%) | 18 (94.7%) |
| 75 Years and over | 8 (100.0%) | 4 (50.0%) |
| Total | 99 (35.7%) | 211 (76.2%) |
Disability Status by Sex by Age in Mount Vernon
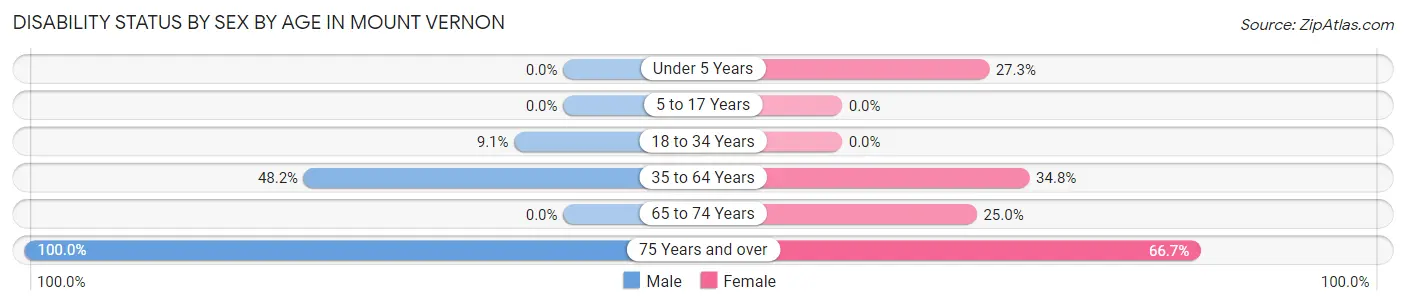
| Age Bracket | Male | Female |
| Under 5 Years | 0 (0.0%) | 3 (27.3%) |
| 5 to 17 Years | 0 (0.0%) | 0 (0.0%) |
| 18 to 34 Years | 2 (9.1%) | 0 (0.0%) |
| 35 to 64 Years | 26 (48.1%) | 8 (34.8%) |
| 65 to 74 Years | 0 (0.0%) | 3 (25.0%) |
| 75 Years and over | 5 (100.0%) | 2 (66.7%) |
Disability Class by Sex by Age in Mount Vernon
Disability Class: Hearing Difficulty
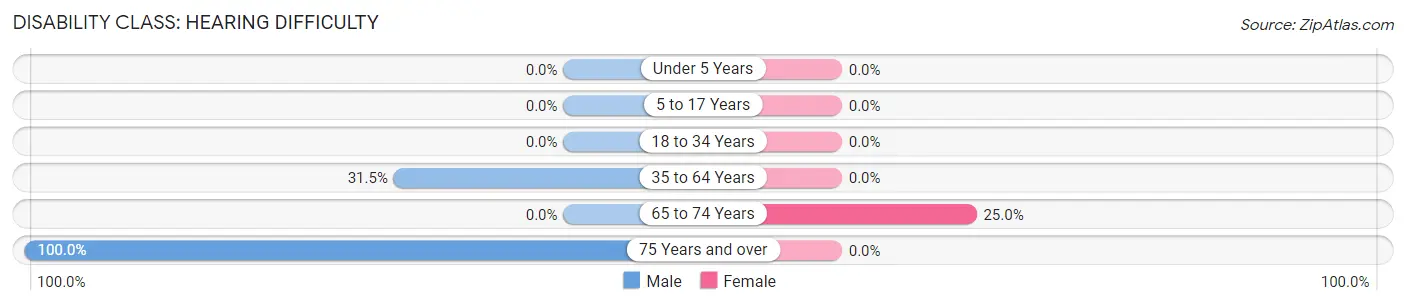
| Age Bracket | Male | Female |
| Under 5 Years | 0 (0.0%) | 0 (0.0%) |
| 5 to 17 Years | 0 (0.0%) | 0 (0.0%) |
| 18 to 34 Years | 0 (0.0%) | 0 (0.0%) |
| 35 to 64 Years | 17 (31.5%) | 0 (0.0%) |
| 65 to 74 Years | 0 (0.0%) | 3 (25.0%) |
| 75 Years and over | 5 (100.0%) | 0 (0.0%) |
Disability Class: Vision Difficulty
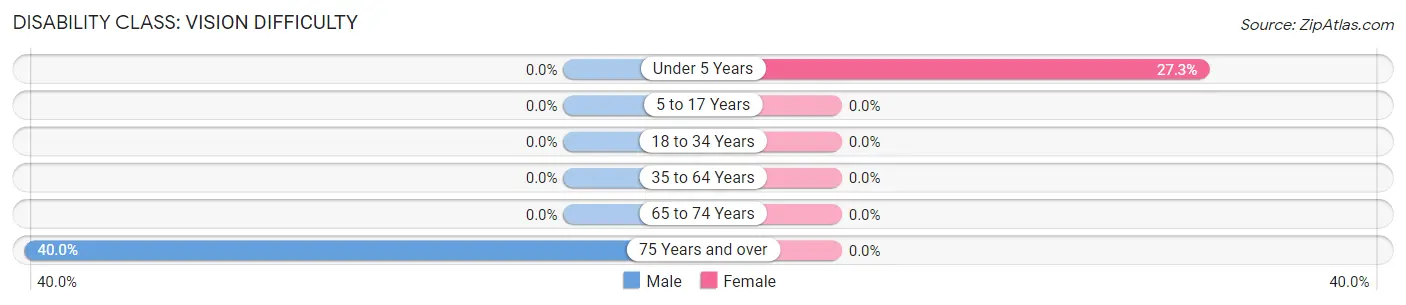
| Age Bracket | Male | Female |
| Under 5 Years | 0 (0.0%) | 3 (27.3%) |
| 5 to 17 Years | 0 (0.0%) | 0 (0.0%) |
| 18 to 34 Years | 0 (0.0%) | 0 (0.0%) |
| 35 to 64 Years | 0 (0.0%) | 0 (0.0%) |
| 65 to 74 Years | 0 (0.0%) | 0 (0.0%) |
| 75 Years and over | 2 (40.0%) | 0 (0.0%) |
Disability Class: Cognitive Difficulty
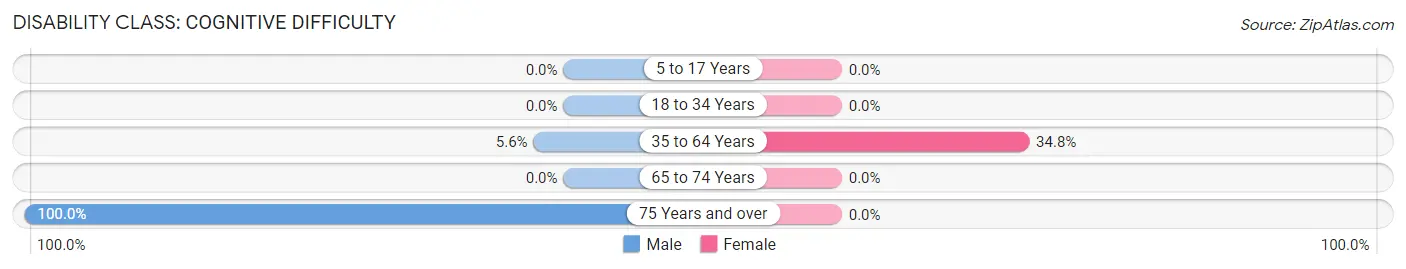
| Age Bracket | Male | Female |
| 5 to 17 Years | 0 (0.0%) | 0 (0.0%) |
| 18 to 34 Years | 0 (0.0%) | 0 (0.0%) |
| 35 to 64 Years | 3 (5.6%) | 8 (34.8%) |
| 65 to 74 Years | 0 (0.0%) | 0 (0.0%) |
| 75 Years and over | 5 (100.0%) | 0 (0.0%) |
Disability Class: Ambulatory Difficulty
| Age Bracket | Male | Female |
| 5 to 17 Years | 0 (0.0%) | 0 (0.0%) |
| 18 to 34 Years | 0 (0.0%) | 0 (0.0%) |
| 35 to 64 Years | 11 (20.4%) | 0 (0.0%) |
| 65 to 74 Years | 0 (0.0%) | 0 (0.0%) |
| 75 Years and over | 5 (100.0%) | 2 (66.7%) |
Disability Class: Self-Care Difficulty
| Age Bracket | Male | Female |
| 5 to 17 Years | 0 (0.0%) | 0 (0.0%) |
| 18 to 34 Years | 0 (0.0%) | 0 (0.0%) |
| 35 to 64 Years | 0 (0.0%) | 0 (0.0%) |
| 65 to 74 Years | 0 (0.0%) | 0 (0.0%) |
| 75 Years and over | 2 (40.0%) | 0 (0.0%) |
Technology Access in Mount Vernon
Computing Device Access in Mount Vernon
| Device Type | # Households | % Households |
| Desktop or Laptop | 55 | 75.3% |
| Smartphone | 58 | 79.4% |
| Tablet | 44 | 60.3% |
| No Computing Device | 11 | 15.1% |
| Total | 73 | 100.0% |
Internet Access in Mount Vernon
| Internet Type | # Households | % Households |
| Dial-Up Internet | 2 | 2.7% |
| Broadband Home | 36 | 49.3% |
| Cellular Data Only | 2 | 2.7% |
| Satellite Internet | 2 | 2.7% |
| No Internet | 24 | 32.9% |
| Total | 73 | 100.0% |
Mount Vernon Summary
Introduction
Mount Vernon is a small city located in the northwest corner of Arkansas in the United States. It is the county seat of Lawrence County and is part of the Fayetteville-Springdale-Rogers Metropolitan Statistical Area. The city has a population of 1,845 as of the 2010 census. The city is known for its historic downtown area, which is home to a variety of businesses, restaurants, and other attractions.
History
Mount Vernon was founded in 1876 by a group of settlers from the nearby town of Smithville. The town was named after the nearby Mount Vernon Springs, which were named after George Washington's home in Virginia. The town was incorporated in 1883 and quickly grew to become a thriving community. The town was home to a variety of businesses, including a sawmill, a gristmill, a cotton gin, and a blacksmith shop.
In the early 1900s, the town began to experience a period of growth and prosperity. The town was home to a variety of businesses, including a bank, a hotel, a movie theater, and a variety of stores. The town also had a variety of churches, including the First Baptist Church, which was founded in 1883.
In the late 1950s, the town began to experience a period of decline. The sawmill and gristmill closed, and the cotton gin was destroyed by a fire. The town's population began to decline, and by the 1970s, the town was in danger of becoming a ghost town.
In the late 1970s, the town began to experience a period of revitalization. The downtown area was renovated, and new businesses began to open. The town also began to attract tourists, and the population began to increase. Today, Mount Vernon is a thriving community with a variety of businesses, restaurants, and other attractions.
Geography
Mount Vernon is located in the northwest corner of Arkansas in the United States. The city is situated in the Ozark Mountains and is surrounded by rolling hills and forests. The city is located at the intersection of U.S. Route 412 and Arkansas Highway 59. The city is located approximately 30 miles east of Fayetteville and 40 miles west of Little Rock.
The city has a total area of 2.2 square miles, all of which is land. The city is located at an elevation of 1,072 feet above sea level. The city is located in a humid subtropical climate zone and experiences hot, humid summers and mild winters.
Economy
The economy of Mount Vernon is largely based on tourism and agriculture. The city is home to a variety of businesses, including restaurants, retail stores, and other attractions. The city is also home to a variety of agricultural businesses, including farms, ranches, and nurseries.
The city is also home to a variety of manufacturing businesses, including a furniture factory and a plastics factory. The city is also home to a variety of service businesses, including a hospital, a nursing home, and a variety of other medical facilities.
Demographics
As of the 2010 census, the city had a population of 1,845. The racial makeup of the city was 95.2% White, 0.7% African American, 0.3% Native American, 0.2% Asian, 0.1% Pacific Islander, 1.7% from other races, and 1.8% from two or more races. Hispanic or Latino of any race were 3.2% of the population.
The median income for a household in the city was $30,938, and the median income for a family was $37,500. The per capita income for the city was $17,845. About 16.2% of families and 19.2% of the population were below the poverty line, including 25.2% of those under age 18 and 11.2% of those age 65 or over.
Conclusion
Mount Vernon is a small city located in the northwest corner of Arkansas in the United States. The city has a population of 1,845 as of the 2010 census and is known for its historic downtown area. The city has a variety of businesses, restaurants, and other attractions. The economy of the city is largely based on tourism and agriculture, and the city is home to a variety of manufacturing and service businesses. The city has a diverse population, with a median income of $30,938 and a poverty rate of 16.2%.
Common Questions
What is Per Capita Income in Mount Vernon?
Per Capita income in Mount Vernon is $15,976.
What is the Median Family Income in Mount Vernon?
Median Family Income in Mount Vernon is $53,750.
What is the Median Household income in Mount Vernon?
Median Household Income in Mount Vernon is $48,625.
What is Inequality or Gini Index in Mount Vernon?
Inequality or Gini Index in Mount Vernon is 0.37.
What is the Total Population of Mount Vernon?
Total Population of Mount Vernon is 277.
What is the Total Male Population of Mount Vernon?
Total Male Population of Mount Vernon is 174.
What is the Total Female Population of Mount Vernon?
Total Female Population of Mount Vernon is 103.
What is the Ratio of Males per 100 Females in Mount Vernon?
There are 168.93 Males per 100 Females in Mount Vernon.
What is the Ratio of Females per 100 Males in Mount Vernon?
There are 59.20 Females per 100 Males in Mount Vernon.
What is the Median Population Age in Mount Vernon?
Median Population Age in Mount Vernon is 30.6 Years.
What is the Average Family Size in Mount Vernon
Average Family Size in Mount Vernon is 4.3 People.
What is the Average Household Size in Mount Vernon
Average Household Size in Mount Vernon is 3.8 People.
How Large is the Labor Force in Mount Vernon?
There are 92 People in the Labor Forcein in Mount Vernon.
What is the Percentage of People in the Labor Force in Mount Vernon?
58.2% of People are in the Labor Force in Mount Vernon.
What is the Unemployment Rate in Mount Vernon?
Unemployment Rate in Mount Vernon is 5.4%.