Hollister, MO Map & Demographics
Hollister Map
Hollister Overview
$22,944
PER CAPITA INCOME
$60,227
AVG FAMILY INCOME
$51,578
AVG HOUSEHOLD INCOME
5.1%
WAGE / INCOME GAP [ % ]
94.9¢/ $1
WAGE / INCOME GAP [ $ ]
$4,306
FAMILY INCOME DEFICIT
0.36
INEQUALITY / GINI INDEX
4,585
TOTAL POPULATION
2,034
MALE POPULATION
2,551
FEMALE POPULATION
79.73
MALES / 100 FEMALES
125.42
FEMALES / 100 MALES
35.8
MEDIAN AGE
3.0
AVG FAMILY SIZE
2.5
AVG HOUSEHOLD SIZE
2,179
LABOR FORCE [ PEOPLE ]
61.2%
PERCENT IN LABOR FORCE
7.5%
UNEMPLOYMENT RATE
Hollister Zip Codes
Hollister Area Codes
Income in Hollister
Income Overview in Hollister
Per Capita Income in Hollister is $22,944, while median incomes of families and households are $60,227 and $51,578 respectively.
| Characteristic | Number | Measure |
| Per Capita Income | 4,585 | $22,944 |
| Median Family Income | 1,279 | $60,227 |
| Mean Family Income | 1,279 | $67,877 |
| Median Household Income | 1,797 | $51,578 |
| Mean Household Income | 1,797 | $56,270 |
| Income Deficit | 1,279 | $4,306 |
| Wage / Income Gap (%) | 4,585 | 5.11% |
| Wage / Income Gap ($) | 4,585 | 94.89¢ per $1 |
| Gini / Inequality Index | 4,585 | 0.36 |
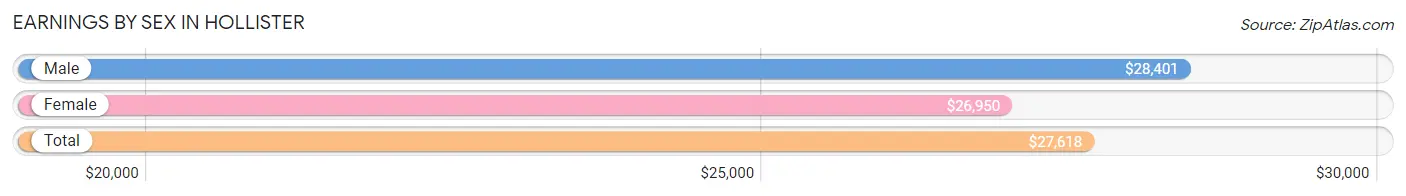
Earnings by Sex in Hollister
Average Earnings in Hollister are $27,618, $28,401 for men and $26,950 for women, a difference of 5.1%.
| Sex | Number | Average Earnings |
| Male | 1,151 (51.0%) | $28,401 |
| Female | 1,106 (49.0%) | $26,950 |
| Total | 2,257 (100.0%) | $27,618 |
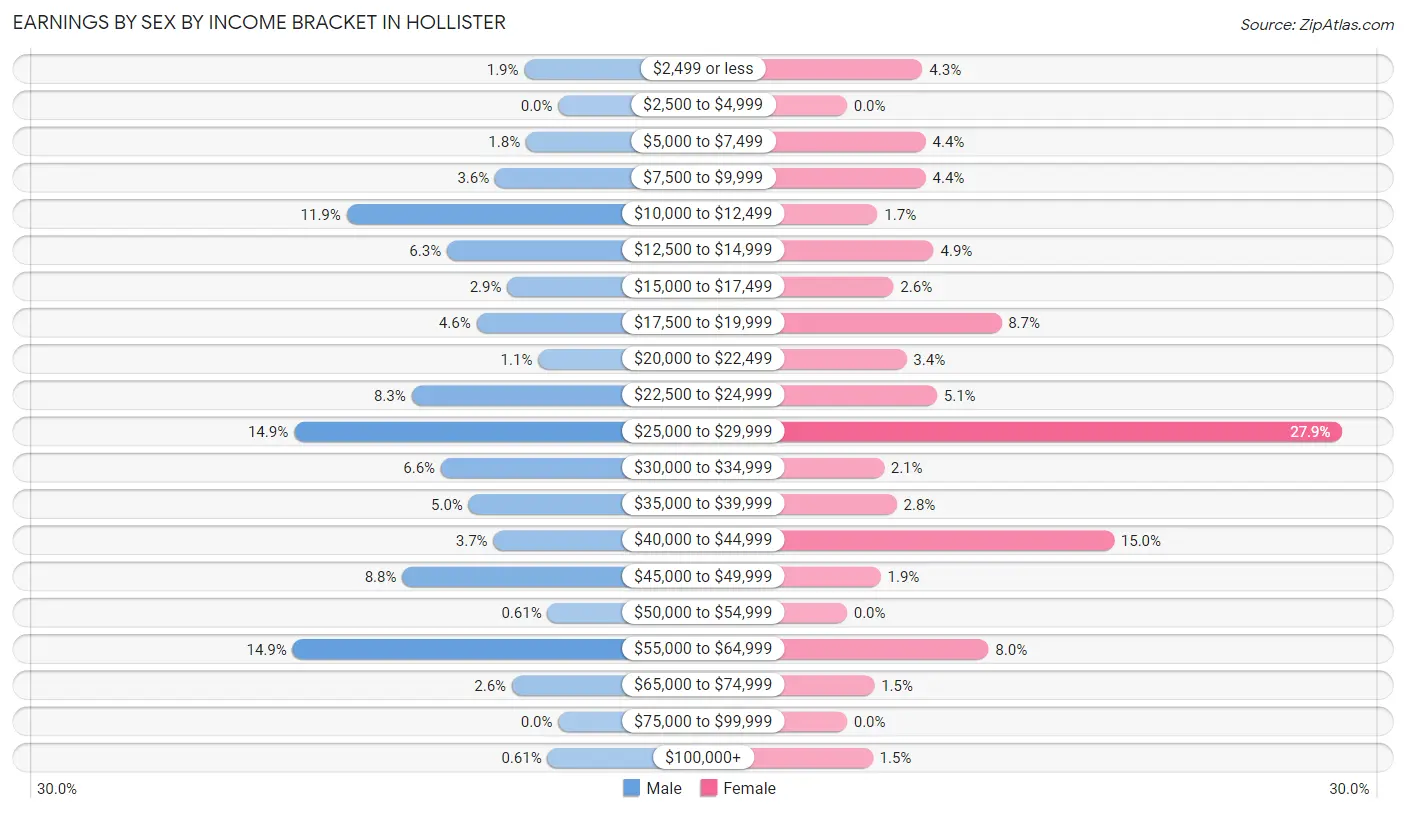
Earnings by Sex by Income Bracket in Hollister
The most common earnings brackets in Hollister are $55,000 to $64,999 for men (172 | 14.9%) and $25,000 to $29,999 for women (308 | 27.9%).
| Income | Male | Female |
| $2,499 or less | 22 (1.9%) | 47 (4.3%) |
| $2,500 to $4,999 | 0 (0.0%) | 0 (0.0%) |
| $5,000 to $7,499 | 21 (1.8%) | 49 (4.4%) |
| $7,500 to $9,999 | 41 (3.6%) | 49 (4.4%) |
| $10,000 to $12,499 | 137 (11.9%) | 19 (1.7%) |
| $12,500 to $14,999 | 72 (6.3%) | 54 (4.9%) |
| $15,000 to $17,499 | 33 (2.9%) | 29 (2.6%) |
| $17,500 to $19,999 | 53 (4.6%) | 96 (8.7%) |
| $20,000 to $22,499 | 13 (1.1%) | 37 (3.4%) |
| $22,500 to $24,999 | 95 (8.3%) | 56 (5.1%) |
| $25,000 to $29,999 | 171 (14.9%) | 308 (27.9%) |
| $30,000 to $34,999 | 76 (6.6%) | 23 (2.1%) |
| $35,000 to $39,999 | 58 (5.0%) | 31 (2.8%) |
| $40,000 to $44,999 | 42 (3.6%) | 166 (15.0%) |
| $45,000 to $49,999 | 101 (8.8%) | 21 (1.9%) |
| $50,000 to $54,999 | 7 (0.6%) | 0 (0.0%) |
| $55,000 to $64,999 | 172 (14.9%) | 88 (8.0%) |
| $65,000 to $74,999 | 30 (2.6%) | 17 (1.5%) |
| $75,000 to $99,999 | 0 (0.0%) | 0 (0.0%) |
| $100,000+ | 7 (0.6%) | 16 (1.5%) |
| Total | 1,151 (100.0%) | 1,106 (100.0%) |
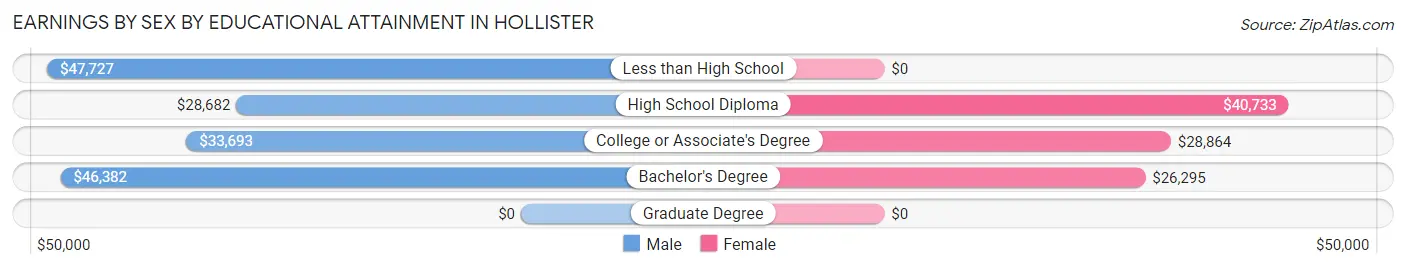
Earnings by Sex by Educational Attainment in Hollister
Average earnings in Hollister are $29,932 for men and $28,316 for women, a difference of 5.4%. Men with an educational attainment of less than high school enjoy the highest average annual earnings of $47,727, while those with high school diploma education earn the least with $28,682. Women with an educational attainment of high school diploma earn the most with the average annual earnings of $40,733, while those with bachelor's degree education have the smallest earnings of $26,295.
| Educational Attainment | Male Income | Female Income |
| Less than High School | $47,727 | $0 |
| High School Diploma | $28,682 | $40,733 |
| College or Associate's Degree | $33,693 | $28,864 |
| Bachelor's Degree | $46,382 | $26,295 |
| Graduate Degree | - | - |
| Total | $29,932 | $28,316 |
Family Income in Hollister
Family Income Brackets in Hollister
According to the Hollister family income data, there are 510 families falling into the $50,000 to $74,999 income range, which is the most common income bracket and makes up 39.9% of all families.
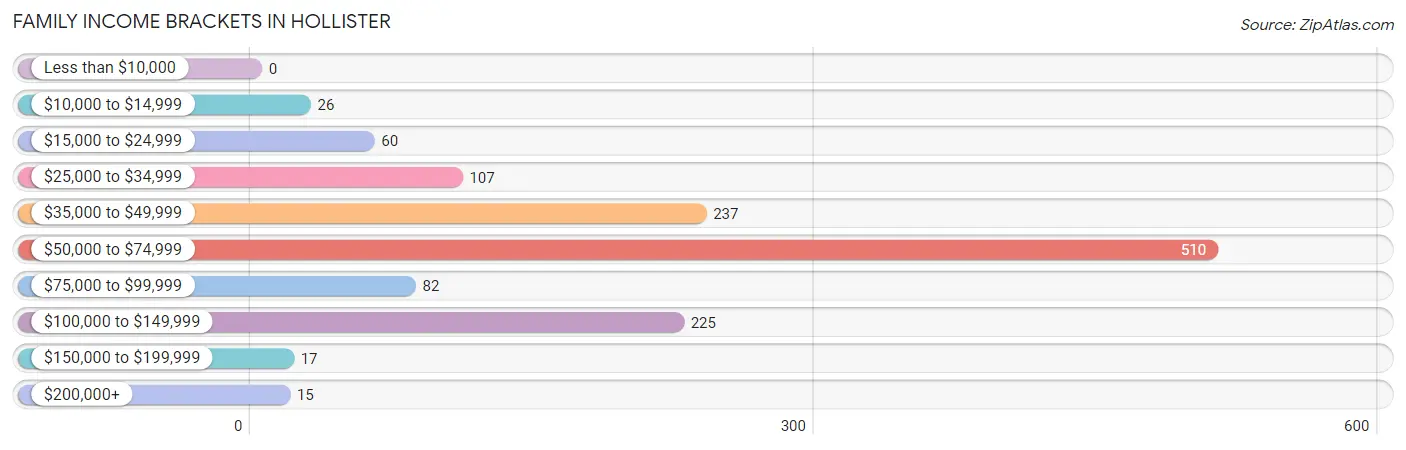
| Income Bracket | # Families | % Families |
| Less than $10,000 | 0 | 0.0% |
| $10,000 to $14,999 | 26 | 2.0% |
| $15,000 to $24,999 | 60 | 4.7% |
| $25,000 to $34,999 | 107 | 8.4% |
| $35,000 to $49,999 | 237 | 18.5% |
| $50,000 to $74,999 | 510 | 39.9% |
| $75,000 to $99,999 | 82 | 6.4% |
| $100,000 to $149,999 | 225 | 17.6% |
| $150,000 to $199,999 | 17 | 1.3% |
| $200,000+ | 15 | 1.2% |
Family Income by Famaliy Size in Hollister
4-person families (171 | 13.4%) account for the highest median family income in Hollister with $98,322 per family, while 2-person families (550 | 43.0%) have the highest median income of $29,405 per family member.
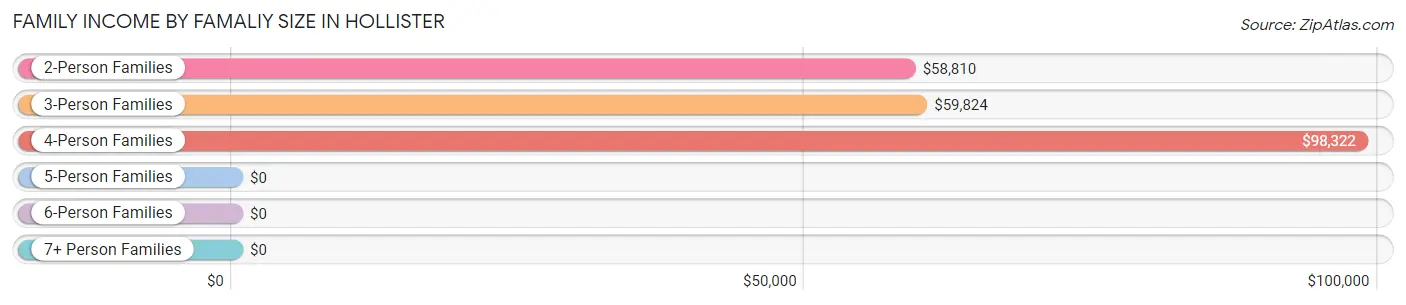
| Income Bracket | # Families | Median Income |
| 2-Person Families | 550 (43.0%) | $58,810 |
| 3-Person Families | 406 (31.7%) | $59,824 |
| 4-Person Families | 171 (13.4%) | $98,322 |
| 5-Person Families | 63 (4.9%) | $0 |
| 6-Person Families | 89 (7.0%) | $0 |
| 7+ Person Families | 0 (0.0%) | $0 |
| Total | 1,279 (100.0%) | $60,227 |
Family Income by Number of Earners in Hollister
The median family income in Hollister is $60,227, with families comprising 3+ earners (168) having the highest median family income of $126,696, while families with 1 earner (424) have the lowest median family income of $38,724, accounting for 13.1% and 33.2% of families, respectively.
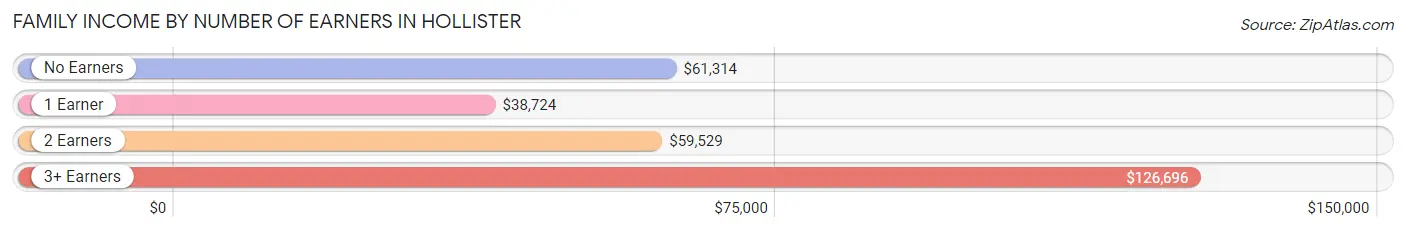
| Number of Earners | # Families | Median Income |
| No Earners | 315 (24.6%) | $61,314 |
| 1 Earner | 424 (33.2%) | $38,724 |
| 2 Earners | 372 (29.1%) | $59,529 |
| 3+ Earners | 168 (13.1%) | $126,696 |
| Total | 1,279 (100.0%) | $60,227 |
Household Income in Hollister
Household Income Brackets in Hollister
With 591 households falling in the category, the $50,000 to $74,999 income range is the most frequent in Hollister, accounting for 32.9% of all households. In contrast, only 14 households (0.8%) fall into the $200,000+ income bracket, making it the least populous group.
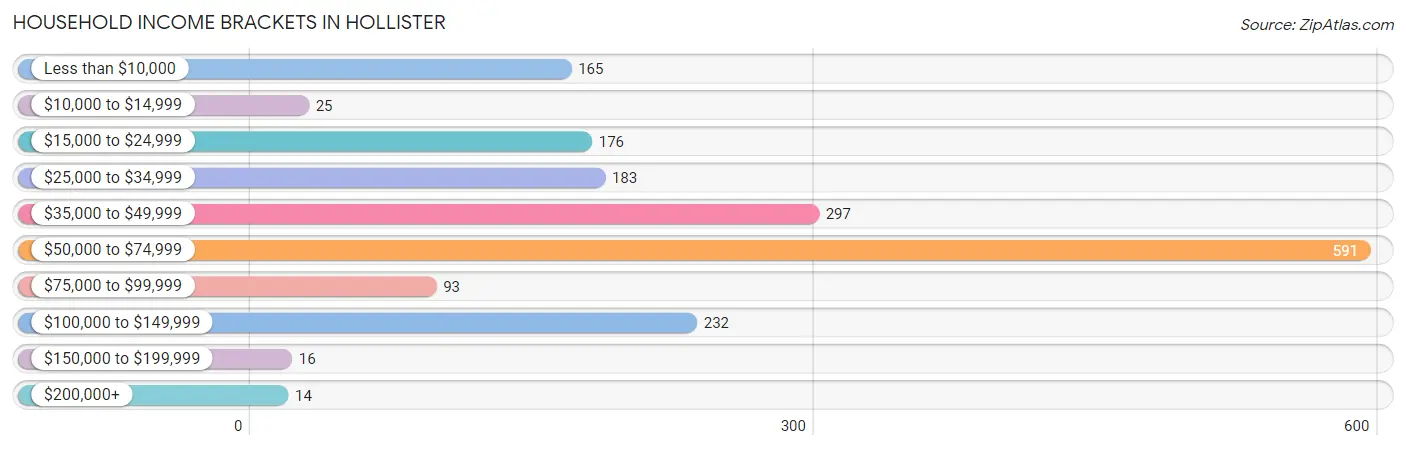
| Income Bracket | # Households | % Households |
| Less than $10,000 | 165 | 9.2% |
| $10,000 to $14,999 | 25 | 1.4% |
| $15,000 to $24,999 | 176 | 9.8% |
| $25,000 to $34,999 | 183 | 10.2% |
| $35,000 to $49,999 | 297 | 16.5% |
| $50,000 to $74,999 | 591 | 32.9% |
| $75,000 to $99,999 | 93 | 5.2% |
| $100,000 to $149,999 | 232 | 12.9% |
| $150,000 to $199,999 | 16 | 0.9% |
| $200,000+ | 14 | 0.8% |
Household Income by Householder Age in Hollister
The median household income in Hollister is $51,578, with the highest median household income of $61,339 found in the 45 to 64 years age bracket for the primary householder. A total of 663 households (36.9%) fall into this category. Meanwhile, the 65+ years age bracket for the primary householder has the lowest median household income of $31,250, with 424 households (23.6%) in this group.
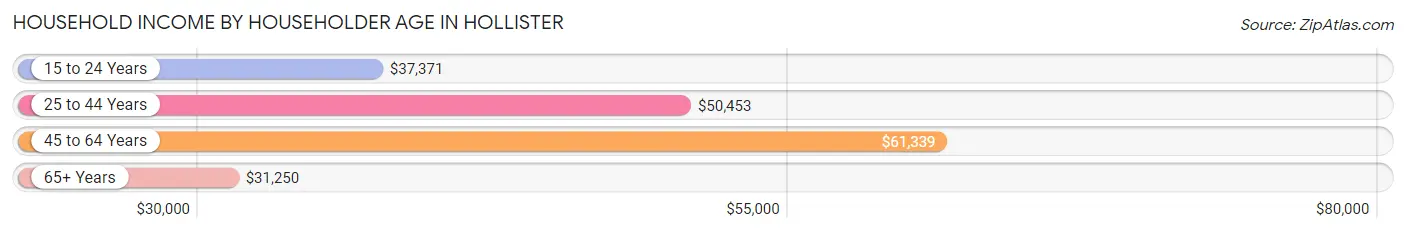
| Income Bracket | # Households | Median Income |
| 15 to 24 Years | 177 (9.9%) | $37,371 |
| 25 to 44 Years | 533 (29.7%) | $50,453 |
| 45 to 64 Years | 663 (36.9%) | $61,339 |
| 65+ Years | 424 (23.6%) | $31,250 |
| Total | 1,797 (100.0%) | $51,578 |
Poverty in Hollister
Income Below Poverty by Sex and Age in Hollister
With 12.4% poverty level for males and 11.8% for females among the residents of Hollister, 15 year old males and 65 to 74 year old females are the most vulnerable to poverty, with 20 males (100.0%) and 65 females (34.2%) in their respective age groups living below the poverty level.
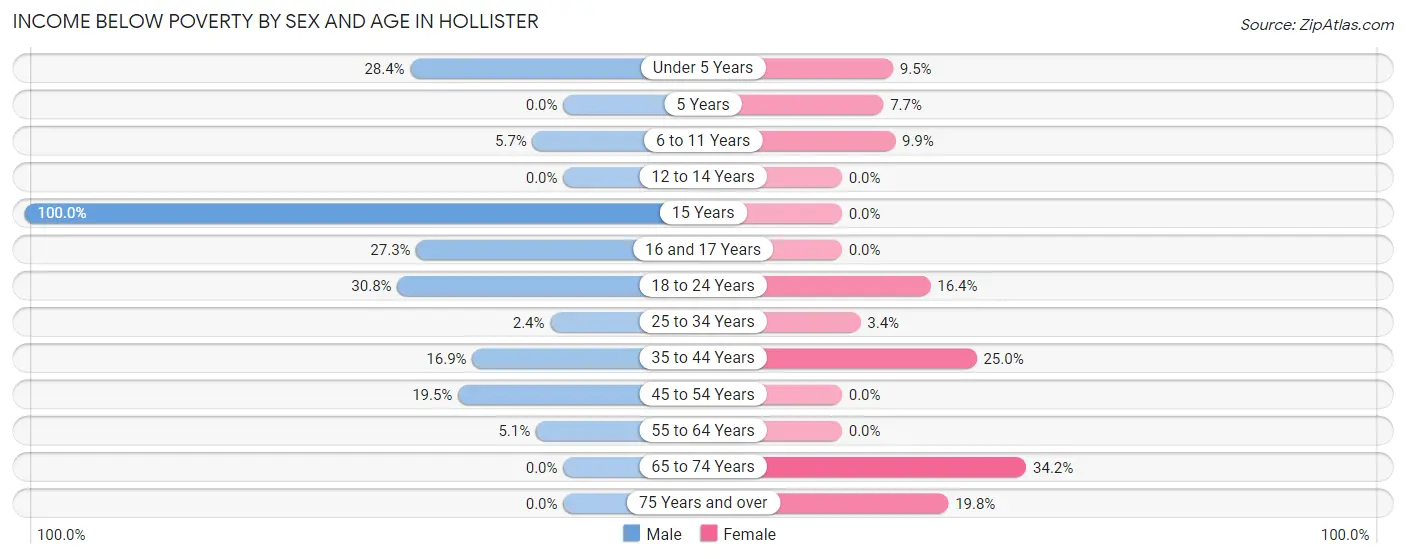
| Age Bracket | Male | Female |
| Under 5 Years | 21 (28.4%) | 9 (9.5%) |
| 5 Years | 0 (0.0%) | 12 (7.7%) |
| 6 to 11 Years | 14 (5.7%) | 33 (9.9%) |
| 12 to 14 Years | 0 (0.0%) | 0 (0.0%) |
| 15 Years | 20 (100.0%) | 0 (0.0%) |
| 16 and 17 Years | 9 (27.3%) | 0 (0.0%) |
| 18 to 24 Years | 81 (30.8%) | 36 (16.4%) |
| 25 to 34 Years | 7 (2.4%) | 12 (3.4%) |
| 35 to 44 Years | 27 (16.9%) | 96 (25.0%) |
| 45 to 54 Years | 49 (19.5%) | 0 (0.0%) |
| 55 to 64 Years | 18 (5.1%) | 0 (0.0%) |
| 65 to 74 Years | 0 (0.0%) | 65 (34.2%) |
| 75 Years and over | 0 (0.0%) | 31 (19.8%) |
| Total | 246 (12.4%) | 294 (11.8%) |
Income Above Poverty by Sex and Age in Hollister
According to the poverty statistics in Hollister, males aged 12 to 14 years and females aged 12 to 14 years are the age groups that are most secure financially, with 100.0% of males and 100.0% of females in these age groups living above the poverty line.
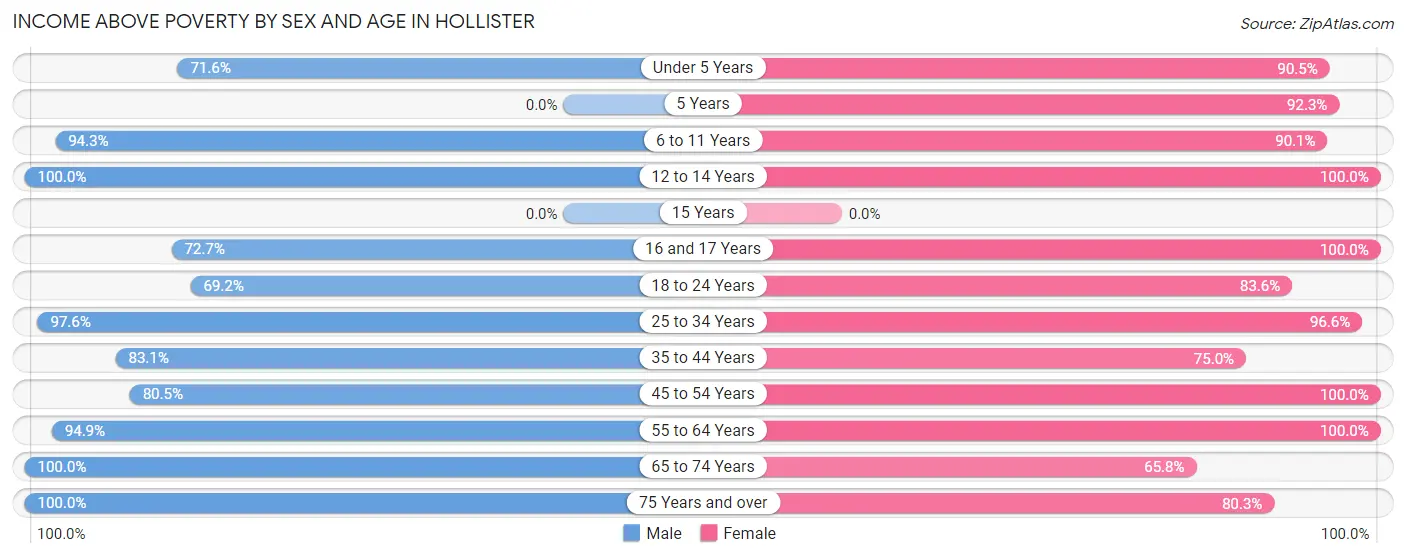
| Age Bracket | Male | Female |
| Under 5 Years | 53 (71.6%) | 86 (90.5%) |
| 5 Years | 0 (0.0%) | 144 (92.3%) |
| 6 to 11 Years | 232 (94.3%) | 301 (90.1%) |
| 12 to 14 Years | 19 (100.0%) | 81 (100.0%) |
| 15 Years | 0 (0.0%) | 0 (0.0%) |
| 16 and 17 Years | 24 (72.7%) | 32 (100.0%) |
| 18 to 24 Years | 182 (69.2%) | 183 (83.6%) |
| 25 to 34 Years | 284 (97.6%) | 337 (96.6%) |
| 35 to 44 Years | 133 (83.1%) | 288 (75.0%) |
| 45 to 54 Years | 202 (80.5%) | 288 (100.0%) |
| 55 to 64 Years | 337 (94.9%) | 204 (100.0%) |
| 65 to 74 Years | 150 (100.0%) | 125 (65.8%) |
| 75 Years and over | 129 (100.0%) | 126 (80.2%) |
| Total | 1,745 (87.6%) | 2,195 (88.2%) |
Income Below Poverty Among Married-Couple Families in Hollister
The poverty statistics for married-couple families in Hollister show that 9.2% or 104 of the total 1,129 families live below the poverty line. Families with 3 or 4 children have the highest poverty rate of 40.1%, comprising of 61 families. On the other hand, families with 1 or 2 children have the lowest poverty rate of 0.0%, which includes 0 families.
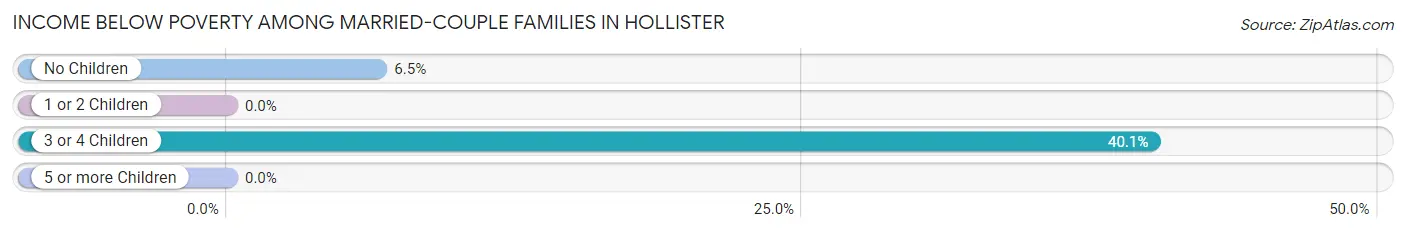
| Children | Above Poverty | Below Poverty |
| No Children | 619 (93.5%) | 43 (6.5%) |
| 1 or 2 Children | 315 (100.0%) | 0 (0.0%) |
| 3 or 4 Children | 91 (59.9%) | 61 (40.1%) |
| 5 or more Children | 0 (0.0%) | 0 (0.0%) |
| Total | 1,025 (90.8%) | 104 (9.2%) |
Income Below Poverty Among Single-Parent Households in Hollister
| Children | Single Father | Single Mother |
| No Children | 0 (0.0%) | 0 (0.0%) |
| 1 or 2 Children | 0 (0.0%) | 0 (0.0%) |
| 3 or 4 Children | 0 (0.0%) | 0 (0.0%) |
| 5 or more Children | 0 (0.0%) | 0 (0.0%) |
| Total | 0 (0.0%) | 0 (0.0%) |
Income Below Poverty Among Married-Couple vs Single-Parent Households in Hollister
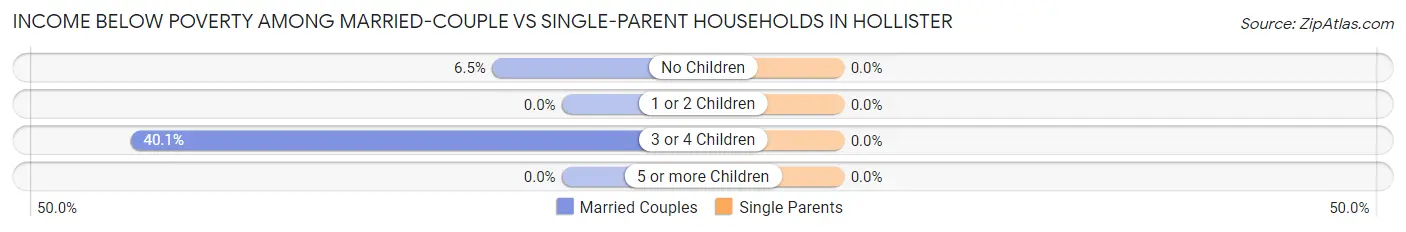
| Children | Married-Couple Families | Single-Parent Households |
| No Children | 43 (6.5%) | 0 (0.0%) |
| 1 or 2 Children | 0 (0.0%) | 0 (0.0%) |
| 3 or 4 Children | 61 (40.1%) | 0 (0.0%) |
| 5 or more Children | 0 (0.0%) | 0 (0.0%) |
| Total | 104 (9.2%) | 0 (0.0%) |
Race in Hollister
The most populous races in Hollister are White / Caucasian (4,095 | 89.3%), Hispanic or Latino (450 | 9.8%), and Two or more Races (406 | 8.8%).
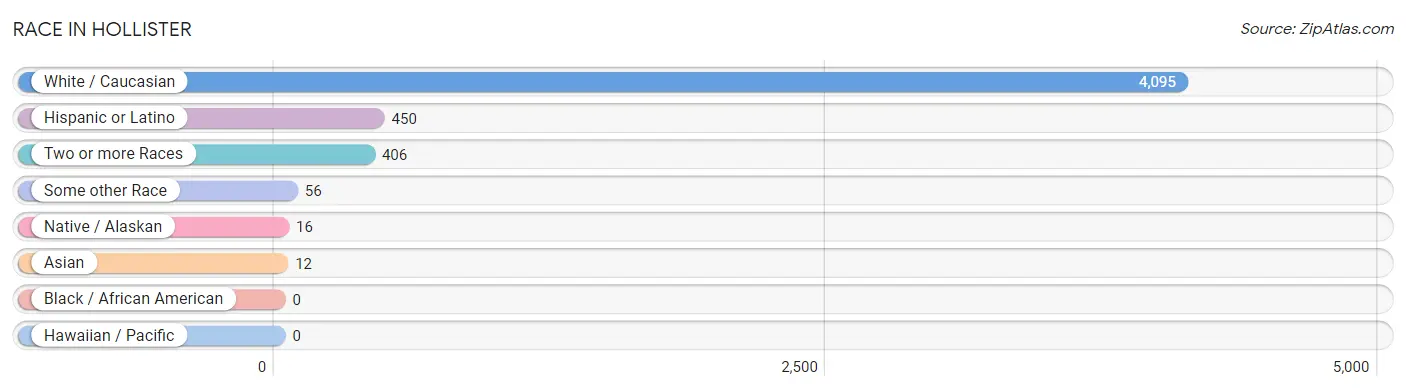
| Race | # Population | % Population |
| Asian | 12 | 0.3% |
| Black / African American | 0 | 0.0% |
| Hawaiian / Pacific | 0 | 0.0% |
| Hispanic or Latino | 450 | 9.8% |
| Native / Alaskan | 16 | 0.4% |
| White / Caucasian | 4,095 | 89.3% |
| Two or more Races | 406 | 8.8% |
| Some other Race | 56 | 1.2% |
| Total | 4,585 | 100.0% |
Ancestry in Hollister
The most populous ancestries reported in Hollister are German (1,146 | 25.0%), English (829 | 18.1%), Irish (504 | 11.0%), Norwegian (301 | 6.6%), and American (285 | 6.2%), together accounting for 66.8% of all Hollister residents.
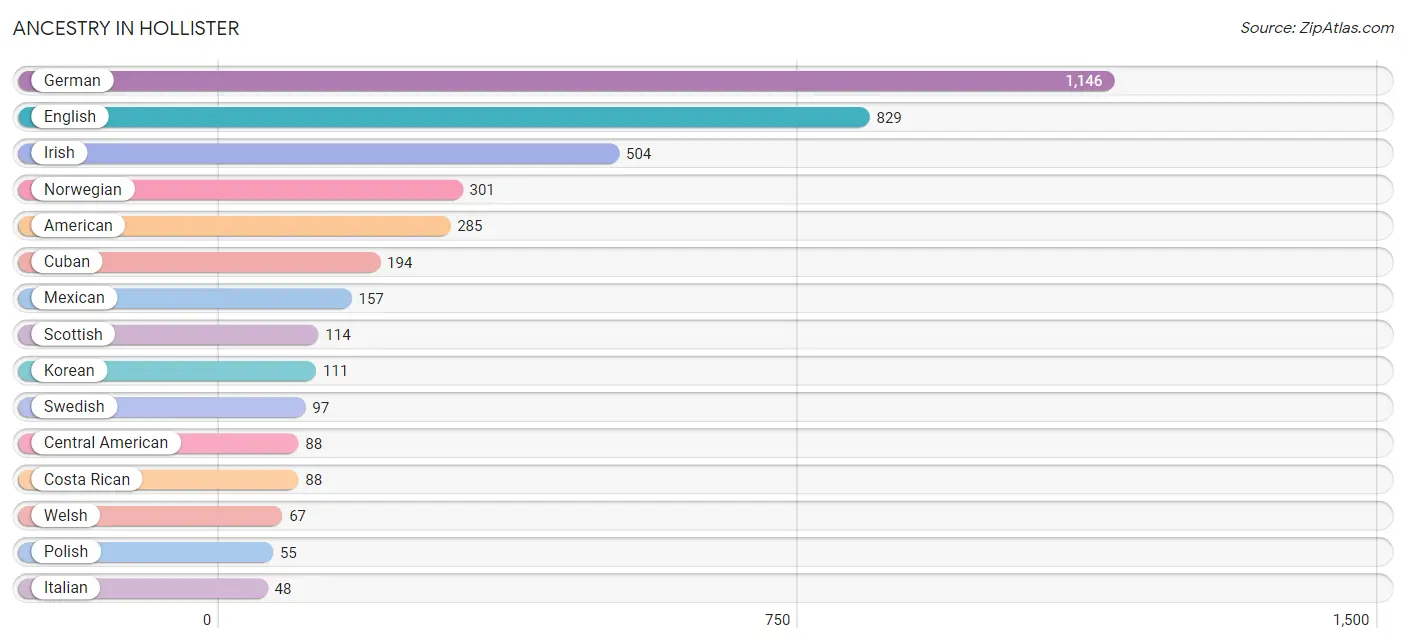
| Ancestry | # Population | % Population |
| American | 285 | 6.2% |
| Central American | 88 | 1.9% |
| Cherokee | 13 | 0.3% |
| Costa Rican | 88 | 1.9% |
| Cuban | 194 | 4.2% |
| English | 829 | 18.1% |
| European | 31 | 0.7% |
| French | 45 | 1.0% |
| French American Indian | 16 | 0.4% |
| German | 1,146 | 25.0% |
| Irish | 504 | 11.0% |
| Italian | 48 | 1.1% |
| Korean | 111 | 2.4% |
| Lithuanian | 25 | 0.5% |
| Mexican | 157 | 3.4% |
| Norwegian | 301 | 6.6% |
| Pakistani | 7 | 0.2% |
| Polish | 55 | 1.2% |
| Scandinavian | 30 | 0.6% |
| Scotch-Irish | 24 | 0.5% |
| Scottish | 114 | 2.5% |
| Spanish | 11 | 0.2% |
| Swedish | 97 | 2.1% |
| Thai | 13 | 0.3% |
| Welsh | 67 | 1.5% | View All 25 Rows |
Immigrants in Hollister
The most numerous immigrant groups reported in Hollister came from Central America (54 | 1.2%), Latin America (54 | 1.2%), Costa Rica (27 | 0.6%), Mexico (27 | 0.6%), and Asia (12 | 0.3%), together accounting for 3.8% of all Hollister residents.
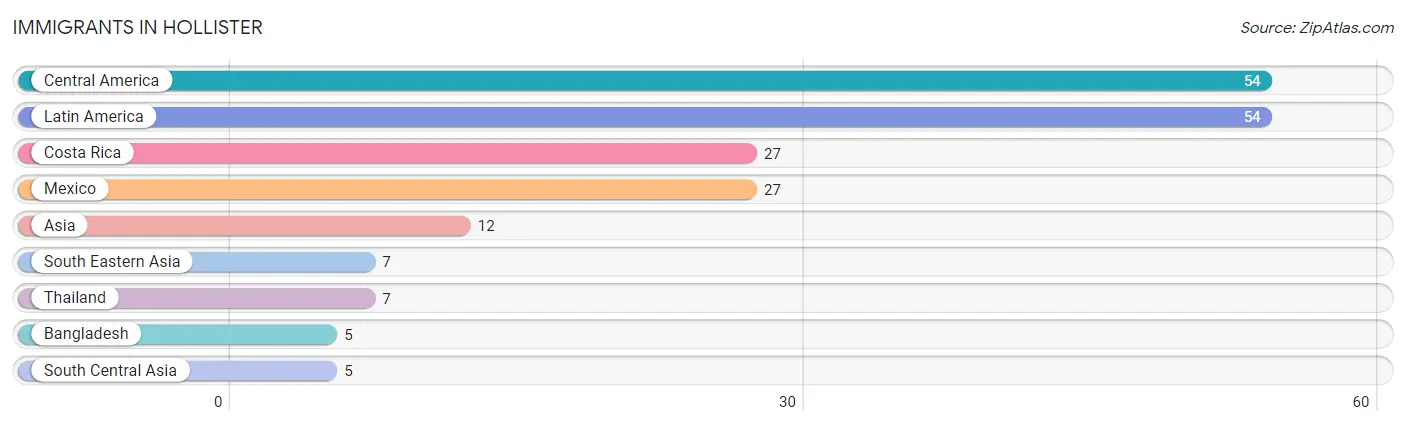
| Immigration Origin | # Population | % Population |
| Asia | 12 | 0.3% |
| Bangladesh | 5 | 0.1% |
| Central America | 54 | 1.2% |
| Costa Rica | 27 | 0.6% |
| Latin America | 54 | 1.2% |
| Mexico | 27 | 0.6% |
| South Central Asia | 5 | 0.1% |
| South Eastern Asia | 7 | 0.2% |
| Thailand | 7 | 0.2% | View All 9 Rows |
Sex and Age in Hollister
Sex and Age in Hollister
The most populous age groups in Hollister are 55 to 59 Years (276 | 13.6%) for men and 5 to 9 Years (405 | 15.9%) for women.
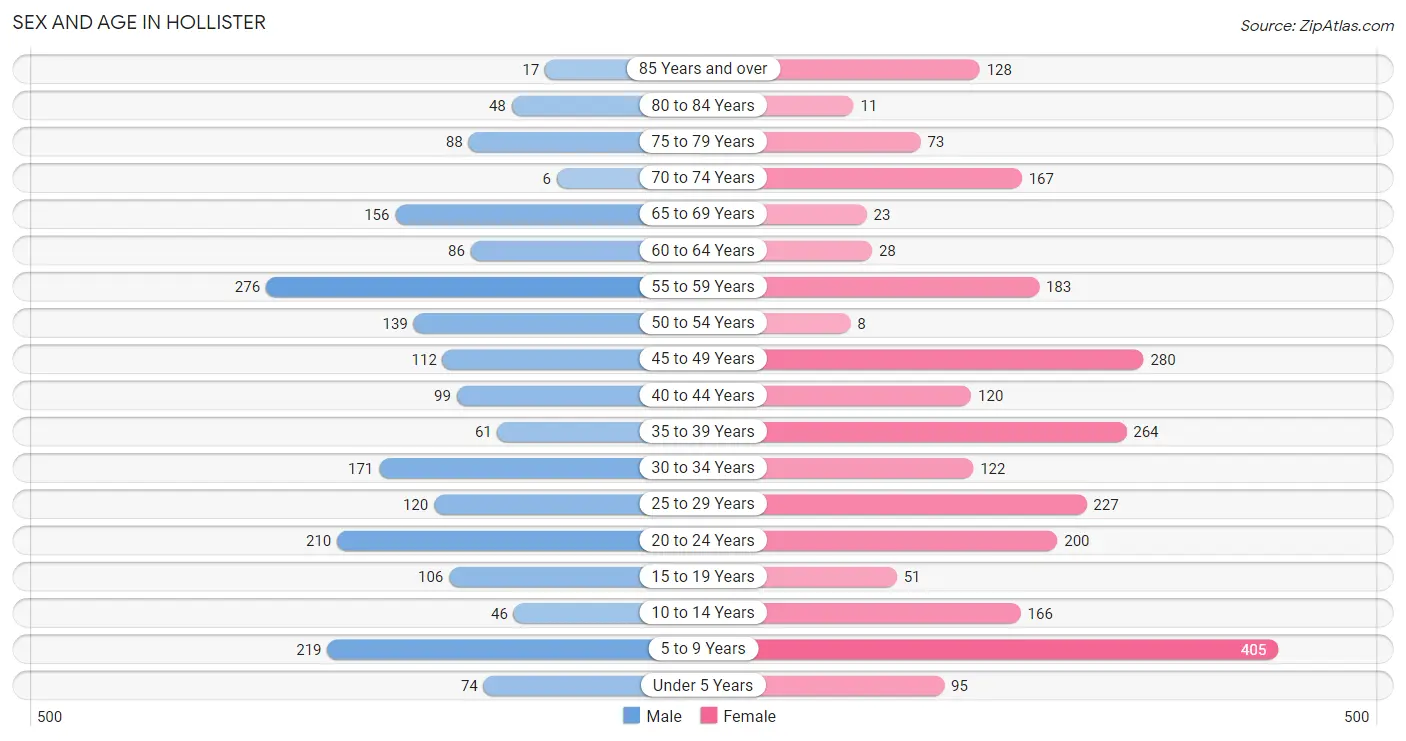
| Age Bracket | Male | Female |
| Under 5 Years | 74 (3.6%) | 95 (3.7%) |
| 5 to 9 Years | 219 (10.8%) | 405 (15.9%) |
| 10 to 14 Years | 46 (2.3%) | 166 (6.5%) |
| 15 to 19 Years | 106 (5.2%) | 51 (2.0%) |
| 20 to 24 Years | 210 (10.3%) | 200 (7.8%) |
| 25 to 29 Years | 120 (5.9%) | 227 (8.9%) |
| 30 to 34 Years | 171 (8.4%) | 122 (4.8%) |
| 35 to 39 Years | 61 (3.0%) | 264 (10.3%) |
| 40 to 44 Years | 99 (4.9%) | 120 (4.7%) |
| 45 to 49 Years | 112 (5.5%) | 280 (11.0%) |
| 50 to 54 Years | 139 (6.8%) | 8 (0.3%) |
| 55 to 59 Years | 276 (13.6%) | 183 (7.2%) |
| 60 to 64 Years | 86 (4.2%) | 28 (1.1%) |
| 65 to 69 Years | 156 (7.7%) | 23 (0.9%) |
| 70 to 74 Years | 6 (0.3%) | 167 (6.6%) |
| 75 to 79 Years | 88 (4.3%) | 73 (2.9%) |
| 80 to 84 Years | 48 (2.4%) | 11 (0.4%) |
| 85 Years and over | 17 (0.8%) | 128 (5.0%) |
| Total | 2,034 (100.0%) | 2,551 (100.0%) |
Families and Households in Hollister
Median Family Size in Hollister
The median family size in Hollister is 3.02 persons per family, with single male/father families (58 | 4.5%) accounting for the largest median family size of 3.33 persons per family. On the other hand, single female/mother families (92 | 7.2%) represent the smallest median family size with 2.72 persons per family.
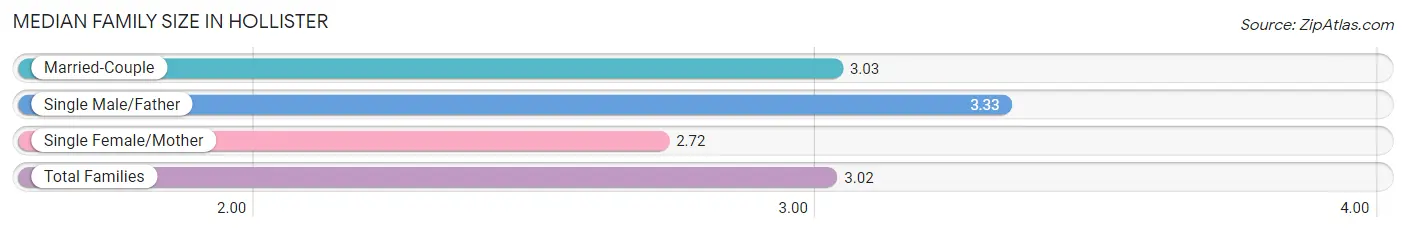
| Family Type | # Families | Family Size |
| Married-Couple | 1,129 (88.3%) | 3.03 |
| Single Male/Father | 58 (4.5%) | 3.33 |
| Single Female/Mother | 92 (7.2%) | 2.72 |
| Total Families | 1,279 (100.0%) | 3.02 |
Median Household Size in Hollister
The median household size in Hollister is 2.49 persons per household, with single male/father households (58 | 3.2%) accounting for the largest median household size of 3.33 persons per household. non-family households (518 | 28.8%) represent the smallest median household size with 1.18 persons per household.
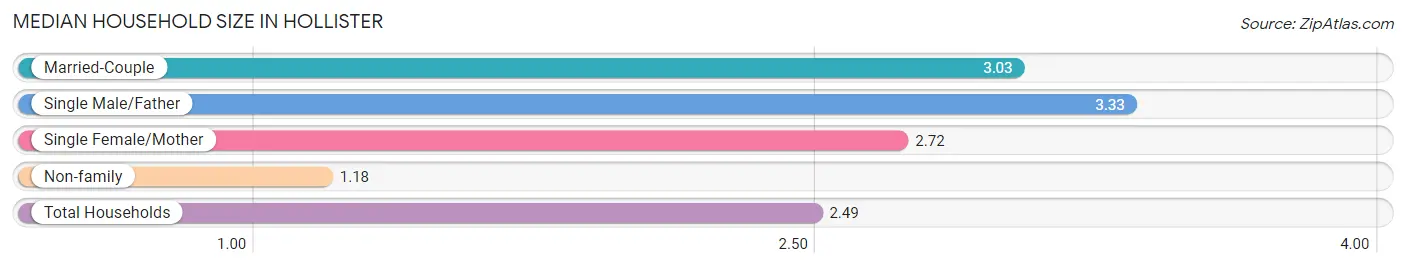
| Household Type | # Households | Household Size |
| Married-Couple | 1,129 (62.8%) | 3.03 |
| Single Male/Father | 58 (3.2%) | 3.33 |
| Single Female/Mother | 92 (5.1%) | 2.72 |
| Non-family | 518 (28.8%) | 1.18 |
| Total Households | 1,797 (100.0%) | 2.49 |
Household Size by Marriage Status in Hollister
Out of a total of 1,797 households in Hollister, 1,279 (71.2%) are family households, while 518 (28.8%) are nonfamily households. The most numerous type of family households are 2-person households, comprising 550, and the most common type of nonfamily households are 1-person households, comprising 429.
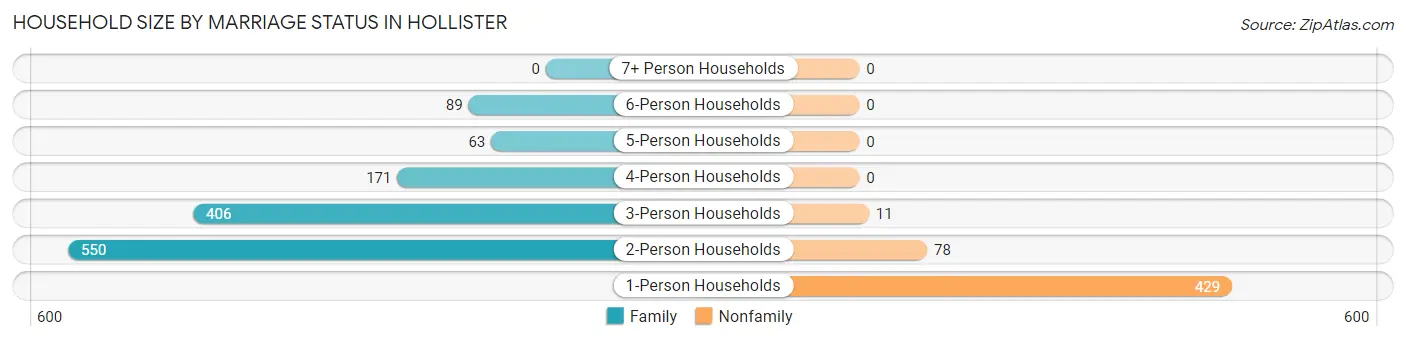
| Household Size | Family Households | Nonfamily Households |
| 1-Person Households | - | 429 (23.9%) |
| 2-Person Households | 550 (30.6%) | 78 (4.3%) |
| 3-Person Households | 406 (22.6%) | 11 (0.6%) |
| 4-Person Households | 171 (9.5%) | 0 (0.0%) |
| 5-Person Households | 63 (3.5%) | 0 (0.0%) |
| 6-Person Households | 89 (5.0%) | 0 (0.0%) |
| 7+ Person Households | 0 (0.0%) | 0 (0.0%) |
| Total | 1,279 (71.2%) | 518 (28.8%) |
Female Fertility in Hollister
Fertility by Age in Hollister
Average fertility rate in Hollister is 35.0 births per 1,000 women. Women in the age bracket of 35 to 50 years have the highest fertility rate with 41.0 births per 1,000 women. Women in the age bracket of 35 to 50 years acount for 61.4% of all women with births.
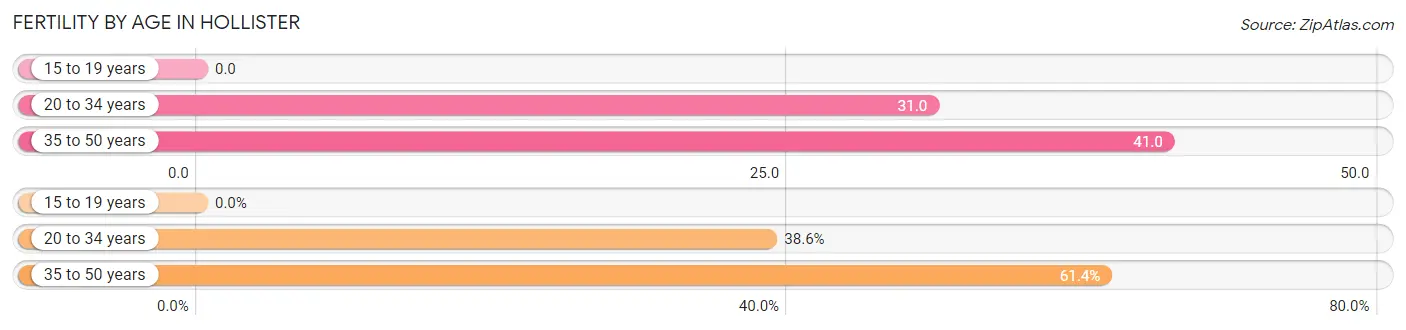
| Age Bracket | Women with Births | Births / 1,000 Women |
| 15 to 19 years | 0 (0.0%) | 0.0 |
| 20 to 34 years | 17 (38.6%) | 31.0 |
| 35 to 50 years | 27 (61.4%) | 41.0 |
| Total | 44 (100.0%) | 35.0 |
Fertility by Age by Marriage Status in Hollister
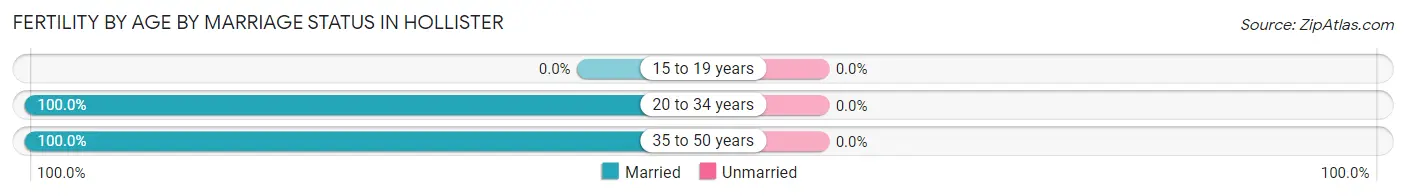
| Age Bracket | Married | Unmarried |
| 15 to 19 years | 0 (0.0%) | 0 (0.0%) |
| 20 to 34 years | 17 (100.0%) | 0 (0.0%) |
| 35 to 50 years | 27 (100.0%) | 0 (0.0%) |
| Total | 44 (100.0%) | 0 (0.0%) |
Fertility by Education in Hollister
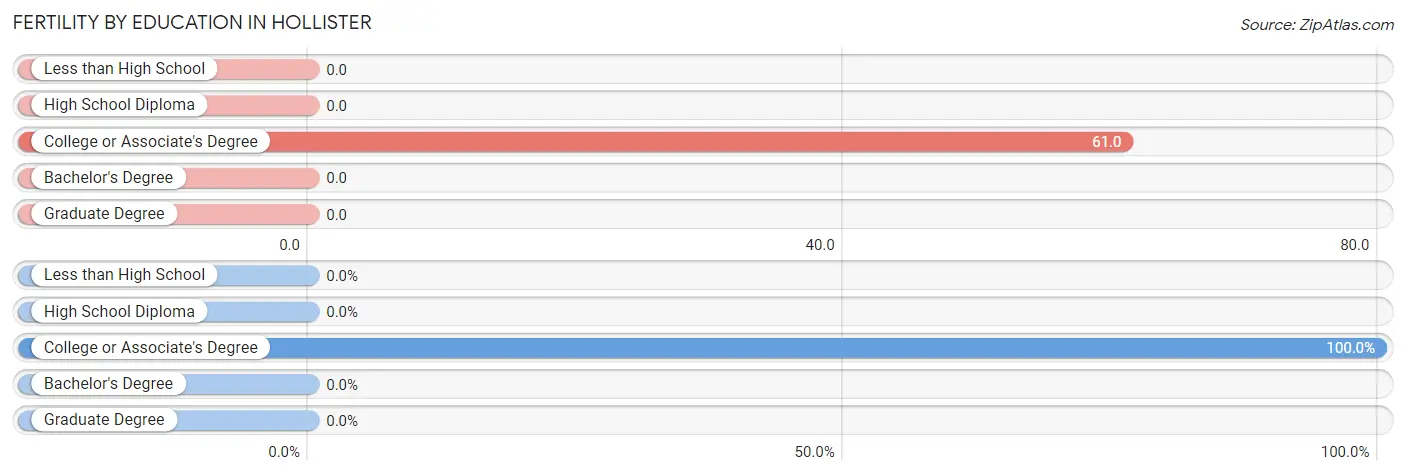
| Educational Attainment | Women with Births | Births / 1,000 Women |
| Less than High School | 0 (0.0%) | 0.0 |
| High School Diploma | 0 (0.0%) | 0.0 |
| College or Associate's Degree | 44 (100.0%) | 61.0 |
| Bachelor's Degree | 0 (0.0%) | 0.0 |
| Graduate Degree | 0 (0.0%) | 0.0 |
| Total | 44 (100.0%) | 35.0 |
Fertility by Education by Marriage Status in Hollister
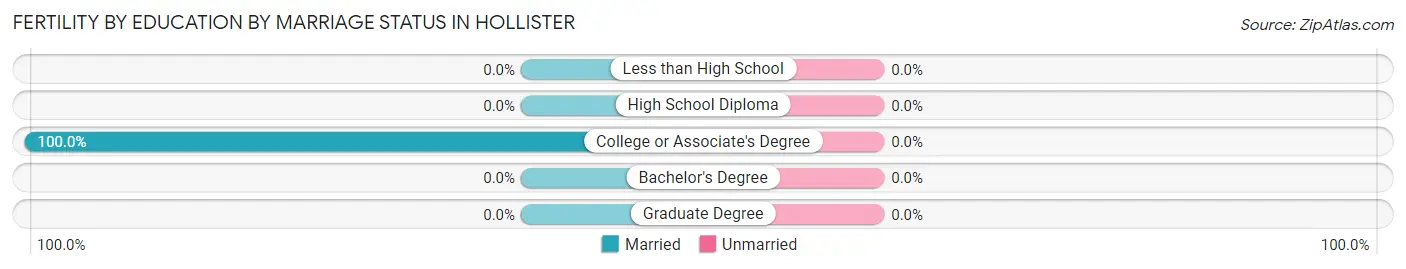
| Educational Attainment | Married | Unmarried |
| Less than High School | 0 (0.0%) | 0 (0.0%) |
| High School Diploma | 0 (0.0%) | 0 (0.0%) |
| College or Associate's Degree | 44 (100.0%) | 0 (0.0%) |
| Bachelor's Degree | 0 (0.0%) | 0 (0.0%) |
| Graduate Degree | 0 (0.0%) | 0 (0.0%) |
| Total | 44 (100.0%) | 0 (0.0%) |
Employment Characteristics in Hollister
Employment by Class of Employer in Hollister
Among the 1,966 employed individuals in Hollister, private company employees (1,567 | 79.7%), not-for-profit organizations (197 | 10.0%), and local government employees (58 | 2.9%) make up the most common classes of employment.
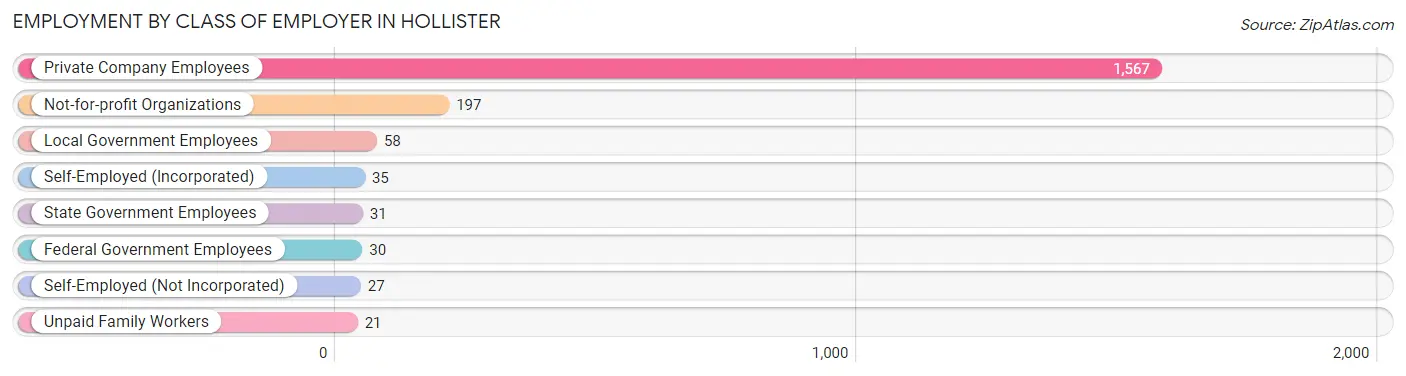
| Employer Class | # Employees | % Employees |
| Private Company Employees | 1,567 | 79.7% |
| Self-Employed (Incorporated) | 35 | 1.8% |
| Self-Employed (Not Incorporated) | 27 | 1.4% |
| Not-for-profit Organizations | 197 | 10.0% |
| Local Government Employees | 58 | 2.9% |
| State Government Employees | 31 | 1.6% |
| Federal Government Employees | 30 | 1.5% |
| Unpaid Family Workers | 21 | 1.1% |
| Total | 1,966 | 100.0% |
Employment Status by Age in Hollister
According to the labor force statistics for Hollister, out of the total population over 16 years of age (3,560), 61.2% or 2,179 individuals are in the labor force, with 7.5% or 163 of them unemployed. The age group with the highest labor force participation rate is 20 to 24 years, with 95.4% or 391 individuals in the labor force. Within the labor force, the 20 to 24 years age range has the highest percentage of unemployed individuals, with 25.1% or 98 of them being unemployed.
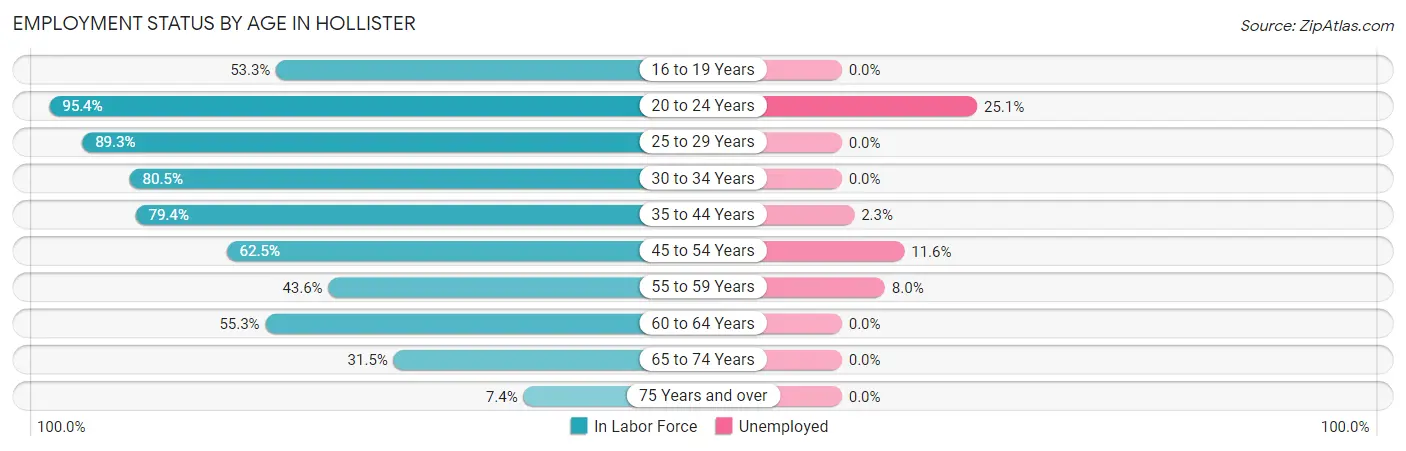
| Age Bracket | In Labor Force | Unemployed |
| 16 to 19 Years | 73 (53.3%) | 0 (0.0%) |
| 20 to 24 Years | 391 (95.4%) | 98 (25.1%) |
| 25 to 29 Years | 310 (89.3%) | 0 (0.0%) |
| 30 to 34 Years | 236 (80.5%) | 0 (0.0%) |
| 35 to 44 Years | 432 (79.4%) | 10 (2.3%) |
| 45 to 54 Years | 337 (62.5%) | 39 (11.6%) |
| 55 to 59 Years | 200 (43.6%) | 16 (8.0%) |
| 60 to 64 Years | 63 (55.3%) | 0 (0.0%) |
| 65 to 74 Years | 111 (31.5%) | 0 (0.0%) |
| 75 Years and over | 27 (7.4%) | 0 (0.0%) |
| Total | 2,179 (61.2%) | 163 (7.5%) |
Employment Status by Educational Attainment in Hollister
According to labor force statistics for Hollister, 68.7% of individuals (1,577) out of the total population between 25 and 64 years of age (2,296) are in the labor force, with 4.1% or 65 of them being unemployed. The group with the highest labor force participation rate are those with the educational attainment of bachelor's degree or higher, with 98.0% or 346 individuals in the labor force. Within the labor force, individuals with college / associate degree education have the highest percentage of unemployment, with 8.5% or 50 of them being unemployed.
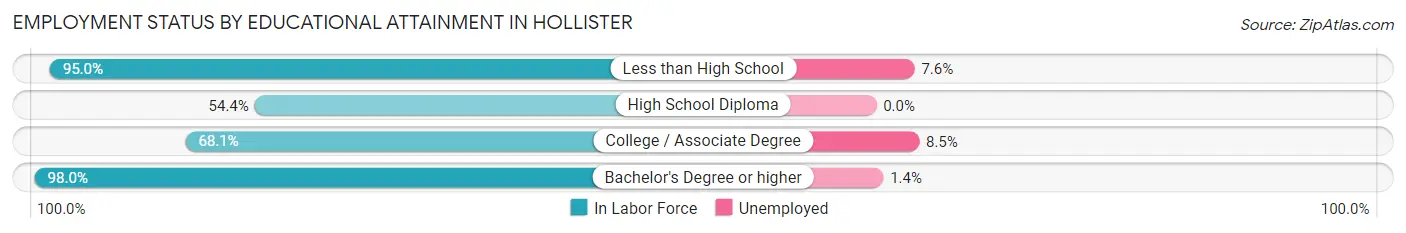
| Educational Attainment | In Labor Force | Unemployed |
| Less than High School | 132 (95.0%) | 11 (7.6%) |
| High School Diploma | 509 (54.4%) | 0 (0.0%) |
| College / Associate Degree | 591 (68.1%) | 74 (8.5%) |
| Bachelor's Degree or higher | 346 (98.0%) | 5 (1.4%) |
| Total | 1,577 (68.7%) | 94 (4.1%) |
Employment Occupations by Sex in Hollister
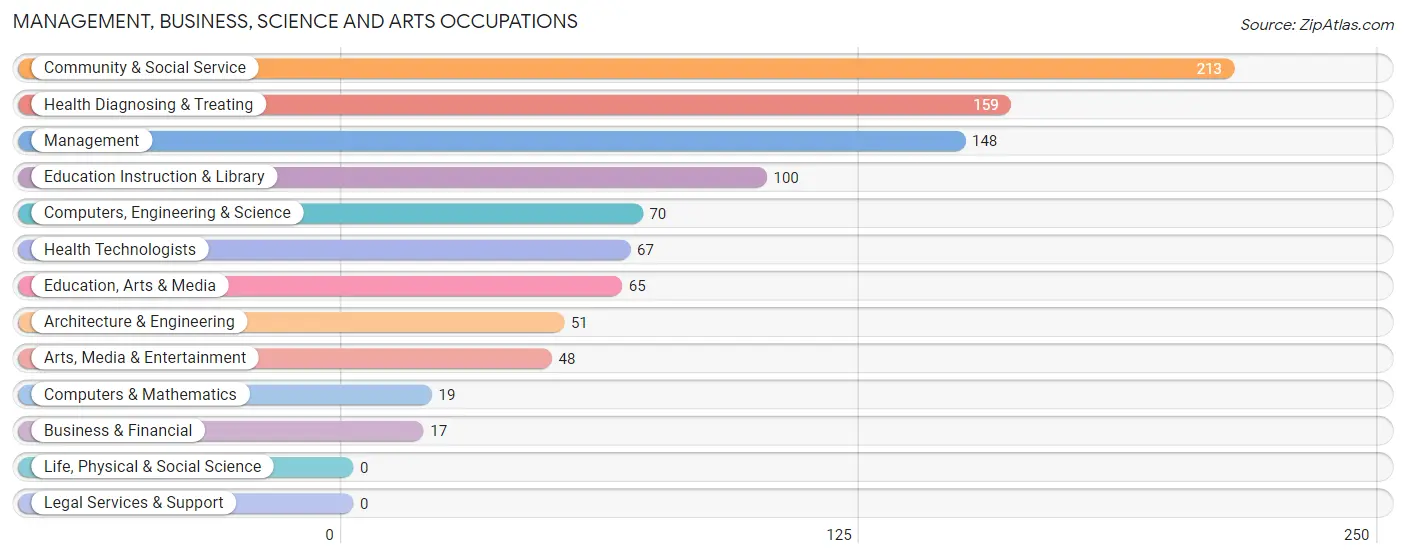
Management, Business, Science and Arts Occupations
The most common Management, Business, Science and Arts occupations in Hollister are Community & Social Service (213 | 10.6%), Health Diagnosing & Treating (159 | 7.9%), Management (148 | 7.3%), Education Instruction & Library (100 | 5.0%), and Computers, Engineering & Science (70 | 3.5%).
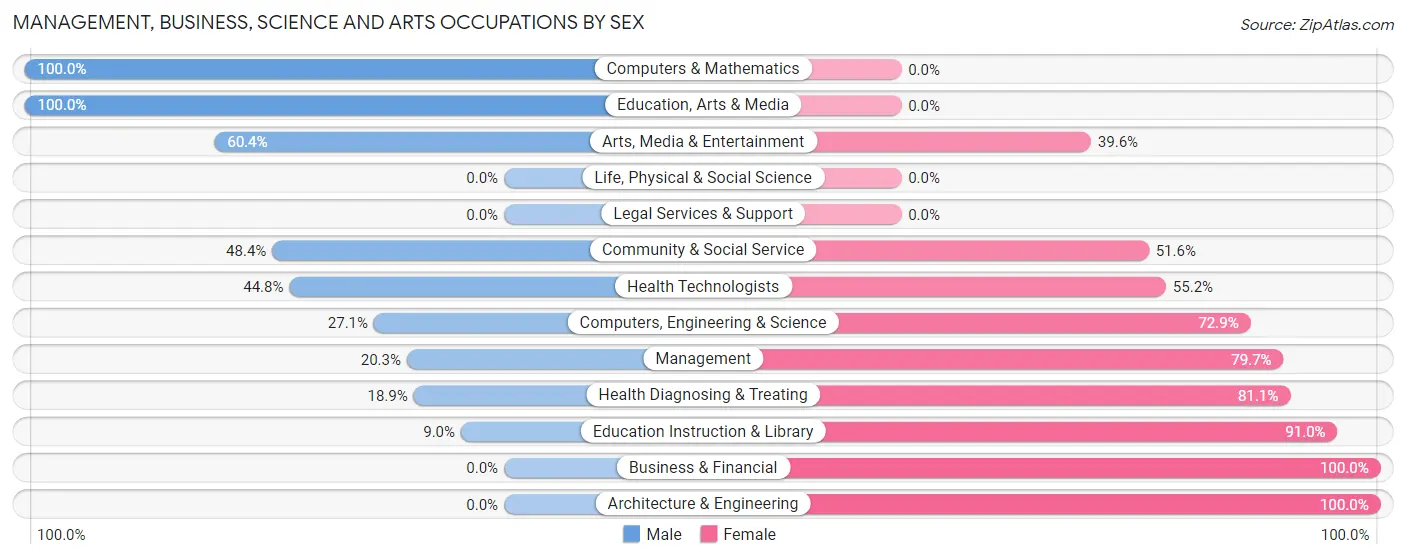
Management, Business, Science and Arts Occupations by Sex
Within the Management, Business, Science and Arts occupations in Hollister, the most male-oriented occupations are Computers & Mathematics (100.0%), Education, Arts & Media (100.0%), and Arts, Media & Entertainment (60.4%), while the most female-oriented occupations are Business & Financial (100.0%), Architecture & Engineering (100.0%), and Education Instruction & Library (91.0%).
| Occupation | Male | Female |
| Management | 30 (20.3%) | 118 (79.7%) |
| Business & Financial | 0 (0.0%) | 17 (100.0%) |
| Computers, Engineering & Science | 19 (27.1%) | 51 (72.9%) |
| Computers & Mathematics | 19 (100.0%) | 0 (0.0%) |
| Architecture & Engineering | 0 (0.0%) | 51 (100.0%) |
| Life, Physical & Social Science | 0 (0.0%) | 0 (0.0%) |
| Community & Social Service | 103 (48.4%) | 110 (51.6%) |
| Education, Arts & Media | 65 (100.0%) | 0 (0.0%) |
| Legal Services & Support | 0 (0.0%) | 0 (0.0%) |
| Education Instruction & Library | 9 (9.0%) | 91 (91.0%) |
| Arts, Media & Entertainment | 29 (60.4%) | 19 (39.6%) |
| Health Diagnosing & Treating | 30 (18.9%) | 129 (81.1%) |
| Health Technologists | 30 (44.8%) | 37 (55.2%) |
| Total (Category) | 182 (30.0%) | 425 (70.0%) |
| Total (Overall) | 1,057 (52.4%) | 960 (47.6%) |
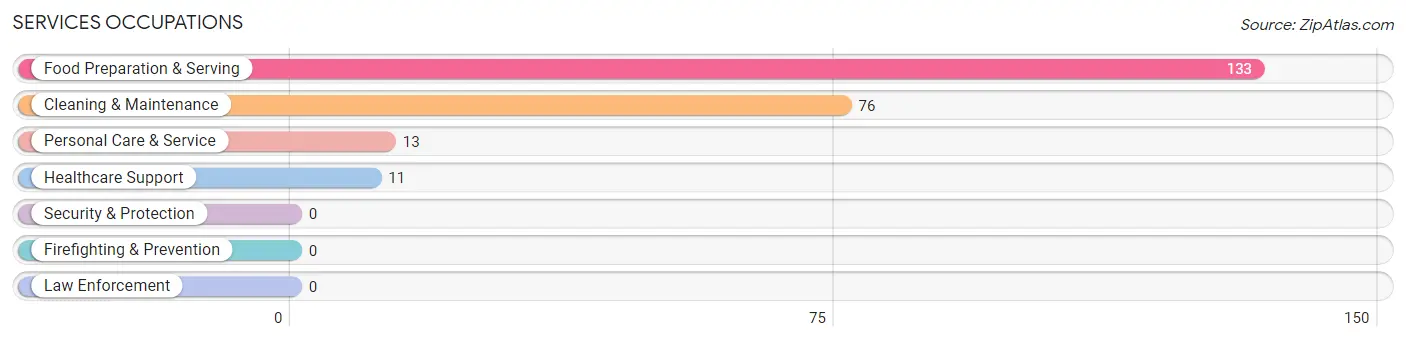
Services Occupations
The most common Services occupations in Hollister are Food Preparation & Serving (133 | 6.6%), Cleaning & Maintenance (76 | 3.8%), Personal Care & Service (13 | 0.6%), and Healthcare Support (11 | 0.5%).
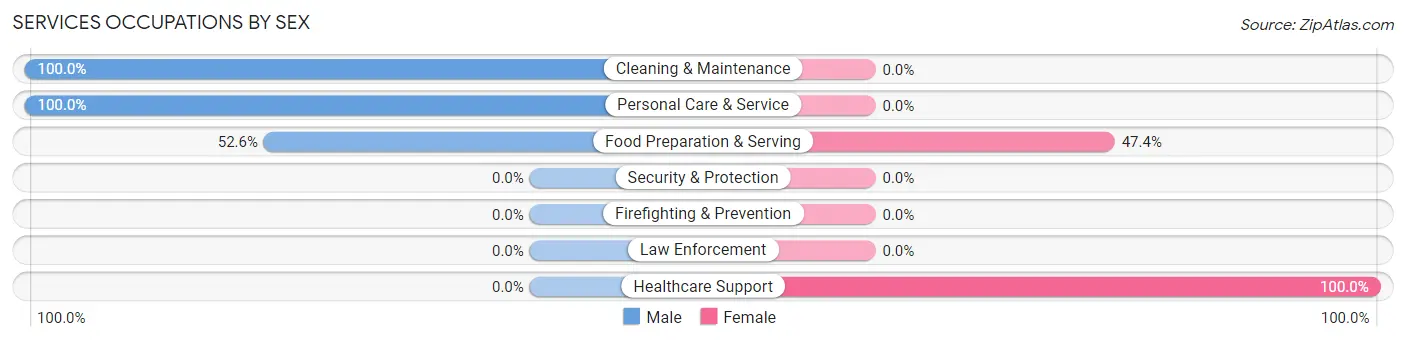
Services Occupations by Sex
Within the Services occupations in Hollister, the most male-oriented occupations are Cleaning & Maintenance (100.0%), Personal Care & Service (100.0%), and Food Preparation & Serving (52.6%), while the most female-oriented occupations are Healthcare Support (100.0%), and Food Preparation & Serving (47.4%).
| Occupation | Male | Female |
| Healthcare Support | 0 (0.0%) | 11 (100.0%) |
| Security & Protection | 0 (0.0%) | 0 (0.0%) |
| Firefighting & Prevention | 0 (0.0%) | 0 (0.0%) |
| Law Enforcement | 0 (0.0%) | 0 (0.0%) |
| Food Preparation & Serving | 70 (52.6%) | 63 (47.4%) |
| Cleaning & Maintenance | 76 (100.0%) | 0 (0.0%) |
| Personal Care & Service | 13 (100.0%) | 0 (0.0%) |
| Total (Category) | 159 (68.2%) | 74 (31.8%) |
| Total (Overall) | 1,057 (52.4%) | 960 (47.6%) |
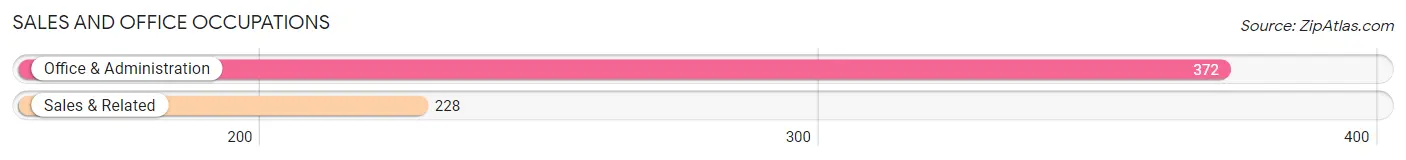
Sales and Office Occupations
The most common Sales and Office occupations in Hollister are Office & Administration (372 | 18.4%), and Sales & Related (228 | 11.3%).
Sales and Office Occupations by Sex
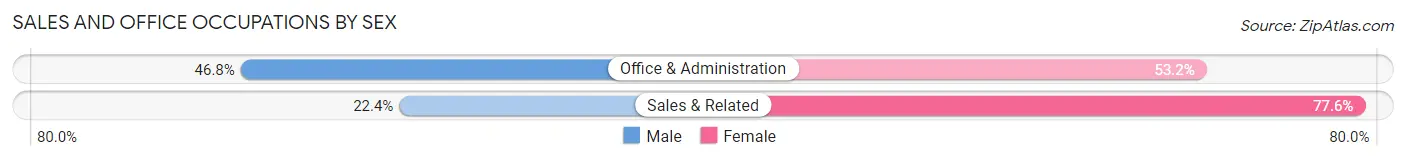
| Occupation | Male | Female |
| Sales & Related | 51 (22.4%) | 177 (77.6%) |
| Office & Administration | 174 (46.8%) | 198 (53.2%) |
| Total (Category) | 225 (37.5%) | 375 (62.5%) |
| Total (Overall) | 1,057 (52.4%) | 960 (47.6%) |
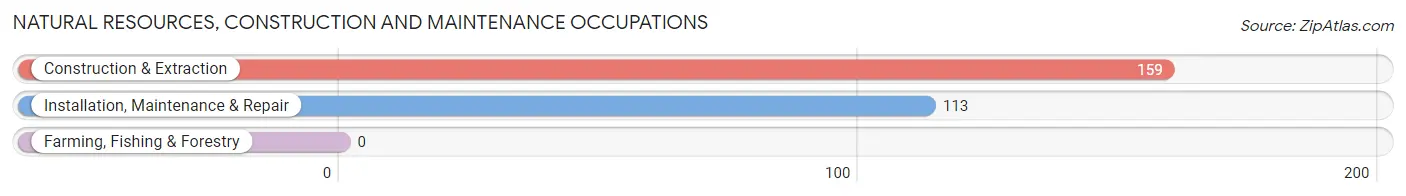
Natural Resources, Construction and Maintenance Occupations
The most common Natural Resources, Construction and Maintenance occupations in Hollister are Construction & Extraction (159 | 7.9%), and Installation, Maintenance & Repair (113 | 5.6%).
Natural Resources, Construction and Maintenance Occupations by Sex
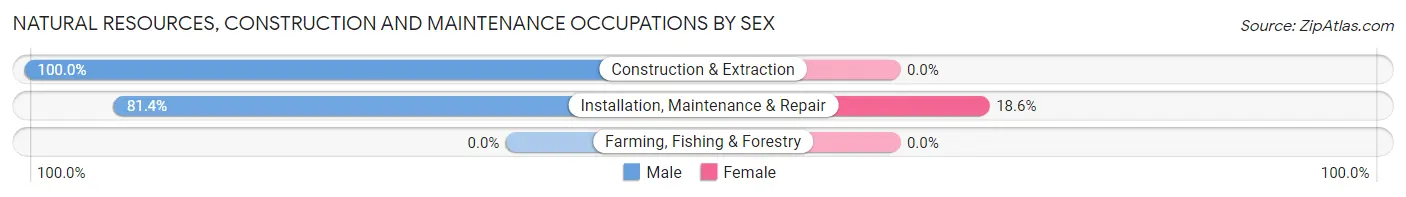
| Occupation | Male | Female |
| Farming, Fishing & Forestry | 0 (0.0%) | 0 (0.0%) |
| Construction & Extraction | 159 (100.0%) | 0 (0.0%) |
| Installation, Maintenance & Repair | 92 (81.4%) | 21 (18.6%) |
| Total (Category) | 251 (92.3%) | 21 (7.7%) |
| Total (Overall) | 1,057 (52.4%) | 960 (47.6%) |
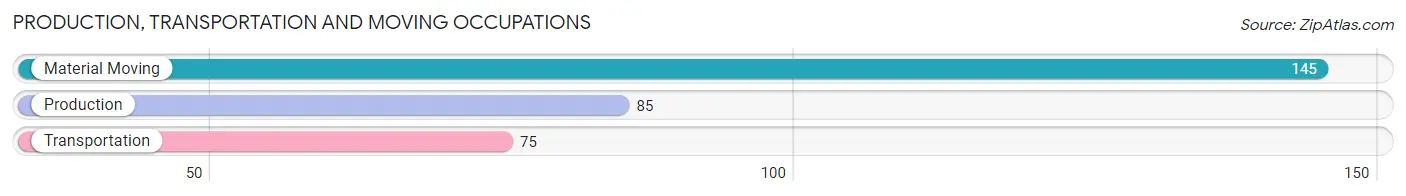
Production, Transportation and Moving Occupations
The most common Production, Transportation and Moving occupations in Hollister are Material Moving (145 | 7.2%), Production (85 | 4.2%), and Transportation (75 | 3.7%).
Production, Transportation and Moving Occupations by Sex
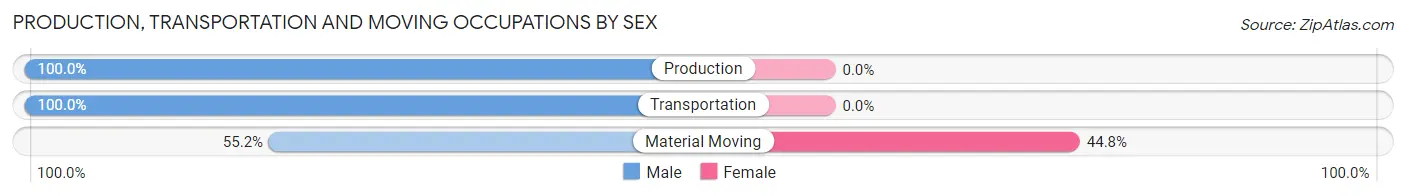
| Occupation | Male | Female |
| Production | 85 (100.0%) | 0 (0.0%) |
| Transportation | 75 (100.0%) | 0 (0.0%) |
| Material Moving | 80 (55.2%) | 65 (44.8%) |
| Total (Category) | 240 (78.7%) | 65 (21.3%) |
| Total (Overall) | 1,057 (52.4%) | 960 (47.6%) |
Employment Industries by Sex in Hollister
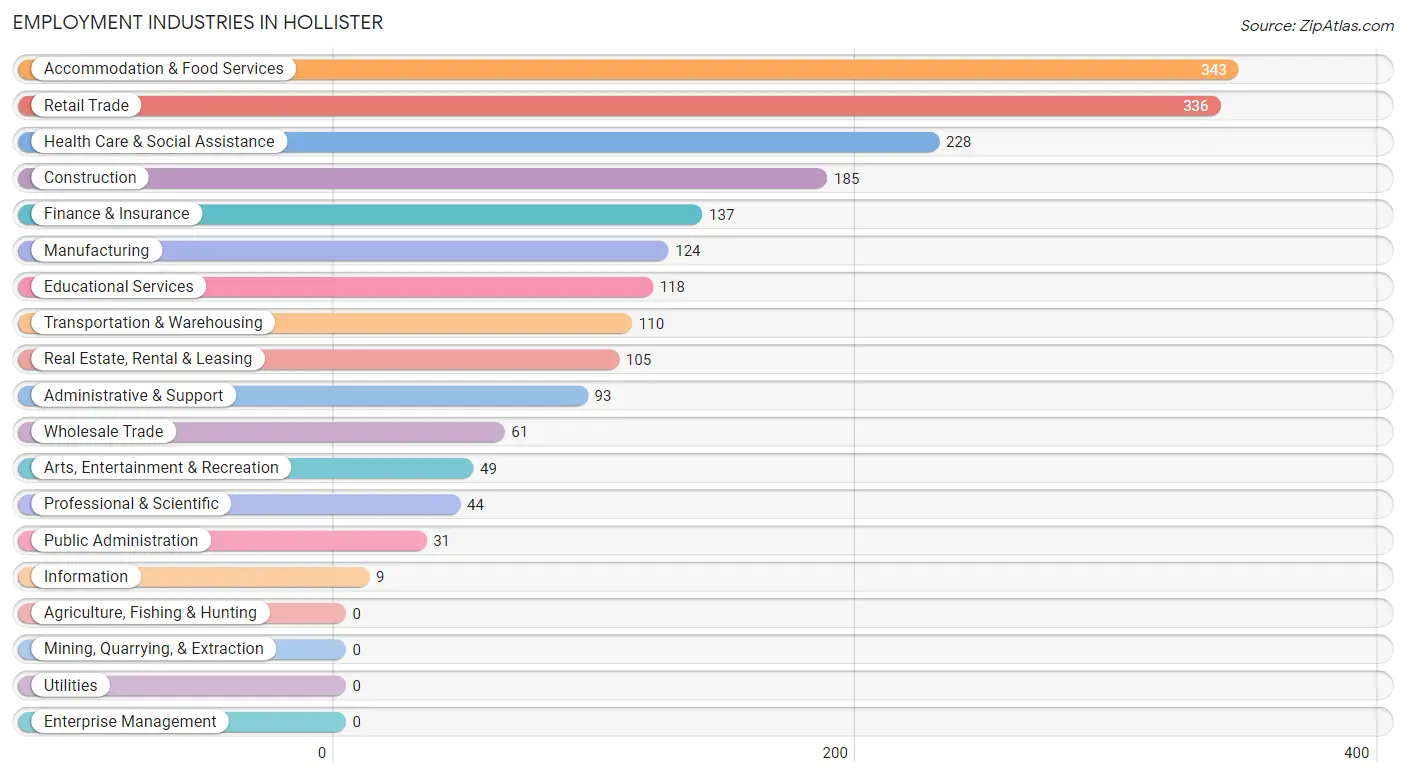
Employment Industries in Hollister
The major employment industries in Hollister include Accommodation & Food Services (343 | 17.0%), Retail Trade (336 | 16.7%), Health Care & Social Assistance (228 | 11.3%), Construction (185 | 9.2%), and Finance & Insurance (137 | 6.8%).
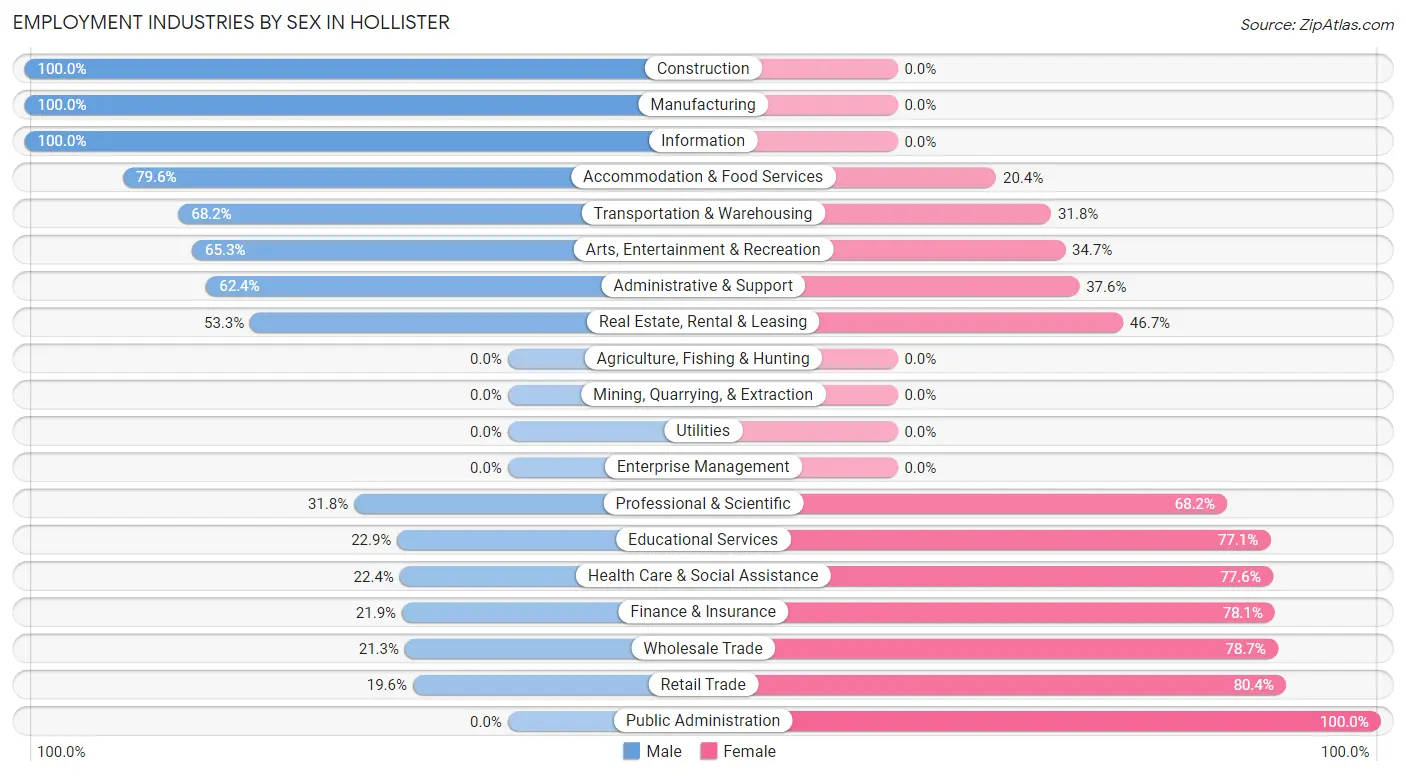
Employment Industries by Sex in Hollister
The Hollister industries that see more men than women are Construction (100.0%), Manufacturing (100.0%), and Information (100.0%), whereas the industries that tend to have a higher number of women are Public Administration (100.0%), Retail Trade (80.4%), and Wholesale Trade (78.7%).
| Industry | Male | Female |
| Agriculture, Fishing & Hunting | 0 (0.0%) | 0 (0.0%) |
| Mining, Quarrying, & Extraction | 0 (0.0%) | 0 (0.0%) |
| Construction | 185 (100.0%) | 0 (0.0%) |
| Manufacturing | 124 (100.0%) | 0 (0.0%) |
| Wholesale Trade | 13 (21.3%) | 48 (78.7%) |
| Retail Trade | 66 (19.6%) | 270 (80.4%) |
| Transportation & Warehousing | 75 (68.2%) | 35 (31.8%) |
| Utilities | 0 (0.0%) | 0 (0.0%) |
| Information | 9 (100.0%) | 0 (0.0%) |
| Finance & Insurance | 30 (21.9%) | 107 (78.1%) |
| Real Estate, Rental & Leasing | 56 (53.3%) | 49 (46.7%) |
| Professional & Scientific | 14 (31.8%) | 30 (68.2%) |
| Enterprise Management | 0 (0.0%) | 0 (0.0%) |
| Administrative & Support | 58 (62.4%) | 35 (37.6%) |
| Educational Services | 27 (22.9%) | 91 (77.1%) |
| Health Care & Social Assistance | 51 (22.4%) | 177 (77.6%) |
| Arts, Entertainment & Recreation | 32 (65.3%) | 17 (34.7%) |
| Accommodation & Food Services | 273 (79.6%) | 70 (20.4%) |
| Public Administration | 0 (0.0%) | 31 (100.0%) |
| Total | 1,057 (52.4%) | 960 (47.6%) |
Education in Hollister
School Enrollment in Hollister
The most common levels of schooling among the 1,158 students in Hollister are elementary school (446 | 38.5%), college / undergraduate (215 | 18.6%), and kindergarten (165 | 14.2%).
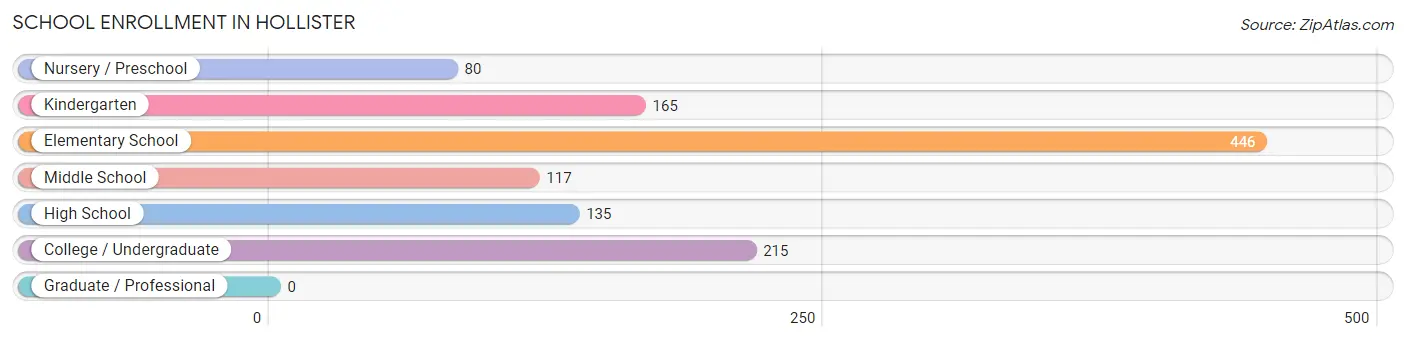
| School Level | # Students | % Students |
| Nursery / Preschool | 80 | 6.9% |
| Kindergarten | 165 | 14.2% |
| Elementary School | 446 | 38.5% |
| Middle School | 117 | 10.1% |
| High School | 135 | 11.7% |
| College / Undergraduate | 215 | 18.6% |
| Graduate / Professional | 0 | 0.0% |
| Total | 1,158 | 100.0% |
School Enrollment by Age by Funding Source in Hollister
Out of a total of 1,158 students who are enrolled in schools in Hollister, 56 (4.8%) attend a private institution, while the remaining 1,102 (95.2%) are enrolled in public schools. The age group of 35 years and over has the highest likelihood of being enrolled in private schools, with 37 (100.0% in the age bracket) enrolled. Conversely, the age group of 5 to 9 year old has the lowest likelihood of being enrolled in a private school, with 624 (100.0% in the age bracket) attending a public institution.
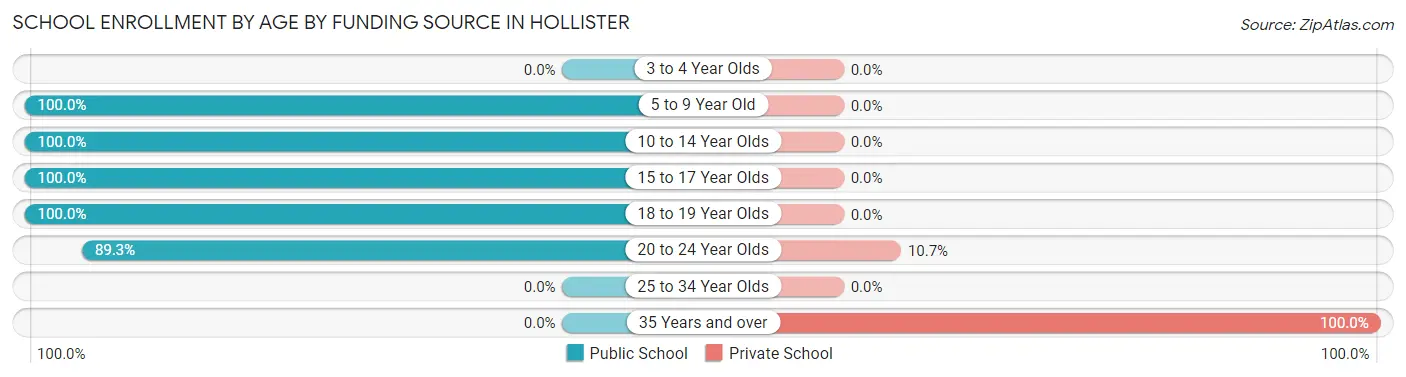
| Age Bracket | Public School | Private School |
| 3 to 4 Year Olds | 0 (0.0%) | 0 (0.0%) |
| 5 to 9 Year Old | 624 (100.0%) | 0 (0.0%) |
| 10 to 14 Year Olds | 212 (100.0%) | 0 (0.0%) |
| 15 to 17 Year Olds | 85 (100.0%) | 0 (0.0%) |
| 18 to 19 Year Olds | 22 (100.0%) | 0 (0.0%) |
| 20 to 24 Year Olds | 159 (89.3%) | 19 (10.7%) |
| 25 to 34 Year Olds | 0 (0.0%) | 0 (0.0%) |
| 35 Years and over | 0 (0.0%) | 37 (100.0%) |
| Total | 1,102 (95.2%) | 56 (4.8%) |
Educational Attainment by Field of Study in Hollister
Business (122 | 17.8%), liberal arts & history (122 | 17.8%), computers & mathematics (82 | 12.0%), social sciences (70 | 10.2%), and visual & performing arts (65 | 9.5%) are the most common fields of study among 684 individuals in Hollister who have obtained a bachelor's degree or higher.
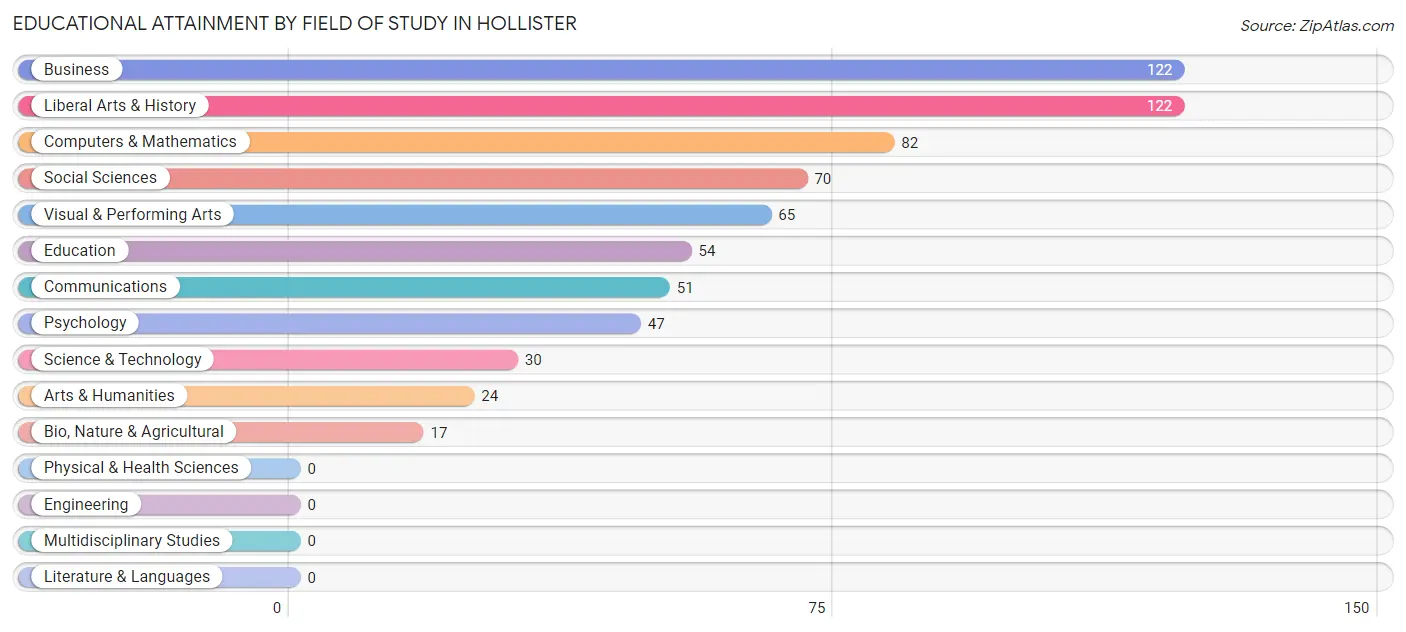
| Field of Study | # Graduates | % Graduates |
| Computers & Mathematics | 82 | 12.0% |
| Bio, Nature & Agricultural | 17 | 2.5% |
| Physical & Health Sciences | 0 | 0.0% |
| Psychology | 47 | 6.9% |
| Social Sciences | 70 | 10.2% |
| Engineering | 0 | 0.0% |
| Multidisciplinary Studies | 0 | 0.0% |
| Science & Technology | 30 | 4.4% |
| Business | 122 | 17.8% |
| Education | 54 | 7.9% |
| Literature & Languages | 0 | 0.0% |
| Liberal Arts & History | 122 | 17.8% |
| Visual & Performing Arts | 65 | 9.5% |
| Communications | 51 | 7.5% |
| Arts & Humanities | 24 | 3.5% |
| Total | 684 | 100.0% |
Transportation & Commute in Hollister
Vehicle Availability by Sex in Hollister
The most prevalent vehicle ownership categories in Hollister are males with 2 vehicles (511, accounting for 48.3%) and females with 2 vehicles (376, making up 56.2%).
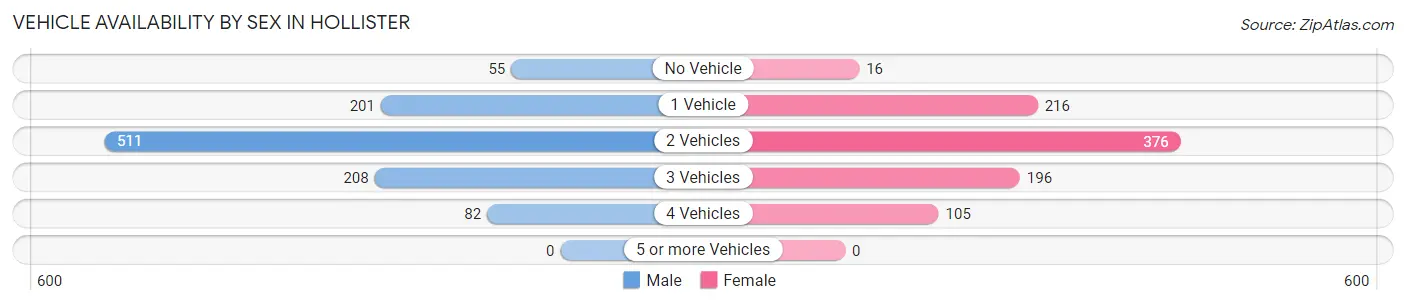
| Vehicles Available | Male | Female |
| No Vehicle | 55 (5.2%) | 16 (1.8%) |
| 1 Vehicle | 201 (19.0%) | 216 (23.8%) |
| 2 Vehicles | 511 (48.3%) | 376 (41.4%) |
| 3 Vehicles | 208 (19.7%) | 196 (21.6%) |
| 4 Vehicles | 82 (7.8%) | 105 (11.6%) |
| 5 or more Vehicles | 0 (0.0%) | 0 (0.0%) |
| Total | 1,057 (100.0%) | 909 (100.0%) |
Commute Time in Hollister
The most frequently occuring commute durations in Hollister are 15 to 19 minutes (502 commuters, 25.7%), 20 to 24 minutes (398 commuters, 20.4%), and 30 to 34 minutes (340 commuters, 17.4%).
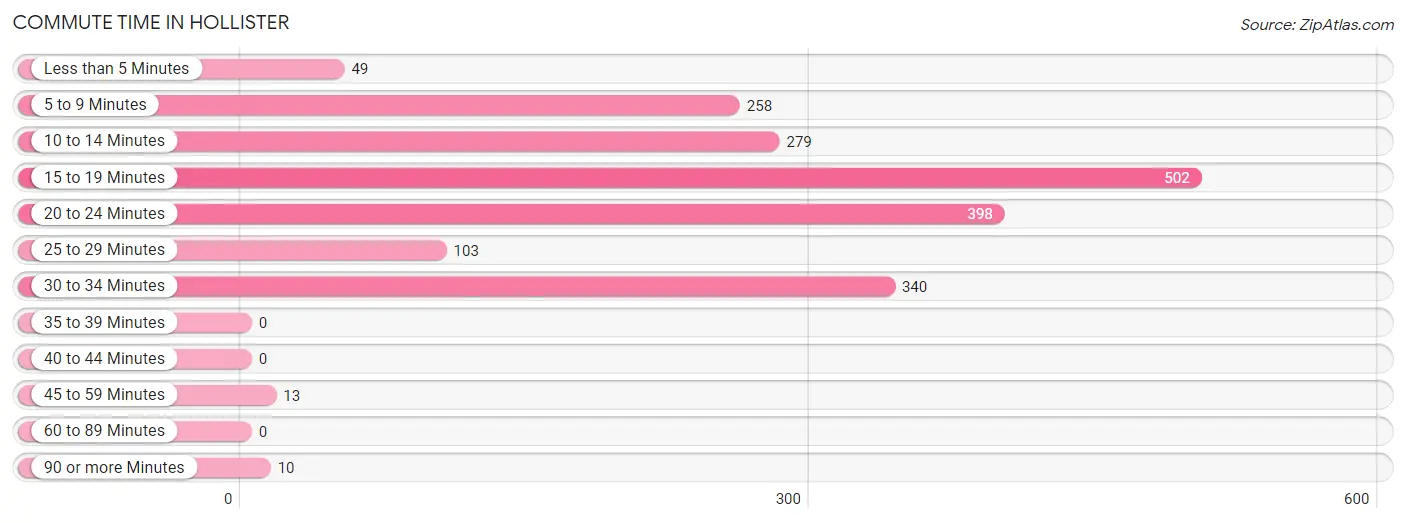
| Commute Time | # Commuters | % Commuters |
| Less than 5 Minutes | 49 | 2.5% |
| 5 to 9 Minutes | 258 | 13.2% |
| 10 to 14 Minutes | 279 | 14.3% |
| 15 to 19 Minutes | 502 | 25.7% |
| 20 to 24 Minutes | 398 | 20.4% |
| 25 to 29 Minutes | 103 | 5.3% |
| 30 to 34 Minutes | 340 | 17.4% |
| 35 to 39 Minutes | 0 | 0.0% |
| 40 to 44 Minutes | 0 | 0.0% |
| 45 to 59 Minutes | 13 | 0.7% |
| 60 to 89 Minutes | 0 | 0.0% |
| 90 or more Minutes | 10 | 0.5% |
Commute Time by Sex in Hollister
The most common commute times in Hollister are 20 to 24 minutes (235 commuters, 22.5%) for males and 15 to 19 minutes (280 commuters, 30.8%) for females.
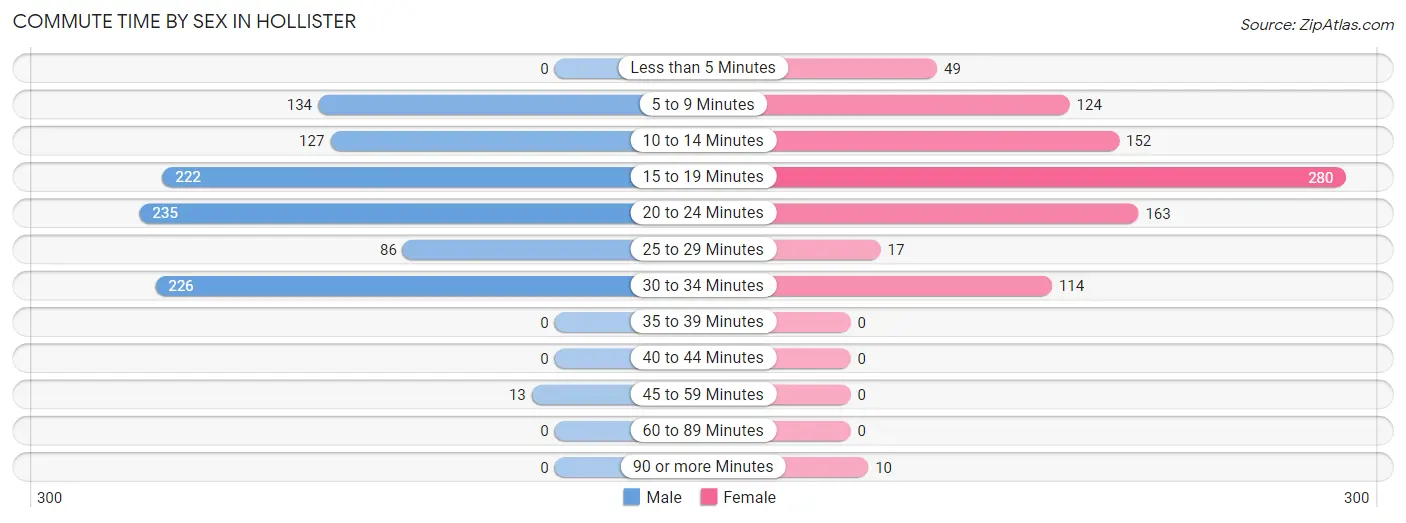
| Commute Time | Male | Female |
| Less than 5 Minutes | 0 (0.0%) | 49 (5.4%) |
| 5 to 9 Minutes | 134 (12.9%) | 124 (13.6%) |
| 10 to 14 Minutes | 127 (12.2%) | 152 (16.7%) |
| 15 to 19 Minutes | 222 (21.3%) | 280 (30.8%) |
| 20 to 24 Minutes | 235 (22.5%) | 163 (17.9%) |
| 25 to 29 Minutes | 86 (8.3%) | 17 (1.9%) |
| 30 to 34 Minutes | 226 (21.7%) | 114 (12.5%) |
| 35 to 39 Minutes | 0 (0.0%) | 0 (0.0%) |
| 40 to 44 Minutes | 0 (0.0%) | 0 (0.0%) |
| 45 to 59 Minutes | 13 (1.3%) | 0 (0.0%) |
| 60 to 89 Minutes | 0 (0.0%) | 0 (0.0%) |
| 90 or more Minutes | 0 (0.0%) | 10 (1.1%) |
Time of Departure to Work by Sex in Hollister
The most frequent times of departure to work in Hollister are 7:00 AM to 7:29 AM (220, 21.1%) for males and 7:30 AM to 7:59 AM (182, 20.0%) for females.
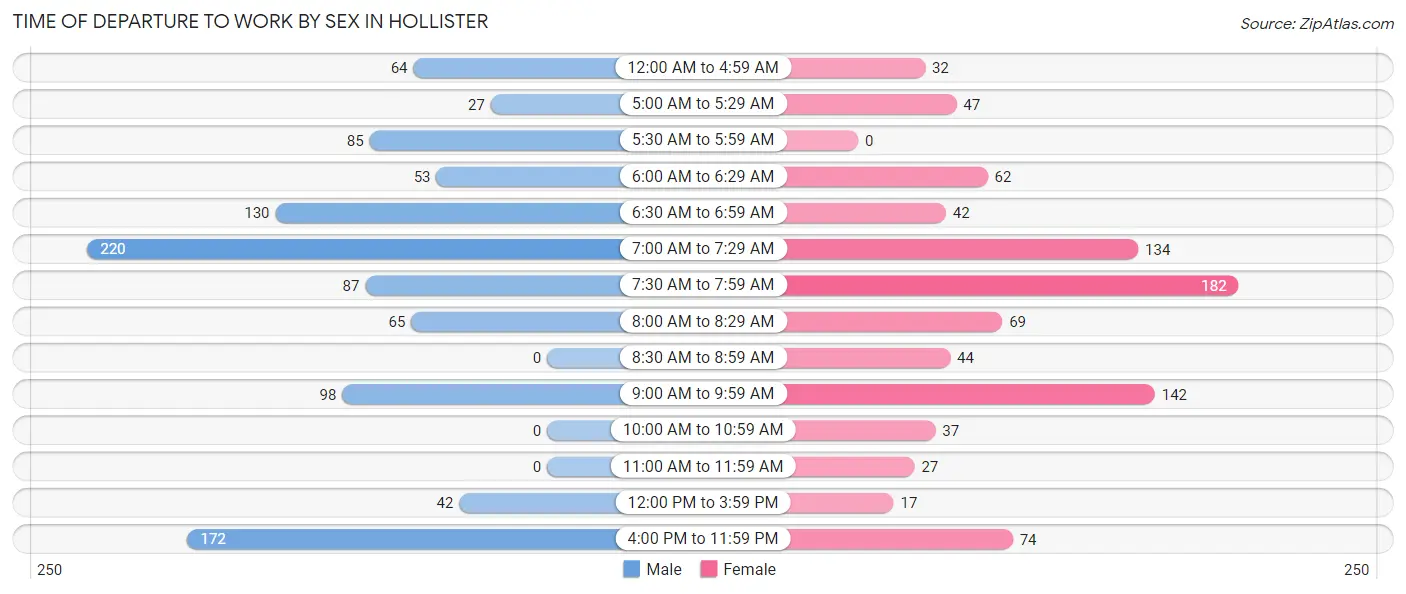
| Time of Departure | Male | Female |
| 12:00 AM to 4:59 AM | 64 (6.1%) | 32 (3.5%) |
| 5:00 AM to 5:29 AM | 27 (2.6%) | 47 (5.2%) |
| 5:30 AM to 5:59 AM | 85 (8.2%) | 0 (0.0%) |
| 6:00 AM to 6:29 AM | 53 (5.1%) | 62 (6.8%) |
| 6:30 AM to 6:59 AM | 130 (12.5%) | 42 (4.6%) |
| 7:00 AM to 7:29 AM | 220 (21.1%) | 134 (14.7%) |
| 7:30 AM to 7:59 AM | 87 (8.3%) | 182 (20.0%) |
| 8:00 AM to 8:29 AM | 65 (6.2%) | 69 (7.6%) |
| 8:30 AM to 8:59 AM | 0 (0.0%) | 44 (4.8%) |
| 9:00 AM to 9:59 AM | 98 (9.4%) | 142 (15.6%) |
| 10:00 AM to 10:59 AM | 0 (0.0%) | 37 (4.1%) |
| 11:00 AM to 11:59 AM | 0 (0.0%) | 27 (3.0%) |
| 12:00 PM to 3:59 PM | 42 (4.0%) | 17 (1.9%) |
| 4:00 PM to 11:59 PM | 172 (16.5%) | 74 (8.1%) |
| Total | 1,043 (100.0%) | 909 (100.0%) |
Housing Occupancy in Hollister
Occupancy by Ownership in Hollister
Of the total 1,797 dwellings in Hollister, owner-occupied units account for 1,135 (63.2%), while renter-occupied units make up 662 (36.8%).
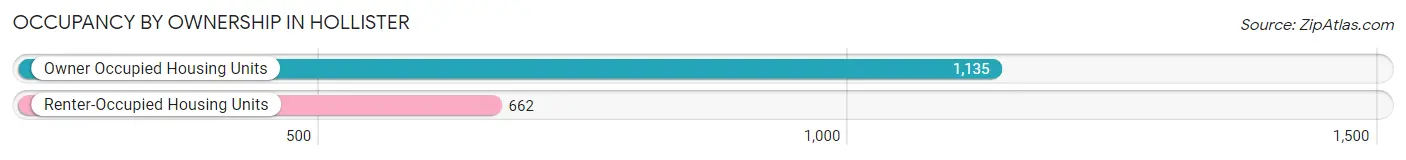
| Occupancy | # Housing Units | % Housing Units |
| Owner Occupied Housing Units | 1,135 | 63.2% |
| Renter-Occupied Housing Units | 662 | 36.8% |
| Total Occupied Housing Units | 1,797 | 100.0% |
Occupancy by Household Size in Hollister
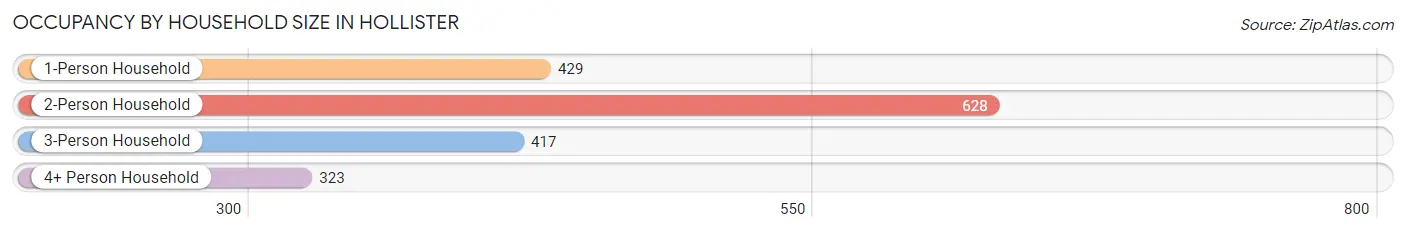
| Household Size | # Housing Units | % Housing Units |
| 1-Person Household | 429 | 23.9% |
| 2-Person Household | 628 | 34.9% |
| 3-Person Household | 417 | 23.2% |
| 4+ Person Household | 323 | 18.0% |
| Total Housing Units | 1,797 | 100.0% |
Occupancy by Ownership by Household Size in Hollister
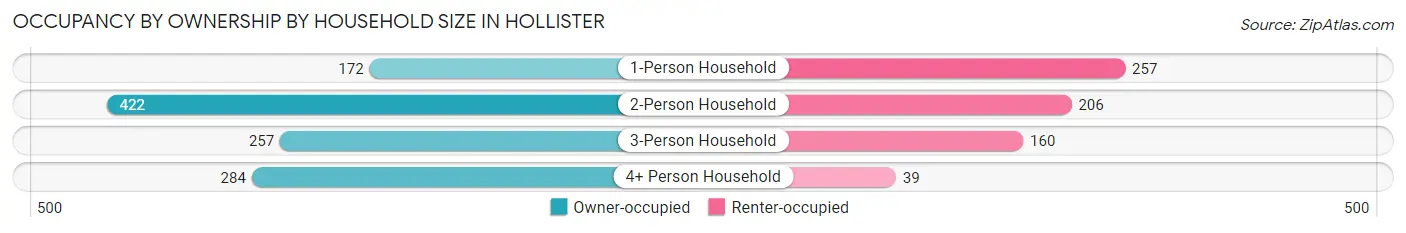
| Household Size | Owner-occupied | Renter-occupied |
| 1-Person Household | 172 (40.1%) | 257 (59.9%) |
| 2-Person Household | 422 (67.2%) | 206 (32.8%) |
| 3-Person Household | 257 (61.6%) | 160 (38.4%) |
| 4+ Person Household | 284 (87.9%) | 39 (12.1%) |
| Total Housing Units | 1,135 (63.2%) | 662 (36.8%) |
Occupancy by Educational Attainment in Hollister
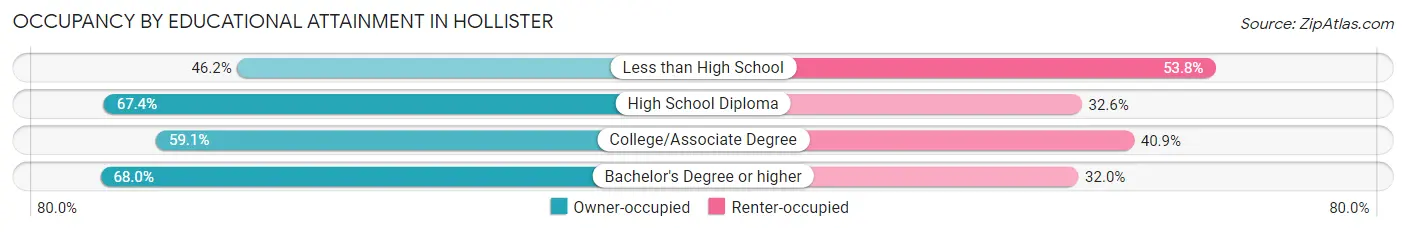
| Household Size | Owner-occupied | Renter-occupied |
| Less than High School | 49 (46.2%) | 57 (53.8%) |
| High School Diploma | 439 (67.4%) | 212 (32.6%) |
| College/Associate Degree | 401 (59.1%) | 277 (40.9%) |
| Bachelor's Degree or higher | 246 (68.0%) | 116 (32.0%) |
Occupancy by Age of Householder in Hollister
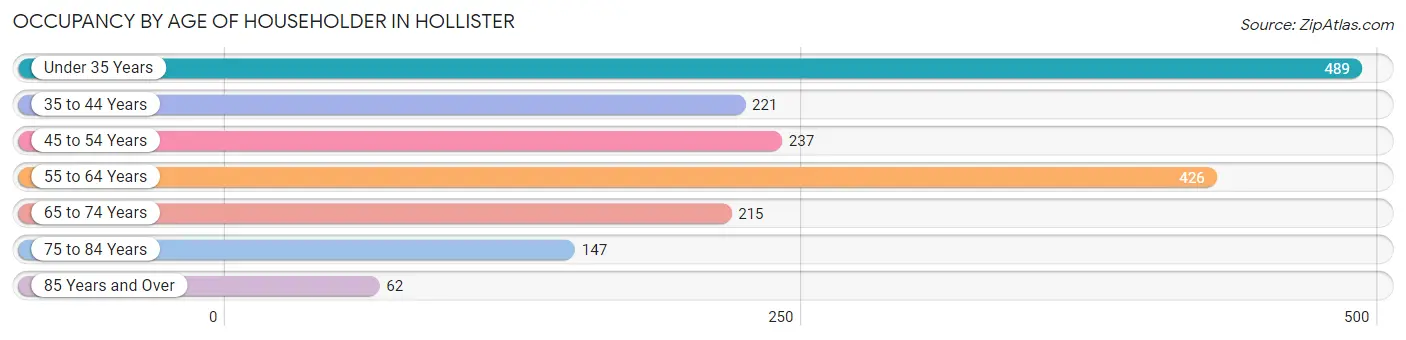
| Age Bracket | # Households | % Households |
| Under 35 Years | 489 | 27.2% |
| 35 to 44 Years | 221 | 12.3% |
| 45 to 54 Years | 237 | 13.2% |
| 55 to 64 Years | 426 | 23.7% |
| 65 to 74 Years | 215 | 12.0% |
| 75 to 84 Years | 147 | 8.2% |
| 85 Years and Over | 62 | 3.5% |
| Total | 1,797 | 100.0% |
Housing Finances in Hollister
Median Income by Occupancy in Hollister
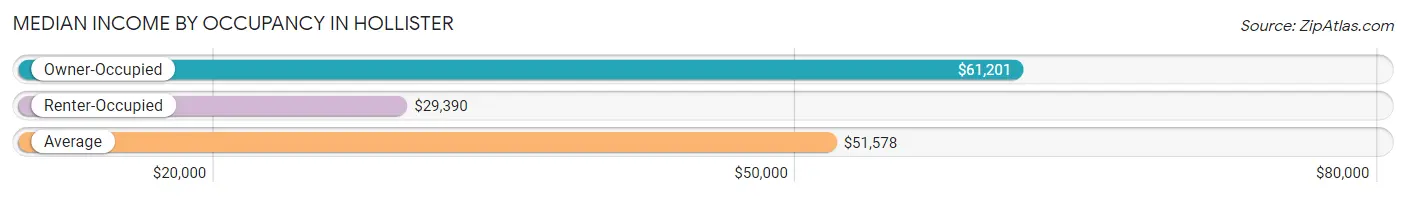
| Occupancy Type | # Households | Median Income |
| Owner-Occupied | 1,135 (63.2%) | $61,201 |
| Renter-Occupied | 662 (36.8%) | $29,390 |
| Average | 1,797 (100.0%) | $51,578 |
Occupancy by Householder Income Bracket in Hollister
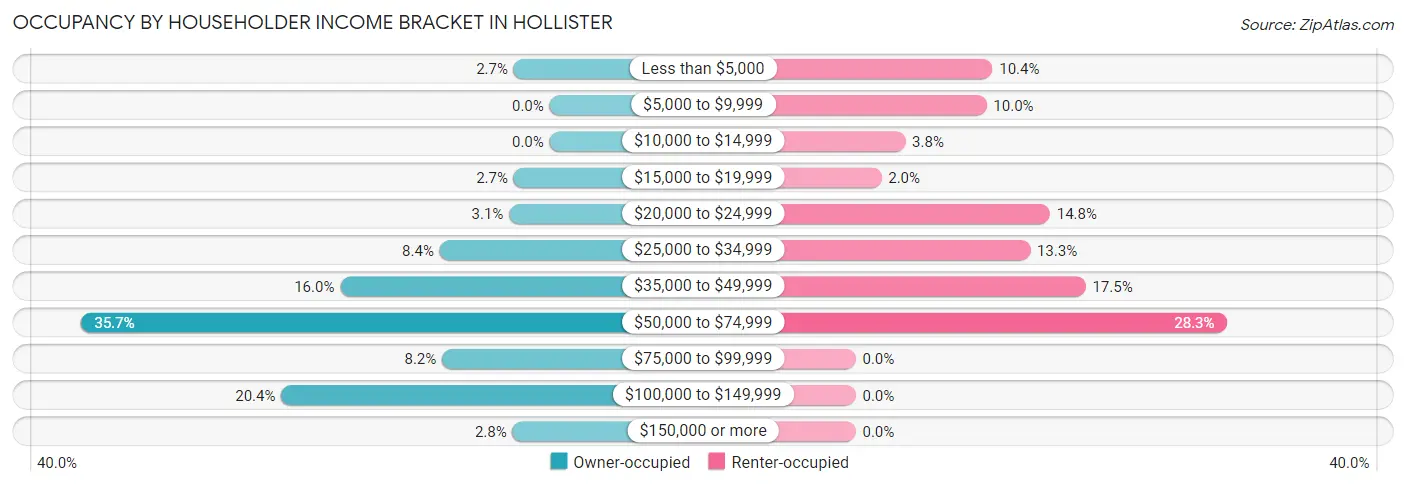
| Income Bracket | Owner-occupied | Renter-occupied |
| Less than $5,000 | 31 (2.7%) | 69 (10.4%) |
| $5,000 to $9,999 | 0 (0.0%) | 66 (10.0%) |
| $10,000 to $14,999 | 0 (0.0%) | 25 (3.8%) |
| $15,000 to $19,999 | 31 (2.7%) | 13 (2.0%) |
| $20,000 to $24,999 | 35 (3.1%) | 98 (14.8%) |
| $25,000 to $34,999 | 95 (8.4%) | 88 (13.3%) |
| $35,000 to $49,999 | 181 (16.0%) | 116 (17.5%) |
| $50,000 to $74,999 | 405 (35.7%) | 187 (28.2%) |
| $75,000 to $99,999 | 93 (8.2%) | 0 (0.0%) |
| $100,000 to $149,999 | 232 (20.4%) | 0 (0.0%) |
| $150,000 or more | 32 (2.8%) | 0 (0.0%) |
| Total | 1,135 (100.0%) | 662 (100.0%) |
Monthly Housing Cost Tiers in Hollister
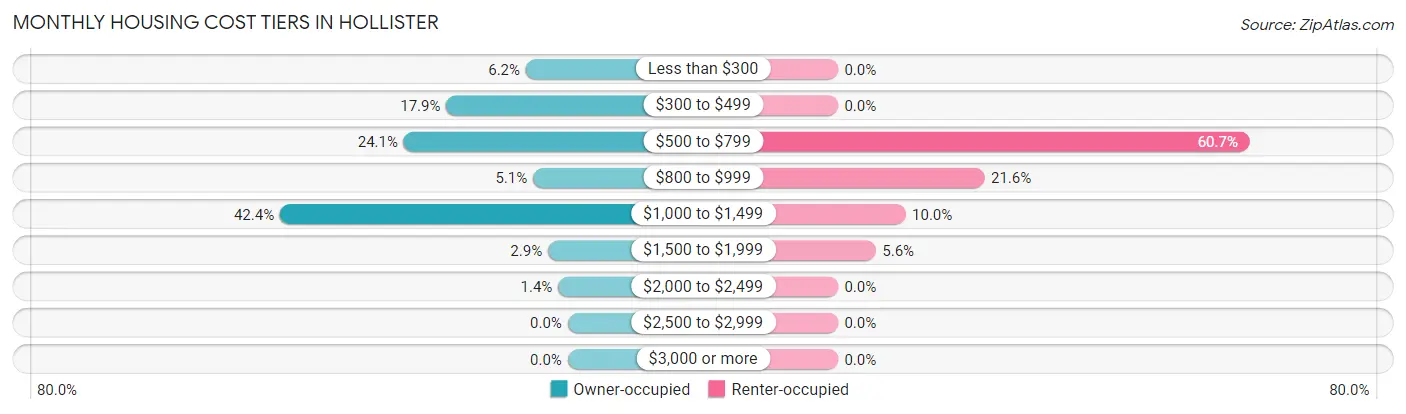
| Monthly Cost | Owner-occupied | Renter-occupied |
| Less than $300 | 70 (6.2%) | 0 (0.0%) |
| $300 to $499 | 203 (17.9%) | 0 (0.0%) |
| $500 to $799 | 274 (24.1%) | 402 (60.7%) |
| $800 to $999 | 58 (5.1%) | 143 (21.6%) |
| $1,000 to $1,499 | 481 (42.4%) | 66 (10.0%) |
| $1,500 to $1,999 | 33 (2.9%) | 37 (5.6%) |
| $2,000 to $2,499 | 16 (1.4%) | 0 (0.0%) |
| $2,500 to $2,999 | 0 (0.0%) | 0 (0.0%) |
| $3,000 or more | 0 (0.0%) | 0 (0.0%) |
| Total | 1,135 (100.0%) | 662 (100.0%) |
Physical Housing Characteristics in Hollister
Housing Structures in Hollister
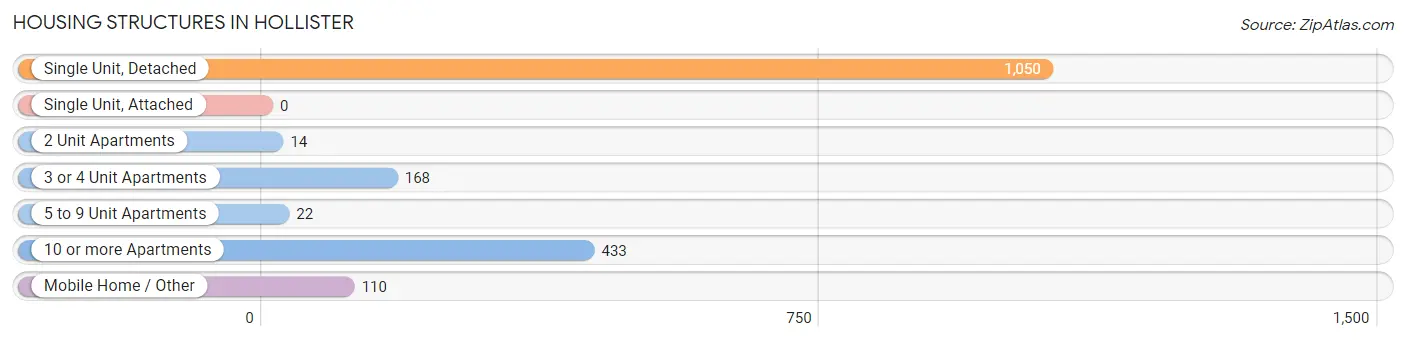
| Structure Type | # Housing Units | % Housing Units |
| Single Unit, Detached | 1,050 | 58.4% |
| Single Unit, Attached | 0 | 0.0% |
| 2 Unit Apartments | 14 | 0.8% |
| 3 or 4 Unit Apartments | 168 | 9.3% |
| 5 to 9 Unit Apartments | 22 | 1.2% |
| 10 or more Apartments | 433 | 24.1% |
| Mobile Home / Other | 110 | 6.1% |
| Total | 1,797 | 100.0% |
Housing Structures by Occupancy in Hollister
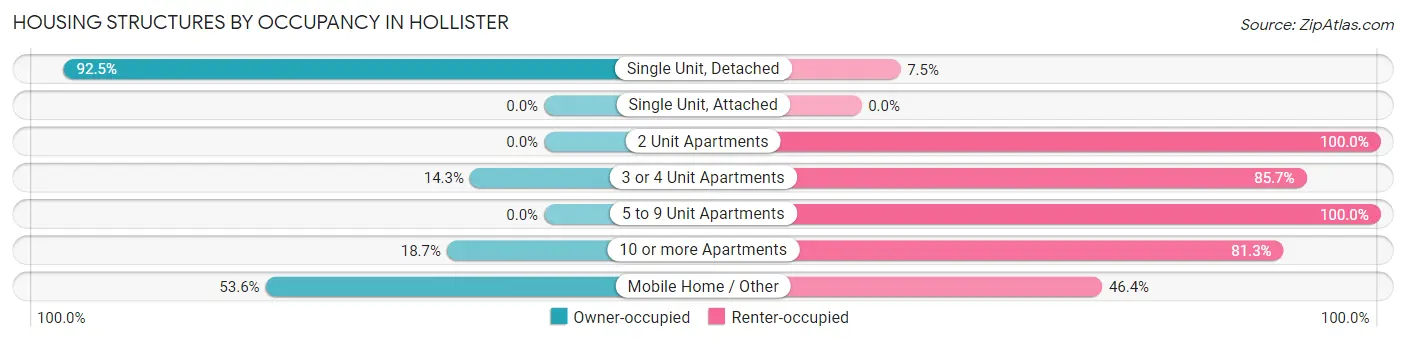
| Structure Type | Owner-occupied | Renter-occupied |
| Single Unit, Detached | 971 (92.5%) | 79 (7.5%) |
| Single Unit, Attached | 0 (0.0%) | 0 (0.0%) |
| 2 Unit Apartments | 0 (0.0%) | 14 (100.0%) |
| 3 or 4 Unit Apartments | 24 (14.3%) | 144 (85.7%) |
| 5 to 9 Unit Apartments | 0 (0.0%) | 22 (100.0%) |
| 10 or more Apartments | 81 (18.7%) | 352 (81.3%) |
| Mobile Home / Other | 59 (53.6%) | 51 (46.4%) |
| Total | 1,135 (63.2%) | 662 (36.8%) |
Housing Structures by Number of Rooms in Hollister
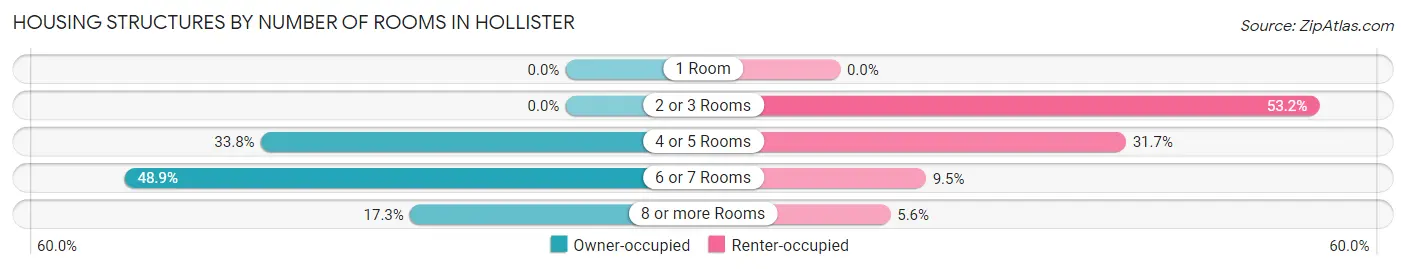
| Number of Rooms | Owner-occupied | Renter-occupied |
| 1 Room | 0 (0.0%) | 0 (0.0%) |
| 2 or 3 Rooms | 0 (0.0%) | 352 (53.2%) |
| 4 or 5 Rooms | 384 (33.8%) | 210 (31.7%) |
| 6 or 7 Rooms | 555 (48.9%) | 63 (9.5%) |
| 8 or more Rooms | 196 (17.3%) | 37 (5.6%) |
| Total | 1,135 (100.0%) | 662 (100.0%) |
Housing Structure by Heating Type in Hollister
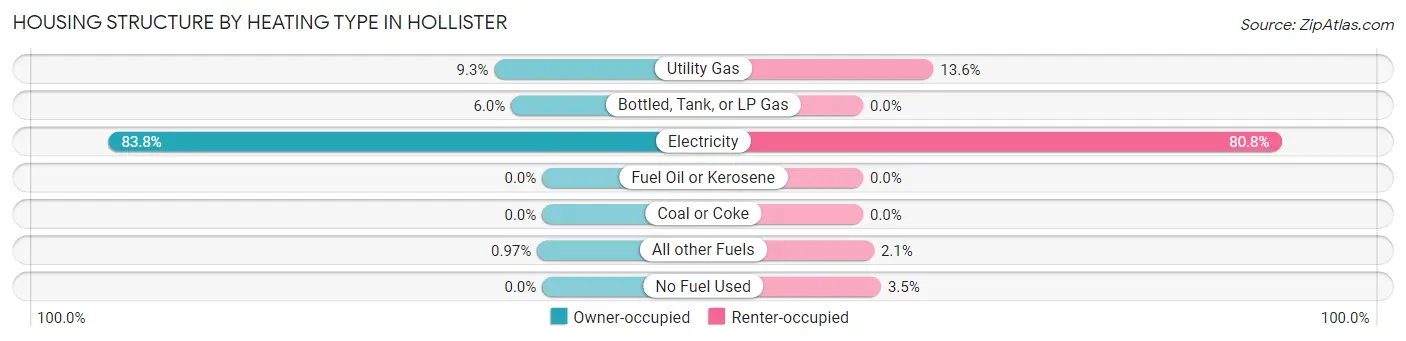
| Heating Type | Owner-occupied | Renter-occupied |
| Utility Gas | 105 (9.2%) | 90 (13.6%) |
| Bottled, Tank, or LP Gas | 68 (6.0%) | 0 (0.0%) |
| Electricity | 951 (83.8%) | 535 (80.8%) |
| Fuel Oil or Kerosene | 0 (0.0%) | 0 (0.0%) |
| Coal or Coke | 0 (0.0%) | 0 (0.0%) |
| All other Fuels | 11 (1.0%) | 14 (2.1%) |
| No Fuel Used | 0 (0.0%) | 23 (3.5%) |
| Total | 1,135 (100.0%) | 662 (100.0%) |
Household Vehicle Usage in Hollister
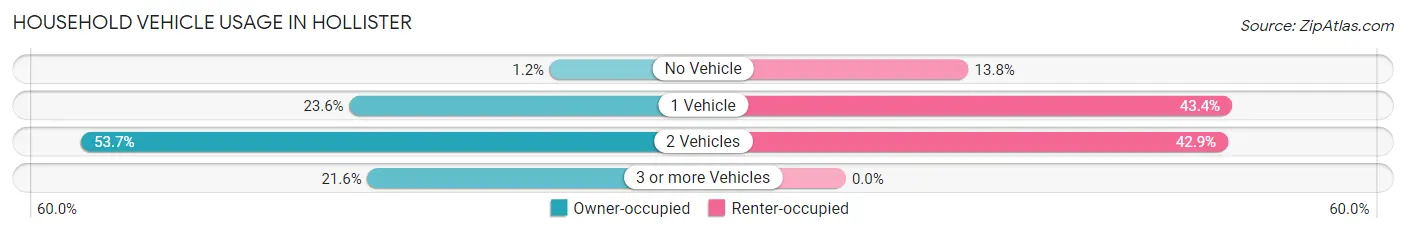
| Vehicles per Household | Owner-occupied | Renter-occupied |
| No Vehicle | 13 (1.1%) | 91 (13.8%) |
| 1 Vehicle | 268 (23.6%) | 287 (43.3%) |
| 2 Vehicles | 609 (53.7%) | 284 (42.9%) |
| 3 or more Vehicles | 245 (21.6%) | 0 (0.0%) |
| Total | 1,135 (100.0%) | 662 (100.0%) |
Real Estate & Mortgages in Hollister
Real Estate and Mortgage Overview in Hollister
| Characteristic | Without Mortgage | With Mortgage |
| Housing Units | 415 | 720 |
| Median Property Value | $138,400 | $154,500 |
| Median Household Income | $61,401 | $15 |
| Monthly Housing Costs | $399 | $0 |
| Real Estate Taxes | $893 | $0 |
Property Value by Mortgage Status in Hollister
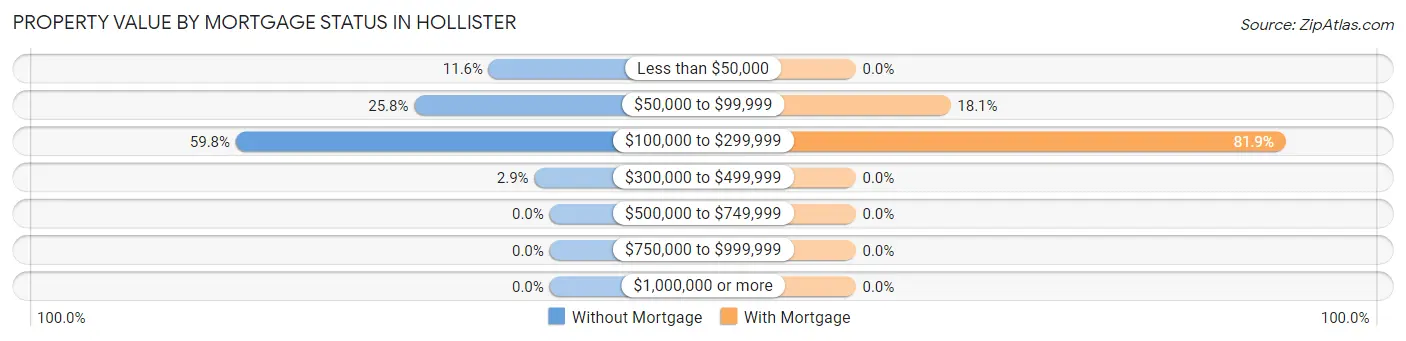
| Property Value | Without Mortgage | With Mortgage |
| Less than $50,000 | 48 (11.6%) | 0 (0.0%) |
| $50,000 to $99,999 | 107 (25.8%) | 130 (18.1%) |
| $100,000 to $299,999 | 248 (59.8%) | 590 (81.9%) |
| $300,000 to $499,999 | 12 (2.9%) | 0 (0.0%) |
| $500,000 to $749,999 | 0 (0.0%) | 0 (0.0%) |
| $750,000 to $999,999 | 0 (0.0%) | 0 (0.0%) |
| $1,000,000 or more | 0 (0.0%) | 0 (0.0%) |
| Total | 415 (100.0%) | 720 (100.0%) |
Household Income by Mortgage Status in Hollister
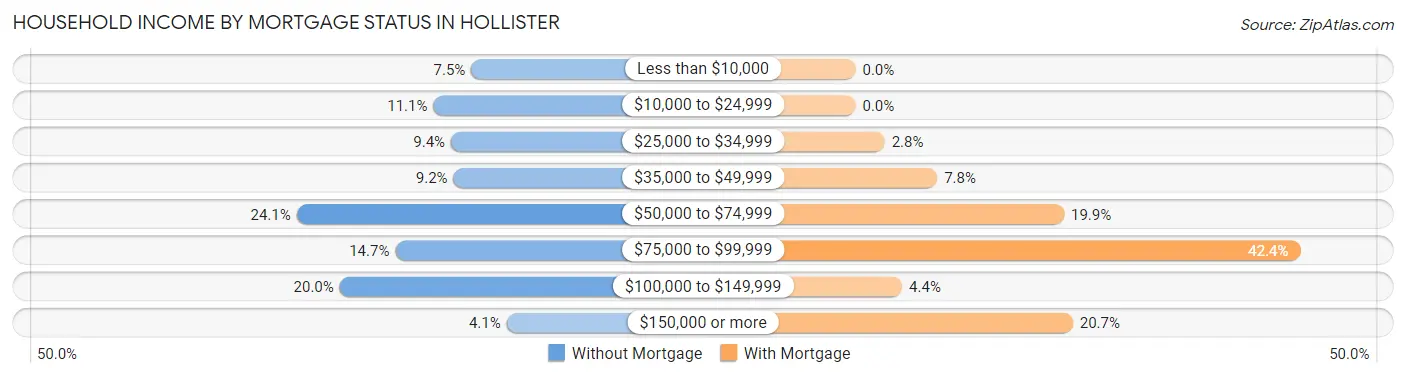
| Household Income | Without Mortgage | With Mortgage |
| Less than $10,000 | 31 (7.5%) | 0 (0.0%) |
| $10,000 to $24,999 | 46 (11.1%) | 0 (0.0%) |
| $25,000 to $34,999 | 39 (9.4%) | 20 (2.8%) |
| $35,000 to $49,999 | 38 (9.2%) | 56 (7.8%) |
| $50,000 to $74,999 | 100 (24.1%) | 143 (19.9%) |
| $75,000 to $99,999 | 61 (14.7%) | 305 (42.4%) |
| $100,000 to $149,999 | 83 (20.0%) | 32 (4.4%) |
| $150,000 or more | 17 (4.1%) | 149 (20.7%) |
| Total | 415 (100.0%) | 720 (100.0%) |
Property Value to Household Income Ratio in Hollister
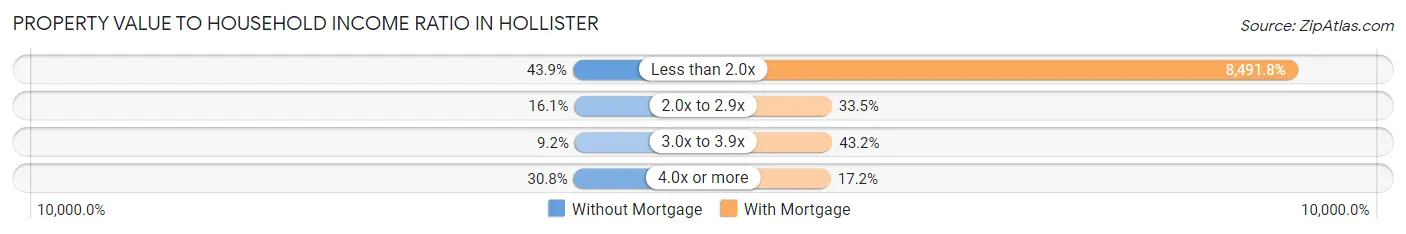
| Value-to-Income Ratio | Without Mortgage | With Mortgage |
| Less than 2.0x | 182 (43.9%) | 61,141 (8,491.8%) |
| 2.0x to 2.9x | 67 (16.1%) | 241 (33.5%) |
| 3.0x to 3.9x | 38 (9.2%) | 311 (43.2%) |
| 4.0x or more | 128 (30.8%) | 124 (17.2%) |
| Total | 415 (100.0%) | 720 (100.0%) |
Real Estate Taxes by Mortgage Status in Hollister
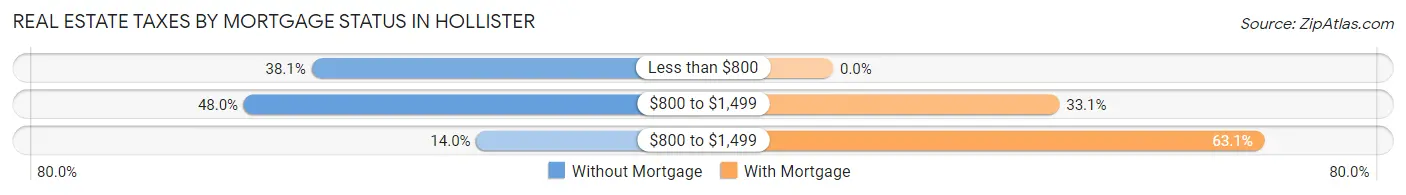
| Property Taxes | Without Mortgage | With Mortgage |
| Less than $800 | 158 (38.1%) | 0 (0.0%) |
| $800 to $1,499 | 199 (47.9%) | 238 (33.1%) |
| $800 to $1,499 | 58 (14.0%) | 454 (63.1%) |
| Total | 415 (100.0%) | 720 (100.0%) |
Health & Disability in Hollister
Health Insurance Coverage by Age in Hollister
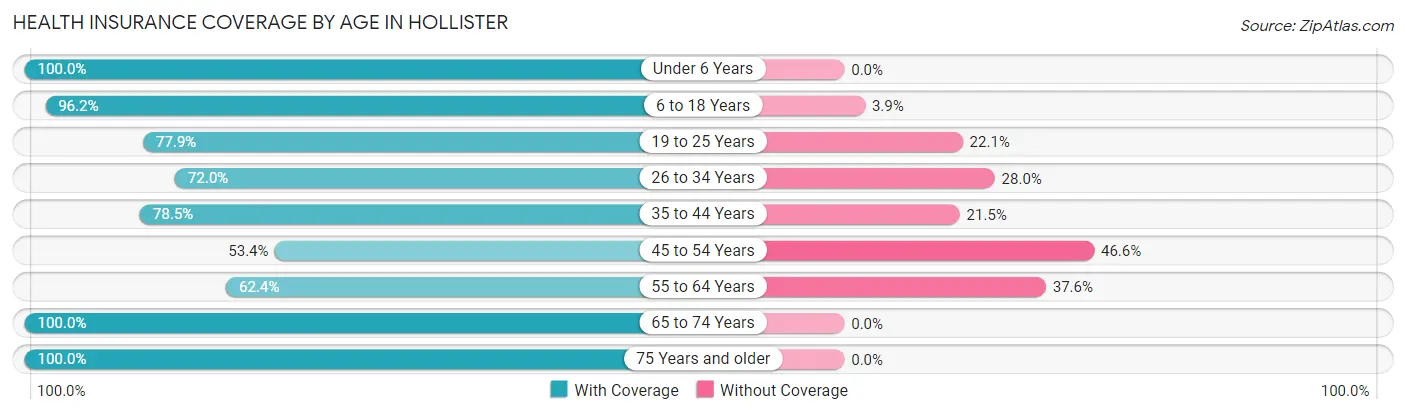
| Age Bracket | With Coverage | Without Coverage |
| Under 6 Years | 325 (100.0%) | 0 (0.0%) |
| 6 to 18 Years | 775 (96.2%) | 31 (3.8%) |
| 19 to 25 Years | 406 (77.9%) | 115 (22.1%) |
| 26 to 34 Years | 403 (72.0%) | 157 (28.0%) |
| 35 to 44 Years | 427 (78.5%) | 117 (21.5%) |
| 45 to 54 Years | 288 (53.4%) | 251 (46.6%) |
| 55 to 64 Years | 349 (62.4%) | 210 (37.6%) |
| 65 to 74 Years | 340 (100.0%) | 0 (0.0%) |
| 75 Years and older | 286 (100.0%) | 0 (0.0%) |
| Total | 3,599 (80.3%) | 881 (19.7%) |
Health Insurance Coverage by Citizenship Status in Hollister
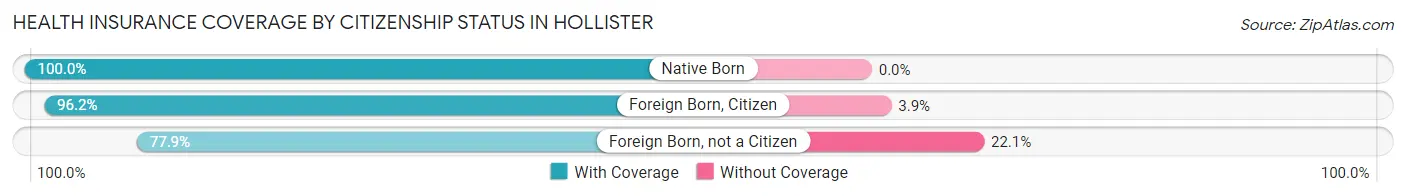
| Citizenship Status | With Coverage | Without Coverage |
| Native Born | 325 (100.0%) | 0 (0.0%) |
| Foreign Born, Citizen | 775 (96.2%) | 31 (3.8%) |
| Foreign Born, not a Citizen | 406 (77.9%) | 115 (22.1%) |
Health Insurance Coverage by Household Income in Hollister
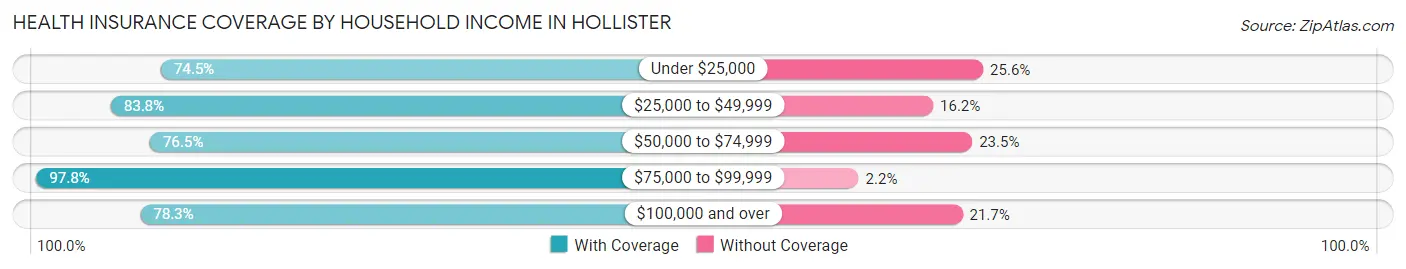
| Household Income | With Coverage | Without Coverage |
| Under $25,000 | 338 (74.5%) | 116 (25.6%) |
| $25,000 to $49,999 | 892 (83.8%) | 172 (16.2%) |
| $50,000 to $74,999 | 1,250 (76.5%) | 384 (23.5%) |
| $75,000 to $99,999 | 397 (97.8%) | 9 (2.2%) |
| $100,000 and over | 722 (78.3%) | 200 (21.7%) |
Public vs Private Health Insurance Coverage by Age in Hollister
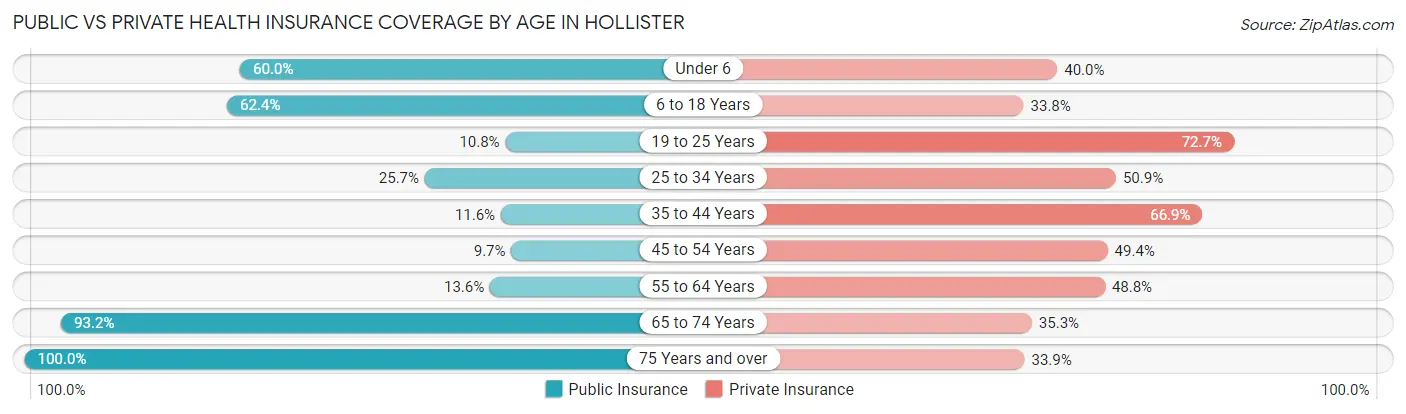
| Age Bracket | Public Insurance | Private Insurance |
| Under 6 | 195 (60.0%) | 130 (40.0%) |
| 6 to 18 Years | 503 (62.4%) | 272 (33.8%) |
| 19 to 25 Years | 56 (10.7%) | 379 (72.7%) |
| 25 to 34 Years | 144 (25.7%) | 285 (50.9%) |
| 35 to 44 Years | 63 (11.6%) | 364 (66.9%) |
| 45 to 54 Years | 52 (9.7%) | 266 (49.3%) |
| 55 to 64 Years | 76 (13.6%) | 273 (48.8%) |
| 65 to 74 Years | 317 (93.2%) | 120 (35.3%) |
| 75 Years and over | 286 (100.0%) | 97 (33.9%) |
| Total | 1,692 (37.8%) | 2,186 (48.8%) |
Disability Status by Sex by Age in Hollister
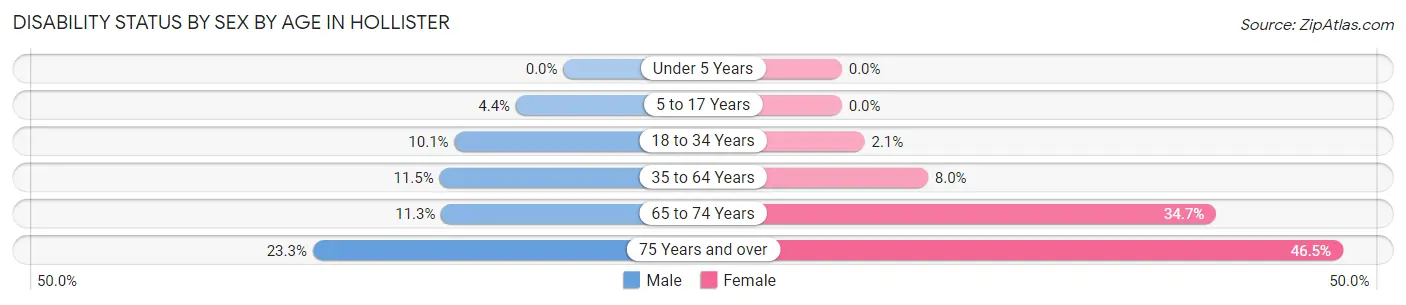
| Age Bracket | Male | Female |
| Under 5 Years | 0 (0.0%) | 0 (0.0%) |
| 5 to 17 Years | 14 (4.4%) | 0 (0.0%) |
| 18 to 34 Years | 56 (10.1%) | 12 (2.1%) |
| 35 to 64 Years | 88 (11.5%) | 70 (8.0%) |
| 65 to 74 Years | 17 (11.3%) | 66 (34.7%) |
| 75 Years and over | 30 (23.3%) | 73 (46.5%) |
Disability Class by Sex by Age in Hollister
Disability Class: Hearing Difficulty
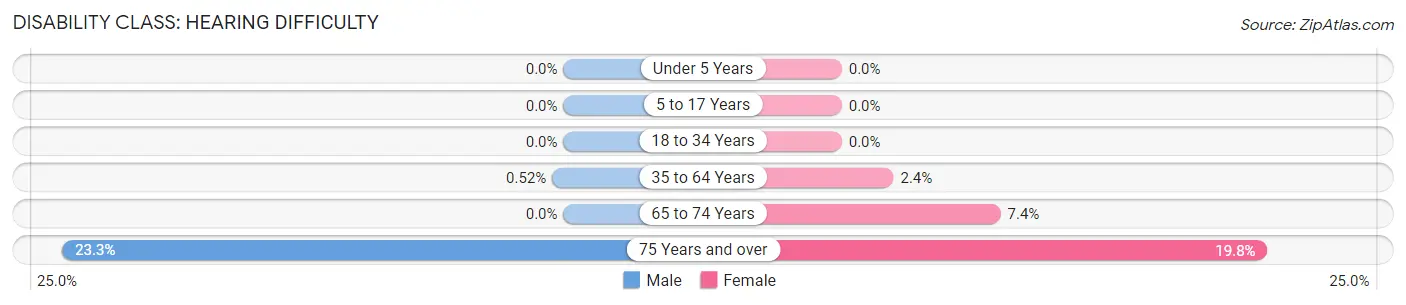
| Age Bracket | Male | Female |
| Under 5 Years | 0 (0.0%) | 0 (0.0%) |
| 5 to 17 Years | 0 (0.0%) | 0 (0.0%) |
| 18 to 34 Years | 0 (0.0%) | 0 (0.0%) |
| 35 to 64 Years | 4 (0.5%) | 21 (2.4%) |
| 65 to 74 Years | 0 (0.0%) | 14 (7.4%) |
| 75 Years and over | 30 (23.3%) | 31 (19.8%) |
Disability Class: Vision Difficulty
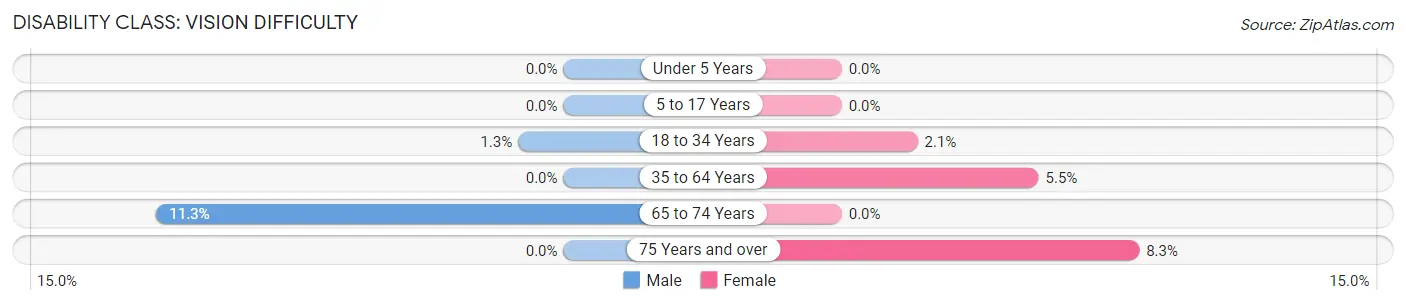
| Age Bracket | Male | Female |
| Under 5 Years | 0 (0.0%) | 0 (0.0%) |
| 5 to 17 Years | 0 (0.0%) | 0 (0.0%) |
| 18 to 34 Years | 7 (1.3%) | 12 (2.1%) |
| 35 to 64 Years | 0 (0.0%) | 48 (5.5%) |
| 65 to 74 Years | 17 (11.3%) | 0 (0.0%) |
| 75 Years and over | 0 (0.0%) | 13 (8.3%) |
Disability Class: Cognitive Difficulty
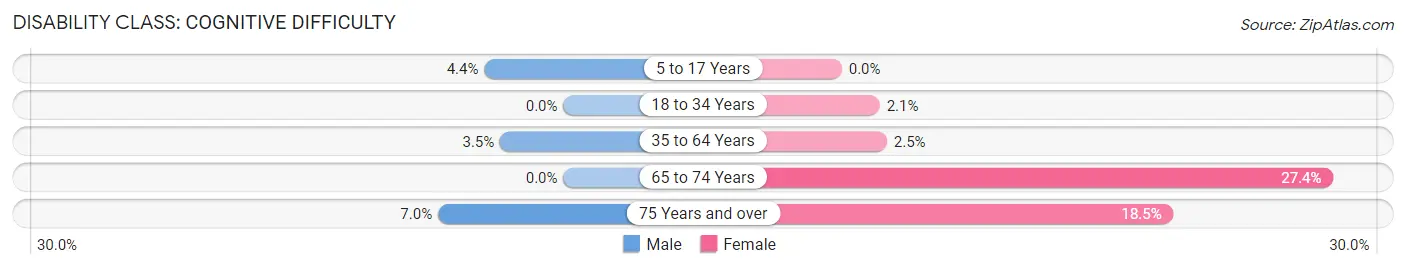
| Age Bracket | Male | Female |
| 5 to 17 Years | 14 (4.4%) | 0 (0.0%) |
| 18 to 34 Years | 0 (0.0%) | 12 (2.1%) |
| 35 to 64 Years | 27 (3.5%) | 22 (2.5%) |
| 65 to 74 Years | 0 (0.0%) | 52 (27.4%) |
| 75 Years and over | 9 (7.0%) | 29 (18.5%) |
Disability Class: Ambulatory Difficulty
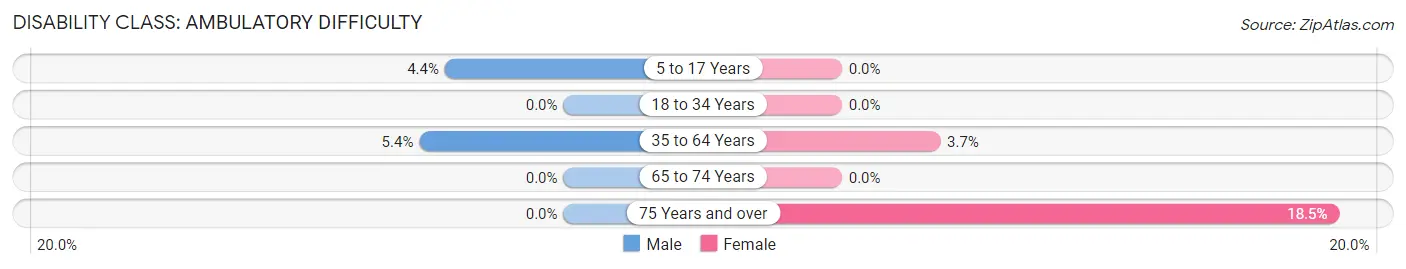
| Age Bracket | Male | Female |
| 5 to 17 Years | 14 (4.4%) | 0 (0.0%) |
| 18 to 34 Years | 0 (0.0%) | 0 (0.0%) |
| 35 to 64 Years | 41 (5.3%) | 32 (3.6%) |
| 65 to 74 Years | 0 (0.0%) | 0 (0.0%) |
| 75 Years and over | 0 (0.0%) | 29 (18.5%) |
Disability Class: Self-Care Difficulty
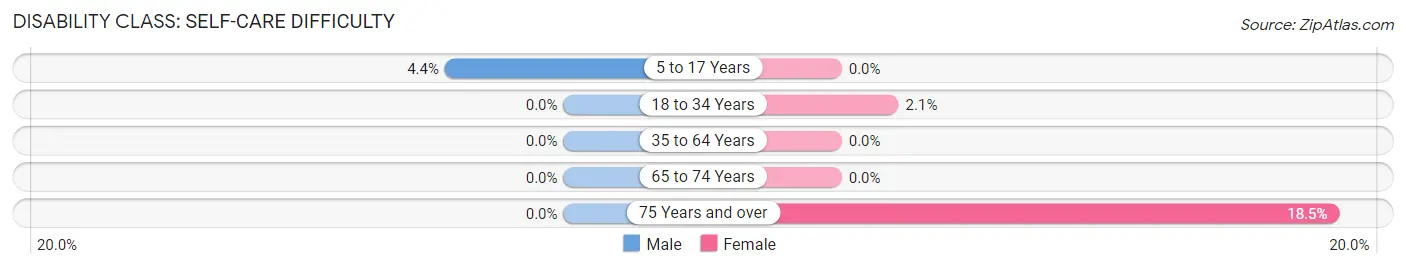
| Age Bracket | Male | Female |
| 5 to 17 Years | 14 (4.4%) | 0 (0.0%) |
| 18 to 34 Years | 0 (0.0%) | 12 (2.1%) |
| 35 to 64 Years | 0 (0.0%) | 0 (0.0%) |
| 65 to 74 Years | 0 (0.0%) | 0 (0.0%) |
| 75 Years and over | 0 (0.0%) | 29 (18.5%) |
Technology Access in Hollister
Computing Device Access in Hollister
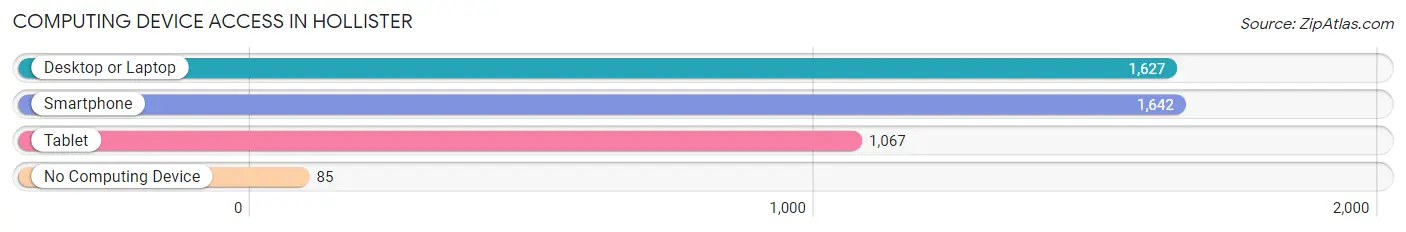
| Device Type | # Households | % Households |
| Desktop or Laptop | 1,627 | 90.5% |
| Smartphone | 1,642 | 91.4% |
| Tablet | 1,067 | 59.4% |
| No Computing Device | 85 | 4.7% |
| Total | 1,797 | 100.0% |
Internet Access in Hollister
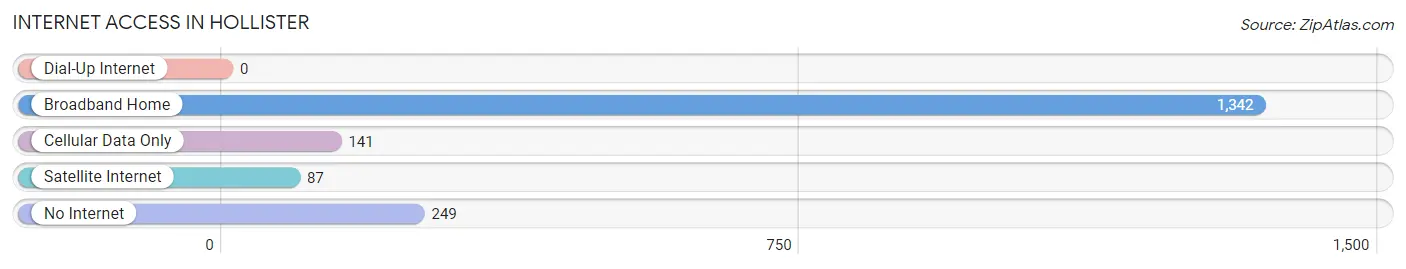
| Internet Type | # Households | % Households |
| Dial-Up Internet | 0 | 0.0% |
| Broadband Home | 1,342 | 74.7% |
| Cellular Data Only | 141 | 7.9% |
| Satellite Internet | 87 | 4.8% |
| No Internet | 249 | 13.9% |
| Total | 1,797 | 100.0% |
Hollister Summary
Hollister, Missouri is a small city located in Taney County, in the Ozark Mountains of southwestern Missouri. The city is situated on the banks of Lake Taneycomo, and is home to approximately 4,000 people. The city is known for its outdoor recreation opportunities, including fishing, boating, and hiking.
History
Hollister was founded in 1883 by a group of settlers from the nearby town of Forsyth. The settlers were looking for a place to build a new town, and chose the area around Lake Taneycomo due to its natural beauty and abundance of resources. The town was named after the Hollister family, who were among the first settlers.
The town quickly grew, and by the early 1900s, it had become a popular tourist destination. The town was known for its fishing, boating, and other outdoor activities. In the 1920s, the town was home to a number of resorts, including the famous Lake Taneycomo Resort.
In the 1950s, the town began to decline as the popularity of outdoor recreation shifted to other areas. However, in the late 1970s, the town began to experience a resurgence as people began to rediscover the beauty of the area. Today, Hollister is a popular destination for outdoor recreation, and is home to a number of resorts, restaurants, and other businesses.
Geography
Hollister is located in the Ozark Mountains of southwestern Missouri. The city is situated on the banks of Lake Taneycomo, a man-made lake created by the damming of the White River. The lake is a popular destination for fishing, boating, and other outdoor activities.
The city is located in Taney County, and is bordered by the cities of Forsyth, Branson, and Kimberling City. The city is located approximately 30 miles south of Springfield, Missouri, and is about an hour and a half drive from St. Louis.
Economy
Hollister’s economy is largely based on tourism and outdoor recreation. The city is home to a number of resorts, restaurants, and other businesses that cater to visitors. The city is also home to a number of manufacturing and industrial businesses, including a paper mill and a furniture factory.
The city is also home to a number of small businesses, including retail stores, restaurants, and other services. The city is also home to a number of medical facilities, including a hospital and a number of clinics.
Demographics
As of the 2010 census, the population of Hollister was 4,050. The population is predominantly white, with a small minority population. The median household income is $41,000, and the median home value is $150,000. The city has a low unemployment rate, and a high rate of homeownership.
Conclusion
Hollister, Missouri is a small city located in the Ozark Mountains of southwestern Missouri. The city is situated on the banks of Lake Taneycomo, and is home to approximately 4,000 people. The city is known for its outdoor recreation opportunities, including fishing, boating, and hiking. The city’s economy is largely based on tourism and outdoor recreation, and the city is home to a number of resorts, restaurants, and other businesses. The population of Hollister is predominantly white, with a small minority population. The median household income is $41,000, and the median home value is $150,000.
Common Questions
What is Per Capita Income in Hollister?
Per Capita income in Hollister is $22,944.
What is the Median Family Income in Hollister?
Median Family Income in Hollister is $60,227.
What is the Median Household income in Hollister?
Median Household Income in Hollister is $51,578.
What is Income or Wage Gap in Hollister?
Income or Wage Gap in Hollister is 5.1%.
Women in Hollister earn 94.9 cents for every dollar earned by a man.
What is Family Income Deficit in Hollister?
Family Income Deficit in Hollister is $4,306.
Families that are below poverty line in Hollister earn $4,306 less on average than the poverty threshold level.
What is Inequality or Gini Index in Hollister?
Inequality or Gini Index in Hollister is 0.36.
What is the Total Population of Hollister?
Total Population of Hollister is 4,585.
What is the Total Male Population of Hollister?
Total Male Population of Hollister is 2,034.
What is the Total Female Population of Hollister?
Total Female Population of Hollister is 2,551.
What is the Ratio of Males per 100 Females in Hollister?
There are 79.73 Males per 100 Females in Hollister.
What is the Ratio of Females per 100 Males in Hollister?
There are 125.42 Females per 100 Males in Hollister.
What is the Median Population Age in Hollister?
Median Population Age in Hollister is 35.8 Years.
What is the Average Family Size in Hollister
Average Family Size in Hollister is 3.0 People.
What is the Average Household Size in Hollister
Average Household Size in Hollister is 2.5 People.
How Large is the Labor Force in Hollister?
There are 2,179 People in the Labor Forcein in Hollister.
What is the Percentage of People in the Labor Force in Hollister?
61.2% of People are in the Labor Force in Hollister.
What is the Unemployment Rate in Hollister?
Unemployment Rate in Hollister is 7.5%.