Vadnais Heights, MN Map & Demographics
Vadnais Heights Map
Vadnais Heights Overview
$51,601
PER CAPITA INCOME
$129,513
AVG FAMILY INCOME
$89,632
AVG HOUSEHOLD INCOME
31.2%
WAGE / INCOME GAP [ % ]
68.8¢/ $1
WAGE / INCOME GAP [ $ ]
$12,479
FAMILY INCOME DEFICIT
0.42
INEQUALITY / GINI INDEX
12,864
TOTAL POPULATION
6,101
MALE POPULATION
6,763
FEMALE POPULATION
90.21
MALES / 100 FEMALES
110.85
FEMALES / 100 MALES
40.8
MEDIAN AGE
3.0
AVG FAMILY SIZE
2.3
AVG HOUSEHOLD SIZE
6,793
LABOR FORCE [ PEOPLE ]
67.2%
PERCENT IN LABOR FORCE
4.9%
UNEMPLOYMENT RATE
Vadnais Heights Area Codes
Income in Vadnais Heights
Income Overview in Vadnais Heights
Per Capita Income in Vadnais Heights is $51,601, while median incomes of families and households are $129,513 and $89,632 respectively.
| Characteristic | Number | Measure |
| Per Capita Income | 12,864 | $51,601 |
| Median Family Income | 3,431 | $129,513 |
| Mean Family Income | 3,431 | $146,224 |
| Median Household Income | 5,514 | $89,632 |
| Mean Household Income | 5,514 | $116,438 |
| Income Deficit | 3,431 | $12,479 |
| Wage / Income Gap (%) | 12,864 | 31.16% |
| Wage / Income Gap ($) | 12,864 | 68.84¢ per $1 |
| Gini / Inequality Index | 12,864 | 0.42 |
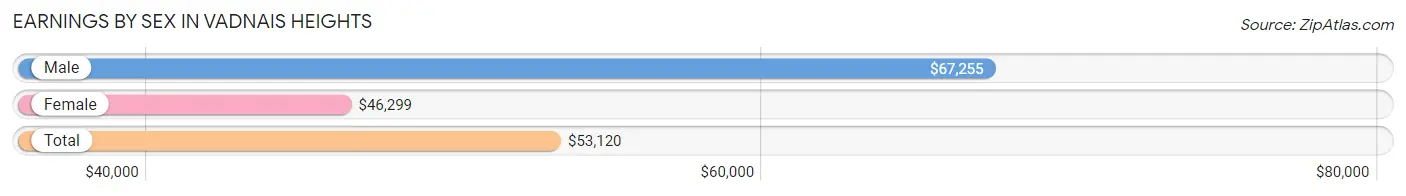
Earnings by Sex in Vadnais Heights
Average Earnings in Vadnais Heights are $53,120, $67,255 for men and $46,299 for women, a difference of 31.2%.
| Sex | Number | Average Earnings |
| Male | 3,354 (47.7%) | $67,255 |
| Female | 3,678 (52.3%) | $46,299 |
| Total | 7,032 (100.0%) | $53,120 |
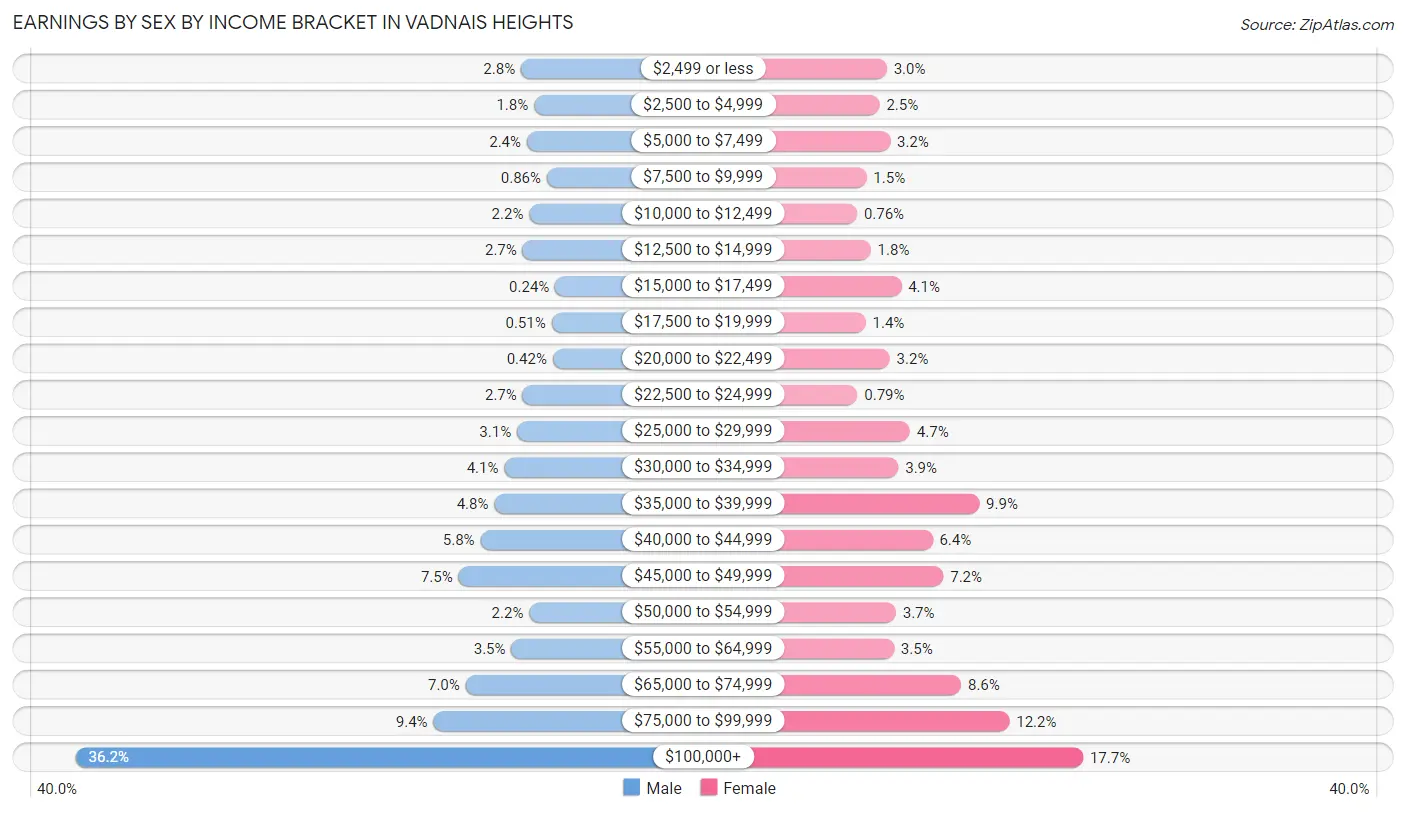
Earnings by Sex by Income Bracket in Vadnais Heights
The most common earnings brackets in Vadnais Heights are $100,000+ for men (1,213 | 36.2%) and $100,000+ for women (651 | 17.7%).
| Income | Male | Female |
| $2,499 or less | 94 (2.8%) | 110 (3.0%) |
| $2,500 to $4,999 | 61 (1.8%) | 90 (2.5%) |
| $5,000 to $7,499 | 79 (2.4%) | 119 (3.2%) |
| $7,500 to $9,999 | 29 (0.9%) | 54 (1.5%) |
| $10,000 to $12,499 | 73 (2.2%) | 28 (0.8%) |
| $12,500 to $14,999 | 90 (2.7%) | 66 (1.8%) |
| $15,000 to $17,499 | 8 (0.2%) | 150 (4.1%) |
| $17,500 to $19,999 | 17 (0.5%) | 52 (1.4%) |
| $20,000 to $22,499 | 14 (0.4%) | 118 (3.2%) |
| $22,500 to $24,999 | 90 (2.7%) | 29 (0.8%) |
| $25,000 to $29,999 | 104 (3.1%) | 174 (4.7%) |
| $30,000 to $34,999 | 136 (4.1%) | 142 (3.9%) |
| $35,000 to $39,999 | 161 (4.8%) | 365 (9.9%) |
| $40,000 to $44,999 | 196 (5.8%) | 236 (6.4%) |
| $45,000 to $49,999 | 251 (7.5%) | 266 (7.2%) |
| $50,000 to $54,999 | 73 (2.2%) | 135 (3.7%) |
| $55,000 to $64,999 | 118 (3.5%) | 130 (3.5%) |
| $65,000 to $74,999 | 233 (7.0%) | 315 (8.6%) |
| $75,000 to $99,999 | 314 (9.4%) | 448 (12.2%) |
| $100,000+ | 1,213 (36.2%) | 651 (17.7%) |
| Total | 3,354 (100.0%) | 3,678 (100.0%) |
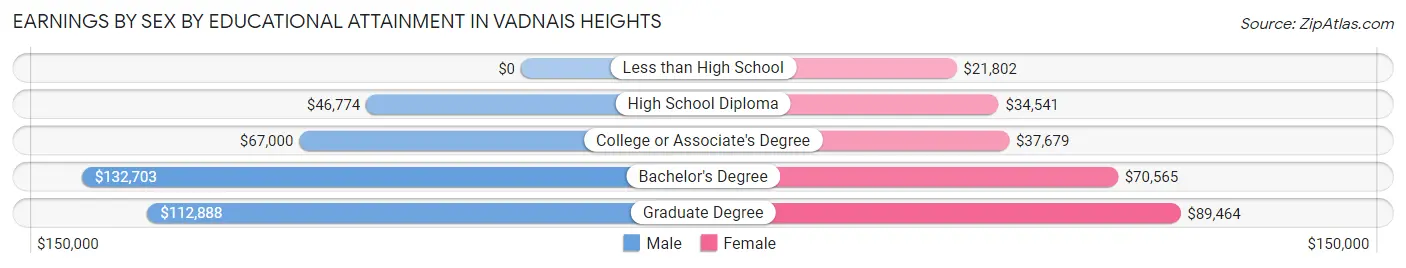
Earnings by Sex by Educational Attainment in Vadnais Heights
Average earnings in Vadnais Heights are $75,509 for men and $48,750 for women, a difference of 35.4%. Men with an educational attainment of bachelor's degree enjoy the highest average annual earnings of $132,703, while those with high school diploma education earn the least with $46,774. Women with an educational attainment of graduate degree earn the most with the average annual earnings of $89,464, while those with less than high school education have the smallest earnings of $21,802.
| Educational Attainment | Male Income | Female Income |
| Less than High School | - | - |
| High School Diploma | $46,774 | $34,541 |
| College or Associate's Degree | $67,000 | $37,679 |
| Bachelor's Degree | $132,703 | $70,565 |
| Graduate Degree | $112,888 | $89,464 |
| Total | $75,509 | $48,750 |
Family Income in Vadnais Heights
Family Income Brackets in Vadnais Heights
According to the Vadnais Heights family income data, there are 923 families falling into the $200,000+ income range, which is the most common income bracket and makes up 26.9% of all families. Conversely, the $10,000 to $14,999 income bracket is the least frequent group with only 21 families (0.6%) belonging to this category.
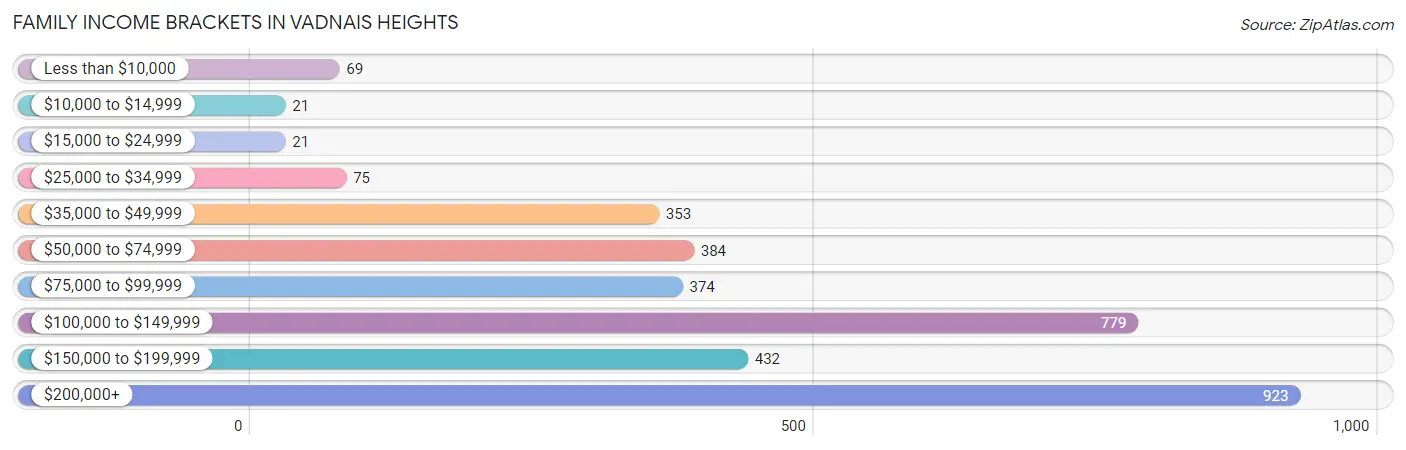
| Income Bracket | # Families | % Families |
| Less than $10,000 | 69 | 2.0% |
| $10,000 to $14,999 | 21 | 0.6% |
| $15,000 to $24,999 | 21 | 0.6% |
| $25,000 to $34,999 | 75 | 2.2% |
| $35,000 to $49,999 | 353 | 10.3% |
| $50,000 to $74,999 | 384 | 11.2% |
| $75,000 to $99,999 | 374 | 10.9% |
| $100,000 to $149,999 | 779 | 22.7% |
| $150,000 to $199,999 | 432 | 12.6% |
| $200,000+ | 923 | 26.9% |
Family Income by Famaliy Size in Vadnais Heights
7+ person families (70 | 2.0%) account for the highest median family income in Vadnais Heights with $230,429 per family, while 3-person families (777 | 22.7%) have the highest median income of $53,720 per family member.
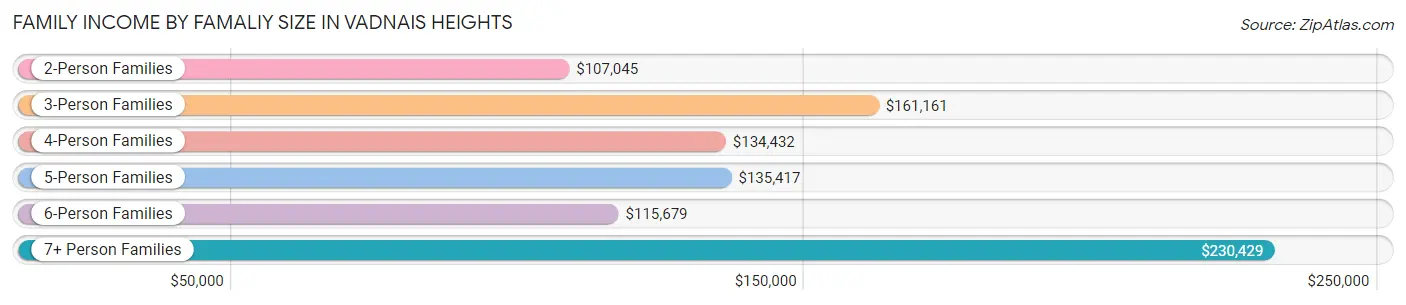
| Income Bracket | # Families | Median Income |
| 2-Person Families | 1,732 (50.5%) | $107,045 |
| 3-Person Families | 777 (22.7%) | $161,161 |
| 4-Person Families | 543 (15.8%) | $134,432 |
| 5-Person Families | 234 (6.8%) | $135,417 |
| 6-Person Families | 75 (2.2%) | $115,679 |
| 7+ Person Families | 70 (2.0%) | $230,429 |
| Total | 3,431 (100.0%) | $129,513 |
Family Income by Number of Earners in Vadnais Heights
The median family income in Vadnais Heights is $129,513, with families comprising 3+ earners (372) having the highest median family income of $172,674, while families with 1 earner (927) have the lowest median family income of $78,826, accounting for 10.8% and 27.0% of families, respectively.
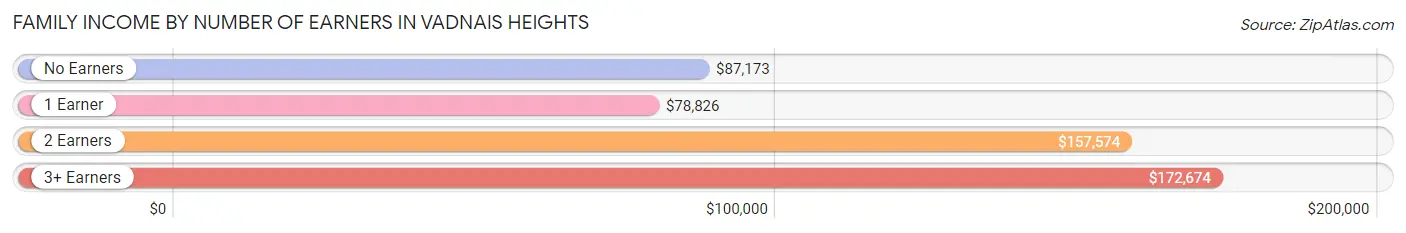
| Number of Earners | # Families | Median Income |
| No Earners | 529 (15.4%) | $87,173 |
| 1 Earner | 927 (27.0%) | $78,826 |
| 2 Earners | 1,603 (46.7%) | $157,574 |
| 3+ Earners | 372 (10.8%) | $172,674 |
| Total | 3,431 (100.0%) | $129,513 |
Household Income in Vadnais Heights
Household Income Brackets in Vadnais Heights
With 1,037 households falling in the category, the $100,000 to $149,999 income range is the most frequent in Vadnais Heights, accounting for 18.8% of all households. In contrast, only 66 households (1.2%) fall into the $10,000 to $14,999 income bracket, making it the least populous group.
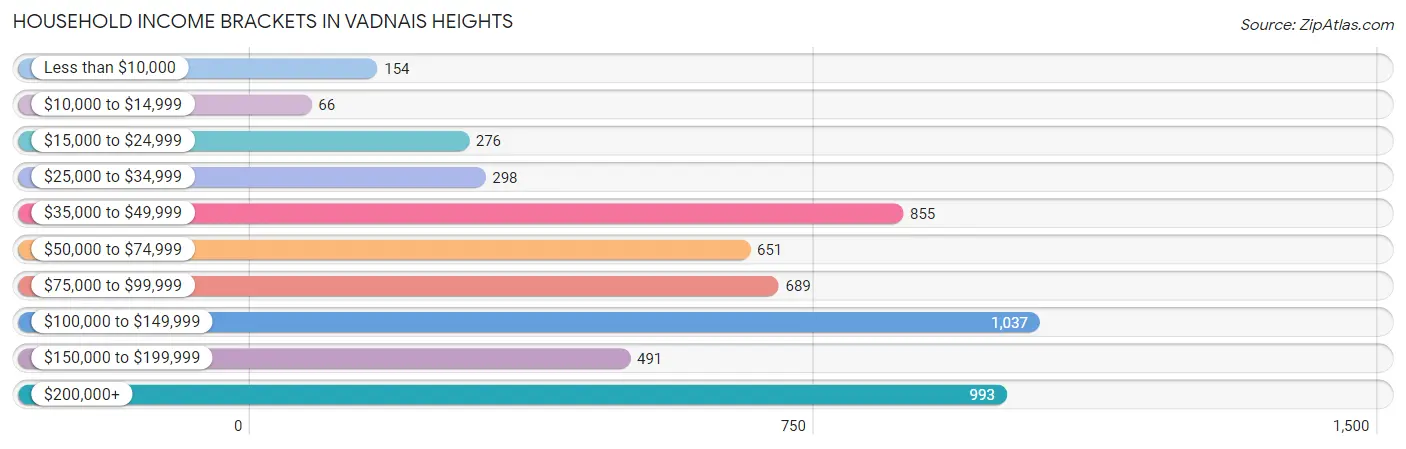
| Income Bracket | # Households | % Households |
| Less than $10,000 | 154 | 2.8% |
| $10,000 to $14,999 | 66 | 1.2% |
| $15,000 to $24,999 | 276 | 5.0% |
| $25,000 to $34,999 | 298 | 5.4% |
| $35,000 to $49,999 | 855 | 15.5% |
| $50,000 to $74,999 | 651 | 11.8% |
| $75,000 to $99,999 | 689 | 12.5% |
| $100,000 to $149,999 | 1,037 | 18.8% |
| $150,000 to $199,999 | 491 | 8.9% |
| $200,000+ | 993 | 18.0% |
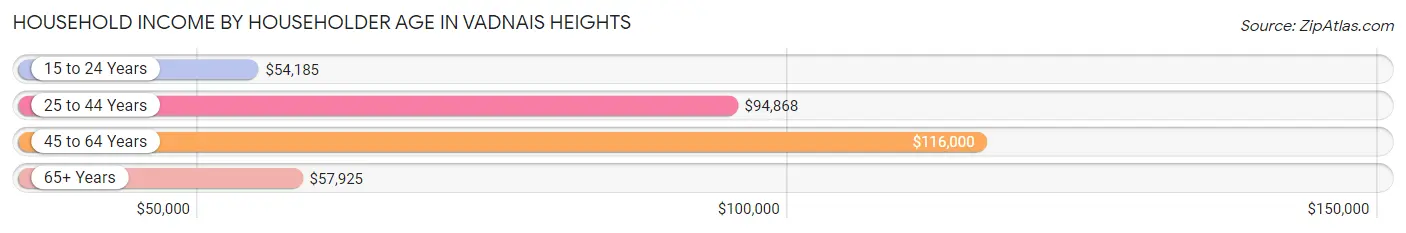
Household Income by Householder Age in Vadnais Heights
The median household income in Vadnais Heights is $89,632, with the highest median household income of $116,000 found in the 45 to 64 years age bracket for the primary householder. A total of 2,136 households (38.7%) fall into this category. Meanwhile, the 15 to 24 years age bracket for the primary householder has the lowest median household income of $54,185, with 51 households (0.9%) in this group.
| Income Bracket | # Households | Median Income |
| 15 to 24 Years | 51 (0.9%) | $54,185 |
| 25 to 44 Years | 1,654 (30.0%) | $94,868 |
| 45 to 64 Years | 2,136 (38.7%) | $116,000 |
| 65+ Years | 1,673 (30.3%) | $57,925 |
| Total | 5,514 (100.0%) | $89,632 |
Poverty in Vadnais Heights
Income Below Poverty by Sex and Age in Vadnais Heights
With 4.2% poverty level for males and 6.2% for females among the residents of Vadnais Heights, under 5 year old males and 18 to 24 year old females are the most vulnerable to poverty, with 48 males (14.4%) and 46 females (17.8%) in their respective age groups living below the poverty level.
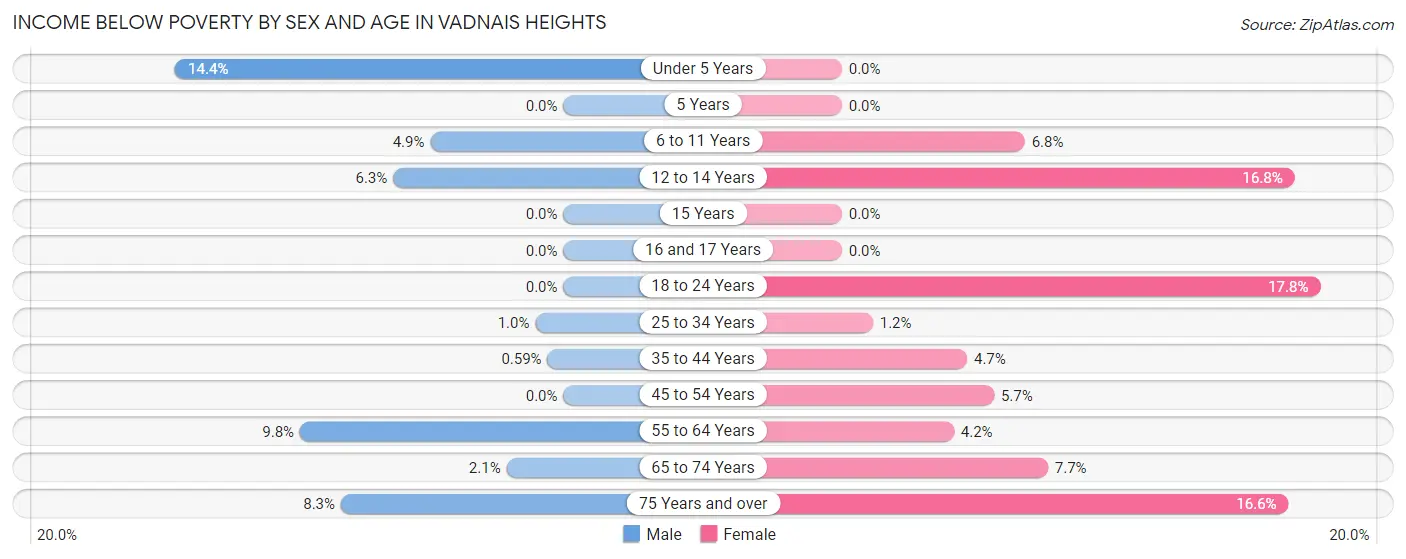
| Age Bracket | Male | Female |
| Under 5 Years | 48 (14.4%) | 0 (0.0%) |
| 5 Years | 0 (0.0%) | 0 (0.0%) |
| 6 to 11 Years | 37 (4.9%) | 36 (6.8%) |
| 12 to 14 Years | 17 (6.3%) | 38 (16.8%) |
| 15 Years | 0 (0.0%) | 0 (0.0%) |
| 16 and 17 Years | 0 (0.0%) | 0 (0.0%) |
| 18 to 24 Years | 0 (0.0%) | 46 (17.8%) |
| 25 to 34 Years | 9 (1.0%) | 9 (1.1%) |
| 35 to 44 Years | 4 (0.6%) | 41 (4.6%) |
| 45 to 54 Years | 0 (0.0%) | 50 (5.7%) |
| 55 to 64 Years | 89 (9.8%) | 47 (4.2%) |
| 65 to 74 Years | 13 (2.1%) | 62 (7.6%) |
| 75 Years and over | 37 (8.3%) | 92 (16.6%) |
| Total | 254 (4.2%) | 421 (6.2%) |
Income Above Poverty by Sex and Age in Vadnais Heights
According to the poverty statistics in Vadnais Heights, males aged 5 years and females aged under 5 years are the age groups that are most secure financially, with 100.0% of males and 100.0% of females in these age groups living above the poverty line.
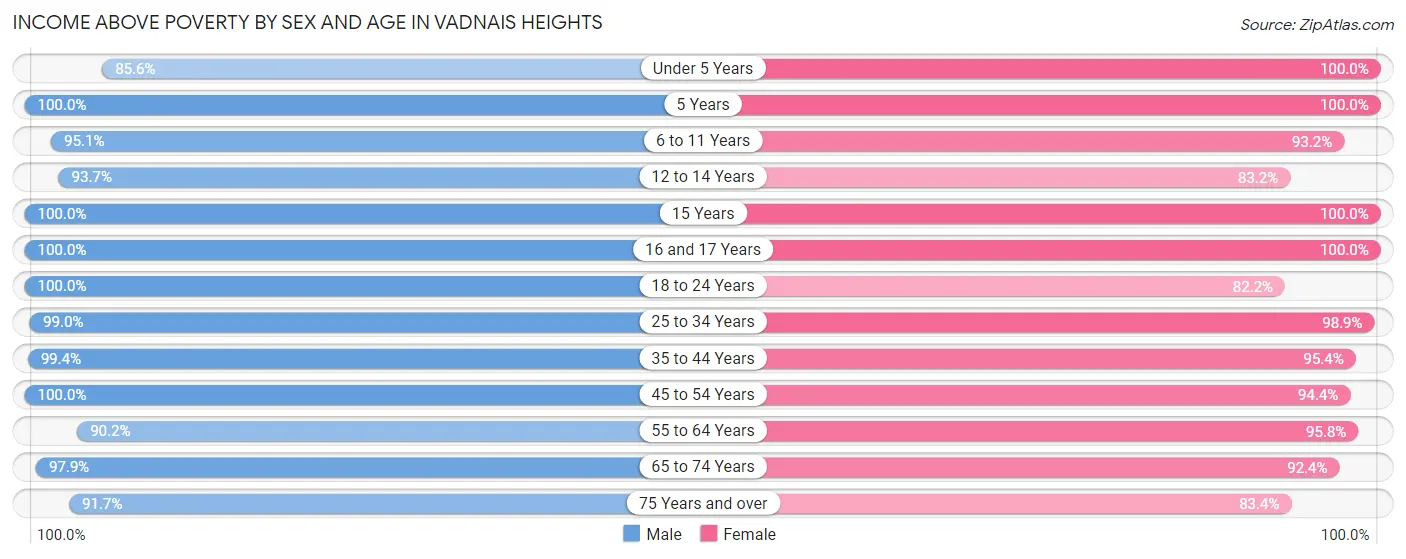
| Age Bracket | Male | Female |
| Under 5 Years | 285 (85.6%) | 377 (100.0%) |
| 5 Years | 70 (100.0%) | 87 (100.0%) |
| 6 to 11 Years | 712 (95.1%) | 494 (93.2%) |
| 12 to 14 Years | 252 (93.7%) | 188 (83.2%) |
| 15 Years | 48 (100.0%) | 67 (100.0%) |
| 16 and 17 Years | 80 (100.0%) | 166 (100.0%) |
| 18 to 24 Years | 299 (100.0%) | 213 (82.2%) |
| 25 to 34 Years | 860 (99.0%) | 774 (98.9%) |
| 35 to 44 Years | 679 (99.4%) | 840 (95.4%) |
| 45 to 54 Years | 726 (100.0%) | 835 (94.4%) |
| 55 to 64 Years | 821 (90.2%) | 1,082 (95.8%) |
| 65 to 74 Years | 602 (97.9%) | 748 (92.3%) |
| 75 Years and over | 411 (91.7%) | 463 (83.4%) |
| Total | 5,845 (95.8%) | 6,334 (93.8%) |
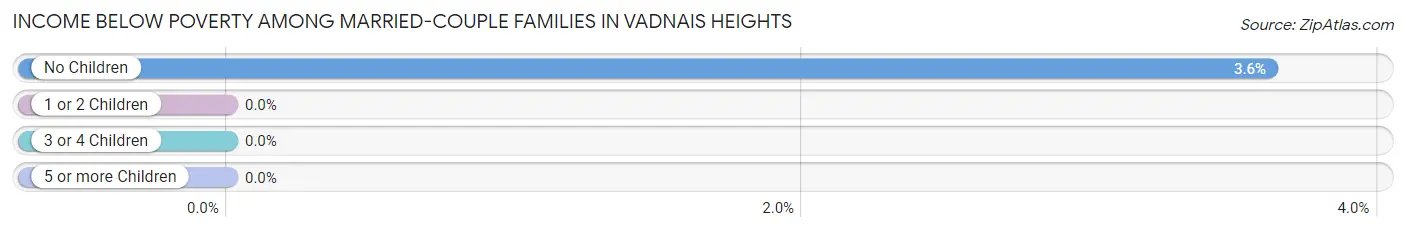
Income Below Poverty Among Married-Couple Families in Vadnais Heights
The poverty statistics for married-couple families in Vadnais Heights show that 2.3% or 63 of the total 2,741 families live below the poverty line. Families with no children have the highest poverty rate of 3.6%, comprising of 63 families. On the other hand, families with 1 or 2 children have the lowest poverty rate of 0.0%, which includes 0 families.
| Children | Above Poverty | Below Poverty |
| No Children | 1,675 (96.4%) | 63 (3.6%) |
| 1 or 2 Children | 719 (100.0%) | 0 (0.0%) |
| 3 or 4 Children | 214 (100.0%) | 0 (0.0%) |
| 5 or more Children | 70 (100.0%) | 0 (0.0%) |
| Total | 2,678 (97.7%) | 63 (2.3%) |
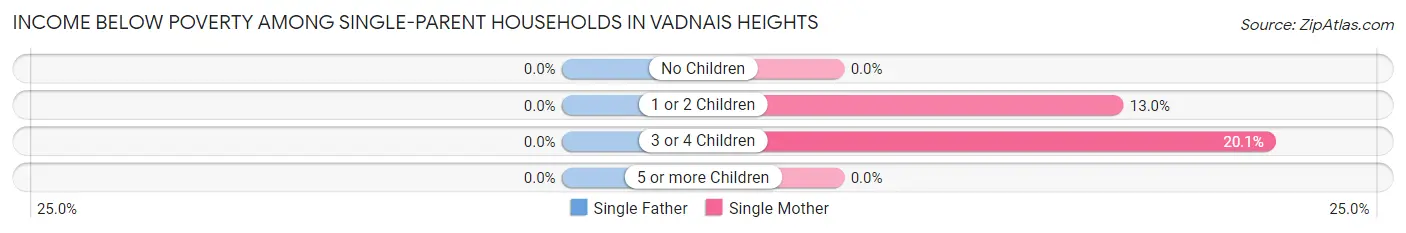
Income Below Poverty Among Single-Parent Households in Vadnais Heights
| Children | Single Father | Single Mother |
| No Children | 0 (0.0%) | 0 (0.0%) |
| 1 or 2 Children | 0 (0.0%) | 26 (13.0%) |
| 3 or 4 Children | 0 (0.0%) | 36 (20.1%) |
| 5 or more Children | 0 (0.0%) | 0 (0.0%) |
| Total | 0 (0.0%) | 62 (10.3%) |
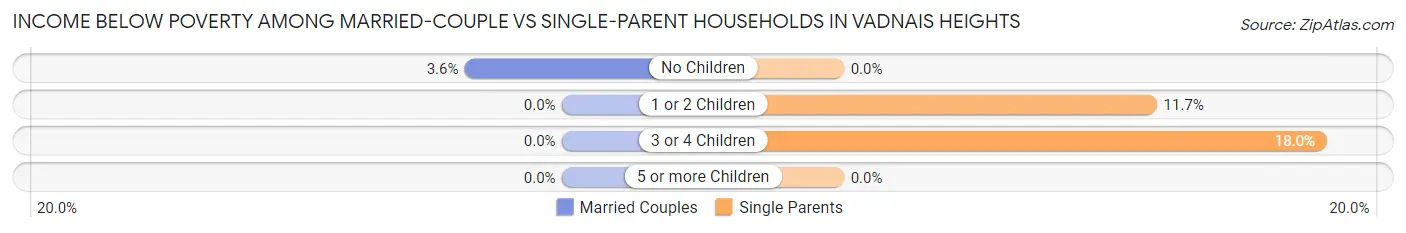
Income Below Poverty Among Married-Couple vs Single-Parent Households in Vadnais Heights
The poverty data for Vadnais Heights shows that 63 of the married-couple family households (2.3%) and 62 of the single-parent households (9.0%) are living below the poverty level. Within the married-couple family households, those with no children have the highest poverty rate, with 63 households (3.6%) falling below the poverty line. Among the single-parent households, those with 3 or 4 children have the highest poverty rate, with 36 household (18.0%) living below poverty.
| Children | Married-Couple Families | Single-Parent Households |
| No Children | 63 (3.6%) | 0 (0.0%) |
| 1 or 2 Children | 0 (0.0%) | 26 (11.7%) |
| 3 or 4 Children | 0 (0.0%) | 36 (18.0%) |
| 5 or more Children | 0 (0.0%) | 0 (0.0%) |
| Total | 63 (2.3%) | 62 (9.0%) |
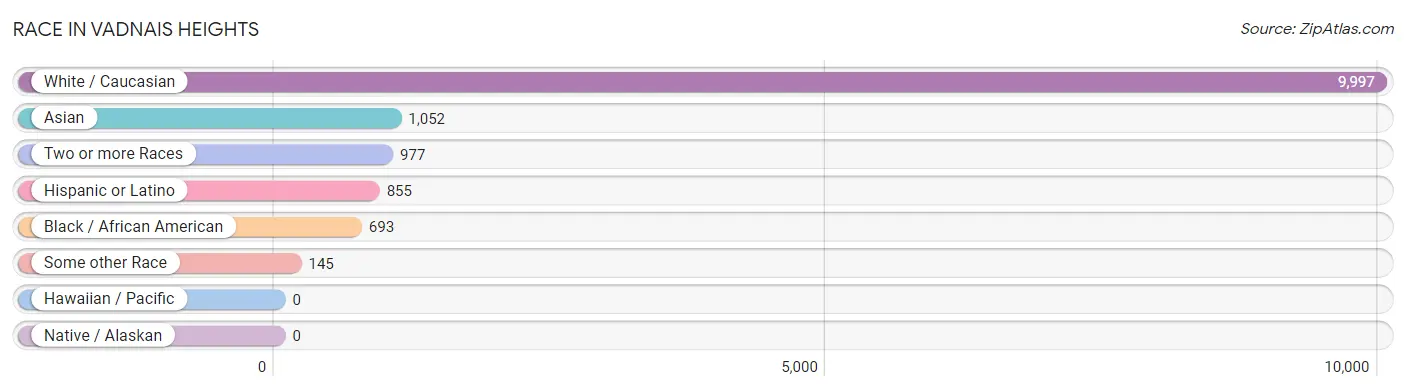
Race in Vadnais Heights
The most populous races in Vadnais Heights are White / Caucasian (9,997 | 77.7%), Asian (1,052 | 8.2%), and Two or more Races (977 | 7.6%).
| Race | # Population | % Population |
| Asian | 1,052 | 8.2% |
| Black / African American | 693 | 5.4% |
| Hawaiian / Pacific | 0 | 0.0% |
| Hispanic or Latino | 855 | 6.7% |
| Native / Alaskan | 0 | 0.0% |
| White / Caucasian | 9,997 | 77.7% |
| Two or more Races | 977 | 7.6% |
| Some other Race | 145 | 1.1% |
| Total | 12,864 | 100.0% |
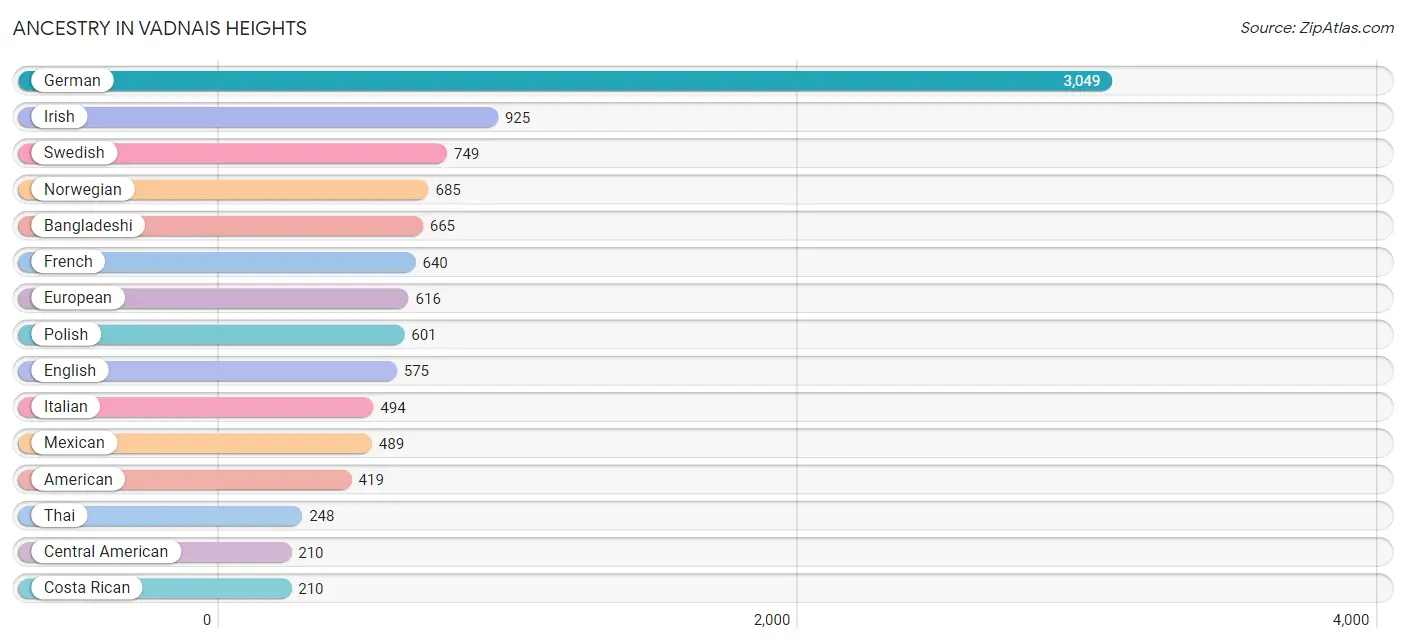
Ancestry in Vadnais Heights
The most populous ancestries reported in Vadnais Heights are German (3,049 | 23.7%), Irish (925 | 7.2%), Swedish (749 | 5.8%), Norwegian (685 | 5.3%), and Bangladeshi (665 | 5.2%), together accounting for 47.2% of all Vadnais Heights residents.
| Ancestry | # Population | % Population |
| African | 18 | 0.1% |
| American | 419 | 3.3% |
| Arab | 41 | 0.3% |
| Armenian | 6 | 0.1% |
| Austrian | 89 | 0.7% |
| Bangladeshi | 665 | 5.2% |
| Belgian | 30 | 0.2% |
| Bhutanese | 47 | 0.4% |
| Blackfeet | 2 | 0.0% |
| British | 33 | 0.3% |
| Burmese | 62 | 0.5% |
| Canadian | 16 | 0.1% |
| Central American | 210 | 1.6% |
| Central American Indian | 33 | 0.3% |
| Colombian | 72 | 0.6% |
| Costa Rican | 210 | 1.6% |
| Croatian | 14 | 0.1% |
| Czech | 119 | 0.9% |
| Czechoslovakian | 27 | 0.2% |
| Danish | 60 | 0.5% |
| Dominican | 33 | 0.3% |
| Dutch | 105 | 0.8% |
| Eastern European | 8 | 0.1% |
| English | 575 | 4.5% |
| European | 616 | 4.8% |
| Finnish | 49 | 0.4% |
| French | 640 | 5.0% |
| French Canadian | 98 | 0.8% |
| German | 3,049 | 23.7% |
| Greek | 47 | 0.4% |
| Hungarian | 65 | 0.5% |
| Icelander | 9 | 0.1% |
| Indian (Asian) | 65 | 0.5% |
| Inupiat | 2 | 0.0% |
| Irish | 925 | 7.2% |
| Italian | 494 | 3.8% |
| Japanese | 57 | 0.4% |
| Korean | 49 | 0.4% |
| Lebanese | 11 | 0.1% |
| Lithuanian | 35 | 0.3% |
| Luxembourger | 119 | 0.9% |
| Malaysian | 19 | 0.2% |
| Mexican | 489 | 3.8% |
| Moroccan | 15 | 0.1% |
| Nigerian | 16 | 0.1% |
| Northern European | 128 | 1.0% |
| Norwegian | 685 | 5.3% |
| Pakistani | 19 | 0.2% |
| Polish | 601 | 4.7% |
| Portuguese | 22 | 0.2% |
| Puerto Rican | 46 | 0.4% |
| Romanian | 22 | 0.2% |
| Russian | 18 | 0.1% |
| Scandinavian | 116 | 0.9% |
| Scotch-Irish | 77 | 0.6% |
| Scottish | 95 | 0.7% |
| Serbian | 28 | 0.2% |
| Slavic | 13 | 0.1% |
| South American | 77 | 0.6% |
| Sri Lankan | 35 | 0.3% |
| Subsaharan African | 34 | 0.3% |
| Swedish | 749 | 5.8% |
| Swiss | 16 | 0.1% |
| Thai | 248 | 1.9% |
| Ukrainian | 107 | 0.8% |
| Welsh | 76 | 0.6% |
| Yugoslavian | 14 | 0.1% | View All 67 Rows |
Immigrants in Vadnais Heights
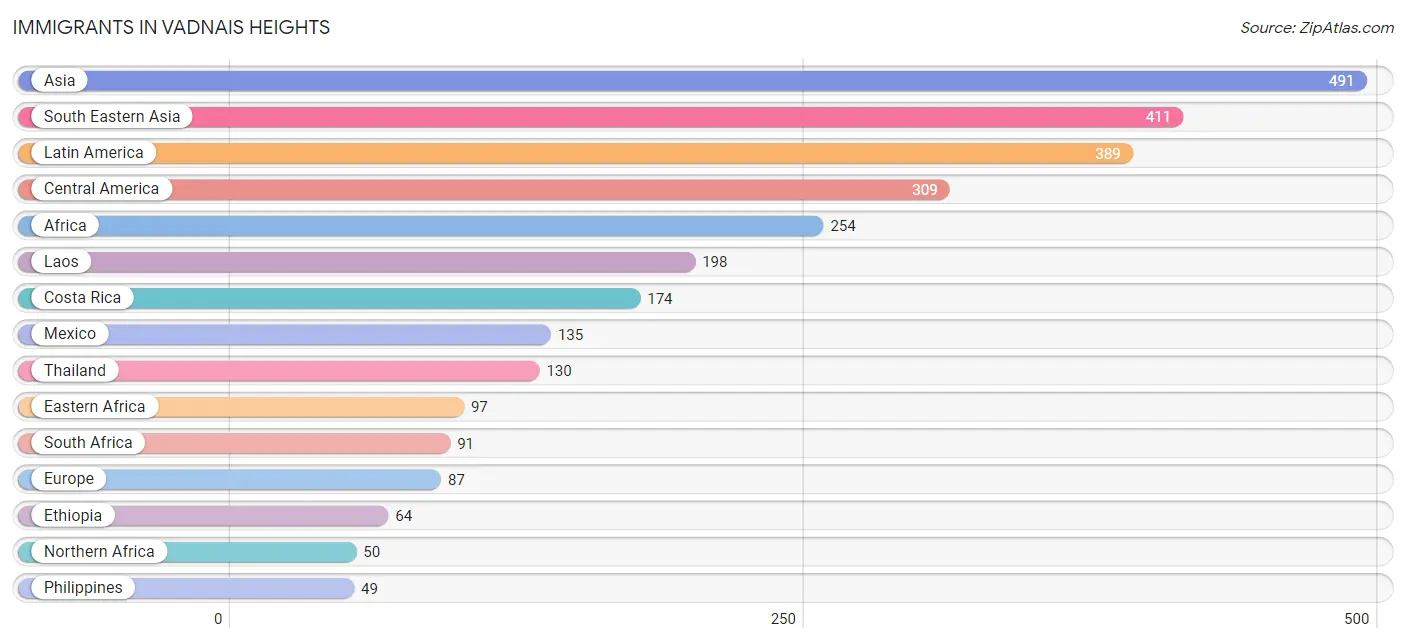
The most numerous immigrant groups reported in Vadnais Heights came from Asia (491 | 3.8%), South Eastern Asia (411 | 3.2%), Latin America (389 | 3.0%), Central America (309 | 2.4%), and Africa (254 | 2.0%), together accounting for 14.4% of all Vadnais Heights residents.
| Immigration Origin | # Population | % Population |
| Africa | 254 | 2.0% |
| Armenia | 6 | 0.1% |
| Asia | 491 | 3.8% |
| Cambodia | 34 | 0.3% |
| Caribbean | 33 | 0.3% |
| Central America | 309 | 2.4% |
| China | 7 | 0.1% |
| Colombia | 47 | 0.4% |
| Costa Rica | 174 | 1.3% |
| Denmark | 11 | 0.1% |
| Dominican Republic | 33 | 0.3% |
| Eastern Africa | 97 | 0.7% |
| Eastern Asia | 44 | 0.3% |
| Eastern Europe | 13 | 0.1% |
| Egypt | 35 | 0.3% |
| Ethiopia | 64 | 0.5% |
| Europe | 87 | 0.7% |
| France | 19 | 0.2% |
| Italy | 24 | 0.2% |
| Korea | 37 | 0.3% |
| Laos | 198 | 1.5% |
| Latin America | 389 | 3.0% |
| Mexico | 135 | 1.1% |
| Moldova | 13 | 0.1% |
| Nigeria | 16 | 0.1% |
| Northern Africa | 50 | 0.4% |
| Northern Europe | 31 | 0.2% |
| Oceania | 15 | 0.1% |
| Philippines | 49 | 0.4% |
| South Africa | 91 | 0.7% |
| South America | 47 | 0.4% |
| South Central Asia | 30 | 0.2% |
| South Eastern Asia | 411 | 3.2% |
| Southern Europe | 24 | 0.2% |
| Thailand | 130 | 1.0% |
| Uganda | 33 | 0.3% |
| Western Africa | 16 | 0.1% |
| Western Asia | 6 | 0.1% |
| Western Europe | 19 | 0.2% | View All 39 Rows |
Sex and Age in Vadnais Heights
Sex and Age in Vadnais Heights
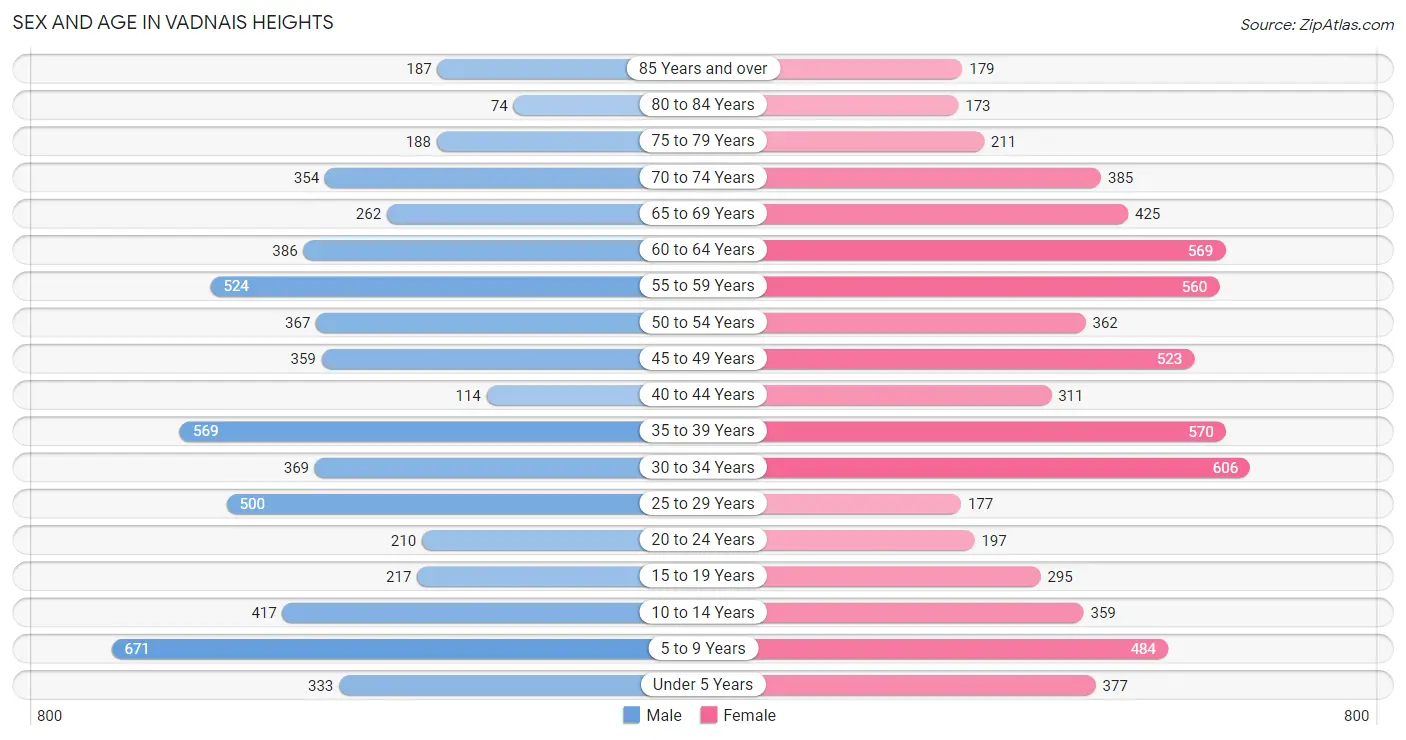
The most populous age groups in Vadnais Heights are 5 to 9 Years (671 | 11.0%) for men and 30 to 34 Years (606 | 9.0%) for women.
| Age Bracket | Male | Female |
| Under 5 Years | 333 (5.5%) | 377 (5.6%) |
| 5 to 9 Years | 671 (11.0%) | 484 (7.2%) |
| 10 to 14 Years | 417 (6.8%) | 359 (5.3%) |
| 15 to 19 Years | 217 (3.6%) | 295 (4.4%) |
| 20 to 24 Years | 210 (3.4%) | 197 (2.9%) |
| 25 to 29 Years | 500 (8.2%) | 177 (2.6%) |
| 30 to 34 Years | 369 (6.0%) | 606 (9.0%) |
| 35 to 39 Years | 569 (9.3%) | 570 (8.4%) |
| 40 to 44 Years | 114 (1.9%) | 311 (4.6%) |
| 45 to 49 Years | 359 (5.9%) | 523 (7.7%) |
| 50 to 54 Years | 367 (6.0%) | 362 (5.3%) |
| 55 to 59 Years | 524 (8.6%) | 560 (8.3%) |
| 60 to 64 Years | 386 (6.3%) | 569 (8.4%) |
| 65 to 69 Years | 262 (4.3%) | 425 (6.3%) |
| 70 to 74 Years | 354 (5.8%) | 385 (5.7%) |
| 75 to 79 Years | 188 (3.1%) | 211 (3.1%) |
| 80 to 84 Years | 74 (1.2%) | 173 (2.6%) |
| 85 Years and over | 187 (3.1%) | 179 (2.6%) |
| Total | 6,101 (100.0%) | 6,763 (100.0%) |
Families and Households in Vadnais Heights
Median Family Size in Vadnais Heights
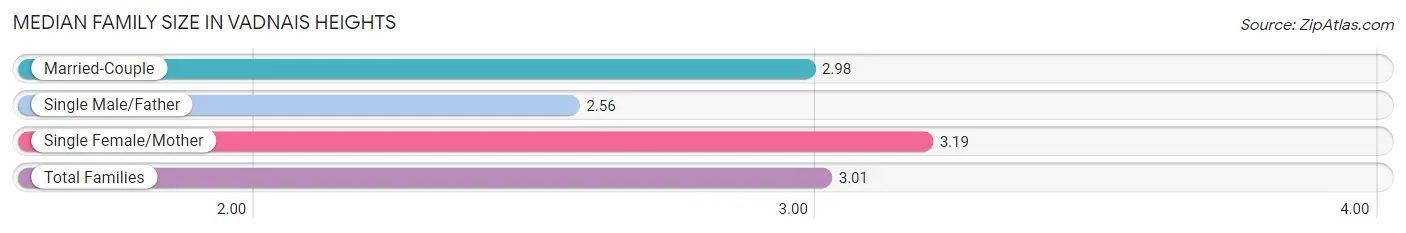
The median family size in Vadnais Heights is 3.01 persons per family, with single female/mother families (602 | 17.5%) accounting for the largest median family size of 3.19 persons per family. On the other hand, single male/father families (88 | 2.6%) represent the smallest median family size with 2.56 persons per family.
| Family Type | # Families | Family Size |
| Married-Couple | 2,741 (79.9%) | 2.98 |
| Single Male/Father | 88 (2.6%) | 2.56 |
| Single Female/Mother | 602 (17.5%) | 3.19 |
| Total Families | 3,431 (100.0%) | 3.01 |
Median Household Size in Vadnais Heights
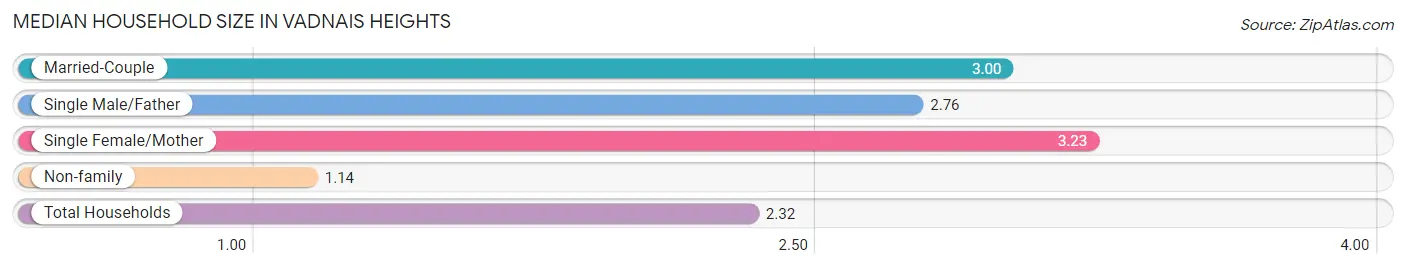
The median household size in Vadnais Heights is 2.32 persons per household, with single female/mother households (602 | 10.9%) accounting for the largest median household size of 3.23 persons per household. non-family households (2,083 | 37.8%) represent the smallest median household size with 1.14 persons per household.
| Household Type | # Households | Household Size |
| Married-Couple | 2,741 (49.7%) | 3.00 |
| Single Male/Father | 88 (1.6%) | 2.76 |
| Single Female/Mother | 602 (10.9%) | 3.23 |
| Non-family | 2,083 (37.8%) | 1.14 |
| Total Households | 5,514 (100.0%) | 2.32 |
Household Size by Marriage Status in Vadnais Heights
Out of a total of 5,514 households in Vadnais Heights, 3,431 (62.2%) are family households, while 2,083 (37.8%) are nonfamily households. The most numerous type of family households are 2-person households, comprising 1,708, and the most common type of nonfamily households are 1-person households, comprising 1,813.
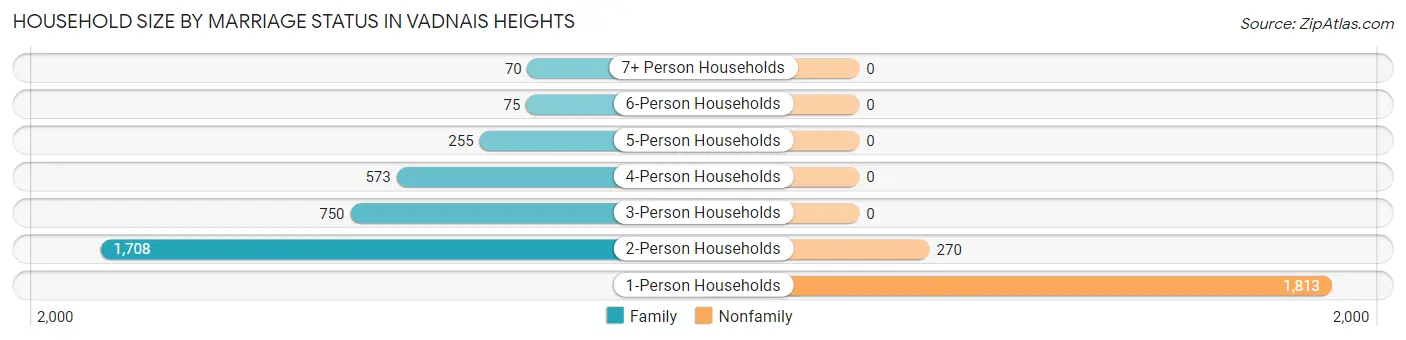
| Household Size | Family Households | Nonfamily Households |
| 1-Person Households | - | 1,813 (32.9%) |
| 2-Person Households | 1,708 (31.0%) | 270 (4.9%) |
| 3-Person Households | 750 (13.6%) | 0 (0.0%) |
| 4-Person Households | 573 (10.4%) | 0 (0.0%) |
| 5-Person Households | 255 (4.6%) | 0 (0.0%) |
| 6-Person Households | 75 (1.4%) | 0 (0.0%) |
| 7+ Person Households | 70 (1.3%) | 0 (0.0%) |
| Total | 3,431 (62.2%) | 2,083 (37.8%) |
Female Fertility in Vadnais Heights
Fertility by Age in Vadnais Heights
Average fertility rate in Vadnais Heights is 36.0 births per 1,000 women. Women in the age bracket of 20 to 34 years have the highest fertility rate with 79.0 births per 1,000 women. Women in the age bracket of 20 to 34 years acount for 76.2% of all women with births.
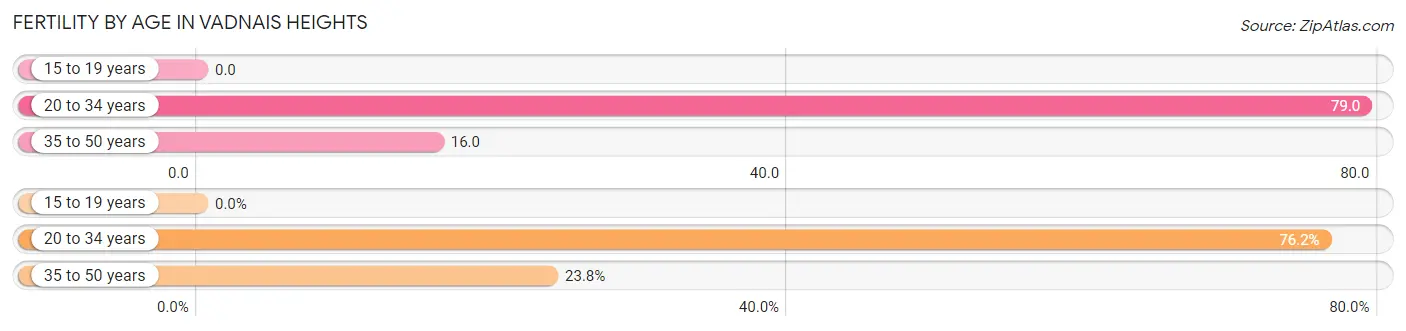
| Age Bracket | Women with Births | Births / 1,000 Women |
| 15 to 19 years | 0 (0.0%) | 0.0 |
| 20 to 34 years | 77 (76.2%) | 79.0 |
| 35 to 50 years | 24 (23.8%) | 16.0 |
| Total | 101 (100.0%) | 36.0 |
Fertility by Age by Marriage Status in Vadnais Heights
86.1% of women with births (101) in Vadnais Heights are married. The highest percentage of unmarried women with births falls into 20 to 34 years age bracket with 18.2% of them unmarried at the time of birth, while the lowest percentage of unmarried women with births belong to 35 to 50 years age bracket with 0.0% of them unmarried.
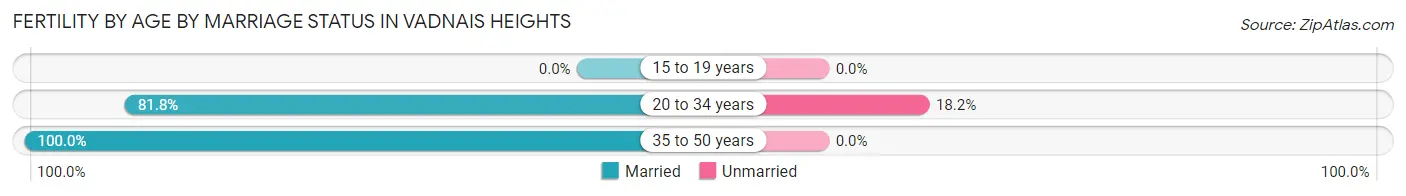
| Age Bracket | Married | Unmarried |
| 15 to 19 years | 0 (0.0%) | 0 (0.0%) |
| 20 to 34 years | 63 (81.8%) | 14 (18.2%) |
| 35 to 50 years | 24 (100.0%) | 0 (0.0%) |
| Total | 87 (86.1%) | 14 (13.9%) |
Fertility by Education in Vadnais Heights
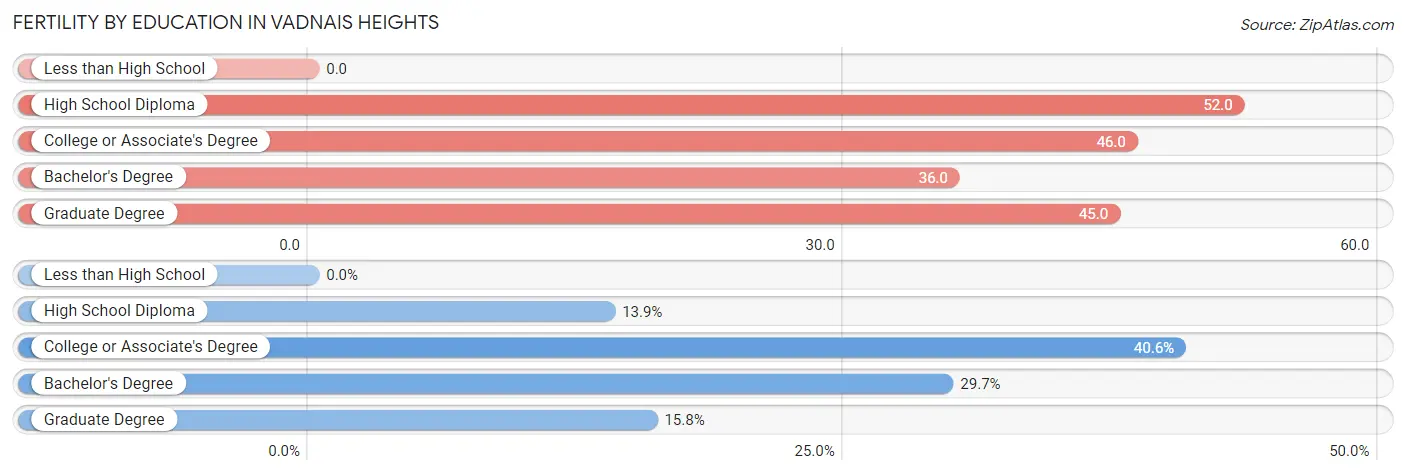
| Educational Attainment | Women with Births | Births / 1,000 Women |
| Less than High School | 0 (0.0%) | 0.0 |
| High School Diploma | 14 (13.9%) | 52.0 |
| College or Associate's Degree | 41 (40.6%) | 46.0 |
| Bachelor's Degree | 30 (29.7%) | 36.0 |
| Graduate Degree | 16 (15.8%) | 45.0 |
| Total | 101 (100.0%) | 36.0 |
Fertility by Education by Marriage Status in Vadnais Heights
13.9% of women with births in Vadnais Heights are unmarried. Women with the educational attainment of college or associate's degree are most likely to be married with 100.0% of them married at childbirth, while women with the educational attainment of high school diploma are least likely to be married with 100.0% of them unmarried at childbirth.
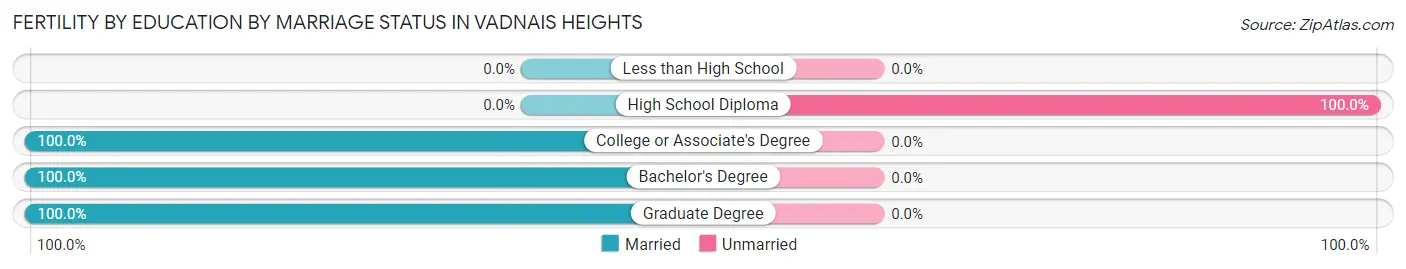
| Educational Attainment | Married | Unmarried |
| Less than High School | 0 (0.0%) | 0 (0.0%) |
| High School Diploma | 0 (0.0%) | 14 (100.0%) |
| College or Associate's Degree | 41 (100.0%) | 0 (0.0%) |
| Bachelor's Degree | 30 (100.0%) | 0 (0.0%) |
| Graduate Degree | 16 (100.0%) | 0 (0.0%) |
| Total | 87 (86.1%) | 14 (13.9%) |
Employment Characteristics in Vadnais Heights
Employment by Class of Employer in Vadnais Heights
Among the 6,385 employed individuals in Vadnais Heights, private company employees (4,262 | 66.7%), not-for-profit organizations (1,035 | 16.2%), and local government employees (485 | 7.6%) make up the most common classes of employment.
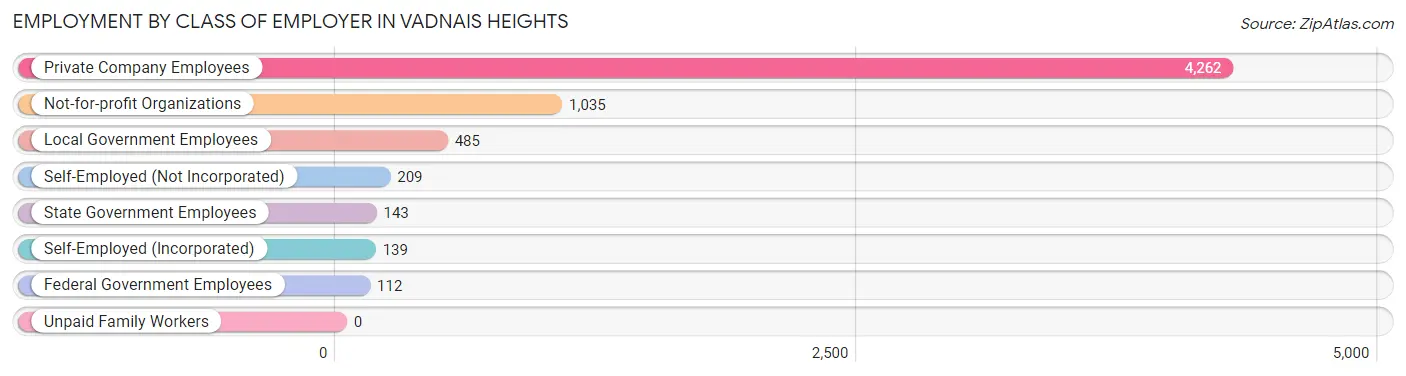
| Employer Class | # Employees | % Employees |
| Private Company Employees | 4,262 | 66.7% |
| Self-Employed (Incorporated) | 139 | 2.2% |
| Self-Employed (Not Incorporated) | 209 | 3.3% |
| Not-for-profit Organizations | 1,035 | 16.2% |
| Local Government Employees | 485 | 7.6% |
| State Government Employees | 143 | 2.2% |
| Federal Government Employees | 112 | 1.8% |
| Unpaid Family Workers | 0 | 0.0% |
| Total | 6,385 | 100.0% |
Employment Status by Age in Vadnais Heights
According to the labor force statistics for Vadnais Heights, out of the total population over 16 years of age (10,108), 67.2% or 6,793 individuals are in the labor force, with 4.9% or 333 of them unemployed. The age group with the highest labor force participation rate is 30 to 34 years, with 99.8% or 973 individuals in the labor force. Within the labor force, the 30 to 34 years age range has the highest percentage of unemployed individuals, with 10.1% or 98 of them being unemployed.
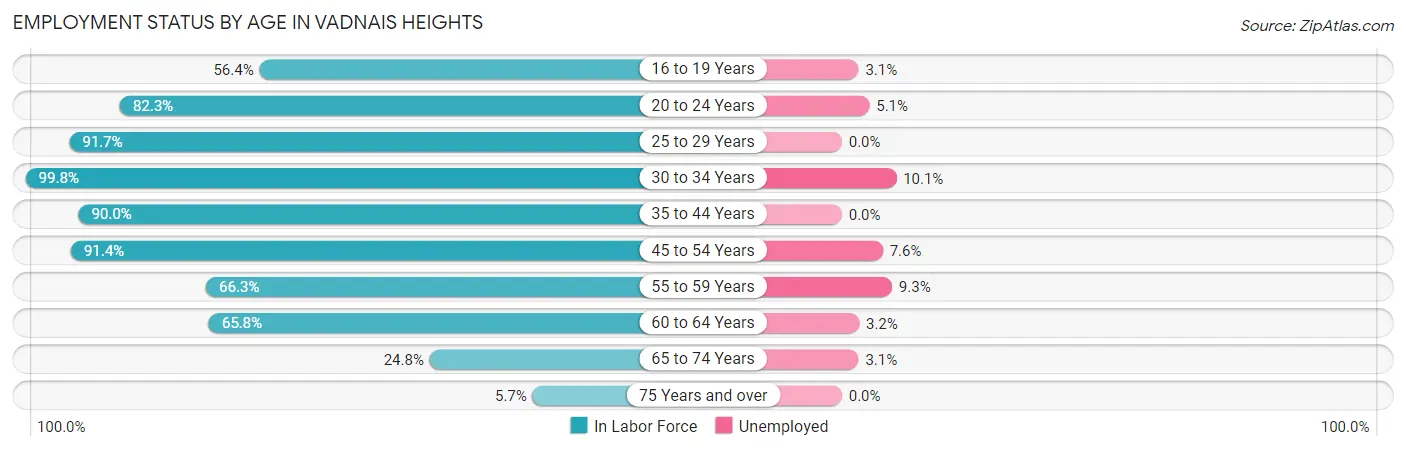
| Age Bracket | In Labor Force | Unemployed |
| 16 to 19 Years | 224 (56.4%) | 7 (3.1%) |
| 20 to 24 Years | 335 (82.3%) | 17 (5.1%) |
| 25 to 29 Years | 621 (91.7%) | 0 (0.0%) |
| 30 to 34 Years | 973 (99.8%) | 98 (10.1%) |
| 35 to 44 Years | 1,408 (90.0%) | 0 (0.0%) |
| 45 to 54 Years | 1,472 (91.4%) | 112 (7.6%) |
| 55 to 59 Years | 719 (66.3%) | 67 (9.3%) |
| 60 to 64 Years | 628 (65.8%) | 20 (3.2%) |
| 65 to 74 Years | 354 (24.8%) | 11 (3.1%) |
| 75 Years and over | 58 (5.7%) | 0 (0.0%) |
| Total | 6,793 (67.2%) | 333 (4.9%) |
Employment Status by Educational Attainment in Vadnais Heights
According to labor force statistics for Vadnais Heights, 84.8% of individuals (5,822) out of the total population between 25 and 64 years of age (6,866) are in the labor force, with 5.1% or 297 of them being unemployed. The group with the highest labor force participation rate are those with the educational attainment of bachelor's degree or higher, with 87.6% or 2,778 individuals in the labor force. Within the labor force, individuals with college / associate degree education have the highest percentage of unemployment, with 11.7% or 217 of them being unemployed.
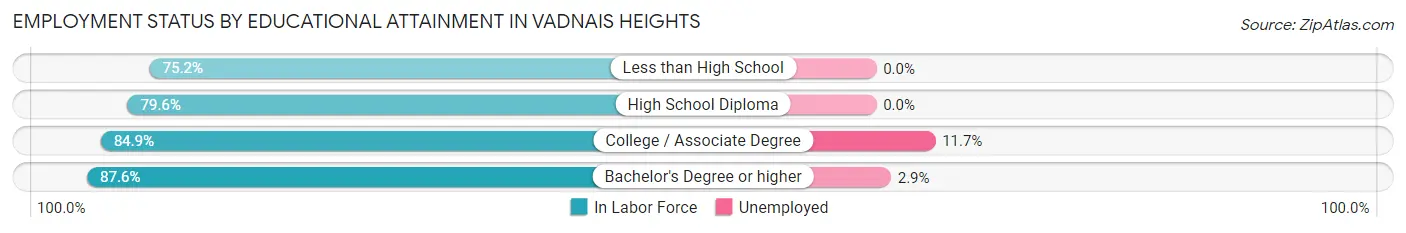
| Educational Attainment | In Labor Force | Unemployed |
| Less than High School | 234 (75.2%) | 0 (0.0%) |
| High School Diploma | 954 (79.6%) | 0 (0.0%) |
| College / Associate Degree | 1,856 (84.9%) | 256 (11.7%) |
| Bachelor's Degree or higher | 2,778 (87.6%) | 92 (2.9%) |
| Total | 5,822 (84.8%) | 350 (5.1%) |
Employment Occupations by Sex in Vadnais Heights
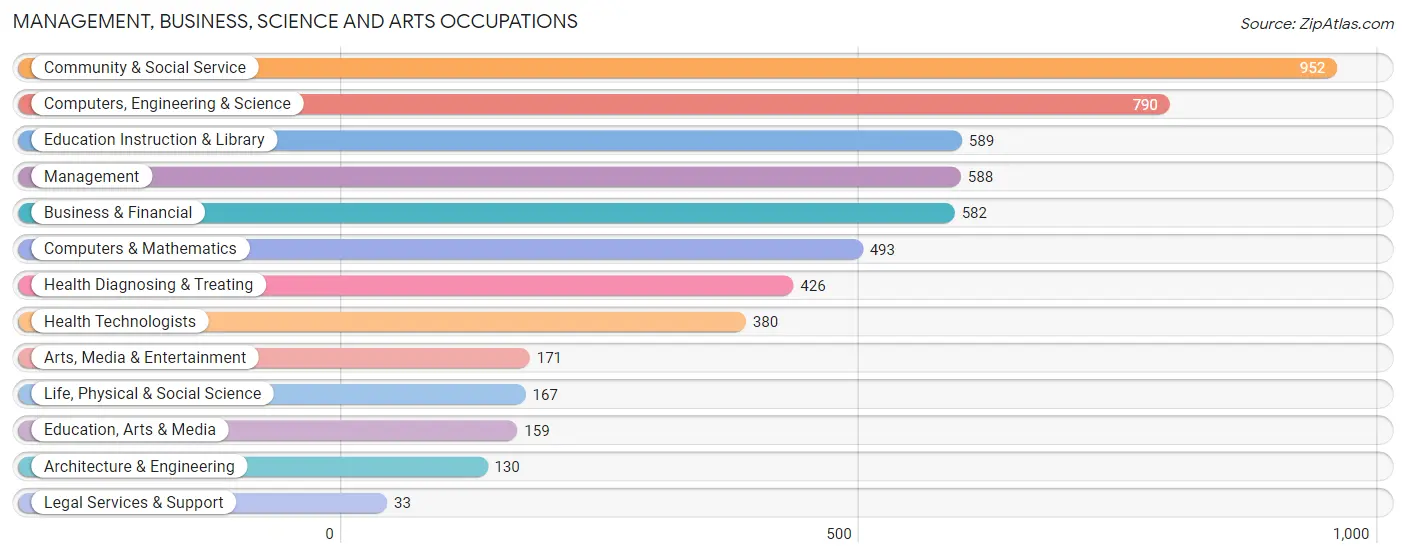
Management, Business, Science and Arts Occupations
The most common Management, Business, Science and Arts occupations in Vadnais Heights are Community & Social Service (952 | 14.7%), Computers, Engineering & Science (790 | 12.2%), Education Instruction & Library (589 | 9.1%), Management (588 | 9.1%), and Business & Financial (582 | 9.0%).
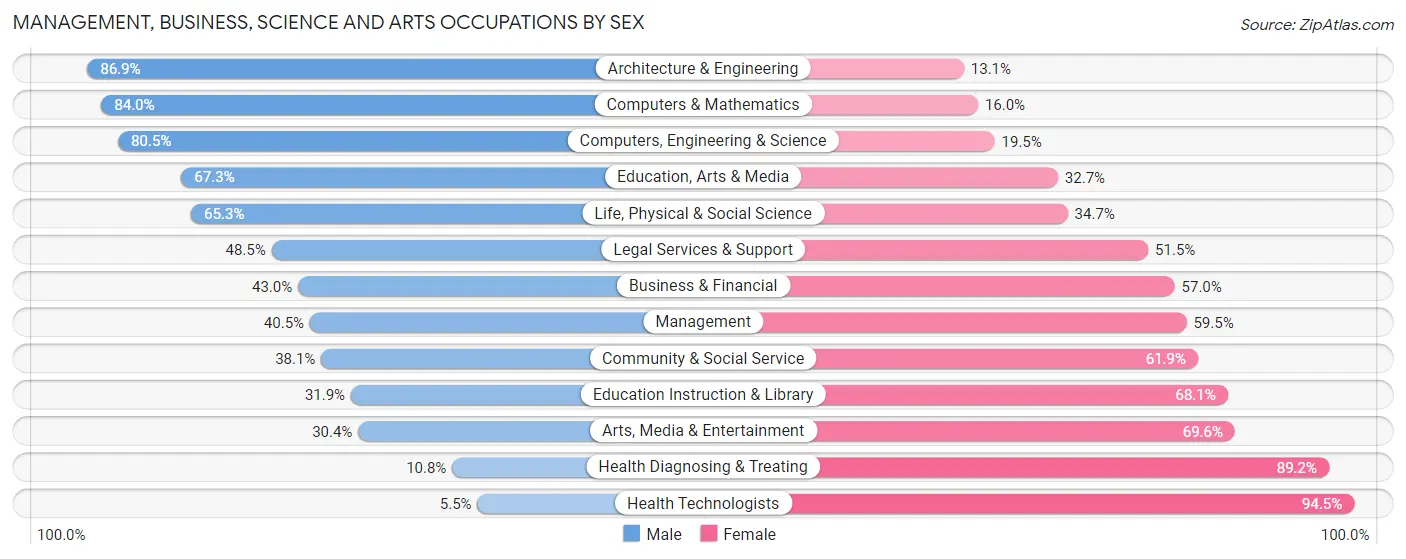
Management, Business, Science and Arts Occupations by Sex
Within the Management, Business, Science and Arts occupations in Vadnais Heights, the most male-oriented occupations are Architecture & Engineering (86.9%), Computers & Mathematics (84.0%), and Computers, Engineering & Science (80.5%), while the most female-oriented occupations are Health Technologists (94.5%), Health Diagnosing & Treating (89.2%), and Arts, Media & Entertainment (69.6%).
| Occupation | Male | Female |
| Management | 238 (40.5%) | 350 (59.5%) |
| Business & Financial | 250 (43.0%) | 332 (57.0%) |
| Computers, Engineering & Science | 636 (80.5%) | 154 (19.5%) |
| Computers & Mathematics | 414 (84.0%) | 79 (16.0%) |
| Architecture & Engineering | 113 (86.9%) | 17 (13.1%) |
| Life, Physical & Social Science | 109 (65.3%) | 58 (34.7%) |
| Community & Social Service | 363 (38.1%) | 589 (61.9%) |
| Education, Arts & Media | 107 (67.3%) | 52 (32.7%) |
| Legal Services & Support | 16 (48.5%) | 17 (51.5%) |
| Education Instruction & Library | 188 (31.9%) | 401 (68.1%) |
| Arts, Media & Entertainment | 52 (30.4%) | 119 (69.6%) |
| Health Diagnosing & Treating | 46 (10.8%) | 380 (89.2%) |
| Health Technologists | 21 (5.5%) | 359 (94.5%) |
| Total (Category) | 1,533 (45.9%) | 1,805 (54.1%) |
| Total (Overall) | 3,031 (46.9%) | 3,427 (53.1%) |
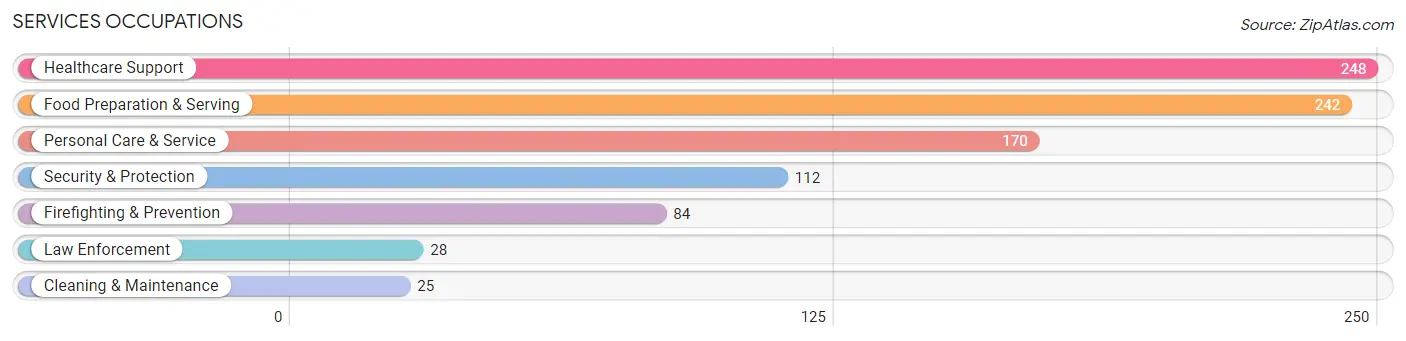
Services Occupations
The most common Services occupations in Vadnais Heights are Healthcare Support (248 | 3.8%), Food Preparation & Serving (242 | 3.7%), Personal Care & Service (170 | 2.6%), Security & Protection (112 | 1.7%), and Firefighting & Prevention (84 | 1.3%).
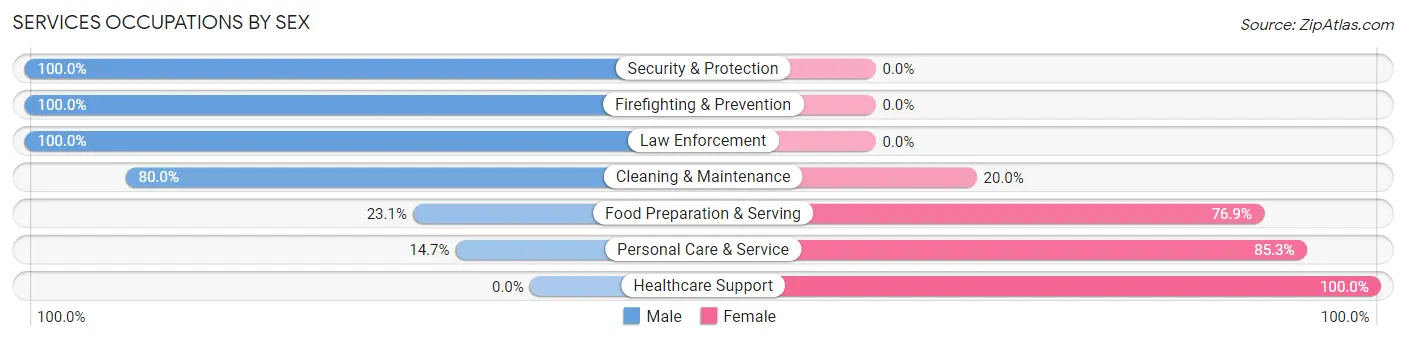
Services Occupations by Sex
Within the Services occupations in Vadnais Heights, the most male-oriented occupations are Security & Protection (100.0%), Firefighting & Prevention (100.0%), and Law Enforcement (100.0%), while the most female-oriented occupations are Healthcare Support (100.0%), Personal Care & Service (85.3%), and Food Preparation & Serving (76.9%).
| Occupation | Male | Female |
| Healthcare Support | 0 (0.0%) | 248 (100.0%) |
| Security & Protection | 112 (100.0%) | 0 (0.0%) |
| Firefighting & Prevention | 84 (100.0%) | 0 (0.0%) |
| Law Enforcement | 28 (100.0%) | 0 (0.0%) |
| Food Preparation & Serving | 56 (23.1%) | 186 (76.9%) |
| Cleaning & Maintenance | 20 (80.0%) | 5 (20.0%) |
| Personal Care & Service | 25 (14.7%) | 145 (85.3%) |
| Total (Category) | 213 (26.7%) | 584 (73.3%) |
| Total (Overall) | 3,031 (46.9%) | 3,427 (53.1%) |
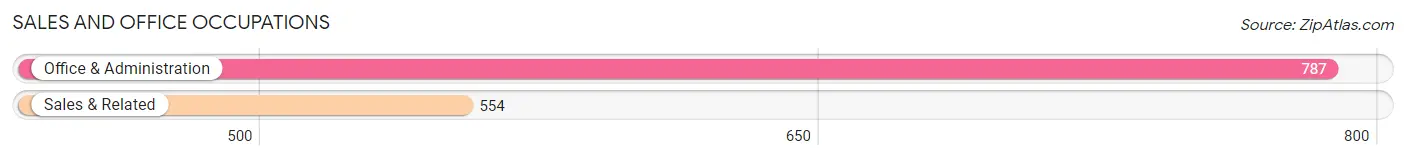
Sales and Office Occupations
The most common Sales and Office occupations in Vadnais Heights are Office & Administration (787 | 12.2%), and Sales & Related (554 | 8.6%).
Sales and Office Occupations by Sex
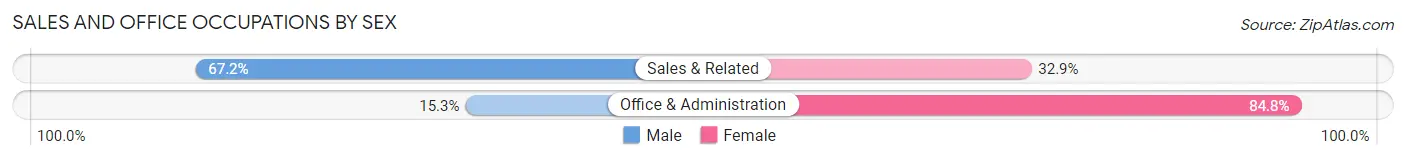
| Occupation | Male | Female |
| Sales & Related | 372 (67.1%) | 182 (32.9%) |
| Office & Administration | 120 (15.2%) | 667 (84.8%) |
| Total (Category) | 492 (36.7%) | 849 (63.3%) |
| Total (Overall) | 3,031 (46.9%) | 3,427 (53.1%) |
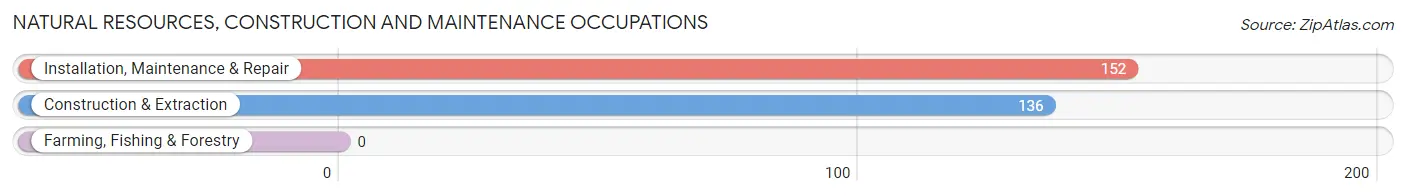
Natural Resources, Construction and Maintenance Occupations
The most common Natural Resources, Construction and Maintenance occupations in Vadnais Heights are Installation, Maintenance & Repair (152 | 2.4%), and Construction & Extraction (136 | 2.1%).
Natural Resources, Construction and Maintenance Occupations by Sex
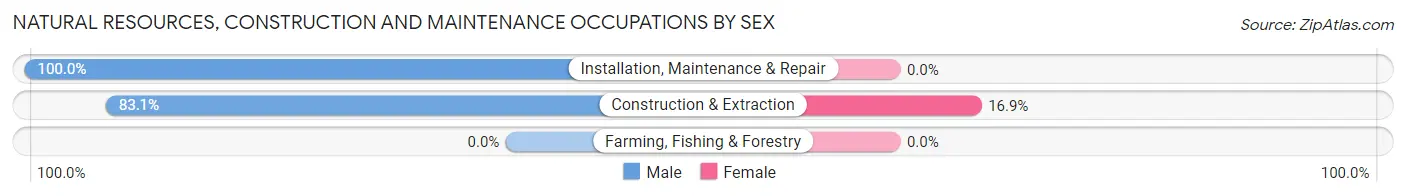
| Occupation | Male | Female |
| Farming, Fishing & Forestry | 0 (0.0%) | 0 (0.0%) |
| Construction & Extraction | 113 (83.1%) | 23 (16.9%) |
| Installation, Maintenance & Repair | 152 (100.0%) | 0 (0.0%) |
| Total (Category) | 265 (92.0%) | 23 (8.0%) |
| Total (Overall) | 3,031 (46.9%) | 3,427 (53.1%) |
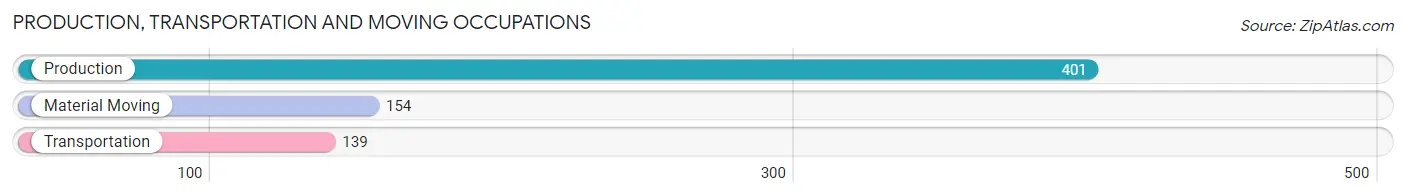
Production, Transportation and Moving Occupations
The most common Production, Transportation and Moving occupations in Vadnais Heights are Production (401 | 6.2%), Material Moving (154 | 2.4%), and Transportation (139 | 2.1%).
Production, Transportation and Moving Occupations by Sex
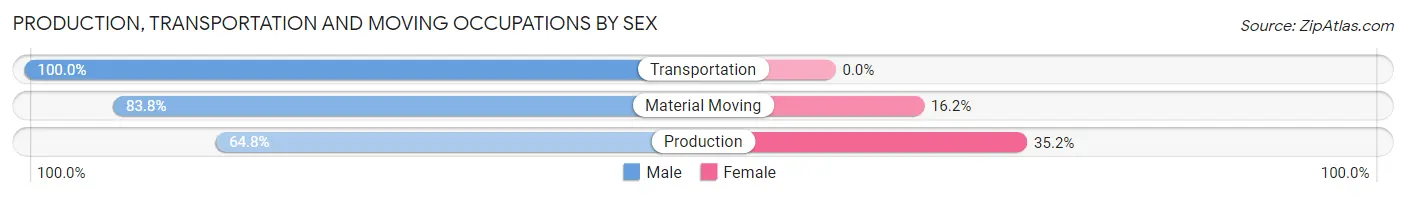
| Occupation | Male | Female |
| Production | 260 (64.8%) | 141 (35.2%) |
| Transportation | 139 (100.0%) | 0 (0.0%) |
| Material Moving | 129 (83.8%) | 25 (16.2%) |
| Total (Category) | 528 (76.1%) | 166 (23.9%) |
| Total (Overall) | 3,031 (46.9%) | 3,427 (53.1%) |
Employment Industries by Sex in Vadnais Heights
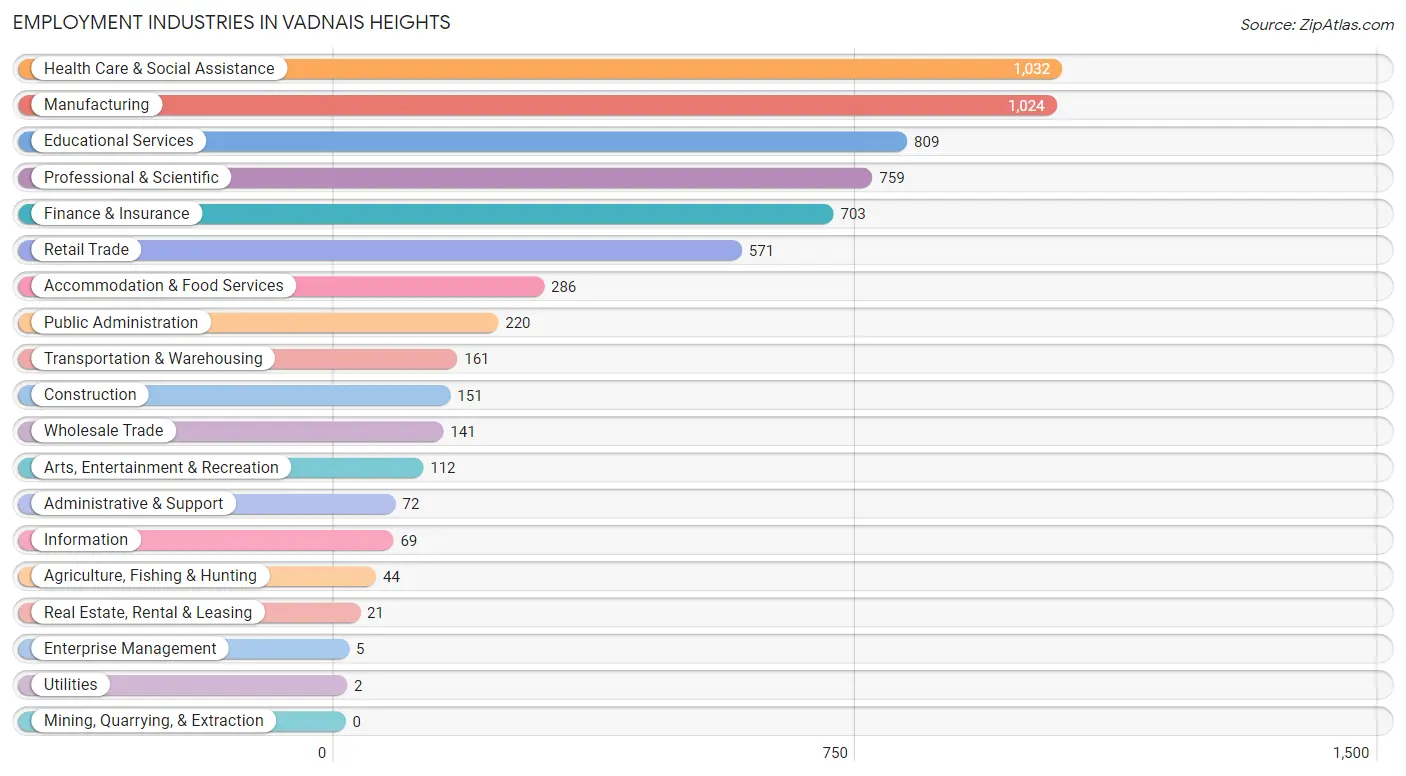
Employment Industries in Vadnais Heights
The major employment industries in Vadnais Heights include Health Care & Social Assistance (1,032 | 16.0%), Manufacturing (1,024 | 15.9%), Educational Services (809 | 12.5%), Professional & Scientific (759 | 11.7%), and Finance & Insurance (703 | 10.9%).
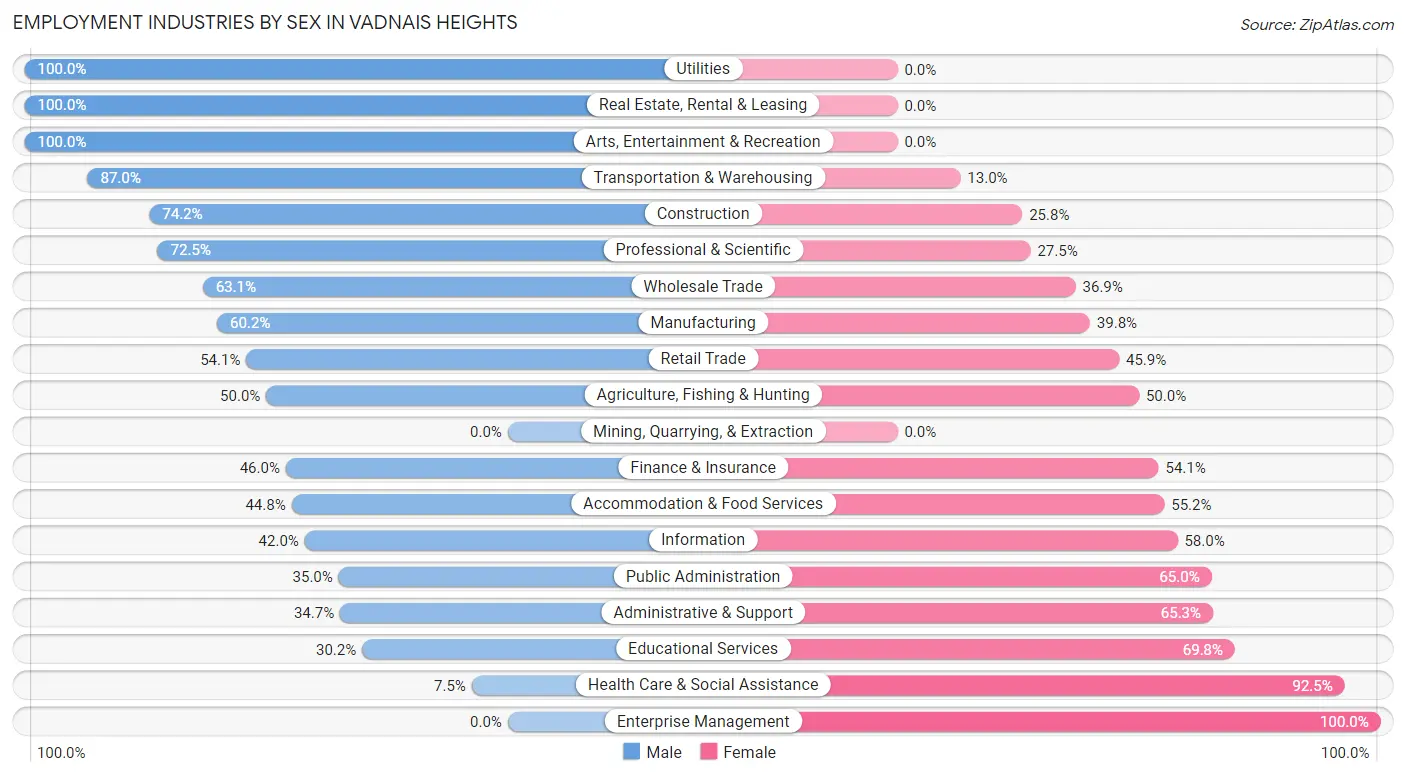
Employment Industries by Sex in Vadnais Heights
The Vadnais Heights industries that see more men than women are Utilities (100.0%), Real Estate, Rental & Leasing (100.0%), and Arts, Entertainment & Recreation (100.0%), whereas the industries that tend to have a higher number of women are Enterprise Management (100.0%), Health Care & Social Assistance (92.5%), and Educational Services (69.8%).
| Industry | Male | Female |
| Agriculture, Fishing & Hunting | 22 (50.0%) | 22 (50.0%) |
| Mining, Quarrying, & Extraction | 0 (0.0%) | 0 (0.0%) |
| Construction | 112 (74.2%) | 39 (25.8%) |
| Manufacturing | 616 (60.2%) | 408 (39.8%) |
| Wholesale Trade | 89 (63.1%) | 52 (36.9%) |
| Retail Trade | 309 (54.1%) | 262 (45.9%) |
| Transportation & Warehousing | 140 (87.0%) | 21 (13.0%) |
| Utilities | 2 (100.0%) | 0 (0.0%) |
| Information | 29 (42.0%) | 40 (58.0%) |
| Finance & Insurance | 323 (46.0%) | 380 (54.0%) |
| Real Estate, Rental & Leasing | 21 (100.0%) | 0 (0.0%) |
| Professional & Scientific | 550 (72.5%) | 209 (27.5%) |
| Enterprise Management | 0 (0.0%) | 5 (100.0%) |
| Administrative & Support | 25 (34.7%) | 47 (65.3%) |
| Educational Services | 244 (30.2%) | 565 (69.8%) |
| Health Care & Social Assistance | 77 (7.5%) | 955 (92.5%) |
| Arts, Entertainment & Recreation | 112 (100.0%) | 0 (0.0%) |
| Accommodation & Food Services | 128 (44.8%) | 158 (55.2%) |
| Public Administration | 77 (35.0%) | 143 (65.0%) |
| Total | 3,031 (46.9%) | 3,427 (53.1%) |
Education in Vadnais Heights
School Enrollment in Vadnais Heights
The most common levels of schooling among the 2,921 students in Vadnais Heights are elementary school (971 | 33.2%), middle school (671 | 23.0%), and high school (476 | 16.3%).
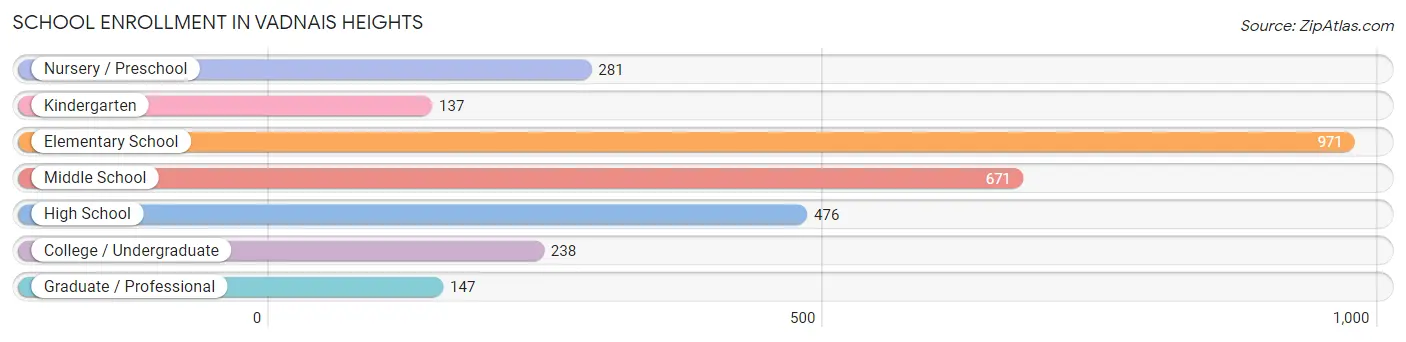
| School Level | # Students | % Students |
| Nursery / Preschool | 281 | 9.6% |
| Kindergarten | 137 | 4.7% |
| Elementary School | 971 | 33.2% |
| Middle School | 671 | 23.0% |
| High School | 476 | 16.3% |
| College / Undergraduate | 238 | 8.2% |
| Graduate / Professional | 147 | 5.0% |
| Total | 2,921 | 100.0% |
School Enrollment by Age by Funding Source in Vadnais Heights
Out of a total of 2,921 students who are enrolled in schools in Vadnais Heights, 681 (23.3%) attend a private institution, while the remaining 2,240 (76.7%) are enrolled in public schools. The age group of 3 to 4 year olds has the highest likelihood of being enrolled in private schools, with 176 (69.3% in the age bracket) enrolled. Conversely, the age group of 18 to 19 year olds has the lowest likelihood of being enrolled in a private school, with 111 (100.0% in the age bracket) attending a public institution.
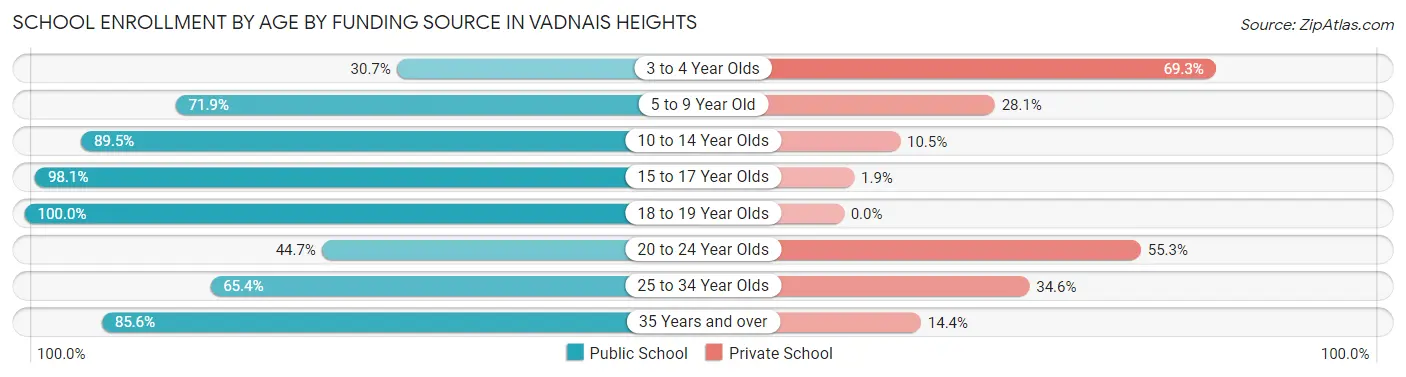
| Age Bracket | Public School | Private School |
| 3 to 4 Year Olds | 78 (30.7%) | 176 (69.3%) |
| 5 to 9 Year Old | 769 (71.9%) | 301 (28.1%) |
| 10 to 14 Year Olds | 682 (89.5%) | 80 (10.5%) |
| 15 to 17 Year Olds | 354 (98.1%) | 7 (1.9%) |
| 18 to 19 Year Olds | 111 (100.0%) | 0 (0.0%) |
| 20 to 24 Year Olds | 46 (44.7%) | 57 (55.3%) |
| 25 to 34 Year Olds | 70 (65.4%) | 37 (34.6%) |
| 35 Years and over | 131 (85.6%) | 22 (14.4%) |
| Total | 2,240 (76.7%) | 681 (23.3%) |
Educational Attainment by Field of Study in Vadnais Heights
Business (725 | 16.1%), engineering (502 | 11.1%), physical & health sciences (397 | 8.8%), education (388 | 8.6%), and science & technology (297 | 6.6%) are the most common fields of study among 4,505 individuals in Vadnais Heights who have obtained a bachelor's degree or higher.
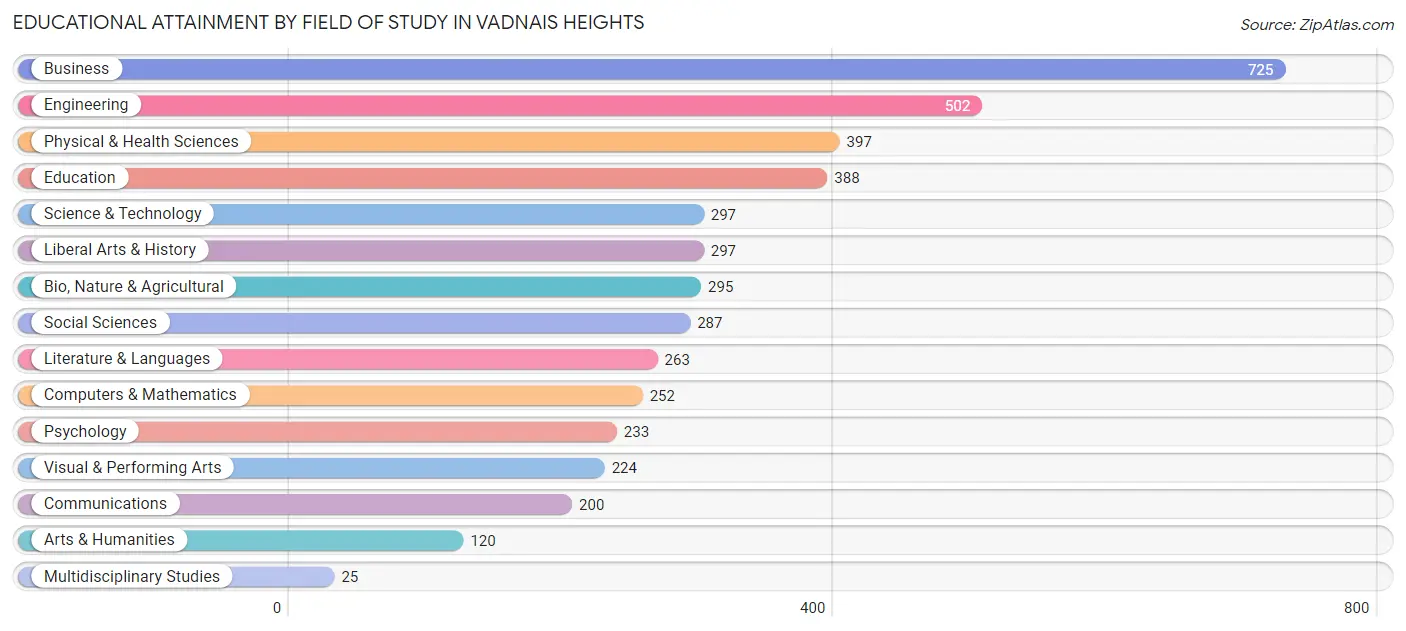
| Field of Study | # Graduates | % Graduates |
| Computers & Mathematics | 252 | 5.6% |
| Bio, Nature & Agricultural | 295 | 6.6% |
| Physical & Health Sciences | 397 | 8.8% |
| Psychology | 233 | 5.2% |
| Social Sciences | 287 | 6.4% |
| Engineering | 502 | 11.1% |
| Multidisciplinary Studies | 25 | 0.5% |
| Science & Technology | 297 | 6.6% |
| Business | 725 | 16.1% |
| Education | 388 | 8.6% |
| Literature & Languages | 263 | 5.8% |
| Liberal Arts & History | 297 | 6.6% |
| Visual & Performing Arts | 224 | 5.0% |
| Communications | 200 | 4.4% |
| Arts & Humanities | 120 | 2.7% |
| Total | 4,505 | 100.0% |
Transportation & Commute in Vadnais Heights
Vehicle Availability by Sex in Vadnais Heights
The most prevalent vehicle ownership categories in Vadnais Heights are males with 2 vehicles (1,460, accounting for 48.2%) and females with 2 vehicles (1,467, making up 43.5%).
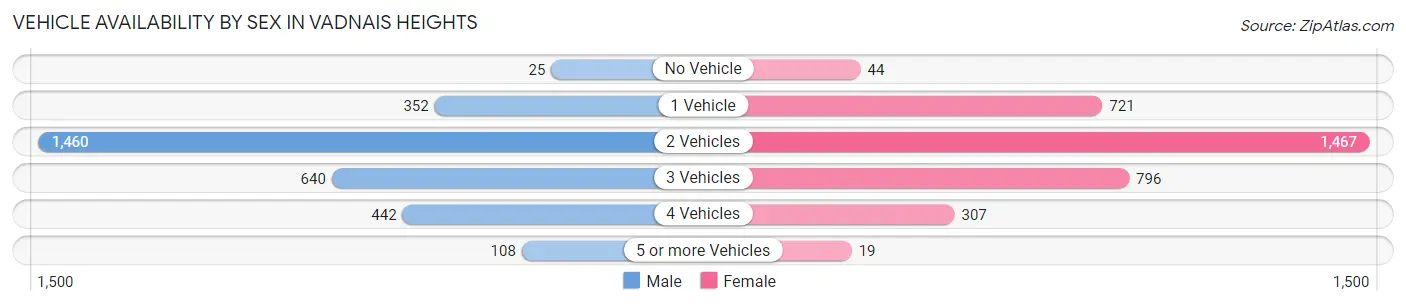
| Vehicles Available | Male | Female |
| No Vehicle | 25 (0.8%) | 44 (1.3%) |
| 1 Vehicle | 352 (11.6%) | 721 (21.5%) |
| 2 Vehicles | 1,460 (48.2%) | 1,467 (43.7%) |
| 3 Vehicles | 640 (21.1%) | 796 (23.7%) |
| 4 Vehicles | 442 (14.6%) | 307 (9.1%) |
| 5 or more Vehicles | 108 (3.6%) | 19 (0.6%) |
| Total | 3,027 (100.0%) | 3,354 (100.0%) |
Commute Time in Vadnais Heights
The most frequently occuring commute durations in Vadnais Heights are 20 to 24 minutes (936 commuters, 17.7%), 15 to 19 minutes (843 commuters, 15.9%), and 25 to 29 minutes (667 commuters, 12.6%).
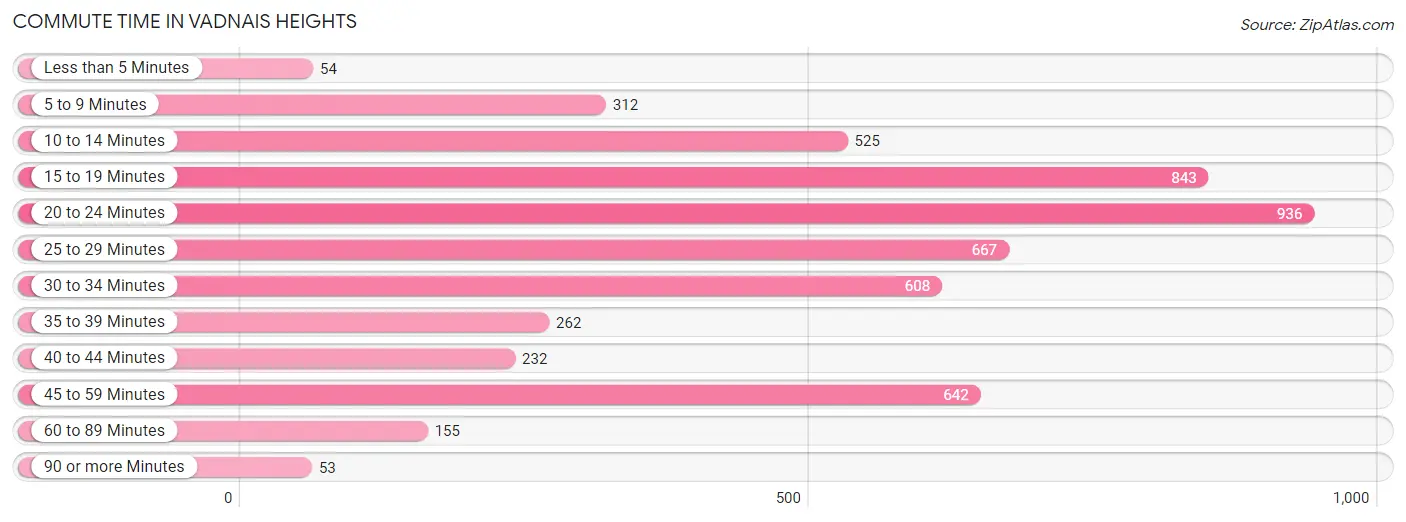
| Commute Time | # Commuters | % Commuters |
| Less than 5 Minutes | 54 | 1.0% |
| 5 to 9 Minutes | 312 | 5.9% |
| 10 to 14 Minutes | 525 | 9.9% |
| 15 to 19 Minutes | 843 | 15.9% |
| 20 to 24 Minutes | 936 | 17.7% |
| 25 to 29 Minutes | 667 | 12.6% |
| 30 to 34 Minutes | 608 | 11.5% |
| 35 to 39 Minutes | 262 | 5.0% |
| 40 to 44 Minutes | 232 | 4.4% |
| 45 to 59 Minutes | 642 | 12.1% |
| 60 to 89 Minutes | 155 | 2.9% |
| 90 or more Minutes | 53 | 1.0% |
Commute Time by Sex in Vadnais Heights
The most common commute times in Vadnais Heights are 45 to 59 minutes (419 commuters, 16.6%) for males and 20 to 24 minutes (598 commuters, 21.6%) for females.
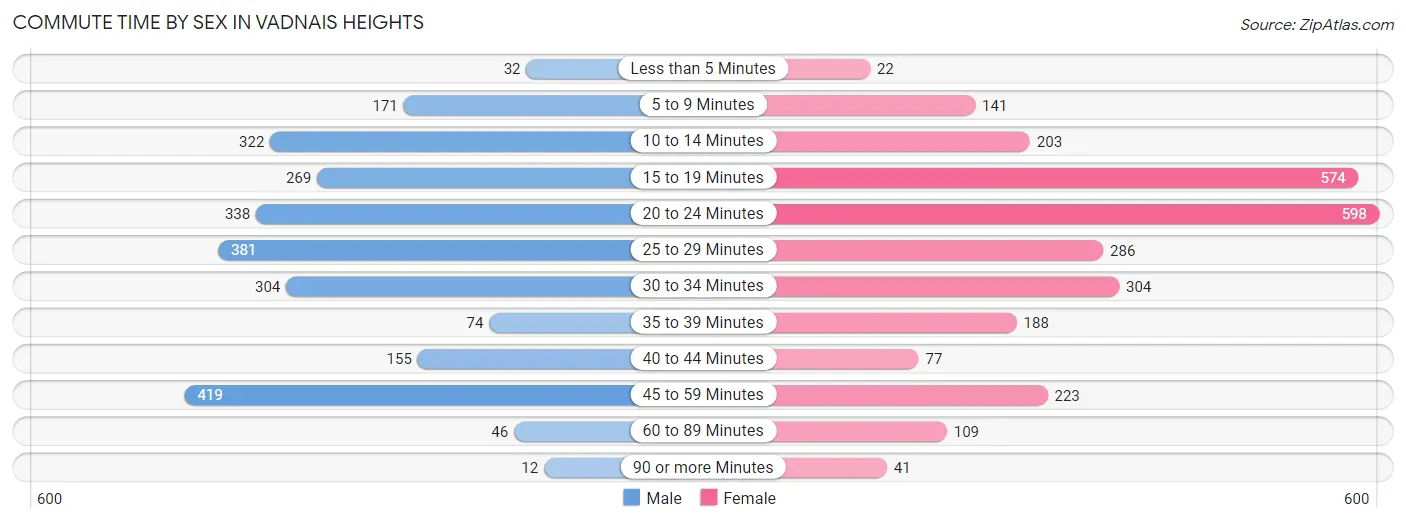
| Commute Time | Male | Female |
| Less than 5 Minutes | 32 (1.3%) | 22 (0.8%) |
| 5 to 9 Minutes | 171 (6.8%) | 141 (5.1%) |
| 10 to 14 Minutes | 322 (12.8%) | 203 (7.3%) |
| 15 to 19 Minutes | 269 (10.7%) | 574 (20.7%) |
| 20 to 24 Minutes | 338 (13.4%) | 598 (21.6%) |
| 25 to 29 Minutes | 381 (15.1%) | 286 (10.3%) |
| 30 to 34 Minutes | 304 (12.0%) | 304 (11.0%) |
| 35 to 39 Minutes | 74 (2.9%) | 188 (6.8%) |
| 40 to 44 Minutes | 155 (6.1%) | 77 (2.8%) |
| 45 to 59 Minutes | 419 (16.6%) | 223 (8.1%) |
| 60 to 89 Minutes | 46 (1.8%) | 109 (3.9%) |
| 90 or more Minutes | 12 (0.5%) | 41 (1.5%) |
Time of Departure to Work by Sex in Vadnais Heights
The most frequent times of departure to work in Vadnais Heights are 6:30 AM to 6:59 AM (445, 17.6%) for males and 8:00 AM to 8:29 AM (443, 16.0%) for females.
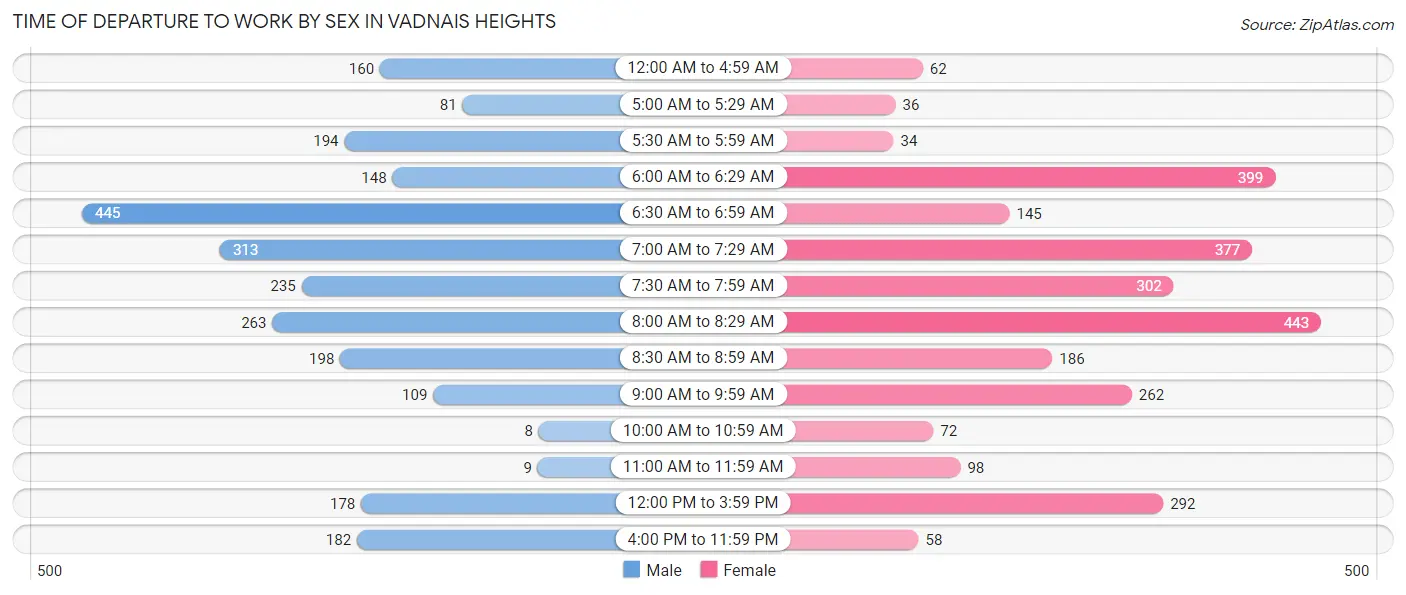
| Time of Departure | Male | Female |
| 12:00 AM to 4:59 AM | 160 (6.3%) | 62 (2.2%) |
| 5:00 AM to 5:29 AM | 81 (3.2%) | 36 (1.3%) |
| 5:30 AM to 5:59 AM | 194 (7.7%) | 34 (1.2%) |
| 6:00 AM to 6:29 AM | 148 (5.9%) | 399 (14.4%) |
| 6:30 AM to 6:59 AM | 445 (17.6%) | 145 (5.2%) |
| 7:00 AM to 7:29 AM | 313 (12.4%) | 377 (13.6%) |
| 7:30 AM to 7:59 AM | 235 (9.3%) | 302 (10.9%) |
| 8:00 AM to 8:29 AM | 263 (10.4%) | 443 (16.0%) |
| 8:30 AM to 8:59 AM | 198 (7.9%) | 186 (6.7%) |
| 9:00 AM to 9:59 AM | 109 (4.3%) | 262 (9.5%) |
| 10:00 AM to 10:59 AM | 8 (0.3%) | 72 (2.6%) |
| 11:00 AM to 11:59 AM | 9 (0.4%) | 98 (3.5%) |
| 12:00 PM to 3:59 PM | 178 (7.1%) | 292 (10.6%) |
| 4:00 PM to 11:59 PM | 182 (7.2%) | 58 (2.1%) |
| Total | 2,523 (100.0%) | 2,766 (100.0%) |
Housing Occupancy in Vadnais Heights
Occupancy by Ownership in Vadnais Heights
Of the total 5,514 dwellings in Vadnais Heights, owner-occupied units account for 4,558 (82.7%), while renter-occupied units make up 956 (17.3%).
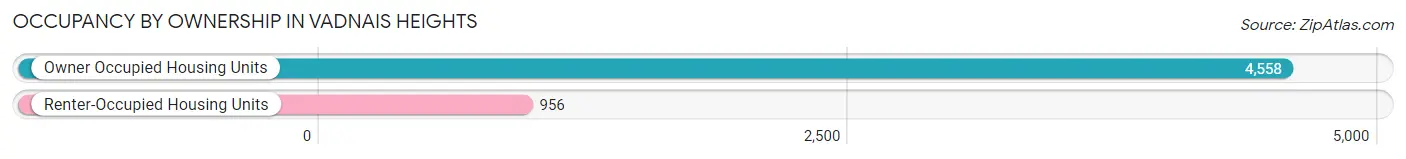
| Occupancy | # Housing Units | % Housing Units |
| Owner Occupied Housing Units | 4,558 | 82.7% |
| Renter-Occupied Housing Units | 956 | 17.3% |
| Total Occupied Housing Units | 5,514 | 100.0% |
Occupancy by Household Size in Vadnais Heights
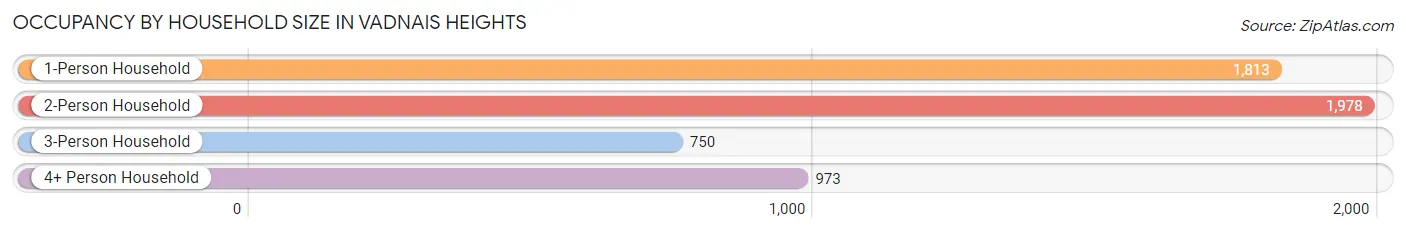
| Household Size | # Housing Units | % Housing Units |
| 1-Person Household | 1,813 | 32.9% |
| 2-Person Household | 1,978 | 35.9% |
| 3-Person Household | 750 | 13.6% |
| 4+ Person Household | 973 | 17.6% |
| Total Housing Units | 5,514 | 100.0% |
Occupancy by Ownership by Household Size in Vadnais Heights
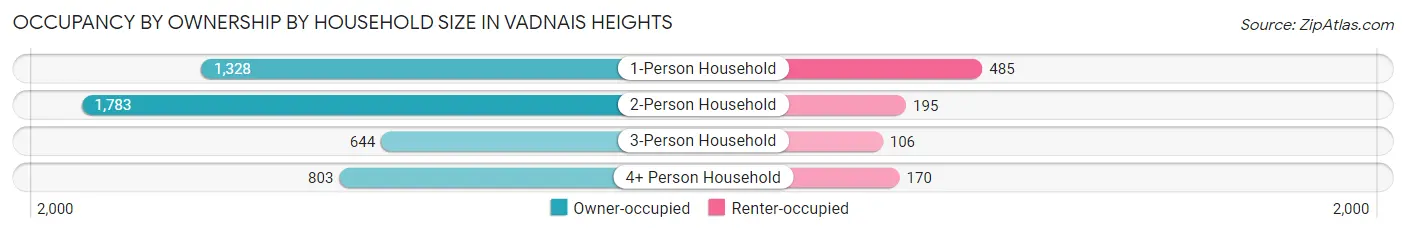
| Household Size | Owner-occupied | Renter-occupied |
| 1-Person Household | 1,328 (73.3%) | 485 (26.8%) |
| 2-Person Household | 1,783 (90.1%) | 195 (9.9%) |
| 3-Person Household | 644 (85.9%) | 106 (14.1%) |
| 4+ Person Household | 803 (82.5%) | 170 (17.5%) |
| Total Housing Units | 4,558 (82.7%) | 956 (17.3%) |
Occupancy by Educational Attainment in Vadnais Heights
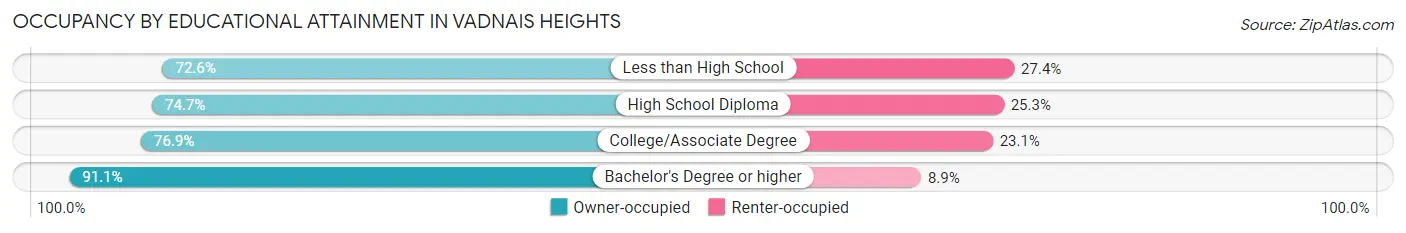
| Household Size | Owner-occupied | Renter-occupied |
| Less than High School | 77 (72.6%) | 29 (27.4%) |
| High School Diploma | 916 (74.7%) | 310 (25.3%) |
| College/Associate Degree | 1,328 (76.9%) | 399 (23.1%) |
| Bachelor's Degree or higher | 2,237 (91.1%) | 218 (8.9%) |
Occupancy by Age of Householder in Vadnais Heights
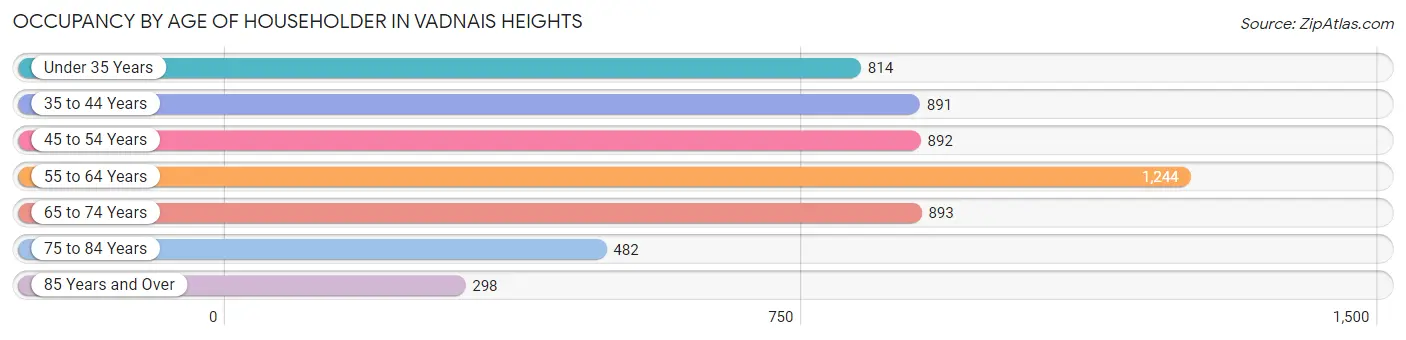
| Age Bracket | # Households | % Households |
| Under 35 Years | 814 | 14.8% |
| 35 to 44 Years | 891 | 16.2% |
| 45 to 54 Years | 892 | 16.2% |
| 55 to 64 Years | 1,244 | 22.6% |
| 65 to 74 Years | 893 | 16.2% |
| 75 to 84 Years | 482 | 8.7% |
| 85 Years and Over | 298 | 5.4% |
| Total | 5,514 | 100.0% |
Housing Finances in Vadnais Heights
Median Income by Occupancy in Vadnais Heights
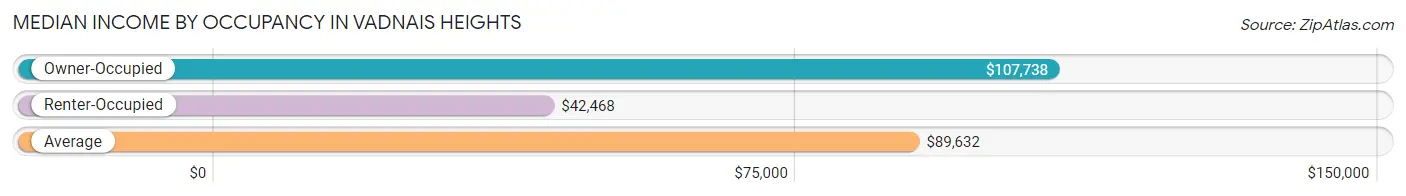
| Occupancy Type | # Households | Median Income |
| Owner-Occupied | 4,558 (82.7%) | $107,738 |
| Renter-Occupied | 956 (17.3%) | $42,468 |
| Average | 5,514 (100.0%) | $89,632 |
Occupancy by Householder Income Bracket in Vadnais Heights
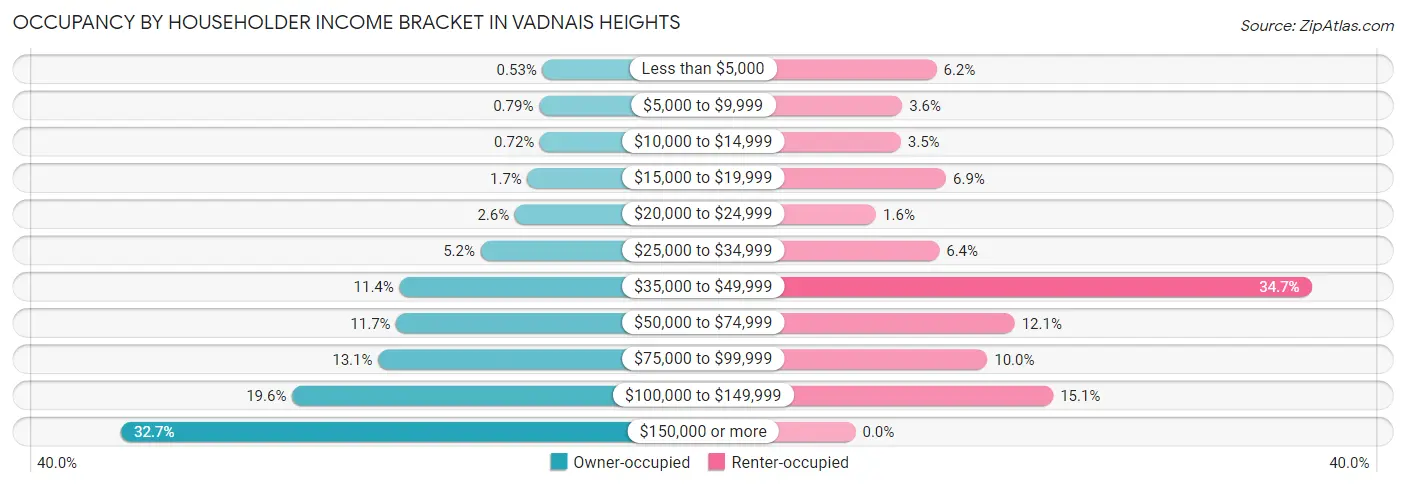
| Income Bracket | Owner-occupied | Renter-occupied |
| Less than $5,000 | 24 (0.5%) | 59 (6.2%) |
| $5,000 to $9,999 | 36 (0.8%) | 34 (3.6%) |
| $10,000 to $14,999 | 33 (0.7%) | 33 (3.5%) |
| $15,000 to $19,999 | 76 (1.7%) | 66 (6.9%) |
| $20,000 to $24,999 | 120 (2.6%) | 15 (1.6%) |
| $25,000 to $34,999 | 239 (5.2%) | 61 (6.4%) |
| $35,000 to $49,999 | 521 (11.4%) | 332 (34.7%) |
| $50,000 to $74,999 | 532 (11.7%) | 116 (12.1%) |
| $75,000 to $99,999 | 595 (13.1%) | 96 (10.0%) |
| $100,000 to $149,999 | 894 (19.6%) | 144 (15.1%) |
| $150,000 or more | 1,488 (32.7%) | 0 (0.0%) |
| Total | 4,558 (100.0%) | 956 (100.0%) |
Monthly Housing Cost Tiers in Vadnais Heights
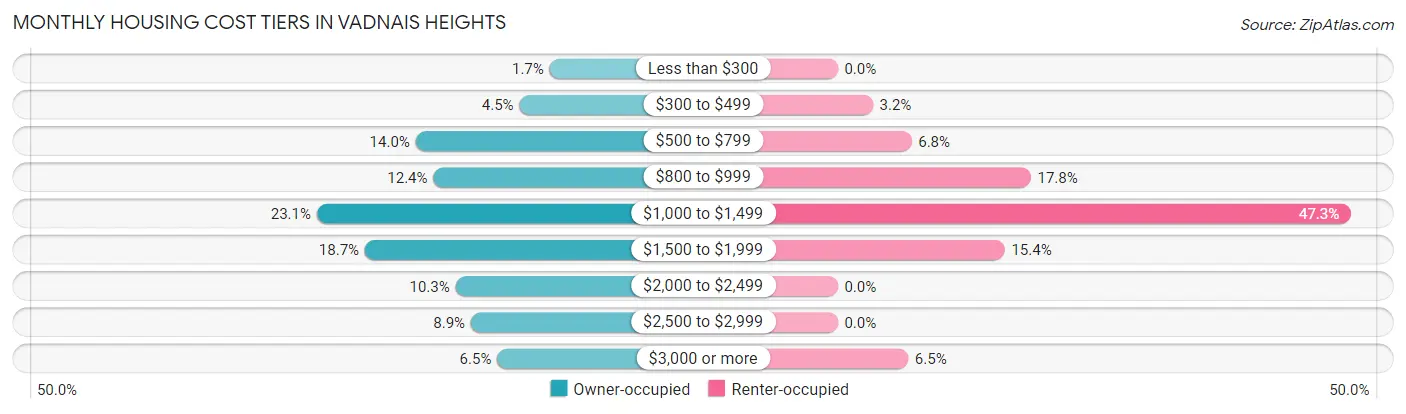
| Monthly Cost | Owner-occupied | Renter-occupied |
| Less than $300 | 76 (1.7%) | 0 (0.0%) |
| $300 to $499 | 203 (4.4%) | 31 (3.2%) |
| $500 to $799 | 638 (14.0%) | 65 (6.8%) |
| $800 to $999 | 564 (12.4%) | 170 (17.8%) |
| $1,000 to $1,499 | 1,053 (23.1%) | 452 (47.3%) |
| $1,500 to $1,999 | 851 (18.7%) | 147 (15.4%) |
| $2,000 to $2,499 | 471 (10.3%) | 0 (0.0%) |
| $2,500 to $2,999 | 406 (8.9%) | 0 (0.0%) |
| $3,000 or more | 296 (6.5%) | 62 (6.5%) |
| Total | 4,558 (100.0%) | 956 (100.0%) |
Physical Housing Characteristics in Vadnais Heights
Housing Structures in Vadnais Heights
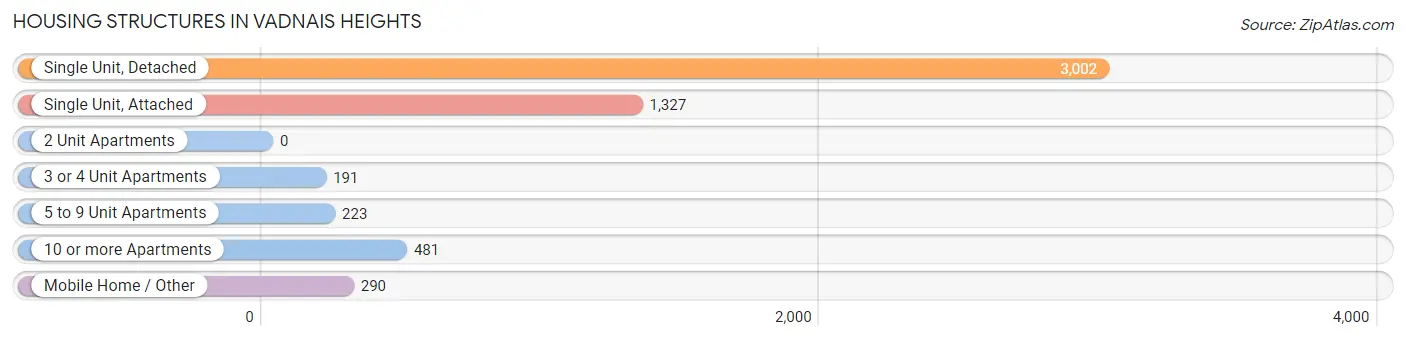
| Structure Type | # Housing Units | % Housing Units |
| Single Unit, Detached | 3,002 | 54.4% |
| Single Unit, Attached | 1,327 | 24.1% |
| 2 Unit Apartments | 0 | 0.0% |
| 3 or 4 Unit Apartments | 191 | 3.5% |
| 5 to 9 Unit Apartments | 223 | 4.0% |
| 10 or more Apartments | 481 | 8.7% |
| Mobile Home / Other | 290 | 5.3% |
| Total | 5,514 | 100.0% |
Housing Structures by Occupancy in Vadnais Heights
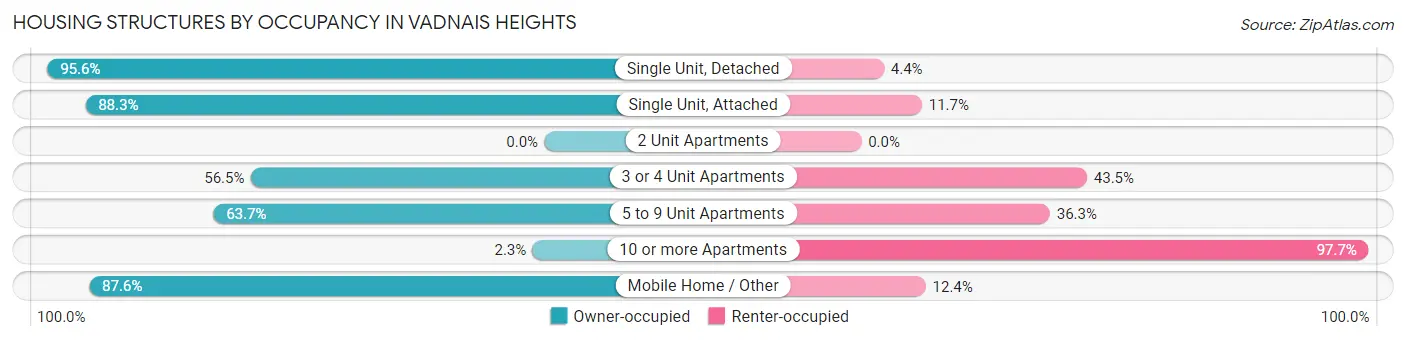
| Structure Type | Owner-occupied | Renter-occupied |
| Single Unit, Detached | 2,871 (95.6%) | 131 (4.4%) |
| Single Unit, Attached | 1,172 (88.3%) | 155 (11.7%) |
| 2 Unit Apartments | 0 (0.0%) | 0 (0.0%) |
| 3 or 4 Unit Apartments | 108 (56.5%) | 83 (43.5%) |
| 5 to 9 Unit Apartments | 142 (63.7%) | 81 (36.3%) |
| 10 or more Apartments | 11 (2.3%) | 470 (97.7%) |
| Mobile Home / Other | 254 (87.6%) | 36 (12.4%) |
| Total | 4,558 (82.7%) | 956 (17.3%) |
Housing Structures by Number of Rooms in Vadnais Heights
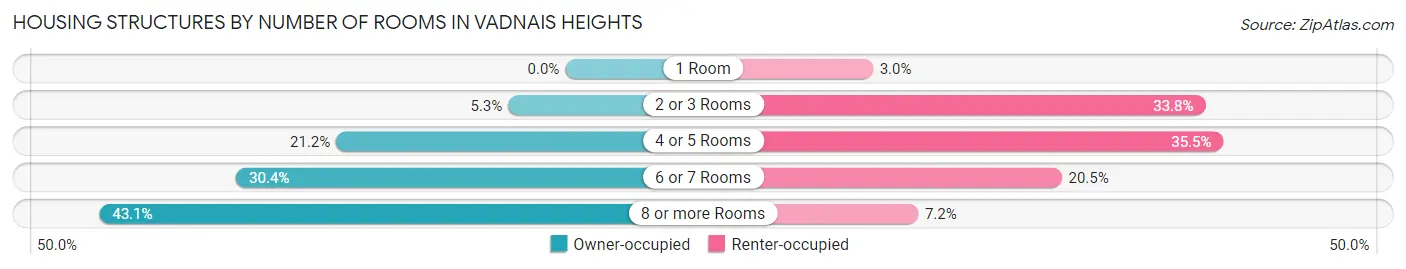
| Number of Rooms | Owner-occupied | Renter-occupied |
| 1 Room | 0 (0.0%) | 29 (3.0%) |
| 2 or 3 Rooms | 241 (5.3%) | 323 (33.8%) |
| 4 or 5 Rooms | 966 (21.2%) | 339 (35.5%) |
| 6 or 7 Rooms | 1,387 (30.4%) | 196 (20.5%) |
| 8 or more Rooms | 1,964 (43.1%) | 69 (7.2%) |
| Total | 4,558 (100.0%) | 956 (100.0%) |
Housing Structure by Heating Type in Vadnais Heights
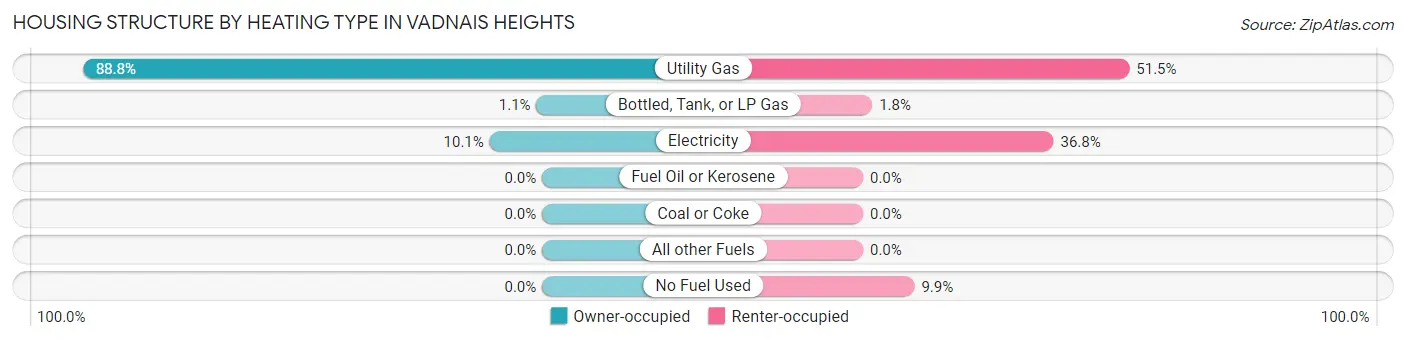
| Heating Type | Owner-occupied | Renter-occupied |
| Utility Gas | 4,046 (88.8%) | 492 (51.5%) |
| Bottled, Tank, or LP Gas | 50 (1.1%) | 17 (1.8%) |
| Electricity | 462 (10.1%) | 352 (36.8%) |
| Fuel Oil or Kerosene | 0 (0.0%) | 0 (0.0%) |
| Coal or Coke | 0 (0.0%) | 0 (0.0%) |
| All other Fuels | 0 (0.0%) | 0 (0.0%) |
| No Fuel Used | 0 (0.0%) | 95 (9.9%) |
| Total | 4,558 (100.0%) | 956 (100.0%) |
Household Vehicle Usage in Vadnais Heights
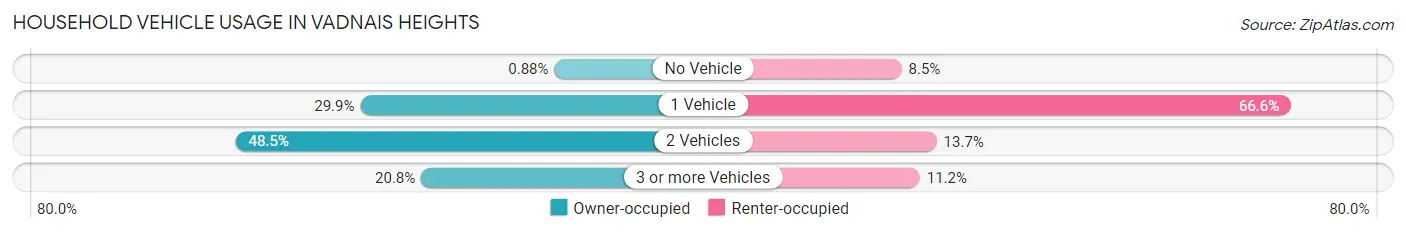
| Vehicles per Household | Owner-occupied | Renter-occupied |
| No Vehicle | 40 (0.9%) | 81 (8.5%) |
| 1 Vehicle | 1,361 (29.9%) | 637 (66.6%) |
| 2 Vehicles | 2,210 (48.5%) | 131 (13.7%) |
| 3 or more Vehicles | 947 (20.8%) | 107 (11.2%) |
| Total | 4,558 (100.0%) | 956 (100.0%) |
Real Estate & Mortgages in Vadnais Heights
Real Estate and Mortgage Overview in Vadnais Heights
| Characteristic | Without Mortgage | With Mortgage |
| Housing Units | 1,723 | 2,835 |
| Median Property Value | $317,400 | $313,200 |
| Median Household Income | $86,894 | $1,114 |
| Monthly Housing Costs | $796 | $294 |
| Real Estate Taxes | $3,865 | $61 |
Property Value by Mortgage Status in Vadnais Heights
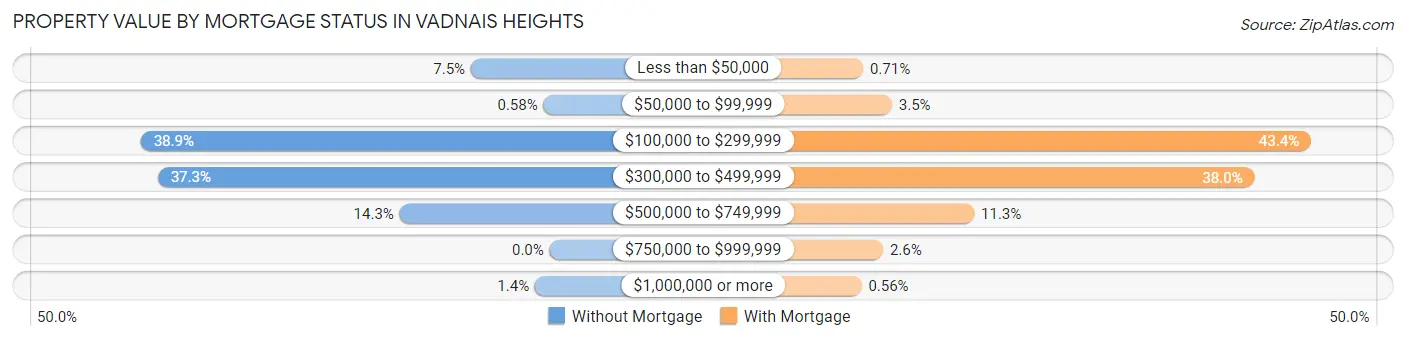
| Property Value | Without Mortgage | With Mortgage |
| Less than $50,000 | 129 (7.5%) | 20 (0.7%) |
| $50,000 to $99,999 | 10 (0.6%) | 98 (3.5%) |
| $100,000 to $299,999 | 671 (38.9%) | 1,230 (43.4%) |
| $300,000 to $499,999 | 643 (37.3%) | 1,077 (38.0%) |
| $500,000 to $749,999 | 246 (14.3%) | 320 (11.3%) |
| $750,000 to $999,999 | 0 (0.0%) | 74 (2.6%) |
| $1,000,000 or more | 24 (1.4%) | 16 (0.6%) |
| Total | 1,723 (100.0%) | 2,835 (100.0%) |
Household Income by Mortgage Status in Vadnais Heights
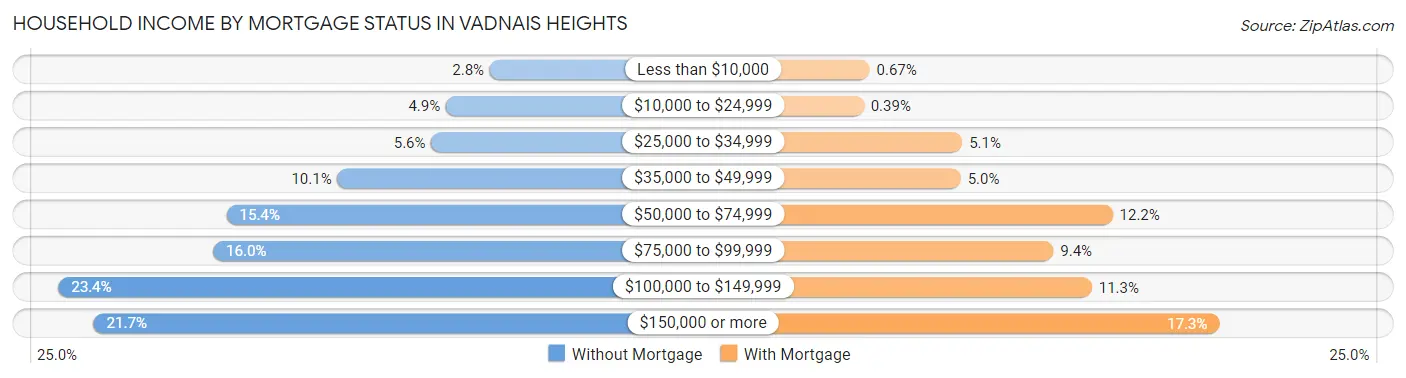
| Household Income | Without Mortgage | With Mortgage |
| Less than $10,000 | 49 (2.8%) | 19 (0.7%) |
| $10,000 to $24,999 | 85 (4.9%) | 11 (0.4%) |
| $25,000 to $34,999 | 97 (5.6%) | 144 (5.1%) |
| $35,000 to $49,999 | 174 (10.1%) | 142 (5.0%) |
| $50,000 to $74,999 | 265 (15.4%) | 347 (12.2%) |
| $75,000 to $99,999 | 276 (16.0%) | 267 (9.4%) |
| $100,000 to $149,999 | 403 (23.4%) | 319 (11.3%) |
| $150,000 or more | 374 (21.7%) | 491 (17.3%) |
| Total | 1,723 (100.0%) | 2,835 (100.0%) |
Property Value to Household Income Ratio in Vadnais Heights
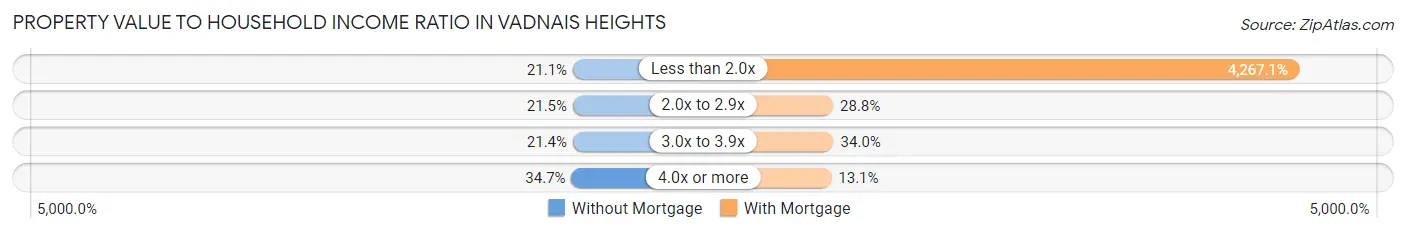
| Value-to-Income Ratio | Without Mortgage | With Mortgage |
| Less than 2.0x | 364 (21.1%) | 120,972 (4,267.1%) |
| 2.0x to 2.9x | 371 (21.5%) | 817 (28.8%) |
| 3.0x to 3.9x | 369 (21.4%) | 965 (34.0%) |
| 4.0x or more | 598 (34.7%) | 371 (13.1%) |
| Total | 1,723 (100.0%) | 2,835 (100.0%) |
Real Estate Taxes by Mortgage Status in Vadnais Heights
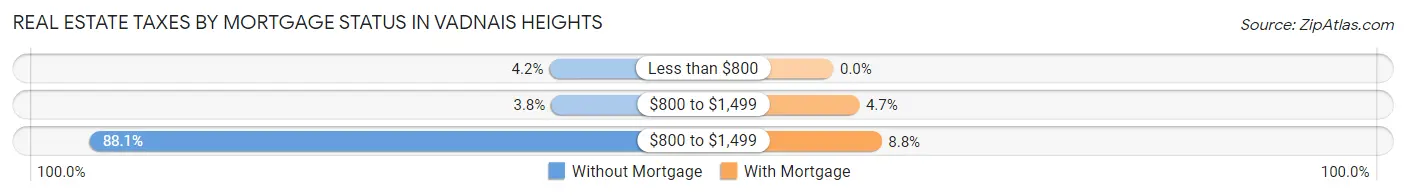
| Property Taxes | Without Mortgage | With Mortgage |
| Less than $800 | 72 (4.2%) | 0 (0.0%) |
| $800 to $1,499 | 66 (3.8%) | 134 (4.7%) |
| $800 to $1,499 | 1,518 (88.1%) | 250 (8.8%) |
| Total | 1,723 (100.0%) | 2,835 (100.0%) |
Health & Disability in Vadnais Heights
Health Insurance Coverage by Age in Vadnais Heights
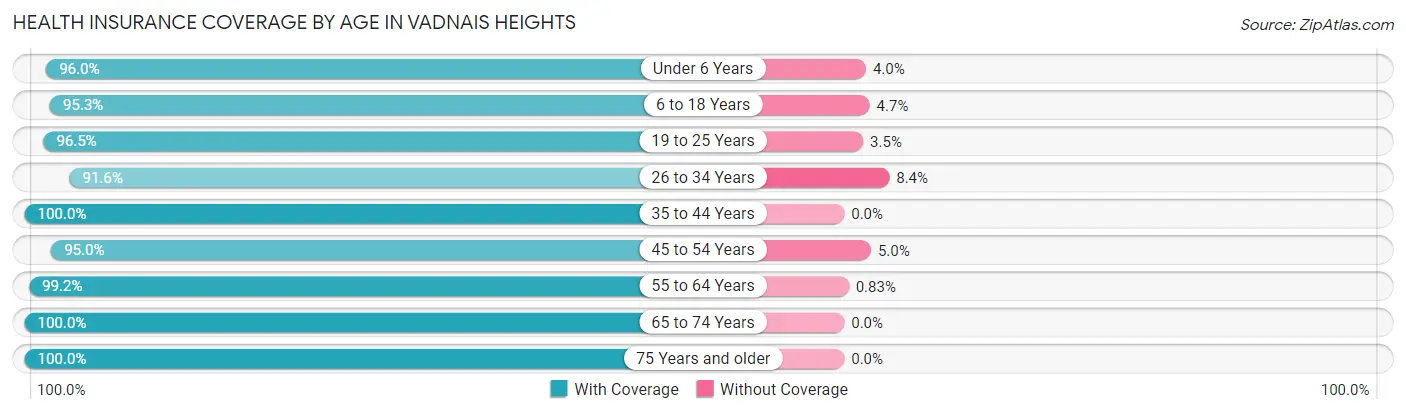
| Age Bracket | With Coverage | Without Coverage |
| Under 6 Years | 832 (96.0%) | 35 (4.0%) |
| 6 to 18 Years | 2,157 (95.3%) | 107 (4.7%) |
| 19 to 25 Years | 685 (96.5%) | 25 (3.5%) |
| 26 to 34 Years | 1,256 (91.6%) | 115 (8.4%) |
| 35 to 44 Years | 1,564 (100.0%) | 0 (0.0%) |
| 45 to 54 Years | 1,529 (95.0%) | 80 (5.0%) |
| 55 to 64 Years | 2,022 (99.2%) | 17 (0.8%) |
| 65 to 74 Years | 1,425 (100.0%) | 0 (0.0%) |
| 75 Years and older | 1,003 (100.0%) | 0 (0.0%) |
| Total | 12,473 (97.1%) | 379 (2.9%) |
Health Insurance Coverage by Citizenship Status in Vadnais Heights
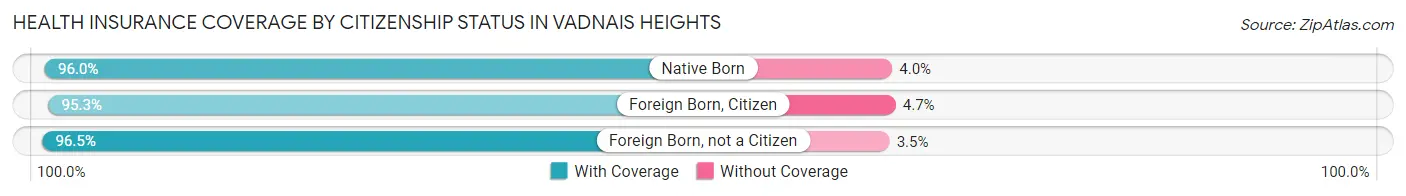
| Citizenship Status | With Coverage | Without Coverage |
| Native Born | 832 (96.0%) | 35 (4.0%) |
| Foreign Born, Citizen | 2,157 (95.3%) | 107 (4.7%) |
| Foreign Born, not a Citizen | 685 (96.5%) | 25 (3.5%) |
Health Insurance Coverage by Household Income in Vadnais Heights
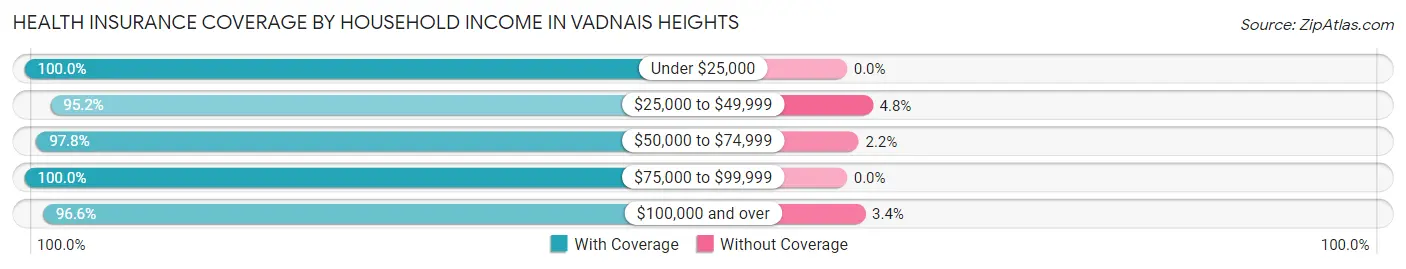
| Household Income | With Coverage | Without Coverage |
| Under $25,000 | 696 (100.0%) | 0 (0.0%) |
| $25,000 to $49,999 | 1,948 (95.2%) | 99 (4.8%) |
| $50,000 to $74,999 | 1,112 (97.8%) | 25 (2.2%) |
| $75,000 to $99,999 | 1,463 (100.0%) | 0 (0.0%) |
| $100,000 and over | 7,189 (96.6%) | 255 (3.4%) |
Public vs Private Health Insurance Coverage by Age in Vadnais Heights
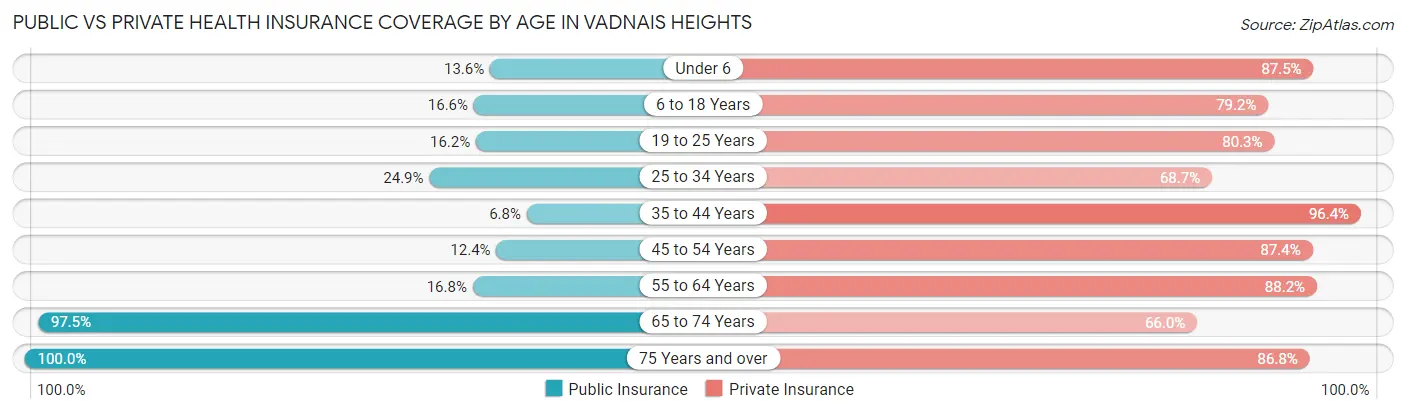
| Age Bracket | Public Insurance | Private Insurance |
| Under 6 | 118 (13.6%) | 759 (87.5%) |
| 6 to 18 Years | 376 (16.6%) | 1,792 (79.1%) |
| 19 to 25 Years | 115 (16.2%) | 570 (80.3%) |
| 25 to 34 Years | 341 (24.9%) | 942 (68.7%) |
| 35 to 44 Years | 106 (6.8%) | 1,507 (96.4%) |
| 45 to 54 Years | 200 (12.4%) | 1,406 (87.4%) |
| 55 to 64 Years | 343 (16.8%) | 1,798 (88.2%) |
| 65 to 74 Years | 1,390 (97.5%) | 940 (66.0%) |
| 75 Years and over | 1,003 (100.0%) | 871 (86.8%) |
| Total | 3,992 (31.1%) | 10,585 (82.4%) |
Disability Status by Sex by Age in Vadnais Heights
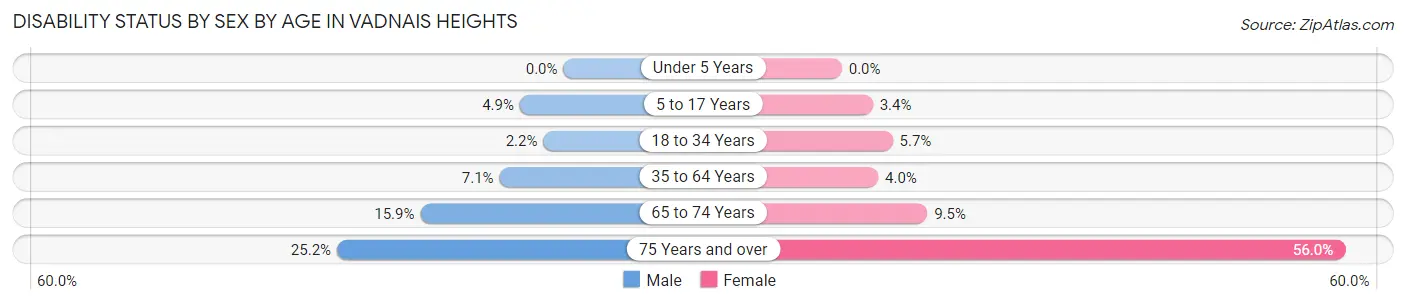
| Age Bracket | Male | Female |
| Under 5 Years | 0 (0.0%) | 0 (0.0%) |
| 5 to 17 Years | 59 (4.9%) | 37 (3.4%) |
| 18 to 34 Years | 26 (2.2%) | 59 (5.7%) |
| 35 to 64 Years | 165 (7.1%) | 117 (4.0%) |
| 65 to 74 Years | 98 (15.9%) | 77 (9.5%) |
| 75 Years and over | 113 (25.2%) | 311 (56.0%) |
Disability Class by Sex by Age in Vadnais Heights
Disability Class: Hearing Difficulty
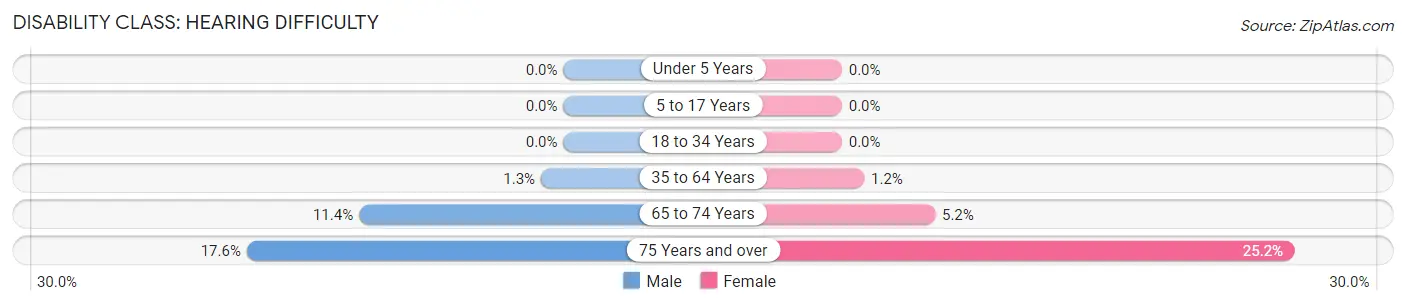
| Age Bracket | Male | Female |
| Under 5 Years | 0 (0.0%) | 0 (0.0%) |
| 5 to 17 Years | 0 (0.0%) | 0 (0.0%) |
| 18 to 34 Years | 0 (0.0%) | 0 (0.0%) |
| 35 to 64 Years | 29 (1.3%) | 36 (1.2%) |
| 65 to 74 Years | 70 (11.4%) | 42 (5.2%) |
| 75 Years and over | 79 (17.6%) | 140 (25.2%) |
Disability Class: Vision Difficulty
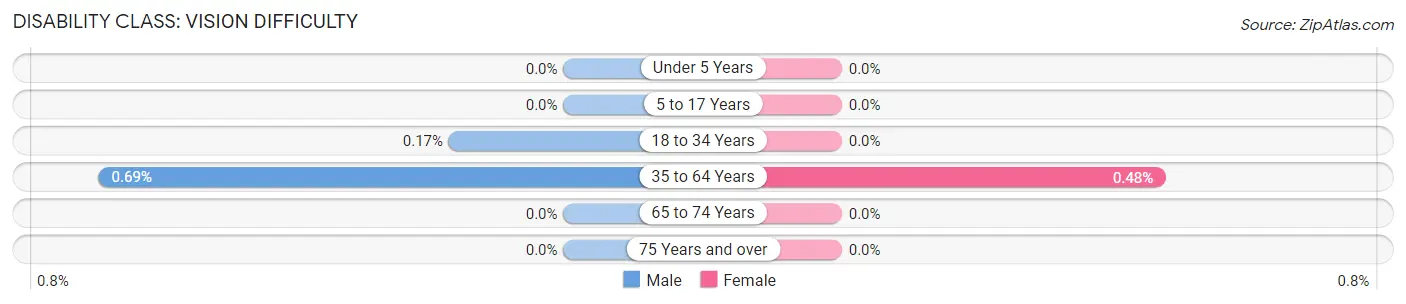
| Age Bracket | Male | Female |
| Under 5 Years | 0 (0.0%) | 0 (0.0%) |
| 5 to 17 Years | 0 (0.0%) | 0 (0.0%) |
| 18 to 34 Years | 2 (0.2%) | 0 (0.0%) |
| 35 to 64 Years | 16 (0.7%) | 14 (0.5%) |
| 65 to 74 Years | 0 (0.0%) | 0 (0.0%) |
| 75 Years and over | 0 (0.0%) | 0 (0.0%) |
Disability Class: Cognitive Difficulty
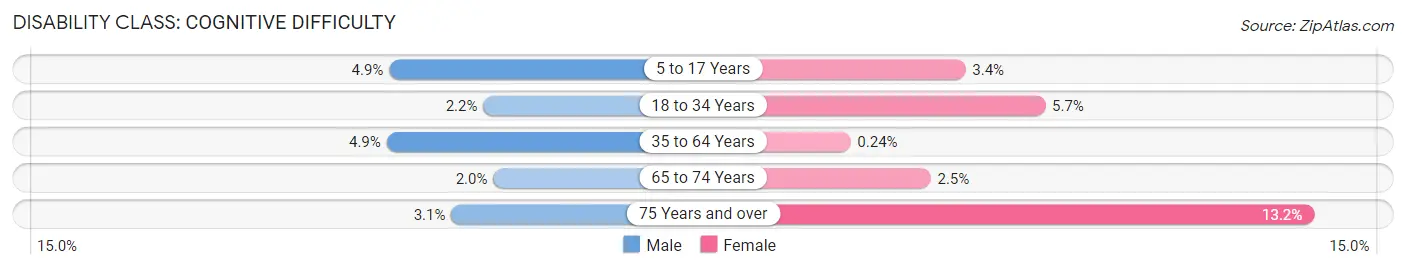
| Age Bracket | Male | Female |
| 5 to 17 Years | 59 (4.9%) | 37 (3.4%) |
| 18 to 34 Years | 26 (2.2%) | 59 (5.7%) |
| 35 to 64 Years | 114 (4.9%) | 7 (0.2%) |
| 65 to 74 Years | 12 (1.9%) | 20 (2.5%) |
| 75 Years and over | 14 (3.1%) | 73 (13.2%) |
Disability Class: Ambulatory Difficulty
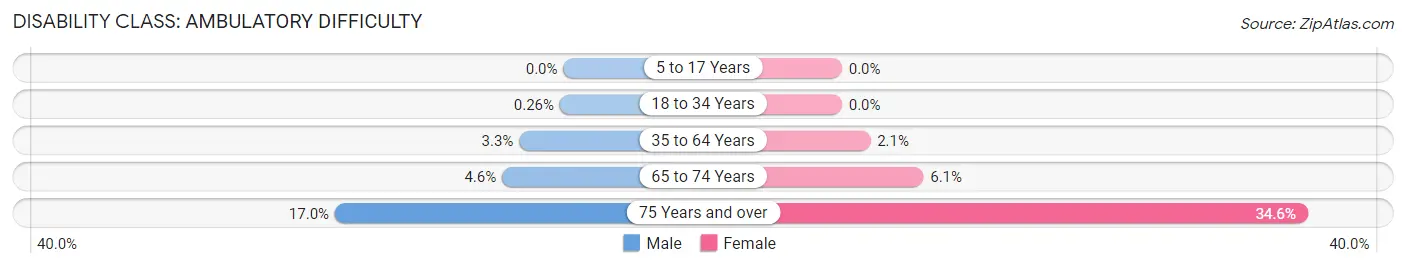
| Age Bracket | Male | Female |
| 5 to 17 Years | 0 (0.0%) | 0 (0.0%) |
| 18 to 34 Years | 3 (0.3%) | 0 (0.0%) |
| 35 to 64 Years | 76 (3.3%) | 61 (2.1%) |
| 65 to 74 Years | 28 (4.5%) | 49 (6.0%) |
| 75 Years and over | 76 (17.0%) | 192 (34.6%) |
Disability Class: Self-Care Difficulty
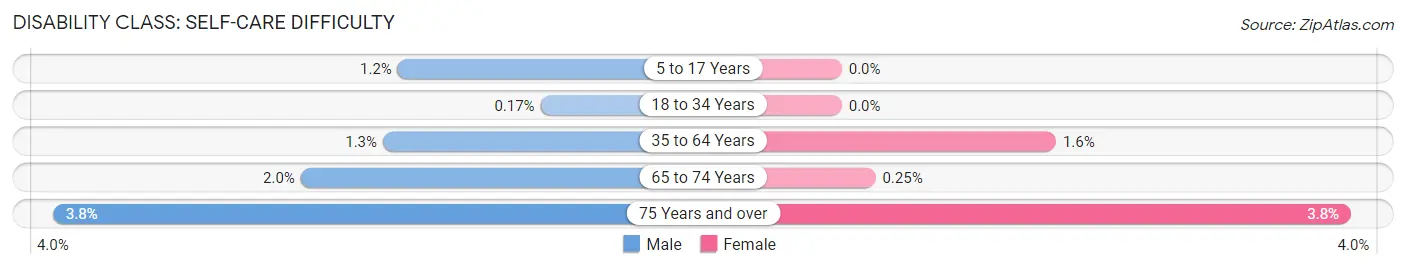
| Age Bracket | Male | Female |
| 5 to 17 Years | 15 (1.2%) | 0 (0.0%) |
| 18 to 34 Years | 2 (0.2%) | 0 (0.0%) |
| 35 to 64 Years | 31 (1.3%) | 46 (1.6%) |
| 65 to 74 Years | 12 (1.9%) | 2 (0.3%) |
| 75 Years and over | 17 (3.8%) | 21 (3.8%) |
Technology Access in Vadnais Heights
Computing Device Access in Vadnais Heights
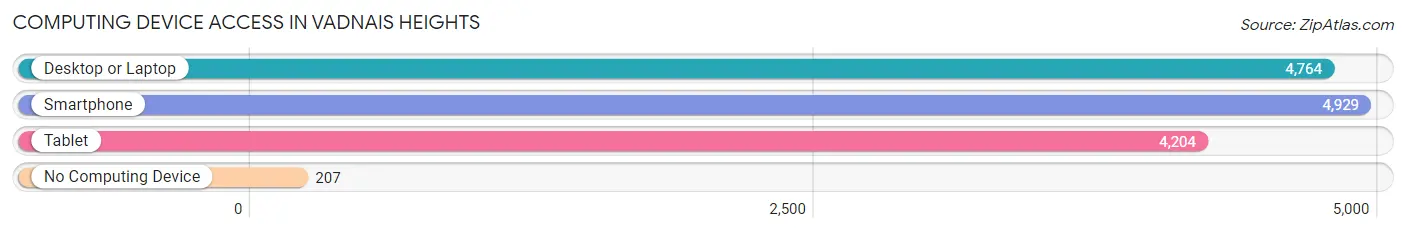
| Device Type | # Households | % Households |
| Desktop or Laptop | 4,764 | 86.4% |
| Smartphone | 4,929 | 89.4% |
| Tablet | 4,204 | 76.2% |
| No Computing Device | 207 | 3.7% |
| Total | 5,514 | 100.0% |
Internet Access in Vadnais Heights
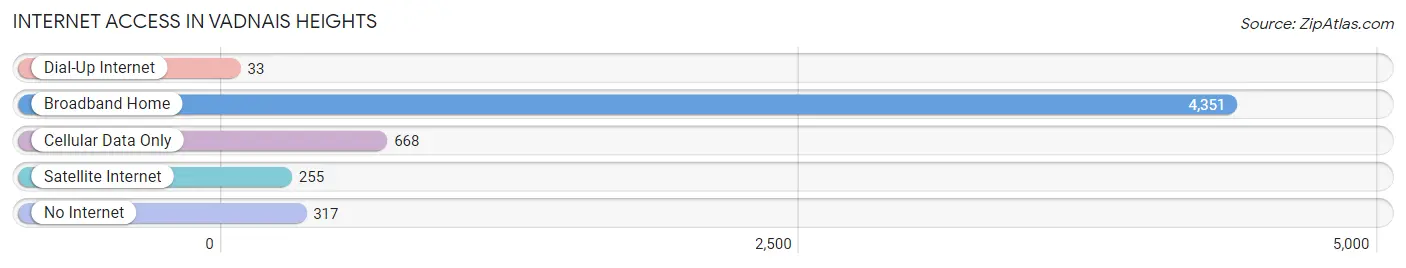
| Internet Type | # Households | % Households |
| Dial-Up Internet | 33 | 0.6% |
| Broadband Home | 4,351 | 78.9% |
| Cellular Data Only | 668 | 12.1% |
| Satellite Internet | 255 | 4.6% |
| No Internet | 317 | 5.8% |
| Total | 5,514 | 100.0% |
Vadnais Heights Summary
Vadnais Heights is a city located in Ramsey County, Minnesota, United States. The city is located just north of Saint Paul, the state capital, and is part of the Twin Cities metropolitan area. As of the 2010 census, the city had a population of 12,302.
History
The area that is now Vadnais Heights was first settled in the mid-1800s by French-Canadian immigrants. The area was originally known as Vadnais Settlement, named after the Vadnais family who were among the first settlers. The area remained largely rural until the 1950s, when the population began to grow rapidly due to the development of the Twin Cities metropolitan area.
In the 1960s, the area was incorporated as the City of Vadnais Heights. The city was named after the Vadnais family, who were among the first settlers in the area. The city was officially incorporated in 1967.
Geography
Vadnais Heights is located in Ramsey County, Minnesota, just north of Saint Paul. The city is located at the intersection of Interstate 35E and Interstate 694. The city is bordered by White Bear Lake to the north, Maplewood to the east, Little Canada to the south, and Shoreview to the west.
The city has a total area of 8.2 square miles, of which 8.1 square miles is land and 0.1 square miles is water. The city is located in the St. Croix River Valley, and is part of the Twin Cities metropolitan area.
Economy
Vadnais Heights is home to a variety of businesses, including manufacturing, retail, and service industries. The city is home to several large employers, including 3M, Andersen Windows, and the Minnesota Department of Transportation.
The city is also home to several shopping centers, including the Vadnais Heights Town Center, which is home to a variety of stores and restaurants. The city is also home to several parks and recreational facilities, including the Vadnais Heights Sports Center, which features an ice arena, soccer fields, and a golf course.
Demographics
As of the 2010 census, the city had a population of 12,302. The racial makeup of the city was 87.3% White, 4.3% African American, 0.4% Native American, 3.2% Asian, 0.1% Pacific Islander, 2.2% from other races, and 2.5% from two or more races. Hispanic or Latino of any race were 5.2% of the population.
The median income for a household in the city was $63,945, and the median income for a family was $76,945. The per capita income for the city was $30,945. About 4.2% of families and 5.7% of the population were below the poverty line, including 7.2% of those under age 18 and 4.2% of those age 65 or over.
Common Questions
What is Per Capita Income in Vadnais Heights?
Per Capita income in Vadnais Heights is $51,601.
What is the Median Family Income in Vadnais Heights?
Median Family Income in Vadnais Heights is $129,513.
What is the Median Household income in Vadnais Heights?
Median Household Income in Vadnais Heights is $89,632.
What is Income or Wage Gap in Vadnais Heights?
Income or Wage Gap in Vadnais Heights is 31.2%.
Women in Vadnais Heights earn 68.8 cents for every dollar earned by a man.
What is Family Income Deficit in Vadnais Heights?
Family Income Deficit in Vadnais Heights is $12,479.
Families that are below poverty line in Vadnais Heights earn $12,479 less on average than the poverty threshold level.
What is Inequality or Gini Index in Vadnais Heights?
Inequality or Gini Index in Vadnais Heights is 0.42.
What is the Total Population of Vadnais Heights?
Total Population of Vadnais Heights is 12,864.
What is the Total Male Population of Vadnais Heights?
Total Male Population of Vadnais Heights is 6,101.
What is the Total Female Population of Vadnais Heights?
Total Female Population of Vadnais Heights is 6,763.
What is the Ratio of Males per 100 Females in Vadnais Heights?
There are 90.21 Males per 100 Females in Vadnais Heights.
What is the Ratio of Females per 100 Males in Vadnais Heights?
There are 110.85 Females per 100 Males in Vadnais Heights.
What is the Median Population Age in Vadnais Heights?
Median Population Age in Vadnais Heights is 40.8 Years.
What is the Average Family Size in Vadnais Heights
Average Family Size in Vadnais Heights is 3.0 People.
What is the Average Household Size in Vadnais Heights
Average Household Size in Vadnais Heights is 2.3 People.
How Large is the Labor Force in Vadnais Heights?
There are 6,793 People in the Labor Forcein in Vadnais Heights.
What is the Percentage of People in the Labor Force in Vadnais Heights?
67.2% of People are in the Labor Force in Vadnais Heights.
What is the Unemployment Rate in Vadnais Heights?
Unemployment Rate in Vadnais Heights is 4.9%.