Stillwater, OK Map & Demographics
Stillwater Map
Stillwater Overview
$24,801
PER CAPITA INCOME
$73,531
AVG FAMILY INCOME
$39,998
AVG HOUSEHOLD INCOME
40.7%
WAGE / INCOME GAP [ % ]
59.3¢/ $1
WAGE / INCOME GAP [ $ ]
$10,504
FAMILY INCOME DEFICIT
0.53
INEQUALITY / GINI INDEX
48,644
TOTAL POPULATION
24,799
MALE POPULATION
23,845
FEMALE POPULATION
104.00
MALES / 100 FEMALES
96.15
FEMALES / 100 MALES
23.4
MEDIAN AGE
2.8
AVG FAMILY SIZE
2.1
AVG HOUSEHOLD SIZE
23,914
LABOR FORCE [ PEOPLE ]
56.7%
PERCENT IN LABOR FORCE
5.3%
UNEMPLOYMENT RATE
Stillwater Area Codes
Income in Stillwater
Income Overview in Stillwater
Per Capita Income in Stillwater is $24,801, while median incomes of families and households are $73,531 and $39,998 respectively.
| Characteristic | Number | Measure |
| Per Capita Income | 48,644 | $24,801 |
| Median Family Income | 7,966 | $73,531 |
| Mean Family Income | 7,966 | $95,150 |
| Median Household Income | 18,951 | $39,998 |
| Mean Household Income | 18,951 | $61,230 |
| Income Deficit | 7,966 | $10,504 |
| Wage / Income Gap (%) | 48,644 | 40.69% |
| Wage / Income Gap ($) | 48,644 | 59.31¢ per $1 |
| Gini / Inequality Index | 48,644 | 0.53 |
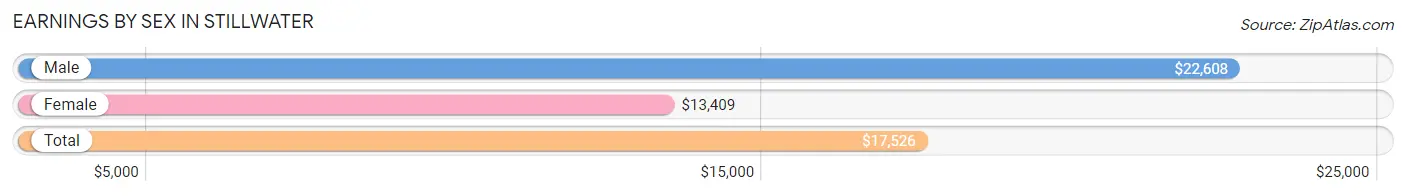
Earnings by Sex in Stillwater
Average Earnings in Stillwater are $17,526, $22,608 for men and $13,409 for women, a difference of 40.7%.
| Sex | Number | Average Earnings |
| Male | 15,364 (53.8%) | $22,608 |
| Female | 13,206 (46.2%) | $13,409 |
| Total | 28,570 (100.0%) | $17,526 |
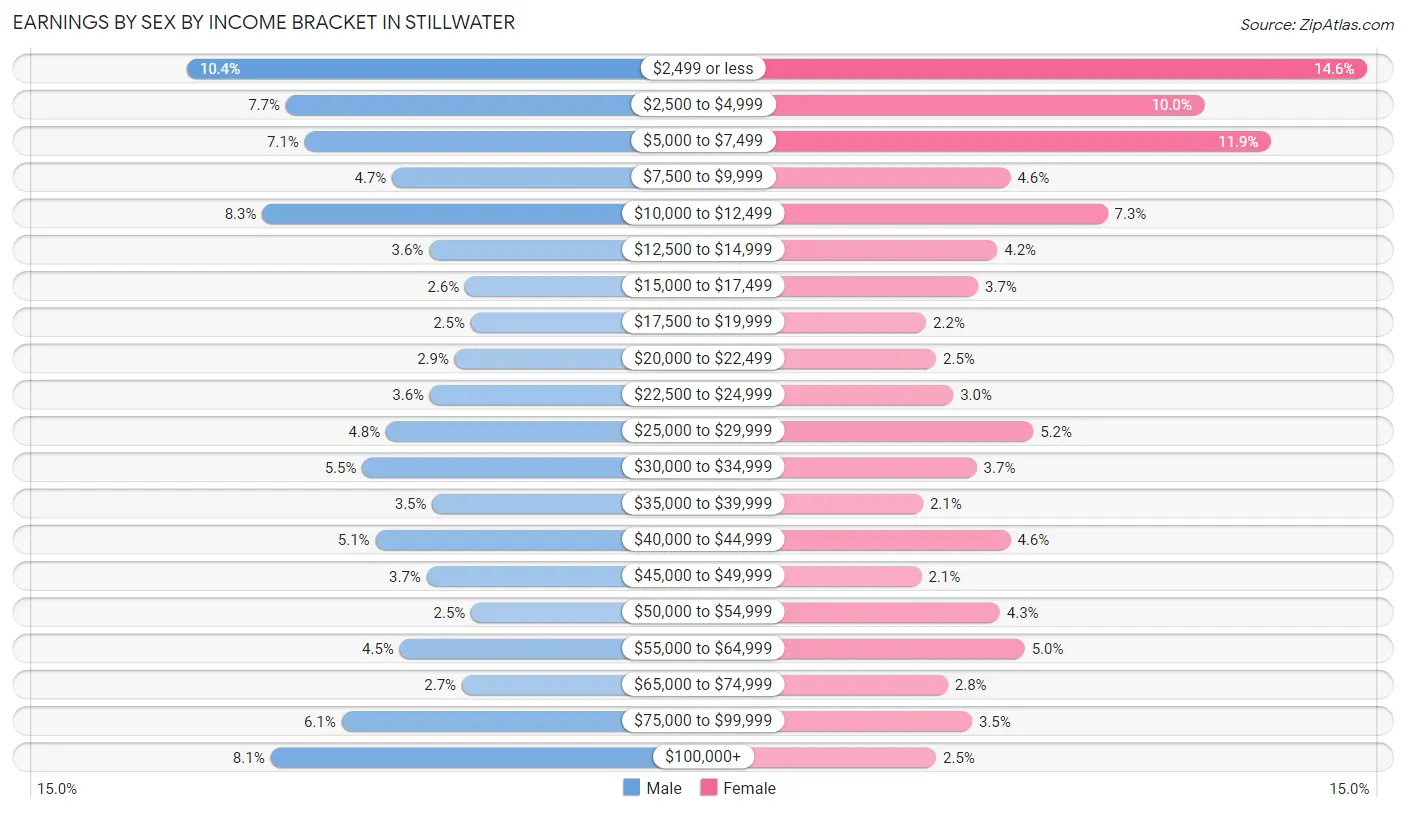
Earnings by Sex by Income Bracket in Stillwater
The most common earnings brackets in Stillwater are $2,499 or less for men (1,604 | 10.4%) and $2,499 or less for women (1,928 | 14.6%).
| Income | Male | Female |
| $2,499 or less | 1,604 (10.4%) | 1,928 (14.6%) |
| $2,500 to $4,999 | 1,177 (7.7%) | 1,325 (10.0%) |
| $5,000 to $7,499 | 1,095 (7.1%) | 1,571 (11.9%) |
| $7,500 to $9,999 | 718 (4.7%) | 608 (4.6%) |
| $10,000 to $12,499 | 1,279 (8.3%) | 968 (7.3%) |
| $12,500 to $14,999 | 557 (3.6%) | 558 (4.2%) |
| $15,000 to $17,499 | 403 (2.6%) | 487 (3.7%) |
| $17,500 to $19,999 | 378 (2.5%) | 294 (2.2%) |
| $20,000 to $22,499 | 447 (2.9%) | 331 (2.5%) |
| $22,500 to $24,999 | 555 (3.6%) | 395 (3.0%) |
| $25,000 to $29,999 | 744 (4.8%) | 692 (5.2%) |
| $30,000 to $34,999 | 847 (5.5%) | 482 (3.6%) |
| $35,000 to $39,999 | 544 (3.5%) | 283 (2.1%) |
| $40,000 to $44,999 | 789 (5.1%) | 608 (4.6%) |
| $45,000 to $49,999 | 568 (3.7%) | 277 (2.1%) |
| $50,000 to $54,999 | 377 (2.5%) | 568 (4.3%) |
| $55,000 to $64,999 | 686 (4.5%) | 660 (5.0%) |
| $65,000 to $74,999 | 417 (2.7%) | 375 (2.8%) |
| $75,000 to $99,999 | 936 (6.1%) | 465 (3.5%) |
| $100,000+ | 1,243 (8.1%) | 331 (2.5%) |
| Total | 15,364 (100.0%) | 13,206 (100.0%) |
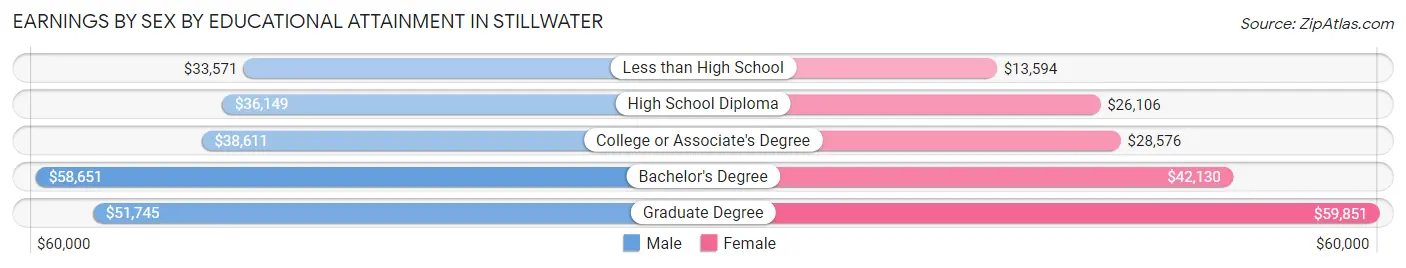
Earnings by Sex by Educational Attainment in Stillwater
Average earnings in Stillwater are $43,764 for men and $36,943 for women, a difference of 15.6%. Men with an educational attainment of bachelor's degree enjoy the highest average annual earnings of $58,651, while those with less than high school education earn the least with $33,571. Women with an educational attainment of graduate degree earn the most with the average annual earnings of $59,851, while those with less than high school education have the smallest earnings of $13,594.
| Educational Attainment | Male Income | Female Income |
| Less than High School | $33,571 | $13,594 |
| High School Diploma | $36,149 | $26,106 |
| College or Associate's Degree | $38,611 | $28,576 |
| Bachelor's Degree | $58,651 | $42,130 |
| Graduate Degree | $51,745 | $59,851 |
| Total | $43,764 | $36,943 |
Family Income in Stillwater
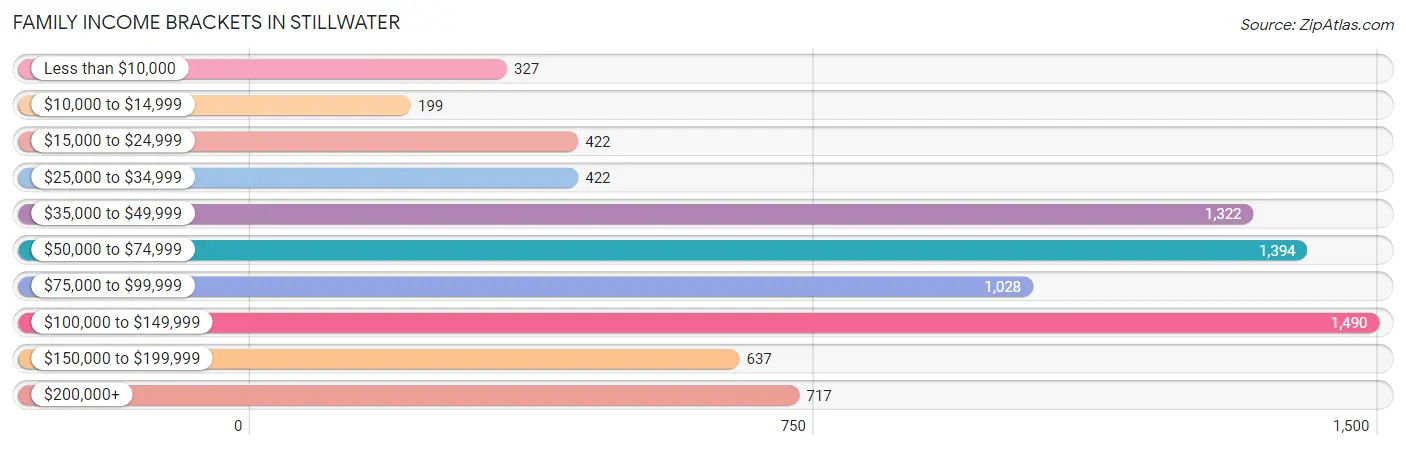
Family Income Brackets in Stillwater
According to the Stillwater family income data, there are 1,490 families falling into the $100,000 to $149,999 income range, which is the most common income bracket and makes up 18.7% of all families. Conversely, the $10,000 to $14,999 income bracket is the least frequent group with only 199 families (2.5%) belonging to this category.
| Income Bracket | # Families | % Families |
| Less than $10,000 | 327 | 4.1% |
| $10,000 to $14,999 | 199 | 2.5% |
| $15,000 to $24,999 | 422 | 5.3% |
| $25,000 to $34,999 | 422 | 5.3% |
| $35,000 to $49,999 | 1,322 | 16.6% |
| $50,000 to $74,999 | 1,394 | 17.5% |
| $75,000 to $99,999 | 1,028 | 12.9% |
| $100,000 to $149,999 | 1,490 | 18.7% |
| $150,000 to $199,999 | 637 | 8.0% |
| $200,000+ | 717 | 9.0% |
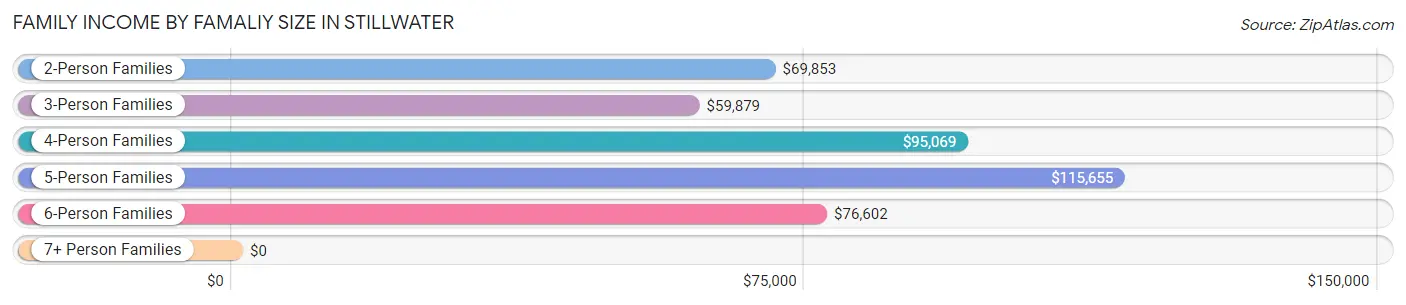
Family Income by Famaliy Size in Stillwater
5-person families (433 | 5.4%) account for the highest median family income in Stillwater with $115,655 per family, while 2-person families (4,394 | 55.2%) have the highest median income of $34,926 per family member.
| Income Bracket | # Families | Median Income |
| 2-Person Families | 4,394 (55.2%) | $69,853 |
| 3-Person Families | 1,691 (21.2%) | $59,879 |
| 4-Person Families | 1,198 (15.0%) | $95,069 |
| 5-Person Families | 433 (5.4%) | $115,655 |
| 6-Person Families | 161 (2.0%) | $76,602 |
| 7+ Person Families | 89 (1.1%) | $0 |
| Total | 7,966 (100.0%) | $73,531 |
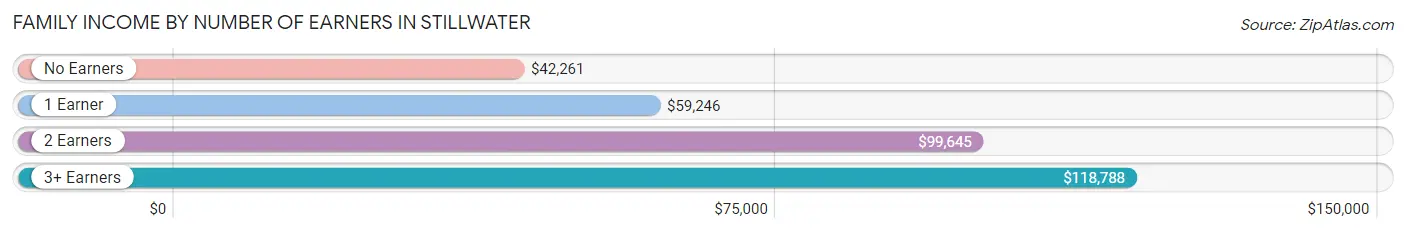
Family Income by Number of Earners in Stillwater
The median family income in Stillwater is $73,531, with families comprising 3+ earners (495) having the highest median family income of $118,788, while families with no earners (1,495) have the lowest median family income of $42,261, accounting for 6.2% and 18.8% of families, respectively.
| Number of Earners | # Families | Median Income |
| No Earners | 1,495 (18.8%) | $42,261 |
| 1 Earner | 2,628 (33.0%) | $59,246 |
| 2 Earners | 3,348 (42.0%) | $99,645 |
| 3+ Earners | 495 (6.2%) | $118,788 |
| Total | 7,966 (100.0%) | $73,531 |
Household Income in Stillwater
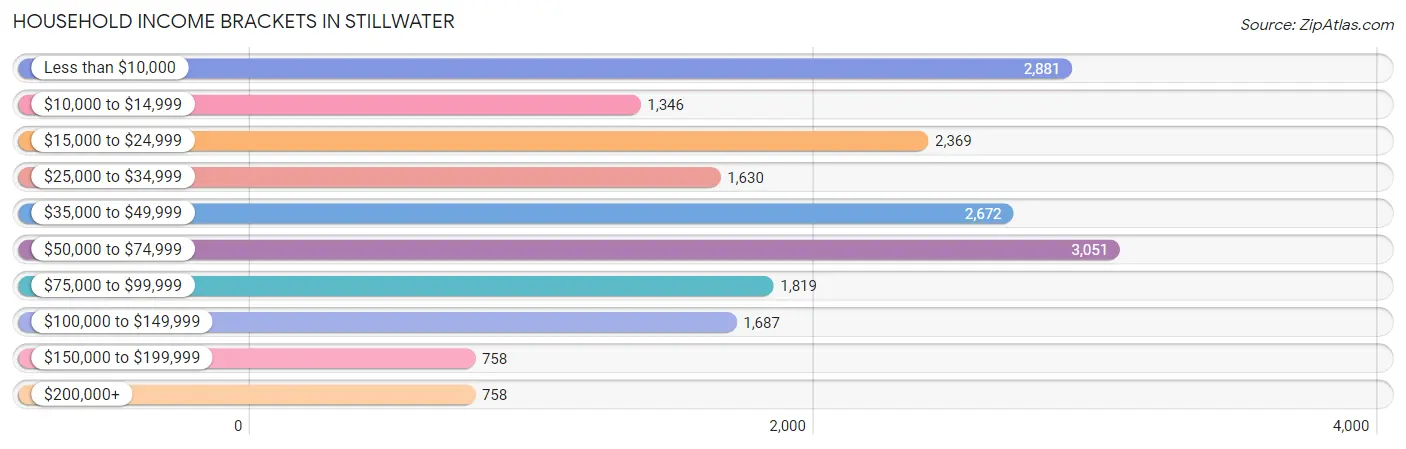
Household Income Brackets in Stillwater
With 3,051 households falling in the category, the $50,000 to $74,999 income range is the most frequent in Stillwater, accounting for 16.1% of all households. In contrast, only 758 households (4.0%) fall into the $150,000 to $199,999 income bracket, making it the least populous group.
| Income Bracket | # Households | % Households |
| Less than $10,000 | 2,881 | 15.2% |
| $10,000 to $14,999 | 1,346 | 7.1% |
| $15,000 to $24,999 | 2,369 | 12.5% |
| $25,000 to $34,999 | 1,630 | 8.6% |
| $35,000 to $49,999 | 2,672 | 14.1% |
| $50,000 to $74,999 | 3,051 | 16.1% |
| $75,000 to $99,999 | 1,819 | 9.6% |
| $100,000 to $149,999 | 1,687 | 8.9% |
| $150,000 to $199,999 | 758 | 4.0% |
| $200,000+ | 758 | 4.0% |
Household Income by Householder Age in Stillwater
The median household income in Stillwater is $39,998, with the highest median household income of $58,675 found in the 65+ years age bracket for the primary householder. A total of 3,239 households (17.1%) fall into this category. Meanwhile, the 15 to 24 years age bracket for the primary householder has the lowest median household income of $15,755, with 6,008 households (31.7%) in this group.
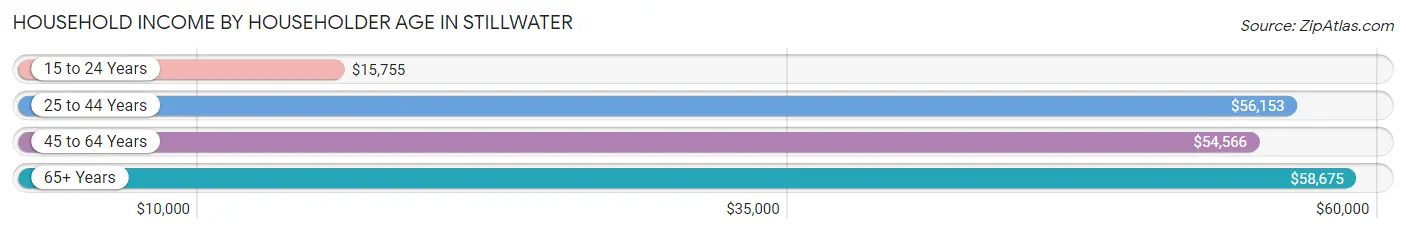
| Income Bracket | # Households | Median Income |
| 15 to 24 Years | 6,008 (31.7%) | $15,755 |
| 25 to 44 Years | 6,013 (31.7%) | $56,153 |
| 45 to 64 Years | 3,691 (19.5%) | $54,566 |
| 65+ Years | 3,239 (17.1%) | $58,675 |
| Total | 18,951 (100.0%) | $39,998 |
Poverty in Stillwater
Income Below Poverty by Sex and Age in Stillwater
With 31.2% poverty level for males and 31.9% for females among the residents of Stillwater, 18 to 24 year old males and 18 to 24 year old females are the most vulnerable to poverty, with 4,183 males (60.2%) and 3,816 females (71.2%) in their respective age groups living below the poverty level.
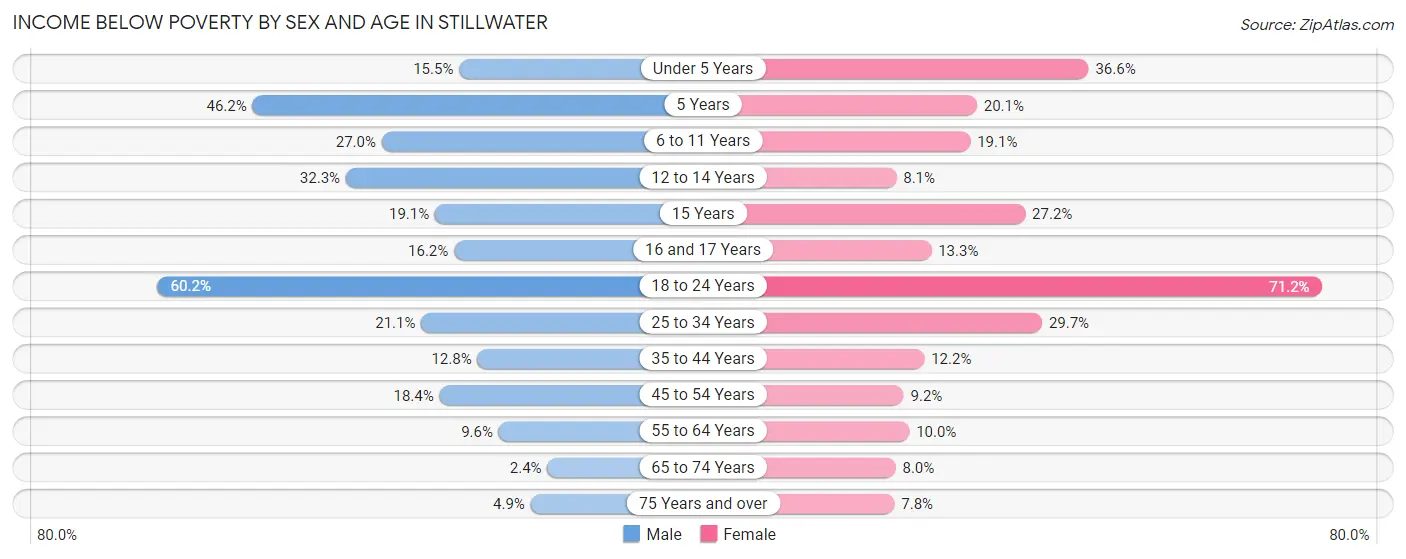
| Age Bracket | Male | Female |
| Under 5 Years | 150 (15.5%) | 341 (36.6%) |
| 5 Years | 30 (46.2%) | 73 (20.1%) |
| 6 to 11 Years | 374 (27.0%) | 225 (19.1%) |
| 12 to 14 Years | 196 (32.3%) | 31 (8.1%) |
| 15 Years | 36 (19.1%) | 52 (27.2%) |
| 16 and 17 Years | 61 (16.2%) | 36 (13.3%) |
| 18 to 24 Years | 4,183 (60.2%) | 3,816 (71.2%) |
| 25 to 34 Years | 716 (21.1%) | 788 (29.7%) |
| 35 to 44 Years | 288 (12.8%) | 258 (12.2%) |
| 45 to 54 Years | 268 (18.4%) | 134 (9.2%) |
| 55 to 64 Years | 139 (9.6%) | 147 (10.0%) |
| 65 to 74 Years | 24 (2.4%) | 115 (8.0%) |
| 75 Years and over | 34 (4.9%) | 111 (7.8%) |
| Total | 6,499 (31.2%) | 6,127 (31.9%) |
Income Above Poverty by Sex and Age in Stillwater
According to the poverty statistics in Stillwater, males aged 65 to 74 years and females aged 75 years and over are the age groups that are most secure financially, with 97.6% of males and 92.2% of females in these age groups living above the poverty line.
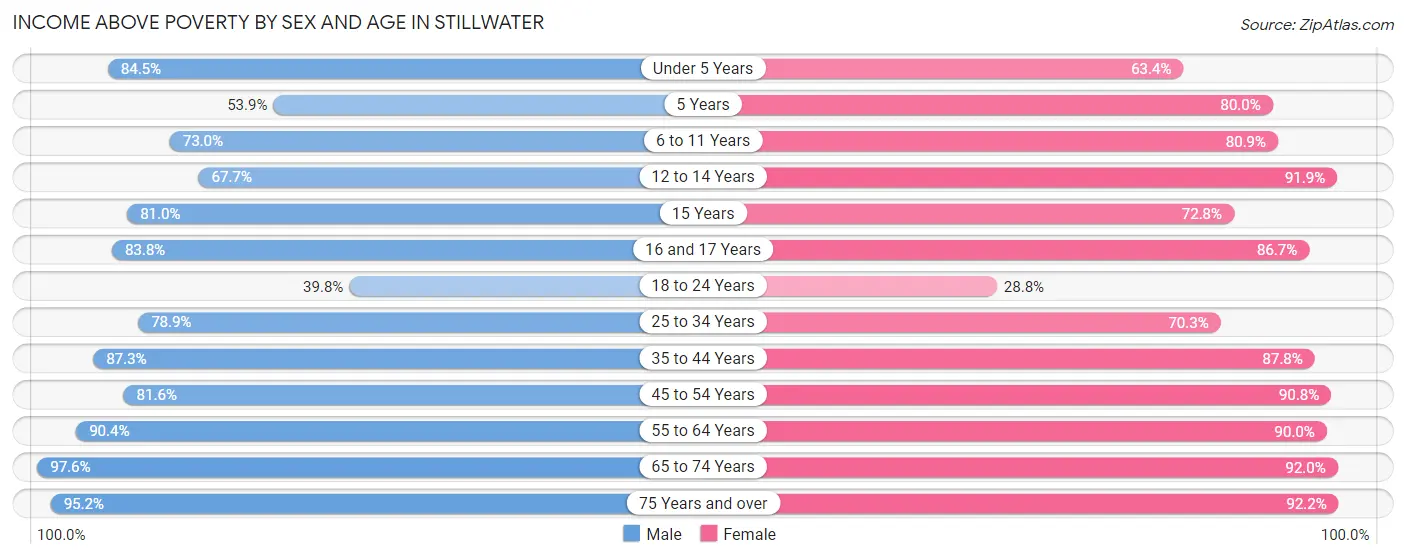
| Age Bracket | Male | Female |
| Under 5 Years | 820 (84.5%) | 590 (63.4%) |
| 5 Years | 35 (53.8%) | 291 (79.9%) |
| 6 to 11 Years | 1,013 (73.0%) | 955 (80.9%) |
| 12 to 14 Years | 411 (67.7%) | 352 (91.9%) |
| 15 Years | 153 (80.9%) | 139 (72.8%) |
| 16 and 17 Years | 315 (83.8%) | 235 (86.7%) |
| 18 to 24 Years | 2,761 (39.8%) | 1,543 (28.8%) |
| 25 to 34 Years | 2,679 (78.9%) | 1,863 (70.3%) |
| 35 to 44 Years | 1,971 (87.3%) | 1,850 (87.8%) |
| 45 to 54 Years | 1,189 (81.6%) | 1,325 (90.8%) |
| 55 to 64 Years | 1,311 (90.4%) | 1,321 (90.0%) |
| 65 to 74 Years | 993 (97.6%) | 1,327 (92.0%) |
| 75 Years and over | 667 (95.2%) | 1,312 (92.2%) |
| Total | 14,318 (68.8%) | 13,103 (68.1%) |
Income Below Poverty Among Married-Couple Families in Stillwater
The poverty statistics for married-couple families in Stillwater show that 5.4% or 307 of the total 5,692 families live below the poverty line. Families with 3 or 4 children have the highest poverty rate of 14.4%, comprising of 54 families. On the other hand, families with 5 or more children have the lowest poverty rate of 0.0%, which includes 0 families.
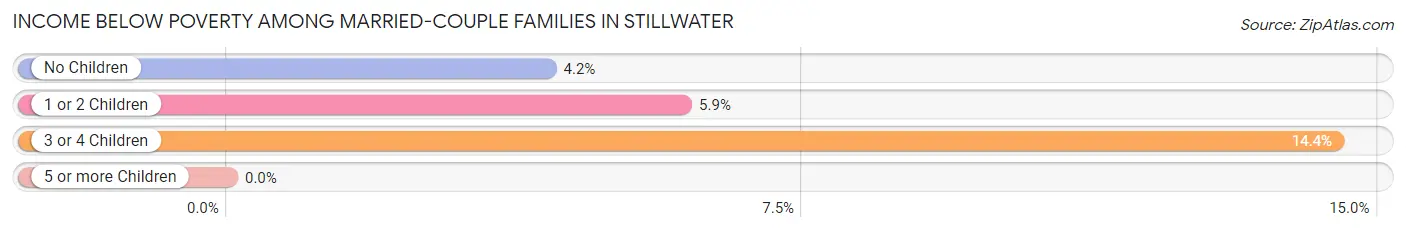
| Children | Above Poverty | Below Poverty |
| No Children | 3,248 (95.8%) | 141 (4.2%) |
| 1 or 2 Children | 1,777 (94.1%) | 112 (5.9%) |
| 3 or 4 Children | 320 (85.6%) | 54 (14.4%) |
| 5 or more Children | 40 (100.0%) | 0 (0.0%) |
| Total | 5,385 (94.6%) | 307 (5.4%) |
Income Below Poverty Among Single-Parent Households in Stillwater
According to the poverty data in Stillwater, 28.1% or 199 single-father households and 27.2% or 426 single-mother households are living below the poverty line. Among single-father households, those with 3 or 4 children have the highest poverty rate, with 7 households (100.0%) experiencing poverty. Likewise, among single-mother households, those with 3 or 4 children have the highest poverty rate, with 81 households (60.9%) falling below the poverty line.
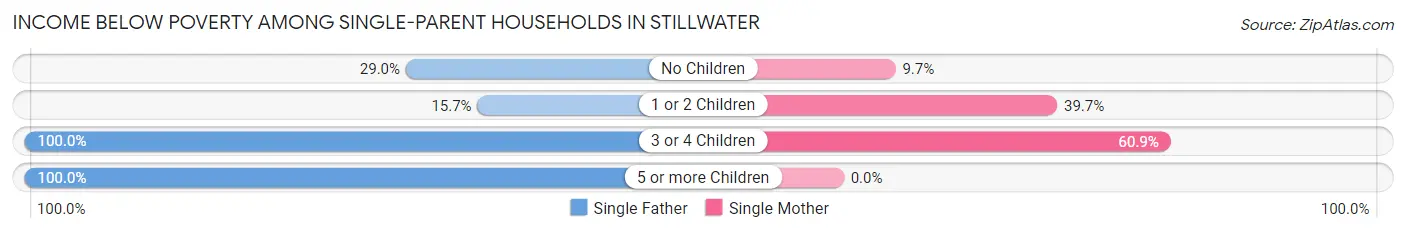
| Children | Single Father | Single Mother |
| No Children | 89 (29.0%) | 72 (9.7%) |
| 1 or 2 Children | 54 (15.7%) | 273 (39.7%) |
| 3 or 4 Children | 7 (100.0%) | 81 (60.9%) |
| 5 or more Children | 49 (100.0%) | 0 (0.0%) |
| Total | 199 (28.1%) | 426 (27.2%) |
Income Below Poverty Among Married-Couple vs Single-Parent Households in Stillwater
The poverty data for Stillwater shows that 307 of the married-couple family households (5.4%) and 625 of the single-parent households (27.5%) are living below the poverty level. Within the married-couple family households, those with 3 or 4 children have the highest poverty rate, with 54 households (14.4%) falling below the poverty line. Among the single-parent households, those with 5 or more children have the highest poverty rate, with 49 household (100.0%) living below poverty.
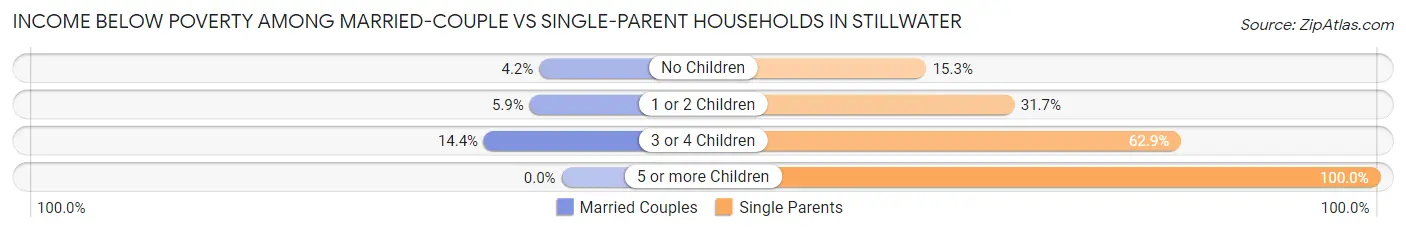
| Children | Married-Couple Families | Single-Parent Households |
| No Children | 141 (4.2%) | 161 (15.3%) |
| 1 or 2 Children | 112 (5.9%) | 327 (31.7%) |
| 3 or 4 Children | 54 (14.4%) | 88 (62.9%) |
| 5 or more Children | 0 (0.0%) | 49 (100.0%) |
| Total | 307 (5.4%) | 625 (27.5%) |
Race in Stillwater
The most populous races in Stillwater are White / Caucasian (36,800 | 75.6%), Two or more Races (4,416 | 9.1%), and Asian (2,989 | 6.1%).
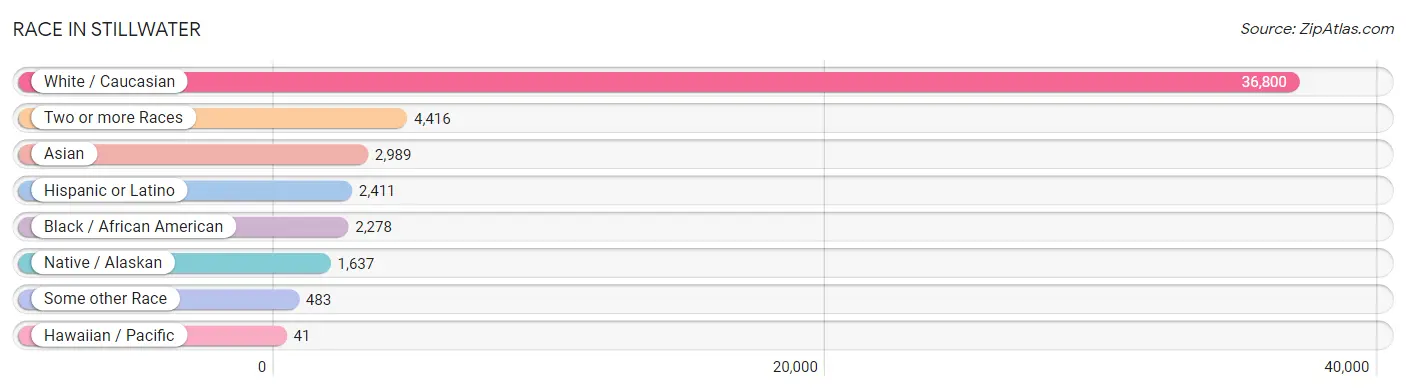
| Race | # Population | % Population |
| Asian | 2,989 | 6.1% |
| Black / African American | 2,278 | 4.7% |
| Hawaiian / Pacific | 41 | 0.1% |
| Hispanic or Latino | 2,411 | 5.0% |
| Native / Alaskan | 1,637 | 3.4% |
| White / Caucasian | 36,800 | 75.6% |
| Two or more Races | 4,416 | 9.1% |
| Some other Race | 483 | 1.0% |
| Total | 48,644 | 100.0% |
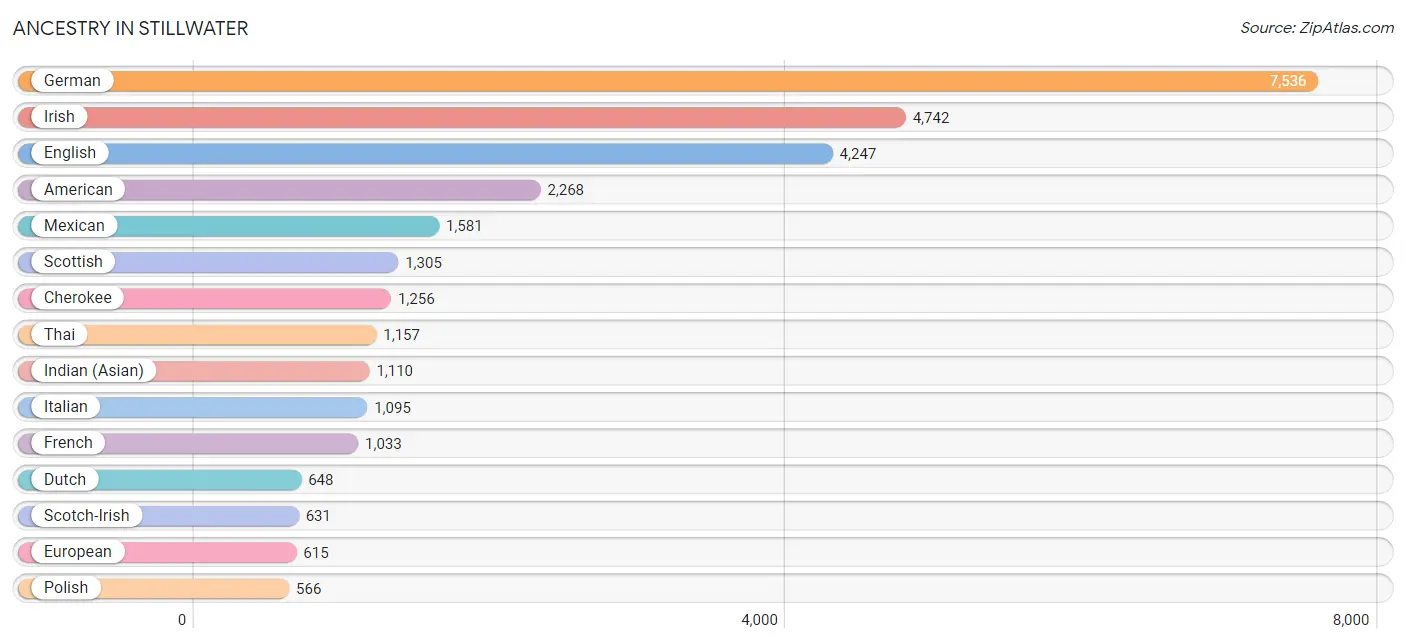
Ancestry in Stillwater
The most populous ancestries reported in Stillwater are German (7,536 | 15.5%), Irish (4,742 | 9.8%), English (4,247 | 8.7%), American (2,268 | 4.7%), and Mexican (1,581 | 3.3%), together accounting for 41.9% of all Stillwater residents.
| Ancestry | # Population | % Population |
| Afghan | 27 | 0.1% |
| African | 238 | 0.5% |
| American | 2,268 | 4.7% |
| Apache | 15 | 0.0% |
| Arab | 438 | 0.9% |
| Argentinean | 8 | 0.0% |
| Austrian | 41 | 0.1% |
| Bangladeshi | 22 | 0.1% |
| Basque | 16 | 0.0% |
| Belizean | 3 | 0.0% |
| Bhutanese | 103 | 0.2% |
| Blackfeet | 39 | 0.1% |
| Bolivian | 21 | 0.0% |
| British | 398 | 0.8% |
| Burmese | 327 | 0.7% |
| Cajun | 16 | 0.0% |
| Cambodian | 53 | 0.1% |
| Canadian | 143 | 0.3% |
| Central American | 73 | 0.2% |
| Central American Indian | 17 | 0.0% |
| Cherokee | 1,256 | 2.6% |
| Chickasaw | 98 | 0.2% |
| Choctaw | 425 | 0.9% |
| Colombian | 145 | 0.3% |
| Comanche | 24 | 0.1% |
| Costa Rican | 8 | 0.0% |
| Creek | 246 | 0.5% |
| Croatian | 16 | 0.0% |
| Cuban | 45 | 0.1% |
| Czech | 299 | 0.6% |
| Czechoslovakian | 41 | 0.1% |
| Danish | 105 | 0.2% |
| Delaware | 11 | 0.0% |
| Dutch | 648 | 1.3% |
| Eastern European | 81 | 0.2% |
| Ecuadorian | 13 | 0.0% |
| Egyptian | 36 | 0.1% |
| English | 4,247 | 8.7% |
| Estonian | 12 | 0.0% |
| European | 615 | 1.3% |
| Filipino | 34 | 0.1% |
| Finnish | 16 | 0.0% |
| French | 1,033 | 2.1% |
| French Canadian | 68 | 0.1% |
| German | 7,536 | 15.5% |
| Ghanaian | 34 | 0.1% |
| Greek | 67 | 0.1% |
| Guatemalan | 14 | 0.0% |
| Honduran | 40 | 0.1% |
| Indian (Asian) | 1,110 | 2.3% |
| Iranian | 275 | 0.6% |
| Iraqi | 37 | 0.1% |
| Irish | 4,742 | 9.8% |
| Iroquois | 6 | 0.0% |
| Italian | 1,095 | 2.2% |
| Kiowa | 18 | 0.0% |
| Korean | 200 | 0.4% |
| Laotian | 55 | 0.1% |
| Lebanese | 32 | 0.1% |
| Lithuanian | 35 | 0.1% |
| Menominee | 8 | 0.0% |
| Mexican | 1,581 | 3.3% |
| Mexican American Indian | 2 | 0.0% |
| Mongolian | 102 | 0.2% |
| Native Hawaiian | 62 | 0.1% |
| Navajo | 4 | 0.0% |
| Nigerian | 237 | 0.5% |
| Northern European | 83 | 0.2% |
| Norwegian | 284 | 0.6% |
| Osage | 94 | 0.2% |
| Ottawa | 20 | 0.0% |
| Pakistani | 139 | 0.3% |
| Panamanian | 11 | 0.0% |
| Pennsylvania German | 16 | 0.0% |
| Peruvian | 9 | 0.0% |
| Polish | 566 | 1.2% |
| Portuguese | 115 | 0.2% |
| Potawatomi | 75 | 0.2% |
| Puerto Rican | 106 | 0.2% |
| Romanian | 6 | 0.0% |
| Russian | 85 | 0.2% |
| Samoan | 4 | 0.0% |
| Scandinavian | 37 | 0.1% |
| Scotch-Irish | 631 | 1.3% |
| Scottish | 1,305 | 2.7% |
| Sioux | 13 | 0.0% |
| Slovak | 20 | 0.0% |
| South American | 200 | 0.4% |
| Spaniard | 65 | 0.1% |
| Spanish | 29 | 0.1% |
| Sri Lankan | 73 | 0.2% |
| Subsaharan African | 515 | 1.1% |
| Swedish | 233 | 0.5% |
| Swiss | 373 | 0.8% |
| Thai | 1,157 | 2.4% |
| Turkish | 102 | 0.2% |
| Ugandan | 24 | 0.1% |
| Ukrainian | 24 | 0.1% |
| Venezuelan | 4 | 0.0% |
| Vietnamese | 56 | 0.1% |
| Welsh | 243 | 0.5% | View All 101 Rows |
Immigrants in Stillwater
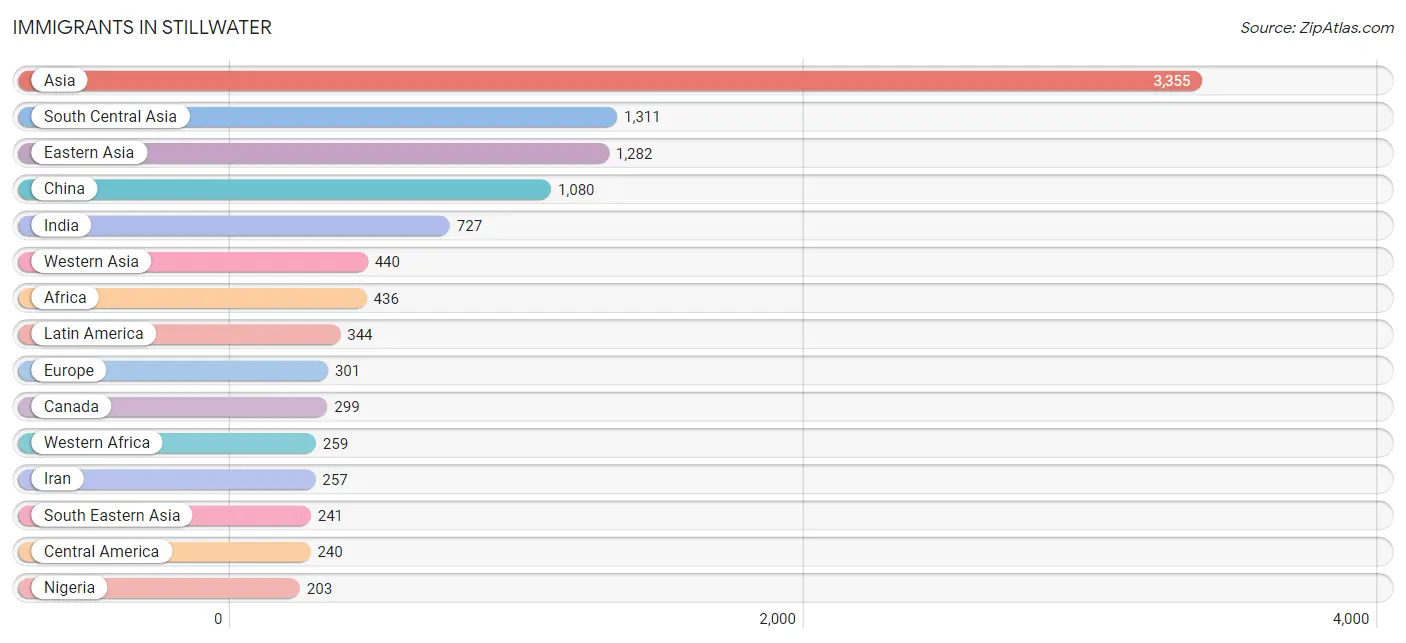
The most numerous immigrant groups reported in Stillwater came from Asia (3,355 | 6.9%), South Central Asia (1,311 | 2.7%), Eastern Asia (1,282 | 2.6%), China (1,080 | 2.2%), and India (727 | 1.5%), together accounting for 16.0% of all Stillwater residents.
| Immigration Origin | # Population | % Population |
| Afghanistan | 42 | 0.1% |
| Africa | 436 | 0.9% |
| Asia | 3,355 | 6.9% |
| Bangladesh | 56 | 0.1% |
| Bolivia | 21 | 0.0% |
| Brazil | 20 | 0.0% |
| Canada | 299 | 0.6% |
| Caribbean | 18 | 0.0% |
| Central America | 240 | 0.5% |
| China | 1,080 | 2.2% |
| Colombia | 45 | 0.1% |
| Congo | 23 | 0.1% |
| Costa Rica | 8 | 0.0% |
| Croatia | 7 | 0.0% |
| Cuba | 18 | 0.0% |
| Eastern Africa | 70 | 0.1% |
| Eastern Asia | 1,282 | 2.6% |
| Eastern Europe | 7 | 0.0% |
| Egypt | 18 | 0.0% |
| England | 22 | 0.1% |
| Europe | 301 | 0.6% |
| Fiji | 5 | 0.0% |
| France | 69 | 0.1% |
| Germany | 68 | 0.1% |
| Ghana | 38 | 0.1% |
| Greece | 37 | 0.1% |
| Guatemala | 57 | 0.1% |
| Honduras | 40 | 0.1% |
| Hong Kong | 142 | 0.3% |
| India | 727 | 1.5% |
| Indonesia | 55 | 0.1% |
| Iran | 257 | 0.5% |
| Iraq | 90 | 0.2% |
| Italy | 12 | 0.0% |
| Japan | 87 | 0.2% |
| Kenya | 6 | 0.0% |
| Korea | 115 | 0.2% |
| Kuwait | 118 | 0.2% |
| Latin America | 344 | 0.7% |
| Malaysia | 92 | 0.2% |
| Mexico | 135 | 0.3% |
| Middle Africa | 44 | 0.1% |
| Nepal | 168 | 0.4% |
| Nigeria | 203 | 0.4% |
| Northern Africa | 51 | 0.1% |
| Northern Europe | 108 | 0.2% |
| Oceania | 5 | 0.0% |
| Pakistan | 21 | 0.0% |
| Philippines | 42 | 0.1% |
| Saudi Arabia | 198 | 0.4% |
| South America | 86 | 0.2% |
| South Central Asia | 1,311 | 2.7% |
| South Eastern Asia | 241 | 0.5% |
| Southern Europe | 49 | 0.1% |
| Sri Lanka | 40 | 0.1% |
| Sweden | 16 | 0.0% |
| Taiwan | 34 | 0.1% |
| Thailand | 22 | 0.1% |
| Turkey | 34 | 0.1% |
| Uganda | 64 | 0.1% |
| Vietnam | 30 | 0.1% |
| Western Africa | 259 | 0.5% |
| Western Asia | 440 | 0.9% |
| Western Europe | 137 | 0.3% |
| Zaire | 21 | 0.0% | View All 65 Rows |
Sex and Age in Stillwater
Sex and Age in Stillwater
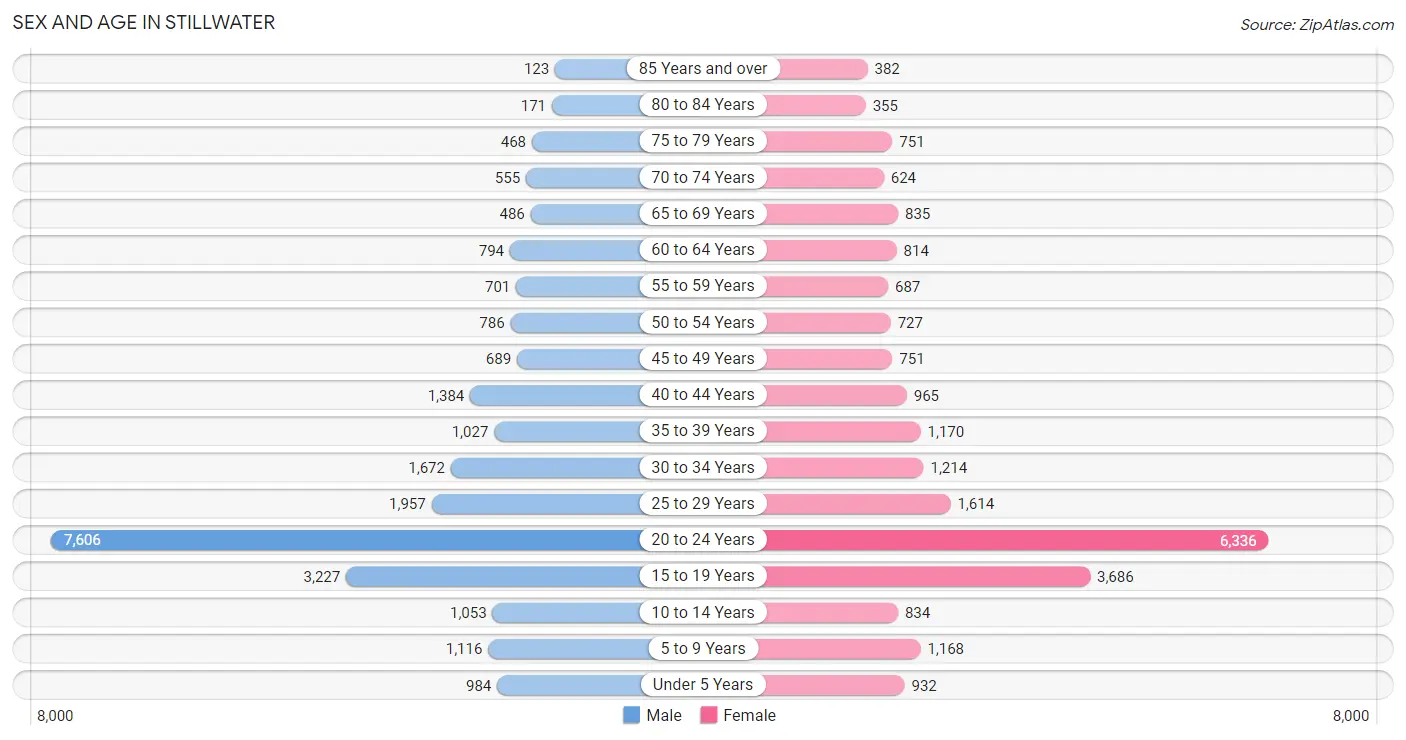
The most populous age groups in Stillwater are 20 to 24 Years (7,606 | 30.7%) for men and 20 to 24 Years (6,336 | 26.6%) for women.
| Age Bracket | Male | Female |
| Under 5 Years | 984 (4.0%) | 932 (3.9%) |
| 5 to 9 Years | 1,116 (4.5%) | 1,168 (4.9%) |
| 10 to 14 Years | 1,053 (4.3%) | 834 (3.5%) |
| 15 to 19 Years | 3,227 (13.0%) | 3,686 (15.5%) |
| 20 to 24 Years | 7,606 (30.7%) | 6,336 (26.6%) |
| 25 to 29 Years | 1,957 (7.9%) | 1,614 (6.8%) |
| 30 to 34 Years | 1,672 (6.7%) | 1,214 (5.1%) |
| 35 to 39 Years | 1,027 (4.1%) | 1,170 (4.9%) |
| 40 to 44 Years | 1,384 (5.6%) | 965 (4.1%) |
| 45 to 49 Years | 689 (2.8%) | 751 (3.2%) |
| 50 to 54 Years | 786 (3.2%) | 727 (3.0%) |
| 55 to 59 Years | 701 (2.8%) | 687 (2.9%) |
| 60 to 64 Years | 794 (3.2%) | 814 (3.4%) |
| 65 to 69 Years | 486 (2.0%) | 835 (3.5%) |
| 70 to 74 Years | 555 (2.2%) | 624 (2.6%) |
| 75 to 79 Years | 468 (1.9%) | 751 (3.2%) |
| 80 to 84 Years | 171 (0.7%) | 355 (1.5%) |
| 85 Years and over | 123 (0.5%) | 382 (1.6%) |
| Total | 24,799 (100.0%) | 23,845 (100.0%) |
Families and Households in Stillwater
Median Family Size in Stillwater
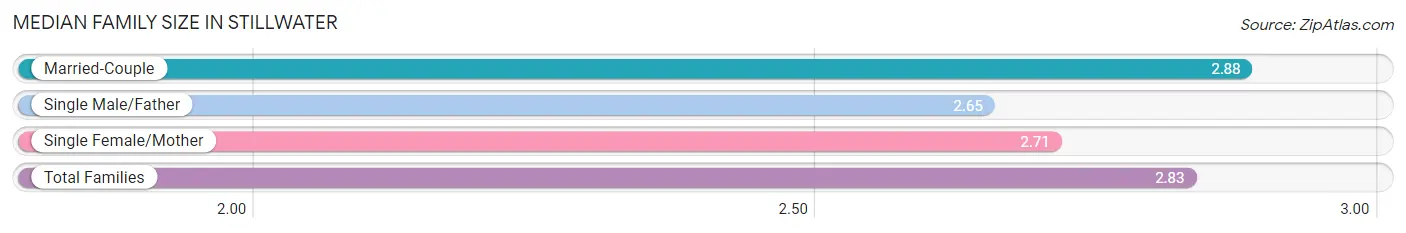
The median family size in Stillwater is 2.83 persons per family, with married-couple families (5,692 | 71.5%) accounting for the largest median family size of 2.88 persons per family. On the other hand, single male/father families (708 | 8.9%) represent the smallest median family size with 2.65 persons per family.
| Family Type | # Families | Family Size |
| Married-Couple | 5,692 (71.5%) | 2.88 |
| Single Male/Father | 708 (8.9%) | 2.65 |
| Single Female/Mother | 1,566 (19.7%) | 2.71 |
| Total Families | 7,966 (100.0%) | 2.83 |
Median Household Size in Stillwater
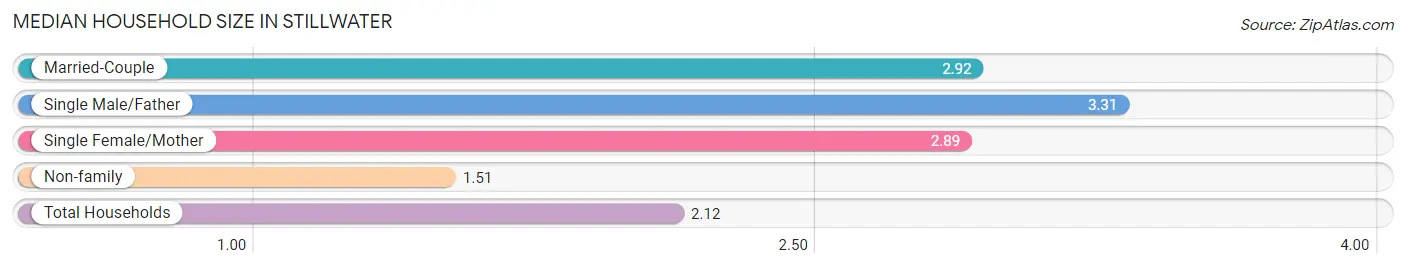
The median household size in Stillwater is 2.12 persons per household, with single male/father households (708 | 3.7%) accounting for the largest median household size of 3.31 persons per household. non-family households (10,985 | 58.0%) represent the smallest median household size with 1.51 persons per household.
| Household Type | # Households | Household Size |
| Married-Couple | 5,692 (30.0%) | 2.92 |
| Single Male/Father | 708 (3.7%) | 3.31 |
| Single Female/Mother | 1,566 (8.3%) | 2.89 |
| Non-family | 10,985 (58.0%) | 1.51 |
| Total Households | 18,951 (100.0%) | 2.12 |
Household Size by Marriage Status in Stillwater
Out of a total of 18,951 households in Stillwater, 7,966 (42.0%) are family households, while 10,985 (58.0%) are nonfamily households. The most numerous type of family households are 2-person households, comprising 4,140, and the most common type of nonfamily households are 1-person households, comprising 7,750.
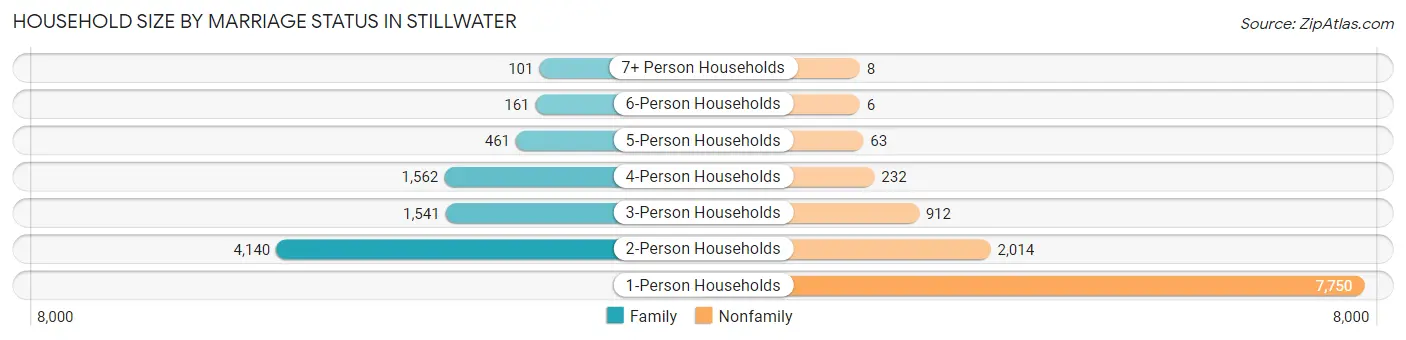
| Household Size | Family Households | Nonfamily Households |
| 1-Person Households | - | 7,750 (40.9%) |
| 2-Person Households | 4,140 (21.8%) | 2,014 (10.6%) |
| 3-Person Households | 1,541 (8.1%) | 912 (4.8%) |
| 4-Person Households | 1,562 (8.2%) | 232 (1.2%) |
| 5-Person Households | 461 (2.4%) | 63 (0.3%) |
| 6-Person Households | 161 (0.9%) | 6 (0.0%) |
| 7+ Person Households | 101 (0.5%) | 8 (0.0%) |
| Total | 7,966 (42.0%) | 10,985 (58.0%) |
Female Fertility in Stillwater
Fertility by Age in Stillwater
Average fertility rate in Stillwater is 25.0 births per 1,000 women. Women in the age bracket of 20 to 34 years have the highest fertility rate with 41.0 births per 1,000 women. Women in the age bracket of 20 to 34 years acount for 91.9% of all women with births.
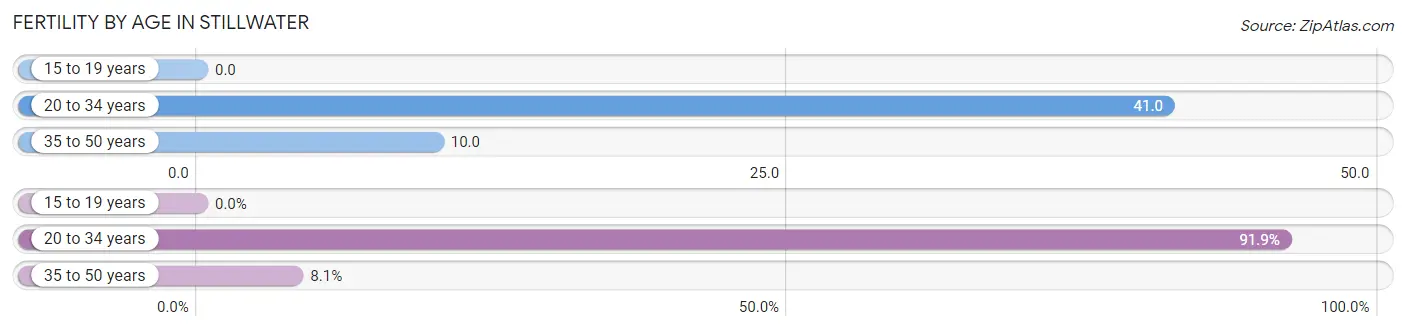
| Age Bracket | Women with Births | Births / 1,000 Women |
| 15 to 19 years | 0 (0.0%) | 0.0 |
| 20 to 34 years | 375 (91.9%) | 41.0 |
| 35 to 50 years | 33 (8.1%) | 10.0 |
| Total | 408 (100.0%) | 25.0 |
Fertility by Age by Marriage Status in Stillwater
65.9% of women with births (408) in Stillwater are married. The highest percentage of unmarried women with births falls into 20 to 34 years age bracket with 34.4% of them unmarried at the time of birth, while the lowest percentage of unmarried women with births belong to 35 to 50 years age bracket with 30.3% of them unmarried.
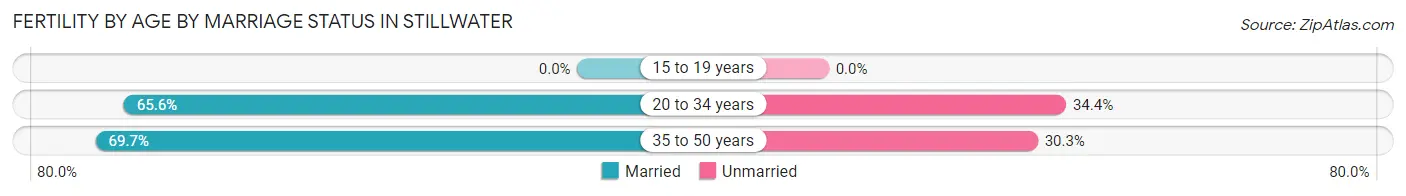
| Age Bracket | Married | Unmarried |
| 15 to 19 years | 0 (0.0%) | 0 (0.0%) |
| 20 to 34 years | 246 (65.6%) | 129 (34.4%) |
| 35 to 50 years | 23 (69.7%) | 10 (30.3%) |
| Total | 269 (65.9%) | 139 (34.1%) |
Fertility by Education in Stillwater
Average fertility rate in Stillwater is 25.0 births per 1,000 women. Women with the education attainment of graduate degree have the highest fertility rate of 84.0 births per 1,000 women, while women with the education attainment of less than high school have the lowest fertility at 2.0 births per 1,000 women. Women with the education attainment of high school diploma represent 38.5% of all women with births.
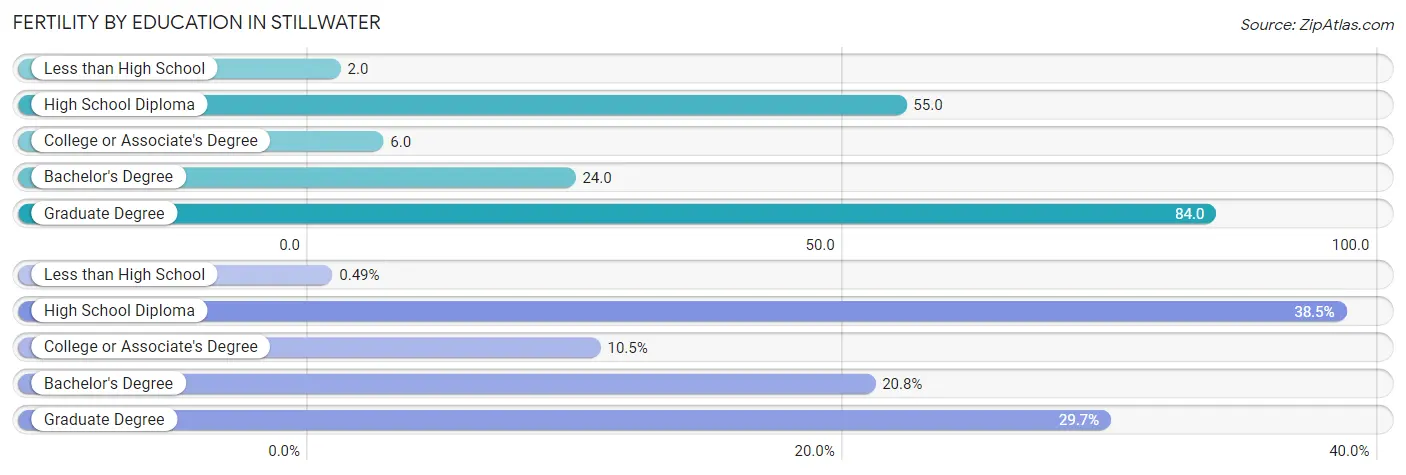
| Educational Attainment | Women with Births | Births / 1,000 Women |
| Less than High School | 2 (0.5%) | 2.0 |
| High School Diploma | 157 (38.5%) | 55.0 |
| College or Associate's Degree | 43 (10.5%) | 6.0 |
| Bachelor's Degree | 85 (20.8%) | 24.0 |
| Graduate Degree | 121 (29.7%) | 84.0 |
| Total | 408 (100.0%) | 25.0 |
Fertility by Education by Marriage Status in Stillwater
34.1% of women with births in Stillwater are unmarried. Women with the educational attainment of less than high school are most likely to be married with 100.0% of them married at childbirth, while women with the educational attainment of high school diploma are least likely to be married with 75.8% of them unmarried at childbirth.
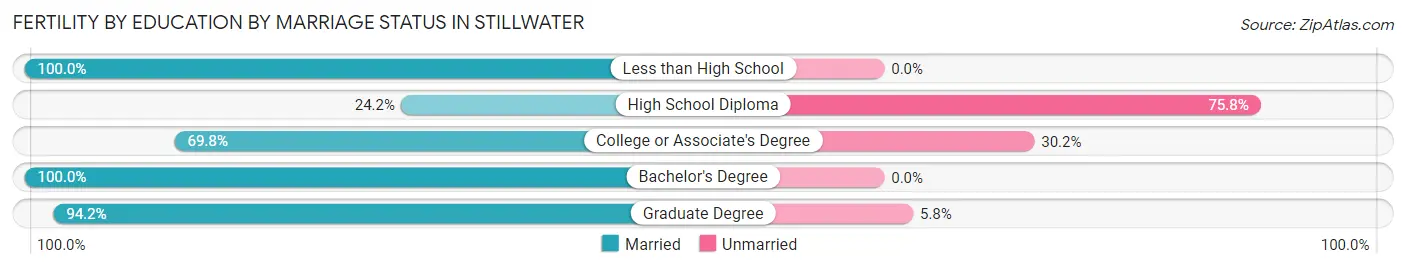
| Educational Attainment | Married | Unmarried |
| Less than High School | 2 (100.0%) | 0 (0.0%) |
| High School Diploma | 38 (24.2%) | 119 (75.8%) |
| College or Associate's Degree | 30 (69.8%) | 13 (30.2%) |
| Bachelor's Degree | 85 (100.0%) | 0 (0.0%) |
| Graduate Degree | 114 (94.2%) | 7 (5.8%) |
| Total | 269 (65.9%) | 139 (34.1%) |
Employment Characteristics in Stillwater
Employment by Class of Employer in Stillwater
Among the 22,279 employed individuals in Stillwater, private company employees (12,211 | 54.8%), state government employees (5,623 | 25.2%), and not-for-profit organizations (1,802 | 8.1%) make up the most common classes of employment.
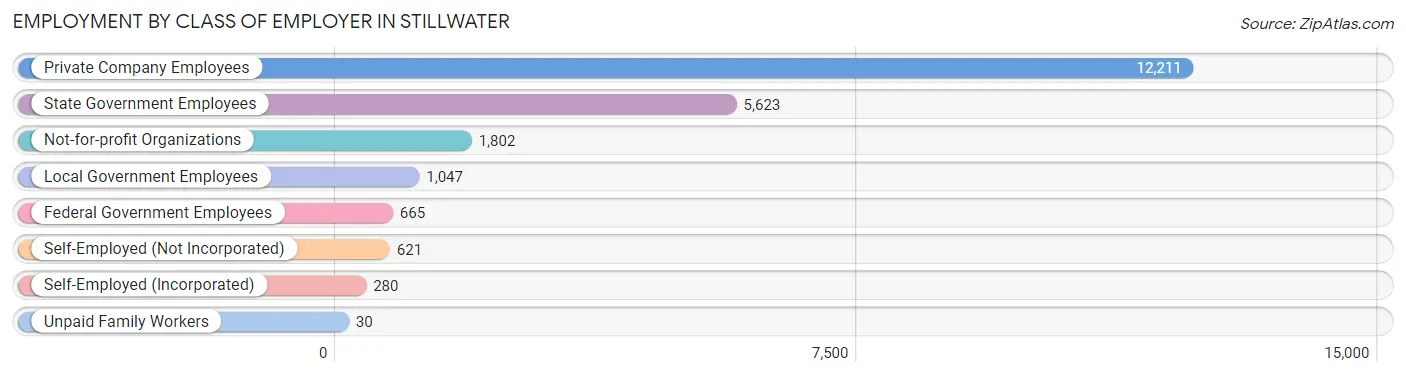
| Employer Class | # Employees | % Employees |
| Private Company Employees | 12,211 | 54.8% |
| Self-Employed (Incorporated) | 280 | 1.3% |
| Self-Employed (Not Incorporated) | 621 | 2.8% |
| Not-for-profit Organizations | 1,802 | 8.1% |
| Local Government Employees | 1,047 | 4.7% |
| State Government Employees | 5,623 | 25.2% |
| Federal Government Employees | 665 | 3.0% |
| Unpaid Family Workers | 30 | 0.1% |
| Total | 22,279 | 100.0% |
Employment Status by Age in Stillwater
According to the labor force statistics for Stillwater, out of the total population over 16 years of age (42,177), 56.7% or 23,914 individuals are in the labor force, with 5.3% or 1,267 of them unemployed. The age group with the highest labor force participation rate is 30 to 34 years, with 82.6% or 2,384 individuals in the labor force. Within the labor force, the 16 to 19 years age range has the highest percentage of unemployed individuals, with 18.9% or 316 of them being unemployed.
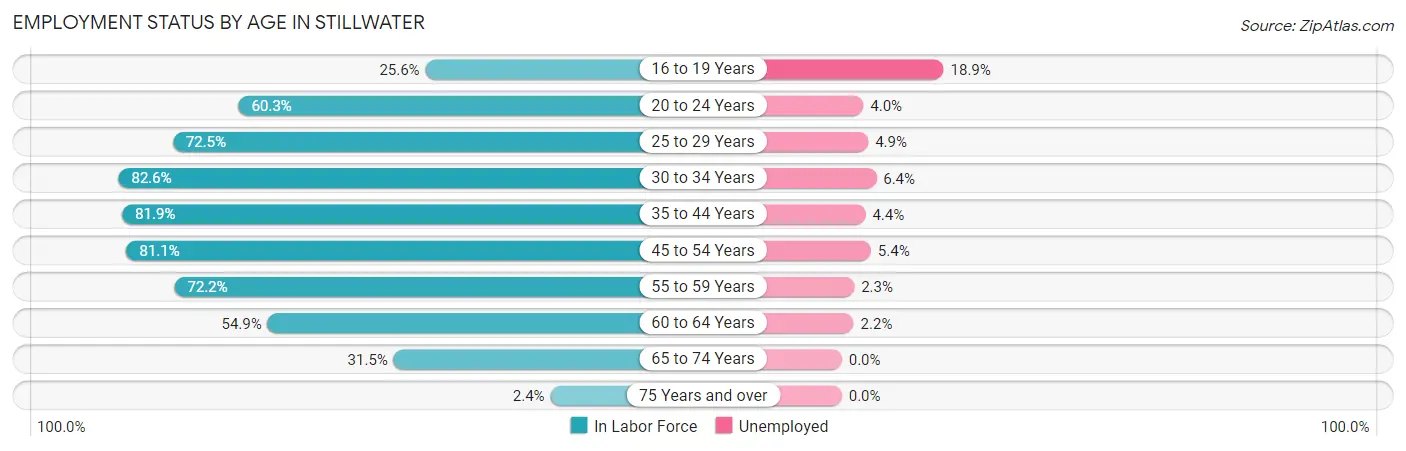
| Age Bracket | In Labor Force | Unemployed |
| 16 to 19 Years | 1,672 (25.6%) | 316 (18.9%) |
| 20 to 24 Years | 8,407 (60.3%) | 336 (4.0%) |
| 25 to 29 Years | 2,589 (72.5%) | 127 (4.9%) |
| 30 to 34 Years | 2,384 (82.6%) | 153 (6.4%) |
| 35 to 44 Years | 3,723 (81.9%) | 164 (4.4%) |
| 45 to 54 Years | 2,395 (81.1%) | 129 (5.4%) |
| 55 to 59 Years | 1,002 (72.2%) | 23 (2.3%) |
| 60 to 64 Years | 883 (54.9%) | 19 (2.2%) |
| 65 to 74 Years | 788 (31.5%) | 0 (0.0%) |
| 75 Years and over | 54 (2.4%) | 0 (0.0%) |
| Total | 23,914 (56.7%) | 1,267 (5.3%) |
Employment Status by Educational Attainment in Stillwater
According to labor force statistics for Stillwater, 76.5% of individuals (12,968) out of the total population between 25 and 64 years of age (16,952) are in the labor force, with 4.7% or 609 of them being unemployed. The group with the highest labor force participation rate are those with the educational attainment of bachelor's degree or higher, with 83.7% or 7,321 individuals in the labor force. Within the labor force, individuals with college / associate degree education have the highest percentage of unemployment, with 8.4% or 236 of them being unemployed.
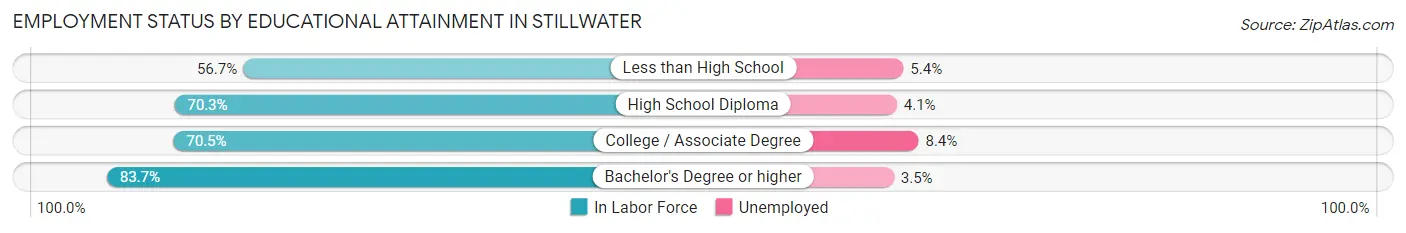
| Educational Attainment | In Labor Force | Unemployed |
| Less than High School | 509 (56.7%) | 48 (5.4%) |
| High School Diploma | 2,330 (70.3%) | 136 (4.1%) |
| College / Associate Degree | 2,815 (70.5%) | 335 (8.4%) |
| Bachelor's Degree or higher | 7,321 (83.7%) | 306 (3.5%) |
| Total | 12,968 (76.5%) | 797 (4.7%) |
Employment Occupations by Sex in Stillwater
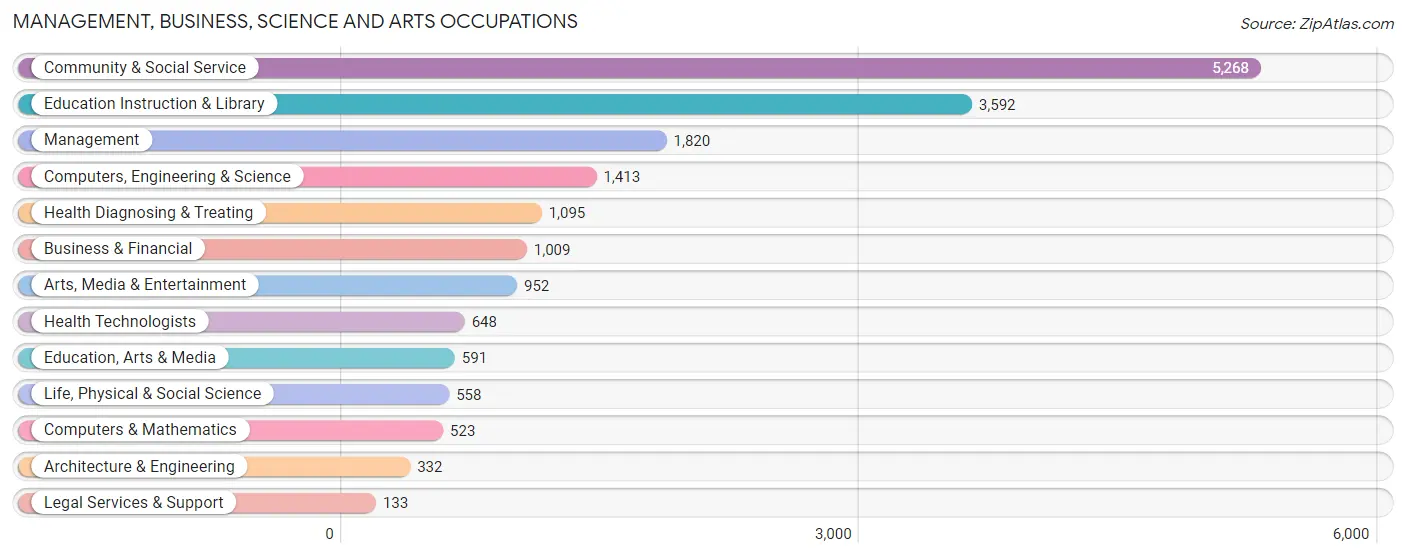
Management, Business, Science and Arts Occupations
The most common Management, Business, Science and Arts occupations in Stillwater are Community & Social Service (5,268 | 23.5%), Education Instruction & Library (3,592 | 16.0%), Management (1,820 | 8.1%), Computers, Engineering & Science (1,413 | 6.3%), and Health Diagnosing & Treating (1,095 | 4.9%).
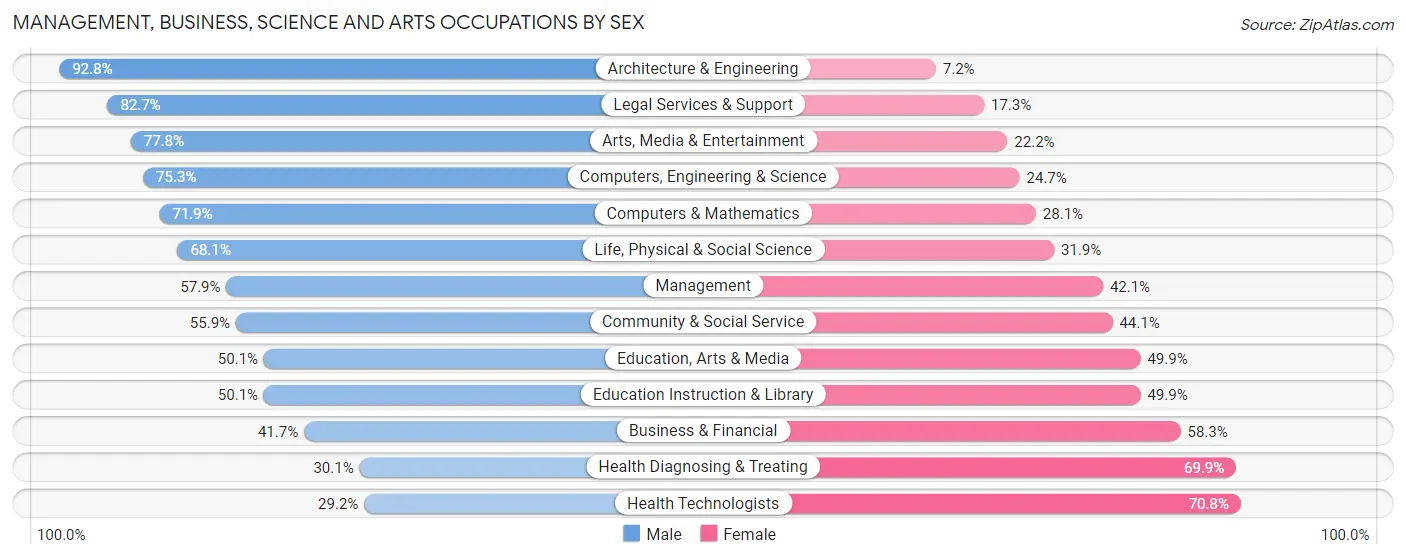
Management, Business, Science and Arts Occupations by Sex
Within the Management, Business, Science and Arts occupations in Stillwater, the most male-oriented occupations are Architecture & Engineering (92.8%), Legal Services & Support (82.7%), and Arts, Media & Entertainment (77.8%), while the most female-oriented occupations are Health Technologists (70.8%), Health Diagnosing & Treating (69.9%), and Business & Financial (58.3%).
| Occupation | Male | Female |
| Management | 1,054 (57.9%) | 766 (42.1%) |
| Business & Financial | 421 (41.7%) | 588 (58.3%) |
| Computers, Engineering & Science | 1,064 (75.3%) | 349 (24.7%) |
| Computers & Mathematics | 376 (71.9%) | 147 (28.1%) |
| Architecture & Engineering | 308 (92.8%) | 24 (7.2%) |
| Life, Physical & Social Science | 380 (68.1%) | 178 (31.9%) |
| Community & Social Service | 2,946 (55.9%) | 2,322 (44.1%) |
| Education, Arts & Media | 296 (50.1%) | 295 (49.9%) |
| Legal Services & Support | 110 (82.7%) | 23 (17.3%) |
| Education Instruction & Library | 1,799 (50.1%) | 1,793 (49.9%) |
| Arts, Media & Entertainment | 741 (77.8%) | 211 (22.2%) |
| Health Diagnosing & Treating | 330 (30.1%) | 765 (69.9%) |
| Health Technologists | 189 (29.2%) | 459 (70.8%) |
| Total (Category) | 5,815 (54.8%) | 4,790 (45.2%) |
| Total (Overall) | 12,169 (54.2%) | 10,289 (45.8%) |
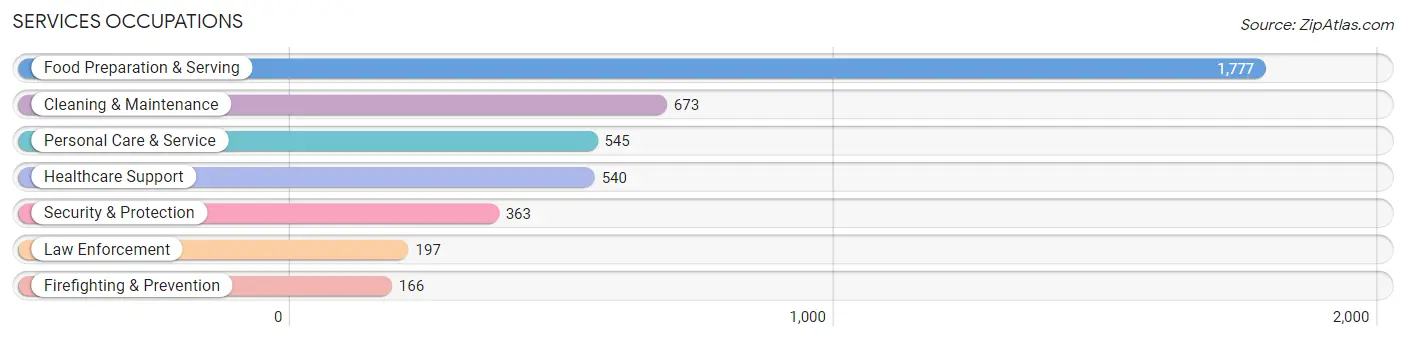
Services Occupations
The most common Services occupations in Stillwater are Food Preparation & Serving (1,777 | 7.9%), Cleaning & Maintenance (673 | 3.0%), Personal Care & Service (545 | 2.4%), Healthcare Support (540 | 2.4%), and Security & Protection (363 | 1.6%).
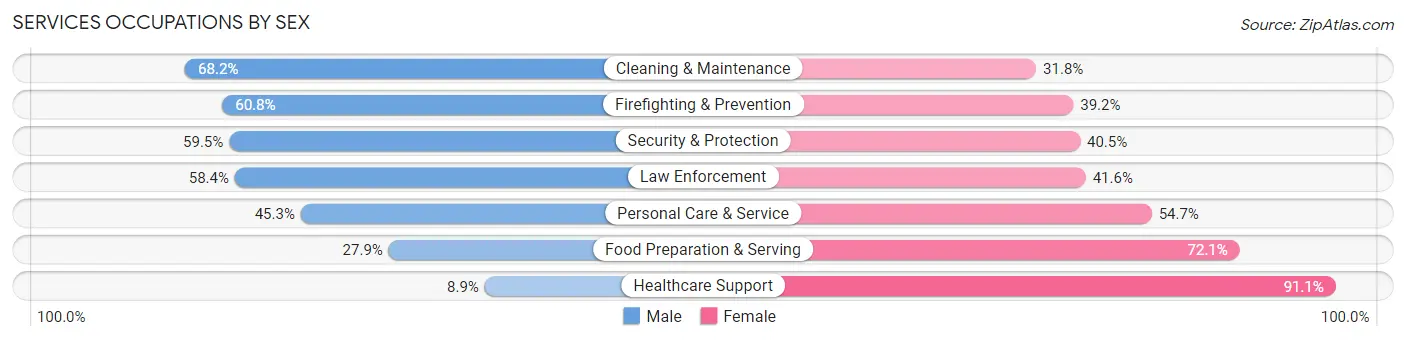
Services Occupations by Sex
Within the Services occupations in Stillwater, the most male-oriented occupations are Cleaning & Maintenance (68.2%), Firefighting & Prevention (60.8%), and Security & Protection (59.5%), while the most female-oriented occupations are Healthcare Support (91.1%), Food Preparation & Serving (72.1%), and Personal Care & Service (54.7%).
| Occupation | Male | Female |
| Healthcare Support | 48 (8.9%) | 492 (91.1%) |
| Security & Protection | 216 (59.5%) | 147 (40.5%) |
| Firefighting & Prevention | 101 (60.8%) | 65 (39.2%) |
| Law Enforcement | 115 (58.4%) | 82 (41.6%) |
| Food Preparation & Serving | 496 (27.9%) | 1,281 (72.1%) |
| Cleaning & Maintenance | 459 (68.2%) | 214 (31.8%) |
| Personal Care & Service | 247 (45.3%) | 298 (54.7%) |
| Total (Category) | 1,466 (37.6%) | 2,432 (62.4%) |
| Total (Overall) | 12,169 (54.2%) | 10,289 (45.8%) |
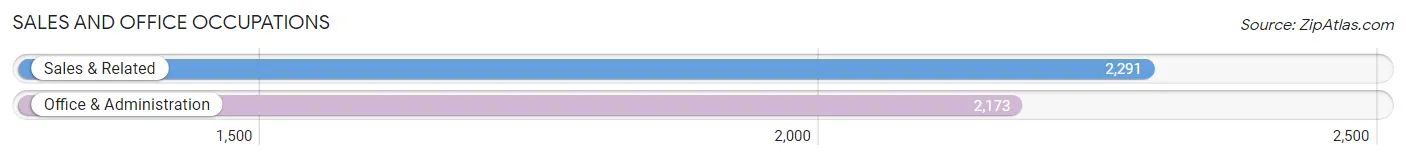
Sales and Office Occupations
The most common Sales and Office occupations in Stillwater are Sales & Related (2,291 | 10.2%), and Office & Administration (2,173 | 9.7%).
Sales and Office Occupations by Sex
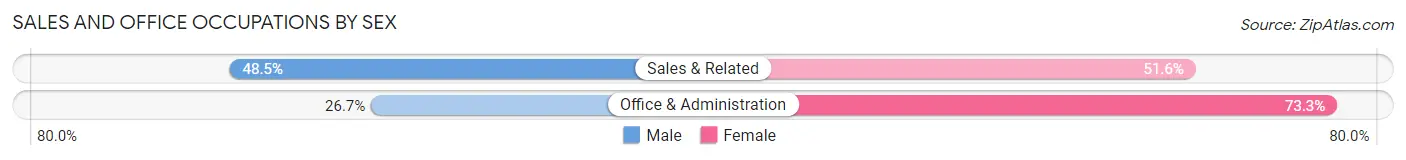
| Occupation | Male | Female |
| Sales & Related | 1,110 (48.4%) | 1,181 (51.5%) |
| Office & Administration | 580 (26.7%) | 1,593 (73.3%) |
| Total (Category) | 1,690 (37.9%) | 2,774 (62.1%) |
| Total (Overall) | 12,169 (54.2%) | 10,289 (45.8%) |
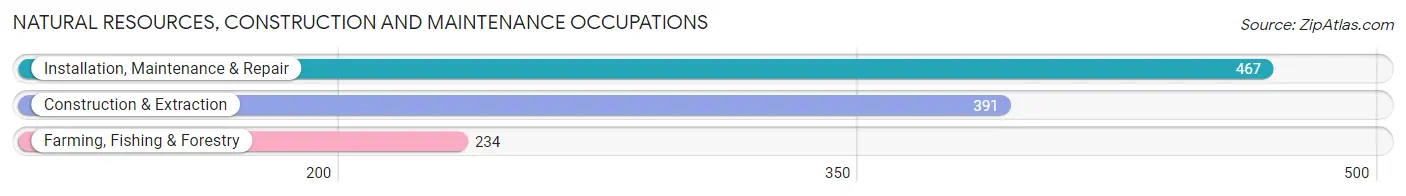
Natural Resources, Construction and Maintenance Occupations
The most common Natural Resources, Construction and Maintenance occupations in Stillwater are Installation, Maintenance & Repair (467 | 2.1%), Construction & Extraction (391 | 1.7%), and Farming, Fishing & Forestry (234 | 1.0%).
Natural Resources, Construction and Maintenance Occupations by Sex
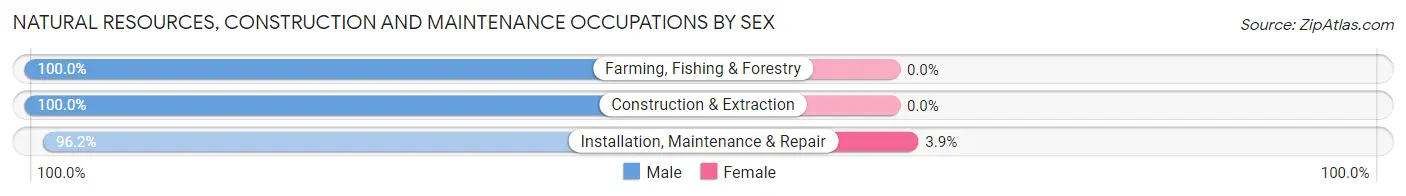
| Occupation | Male | Female |
| Farming, Fishing & Forestry | 234 (100.0%) | 0 (0.0%) |
| Construction & Extraction | 391 (100.0%) | 0 (0.0%) |
| Installation, Maintenance & Repair | 449 (96.2%) | 18 (3.8%) |
| Total (Category) | 1,074 (98.4%) | 18 (1.7%) |
| Total (Overall) | 12,169 (54.2%) | 10,289 (45.8%) |
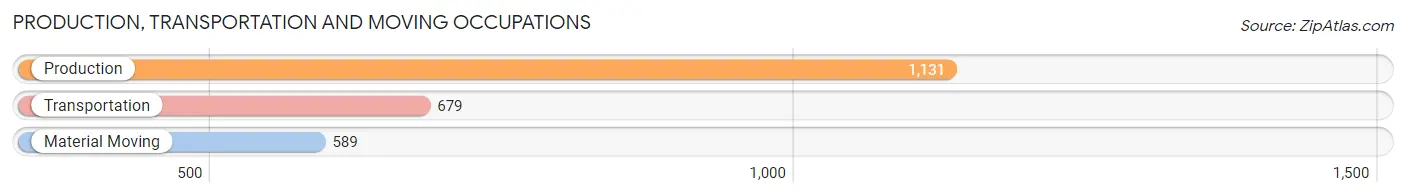
Production, Transportation and Moving Occupations
The most common Production, Transportation and Moving occupations in Stillwater are Production (1,131 | 5.0%), Transportation (679 | 3.0%), and Material Moving (589 | 2.6%).
Production, Transportation and Moving Occupations by Sex
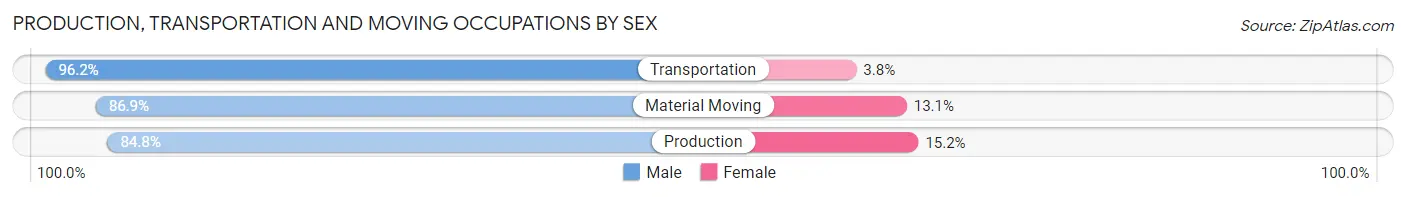
| Occupation | Male | Female |
| Production | 959 (84.8%) | 172 (15.2%) |
| Transportation | 653 (96.2%) | 26 (3.8%) |
| Material Moving | 512 (86.9%) | 77 (13.1%) |
| Total (Category) | 2,124 (88.5%) | 275 (11.5%) |
| Total (Overall) | 12,169 (54.2%) | 10,289 (45.8%) |
Employment Industries by Sex in Stillwater
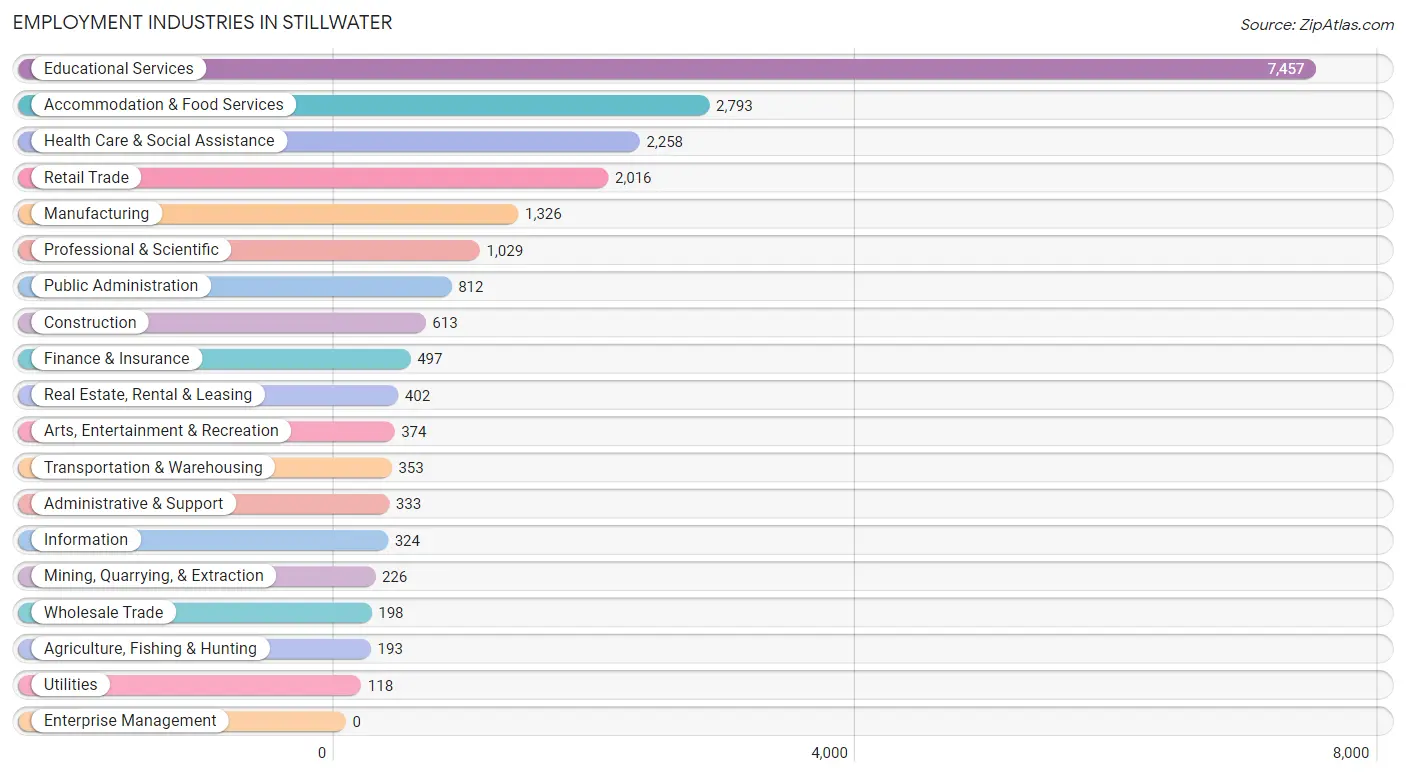
Employment Industries in Stillwater
The major employment industries in Stillwater include Educational Services (7,457 | 33.2%), Accommodation & Food Services (2,793 | 12.4%), Health Care & Social Assistance (2,258 | 10.1%), Retail Trade (2,016 | 9.0%), and Manufacturing (1,326 | 5.9%).
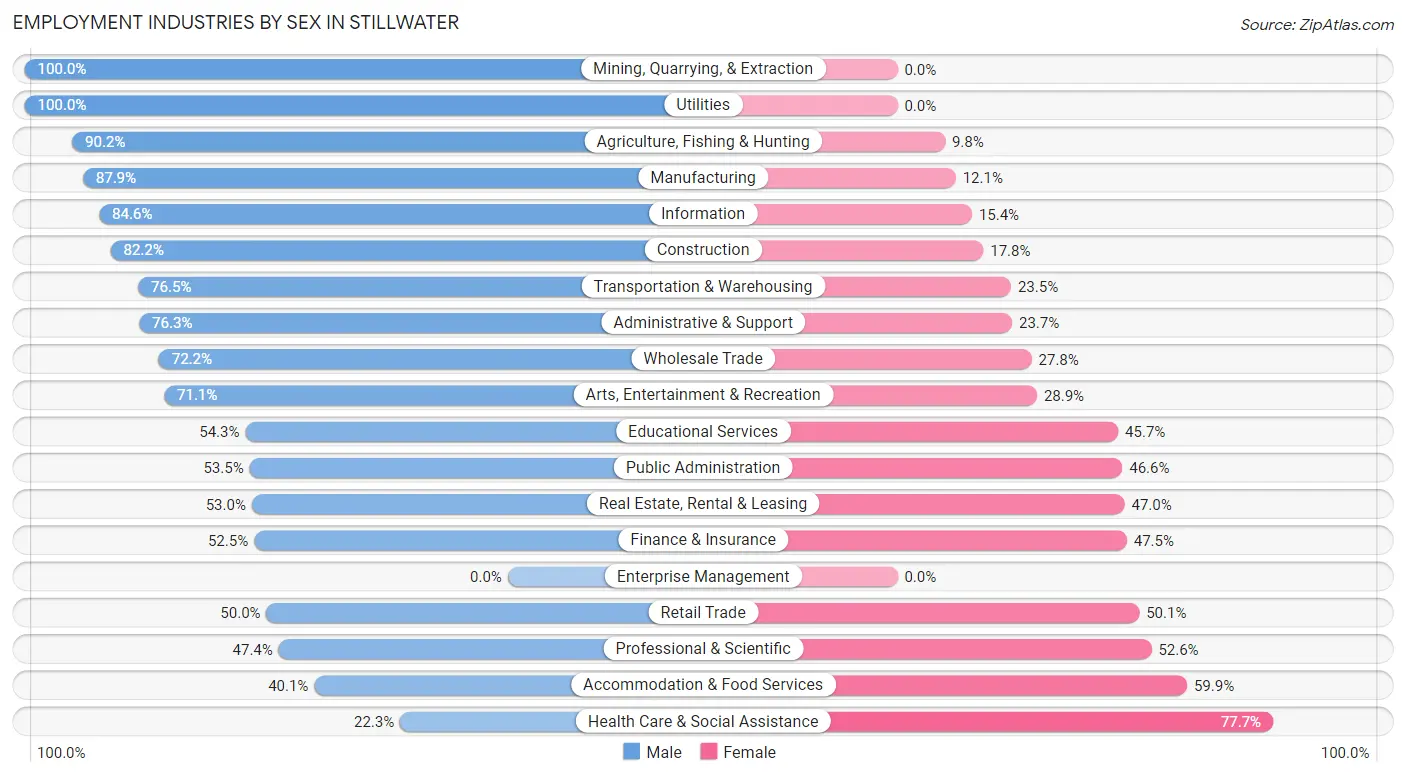
Employment Industries by Sex in Stillwater
The Stillwater industries that see more men than women are Mining, Quarrying, & Extraction (100.0%), Utilities (100.0%), and Agriculture, Fishing & Hunting (90.2%), whereas the industries that tend to have a higher number of women are Health Care & Social Assistance (77.7%), Accommodation & Food Services (59.9%), and Professional & Scientific (52.6%).
| Industry | Male | Female |
| Agriculture, Fishing & Hunting | 174 (90.2%) | 19 (9.8%) |
| Mining, Quarrying, & Extraction | 226 (100.0%) | 0 (0.0%) |
| Construction | 504 (82.2%) | 109 (17.8%) |
| Manufacturing | 1,166 (87.9%) | 160 (12.1%) |
| Wholesale Trade | 143 (72.2%) | 55 (27.8%) |
| Retail Trade | 1,007 (49.9%) | 1,009 (50.0%) |
| Transportation & Warehousing | 270 (76.5%) | 83 (23.5%) |
| Utilities | 118 (100.0%) | 0 (0.0%) |
| Information | 274 (84.6%) | 50 (15.4%) |
| Finance & Insurance | 261 (52.5%) | 236 (47.5%) |
| Real Estate, Rental & Leasing | 213 (53.0%) | 189 (47.0%) |
| Professional & Scientific | 488 (47.4%) | 541 (52.6%) |
| Enterprise Management | 0 (0.0%) | 0 (0.0%) |
| Administrative & Support | 254 (76.3%) | 79 (23.7%) |
| Educational Services | 4,050 (54.3%) | 3,407 (45.7%) |
| Health Care & Social Assistance | 503 (22.3%) | 1,755 (77.7%) |
| Arts, Entertainment & Recreation | 266 (71.1%) | 108 (28.9%) |
| Accommodation & Food Services | 1,119 (40.1%) | 1,674 (59.9%) |
| Public Administration | 434 (53.4%) | 378 (46.6%) |
| Total | 12,169 (54.2%) | 10,289 (45.8%) |
Education in Stillwater
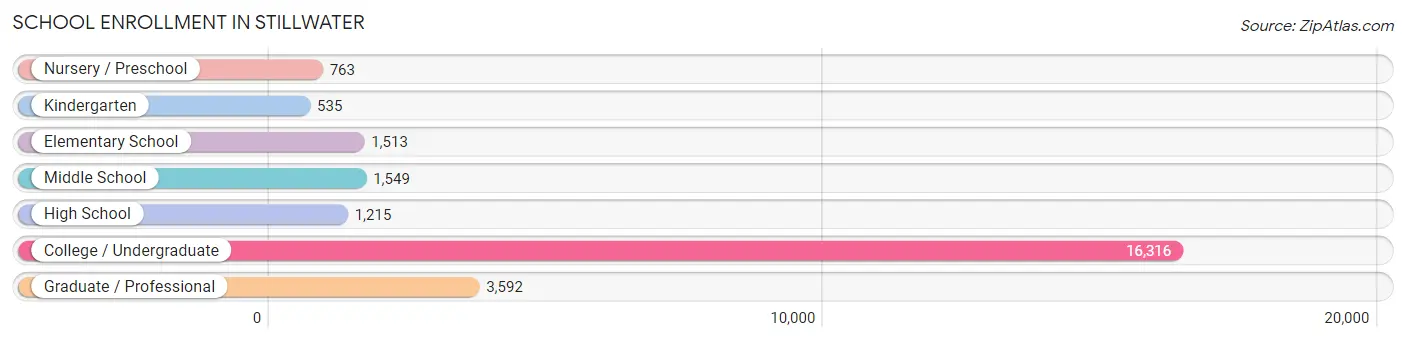
School Enrollment in Stillwater
The most common levels of schooling among the 25,483 students in Stillwater are college / undergraduate (16,316 | 64.0%), graduate / professional (3,592 | 14.1%), and middle school (1,549 | 6.1%).
| School Level | # Students | % Students |
| Nursery / Preschool | 763 | 3.0% |
| Kindergarten | 535 | 2.1% |
| Elementary School | 1,513 | 5.9% |
| Middle School | 1,549 | 6.1% |
| High School | 1,215 | 4.8% |
| College / Undergraduate | 16,316 | 64.0% |
| Graduate / Professional | 3,592 | 14.1% |
| Total | 25,483 | 100.0% |
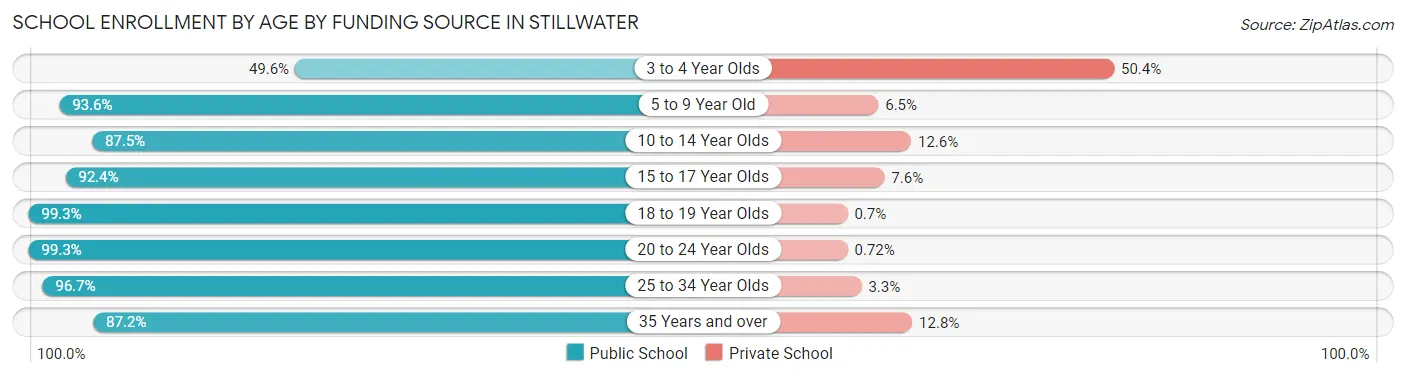
School Enrollment by Age by Funding Source in Stillwater
Out of a total of 25,483 students who are enrolled in schools in Stillwater, 994 (3.9%) attend a private institution, while the remaining 24,489 (96.1%) are enrolled in public schools. The age group of 3 to 4 year olds has the highest likelihood of being enrolled in private schools, with 279 (50.4% in the age bracket) enrolled. Conversely, the age group of 18 to 19 year olds has the lowest likelihood of being enrolled in a private school, with 5,683 (99.3% in the age bracket) attending a public institution.
| Age Bracket | Public School | Private School |
| 3 to 4 Year Olds | 275 (49.6%) | 279 (50.4%) |
| 5 to 9 Year Old | 1,916 (93.5%) | 132 (6.5%) |
| 10 to 14 Year Olds | 1,595 (87.5%) | 229 (12.6%) |
| 15 to 17 Year Olds | 950 (92.4%) | 78 (7.6%) |
| 18 to 19 Year Olds | 5,683 (99.3%) | 40 (0.7%) |
| 20 to 24 Year Olds | 11,201 (99.3%) | 81 (0.7%) |
| 25 to 34 Year Olds | 2,280 (96.7%) | 78 (3.3%) |
| 35 Years and over | 581 (87.2%) | 85 (12.8%) |
| Total | 24,489 (96.1%) | 994 (3.9%) |
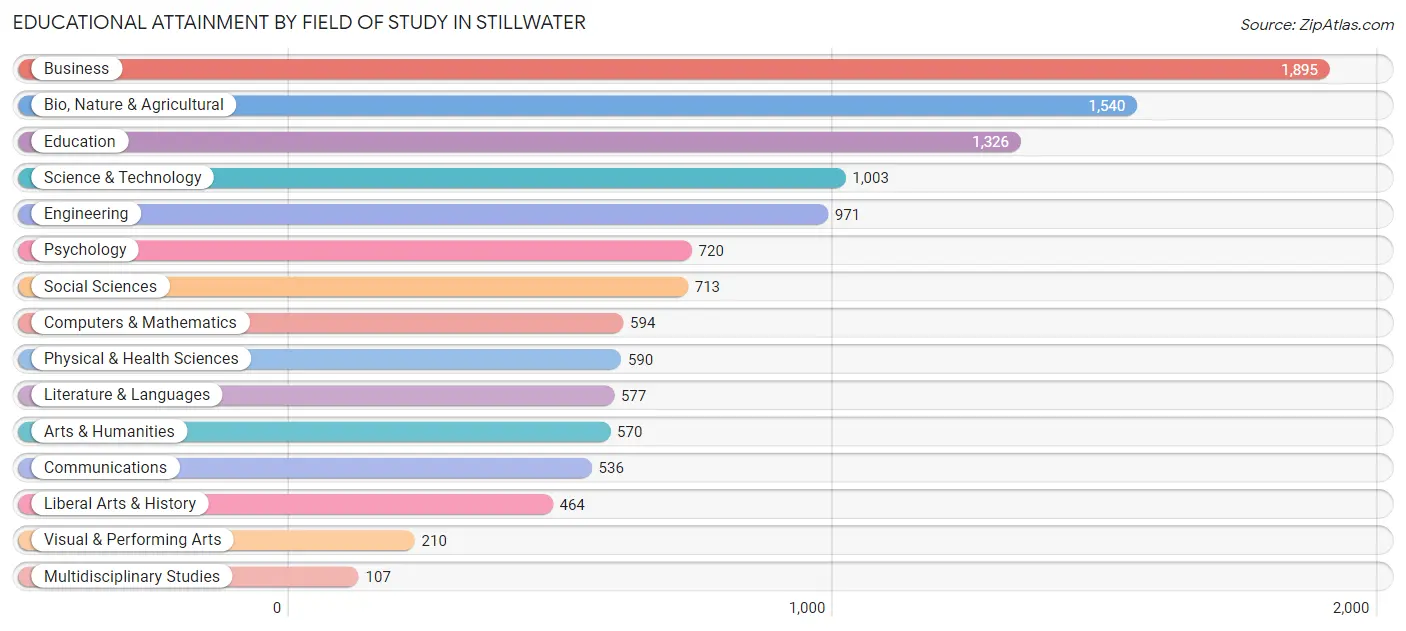
Educational Attainment by Field of Study in Stillwater
Business (1,895 | 16.0%), bio, nature & agricultural (1,540 | 13.0%), education (1,326 | 11.2%), science & technology (1,003 | 8.5%), and engineering (971 | 8.2%) are the most common fields of study among 11,816 individuals in Stillwater who have obtained a bachelor's degree or higher.
| Field of Study | # Graduates | % Graduates |
| Computers & Mathematics | 594 | 5.0% |
| Bio, Nature & Agricultural | 1,540 | 13.0% |
| Physical & Health Sciences | 590 | 5.0% |
| Psychology | 720 | 6.1% |
| Social Sciences | 713 | 6.0% |
| Engineering | 971 | 8.2% |
| Multidisciplinary Studies | 107 | 0.9% |
| Science & Technology | 1,003 | 8.5% |
| Business | 1,895 | 16.0% |
| Education | 1,326 | 11.2% |
| Literature & Languages | 577 | 4.9% |
| Liberal Arts & History | 464 | 3.9% |
| Visual & Performing Arts | 210 | 1.8% |
| Communications | 536 | 4.5% |
| Arts & Humanities | 570 | 4.8% |
| Total | 11,816 | 100.0% |
Transportation & Commute in Stillwater
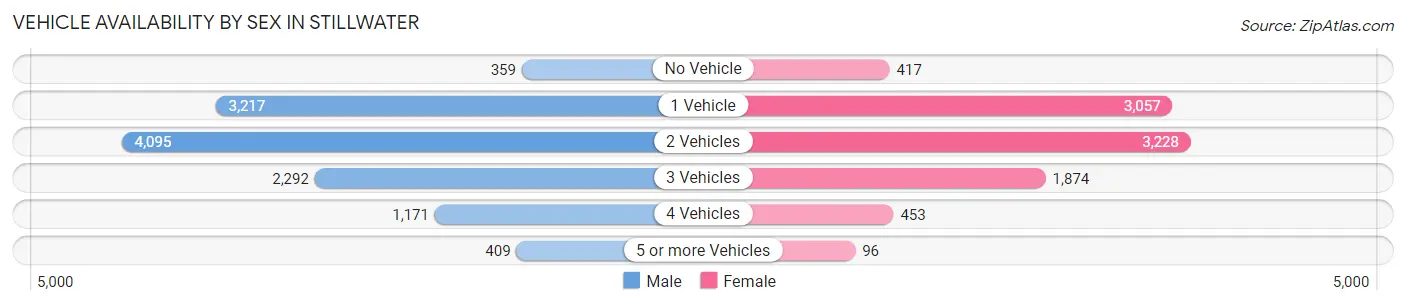
Vehicle Availability by Sex in Stillwater
The most prevalent vehicle ownership categories in Stillwater are males with 2 vehicles (4,095, accounting for 35.5%) and females with 2 vehicles (3,228, making up 44.9%).
| Vehicles Available | Male | Female |
| No Vehicle | 359 (3.1%) | 417 (4.6%) |
| 1 Vehicle | 3,217 (27.9%) | 3,057 (33.5%) |
| 2 Vehicles | 4,095 (35.5%) | 3,228 (35.4%) |
| 3 Vehicles | 2,292 (19.9%) | 1,874 (20.5%) |
| 4 Vehicles | 1,171 (10.1%) | 453 (5.0%) |
| 5 or more Vehicles | 409 (3.5%) | 96 (1.1%) |
| Total | 11,543 (100.0%) | 9,125 (100.0%) |
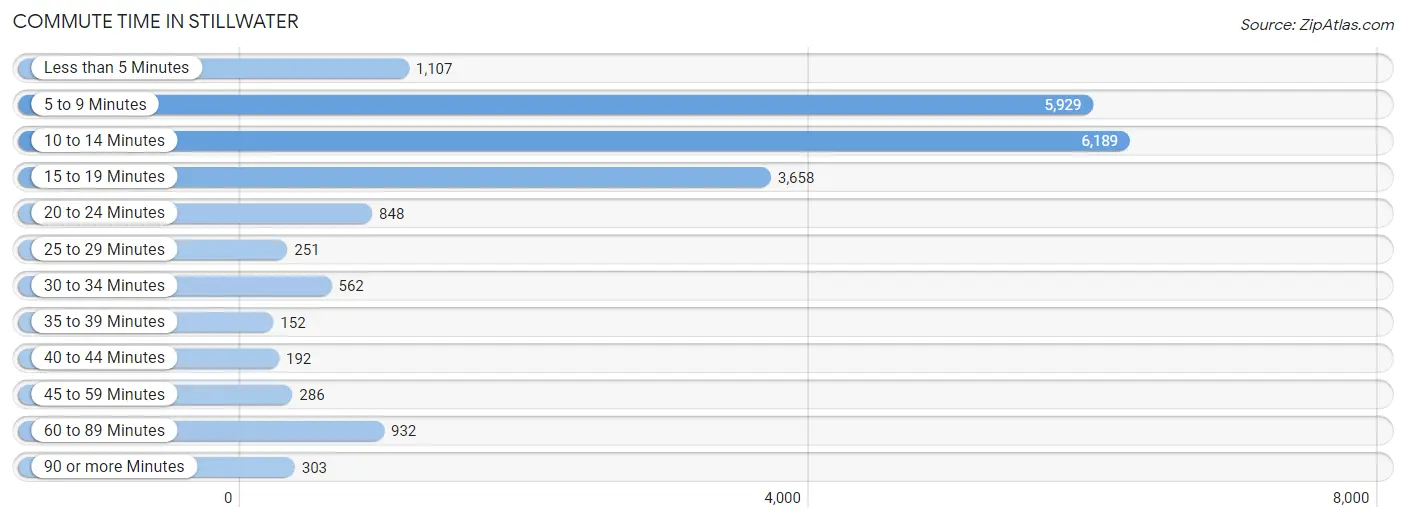
Commute Time in Stillwater
The most frequently occuring commute durations in Stillwater are 10 to 14 minutes (6,189 commuters, 30.3%), 5 to 9 minutes (5,929 commuters, 29.0%), and 15 to 19 minutes (3,658 commuters, 17.9%).
| Commute Time | # Commuters | % Commuters |
| Less than 5 Minutes | 1,107 | 5.4% |
| 5 to 9 Minutes | 5,929 | 29.0% |
| 10 to 14 Minutes | 6,189 | 30.3% |
| 15 to 19 Minutes | 3,658 | 17.9% |
| 20 to 24 Minutes | 848 | 4.2% |
| 25 to 29 Minutes | 251 | 1.2% |
| 30 to 34 Minutes | 562 | 2.8% |
| 35 to 39 Minutes | 152 | 0.7% |
| 40 to 44 Minutes | 192 | 0.9% |
| 45 to 59 Minutes | 286 | 1.4% |
| 60 to 89 Minutes | 932 | 4.6% |
| 90 or more Minutes | 303 | 1.5% |
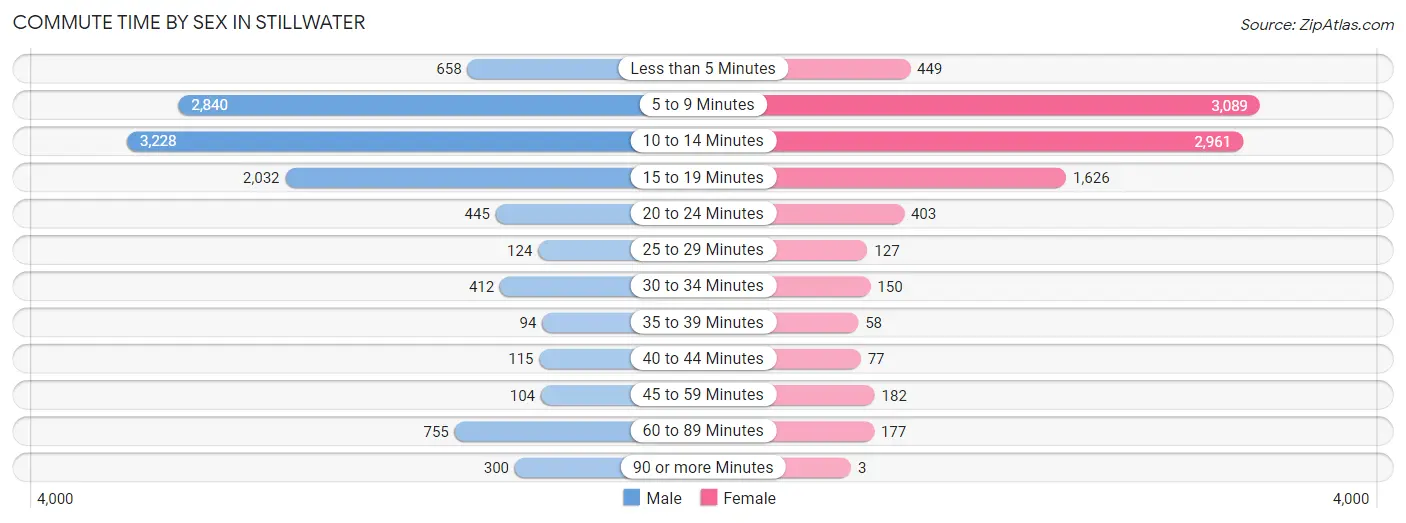
Commute Time by Sex in Stillwater
The most common commute times in Stillwater are 10 to 14 minutes (3,228 commuters, 29.1%) for males and 5 to 9 minutes (3,089 commuters, 33.2%) for females.
| Commute Time | Male | Female |
| Less than 5 Minutes | 658 (5.9%) | 449 (4.8%) |
| 5 to 9 Minutes | 2,840 (25.6%) | 3,089 (33.2%) |
| 10 to 14 Minutes | 3,228 (29.1%) | 2,961 (31.8%) |
| 15 to 19 Minutes | 2,032 (18.3%) | 1,626 (17.5%) |
| 20 to 24 Minutes | 445 (4.0%) | 403 (4.3%) |
| 25 to 29 Minutes | 124 (1.1%) | 127 (1.4%) |
| 30 to 34 Minutes | 412 (3.7%) | 150 (1.6%) |
| 35 to 39 Minutes | 94 (0.9%) | 58 (0.6%) |
| 40 to 44 Minutes | 115 (1.0%) | 77 (0.8%) |
| 45 to 59 Minutes | 104 (0.9%) | 182 (2.0%) |
| 60 to 89 Minutes | 755 (6.8%) | 177 (1.9%) |
| 90 or more Minutes | 300 (2.7%) | 3 (0.0%) |
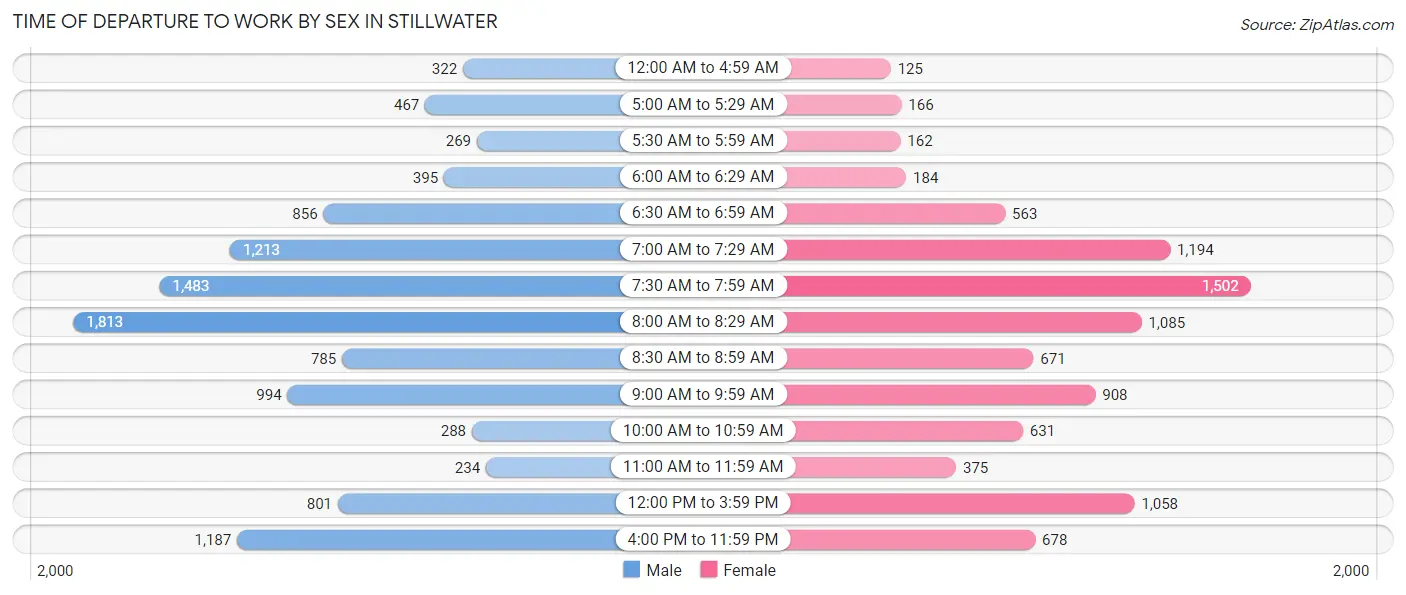
Time of Departure to Work by Sex in Stillwater
The most frequent times of departure to work in Stillwater are 8:00 AM to 8:29 AM (1,813, 16.3%) for males and 7:30 AM to 7:59 AM (1,502, 16.2%) for females.
| Time of Departure | Male | Female |
| 12:00 AM to 4:59 AM | 322 (2.9%) | 125 (1.3%) |
| 5:00 AM to 5:29 AM | 467 (4.2%) | 166 (1.8%) |
| 5:30 AM to 5:59 AM | 269 (2.4%) | 162 (1.7%) |
| 6:00 AM to 6:29 AM | 395 (3.6%) | 184 (2.0%) |
| 6:30 AM to 6:59 AM | 856 (7.7%) | 563 (6.0%) |
| 7:00 AM to 7:29 AM | 1,213 (10.9%) | 1,194 (12.8%) |
| 7:30 AM to 7:59 AM | 1,483 (13.4%) | 1,502 (16.2%) |
| 8:00 AM to 8:29 AM | 1,813 (16.3%) | 1,085 (11.7%) |
| 8:30 AM to 8:59 AM | 785 (7.1%) | 671 (7.2%) |
| 9:00 AM to 9:59 AM | 994 (8.9%) | 908 (9.8%) |
| 10:00 AM to 10:59 AM | 288 (2.6%) | 631 (6.8%) |
| 11:00 AM to 11:59 AM | 234 (2.1%) | 375 (4.0%) |
| 12:00 PM to 3:59 PM | 801 (7.2%) | 1,058 (11.4%) |
| 4:00 PM to 11:59 PM | 1,187 (10.7%) | 678 (7.3%) |
| Total | 11,107 (100.0%) | 9,302 (100.0%) |
Housing Occupancy in Stillwater
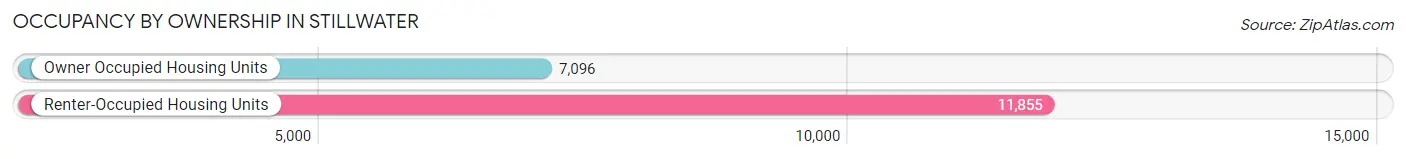
Occupancy by Ownership in Stillwater
Of the total 18,951 dwellings in Stillwater, owner-occupied units account for 7,096 (37.4%), while renter-occupied units make up 11,855 (62.6%).
| Occupancy | # Housing Units | % Housing Units |
| Owner Occupied Housing Units | 7,096 | 37.4% |
| Renter-Occupied Housing Units | 11,855 | 62.6% |
| Total Occupied Housing Units | 18,951 | 100.0% |
Occupancy by Household Size in Stillwater
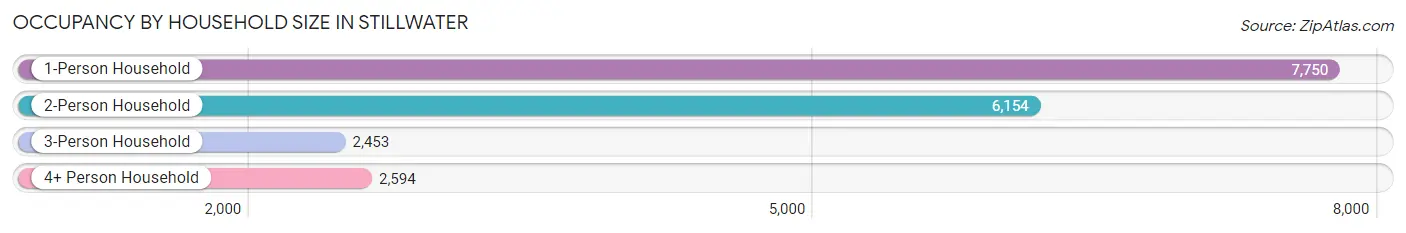
| Household Size | # Housing Units | % Housing Units |
| 1-Person Household | 7,750 | 40.9% |
| 2-Person Household | 6,154 | 32.5% |
| 3-Person Household | 2,453 | 12.9% |
| 4+ Person Household | 2,594 | 13.7% |
| Total Housing Units | 18,951 | 100.0% |
Occupancy by Ownership by Household Size in Stillwater
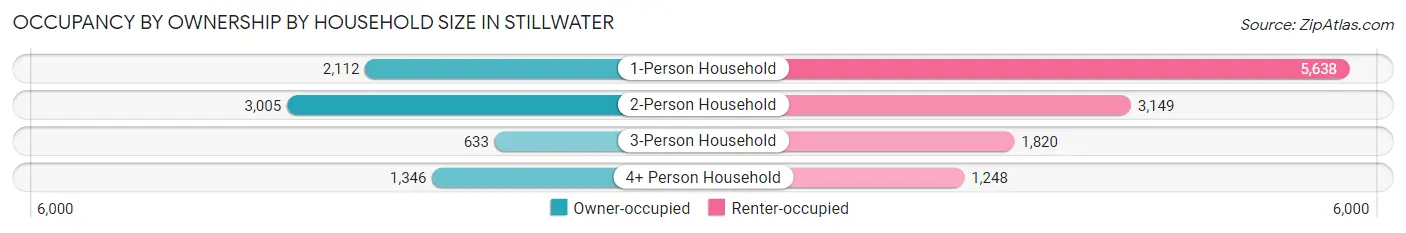
| Household Size | Owner-occupied | Renter-occupied |
| 1-Person Household | 2,112 (27.3%) | 5,638 (72.8%) |
| 2-Person Household | 3,005 (48.8%) | 3,149 (51.2%) |
| 3-Person Household | 633 (25.8%) | 1,820 (74.2%) |
| 4+ Person Household | 1,346 (51.9%) | 1,248 (48.1%) |
| Total Housing Units | 7,096 (37.4%) | 11,855 (62.6%) |
Occupancy by Educational Attainment in Stillwater
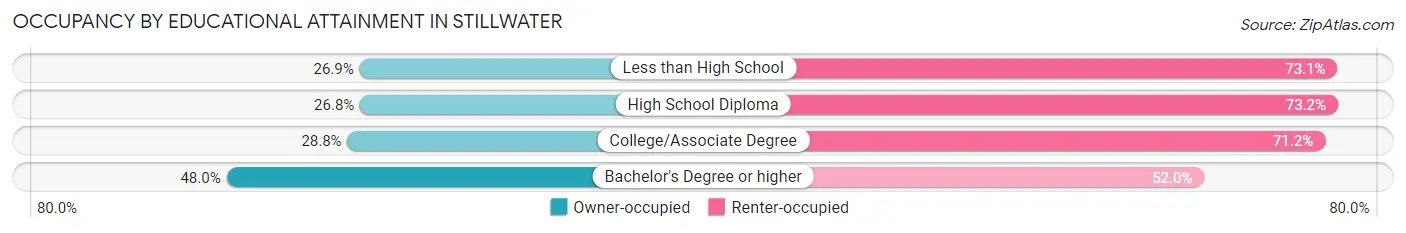
| Household Size | Owner-occupied | Renter-occupied |
| Less than High School | 147 (26.9%) | 400 (73.1%) |
| High School Diploma | 717 (26.8%) | 1,960 (73.2%) |
| College/Associate Degree | 1,971 (28.8%) | 4,875 (71.2%) |
| Bachelor's Degree or higher | 4,261 (48.0%) | 4,620 (52.0%) |
Occupancy by Age of Householder in Stillwater
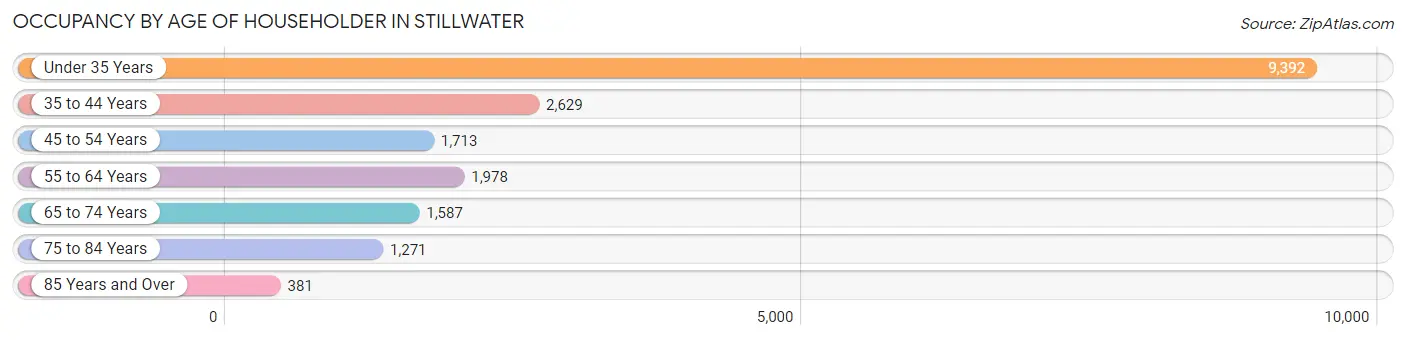
| Age Bracket | # Households | % Households |
| Under 35 Years | 9,392 | 49.6% |
| 35 to 44 Years | 2,629 | 13.9% |
| 45 to 54 Years | 1,713 | 9.0% |
| 55 to 64 Years | 1,978 | 10.4% |
| 65 to 74 Years | 1,587 | 8.4% |
| 75 to 84 Years | 1,271 | 6.7% |
| 85 Years and Over | 381 | 2.0% |
| Total | 18,951 | 100.0% |
Housing Finances in Stillwater
Median Income by Occupancy in Stillwater
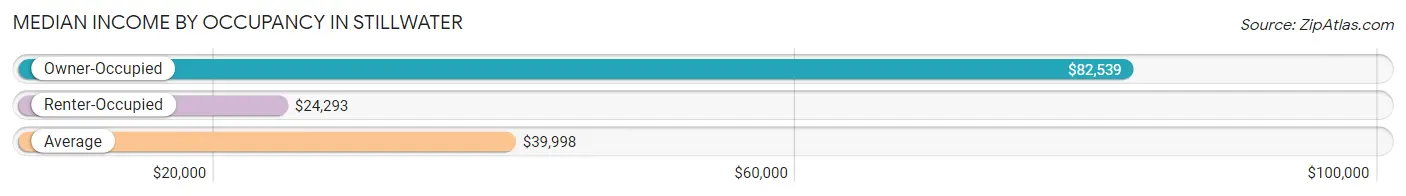
| Occupancy Type | # Households | Median Income |
| Owner-Occupied | 7,096 (37.4%) | $82,539 |
| Renter-Occupied | 11,855 (62.6%) | $24,293 |
| Average | 18,951 (100.0%) | $39,998 |
Occupancy by Householder Income Bracket in Stillwater
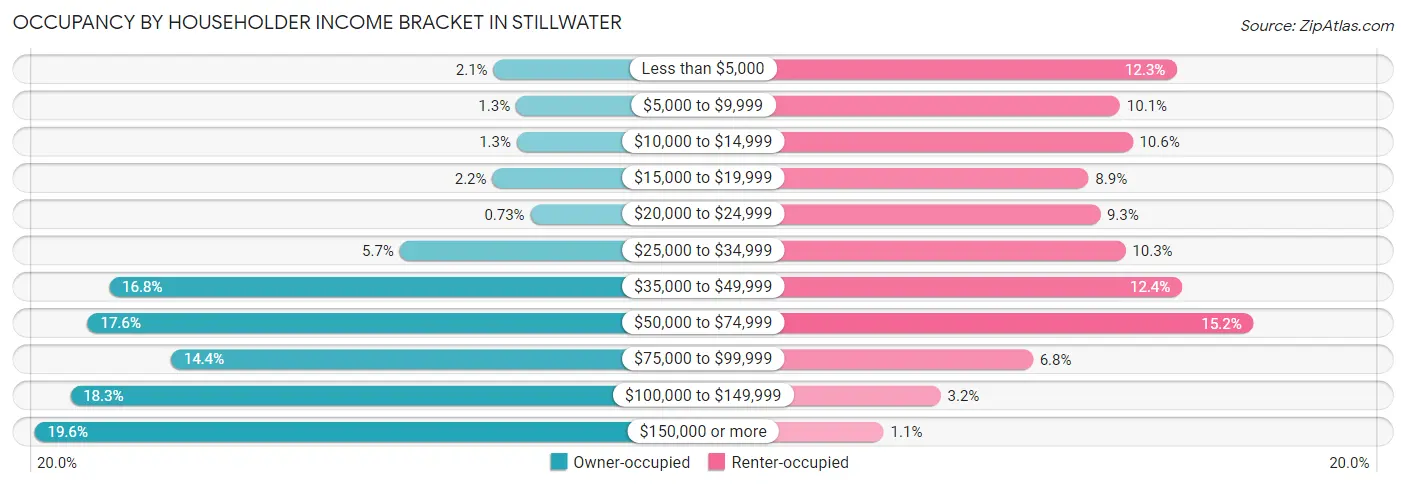
| Income Bracket | Owner-occupied | Renter-occupied |
| Less than $5,000 | 152 (2.1%) | 1,452 (12.2%) |
| $5,000 to $9,999 | 91 (1.3%) | 1,194 (10.1%) |
| $10,000 to $14,999 | 89 (1.3%) | 1,251 (10.5%) |
| $15,000 to $19,999 | 155 (2.2%) | 1,052 (8.9%) |
| $20,000 to $24,999 | 52 (0.7%) | 1,104 (9.3%) |
| $25,000 to $34,999 | 405 (5.7%) | 1,219 (10.3%) |
| $35,000 to $49,999 | 1,191 (16.8%) | 1,475 (12.4%) |
| $50,000 to $74,999 | 1,249 (17.6%) | 1,797 (15.2%) |
| $75,000 to $99,999 | 1,024 (14.4%) | 800 (6.8%) |
| $100,000 to $149,999 | 1,296 (18.3%) | 384 (3.2%) |
| $150,000 or more | 1,392 (19.6%) | 127 (1.1%) |
| Total | 7,096 (100.0%) | 11,855 (100.0%) |
Monthly Housing Cost Tiers in Stillwater
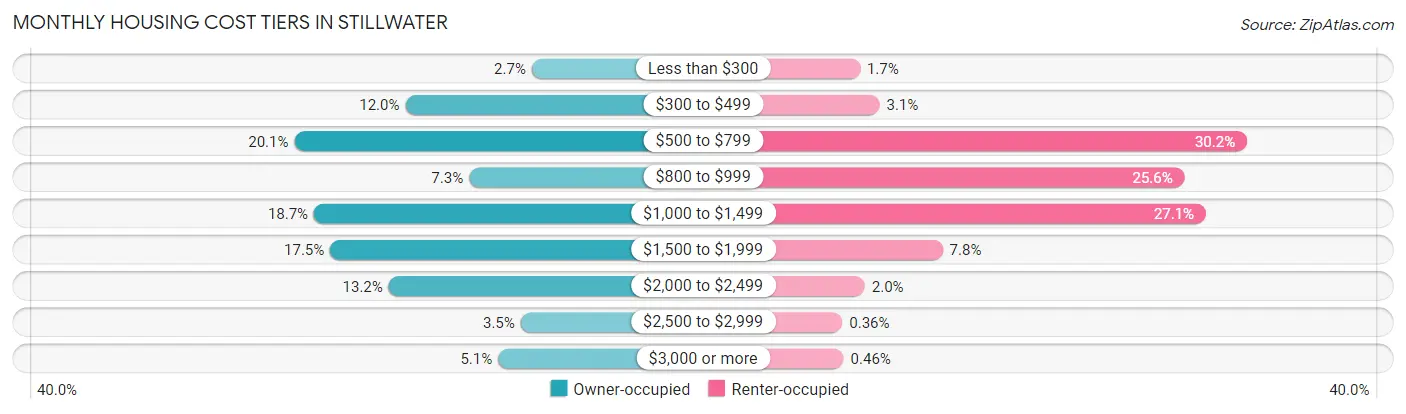
| Monthly Cost | Owner-occupied | Renter-occupied |
| Less than $300 | 188 (2.6%) | 197 (1.7%) |
| $300 to $499 | 849 (12.0%) | 367 (3.1%) |
| $500 to $799 | 1,429 (20.1%) | 3,575 (30.2%) |
| $800 to $999 | 516 (7.3%) | 3,030 (25.6%) |
| $1,000 to $1,499 | 1,326 (18.7%) | 3,217 (27.1%) |
| $1,500 to $1,999 | 1,242 (17.5%) | 919 (7.7%) |
| $2,000 to $2,499 | 936 (13.2%) | 239 (2.0%) |
| $2,500 to $2,999 | 246 (3.5%) | 43 (0.4%) |
| $3,000 or more | 364 (5.1%) | 55 (0.5%) |
| Total | 7,096 (100.0%) | 11,855 (100.0%) |
Physical Housing Characteristics in Stillwater
Housing Structures in Stillwater
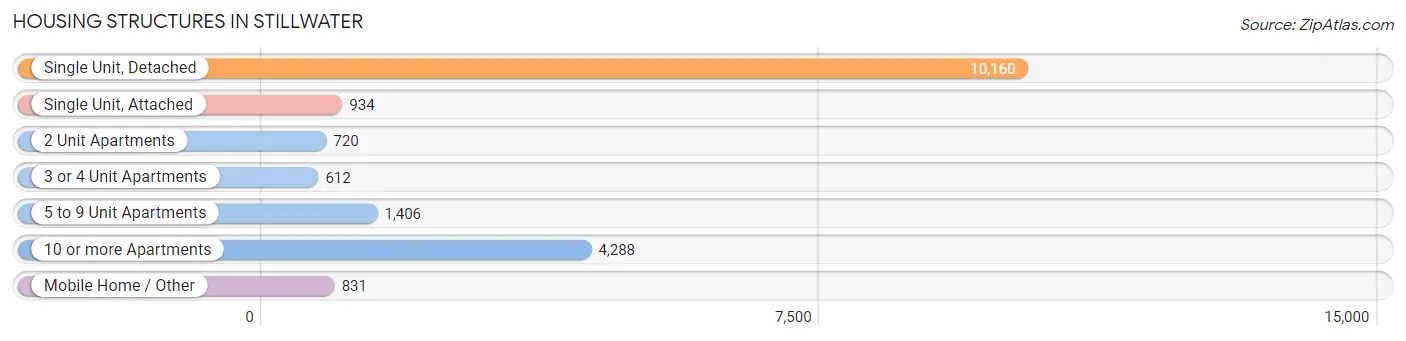
| Structure Type | # Housing Units | % Housing Units |
| Single Unit, Detached | 10,160 | 53.6% |
| Single Unit, Attached | 934 | 4.9% |
| 2 Unit Apartments | 720 | 3.8% |
| 3 or 4 Unit Apartments | 612 | 3.2% |
| 5 to 9 Unit Apartments | 1,406 | 7.4% |
| 10 or more Apartments | 4,288 | 22.6% |
| Mobile Home / Other | 831 | 4.4% |
| Total | 18,951 | 100.0% |
Housing Structures by Occupancy in Stillwater
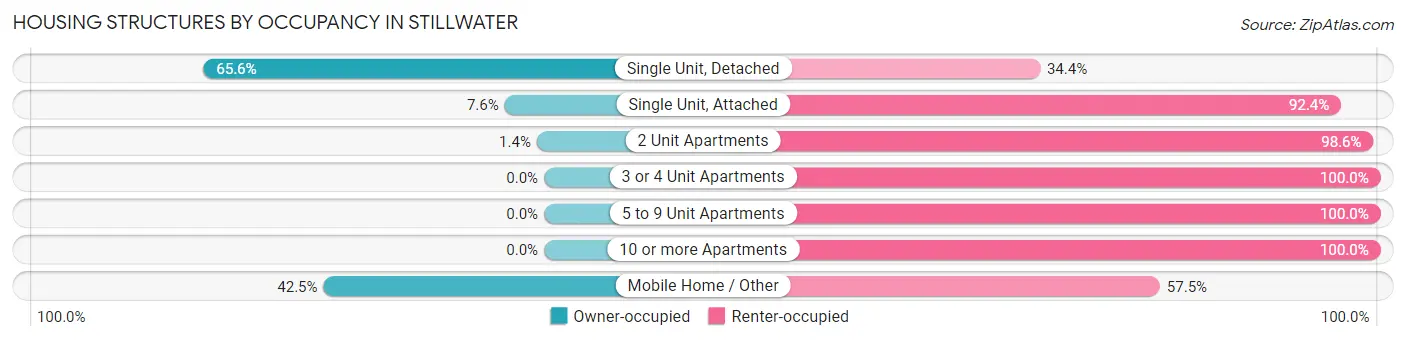
| Structure Type | Owner-occupied | Renter-occupied |
| Single Unit, Detached | 6,662 (65.6%) | 3,498 (34.4%) |
| Single Unit, Attached | 71 (7.6%) | 863 (92.4%) |
| 2 Unit Apartments | 10 (1.4%) | 710 (98.6%) |
| 3 or 4 Unit Apartments | 0 (0.0%) | 612 (100.0%) |
| 5 to 9 Unit Apartments | 0 (0.0%) | 1,406 (100.0%) |
| 10 or more Apartments | 0 (0.0%) | 4,288 (100.0%) |
| Mobile Home / Other | 353 (42.5%) | 478 (57.5%) |
| Total | 7,096 (37.4%) | 11,855 (62.6%) |
Housing Structures by Number of Rooms in Stillwater
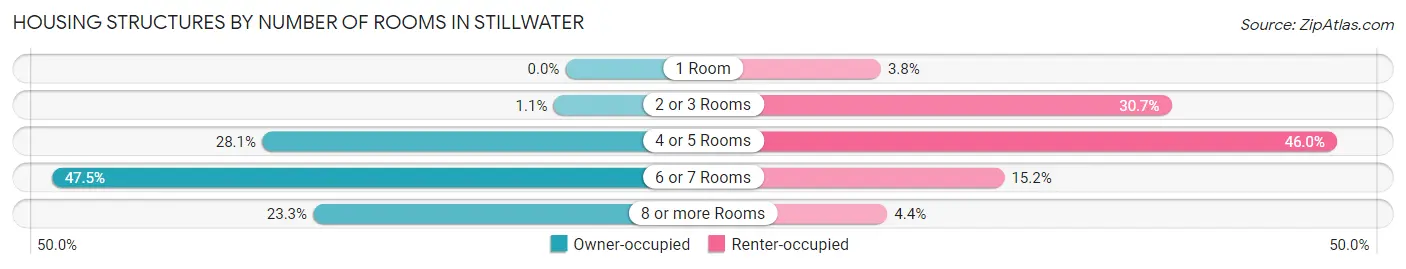
| Number of Rooms | Owner-occupied | Renter-occupied |
| 1 Room | 0 (0.0%) | 450 (3.8%) |
| 2 or 3 Rooms | 79 (1.1%) | 3,634 (30.6%) |
| 4 or 5 Rooms | 1,991 (28.1%) | 5,447 (46.0%) |
| 6 or 7 Rooms | 3,370 (47.5%) | 1,804 (15.2%) |
| 8 or more Rooms | 1,656 (23.3%) | 520 (4.4%) |
| Total | 7,096 (100.0%) | 11,855 (100.0%) |
Housing Structure by Heating Type in Stillwater
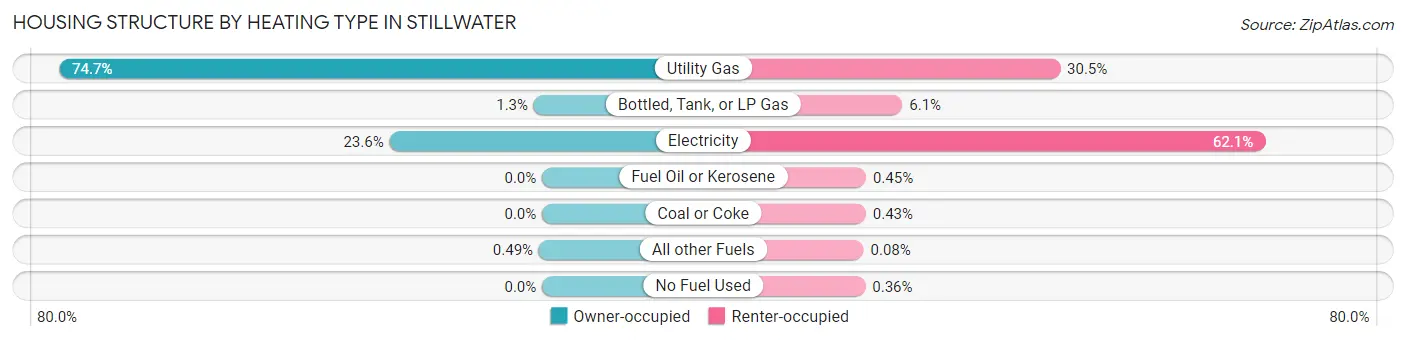
| Heating Type | Owner-occupied | Renter-occupied |
| Utility Gas | 5,297 (74.7%) | 3,611 (30.5%) |
| Bottled, Tank, or LP Gas | 90 (1.3%) | 721 (6.1%) |
| Electricity | 1,674 (23.6%) | 7,367 (62.1%) |
| Fuel Oil or Kerosene | 0 (0.0%) | 53 (0.4%) |
| Coal or Coke | 0 (0.0%) | 51 (0.4%) |
| All other Fuels | 35 (0.5%) | 9 (0.1%) |
| No Fuel Used | 0 (0.0%) | 43 (0.4%) |
| Total | 7,096 (100.0%) | 11,855 (100.0%) |
Household Vehicle Usage in Stillwater
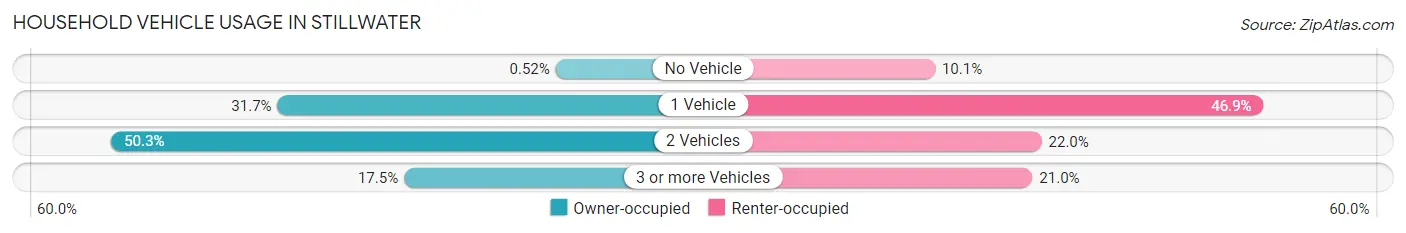
| Vehicles per Household | Owner-occupied | Renter-occupied |
| No Vehicle | 37 (0.5%) | 1,196 (10.1%) |
| 1 Vehicle | 2,248 (31.7%) | 5,558 (46.9%) |
| 2 Vehicles | 3,569 (50.3%) | 2,612 (22.0%) |
| 3 or more Vehicles | 1,242 (17.5%) | 2,489 (21.0%) |
| Total | 7,096 (100.0%) | 11,855 (100.0%) |
Real Estate & Mortgages in Stillwater
Real Estate and Mortgage Overview in Stillwater
| Characteristic | Without Mortgage | With Mortgage |
| Housing Units | 2,731 | 4,365 |
| Median Property Value | $191,400 | $237,100 |
| Median Household Income | $60,038 | $937 |
| Monthly Housing Costs | $562 | $364 |
| Real Estate Taxes | $1,815 | $167 |
Property Value by Mortgage Status in Stillwater
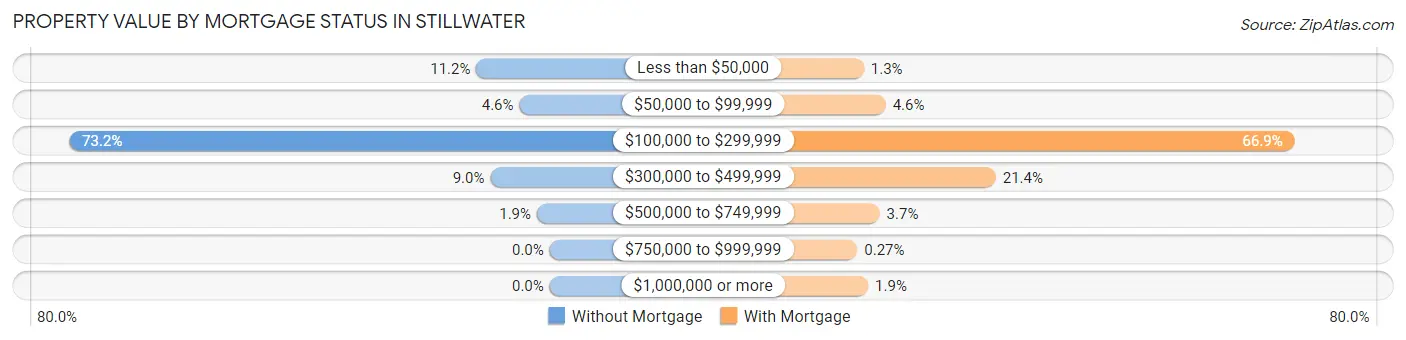
| Property Value | Without Mortgage | With Mortgage |
| Less than $50,000 | 305 (11.2%) | 55 (1.3%) |
| $50,000 to $99,999 | 126 (4.6%) | 201 (4.6%) |
| $100,000 to $299,999 | 2,000 (73.2%) | 2,920 (66.9%) |
| $300,000 to $499,999 | 247 (9.0%) | 933 (21.4%) |
| $500,000 to $749,999 | 53 (1.9%) | 160 (3.7%) |
| $750,000 to $999,999 | 0 (0.0%) | 12 (0.3%) |
| $1,000,000 or more | 0 (0.0%) | 84 (1.9%) |
| Total | 2,731 (100.0%) | 4,365 (100.0%) |
Household Income by Mortgage Status in Stillwater
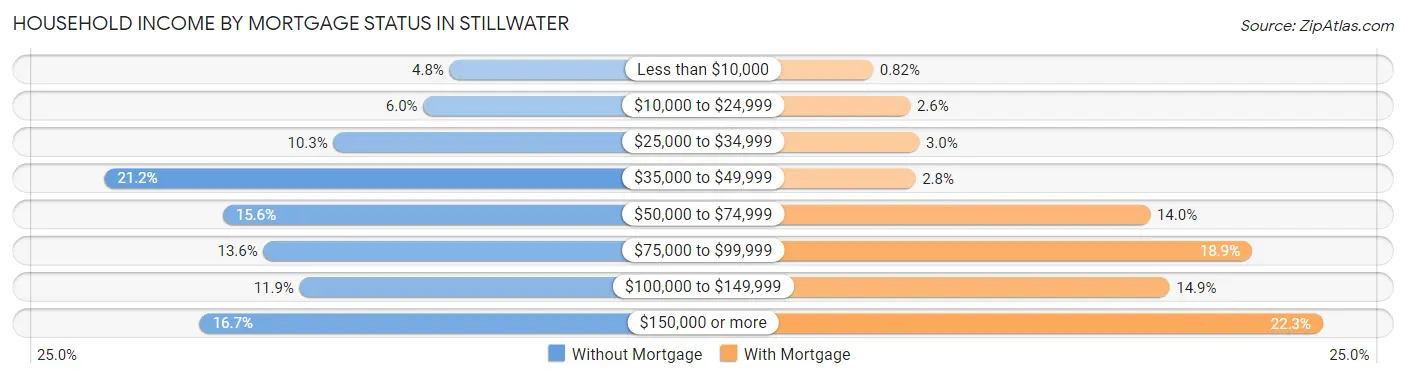
| Household Income | Without Mortgage | With Mortgage |
| Less than $10,000 | 130 (4.8%) | 36 (0.8%) |
| $10,000 to $24,999 | 164 (6.0%) | 113 (2.6%) |
| $25,000 to $34,999 | 281 (10.3%) | 132 (3.0%) |
| $35,000 to $49,999 | 579 (21.2%) | 124 (2.8%) |
| $50,000 to $74,999 | 425 (15.6%) | 612 (14.0%) |
| $75,000 to $99,999 | 372 (13.6%) | 824 (18.9%) |
| $100,000 to $149,999 | 325 (11.9%) | 652 (14.9%) |
| $150,000 or more | 455 (16.7%) | 971 (22.3%) |
| Total | 2,731 (100.0%) | 4,365 (100.0%) |
Property Value to Household Income Ratio in Stillwater
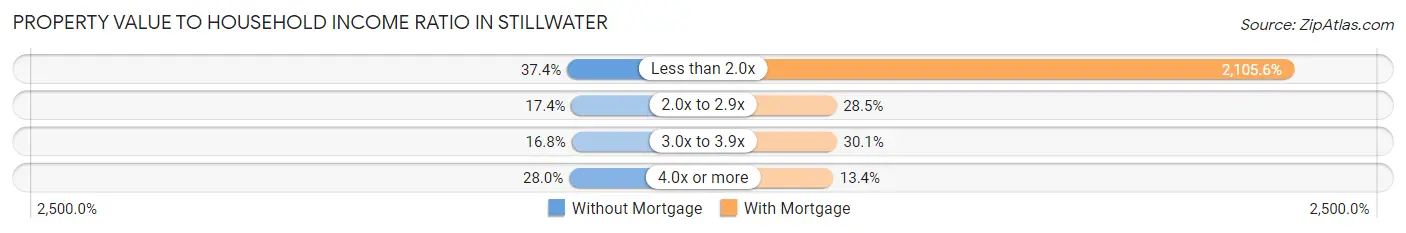
| Value-to-Income Ratio | Without Mortgage | With Mortgage |
| Less than 2.0x | 1,021 (37.4%) | 91,911 (2,105.6%) |
| 2.0x to 2.9x | 476 (17.4%) | 1,243 (28.5%) |
| 3.0x to 3.9x | 460 (16.8%) | 1,314 (30.1%) |
| 4.0x or more | 765 (28.0%) | 585 (13.4%) |
| Total | 2,731 (100.0%) | 4,365 (100.0%) |
Real Estate Taxes by Mortgage Status in Stillwater
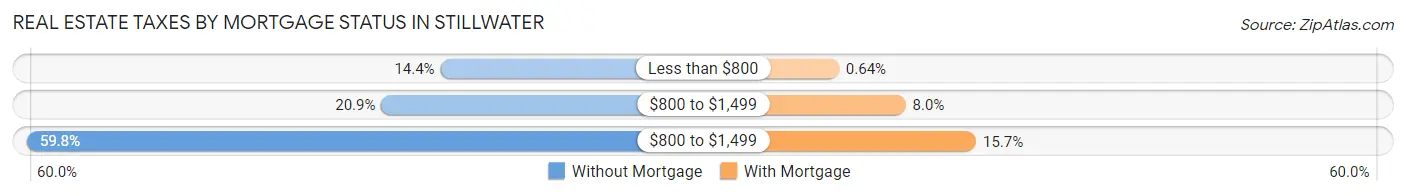
| Property Taxes | Without Mortgage | With Mortgage |
| Less than $800 | 394 (14.4%) | 28 (0.6%) |
| $800 to $1,499 | 571 (20.9%) | 347 (8.0%) |
| $800 to $1,499 | 1,632 (59.8%) | 684 (15.7%) |
| Total | 2,731 (100.0%) | 4,365 (100.0%) |
Health & Disability in Stillwater
Health Insurance Coverage by Age in Stillwater
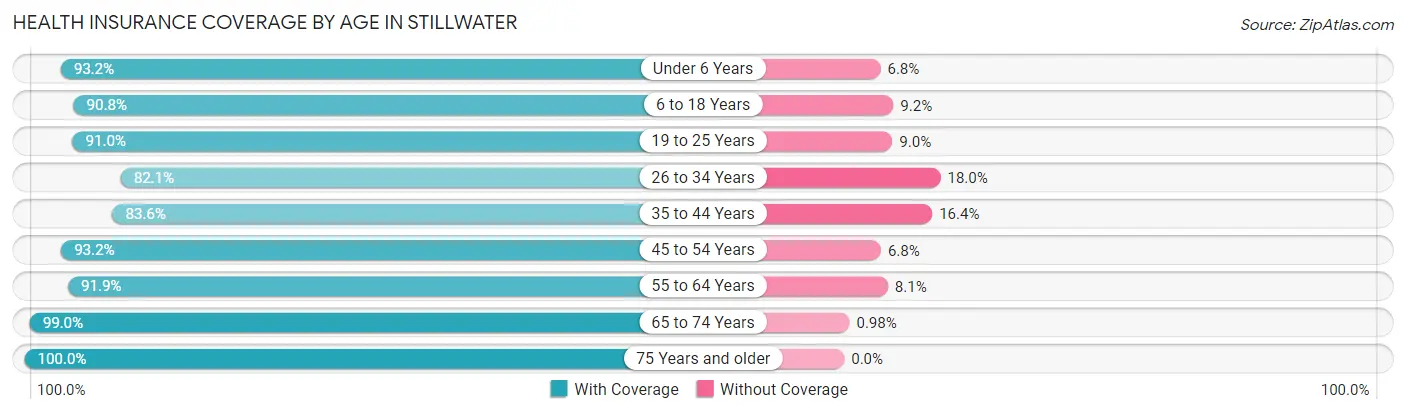
| Age Bracket | With Coverage | Without Coverage |
| Under 6 Years | 2,263 (93.2%) | 164 (6.8%) |
| 6 to 18 Years | 6,971 (90.8%) | 703 (9.2%) |
| 19 to 25 Years | 16,088 (91.0%) | 1,586 (9.0%) |
| 26 to 34 Years | 4,416 (82.1%) | 966 (17.9%) |
| 35 to 44 Years | 3,705 (83.6%) | 727 (16.4%) |
| 45 to 54 Years | 2,722 (93.2%) | 200 (6.8%) |
| 55 to 64 Years | 2,699 (91.9%) | 239 (8.1%) |
| 65 to 74 Years | 2,437 (99.0%) | 24 (1.0%) |
| 75 Years and older | 2,124 (100.0%) | 0 (0.0%) |
| Total | 43,425 (90.4%) | 4,609 (9.6%) |
Health Insurance Coverage by Citizenship Status in Stillwater
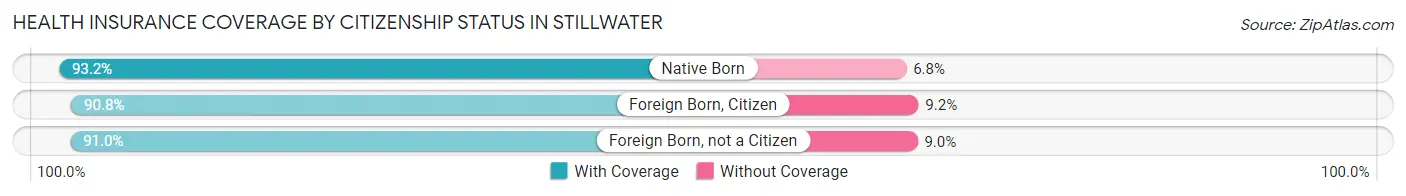
| Citizenship Status | With Coverage | Without Coverage |
| Native Born | 2,263 (93.2%) | 164 (6.8%) |
| Foreign Born, Citizen | 6,971 (90.8%) | 703 (9.2%) |
| Foreign Born, not a Citizen | 16,088 (91.0%) | 1,586 (9.0%) |
Health Insurance Coverage by Household Income in Stillwater
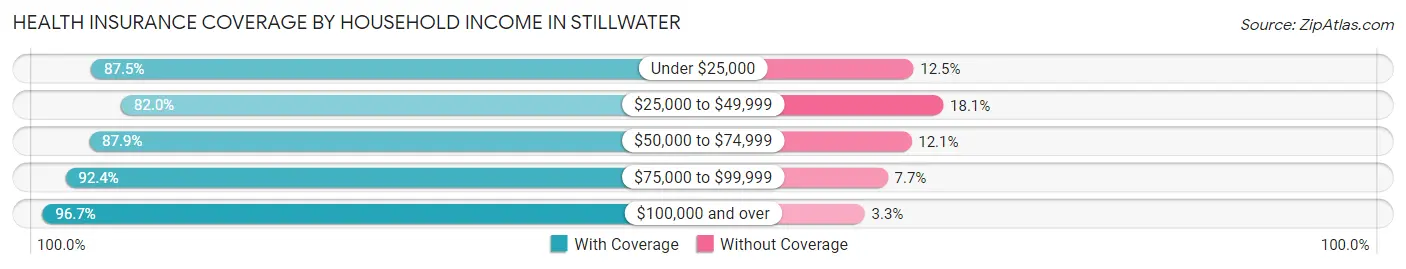
| Household Income | With Coverage | Without Coverage |
| Under $25,000 | 9,383 (87.5%) | 1,337 (12.5%) |
| $25,000 to $49,999 | 7,211 (82.0%) | 1,588 (18.0%) |
| $50,000 to $74,999 | 5,951 (87.9%) | 818 (12.1%) |
| $75,000 to $99,999 | 3,743 (92.3%) | 310 (7.6%) |
| $100,000 and over | 9,299 (96.7%) | 321 (3.3%) |
Public vs Private Health Insurance Coverage by Age in Stillwater
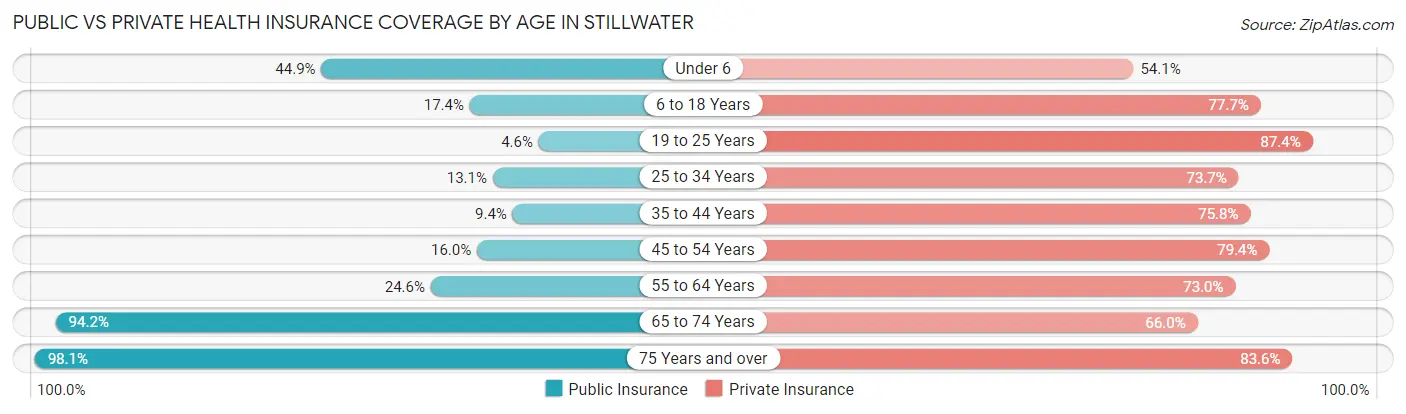
| Age Bracket | Public Insurance | Private Insurance |
| Under 6 | 1,090 (44.9%) | 1,314 (54.1%) |
| 6 to 18 Years | 1,333 (17.4%) | 5,966 (77.7%) |
| 19 to 25 Years | 804 (4.5%) | 15,443 (87.4%) |
| 25 to 34 Years | 705 (13.1%) | 3,964 (73.7%) |
| 35 to 44 Years | 417 (9.4%) | 3,360 (75.8%) |
| 45 to 54 Years | 468 (16.0%) | 2,319 (79.4%) |
| 55 to 64 Years | 723 (24.6%) | 2,146 (73.0%) |
| 65 to 74 Years | 2,319 (94.2%) | 1,625 (66.0%) |
| 75 Years and over | 2,084 (98.1%) | 1,776 (83.6%) |
| Total | 9,943 (20.7%) | 37,913 (78.9%) |
Disability Status by Sex by Age in Stillwater
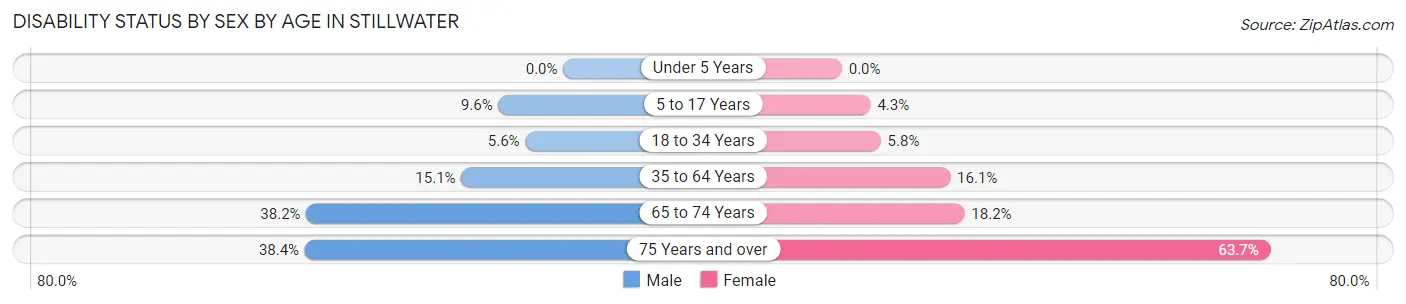
| Age Bracket | Male | Female |
| Under 5 Years | 0 (0.0%) | 0 (0.0%) |
| 5 to 17 Years | 263 (9.6%) | 105 (4.3%) |
| 18 to 34 Years | 772 (5.6%) | 711 (5.8%) |
| 35 to 64 Years | 794 (15.1%) | 812 (16.1%) |
| 65 to 74 Years | 388 (38.2%) | 263 (18.2%) |
| 75 Years and over | 269 (38.4%) | 906 (63.7%) |
Disability Class by Sex by Age in Stillwater
Disability Class: Hearing Difficulty
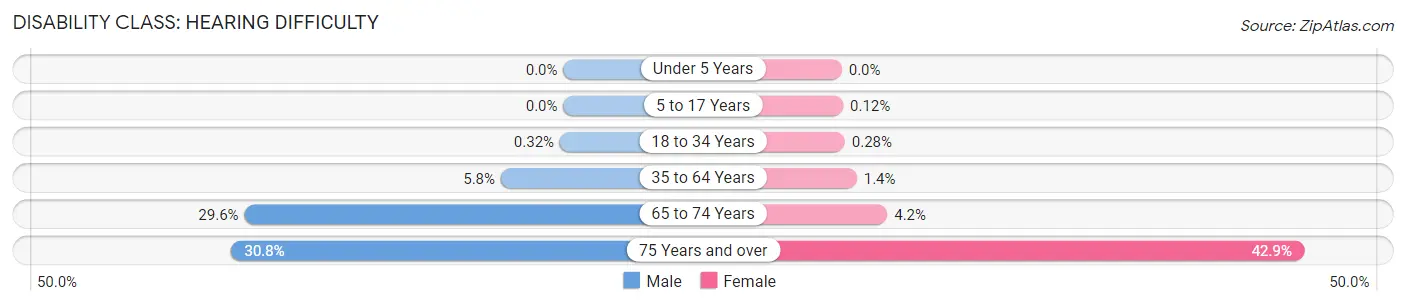
| Age Bracket | Male | Female |
| Under 5 Years | 0 (0.0%) | 0 (0.0%) |
| 5 to 17 Years | 0 (0.0%) | 3 (0.1%) |
| 18 to 34 Years | 44 (0.3%) | 34 (0.3%) |
| 35 to 64 Years | 304 (5.8%) | 70 (1.4%) |
| 65 to 74 Years | 301 (29.6%) | 61 (4.2%) |
| 75 Years and over | 216 (30.8%) | 610 (42.9%) |
Disability Class: Vision Difficulty
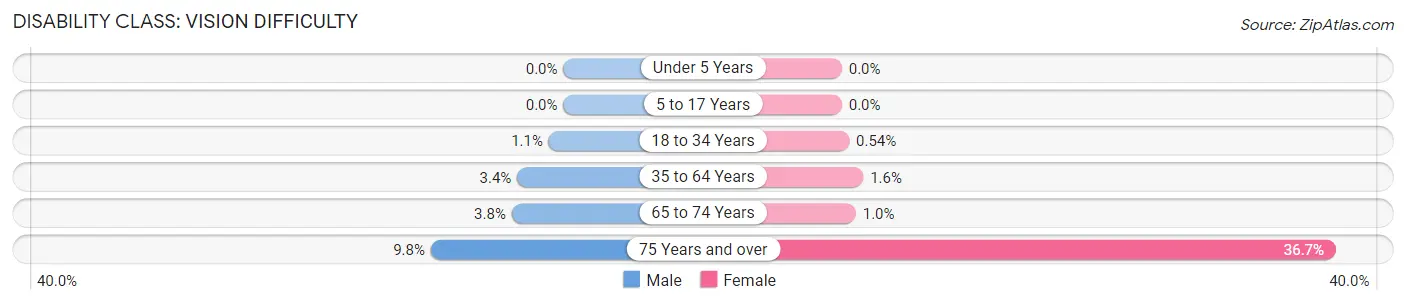
| Age Bracket | Male | Female |
| Under 5 Years | 0 (0.0%) | 0 (0.0%) |
| 5 to 17 Years | 0 (0.0%) | 0 (0.0%) |
| 18 to 34 Years | 148 (1.1%) | 67 (0.5%) |
| 35 to 64 Years | 180 (3.4%) | 80 (1.6%) |
| 65 to 74 Years | 39 (3.8%) | 15 (1.0%) |
| 75 Years and over | 69 (9.8%) | 522 (36.7%) |
Disability Class: Cognitive Difficulty
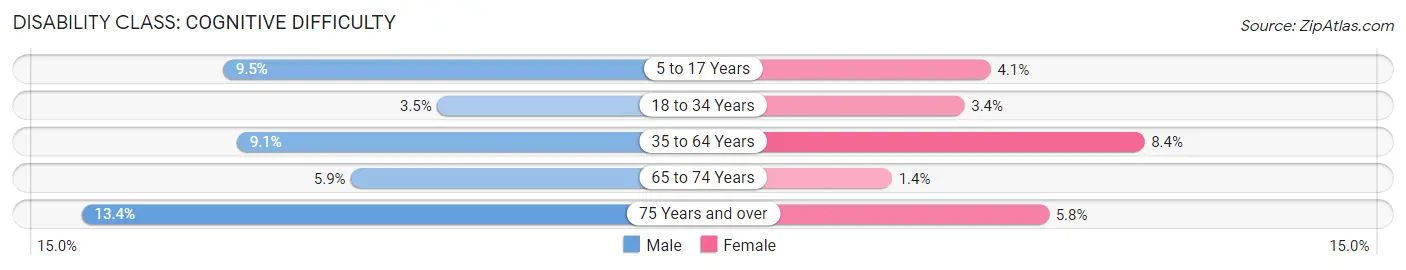
| Age Bracket | Male | Female |
| 5 to 17 Years | 259 (9.5%) | 102 (4.1%) |
| 18 to 34 Years | 480 (3.5%) | 421 (3.4%) |
| 35 to 64 Years | 477 (9.1%) | 425 (8.4%) |
| 65 to 74 Years | 60 (5.9%) | 20 (1.4%) |
| 75 Years and over | 94 (13.4%) | 82 (5.8%) |
Disability Class: Ambulatory Difficulty
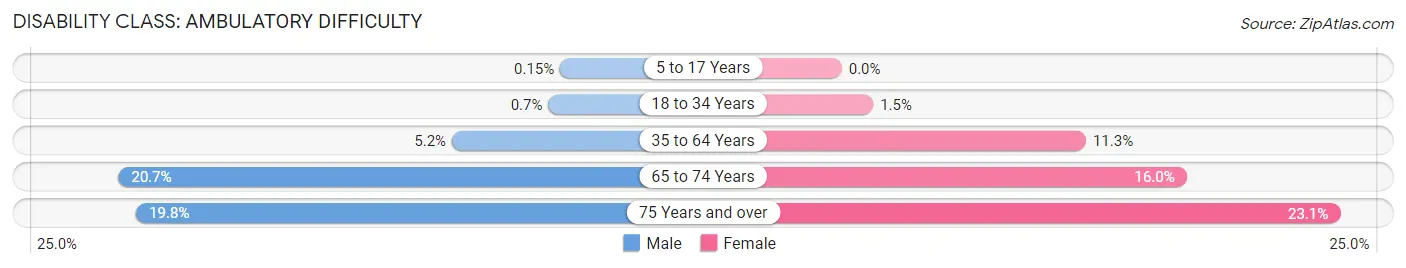
| Age Bracket | Male | Female |
| 5 to 17 Years | 4 (0.2%) | 0 (0.0%) |
| 18 to 34 Years | 96 (0.7%) | 180 (1.5%) |
| 35 to 64 Years | 271 (5.2%) | 572 (11.3%) |
| 65 to 74 Years | 210 (20.6%) | 231 (16.0%) |
| 75 Years and over | 139 (19.8%) | 329 (23.1%) |
Disability Class: Self-Care Difficulty
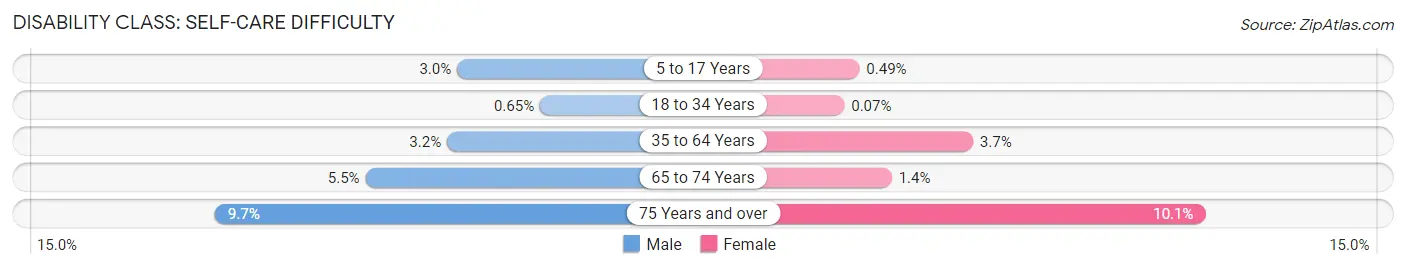
| Age Bracket | Male | Female |
| 5 to 17 Years | 81 (3.0%) | 12 (0.5%) |
| 18 to 34 Years | 89 (0.6%) | 9 (0.1%) |
| 35 to 64 Years | 170 (3.2%) | 184 (3.6%) |
| 65 to 74 Years | 56 (5.5%) | 20 (1.4%) |
| 75 Years and over | 68 (9.7%) | 144 (10.1%) |
Technology Access in Stillwater
Computing Device Access in Stillwater
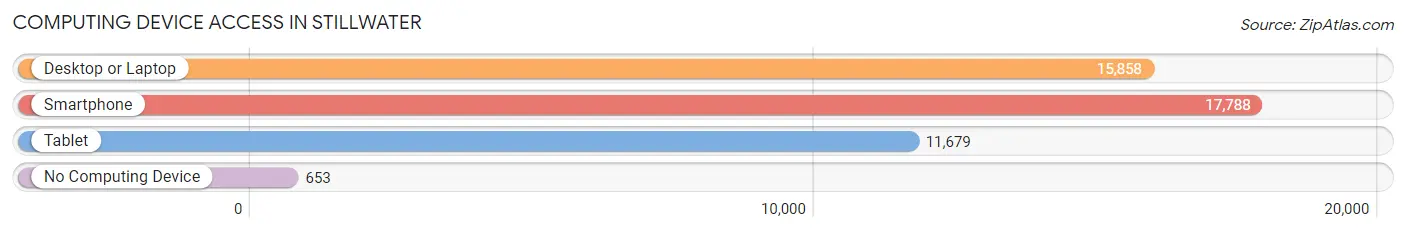
| Device Type | # Households | % Households |
| Desktop or Laptop | 15,858 | 83.7% |
| Smartphone | 17,788 | 93.9% |
| Tablet | 11,679 | 61.6% |
| No Computing Device | 653 | 3.5% |
| Total | 18,951 | 100.0% |
Internet Access in Stillwater
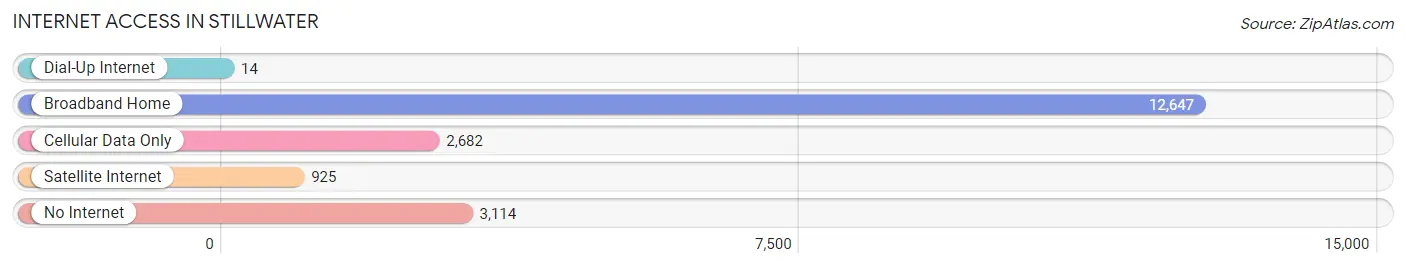
| Internet Type | # Households | % Households |
| Dial-Up Internet | 14 | 0.1% |
| Broadband Home | 12,647 | 66.7% |
| Cellular Data Only | 2,682 | 14.1% |
| Satellite Internet | 925 | 4.9% |
| No Internet | 3,114 | 16.4% |
| Total | 18,951 | 100.0% |
Stillwater Summary
Stillwater, Oklahoma is a city located in Payne County, Oklahoma. It is the county seat of Payne County and is located in the northeastern part of the state. The city is home to Oklahoma State University, which is the largest university in the state. As of the 2010 census, the population of Stillwater was 45,688, making it the tenth largest city in Oklahoma.
History
The area that is now Stillwater was first settled in 1884 by a group of settlers from Iowa. The settlers named the area Stillwater because of the numerous springs and creeks in the area. The town was officially incorporated in 1889 and was named the county seat of Payne County in 1890.
In the early 1900s, Stillwater began to grow rapidly due to the arrival of the railroad. The railroad allowed for the transportation of goods and people to and from the city. This growth was further accelerated by the establishment of Oklahoma A&M College (now Oklahoma State University) in 1890. The college brought a large influx of students and faculty to the city, which helped to spur economic growth.
In the 1950s, Stillwater began to experience a period of rapid growth. This growth was due to the city’s location on the newly constructed Interstate 35, which connected Stillwater to Oklahoma City and Tulsa. This allowed for an increase in tourism and business development in the city.
Geography
Stillwater is located in the northeastern part of Oklahoma, in Payne County. The city is situated on the banks of the Stillwater Creek, which is a tributary of the Cimarron River. The city is located approximately 85 miles northeast of Oklahoma City and approximately 90 miles northwest of Tulsa.
The city has a total area of 24.3 square miles, of which 24.2 square miles is land and 0.1 square miles is water. The city is located in a region of rolling hills and is surrounded by farmland.
Economy
Stillwater’s economy is largely driven by Oklahoma State University, which is the largest employer in the city. Other major employers in the city include Stillwater Medical Center, Stillwater Public Schools, and the City of Stillwater.
The city is also home to a number of manufacturing companies, including ConocoPhillips, Cargill, and Tyson Foods. The city is also home to a number of technology companies, including Microsoft, Oracle, and Dell.
Demographics
As of the 2010 census, the population of Stillwater was 45,688. The racial makeup of the city was 79.2% White, 8.2% African American, 4.3% Native American, 2.7% Asian, 0.2% Pacific Islander, and 4.4% from other races. Hispanic or Latino of any race were 8.3% of the population.
The median income for a household in the city was $35,945, and the median income for a family was $50,945. The per capita income for the city was $20,945. About 14.2% of the population was below the poverty line.
Common Questions
What is Per Capita Income in Stillwater?
Per Capita income in Stillwater is $24,801.
What is the Median Family Income in Stillwater?
Median Family Income in Stillwater is $73,531.
What is the Median Household income in Stillwater?
Median Household Income in Stillwater is $39,998.
What is Income or Wage Gap in Stillwater?
Income or Wage Gap in Stillwater is 40.7%.
Women in Stillwater earn 59.3 cents for every dollar earned by a man.
What is Family Income Deficit in Stillwater?
Family Income Deficit in Stillwater is $10,504.
Families that are below poverty line in Stillwater earn $10,504 less on average than the poverty threshold level.
What is Inequality or Gini Index in Stillwater?
Inequality or Gini Index in Stillwater is 0.53.
What is the Total Population of Stillwater?
Total Population of Stillwater is 48,644.
What is the Total Male Population of Stillwater?
Total Male Population of Stillwater is 24,799.
What is the Total Female Population of Stillwater?
Total Female Population of Stillwater is 23,845.
What is the Ratio of Males per 100 Females in Stillwater?
There are 104.00 Males per 100 Females in Stillwater.
What is the Ratio of Females per 100 Males in Stillwater?
There are 96.15 Females per 100 Males in Stillwater.
What is the Median Population Age in Stillwater?
Median Population Age in Stillwater is 23.4 Years.
What is the Average Family Size in Stillwater
Average Family Size in Stillwater is 2.8 People.
What is the Average Household Size in Stillwater
Average Household Size in Stillwater is 2.1 People.
How Large is the Labor Force in Stillwater?
There are 23,914 People in the Labor Forcein in Stillwater.
What is the Percentage of People in the Labor Force in Stillwater?
56.7% of People are in the Labor Force in Stillwater.
What is the Unemployment Rate in Stillwater?
Unemployment Rate in Stillwater is 5.3%.