Stafford, TX Map & Demographics
Stafford Map
Stafford Overview
$37,617
PER CAPITA INCOME
$97,853
AVG FAMILY INCOME
$87,245
AVG HOUSEHOLD INCOME
21.4%
WAGE / INCOME GAP [ % ]
78.6¢/ $1
WAGE / INCOME GAP [ $ ]
$12,054
FAMILY INCOME DEFICIT
0.38
INEQUALITY / GINI INDEX
17,240
TOTAL POPULATION
8,882
MALE POPULATION
8,358
FEMALE POPULATION
106.27
MALES / 100 FEMALES
94.10
FEMALES / 100 MALES
32.6
MEDIAN AGE
3.2
AVG FAMILY SIZE
2.7
AVG HOUSEHOLD SIZE
10,164
LABOR FORCE [ PEOPLE ]
74.7%
PERCENT IN LABOR FORCE
3.9%
UNEMPLOYMENT RATE
Stafford Zip Codes
Income in Stafford
Income Overview in Stafford
Per Capita Income in Stafford is $37,617, while median incomes of families and households are $97,853 and $87,245 respectively.
| Characteristic | Number | Measure |
| Per Capita Income | 17,240 | $37,617 |
| Median Family Income | 4,377 | $97,853 |
| Mean Family Income | 4,377 | $109,497 |
| Median Household Income | 6,458 | $87,245 |
| Mean Household Income | 6,458 | $98,628 |
| Income Deficit | 4,377 | $12,054 |
| Wage / Income Gap (%) | 17,240 | 21.38% |
| Wage / Income Gap ($) | 17,240 | 78.62¢ per $1 |
| Gini / Inequality Index | 17,240 | 0.38 |
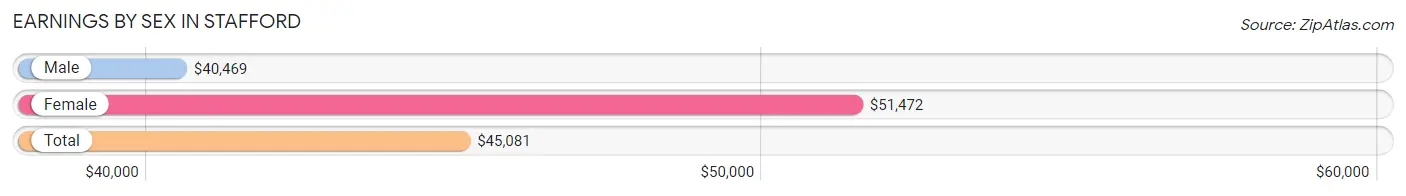
Earnings by Sex in Stafford
Average Earnings in Stafford are $45,081, $40,469 for men and $51,472 for women, a difference of 21.4%.
| Sex | Number | Average Earnings |
| Male | 5,384 (52.0%) | $40,469 |
| Female | 4,967 (48.0%) | $51,472 |
| Total | 10,351 (100.0%) | $45,081 |
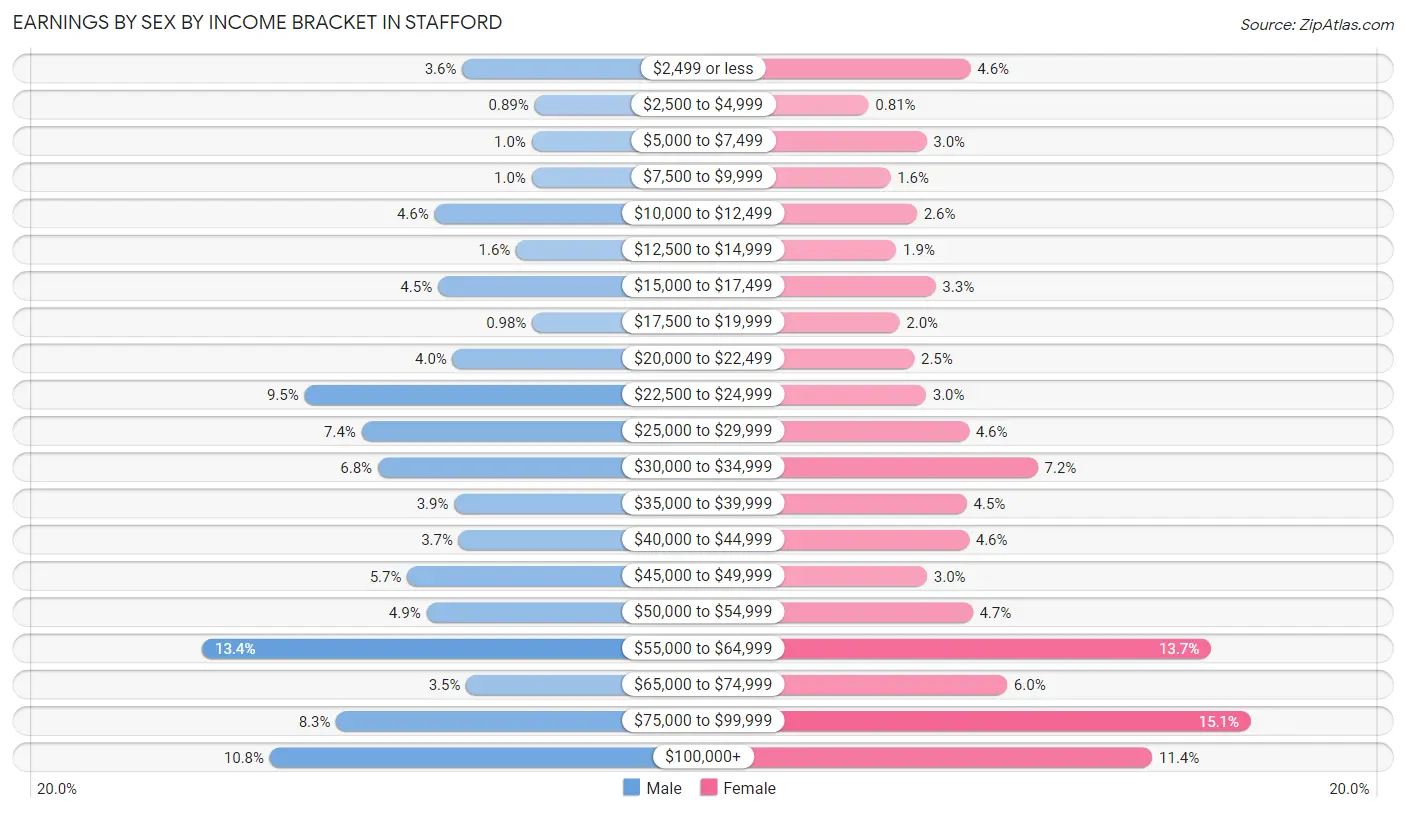
Earnings by Sex by Income Bracket in Stafford
The most common earnings brackets in Stafford are $55,000 to $64,999 for men (719 | 13.4%) and $75,000 to $99,999 for women (752 | 15.1%).
| Income | Male | Female |
| $2,499 or less | 194 (3.6%) | 230 (4.6%) |
| $2,500 to $4,999 | 48 (0.9%) | 40 (0.8%) |
| $5,000 to $7,499 | 54 (1.0%) | 148 (3.0%) |
| $7,500 to $9,999 | 54 (1.0%) | 81 (1.6%) |
| $10,000 to $12,499 | 250 (4.6%) | 130 (2.6%) |
| $12,500 to $14,999 | 85 (1.6%) | 92 (1.8%) |
| $15,000 to $17,499 | 243 (4.5%) | 165 (3.3%) |
| $17,500 to $19,999 | 53 (1.0%) | 98 (2.0%) |
| $20,000 to $22,499 | 213 (4.0%) | 125 (2.5%) |
| $22,500 to $24,999 | 512 (9.5%) | 147 (3.0%) |
| $25,000 to $29,999 | 397 (7.4%) | 227 (4.6%) |
| $30,000 to $34,999 | 364 (6.8%) | 355 (7.1%) |
| $35,000 to $39,999 | 210 (3.9%) | 223 (4.5%) |
| $40,000 to $44,999 | 201 (3.7%) | 227 (4.6%) |
| $45,000 to $49,999 | 305 (5.7%) | 149 (3.0%) |
| $50,000 to $54,999 | 266 (4.9%) | 234 (4.7%) |
| $55,000 to $64,999 | 719 (13.4%) | 678 (13.7%) |
| $65,000 to $74,999 | 186 (3.5%) | 298 (6.0%) |
| $75,000 to $99,999 | 448 (8.3%) | 752 (15.1%) |
| $100,000+ | 582 (10.8%) | 568 (11.4%) |
| Total | 5,384 (100.0%) | 4,967 (100.0%) |
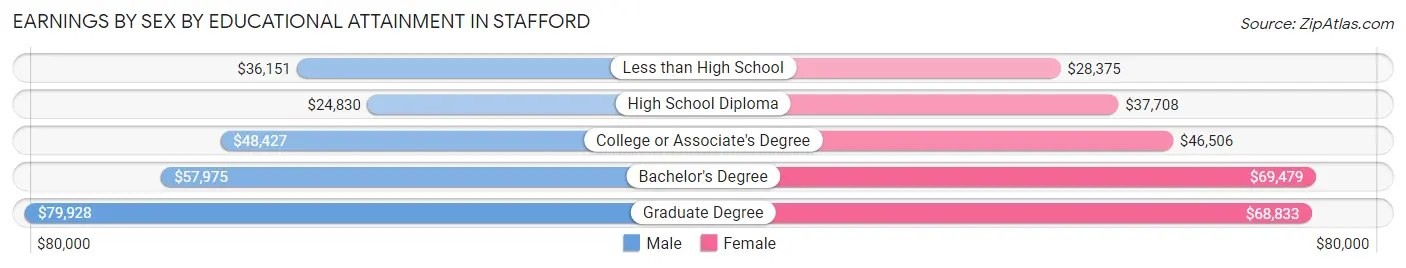
Earnings by Sex by Educational Attainment in Stafford
Average earnings in Stafford are $46,539 for men and $55,996 for women, a difference of 16.9%. Men with an educational attainment of graduate degree enjoy the highest average annual earnings of $79,928, while those with high school diploma education earn the least with $24,830. Women with an educational attainment of bachelor's degree earn the most with the average annual earnings of $69,479, while those with less than high school education have the smallest earnings of $28,375.
| Educational Attainment | Male Income | Female Income |
| Less than High School | $36,151 | $28,375 |
| High School Diploma | $24,830 | $37,708 |
| College or Associate's Degree | $48,427 | $46,506 |
| Bachelor's Degree | $57,975 | $69,479 |
| Graduate Degree | $79,928 | $68,833 |
| Total | $46,539 | $55,996 |
Family Income in Stafford
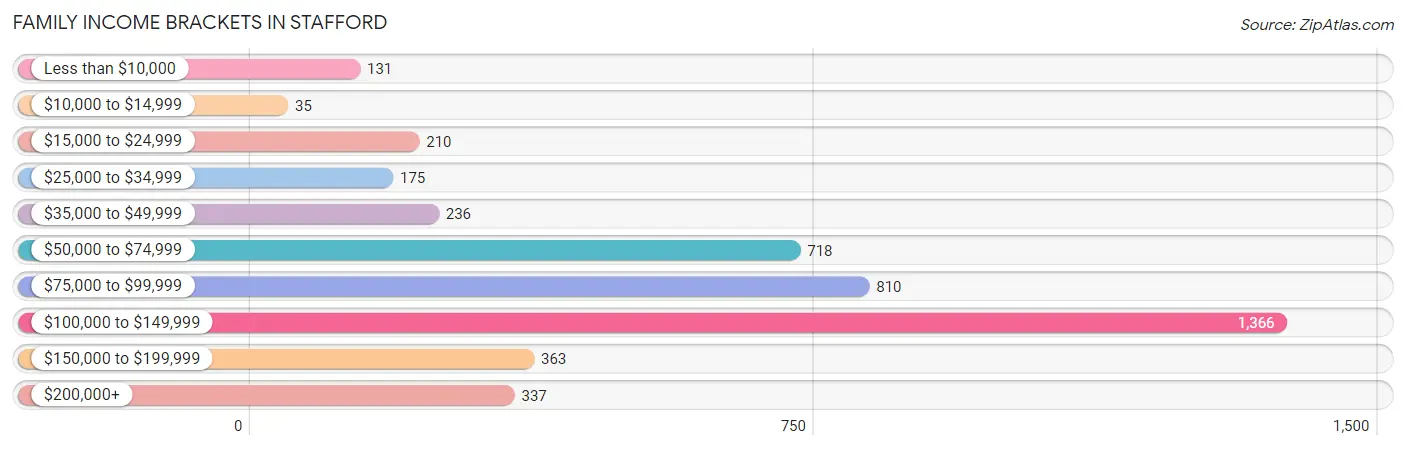
Family Income Brackets in Stafford
According to the Stafford family income data, there are 1,366 families falling into the $100,000 to $149,999 income range, which is the most common income bracket and makes up 31.2% of all families. Conversely, the $10,000 to $14,999 income bracket is the least frequent group with only 35 families (0.8%) belonging to this category.
| Income Bracket | # Families | % Families |
| Less than $10,000 | 131 | 3.0% |
| $10,000 to $14,999 | 35 | 0.8% |
| $15,000 to $24,999 | 210 | 4.8% |
| $25,000 to $34,999 | 175 | 4.0% |
| $35,000 to $49,999 | 236 | 5.4% |
| $50,000 to $74,999 | 718 | 16.4% |
| $75,000 to $99,999 | 810 | 18.5% |
| $100,000 to $149,999 | 1,366 | 31.2% |
| $150,000 to $199,999 | 363 | 8.3% |
| $200,000+ | 337 | 7.7% |
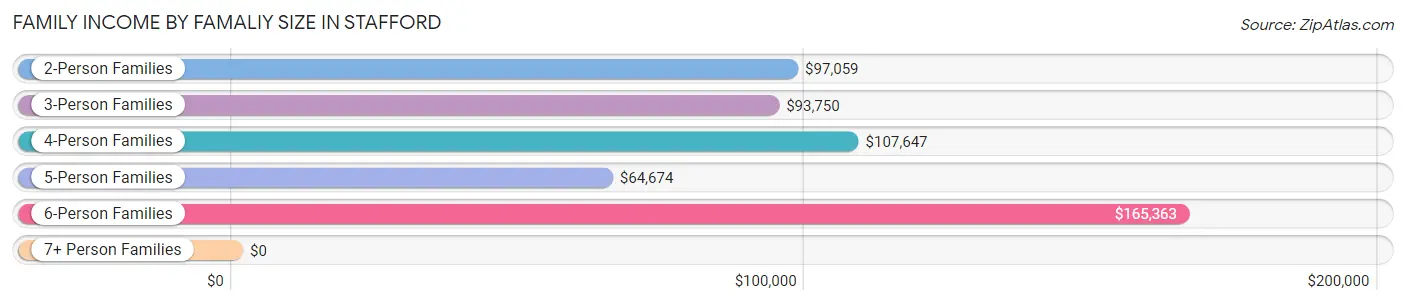
Family Income by Famaliy Size in Stafford
6-person families (134 | 3.1%) account for the highest median family income in Stafford with $165,363 per family, while 2-person families (1,454 | 33.2%) have the highest median income of $48,530 per family member.
| Income Bracket | # Families | Median Income |
| 2-Person Families | 1,454 (33.2%) | $97,059 |
| 3-Person Families | 1,430 (32.7%) | $93,750 |
| 4-Person Families | 1,064 (24.3%) | $107,647 |
| 5-Person Families | 236 (5.4%) | $64,674 |
| 6-Person Families | 134 (3.1%) | $165,363 |
| 7+ Person Families | 59 (1.3%) | $0 |
| Total | 4,377 (100.0%) | $97,853 |
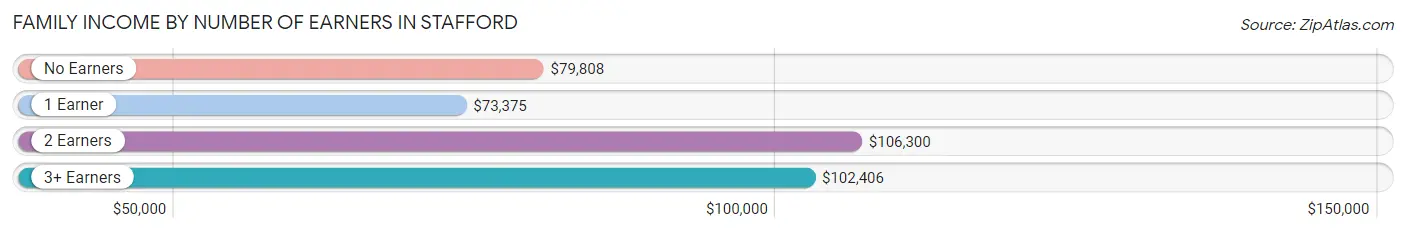
Family Income by Number of Earners in Stafford
The median family income in Stafford is $97,853, with families comprising 2 earners (1,850) having the highest median family income of $106,300, while families with 1 earner (1,670) have the lowest median family income of $73,375, accounting for 42.3% and 38.2% of families, respectively.
| Number of Earners | # Families | Median Income |
| No Earners | 218 (5.0%) | $79,808 |
| 1 Earner | 1,670 (38.2%) | $73,375 |
| 2 Earners | 1,850 (42.3%) | $106,300 |
| 3+ Earners | 639 (14.6%) | $102,406 |
| Total | 4,377 (100.0%) | $97,853 |
Household Income in Stafford
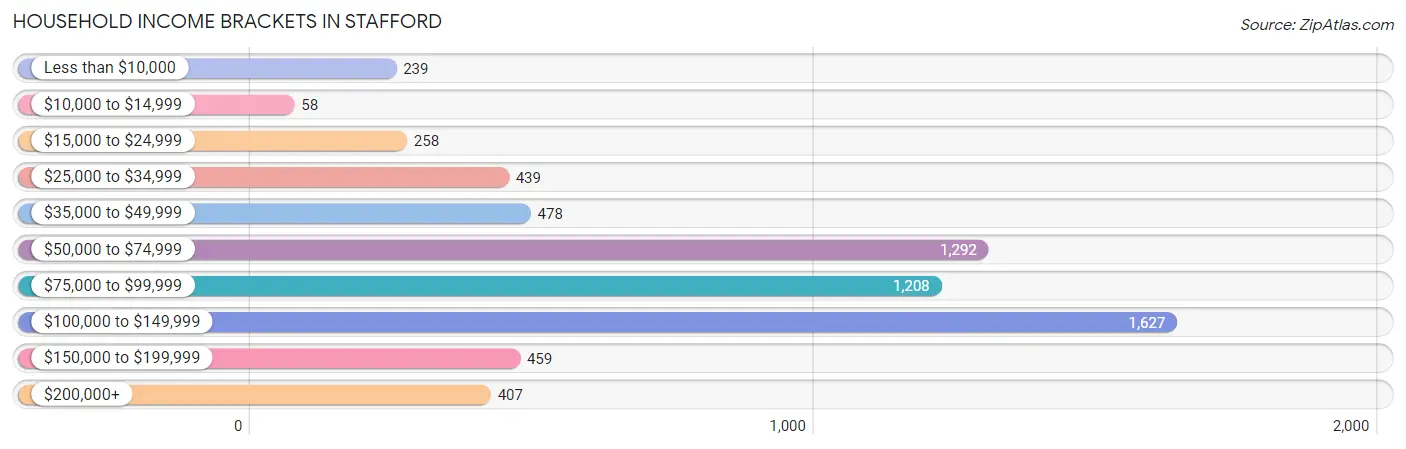
Household Income Brackets in Stafford
With 1,627 households falling in the category, the $100,000 to $149,999 income range is the most frequent in Stafford, accounting for 25.2% of all households. In contrast, only 58 households (0.9%) fall into the $10,000 to $14,999 income bracket, making it the least populous group.
| Income Bracket | # Households | % Households |
| Less than $10,000 | 239 | 3.7% |
| $10,000 to $14,999 | 58 | 0.9% |
| $15,000 to $24,999 | 258 | 4.0% |
| $25,000 to $34,999 | 439 | 6.8% |
| $35,000 to $49,999 | 478 | 7.4% |
| $50,000 to $74,999 | 1,292 | 20.0% |
| $75,000 to $99,999 | 1,208 | 18.7% |
| $100,000 to $149,999 | 1,627 | 25.2% |
| $150,000 to $199,999 | 459 | 7.1% |
| $200,000+ | 407 | 6.3% |
Household Income by Householder Age in Stafford
The median household income in Stafford is $87,245, with the highest median household income of $98,852 found in the 25 to 44 years age bracket for the primary householder. A total of 2,728 households (42.2%) fall into this category. Meanwhile, the 15 to 24 years age bracket for the primary householder has the lowest median household income of $50,811, with 420 households (6.5%) in this group.
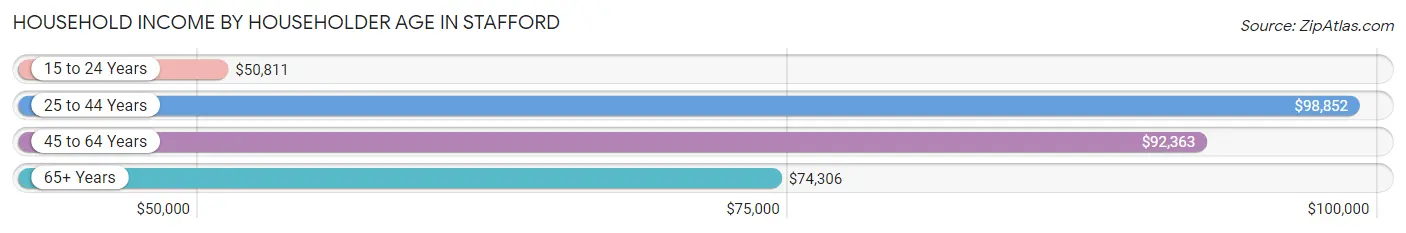
| Income Bracket | # Households | Median Income |
| 15 to 24 Years | 420 (6.5%) | $50,811 |
| 25 to 44 Years | 2,728 (42.2%) | $98,852 |
| 45 to 64 Years | 2,261 (35.0%) | $92,363 |
| 65+ Years | 1,049 (16.2%) | $74,306 |
| Total | 6,458 (100.0%) | $87,245 |
Poverty in Stafford
Income Below Poverty by Sex and Age in Stafford
With 9.4% poverty level for males and 12.4% for females among the residents of Stafford, 6 to 11 year old males and 5 year old females are the most vulnerable to poverty, with 289 males (26.6%) and 45 females (53.6%) in their respective age groups living below the poverty level.
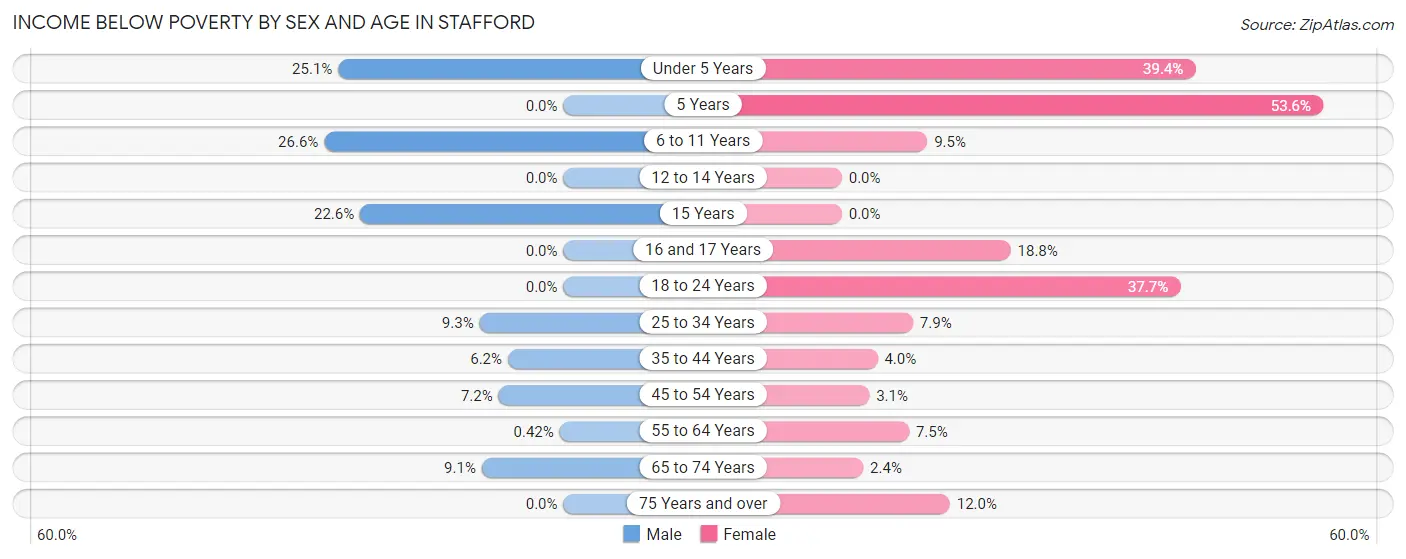
| Age Bracket | Male | Female |
| Under 5 Years | 153 (25.1%) | 205 (39.4%) |
| 5 Years | 0 (0.0%) | 45 (53.6%) |
| 6 to 11 Years | 289 (26.6%) | 51 (9.5%) |
| 12 to 14 Years | 0 (0.0%) | 0 (0.0%) |
| 15 Years | 24 (22.6%) | 0 (0.0%) |
| 16 and 17 Years | 0 (0.0%) | 25 (18.8%) |
| 18 to 24 Years | 0 (0.0%) | 365 (37.7%) |
| 25 to 34 Years | 171 (9.3%) | 138 (7.9%) |
| 35 to 44 Years | 62 (6.2%) | 47 (4.0%) |
| 45 to 54 Years | 84 (7.2%) | 23 (3.0%) |
| 55 to 64 Years | 4 (0.4%) | 80 (7.5%) |
| 65 to 74 Years | 49 (9.1%) | 16 (2.4%) |
| 75 Years and over | 0 (0.0%) | 38 (12.0%) |
| Total | 836 (9.4%) | 1,033 (12.4%) |
Income Above Poverty by Sex and Age in Stafford
According to the poverty statistics in Stafford, males aged 5 years and females aged 12 to 14 years are the age groups that are most secure financially, with 100.0% of males and 100.0% of females in these age groups living above the poverty line.
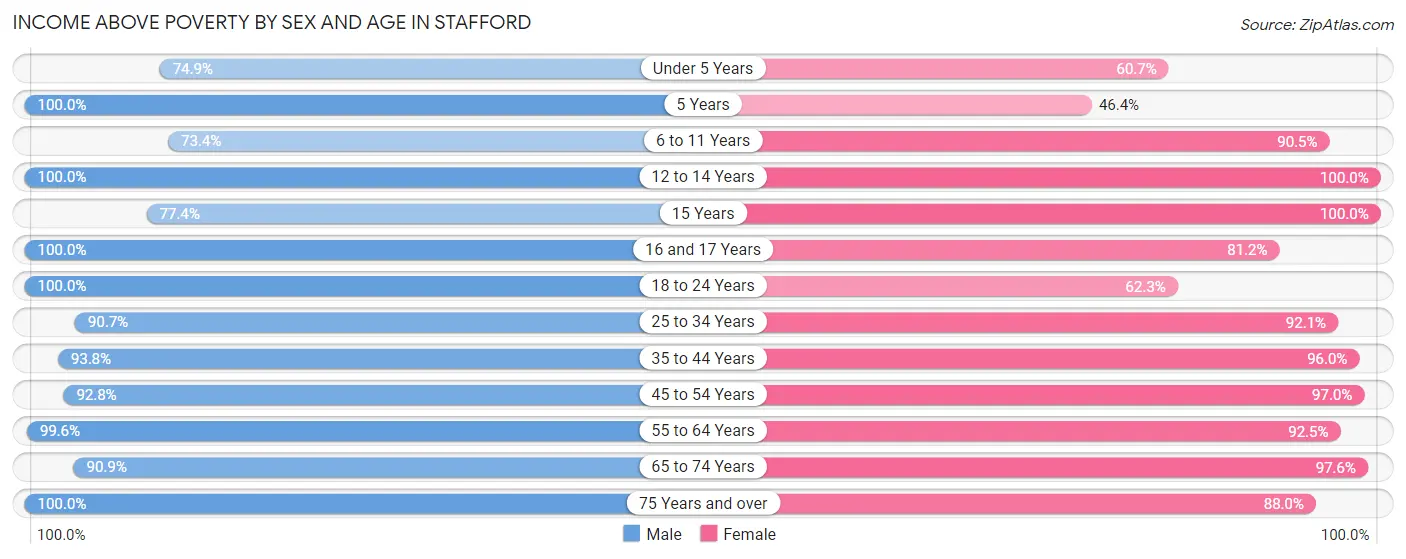
| Age Bracket | Male | Female |
| Under 5 Years | 457 (74.9%) | 316 (60.7%) |
| 5 Years | 30 (100.0%) | 39 (46.4%) |
| 6 to 11 Years | 796 (73.4%) | 485 (90.5%) |
| 12 to 14 Years | 278 (100.0%) | 241 (100.0%) |
| 15 Years | 82 (77.4%) | 120 (100.0%) |
| 16 and 17 Years | 219 (100.0%) | 108 (81.2%) |
| 18 to 24 Years | 761 (100.0%) | 604 (62.3%) |
| 25 to 34 Years | 1,659 (90.7%) | 1,605 (92.1%) |
| 35 to 44 Years | 942 (93.8%) | 1,137 (96.0%) |
| 45 to 54 Years | 1,079 (92.8%) | 732 (97.0%) |
| 55 to 64 Years | 951 (99.6%) | 989 (92.5%) |
| 65 to 74 Years | 490 (90.9%) | 655 (97.6%) |
| 75 Years and over | 295 (100.0%) | 278 (88.0%) |
| Total | 8,039 (90.6%) | 7,309 (87.6%) |
Income Below Poverty Among Married-Couple Families in Stafford
The poverty statistics for married-couple families in Stafford show that 2.9% or 82 of the total 2,785 families live below the poverty line. Families with 5 or more children have the highest poverty rate of 100.0%, comprising of 59 families. On the other hand, families with no children have the lowest poverty rate of 0.0%, which includes 0 families.
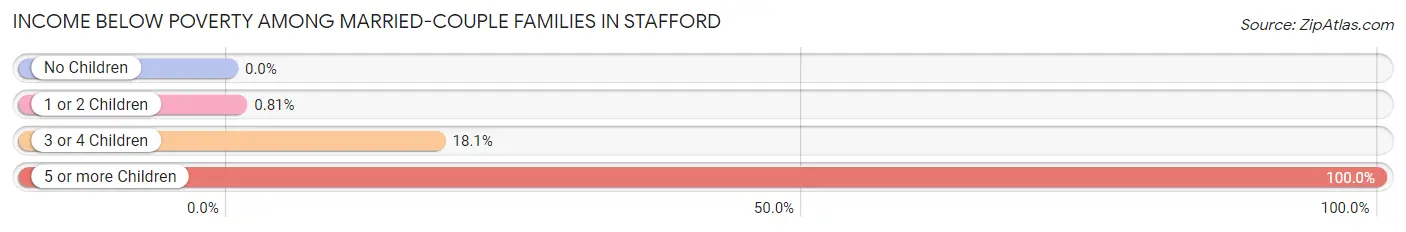
| Children | Above Poverty | Below Poverty |
| No Children | 1,658 (100.0%) | 0 (0.0%) |
| 1 or 2 Children | 977 (99.2%) | 8 (0.8%) |
| 3 or 4 Children | 68 (81.9%) | 15 (18.1%) |
| 5 or more Children | 0 (0.0%) | 59 (100.0%) |
| Total | 2,703 (97.1%) | 82 (2.9%) |
Income Below Poverty Among Single-Parent Households in Stafford
According to the poverty data in Stafford, 19.6% or 96 single-father households and 17.1% or 189 single-mother households are living below the poverty line. Among single-father households, those with 3 or 4 children have the highest poverty rate, with 86 households (100.0%) experiencing poverty. Likewise, among single-mother households, those with 1 or 2 children have the highest poverty rate, with 134 households (28.3%) falling below the poverty line.
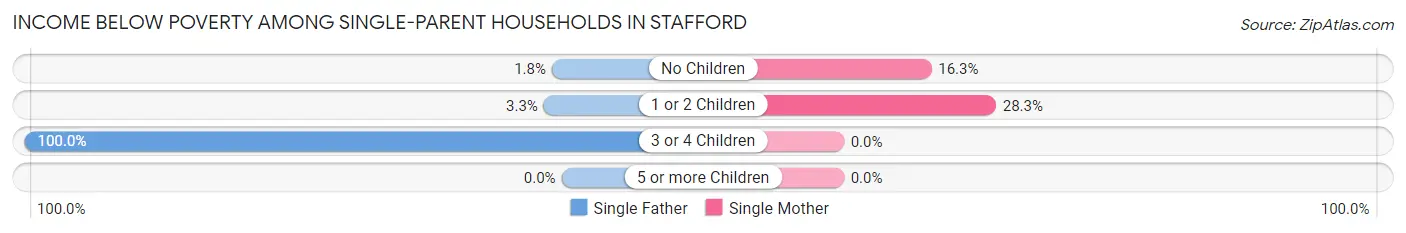
| Children | Single Father | Single Mother |
| No Children | 4 (1.8%) | 55 (16.3%) |
| 1 or 2 Children | 6 (3.3%) | 134 (28.3%) |
| 3 or 4 Children | 86 (100.0%) | 0 (0.0%) |
| 5 or more Children | 0 (0.0%) | 0 (0.0%) |
| Total | 96 (19.6%) | 189 (17.1%) |
Income Below Poverty Among Married-Couple vs Single-Parent Households in Stafford
The poverty data for Stafford shows that 82 of the married-couple family households (2.9%) and 285 of the single-parent households (17.9%) are living below the poverty level. Within the married-couple family households, those with 5 or more children have the highest poverty rate, with 59 households (100.0%) falling below the poverty line. Among the single-parent households, those with 3 or 4 children have the highest poverty rate, with 86 household (22.7%) living below poverty.
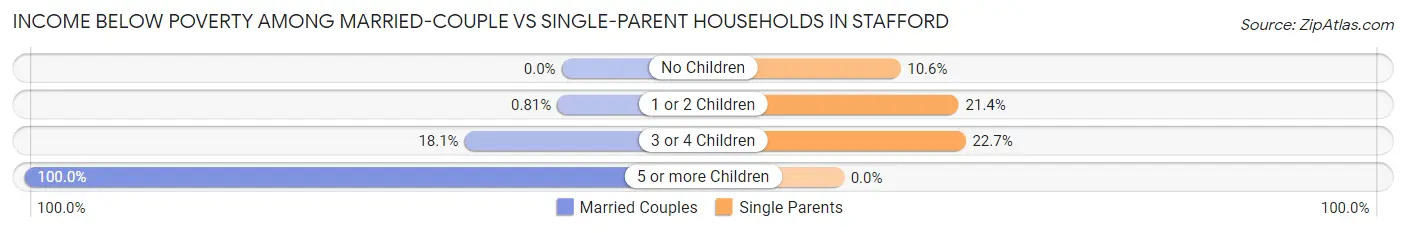
| Children | Married-Couple Families | Single-Parent Households |
| No Children | 0 (0.0%) | 59 (10.5%) |
| 1 or 2 Children | 8 (0.8%) | 140 (21.4%) |
| 3 or 4 Children | 15 (18.1%) | 86 (22.7%) |
| 5 or more Children | 59 (100.0%) | 0 (0.0%) |
| Total | 82 (2.9%) | 285 (17.9%) |
Race in Stafford
The most populous races in Stafford are Black / African American (4,970 | 28.8%), White / Caucasian (4,718 | 27.4%), and Asian (4,443 | 25.8%).
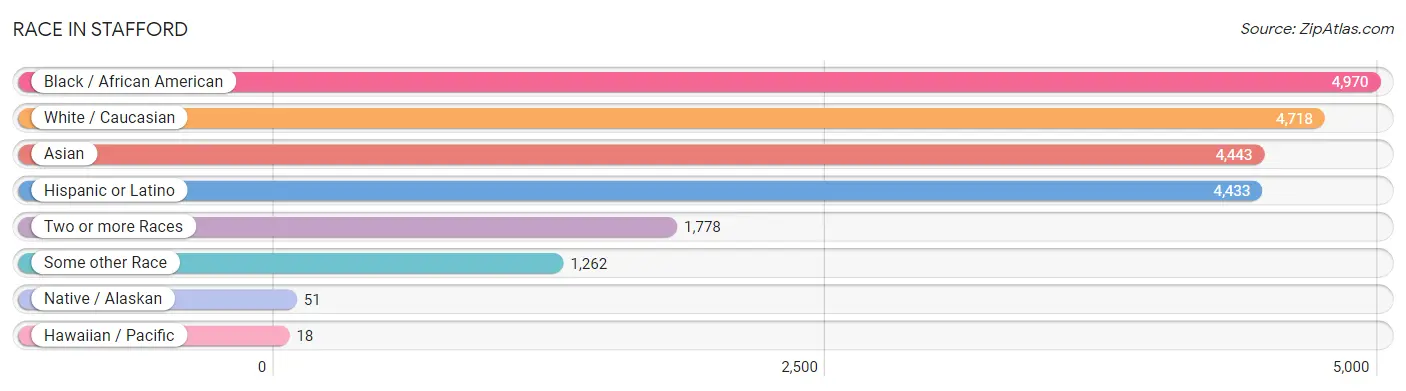
| Race | # Population | % Population |
| Asian | 4,443 | 25.8% |
| Black / African American | 4,970 | 28.8% |
| Hawaiian / Pacific | 18 | 0.1% |
| Hispanic or Latino | 4,433 | 25.7% |
| Native / Alaskan | 51 | 0.3% |
| White / Caucasian | 4,718 | 27.4% |
| Two or more Races | 1,778 | 10.3% |
| Some other Race | 1,262 | 7.3% |
| Total | 17,240 | 100.0% |
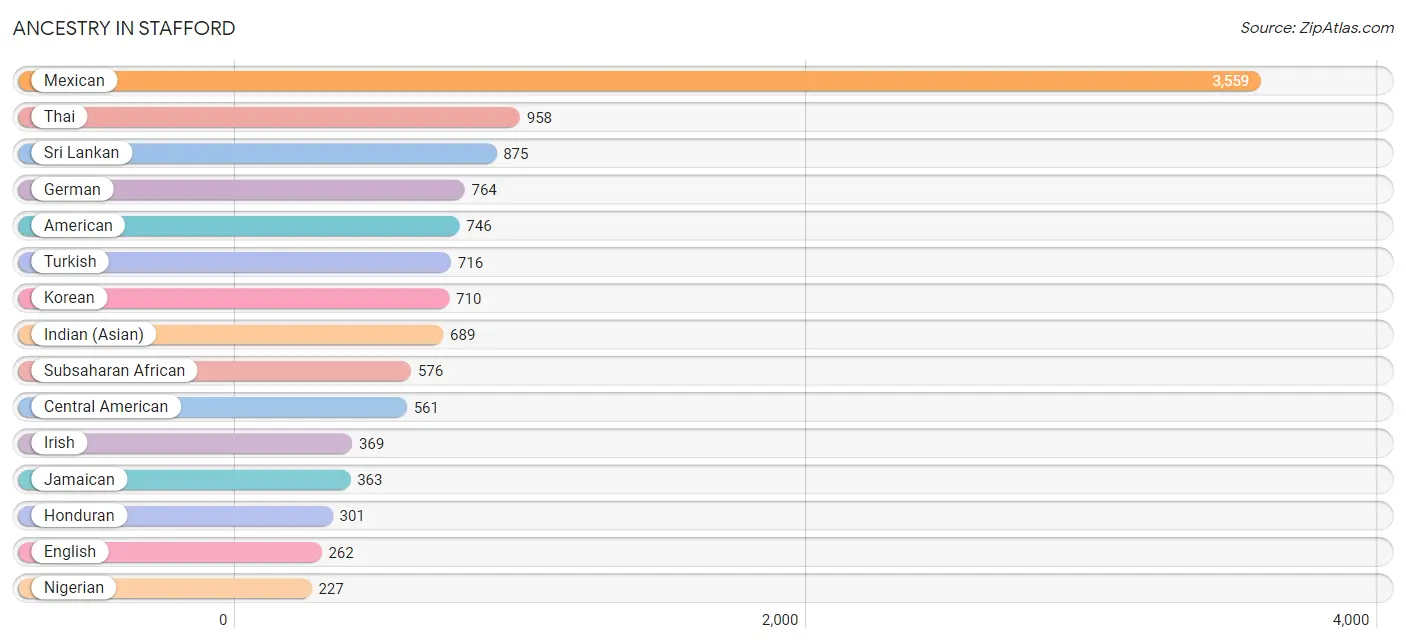
Ancestry in Stafford
The most populous ancestries reported in Stafford are Mexican (3,559 | 20.6%), Thai (958 | 5.6%), Sri Lankan (875 | 5.1%), German (764 | 4.4%), and American (746 | 4.3%), together accounting for 40.0% of all Stafford residents.
| Ancestry | # Population | % Population |
| African | 157 | 0.9% |
| American | 746 | 4.3% |
| Arab | 155 | 0.9% |
| Argentinean | 12 | 0.1% |
| Armenian | 17 | 0.1% |
| Austrian | 35 | 0.2% |
| Barbadian | 10 | 0.1% |
| Belgian | 33 | 0.2% |
| Belizean | 8 | 0.1% |
| British | 44 | 0.3% |
| Burmese | 128 | 0.7% |
| Central American | 561 | 3.3% |
| Cherokee | 6 | 0.0% |
| Colombian | 6 | 0.0% |
| Croatian | 31 | 0.2% |
| Cuban | 37 | 0.2% |
| Czech | 16 | 0.1% |
| English | 262 | 1.5% |
| Ethiopian | 33 | 0.2% |
| European | 99 | 0.6% |
| French | 135 | 0.8% |
| French Canadian | 20 | 0.1% |
| German | 764 | 4.4% |
| Ghanaian | 142 | 0.8% |
| Greek | 17 | 0.1% |
| Guatemalan | 26 | 0.2% |
| Honduran | 301 | 1.8% |
| Hungarian | 41 | 0.2% |
| Indian (Asian) | 689 | 4.0% |
| Irish | 369 | 2.1% |
| Italian | 141 | 0.8% |
| Jamaican | 363 | 2.1% |
| Japanese | 193 | 1.1% |
| Korean | 710 | 4.1% |
| Mexican | 3,559 | 20.6% |
| Mexican American Indian | 18 | 0.1% |
| Mongolian | 194 | 1.1% |
| Nicaraguan | 35 | 0.2% |
| Nigerian | 227 | 1.3% |
| Norwegian | 22 | 0.1% |
| Pakistani | 15 | 0.1% |
| Panamanian | 22 | 0.1% |
| Polish | 72 | 0.4% |
| Portuguese | 18 | 0.1% |
| Puerto Rican | 85 | 0.5% |
| Russian | 33 | 0.2% |
| Salvadoran | 177 | 1.0% |
| Scandinavian | 15 | 0.1% |
| Scotch-Irish | 20 | 0.1% |
| Scottish | 51 | 0.3% |
| Senegalese | 29 | 0.2% |
| Somali | 21 | 0.1% |
| South American | 68 | 0.4% |
| Spaniard | 24 | 0.1% |
| Sri Lankan | 875 | 5.1% |
| Subsaharan African | 576 | 3.3% |
| Swiss | 8 | 0.1% |
| Thai | 958 | 5.6% |
| Turkish | 716 | 4.2% |
| Ukrainian | 16 | 0.1% |
| Venezuelan | 50 | 0.3% |
| Welsh | 7 | 0.0% | View All 62 Rows |
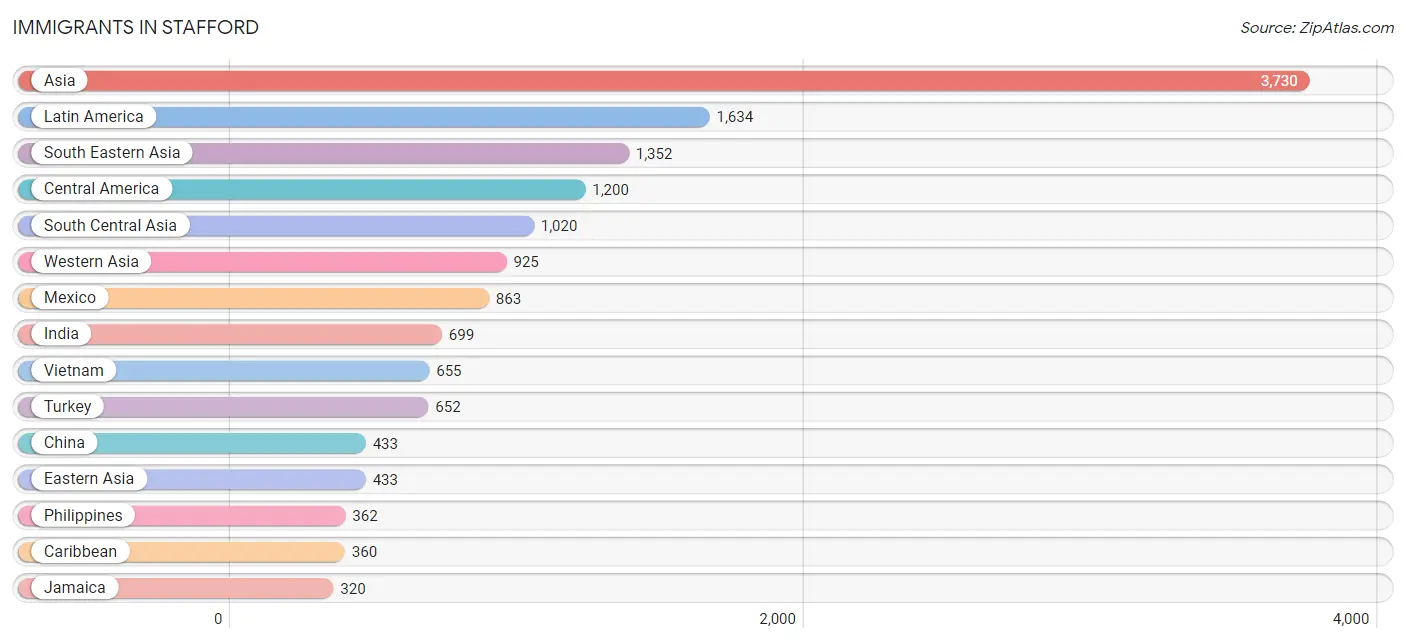
Immigrants in Stafford
The most numerous immigrant groups reported in Stafford came from Asia (3,730 | 21.6%), Latin America (1,634 | 9.5%), South Eastern Asia (1,352 | 7.8%), Central America (1,200 | 7.0%), and South Central Asia (1,020 | 5.9%), together accounting for 51.8% of all Stafford residents.
| Immigration Origin | # Population | % Population |
| Africa | 156 | 0.9% |
| Argentina | 51 | 0.3% |
| Asia | 3,730 | 21.6% |
| Cambodia | 96 | 0.6% |
| Caribbean | 360 | 2.1% |
| Central America | 1,200 | 7.0% |
| China | 433 | 2.5% |
| Colombia | 6 | 0.0% |
| Cuba | 12 | 0.1% |
| Eastern Africa | 15 | 0.1% |
| Eastern Asia | 433 | 2.5% |
| Eastern Europe | 16 | 0.1% |
| El Salvador | 102 | 0.6% |
| Eritrea | 15 | 0.1% |
| Europe | 75 | 0.4% |
| Germany | 59 | 0.3% |
| Guatemala | 6 | 0.0% |
| Honduras | 207 | 1.2% |
| Hong Kong | 101 | 0.6% |
| India | 699 | 4.1% |
| Indonesia | 45 | 0.3% |
| Iraq | 124 | 0.7% |
| Jamaica | 320 | 1.9% |
| Latin America | 1,634 | 9.5% |
| Malaysia | 194 | 1.1% |
| Mexico | 863 | 5.0% |
| Nigeria | 141 | 0.8% |
| Pakistan | 260 | 1.5% |
| Panama | 22 | 0.1% |
| Philippines | 362 | 2.1% |
| South America | 74 | 0.4% |
| South Central Asia | 1,020 | 5.9% |
| South Eastern Asia | 1,352 | 7.8% |
| Taiwan | 57 | 0.3% |
| Trinidad and Tobago | 19 | 0.1% |
| Turkey | 652 | 3.8% |
| Ukraine | 16 | 0.1% |
| Venezuela | 17 | 0.1% |
| Vietnam | 655 | 3.8% |
| Western Africa | 141 | 0.8% |
| Western Asia | 925 | 5.4% |
| Western Europe | 59 | 0.3% | View All 42 Rows |
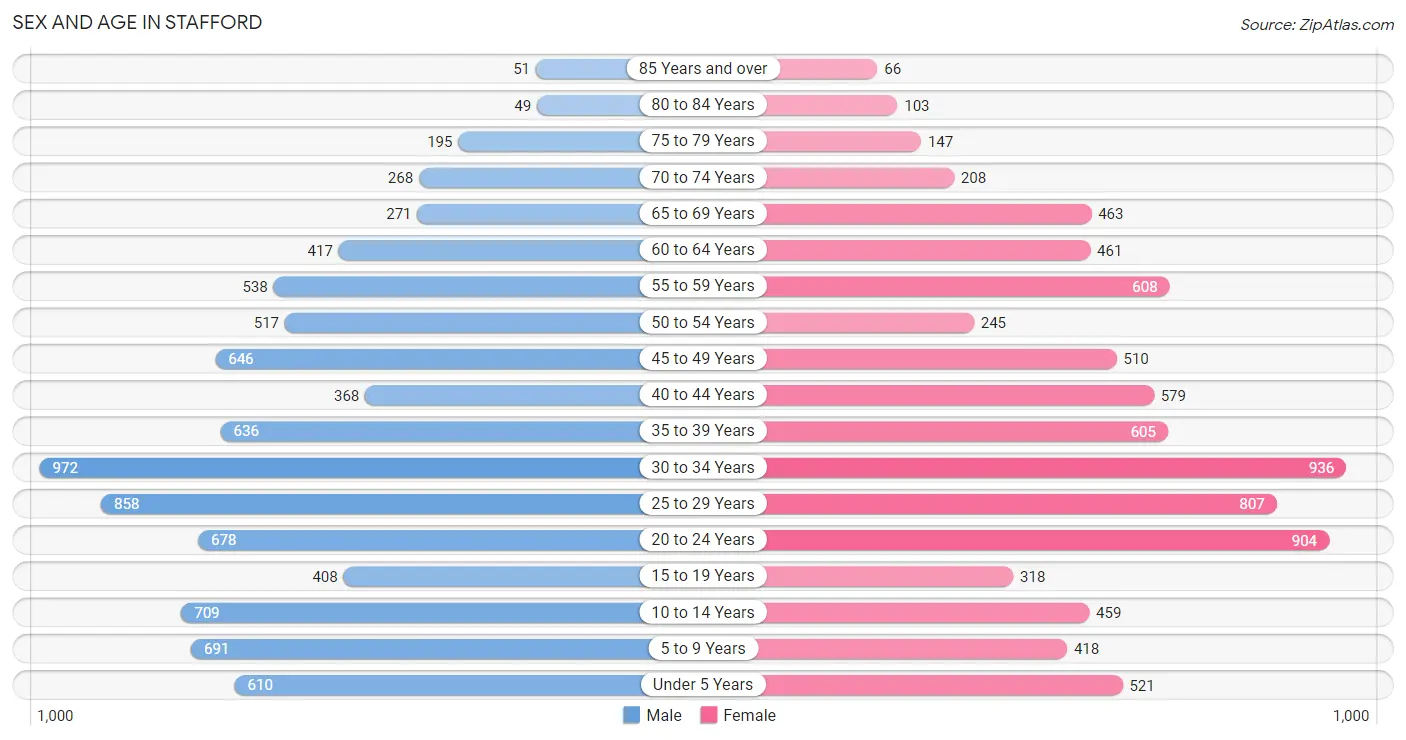
Sex and Age in Stafford
Sex and Age in Stafford
The most populous age groups in Stafford are 30 to 34 Years (972 | 10.9%) for men and 30 to 34 Years (936 | 11.2%) for women.
| Age Bracket | Male | Female |
| Under 5 Years | 610 (6.9%) | 521 (6.2%) |
| 5 to 9 Years | 691 (7.8%) | 418 (5.0%) |
| 10 to 14 Years | 709 (8.0%) | 459 (5.5%) |
| 15 to 19 Years | 408 (4.6%) | 318 (3.8%) |
| 20 to 24 Years | 678 (7.6%) | 904 (10.8%) |
| 25 to 29 Years | 858 (9.7%) | 807 (9.7%) |
| 30 to 34 Years | 972 (10.9%) | 936 (11.2%) |
| 35 to 39 Years | 636 (7.2%) | 605 (7.2%) |
| 40 to 44 Years | 368 (4.1%) | 579 (6.9%) |
| 45 to 49 Years | 646 (7.3%) | 510 (6.1%) |
| 50 to 54 Years | 517 (5.8%) | 245 (2.9%) |
| 55 to 59 Years | 538 (6.1%) | 608 (7.3%) |
| 60 to 64 Years | 417 (4.7%) | 461 (5.5%) |
| 65 to 69 Years | 271 (3.0%) | 463 (5.5%) |
| 70 to 74 Years | 268 (3.0%) | 208 (2.5%) |
| 75 to 79 Years | 195 (2.2%) | 147 (1.8%) |
| 80 to 84 Years | 49 (0.5%) | 103 (1.2%) |
| 85 Years and over | 51 (0.6%) | 66 (0.8%) |
| Total | 8,882 (100.0%) | 8,358 (100.0%) |
Families and Households in Stafford
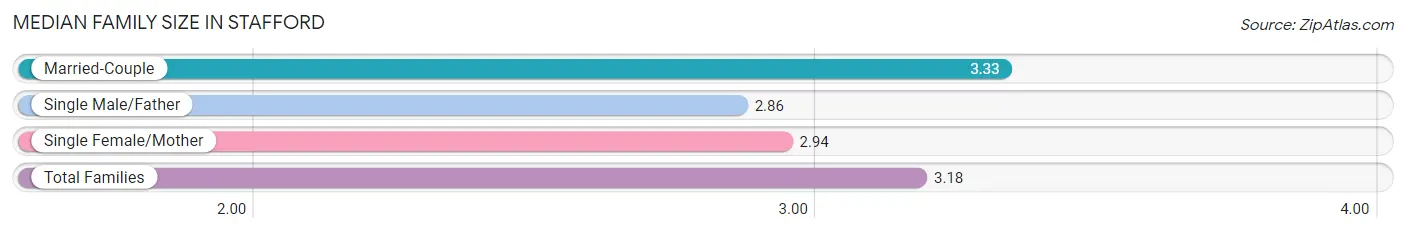
Median Family Size in Stafford
The median family size in Stafford is 3.18 persons per family, with married-couple families (2,785 | 63.6%) accounting for the largest median family size of 3.33 persons per family. On the other hand, single male/father families (489 | 11.2%) represent the smallest median family size with 2.86 persons per family.
| Family Type | # Families | Family Size |
| Married-Couple | 2,785 (63.6%) | 3.33 |
| Single Male/Father | 489 (11.2%) | 2.86 |
| Single Female/Mother | 1,103 (25.2%) | 2.94 |
| Total Families | 4,377 (100.0%) | 3.18 |
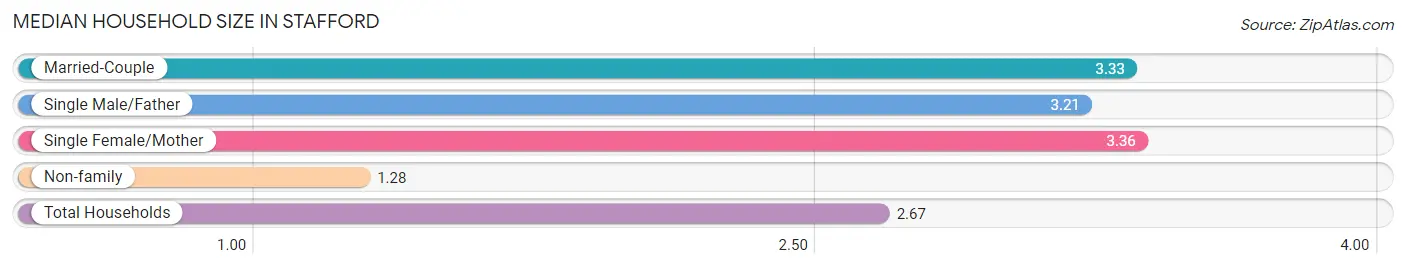
Median Household Size in Stafford
The median household size in Stafford is 2.67 persons per household, with single female/mother households (1,103 | 17.1%) accounting for the largest median household size of 3.36 persons per household. non-family households (2,081 | 32.2%) represent the smallest median household size with 1.28 persons per household.
| Household Type | # Households | Household Size |
| Married-Couple | 2,785 (43.1%) | 3.33 |
| Single Male/Father | 489 (7.6%) | 3.21 |
| Single Female/Mother | 1,103 (17.1%) | 3.36 |
| Non-family | 2,081 (32.2%) | 1.28 |
| Total Households | 6,458 (100.0%) | 2.67 |
Household Size by Marriage Status in Stafford
Out of a total of 6,458 households in Stafford, 4,377 (67.8%) are family households, while 2,081 (32.2%) are nonfamily households. The most numerous type of family households are 3-person households, comprising 1,395, and the most common type of nonfamily households are 1-person households, comprising 1,611.
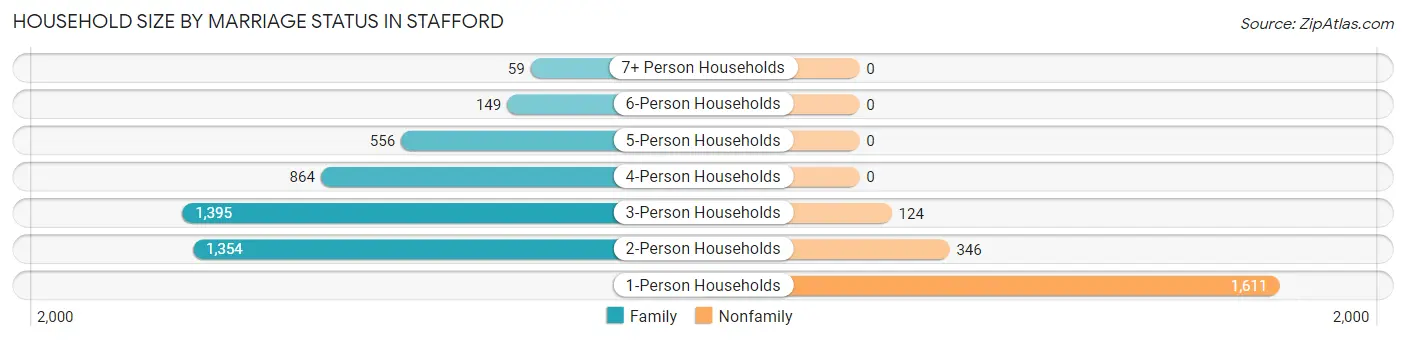
| Household Size | Family Households | Nonfamily Households |
| 1-Person Households | - | 1,611 (24.9%) |
| 2-Person Households | 1,354 (21.0%) | 346 (5.4%) |
| 3-Person Households | 1,395 (21.6%) | 124 (1.9%) |
| 4-Person Households | 864 (13.4%) | 0 (0.0%) |
| 5-Person Households | 556 (8.6%) | 0 (0.0%) |
| 6-Person Households | 149 (2.3%) | 0 (0.0%) |
| 7+ Person Households | 59 (0.9%) | 0 (0.0%) |
| Total | 4,377 (67.8%) | 2,081 (32.2%) |
Female Fertility in Stafford
Fertility by Age in Stafford
Average fertility rate in Stafford is 42.0 births per 1,000 women. Women in the age bracket of 20 to 34 years have the highest fertility rate with 66.0 births per 1,000 women. Women in the age bracket of 20 to 34 years acount for 89.3% of all women with births.
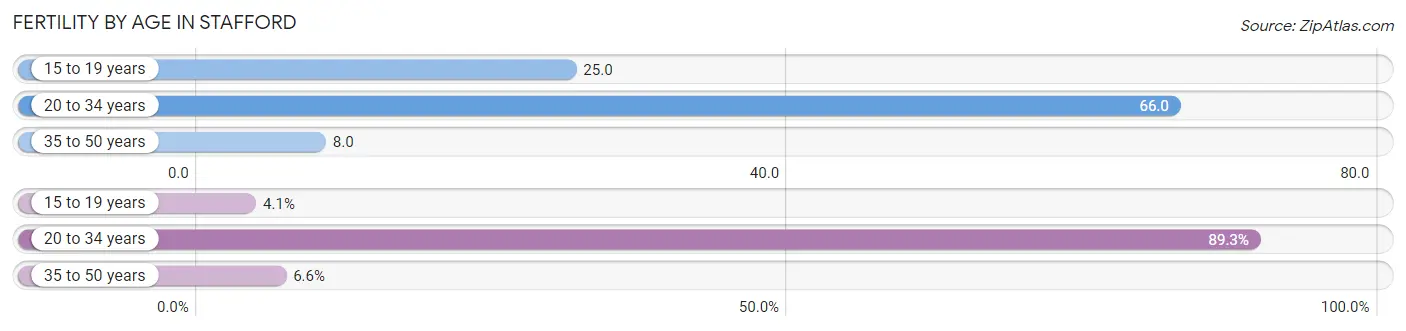
| Age Bracket | Women with Births | Births / 1,000 Women |
| 15 to 19 years | 8 (4.1%) | 25.0 |
| 20 to 34 years | 175 (89.3%) | 66.0 |
| 35 to 50 years | 13 (6.6%) | 8.0 |
| Total | 196 (100.0%) | 42.0 |
Fertility by Age by Marriage Status in Stafford
94.4% of women with births (196) in Stafford are married. The highest percentage of unmarried women with births falls into 20 to 34 years age bracket with 6.3% of them unmarried at the time of birth, while the lowest percentage of unmarried women with births belong to 15 to 19 years age bracket with 0.0% of them unmarried.
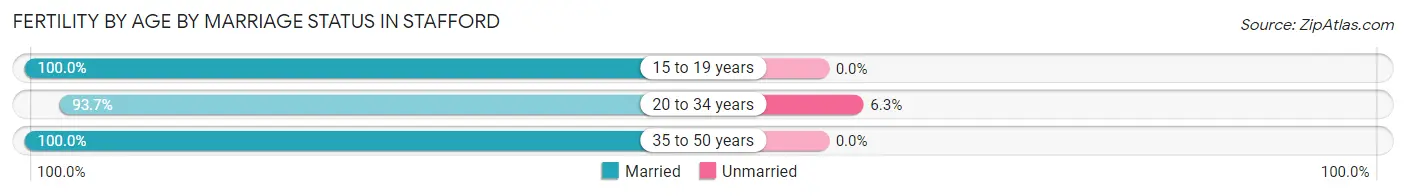
| Age Bracket | Married | Unmarried |
| 15 to 19 years | 8 (100.0%) | 0 (0.0%) |
| 20 to 34 years | 164 (93.7%) | 11 (6.3%) |
| 35 to 50 years | 13 (100.0%) | 0 (0.0%) |
| Total | 185 (94.4%) | 11 (5.6%) |
Fertility by Education in Stafford
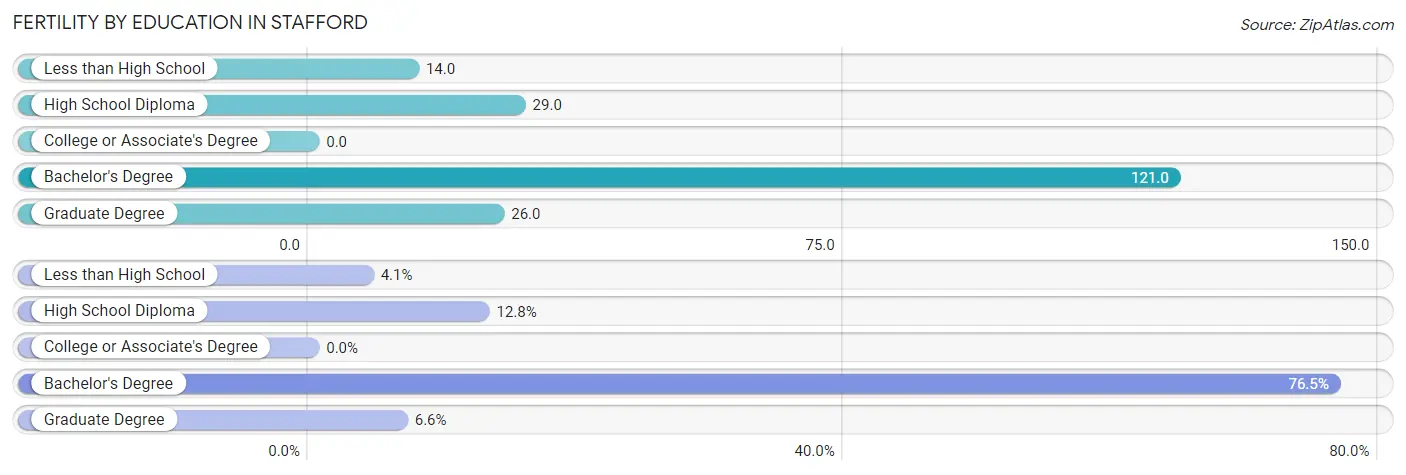
| Educational Attainment | Women with Births | Births / 1,000 Women |
| Less than High School | 8 (4.1%) | 14.0 |
| High School Diploma | 25 (12.8%) | 29.0 |
| College or Associate's Degree | 0 (0.0%) | 0.0 |
| Bachelor's Degree | 150 (76.5%) | 121.0 |
| Graduate Degree | 13 (6.6%) | 26.0 |
| Total | 196 (100.0%) | 42.0 |
Fertility by Education by Marriage Status in Stafford
5.6% of women with births in Stafford are unmarried. Women with the educational attainment of less than high school are most likely to be married with 100.0% of them married at childbirth, while women with the educational attainment of bachelor's degree are least likely to be married with 7.3% of them unmarried at childbirth.
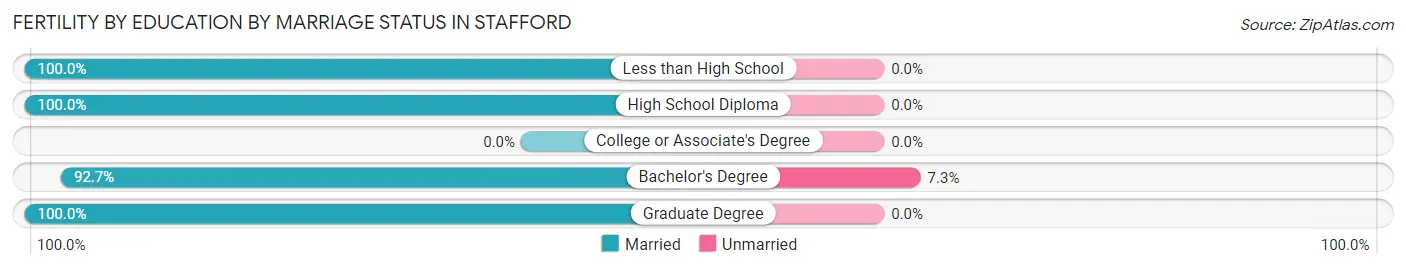
| Educational Attainment | Married | Unmarried |
| Less than High School | 8 (100.0%) | 0 (0.0%) |
| High School Diploma | 25 (100.0%) | 0 (0.0%) |
| College or Associate's Degree | 0 (0.0%) | 0 (0.0%) |
| Bachelor's Degree | 139 (92.7%) | 11 (7.3%) |
| Graduate Degree | 13 (100.0%) | 0 (0.0%) |
| Total | 185 (94.4%) | 11 (5.6%) |
Employment Characteristics in Stafford
Employment by Class of Employer in Stafford
Among the 9,255 employed individuals in Stafford, private company employees (6,479 | 70.0%), not-for-profit organizations (993 | 10.7%), and state government employees (525 | 5.7%) make up the most common classes of employment.
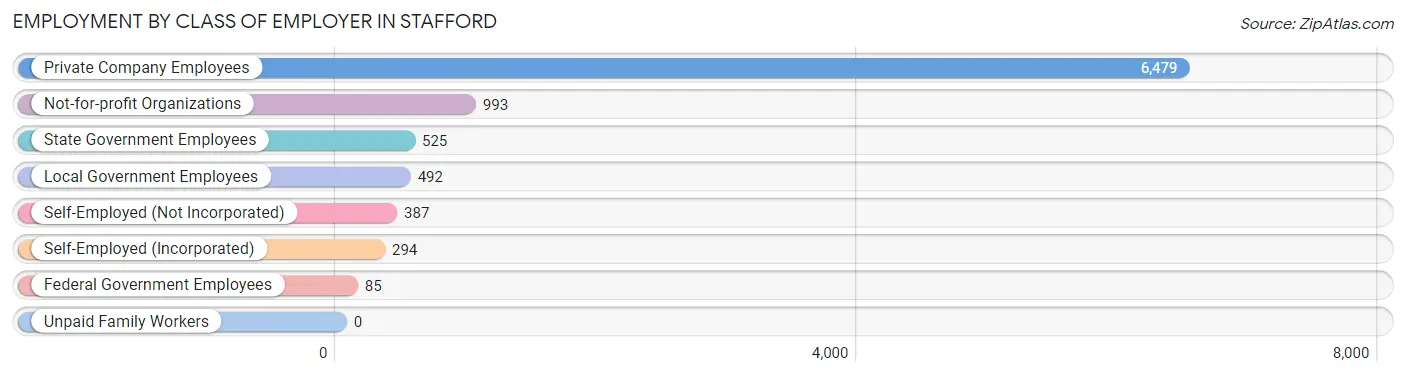
| Employer Class | # Employees | % Employees |
| Private Company Employees | 6,479 | 70.0% |
| Self-Employed (Incorporated) | 294 | 3.2% |
| Self-Employed (Not Incorporated) | 387 | 4.2% |
| Not-for-profit Organizations | 993 | 10.7% |
| Local Government Employees | 492 | 5.3% |
| State Government Employees | 525 | 5.7% |
| Federal Government Employees | 85 | 0.9% |
| Unpaid Family Workers | 0 | 0.0% |
| Total | 9,255 | 100.0% |
Employment Status by Age in Stafford
According to the labor force statistics for Stafford, out of the total population over 16 years of age (13,606), 74.7% or 10,164 individuals are in the labor force, with 3.9% or 396 of them unemployed. The age group with the highest labor force participation rate is 25 to 29 years, with 96.9% or 1,613 individuals in the labor force. Within the labor force, the 16 to 19 years age range has the highest percentage of unemployed individuals, with 56.7% or 55 of them being unemployed.
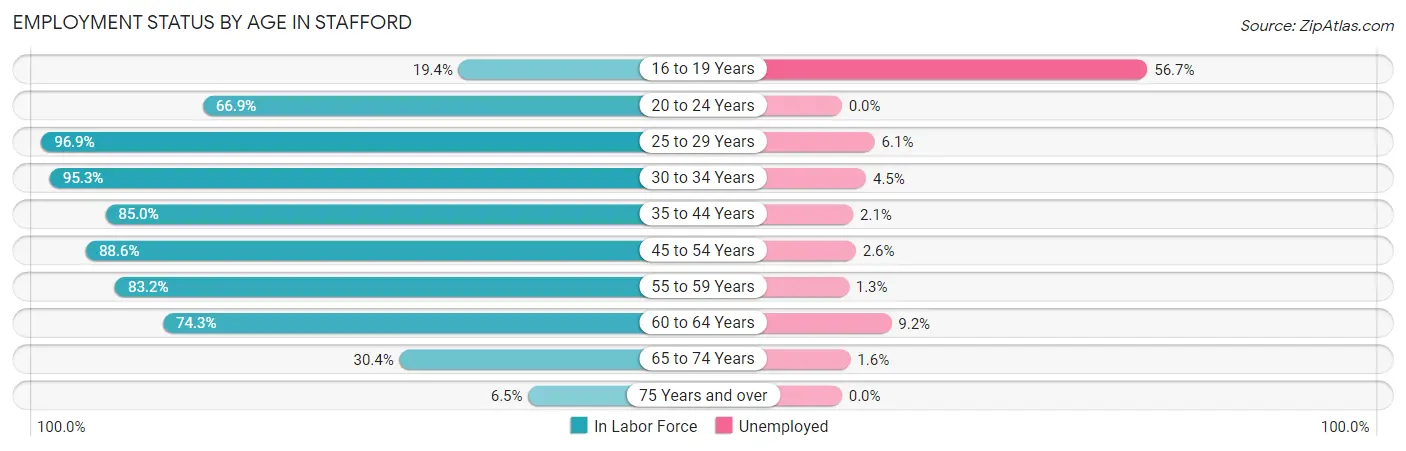
| Age Bracket | In Labor Force | Unemployed |
| 16 to 19 Years | 97 (19.4%) | 55 (56.7%) |
| 20 to 24 Years | 1,058 (66.9%) | 0 (0.0%) |
| 25 to 29 Years | 1,613 (96.9%) | 98 (6.1%) |
| 30 to 34 Years | 1,818 (95.3%) | 82 (4.5%) |
| 35 to 44 Years | 1,860 (85.0%) | 39 (2.1%) |
| 45 to 54 Years | 1,699 (88.6%) | 44 (2.6%) |
| 55 to 59 Years | 953 (83.2%) | 12 (1.3%) |
| 60 to 64 Years | 652 (74.3%) | 60 (9.2%) |
| 65 to 74 Years | 368 (30.4%) | 6 (1.6%) |
| 75 Years and over | 40 (6.5%) | 0 (0.0%) |
| Total | 10,164 (74.7%) | 396 (3.9%) |
Employment Status by Educational Attainment in Stafford
According to labor force statistics for Stafford, 88.6% of individuals (8,597) out of the total population between 25 and 64 years of age (9,703) are in the labor force, with 3.9% or 335 of them being unemployed. The group with the highest labor force participation rate are those with the educational attainment of high school diploma, with 92.0% or 2,218 individuals in the labor force. Within the labor force, individuals with high school diploma education have the highest percentage of unemployment, with 5.8% or 129 of them being unemployed.
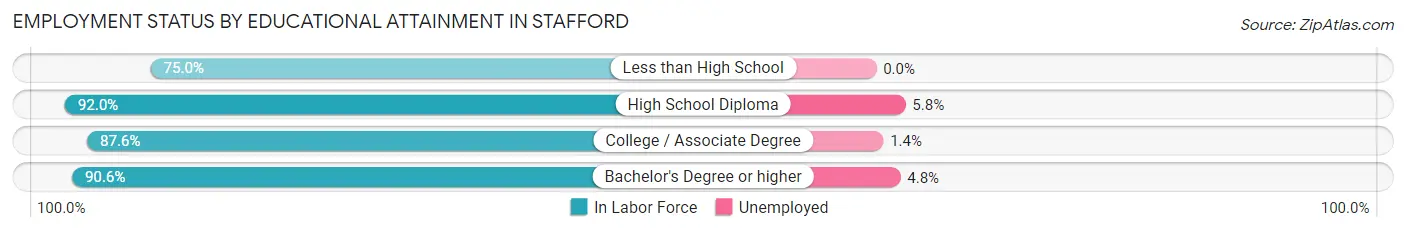
| Educational Attainment | In Labor Force | Unemployed |
| Less than High School | 782 (75.0%) | 0 (0.0%) |
| High School Diploma | 2,218 (92.0%) | 140 (5.8%) |
| College / Associate Degree | 1,878 (87.6%) | 30 (1.4%) |
| Bachelor's Degree or higher | 3,720 (90.6%) | 197 (4.8%) |
| Total | 8,597 (88.6%) | 378 (3.9%) |
Employment Occupations by Sex in Stafford
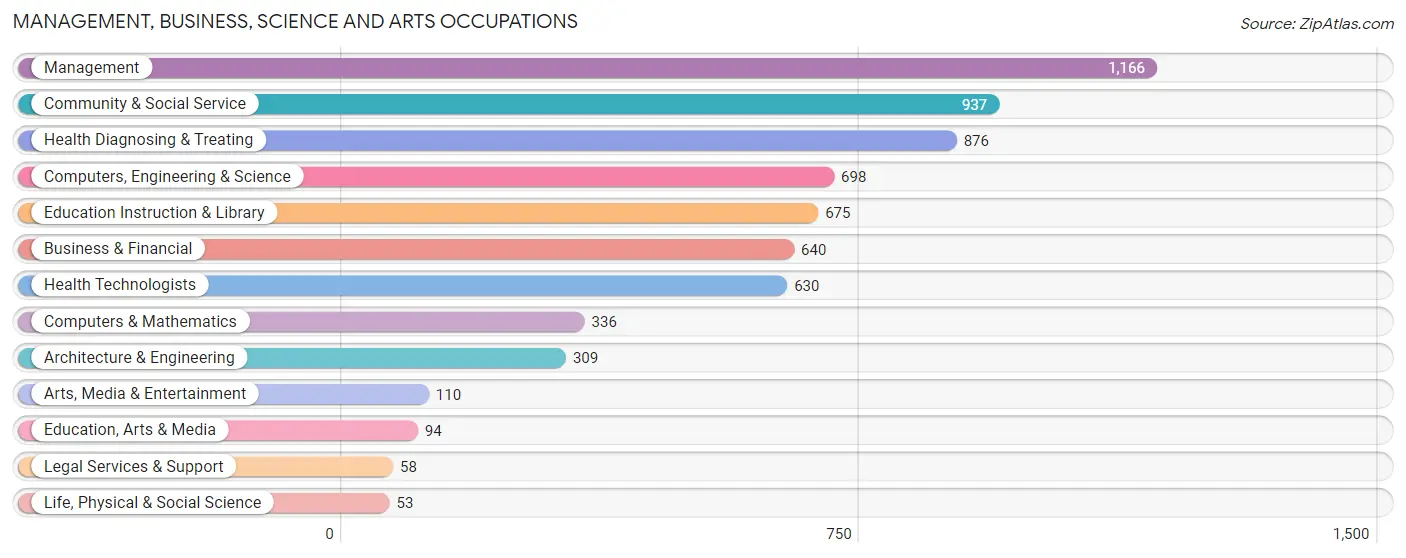
Management, Business, Science and Arts Occupations
The most common Management, Business, Science and Arts occupations in Stafford are Management (1,166 | 11.9%), Community & Social Service (937 | 9.6%), Health Diagnosing & Treating (876 | 9.0%), Computers, Engineering & Science (698 | 7.1%), and Education Instruction & Library (675 | 6.9%).
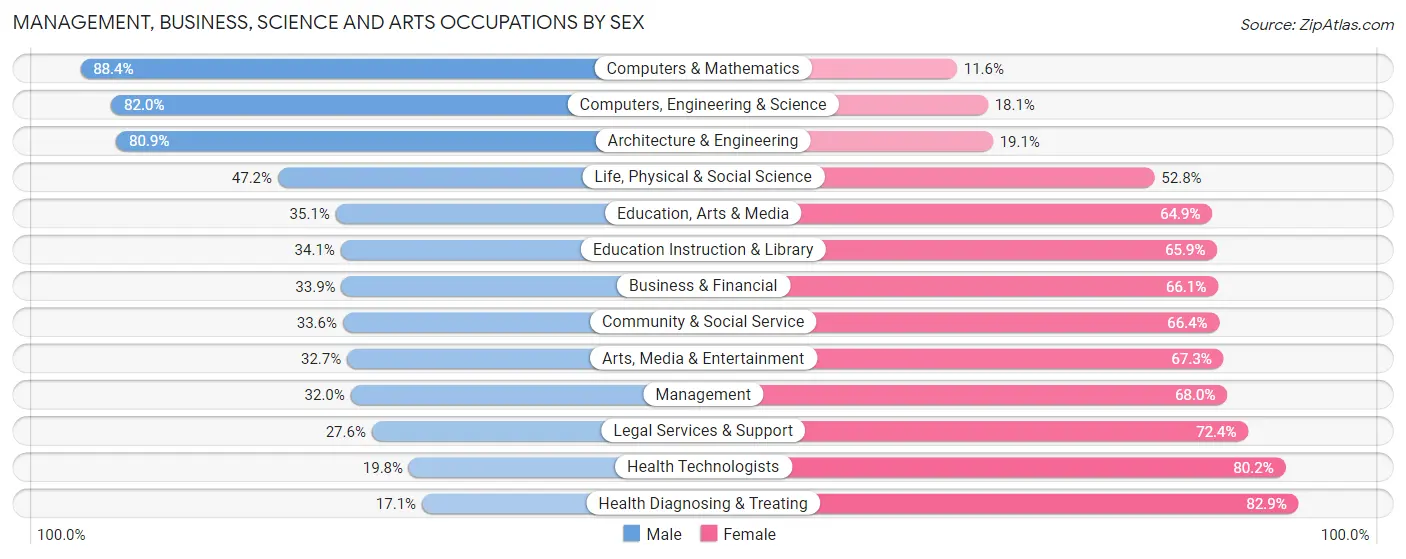
Management, Business, Science and Arts Occupations by Sex
Within the Management, Business, Science and Arts occupations in Stafford, the most male-oriented occupations are Computers & Mathematics (88.4%), Computers, Engineering & Science (82.0%), and Architecture & Engineering (80.9%), while the most female-oriented occupations are Health Diagnosing & Treating (82.9%), Health Technologists (80.2%), and Legal Services & Support (72.4%).
| Occupation | Male | Female |
| Management | 373 (32.0%) | 793 (68.0%) |
| Business & Financial | 217 (33.9%) | 423 (66.1%) |
| Computers, Engineering & Science | 572 (82.0%) | 126 (18.0%) |
| Computers & Mathematics | 297 (88.4%) | 39 (11.6%) |
| Architecture & Engineering | 250 (80.9%) | 59 (19.1%) |
| Life, Physical & Social Science | 25 (47.2%) | 28 (52.8%) |
| Community & Social Service | 315 (33.6%) | 622 (66.4%) |
| Education, Arts & Media | 33 (35.1%) | 61 (64.9%) |
| Legal Services & Support | 16 (27.6%) | 42 (72.4%) |
| Education Instruction & Library | 230 (34.1%) | 445 (65.9%) |
| Arts, Media & Entertainment | 36 (32.7%) | 74 (67.3%) |
| Health Diagnosing & Treating | 150 (17.1%) | 726 (82.9%) |
| Health Technologists | 125 (19.8%) | 505 (80.2%) |
| Total (Category) | 1,627 (37.7%) | 2,690 (62.3%) |
| Total (Overall) | 5,033 (51.5%) | 4,731 (48.4%) |
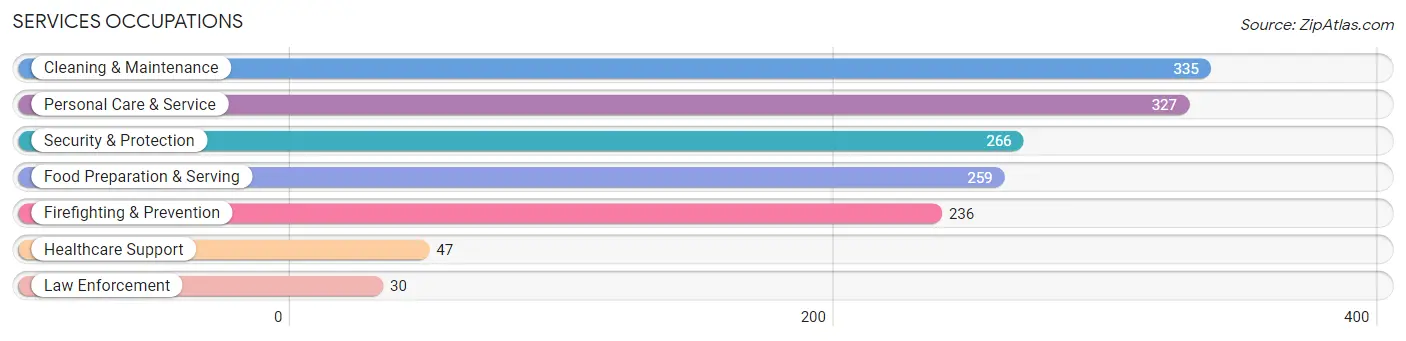
Services Occupations
The most common Services occupations in Stafford are Cleaning & Maintenance (335 | 3.4%), Personal Care & Service (327 | 3.4%), Security & Protection (266 | 2.7%), Food Preparation & Serving (259 | 2.6%), and Firefighting & Prevention (236 | 2.4%).
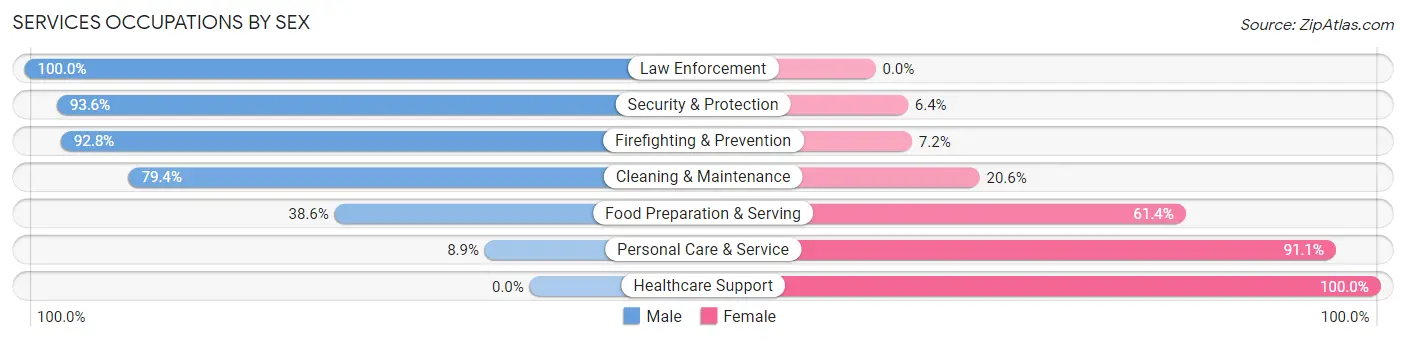
Services Occupations by Sex
Within the Services occupations in Stafford, the most male-oriented occupations are Law Enforcement (100.0%), Security & Protection (93.6%), and Firefighting & Prevention (92.8%), while the most female-oriented occupations are Healthcare Support (100.0%), Personal Care & Service (91.1%), and Food Preparation & Serving (61.4%).
| Occupation | Male | Female |
| Healthcare Support | 0 (0.0%) | 47 (100.0%) |
| Security & Protection | 249 (93.6%) | 17 (6.4%) |
| Firefighting & Prevention | 219 (92.8%) | 17 (7.2%) |
| Law Enforcement | 30 (100.0%) | 0 (0.0%) |
| Food Preparation & Serving | 100 (38.6%) | 159 (61.4%) |
| Cleaning & Maintenance | 266 (79.4%) | 69 (20.6%) |
| Personal Care & Service | 29 (8.9%) | 298 (91.1%) |
| Total (Category) | 644 (52.2%) | 590 (47.8%) |
| Total (Overall) | 5,033 (51.5%) | 4,731 (48.4%) |
Sales and Office Occupations
The most common Sales and Office occupations in Stafford are Office & Administration (1,020 | 10.4%), and Sales & Related (614 | 6.3%).
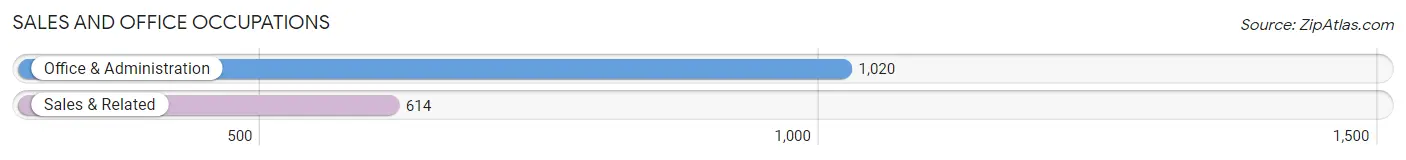
Sales and Office Occupations by Sex
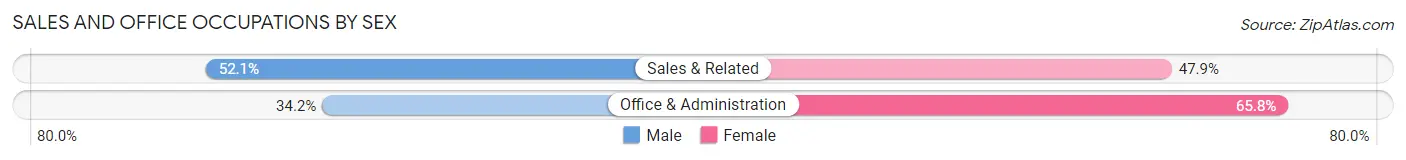
| Occupation | Male | Female |
| Sales & Related | 320 (52.1%) | 294 (47.9%) |
| Office & Administration | 349 (34.2%) | 671 (65.8%) |
| Total (Category) | 669 (40.9%) | 965 (59.1%) |
| Total (Overall) | 5,033 (51.5%) | 4,731 (48.4%) |
Natural Resources, Construction and Maintenance Occupations
The most common Natural Resources, Construction and Maintenance occupations in Stafford are Installation, Maintenance & Repair (413 | 4.2%), Construction & Extraction (350 | 3.6%), and Farming, Fishing & Forestry (42 | 0.4%).
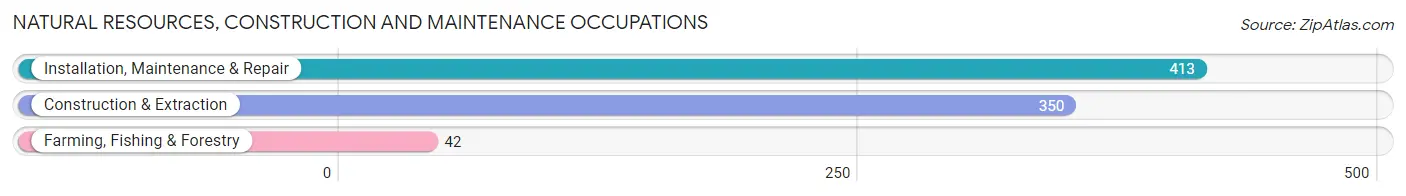
Natural Resources, Construction and Maintenance Occupations by Sex
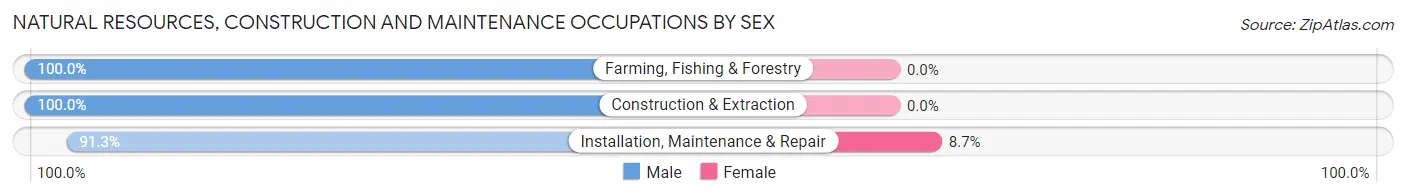
| Occupation | Male | Female |
| Farming, Fishing & Forestry | 42 (100.0%) | 0 (0.0%) |
| Construction & Extraction | 350 (100.0%) | 0 (0.0%) |
| Installation, Maintenance & Repair | 377 (91.3%) | 36 (8.7%) |
| Total (Category) | 769 (95.5%) | 36 (4.5%) |
| Total (Overall) | 5,033 (51.5%) | 4,731 (48.4%) |
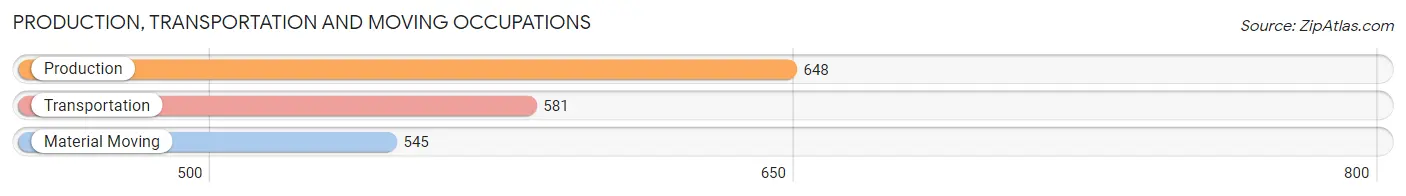
Production, Transportation and Moving Occupations
The most common Production, Transportation and Moving occupations in Stafford are Production (648 | 6.6%), Transportation (581 | 5.9%), and Material Moving (545 | 5.6%).
Production, Transportation and Moving Occupations by Sex
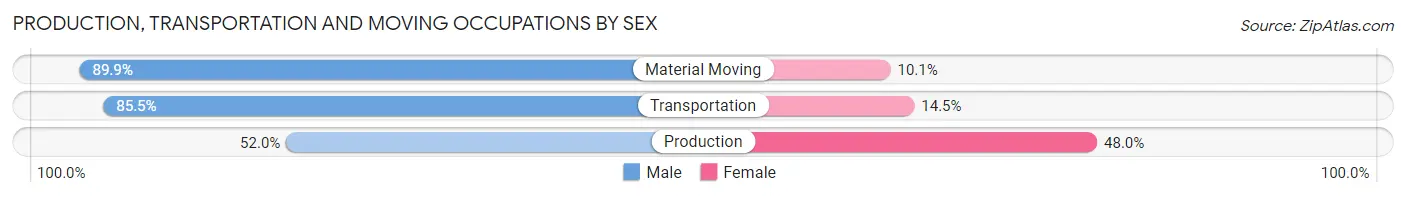
| Occupation | Male | Female |
| Production | 337 (52.0%) | 311 (48.0%) |
| Transportation | 497 (85.5%) | 84 (14.5%) |
| Material Moving | 490 (89.9%) | 55 (10.1%) |
| Total (Category) | 1,324 (74.6%) | 450 (25.4%) |
| Total (Overall) | 5,033 (51.5%) | 4,731 (48.4%) |
Employment Industries by Sex in Stafford
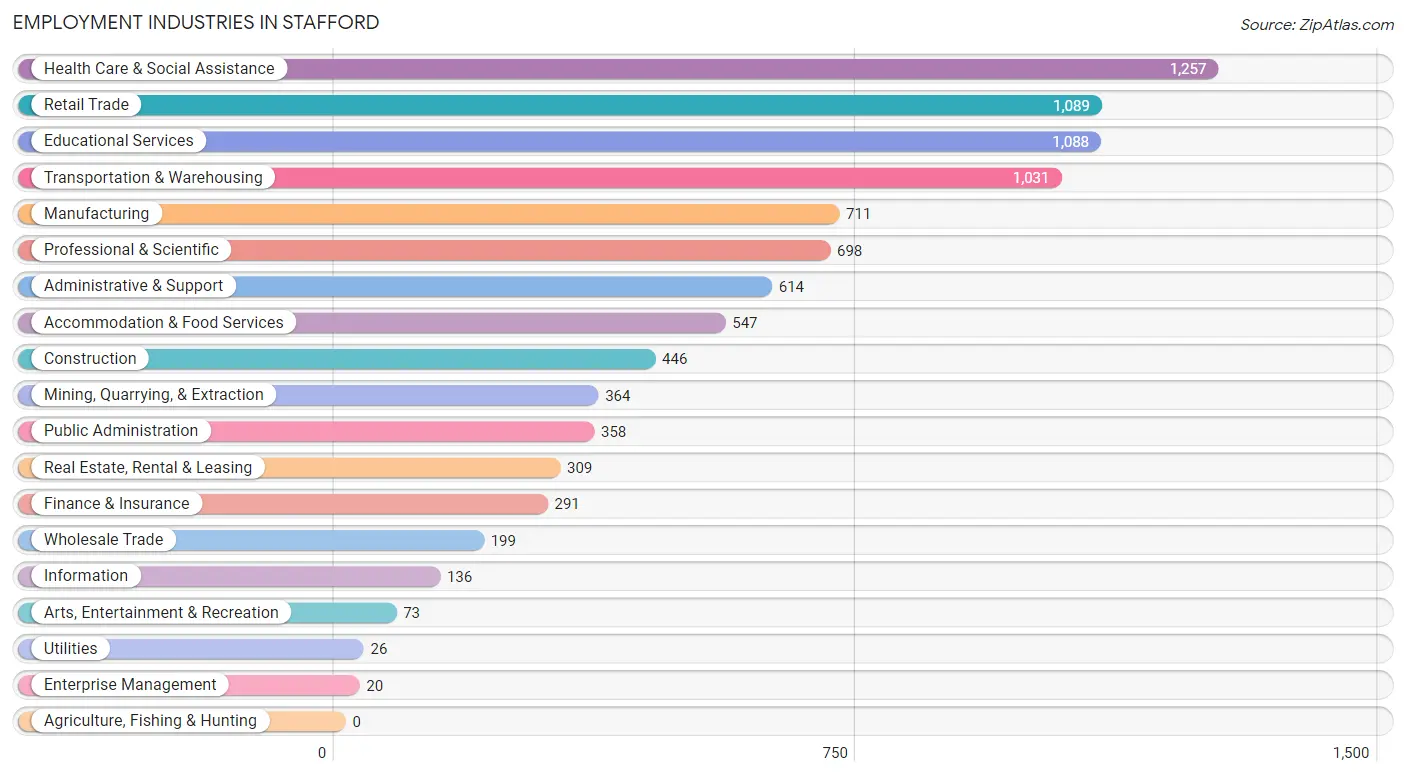
Employment Industries in Stafford
The major employment industries in Stafford include Health Care & Social Assistance (1,257 | 12.9%), Retail Trade (1,089 | 11.2%), Educational Services (1,088 | 11.1%), Transportation & Warehousing (1,031 | 10.6%), and Manufacturing (711 | 7.3%).
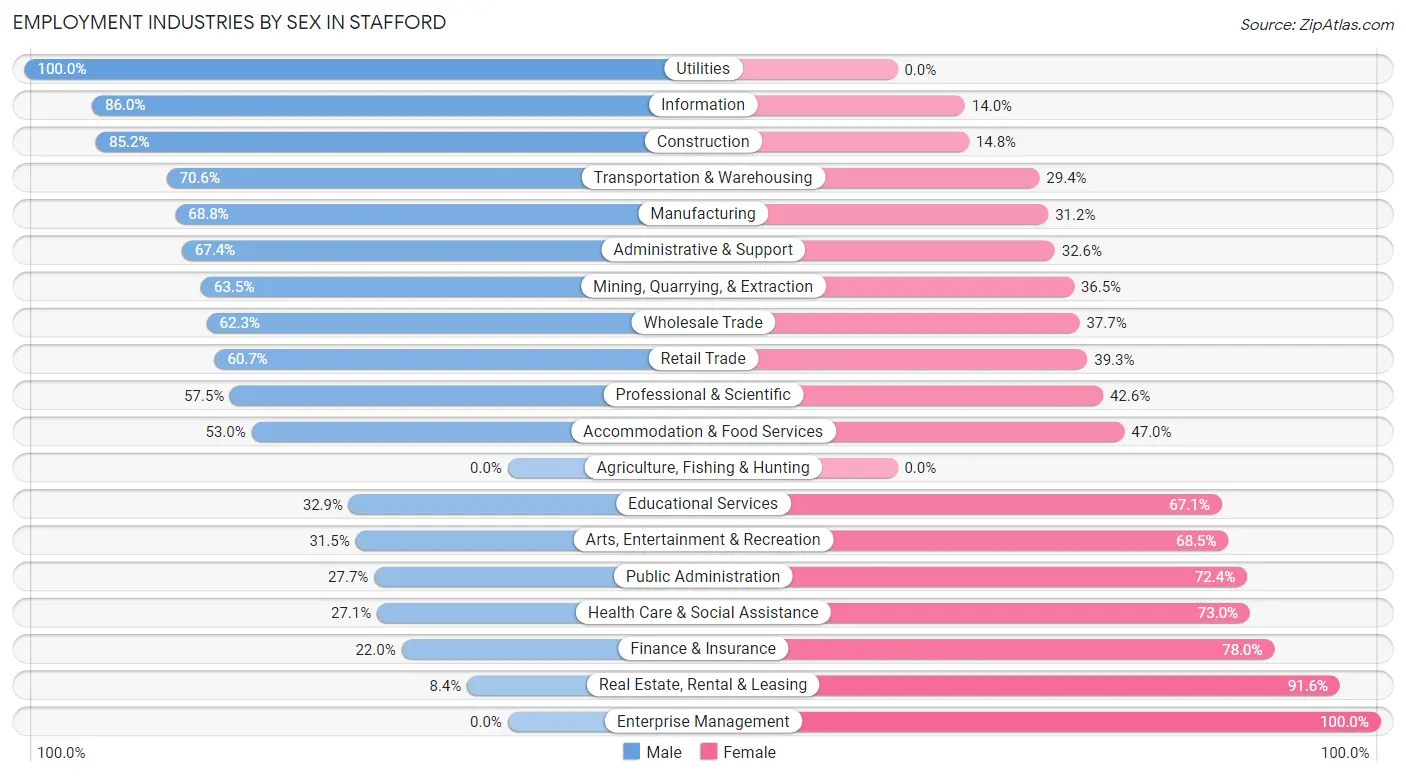
Employment Industries by Sex in Stafford
The Stafford industries that see more men than women are Utilities (100.0%), Information (86.0%), and Construction (85.2%), whereas the industries that tend to have a higher number of women are Enterprise Management (100.0%), Real Estate, Rental & Leasing (91.6%), and Finance & Insurance (78.0%).
| Industry | Male | Female |
| Agriculture, Fishing & Hunting | 0 (0.0%) | 0 (0.0%) |
| Mining, Quarrying, & Extraction | 231 (63.5%) | 133 (36.5%) |
| Construction | 380 (85.2%) | 66 (14.8%) |
| Manufacturing | 489 (68.8%) | 222 (31.2%) |
| Wholesale Trade | 124 (62.3%) | 75 (37.7%) |
| Retail Trade | 661 (60.7%) | 428 (39.3%) |
| Transportation & Warehousing | 728 (70.6%) | 303 (29.4%) |
| Utilities | 26 (100.0%) | 0 (0.0%) |
| Information | 117 (86.0%) | 19 (14.0%) |
| Finance & Insurance | 64 (22.0%) | 227 (78.0%) |
| Real Estate, Rental & Leasing | 26 (8.4%) | 283 (91.6%) |
| Professional & Scientific | 401 (57.5%) | 297 (42.5%) |
| Enterprise Management | 0 (0.0%) | 20 (100.0%) |
| Administrative & Support | 414 (67.4%) | 200 (32.6%) |
| Educational Services | 358 (32.9%) | 730 (67.1%) |
| Health Care & Social Assistance | 340 (27.1%) | 917 (73.0%) |
| Arts, Entertainment & Recreation | 23 (31.5%) | 50 (68.5%) |
| Accommodation & Food Services | 290 (53.0%) | 257 (47.0%) |
| Public Administration | 99 (27.7%) | 259 (72.4%) |
| Total | 5,033 (51.5%) | 4,731 (48.4%) |
Education in Stafford
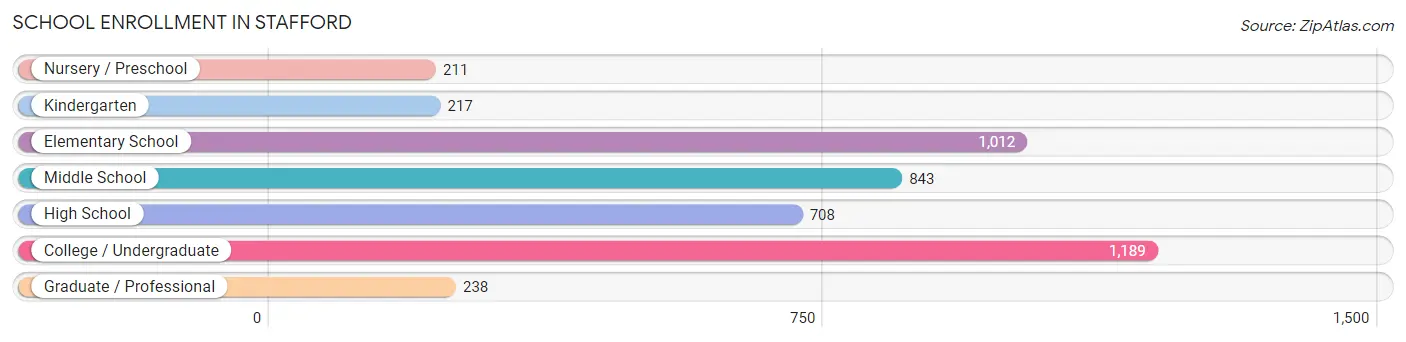
School Enrollment in Stafford
The most common levels of schooling among the 4,418 students in Stafford are college / undergraduate (1,189 | 26.9%), elementary school (1,012 | 22.9%), and middle school (843 | 19.1%).
| School Level | # Students | % Students |
| Nursery / Preschool | 211 | 4.8% |
| Kindergarten | 217 | 4.9% |
| Elementary School | 1,012 | 22.9% |
| Middle School | 843 | 19.1% |
| High School | 708 | 16.0% |
| College / Undergraduate | 1,189 | 26.9% |
| Graduate / Professional | 238 | 5.4% |
| Total | 4,418 | 100.0% |
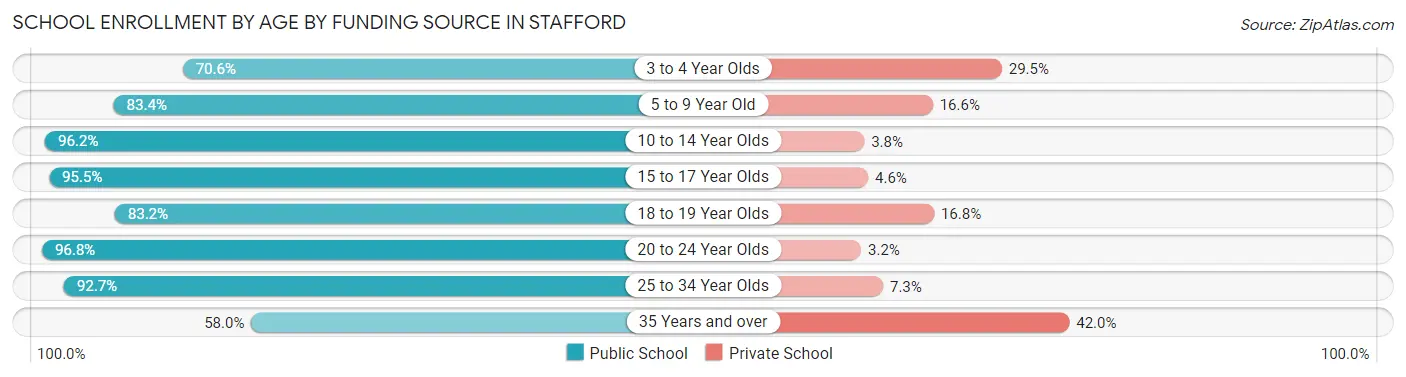
School Enrollment by Age by Funding Source in Stafford
Out of a total of 4,418 students who are enrolled in schools in Stafford, 451 (10.2%) attend a private institution, while the remaining 3,967 (89.8%) are enrolled in public schools. The age group of 35 years and over has the highest likelihood of being enrolled in private schools, with 87 (42.0% in the age bracket) enrolled. Conversely, the age group of 20 to 24 year olds has the lowest likelihood of being enrolled in a private school, with 777 (96.8% in the age bracket) attending a public institution.
| Age Bracket | Public School | Private School |
| 3 to 4 Year Olds | 103 (70.6%) | 43 (29.4%) |
| 5 to 9 Year Old | 910 (83.4%) | 181 (16.6%) |
| 10 to 14 Year Olds | 1,107 (96.2%) | 44 (3.8%) |
| 15 to 17 Year Olds | 546 (95.5%) | 26 (4.5%) |
| 18 to 19 Year Olds | 89 (83.2%) | 18 (16.8%) |
| 20 to 24 Year Olds | 777 (96.8%) | 26 (3.2%) |
| 25 to 34 Year Olds | 316 (92.7%) | 25 (7.3%) |
| 35 Years and over | 120 (58.0%) | 87 (42.0%) |
| Total | 3,967 (89.8%) | 451 (10.2%) |
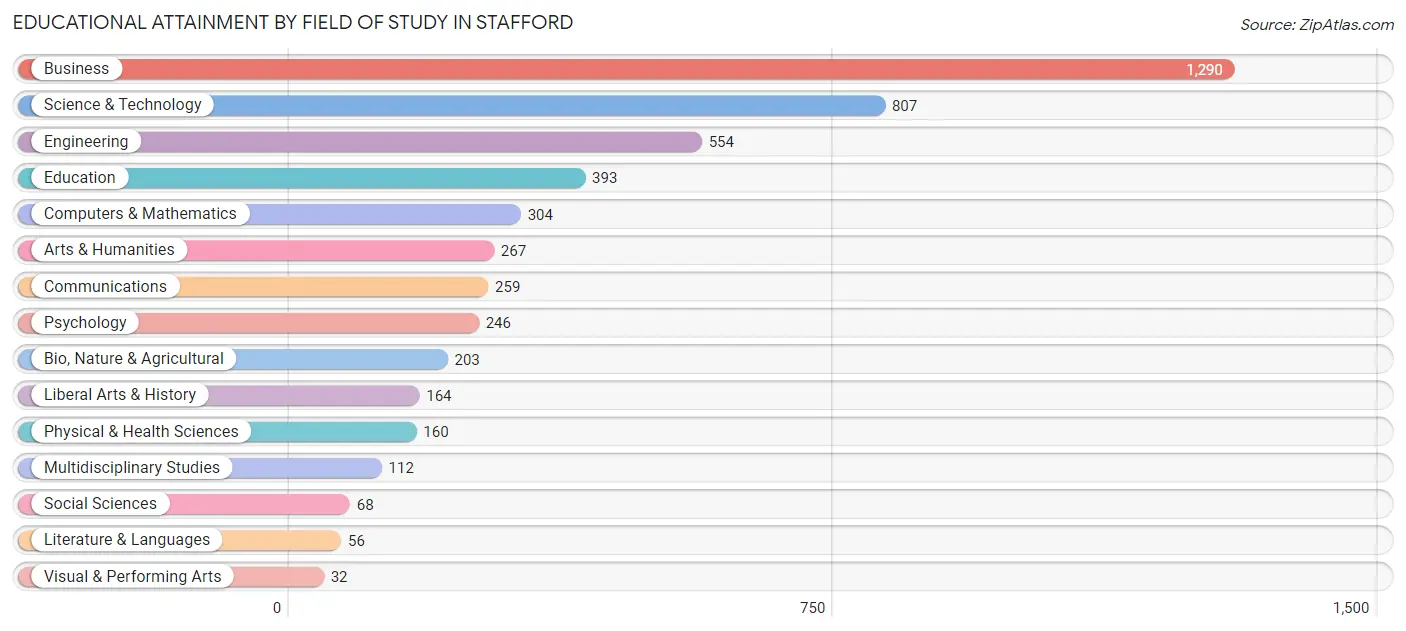
Educational Attainment by Field of Study in Stafford
Business (1,290 | 26.3%), science & technology (807 | 16.4%), engineering (554 | 11.3%), education (393 | 8.0%), and computers & mathematics (304 | 6.2%) are the most common fields of study among 4,915 individuals in Stafford who have obtained a bachelor's degree or higher.
| Field of Study | # Graduates | % Graduates |
| Computers & Mathematics | 304 | 6.2% |
| Bio, Nature & Agricultural | 203 | 4.1% |
| Physical & Health Sciences | 160 | 3.3% |
| Psychology | 246 | 5.0% |
| Social Sciences | 68 | 1.4% |
| Engineering | 554 | 11.3% |
| Multidisciplinary Studies | 112 | 2.3% |
| Science & Technology | 807 | 16.4% |
| Business | 1,290 | 26.3% |
| Education | 393 | 8.0% |
| Literature & Languages | 56 | 1.1% |
| Liberal Arts & History | 164 | 3.3% |
| Visual & Performing Arts | 32 | 0.6% |
| Communications | 259 | 5.3% |
| Arts & Humanities | 267 | 5.4% |
| Total | 4,915 | 100.0% |
Transportation & Commute in Stafford
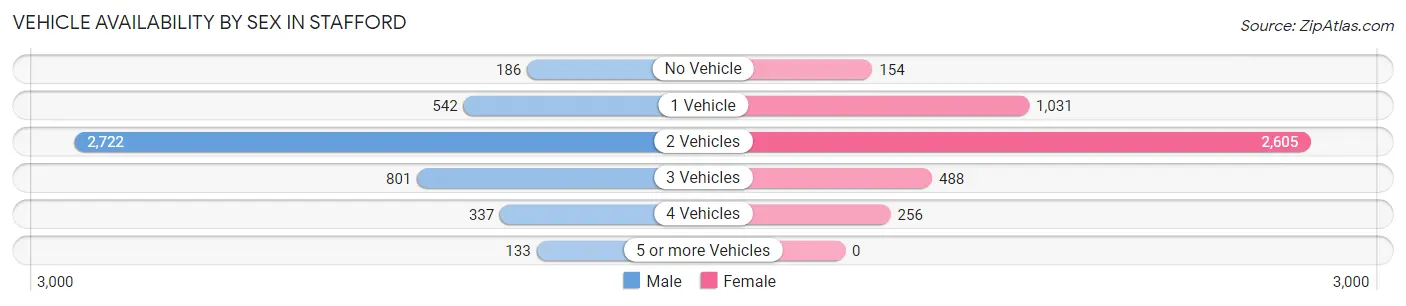
Vehicle Availability by Sex in Stafford
The most prevalent vehicle ownership categories in Stafford are males with 2 vehicles (2,722, accounting for 57.7%) and females with 2 vehicles (2,605, making up 60.0%).
| Vehicles Available | Male | Female |
| No Vehicle | 186 (3.9%) | 154 (3.4%) |
| 1 Vehicle | 542 (11.5%) | 1,031 (22.7%) |
| 2 Vehicles | 2,722 (57.7%) | 2,605 (57.5%) |
| 3 Vehicles | 801 (17.0%) | 488 (10.8%) |
| 4 Vehicles | 337 (7.1%) | 256 (5.7%) |
| 5 or more Vehicles | 133 (2.8%) | 0 (0.0%) |
| Total | 4,721 (100.0%) | 4,534 (100.0%) |
Commute Time in Stafford
The most frequently occuring commute durations in Stafford are 15 to 19 minutes (1,334 commuters, 15.7%), 20 to 24 minutes (1,060 commuters, 12.5%), and 5 to 9 minutes (1,045 commuters, 12.3%).
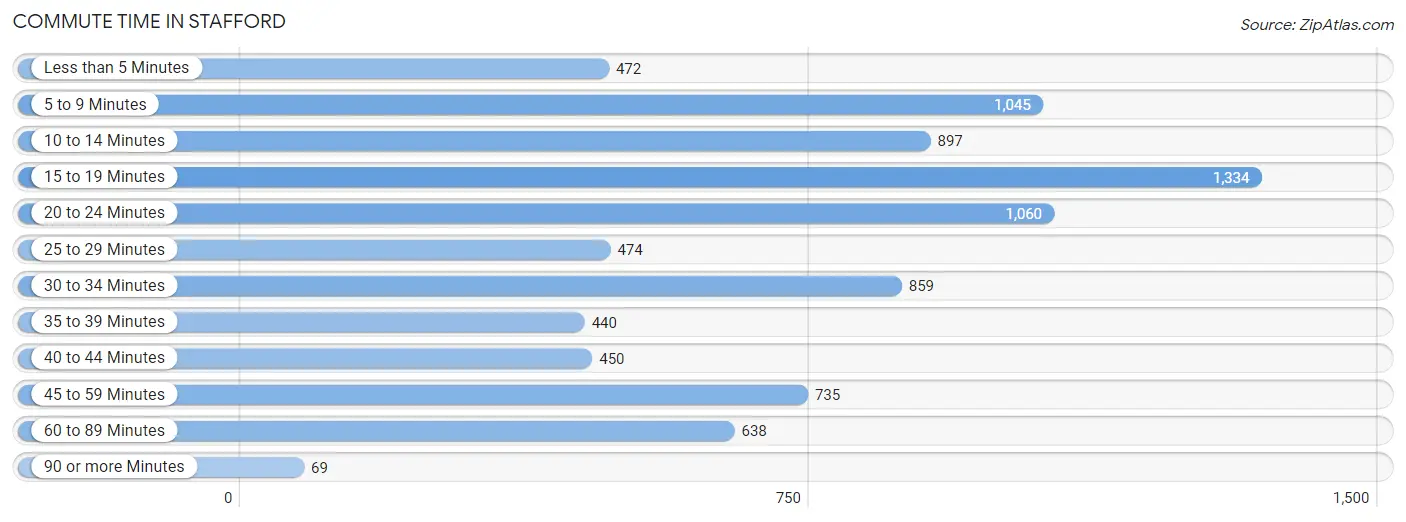
| Commute Time | # Commuters | % Commuters |
| Less than 5 Minutes | 472 | 5.6% |
| 5 to 9 Minutes | 1,045 | 12.3% |
| 10 to 14 Minutes | 897 | 10.6% |
| 15 to 19 Minutes | 1,334 | 15.7% |
| 20 to 24 Minutes | 1,060 | 12.5% |
| 25 to 29 Minutes | 474 | 5.6% |
| 30 to 34 Minutes | 859 | 10.1% |
| 35 to 39 Minutes | 440 | 5.2% |
| 40 to 44 Minutes | 450 | 5.3% |
| 45 to 59 Minutes | 735 | 8.7% |
| 60 to 89 Minutes | 638 | 7.5% |
| 90 or more Minutes | 69 | 0.8% |
Commute Time by Sex in Stafford
The most common commute times in Stafford are 15 to 19 minutes (673 commuters, 15.7%) for males and 15 to 19 minutes (661 commuters, 15.8%) for females.
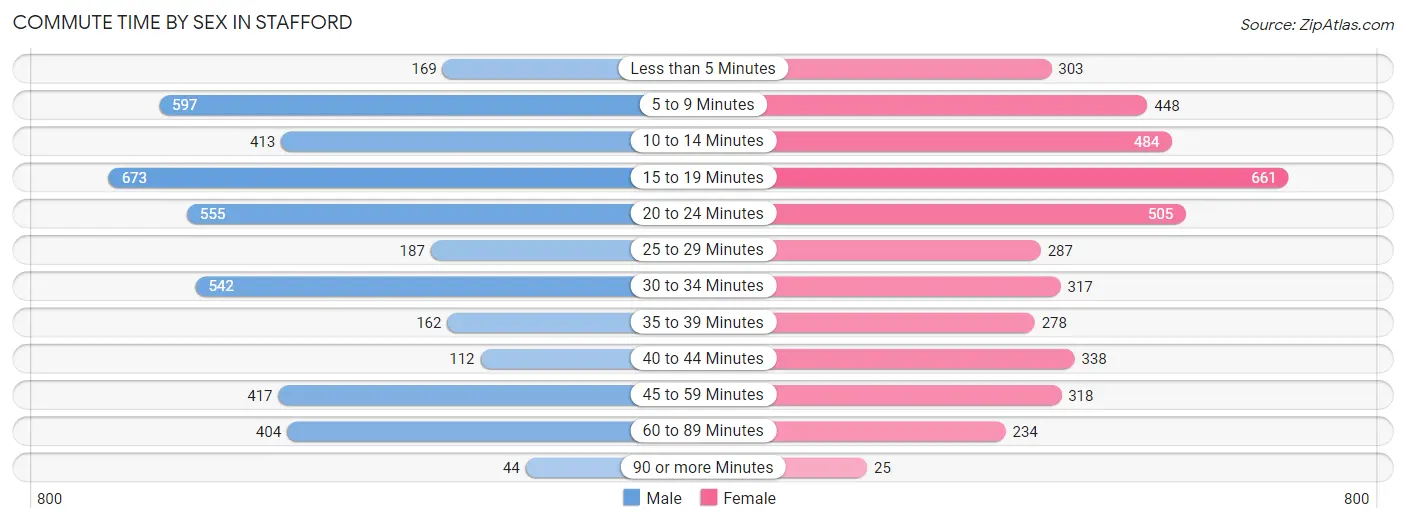
| Commute Time | Male | Female |
| Less than 5 Minutes | 169 (4.0%) | 303 (7.2%) |
| 5 to 9 Minutes | 597 (14.0%) | 448 (10.7%) |
| 10 to 14 Minutes | 413 (9.7%) | 484 (11.5%) |
| 15 to 19 Minutes | 673 (15.7%) | 661 (15.8%) |
| 20 to 24 Minutes | 555 (13.0%) | 505 (12.0%) |
| 25 to 29 Minutes | 187 (4.4%) | 287 (6.8%) |
| 30 to 34 Minutes | 542 (12.7%) | 317 (7.5%) |
| 35 to 39 Minutes | 162 (3.8%) | 278 (6.6%) |
| 40 to 44 Minutes | 112 (2.6%) | 338 (8.1%) |
| 45 to 59 Minutes | 417 (9.8%) | 318 (7.6%) |
| 60 to 89 Minutes | 404 (9.5%) | 234 (5.6%) |
| 90 or more Minutes | 44 (1.0%) | 25 (0.6%) |
Time of Departure to Work by Sex in Stafford
The most frequent times of departure to work in Stafford are 6:00 AM to 6:29 AM (719, 16.8%) for males and 8:00 AM to 8:29 AM (831, 19.8%) for females.
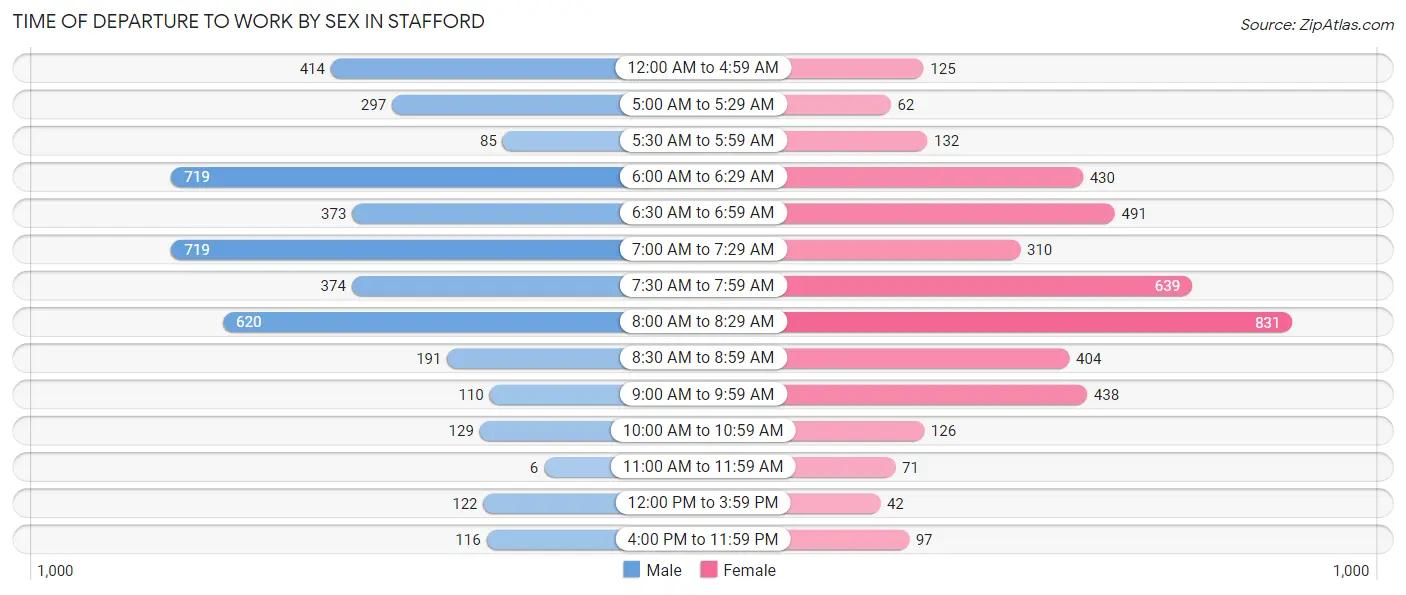
| Time of Departure | Male | Female |
| 12:00 AM to 4:59 AM | 414 (9.7%) | 125 (3.0%) |
| 5:00 AM to 5:29 AM | 297 (7.0%) | 62 (1.5%) |
| 5:30 AM to 5:59 AM | 85 (2.0%) | 132 (3.1%) |
| 6:00 AM to 6:29 AM | 719 (16.8%) | 430 (10.2%) |
| 6:30 AM to 6:59 AM | 373 (8.7%) | 491 (11.7%) |
| 7:00 AM to 7:29 AM | 719 (16.8%) | 310 (7.4%) |
| 7:30 AM to 7:59 AM | 374 (8.7%) | 639 (15.2%) |
| 8:00 AM to 8:29 AM | 620 (14.5%) | 831 (19.8%) |
| 8:30 AM to 8:59 AM | 191 (4.5%) | 404 (9.6%) |
| 9:00 AM to 9:59 AM | 110 (2.6%) | 438 (10.4%) |
| 10:00 AM to 10:59 AM | 129 (3.0%) | 126 (3.0%) |
| 11:00 AM to 11:59 AM | 6 (0.1%) | 71 (1.7%) |
| 12:00 PM to 3:59 PM | 122 (2.9%) | 42 (1.0%) |
| 4:00 PM to 11:59 PM | 116 (2.7%) | 97 (2.3%) |
| Total | 4,275 (100.0%) | 4,198 (100.0%) |
Housing Occupancy in Stafford
Occupancy by Ownership in Stafford
Of the total 6,458 dwellings in Stafford, owner-occupied units account for 2,956 (45.8%), while renter-occupied units make up 3,502 (54.2%).
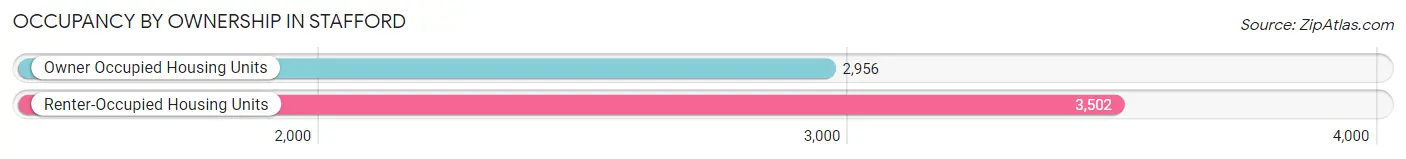
| Occupancy | # Housing Units | % Housing Units |
| Owner Occupied Housing Units | 2,956 | 45.8% |
| Renter-Occupied Housing Units | 3,502 | 54.2% |
| Total Occupied Housing Units | 6,458 | 100.0% |
Occupancy by Household Size in Stafford
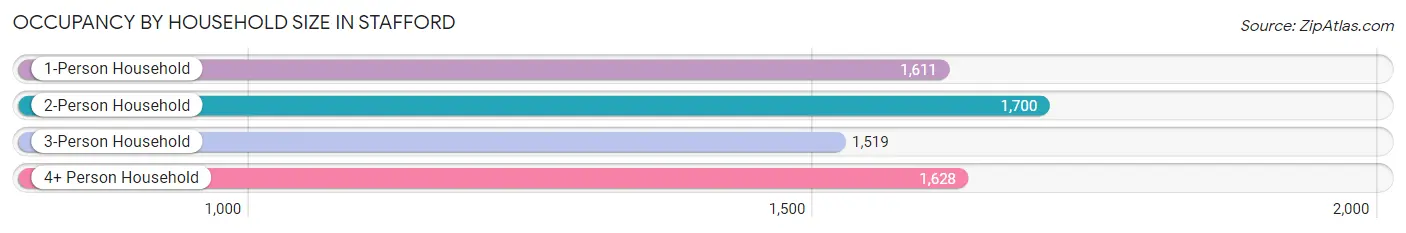
| Household Size | # Housing Units | % Housing Units |
| 1-Person Household | 1,611 | 24.9% |
| 2-Person Household | 1,700 | 26.3% |
| 3-Person Household | 1,519 | 23.5% |
| 4+ Person Household | 1,628 | 25.2% |
| Total Housing Units | 6,458 | 100.0% |
Occupancy by Ownership by Household Size in Stafford
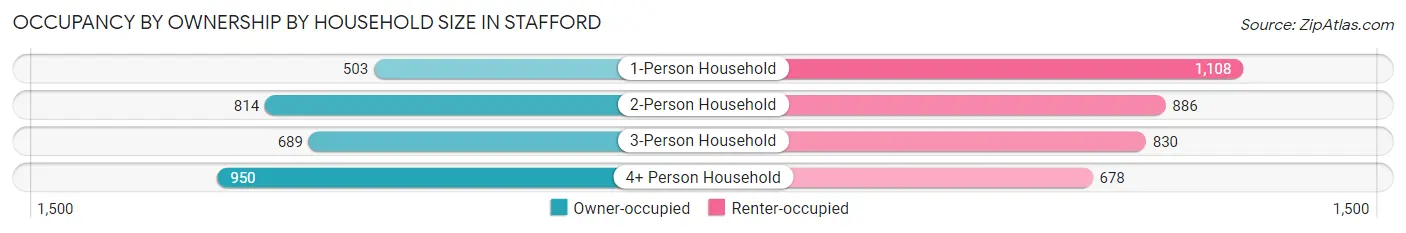
| Household Size | Owner-occupied | Renter-occupied |
| 1-Person Household | 503 (31.2%) | 1,108 (68.8%) |
| 2-Person Household | 814 (47.9%) | 886 (52.1%) |
| 3-Person Household | 689 (45.4%) | 830 (54.6%) |
| 4+ Person Household | 950 (58.4%) | 678 (41.6%) |
| Total Housing Units | 2,956 (45.8%) | 3,502 (54.2%) |
Occupancy by Educational Attainment in Stafford
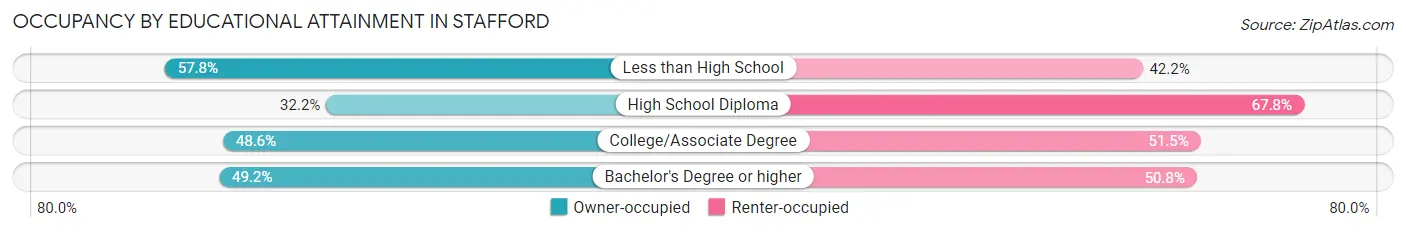
| Household Size | Owner-occupied | Renter-occupied |
| Less than High School | 294 (57.8%) | 215 (42.2%) |
| High School Diploma | 479 (32.2%) | 1,010 (67.8%) |
| College/Associate Degree | 756 (48.5%) | 801 (51.4%) |
| Bachelor's Degree or higher | 1,427 (49.2%) | 1,476 (50.8%) |
Occupancy by Age of Householder in Stafford
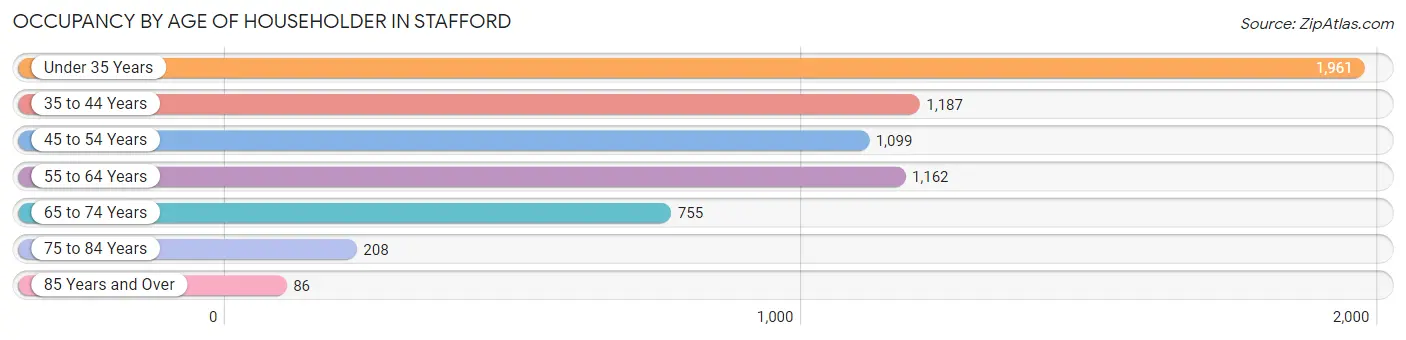
| Age Bracket | # Households | % Households |
| Under 35 Years | 1,961 | 30.4% |
| 35 to 44 Years | 1,187 | 18.4% |
| 45 to 54 Years | 1,099 | 17.0% |
| 55 to 64 Years | 1,162 | 18.0% |
| 65 to 74 Years | 755 | 11.7% |
| 75 to 84 Years | 208 | 3.2% |
| 85 Years and Over | 86 | 1.3% |
| Total | 6,458 | 100.0% |
Housing Finances in Stafford
Median Income by Occupancy in Stafford
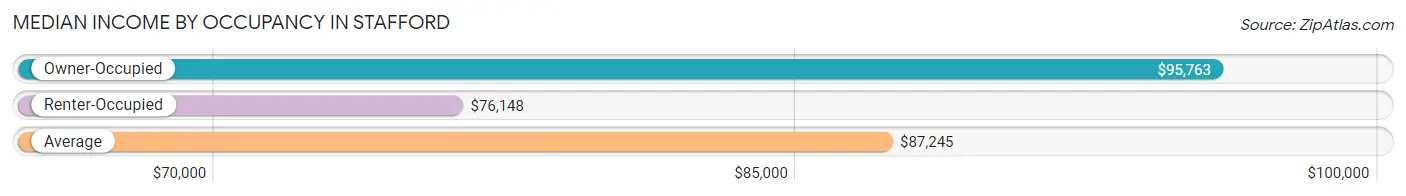
| Occupancy Type | # Households | Median Income |
| Owner-Occupied | 2,956 (45.8%) | $95,763 |
| Renter-Occupied | 3,502 (54.2%) | $76,148 |
| Average | 6,458 (100.0%) | $87,245 |
Occupancy by Householder Income Bracket in Stafford
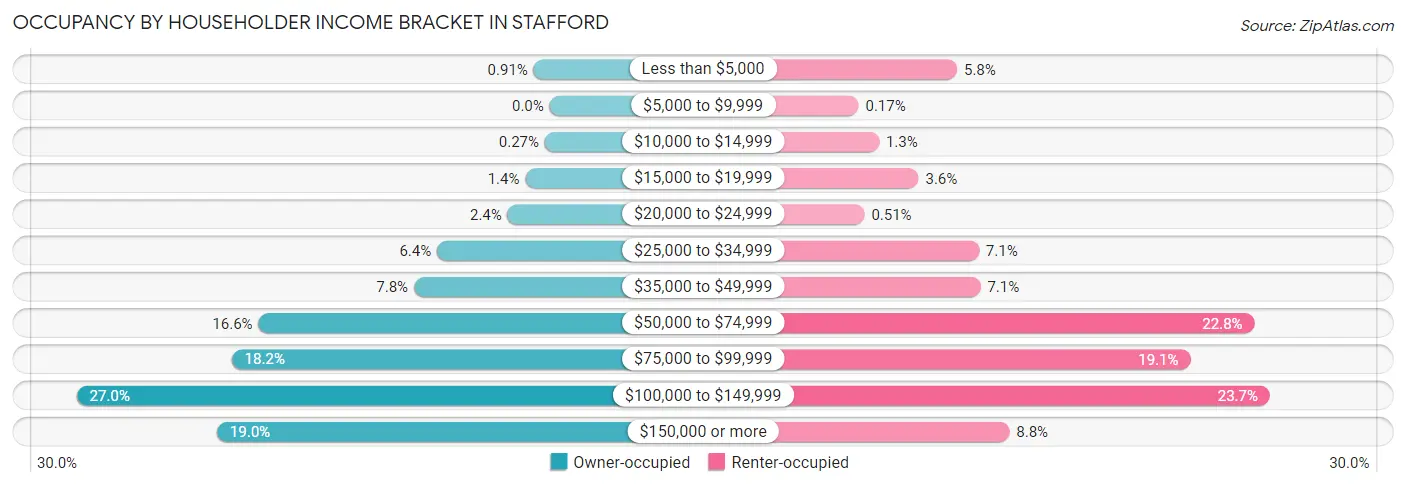
| Income Bracket | Owner-occupied | Renter-occupied |
| Less than $5,000 | 27 (0.9%) | 203 (5.8%) |
| $5,000 to $9,999 | 0 (0.0%) | 6 (0.2%) |
| $10,000 to $14,999 | 8 (0.3%) | 47 (1.3%) |
| $15,000 to $19,999 | 41 (1.4%) | 126 (3.6%) |
| $20,000 to $24,999 | 71 (2.4%) | 18 (0.5%) |
| $25,000 to $34,999 | 190 (6.4%) | 247 (7.0%) |
| $35,000 to $49,999 | 229 (7.7%) | 250 (7.1%) |
| $50,000 to $74,999 | 492 (16.6%) | 798 (22.8%) |
| $75,000 to $99,999 | 537 (18.2%) | 670 (19.1%) |
| $100,000 to $149,999 | 799 (27.0%) | 829 (23.7%) |
| $150,000 or more | 562 (19.0%) | 308 (8.8%) |
| Total | 2,956 (100.0%) | 3,502 (100.0%) |
Monthly Housing Cost Tiers in Stafford
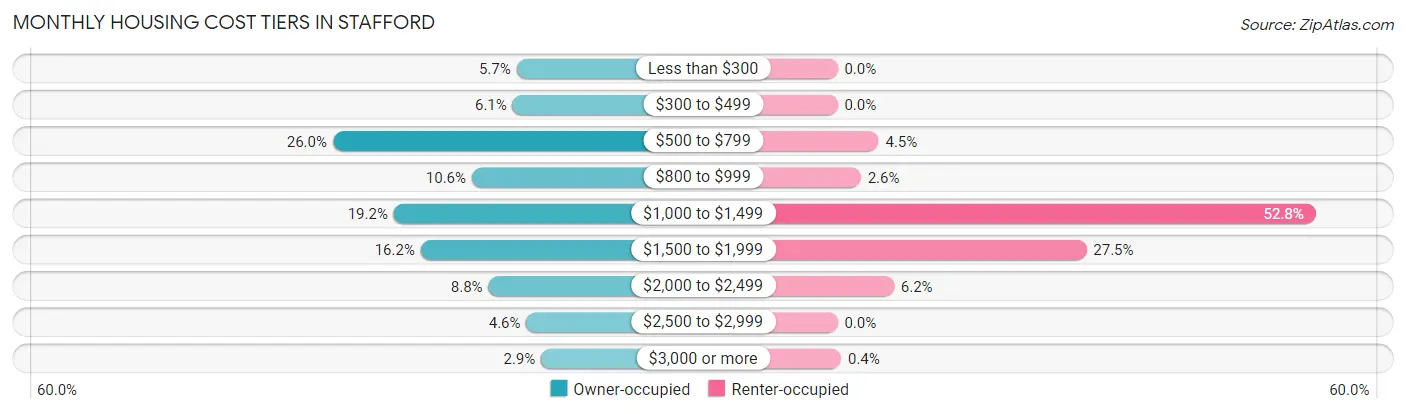
| Monthly Cost | Owner-occupied | Renter-occupied |
| Less than $300 | 167 (5.7%) | 0 (0.0%) |
| $300 to $499 | 180 (6.1%) | 0 (0.0%) |
| $500 to $799 | 767 (26.0%) | 159 (4.5%) |
| $800 to $999 | 313 (10.6%) | 90 (2.6%) |
| $1,000 to $1,499 | 568 (19.2%) | 1,850 (52.8%) |
| $1,500 to $1,999 | 480 (16.2%) | 963 (27.5%) |
| $2,000 to $2,499 | 259 (8.8%) | 218 (6.2%) |
| $2,500 to $2,999 | 135 (4.6%) | 0 (0.0%) |
| $3,000 or more | 87 (2.9%) | 14 (0.4%) |
| Total | 2,956 (100.0%) | 3,502 (100.0%) |
Physical Housing Characteristics in Stafford
Housing Structures in Stafford
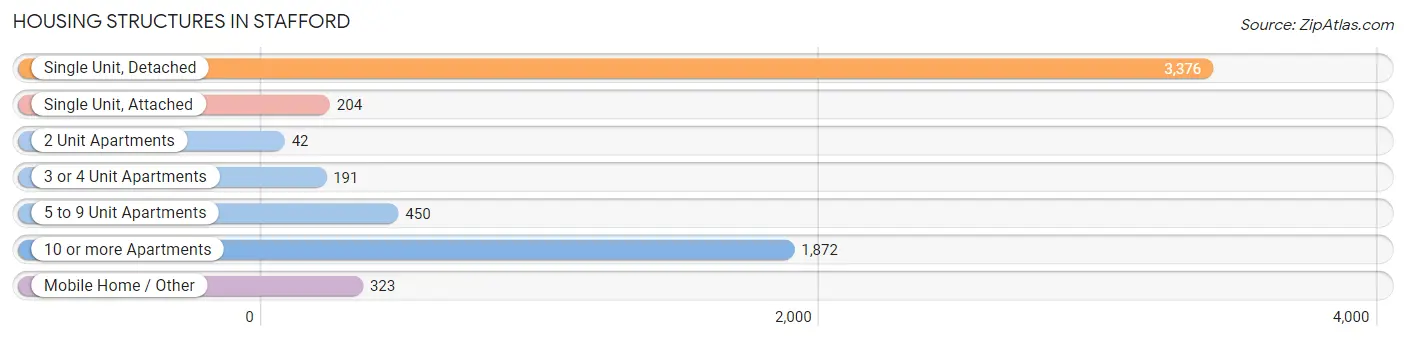
| Structure Type | # Housing Units | % Housing Units |
| Single Unit, Detached | 3,376 | 52.3% |
| Single Unit, Attached | 204 | 3.2% |
| 2 Unit Apartments | 42 | 0.6% |
| 3 or 4 Unit Apartments | 191 | 3.0% |
| 5 to 9 Unit Apartments | 450 | 7.0% |
| 10 or more Apartments | 1,872 | 29.0% |
| Mobile Home / Other | 323 | 5.0% |
| Total | 6,458 | 100.0% |
Housing Structures by Occupancy in Stafford
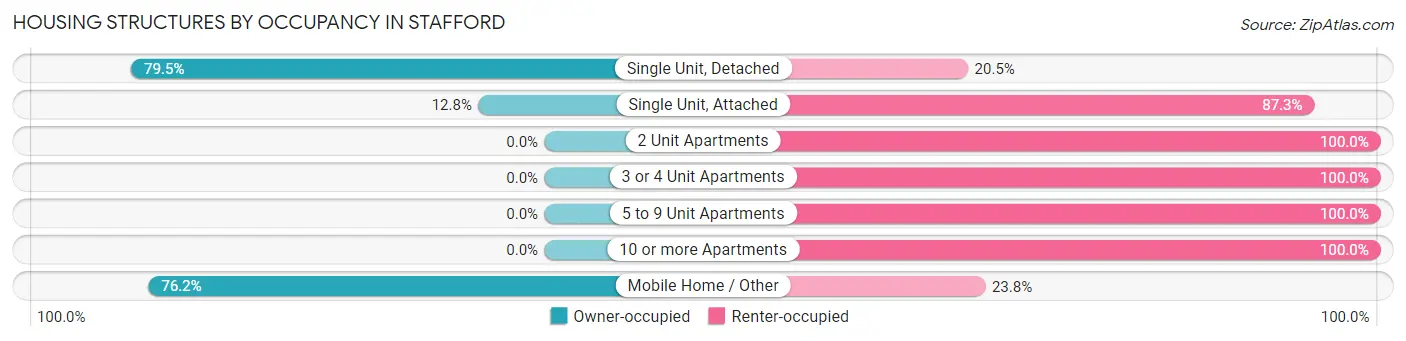
| Structure Type | Owner-occupied | Renter-occupied |
| Single Unit, Detached | 2,684 (79.5%) | 692 (20.5%) |
| Single Unit, Attached | 26 (12.8%) | 178 (87.3%) |
| 2 Unit Apartments | 0 (0.0%) | 42 (100.0%) |
| 3 or 4 Unit Apartments | 0 (0.0%) | 191 (100.0%) |
| 5 to 9 Unit Apartments | 0 (0.0%) | 450 (100.0%) |
| 10 or more Apartments | 0 (0.0%) | 1,872 (100.0%) |
| Mobile Home / Other | 246 (76.2%) | 77 (23.8%) |
| Total | 2,956 (45.8%) | 3,502 (54.2%) |
Housing Structures by Number of Rooms in Stafford
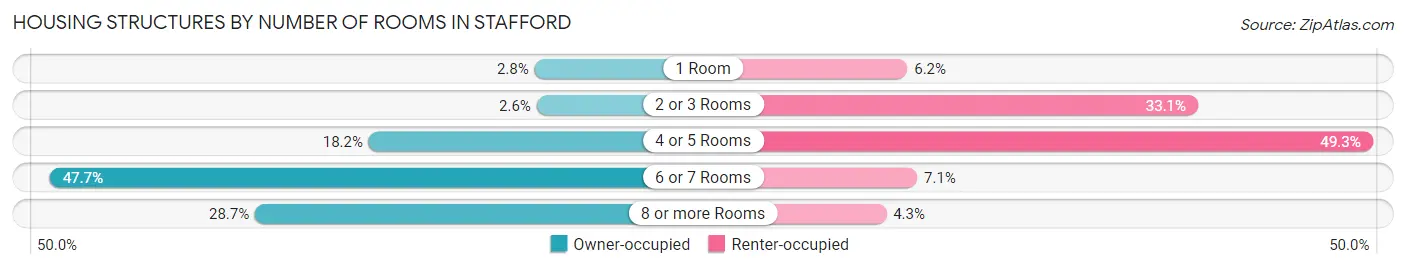
| Number of Rooms | Owner-occupied | Renter-occupied |
| 1 Room | 84 (2.8%) | 218 (6.2%) |
| 2 or 3 Rooms | 78 (2.6%) | 1,159 (33.1%) |
| 4 or 5 Rooms | 537 (18.2%) | 1,725 (49.3%) |
| 6 or 7 Rooms | 1,409 (47.7%) | 250 (7.1%) |
| 8 or more Rooms | 848 (28.7%) | 150 (4.3%) |
| Total | 2,956 (100.0%) | 3,502 (100.0%) |
Housing Structure by Heating Type in Stafford
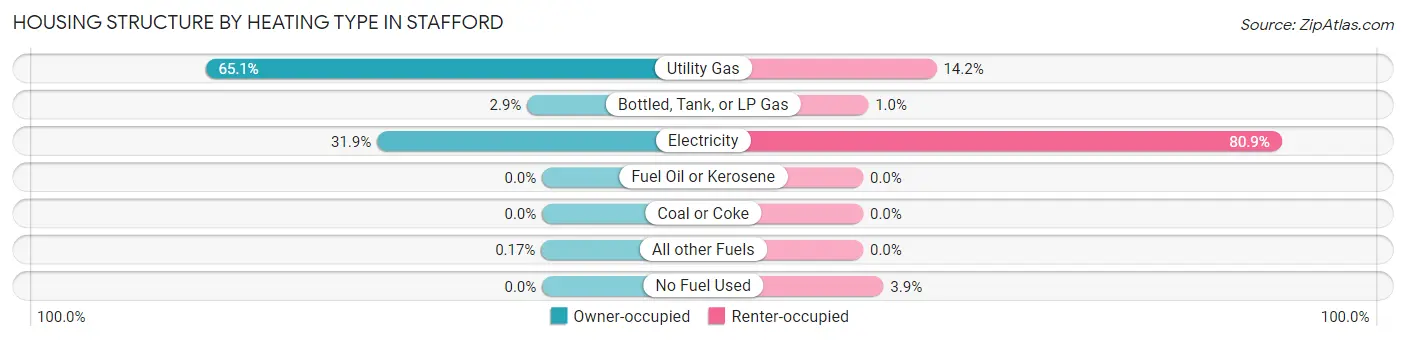
| Heating Type | Owner-occupied | Renter-occupied |
| Utility Gas | 1,923 (65.0%) | 497 (14.2%) |
| Bottled, Tank, or LP Gas | 85 (2.9%) | 35 (1.0%) |
| Electricity | 943 (31.9%) | 2,832 (80.9%) |
| Fuel Oil or Kerosene | 0 (0.0%) | 0 (0.0%) |
| Coal or Coke | 0 (0.0%) | 0 (0.0%) |
| All other Fuels | 5 (0.2%) | 0 (0.0%) |
| No Fuel Used | 0 (0.0%) | 138 (3.9%) |
| Total | 2,956 (100.0%) | 3,502 (100.0%) |
Household Vehicle Usage in Stafford
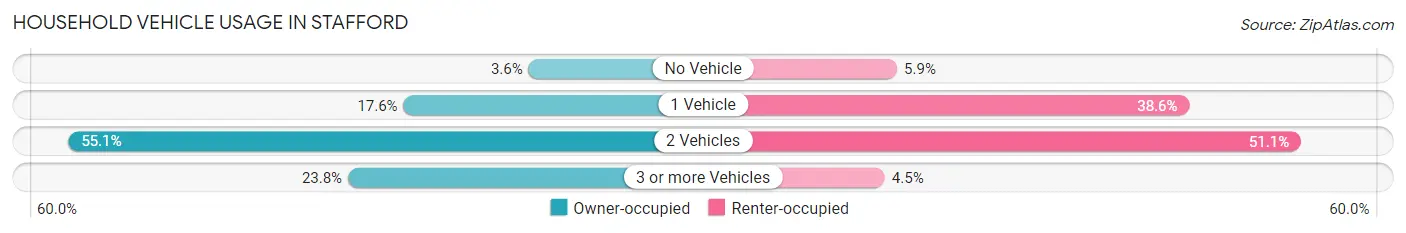
| Vehicles per Household | Owner-occupied | Renter-occupied |
| No Vehicle | 105 (3.5%) | 205 (5.9%) |
| 1 Vehicle | 519 (17.6%) | 1,351 (38.6%) |
| 2 Vehicles | 1,629 (55.1%) | 1,789 (51.1%) |
| 3 or more Vehicles | 703 (23.8%) | 157 (4.5%) |
| Total | 2,956 (100.0%) | 3,502 (100.0%) |
Real Estate & Mortgages in Stafford
Real Estate and Mortgage Overview in Stafford
| Characteristic | Without Mortgage | With Mortgage |
| Housing Units | 1,465 | 1,491 |
| Median Property Value | $224,800 | $230,500 |
| Median Household Income | $90,290 | $318 |
| Monthly Housing Costs | $660 | $87 |
| Real Estate Taxes | $3,073 | $144 |
Property Value by Mortgage Status in Stafford
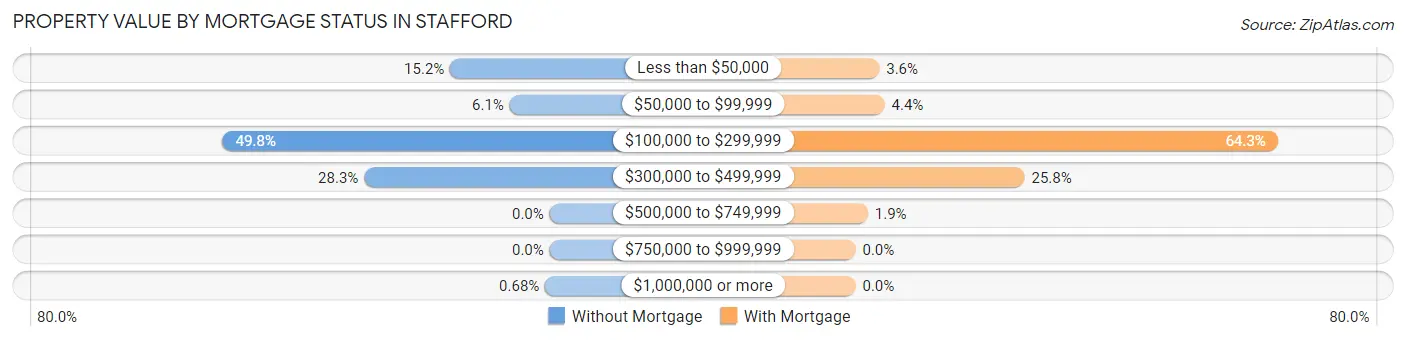
| Property Value | Without Mortgage | With Mortgage |
| Less than $50,000 | 222 (15.1%) | 54 (3.6%) |
| $50,000 to $99,999 | 89 (6.1%) | 66 (4.4%) |
| $100,000 to $299,999 | 730 (49.8%) | 959 (64.3%) |
| $300,000 to $499,999 | 414 (28.3%) | 384 (25.8%) |
| $500,000 to $749,999 | 0 (0.0%) | 28 (1.9%) |
| $750,000 to $999,999 | 0 (0.0%) | 0 (0.0%) |
| $1,000,000 or more | 10 (0.7%) | 0 (0.0%) |
| Total | 1,465 (100.0%) | 1,491 (100.0%) |
Household Income by Mortgage Status in Stafford
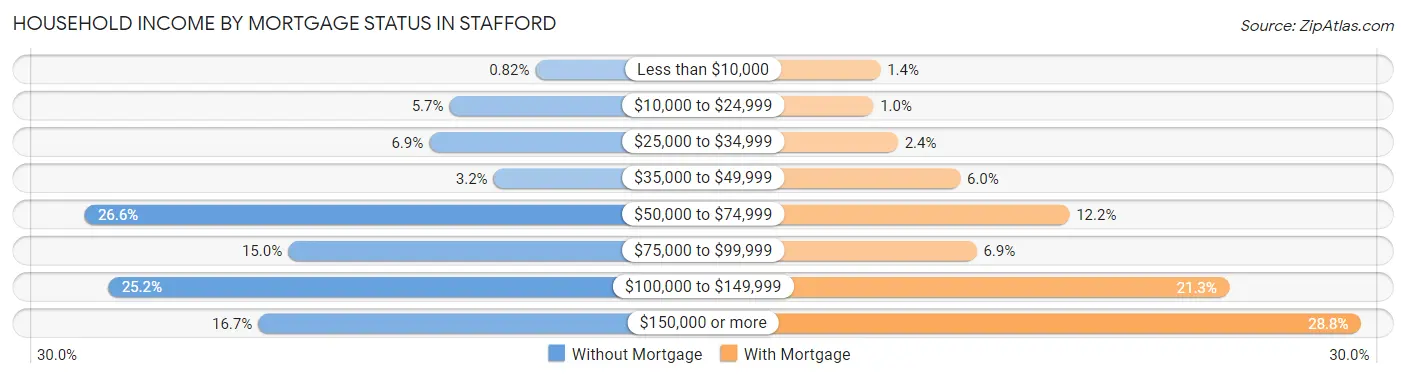
| Household Income | Without Mortgage | With Mortgage |
| Less than $10,000 | 12 (0.8%) | 21 (1.4%) |
| $10,000 to $24,999 | 84 (5.7%) | 15 (1.0%) |
| $25,000 to $34,999 | 101 (6.9%) | 36 (2.4%) |
| $35,000 to $49,999 | 47 (3.2%) | 89 (6.0%) |
| $50,000 to $74,999 | 389 (26.6%) | 182 (12.2%) |
| $75,000 to $99,999 | 219 (14.9%) | 103 (6.9%) |
| $100,000 to $149,999 | 369 (25.2%) | 318 (21.3%) |
| $150,000 or more | 244 (16.7%) | 430 (28.8%) |
| Total | 1,465 (100.0%) | 1,491 (100.0%) |
Property Value to Household Income Ratio in Stafford
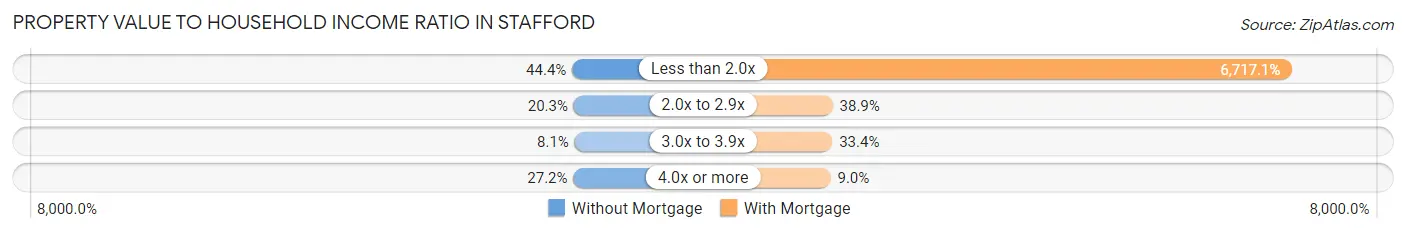
| Value-to-Income Ratio | Without Mortgage | With Mortgage |
| Less than 2.0x | 650 (44.4%) | 100,152 (6,717.1%) |
| 2.0x to 2.9x | 298 (20.3%) | 580 (38.9%) |
| 3.0x to 3.9x | 119 (8.1%) | 498 (33.4%) |
| 4.0x or more | 398 (27.2%) | 134 (9.0%) |
| Total | 1,465 (100.0%) | 1,491 (100.0%) |
Real Estate Taxes by Mortgage Status in Stafford
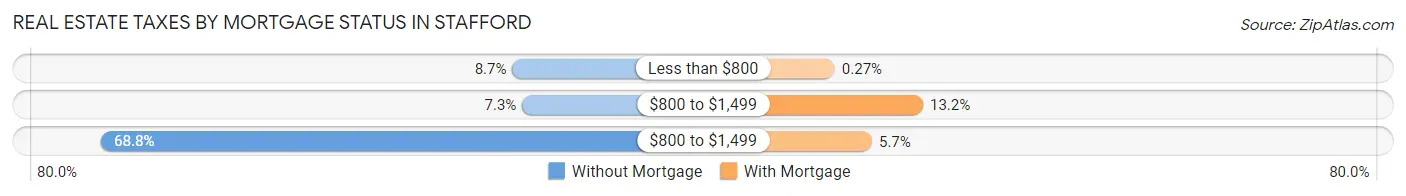
| Property Taxes | Without Mortgage | With Mortgage |
| Less than $800 | 128 (8.7%) | 4 (0.3%) |
| $800 to $1,499 | 107 (7.3%) | 196 (13.2%) |
| $800 to $1,499 | 1,008 (68.8%) | 85 (5.7%) |
| Total | 1,465 (100.0%) | 1,491 (100.0%) |
Health & Disability in Stafford
Health Insurance Coverage by Age in Stafford
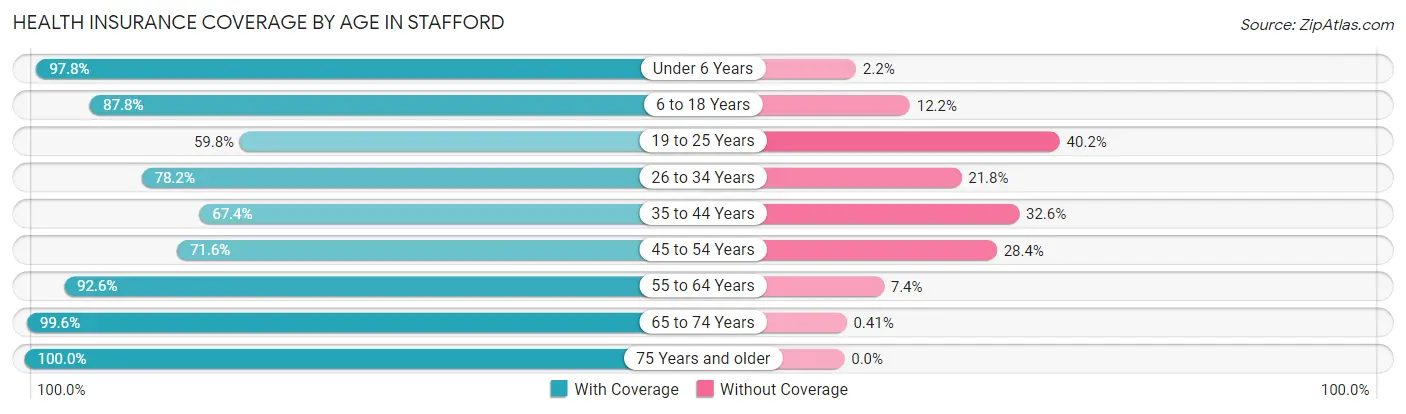
| Age Bracket | With Coverage | Without Coverage |
| Under 6 Years | 1,218 (97.8%) | 27 (2.2%) |
| 6 to 18 Years | 2,445 (87.8%) | 340 (12.2%) |
| 19 to 25 Years | 1,119 (59.8%) | 751 (40.2%) |
| 26 to 34 Years | 2,650 (78.2%) | 739 (21.8%) |
| 35 to 44 Years | 1,475 (67.4%) | 713 (32.6%) |
| 45 to 54 Years | 1,373 (71.6%) | 545 (28.4%) |
| 55 to 64 Years | 1,875 (92.6%) | 149 (7.4%) |
| 65 to 74 Years | 1,205 (99.6%) | 5 (0.4%) |
| 75 Years and older | 611 (100.0%) | 0 (0.0%) |
| Total | 13,971 (81.0%) | 3,269 (19.0%) |
Health Insurance Coverage by Citizenship Status in Stafford
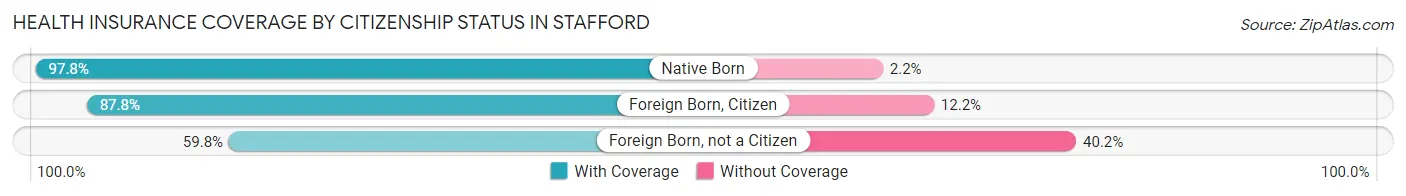
| Citizenship Status | With Coverage | Without Coverage |
| Native Born | 1,218 (97.8%) | 27 (2.2%) |
| Foreign Born, Citizen | 2,445 (87.8%) | 340 (12.2%) |
| Foreign Born, not a Citizen | 1,119 (59.8%) | 751 (40.2%) |
Health Insurance Coverage by Household Income in Stafford
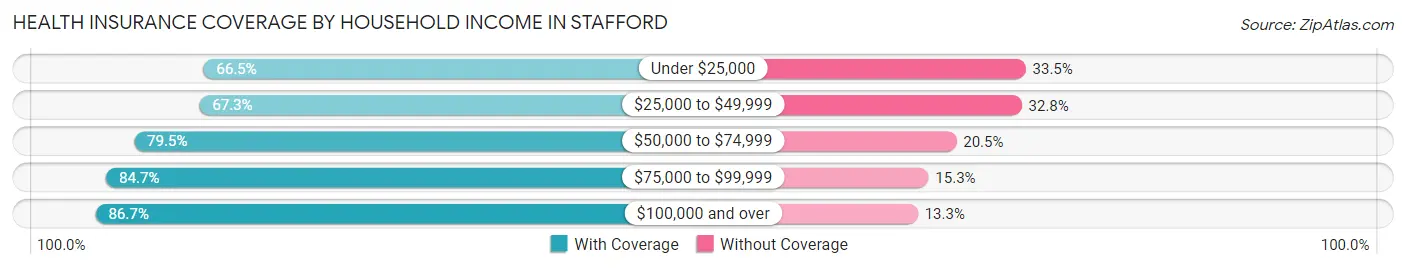
| Household Income | With Coverage | Without Coverage |
| Under $25,000 | 790 (66.5%) | 398 (33.5%) |
| $25,000 to $49,999 | 1,505 (67.2%) | 733 (32.8%) |
| $50,000 to $74,999 | 2,587 (79.5%) | 668 (20.5%) |
| $75,000 to $99,999 | 2,394 (84.7%) | 432 (15.3%) |
| $100,000 and over | 6,690 (86.7%) | 1,025 (13.3%) |
Public vs Private Health Insurance Coverage by Age in Stafford
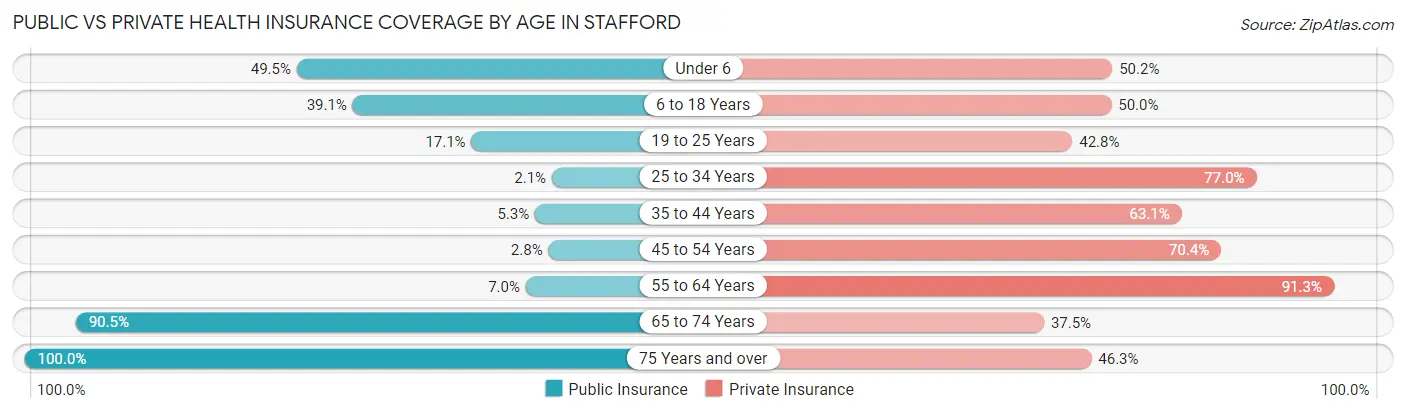
| Age Bracket | Public Insurance | Private Insurance |
| Under 6 | 616 (49.5%) | 625 (50.2%) |
| 6 to 18 Years | 1,089 (39.1%) | 1,393 (50.0%) |
| 19 to 25 Years | 319 (17.1%) | 800 (42.8%) |
| 25 to 34 Years | 72 (2.1%) | 2,608 (76.9%) |
| 35 to 44 Years | 115 (5.3%) | 1,380 (63.1%) |
| 45 to 54 Years | 53 (2.8%) | 1,350 (70.4%) |
| 55 to 64 Years | 141 (7.0%) | 1,848 (91.3%) |
| 65 to 74 Years | 1,095 (90.5%) | 454 (37.5%) |
| 75 Years and over | 611 (100.0%) | 283 (46.3%) |
| Total | 4,111 (23.8%) | 10,741 (62.3%) |
Disability Status by Sex by Age in Stafford
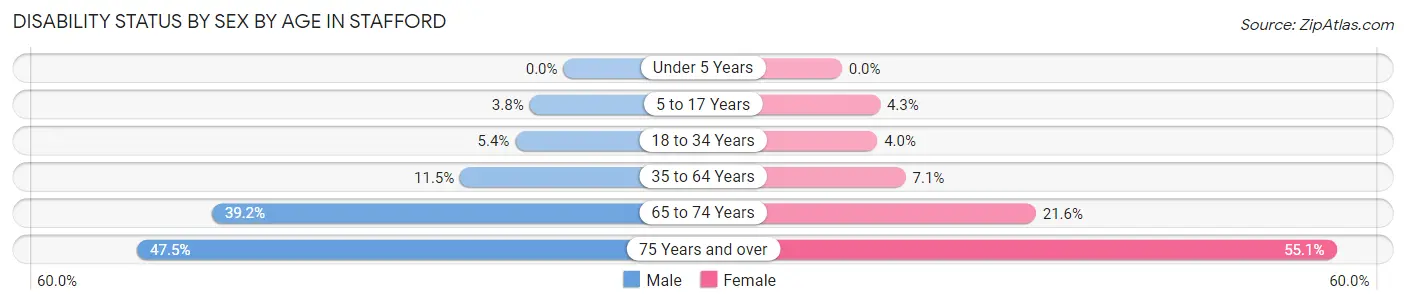
| Age Bracket | Male | Female |
| Under 5 Years | 0 (0.0%) | 0 (0.0%) |
| 5 to 17 Years | 65 (3.8%) | 48 (4.3%) |
| 18 to 34 Years | 139 (5.4%) | 107 (4.0%) |
| 35 to 64 Years | 359 (11.5%) | 214 (7.1%) |
| 65 to 74 Years | 211 (39.2%) | 145 (21.6%) |
| 75 Years and over | 140 (47.5%) | 174 (55.1%) |
Disability Class by Sex by Age in Stafford
Disability Class: Hearing Difficulty
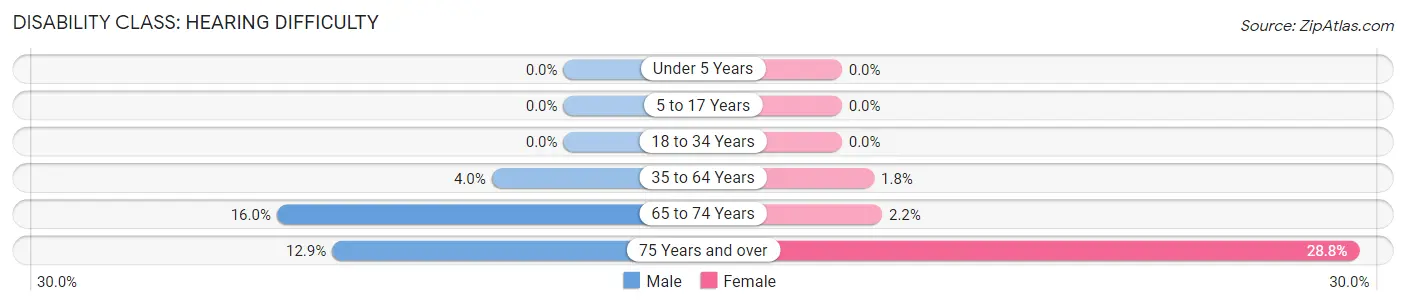
| Age Bracket | Male | Female |
| Under 5 Years | 0 (0.0%) | 0 (0.0%) |
| 5 to 17 Years | 0 (0.0%) | 0 (0.0%) |
| 18 to 34 Years | 0 (0.0%) | 0 (0.0%) |
| 35 to 64 Years | 125 (4.0%) | 54 (1.8%) |
| 65 to 74 Years | 86 (16.0%) | 15 (2.2%) |
| 75 Years and over | 38 (12.9%) | 91 (28.8%) |
Disability Class: Vision Difficulty
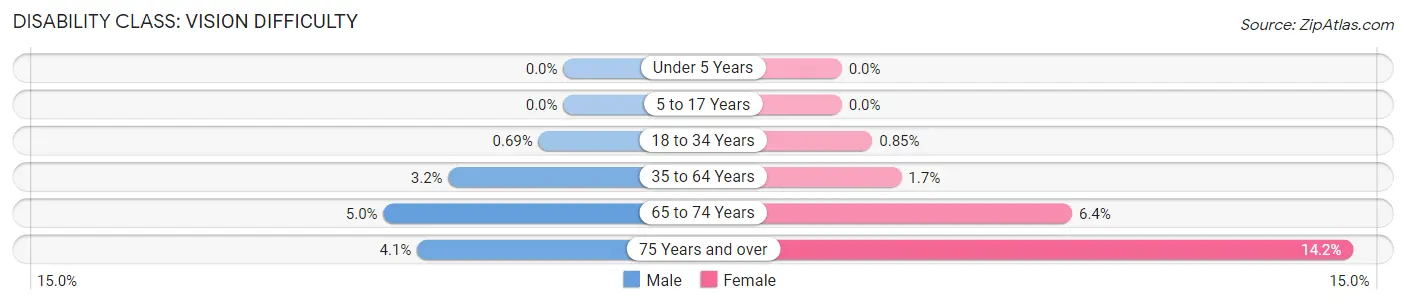
| Age Bracket | Male | Female |
| Under 5 Years | 0 (0.0%) | 0 (0.0%) |
| 5 to 17 Years | 0 (0.0%) | 0 (0.0%) |
| 18 to 34 Years | 18 (0.7%) | 23 (0.9%) |
| 35 to 64 Years | 100 (3.2%) | 50 (1.7%) |
| 65 to 74 Years | 27 (5.0%) | 43 (6.4%) |
| 75 Years and over | 12 (4.1%) | 45 (14.2%) |
Disability Class: Cognitive Difficulty
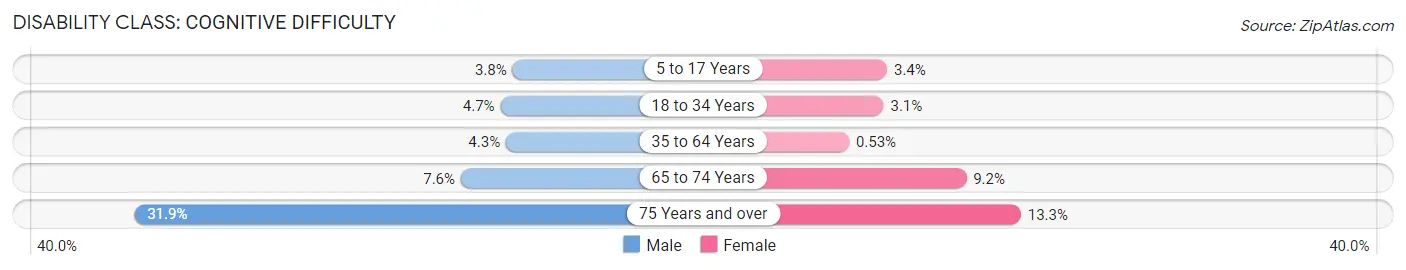
| Age Bracket | Male | Female |
| 5 to 17 Years | 65 (3.8%) | 38 (3.4%) |
| 18 to 34 Years | 121 (4.7%) | 84 (3.1%) |
| 35 to 64 Years | 133 (4.3%) | 16 (0.5%) |
| 65 to 74 Years | 41 (7.6%) | 62 (9.2%) |
| 75 Years and over | 94 (31.9%) | 42 (13.3%) |
Disability Class: Ambulatory Difficulty
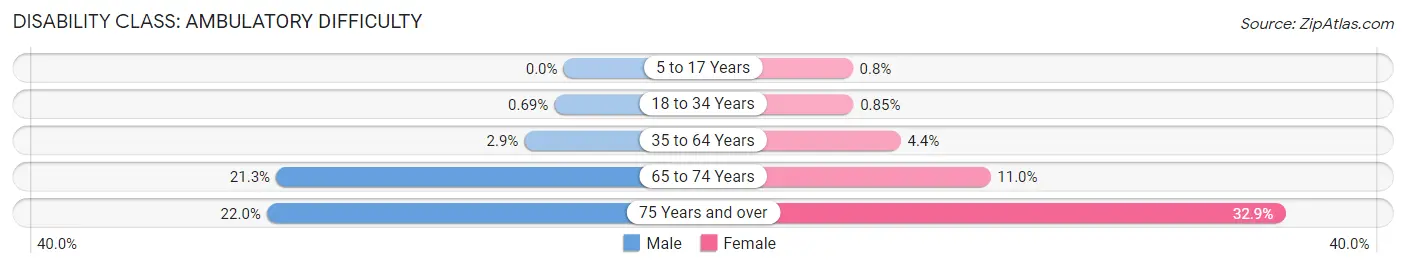
| Age Bracket | Male | Female |
| 5 to 17 Years | 0 (0.0%) | 9 (0.8%) |
| 18 to 34 Years | 18 (0.7%) | 23 (0.9%) |
| 35 to 64 Years | 91 (2.9%) | 131 (4.4%) |
| 65 to 74 Years | 115 (21.3%) | 74 (11.0%) |
| 75 Years and over | 65 (22.0%) | 104 (32.9%) |
Disability Class: Self-Care Difficulty
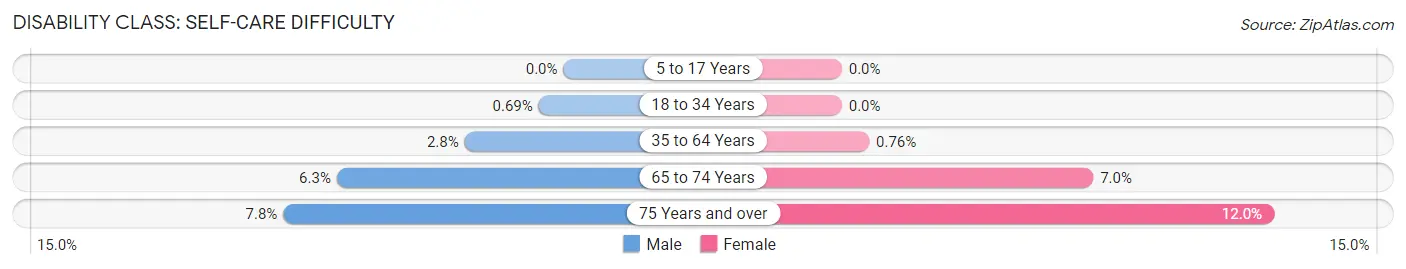
| Age Bracket | Male | Female |
| 5 to 17 Years | 0 (0.0%) | 0 (0.0%) |
| 18 to 34 Years | 18 (0.7%) | 0 (0.0%) |
| 35 to 64 Years | 86 (2.8%) | 23 (0.8%) |
| 65 to 74 Years | 34 (6.3%) | 47 (7.0%) |
| 75 Years and over | 23 (7.8%) | 38 (12.0%) |
Technology Access in Stafford
Computing Device Access in Stafford
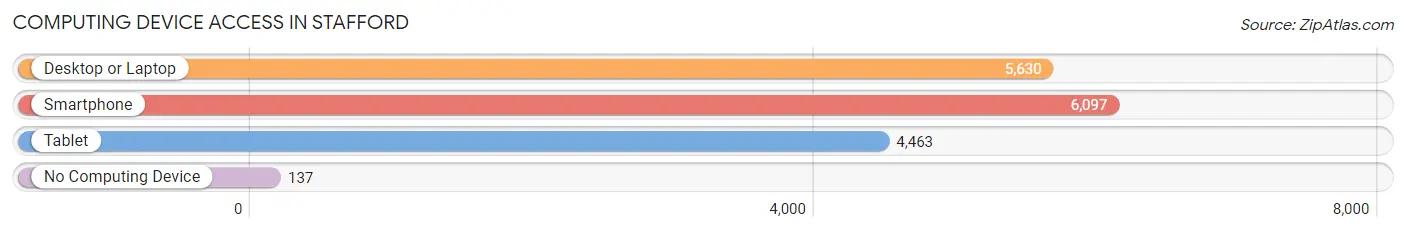
| Device Type | # Households | % Households |
| Desktop or Laptop | 5,630 | 87.2% |
| Smartphone | 6,097 | 94.4% |
| Tablet | 4,463 | 69.1% |
| No Computing Device | 137 | 2.1% |
| Total | 6,458 | 100.0% |
Internet Access in Stafford
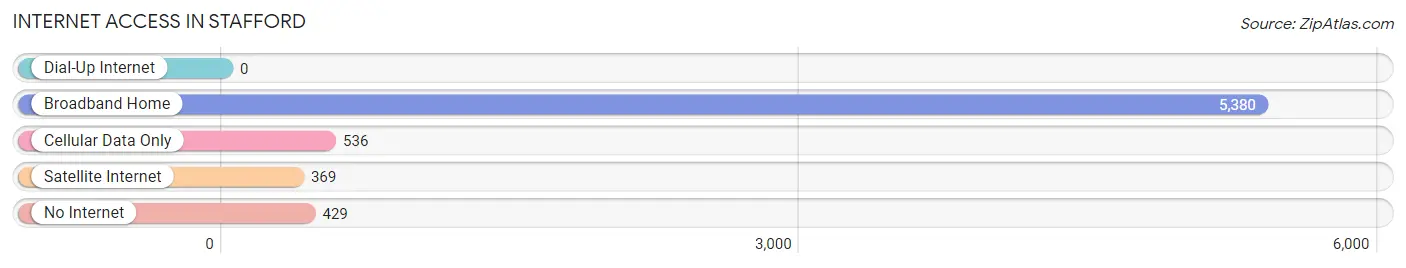
| Internet Type | # Households | % Households |
| Dial-Up Internet | 0 | 0.0% |
| Broadband Home | 5,380 | 83.3% |
| Cellular Data Only | 536 | 8.3% |
| Satellite Internet | 369 | 5.7% |
| No Internet | 429 | 6.6% |
| Total | 6,458 | 100.0% |
Stafford Summary
Stafford, Texas is a city located in Fort Bend County, Texas, United States. The city is part of the Houston–The Woodlands–Sugar Land metropolitan area. As of the 2010 census, the city population was 17,693, making it the second-largest city in Fort Bend County.
History
Stafford was founded in 1853 by William Stafford, a former slave who had purchased his freedom. He purchased land from the Mexican government and established a small farming community. The town was originally known as "Stafford's Point" and was later renamed "Staffordville". In 1883, the Galveston, Harrisburg and San Antonio Railway was built through the town, and the name was changed to "Stafford".
The city was incorporated in 1956 and has since grown to become one of the largest cities in Fort Bend County. The city is home to several large employers, including the University of Houston, the Houston Community College System, and the Houston Independent School District.
Geography
Stafford is located in southeastern Fort Bend County at 29°35′25″N 95°35′17″W (29.590278, -95.588333). It is bordered to the north by the city of Sugar Land, to the east by the city of Missouri City, to the south by the city of Houston, and to the west by the city of Richmond.
The city has a total area of 8 2 square miles 21 2 km2 all of it land
Economy
Stafford is home to several large employers, including the University of Houston, the Houston Community College System, and the Houston Independent School District. The city is also home to several major industrial and manufacturing companies, including Schlumberger, Halliburton, and Chevron.
Demographics
As of the 2010 census, there were 17,693 people, 6,845 households, and 4,845 families residing in the city. The population density was 2,153.3 people per square mile (830.2/km2). There were 7,541 housing units at an average density of 917.3 per square mile (354.2/km2). The racial makeup of the city was 57.2% White, 22.3% African American, 0.5% Native American, 8.2% Asian, 0.1% Pacific Islander, 8.7% from other races, and 3.1% from two or more races. Hispanic or Latino of any race were 24.2% of the population.
There were 6,845 households, out of which 33.2% had children under the age of 18 living with them, 48.2% were married couples living together, 15.7% had a female householder with no husband present, and 30.7% were non-families. 24.7% of all households were made up of individuals, and 8.2% had someone living alone who was 65 years of age or older. The average household size was 2.58 and the average family size was 3.09.
In the city, the population was spread out, with 25.2% under the age of 18, 8.7% from 18 to 24, 30.2% from 25 to 44, 24.2% from 45 to 64, and 11.7% who were 65 years of age or older. The median age was 36 years. For every 100 females, there were 93.2 males. For every 100 females age 18 and over, there were 89.7 males.
The median income for a household in the city was $50,945, and the median income for a family was $58,945. Males had a median income of $41,945 versus $31,945 for females. The per capita income for the city was $23,945. About 8.2% of families and 10.2% of the population were below the poverty line, including 14.2% of those under age 18 and 8.2% of those age 65 or over.
Common Questions
What is Per Capita Income in Stafford?
Per Capita income in Stafford is $37,617.
What is the Median Family Income in Stafford?
Median Family Income in Stafford is $97,853.
What is the Median Household income in Stafford?
Median Household Income in Stafford is $87,245.
What is Income or Wage Gap in Stafford?
Income or Wage Gap in Stafford is 21.4%.
Women in Stafford earn 78.6 cents for every dollar earned by a man.
What is Family Income Deficit in Stafford?
Family Income Deficit in Stafford is $12,054.
Families that are below poverty line in Stafford earn $12,054 less on average than the poverty threshold level.
What is Inequality or Gini Index in Stafford?
Inequality or Gini Index in Stafford is 0.38.
What is the Total Population of Stafford?
Total Population of Stafford is 17,240.
What is the Total Male Population of Stafford?
Total Male Population of Stafford is 8,882.
What is the Total Female Population of Stafford?
Total Female Population of Stafford is 8,358.
What is the Ratio of Males per 100 Females in Stafford?
There are 106.27 Males per 100 Females in Stafford.
What is the Ratio of Females per 100 Males in Stafford?
There are 94.10 Females per 100 Males in Stafford.
What is the Median Population Age in Stafford?
Median Population Age in Stafford is 32.6 Years.
What is the Average Family Size in Stafford
Average Family Size in Stafford is 3.2 People.
What is the Average Household Size in Stafford
Average Household Size in Stafford is 2.7 People.
How Large is the Labor Force in Stafford?
There are 10,164 People in the Labor Forcein in Stafford.
What is the Percentage of People in the Labor Force in Stafford?
74.7% of People are in the Labor Force in Stafford.
What is the Unemployment Rate in Stafford?
Unemployment Rate in Stafford is 3.9%.