Miami Lakes, FL Map & Demographics
Miami Lakes Map
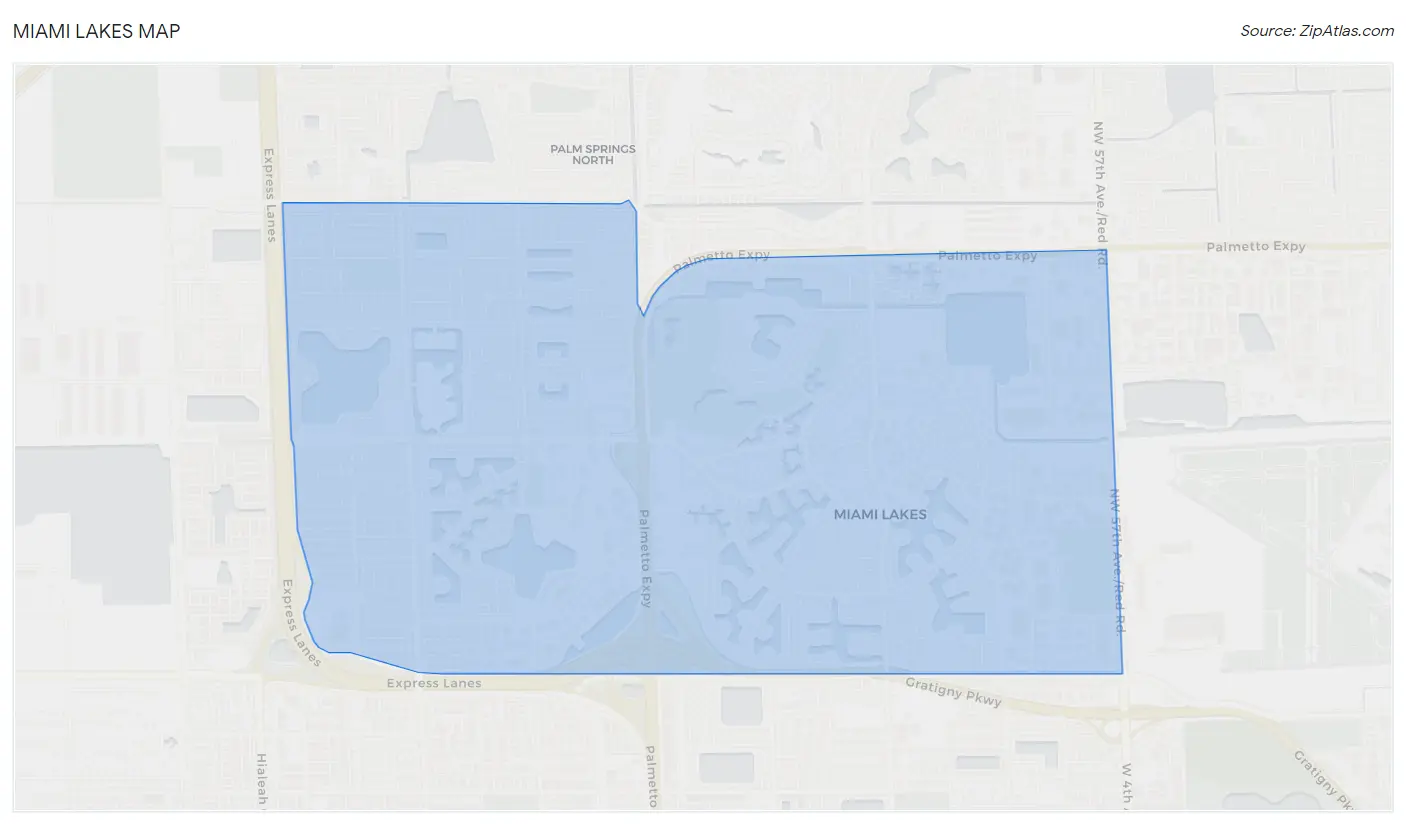
Miami Lakes Overview
$42,709
PER CAPITA INCOME
$100,217
AVG FAMILY INCOME
$90,339
AVG HOUSEHOLD INCOME
7.2%
WAGE / INCOME GAP [ % ]
92.8¢/ $1
WAGE / INCOME GAP [ $ ]
0.41
INEQUALITY / GINI INDEX
30,621
TOTAL POPULATION
15,027
MALE POPULATION
15,594
FEMALE POPULATION
96.36
MALES / 100 FEMALES
103.77
FEMALES / 100 MALES
42.8
MEDIAN AGE
3.2
AVG FAMILY SIZE
2.8
AVG HOUSEHOLD SIZE
17,704
LABOR FORCE [ PEOPLE ]
69.6%
PERCENT IN LABOR FORCE
3.2%
UNEMPLOYMENT RATE
Income in Miami Lakes
Income Overview in Miami Lakes
Per Capita Income in Miami Lakes is $42,709, while median incomes of families and households are $100,217 and $90,339 respectively.
| Characteristic | Number | Measure |
| Per Capita Income | 30,621 | $42,709 |
| Median Family Income | 7,972 | $100,217 |
| Mean Family Income | 7,972 | $126,167 |
| Median Household Income | 11,073 | $90,339 |
| Mean Household Income | 11,073 | $115,962 |
| Income Deficit | 7,972 | $0 |
| Wage / Income Gap (%) | 30,621 | 7.19% |
| Wage / Income Gap ($) | 30,621 | 92.81¢ per $1 |
| Gini / Inequality Index | 30,621 | 0.41 |
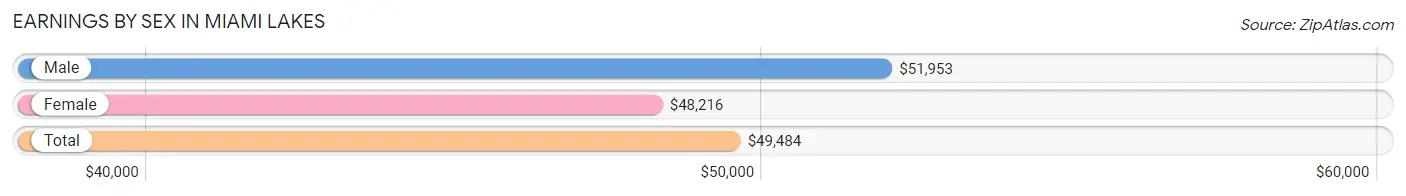
Earnings by Sex in Miami Lakes
Average Earnings in Miami Lakes are $49,484, $51,953 for men and $48,216 for women, a difference of 7.2%.
| Sex | Number | Average Earnings |
| Male | 9,542 (51.9%) | $51,953 |
| Female | 8,836 (48.1%) | $48,216 |
| Total | 18,378 (100.0%) | $49,484 |
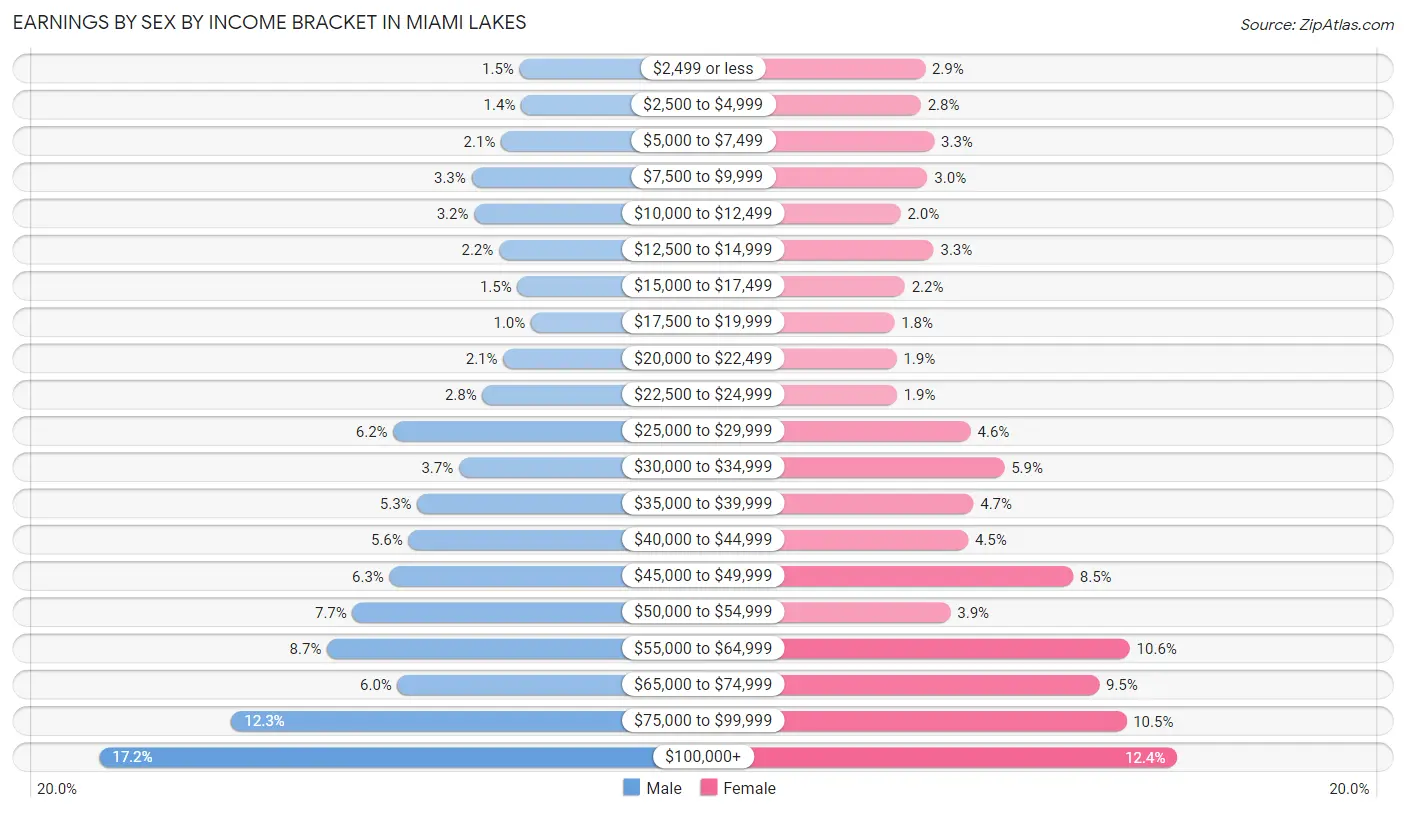
Earnings by Sex by Income Bracket in Miami Lakes
The most common earnings brackets in Miami Lakes are $100,000+ for men (1,641 | 17.2%) and $100,000+ for women (1,094 | 12.4%).
| Income | Male | Female |
| $2,499 or less | 138 (1.5%) | 259 (2.9%) |
| $2,500 to $4,999 | 133 (1.4%) | 245 (2.8%) |
| $5,000 to $7,499 | 204 (2.1%) | 289 (3.3%) |
| $7,500 to $9,999 | 310 (3.3%) | 267 (3.0%) |
| $10,000 to $12,499 | 301 (3.2%) | 178 (2.0%) |
| $12,500 to $14,999 | 212 (2.2%) | 287 (3.3%) |
| $15,000 to $17,499 | 146 (1.5%) | 192 (2.2%) |
| $17,500 to $19,999 | 97 (1.0%) | 157 (1.8%) |
| $20,000 to $22,499 | 197 (2.1%) | 164 (1.9%) |
| $22,500 to $24,999 | 271 (2.8%) | 165 (1.9%) |
| $25,000 to $29,999 | 590 (6.2%) | 410 (4.6%) |
| $30,000 to $34,999 | 355 (3.7%) | 521 (5.9%) |
| $35,000 to $39,999 | 504 (5.3%) | 419 (4.7%) |
| $40,000 to $44,999 | 535 (5.6%) | 401 (4.5%) |
| $45,000 to $49,999 | 603 (6.3%) | 748 (8.5%) |
| $50,000 to $54,999 | 736 (7.7%) | 343 (3.9%) |
| $55,000 to $64,999 | 826 (8.7%) | 937 (10.6%) |
| $65,000 to $74,999 | 574 (6.0%) | 835 (9.5%) |
| $75,000 to $99,999 | 1,169 (12.2%) | 925 (10.5%) |
| $100,000+ | 1,641 (17.2%) | 1,094 (12.4%) |
| Total | 9,542 (100.0%) | 8,836 (100.0%) |
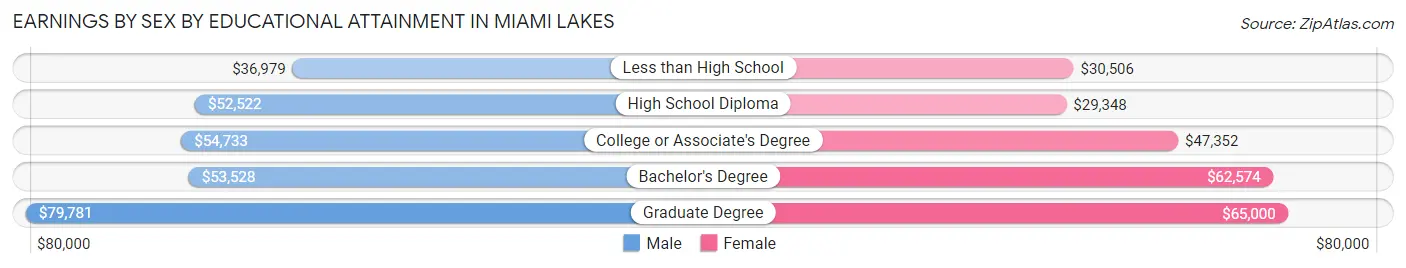
Earnings by Sex by Educational Attainment in Miami Lakes
Average earnings in Miami Lakes are $54,875 for men and $50,725 for women, a difference of 7.6%. Men with an educational attainment of graduate degree enjoy the highest average annual earnings of $79,781, while those with less than high school education earn the least with $36,979. Women with an educational attainment of graduate degree earn the most with the average annual earnings of $65,000, while those with high school diploma education have the smallest earnings of $29,348.
| Educational Attainment | Male Income | Female Income |
| Less than High School | $36,979 | $30,506 |
| High School Diploma | $52,522 | $29,348 |
| College or Associate's Degree | $54,733 | $47,352 |
| Bachelor's Degree | $53,528 | $62,574 |
| Graduate Degree | $79,781 | $65,000 |
| Total | $54,875 | $50,725 |
Family Income in Miami Lakes
Family Income Brackets in Miami Lakes
According to the Miami Lakes family income data, there are 1,666 families falling into the $100,000 to $149,999 income range, which is the most common income bracket and makes up 20.9% of all families. Conversely, the less than $10,000 income bracket is the least frequent group with only 40 families (0.5%) belonging to this category.
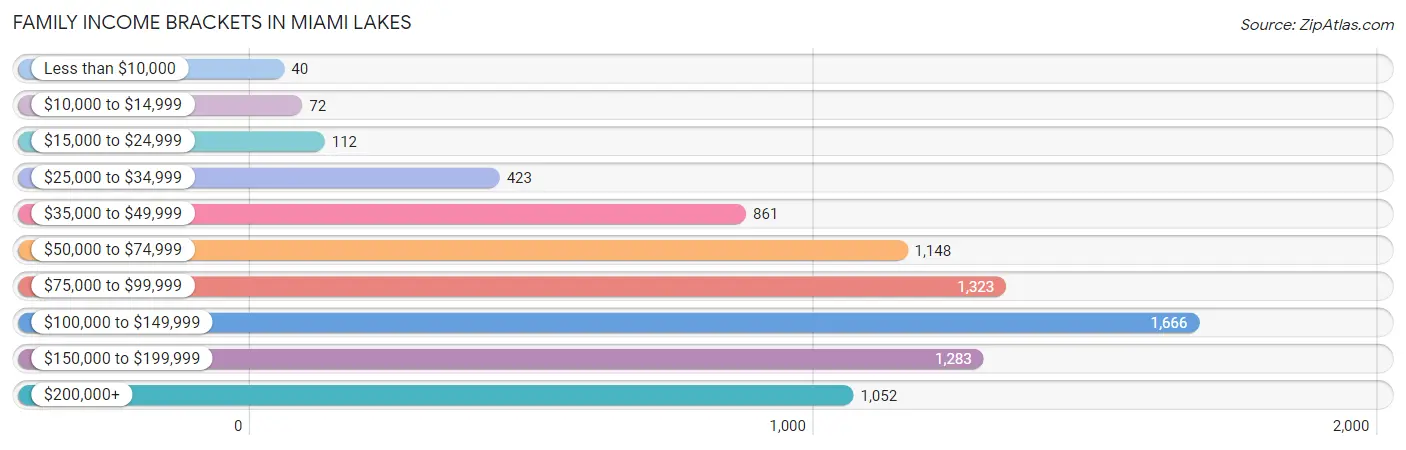
| Income Bracket | # Families | % Families |
| Less than $10,000 | 40 | 0.5% |
| $10,000 to $14,999 | 72 | 0.9% |
| $15,000 to $24,999 | 112 | 1.4% |
| $25,000 to $34,999 | 423 | 5.3% |
| $35,000 to $49,999 | 861 | 10.8% |
| $50,000 to $74,999 | 1,148 | 14.4% |
| $75,000 to $99,999 | 1,323 | 16.6% |
| $100,000 to $149,999 | 1,666 | 20.9% |
| $150,000 to $199,999 | 1,283 | 16.1% |
| $200,000+ | 1,052 | 13.2% |
Family Income by Famaliy Size in Miami Lakes
7+ person families (52 | 0.6%) account for the highest median family income in Miami Lakes with $193,750 per family, while 2-person families (2,819 | 35.4%) have the highest median income of $39,448 per family member.
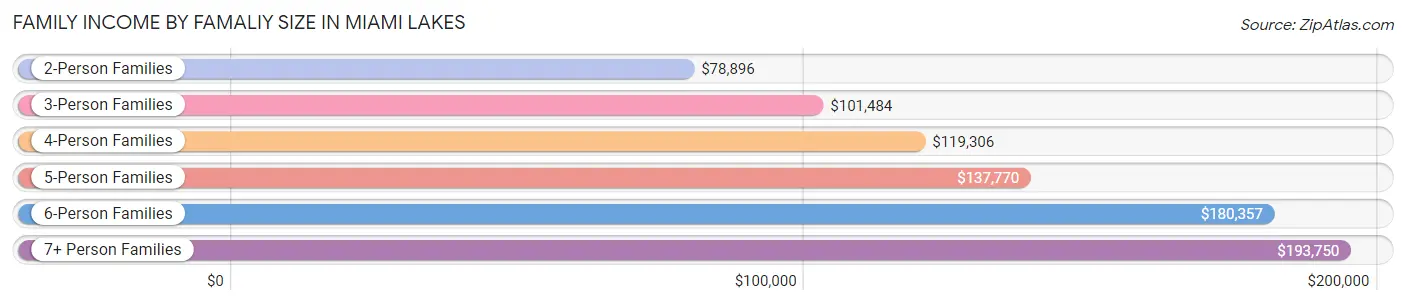
| Income Bracket | # Families | Median Income |
| 2-Person Families | 2,819 (35.4%) | $78,896 |
| 3-Person Families | 2,509 (31.5%) | $101,484 |
| 4-Person Families | 1,862 (23.4%) | $119,306 |
| 5-Person Families | 638 (8.0%) | $137,770 |
| 6-Person Families | 92 (1.1%) | $180,357 |
| 7+ Person Families | 52 (0.6%) | $193,750 |
| Total | 7,972 (100.0%) | $100,217 |
Family Income by Number of Earners in Miami Lakes
The median family income in Miami Lakes is $100,217, with families comprising 3+ earners (1,466) having the highest median family income of $138,113, while families with no earners (669) have the lowest median family income of $50,110, accounting for 18.4% and 8.4% of families, respectively.
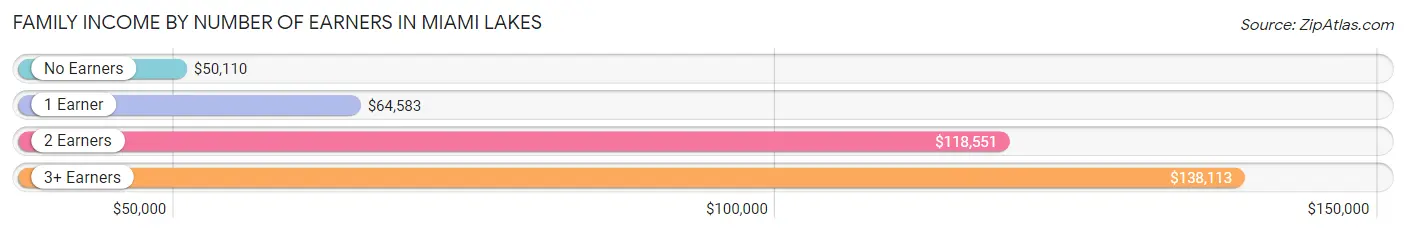
| Number of Earners | # Families | Median Income |
| No Earners | 669 (8.4%) | $50,110 |
| 1 Earner | 2,226 (27.9%) | $64,583 |
| 2 Earners | 3,611 (45.3%) | $118,551 |
| 3+ Earners | 1,466 (18.4%) | $138,113 |
| Total | 7,972 (100.0%) | $100,217 |
Household Income in Miami Lakes
Household Income Brackets in Miami Lakes
With 2,148 households falling in the category, the $100,000 to $149,999 income range is the most frequent in Miami Lakes, accounting for 19.4% of all households. In contrast, only 233 households (2.1%) fall into the less than $10,000 income bracket, making it the least populous group.
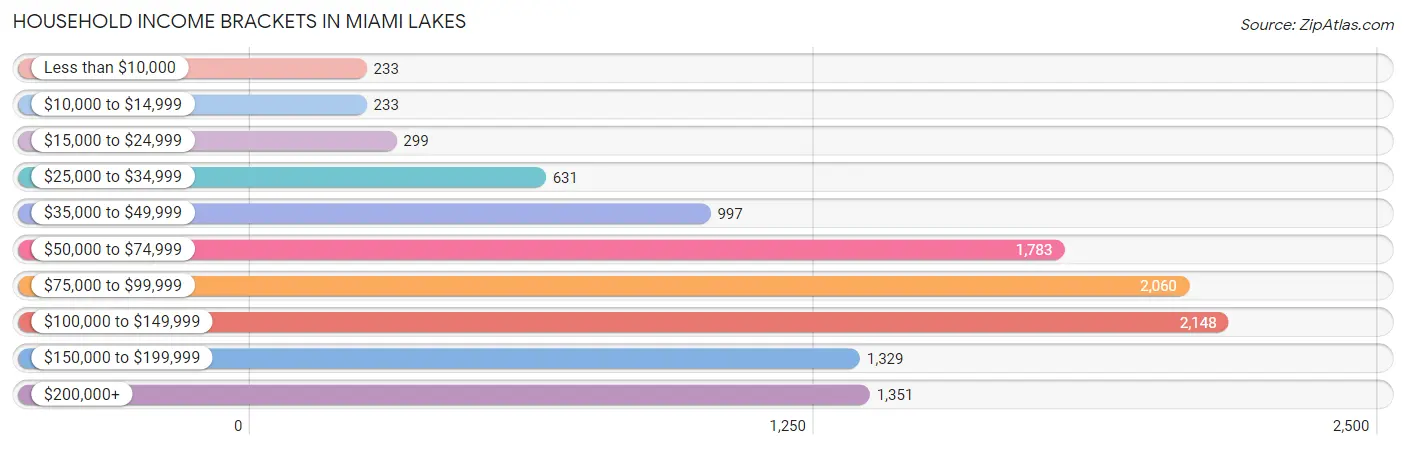
| Income Bracket | # Households | % Households |
| Less than $10,000 | 233 | 2.1% |
| $10,000 to $14,999 | 233 | 2.1% |
| $15,000 to $24,999 | 299 | 2.7% |
| $25,000 to $34,999 | 631 | 5.7% |
| $35,000 to $49,999 | 997 | 9.0% |
| $50,000 to $74,999 | 1,783 | 16.1% |
| $75,000 to $99,999 | 2,060 | 18.6% |
| $100,000 to $149,999 | 2,148 | 19.4% |
| $150,000 to $199,999 | 1,329 | 12.0% |
| $200,000+ | 1,351 | 12.2% |
Household Income by Householder Age in Miami Lakes
The median household income in Miami Lakes is $90,339, with the highest median household income of $101,340 found in the 45 to 64 years age bracket for the primary householder. A total of 5,158 households (46.6%) fall into this category. Meanwhile, the 65+ years age bracket for the primary householder has the lowest median household income of $50,212, with 2,562 households (23.1%) in this group.
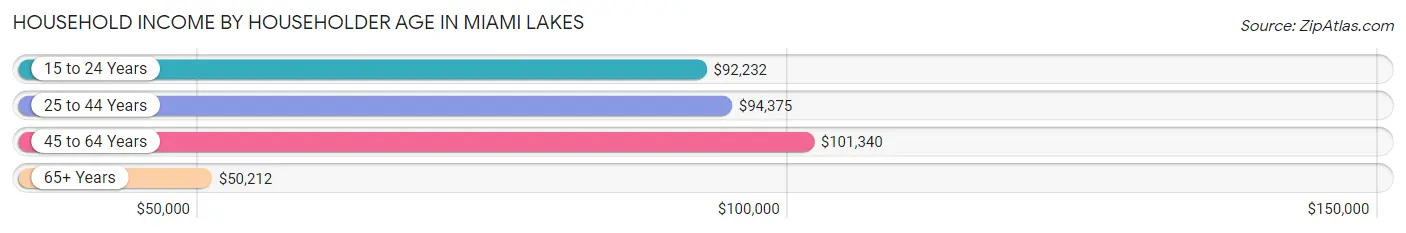
| Income Bracket | # Households | Median Income |
| 15 to 24 Years | 182 (1.6%) | $92,232 |
| 25 to 44 Years | 3,171 (28.6%) | $94,375 |
| 45 to 64 Years | 5,158 (46.6%) | $101,340 |
| 65+ Years | 2,562 (23.1%) | $50,212 |
| Total | 11,073 (100.0%) | $90,339 |
Poverty in Miami Lakes
Income Below Poverty by Sex and Age in Miami Lakes
With 3.3% poverty level for males and 5.8% for females among the residents of Miami Lakes, 5 year old males and 75 year old and over females are the most vulnerable to poverty, with 35 males (24.3%) and 163 females (11.0%) in their respective age groups living below the poverty level.
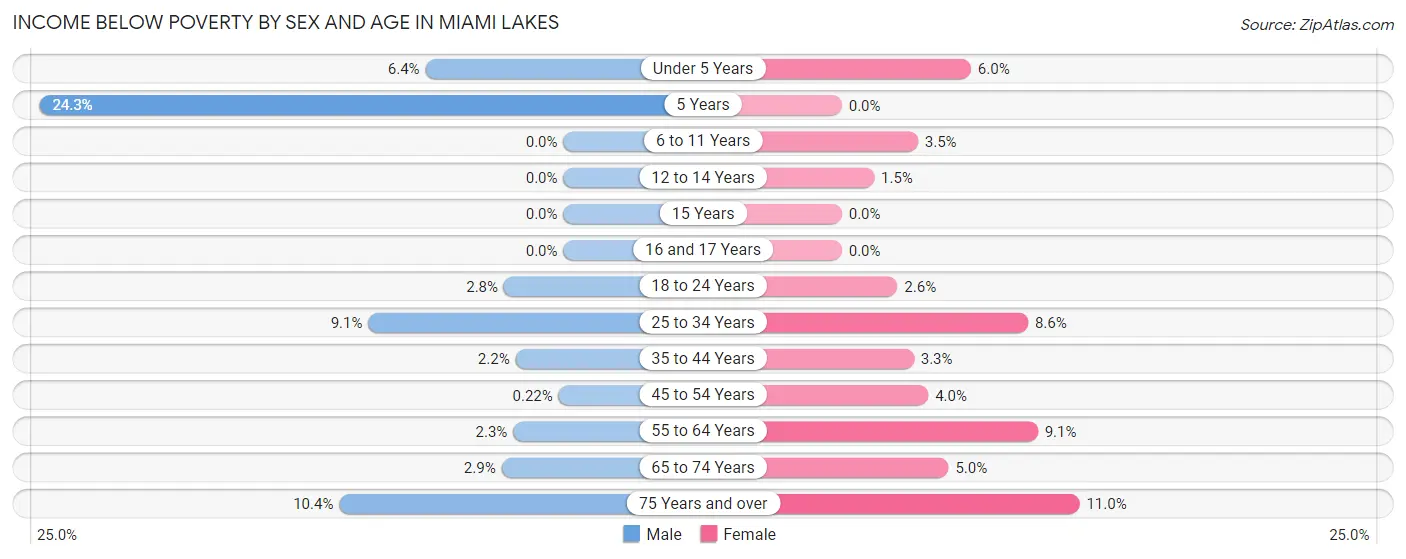
| Age Bracket | Male | Female |
| Under 5 Years | 45 (6.4%) | 44 (6.0%) |
| 5 Years | 35 (24.3%) | 0 (0.0%) |
| 6 to 11 Years | 0 (0.0%) | 38 (3.5%) |
| 12 to 14 Years | 0 (0.0%) | 9 (1.5%) |
| 15 Years | 0 (0.0%) | 0 (0.0%) |
| 16 and 17 Years | 0 (0.0%) | 0 (0.0%) |
| 18 to 24 Years | 43 (2.8%) | 25 (2.6%) |
| 25 to 34 Years | 161 (9.0%) | 176 (8.6%) |
| 35 to 44 Years | 49 (2.2%) | 62 (3.3%) |
| 45 to 54 Years | 5 (0.2%) | 103 (4.0%) |
| 55 to 64 Years | 47 (2.3%) | 205 (9.1%) |
| 65 to 74 Years | 35 (2.9%) | 77 (5.0%) |
| 75 Years and over | 81 (10.4%) | 163 (11.0%) |
| Total | 501 (3.3%) | 902 (5.8%) |
Income Above Poverty by Sex and Age in Miami Lakes
According to the poverty statistics in Miami Lakes, males aged 6 to 11 years and females aged 5 years are the age groups that are most secure financially, with 100.0% of males and 100.0% of females in these age groups living above the poverty line.
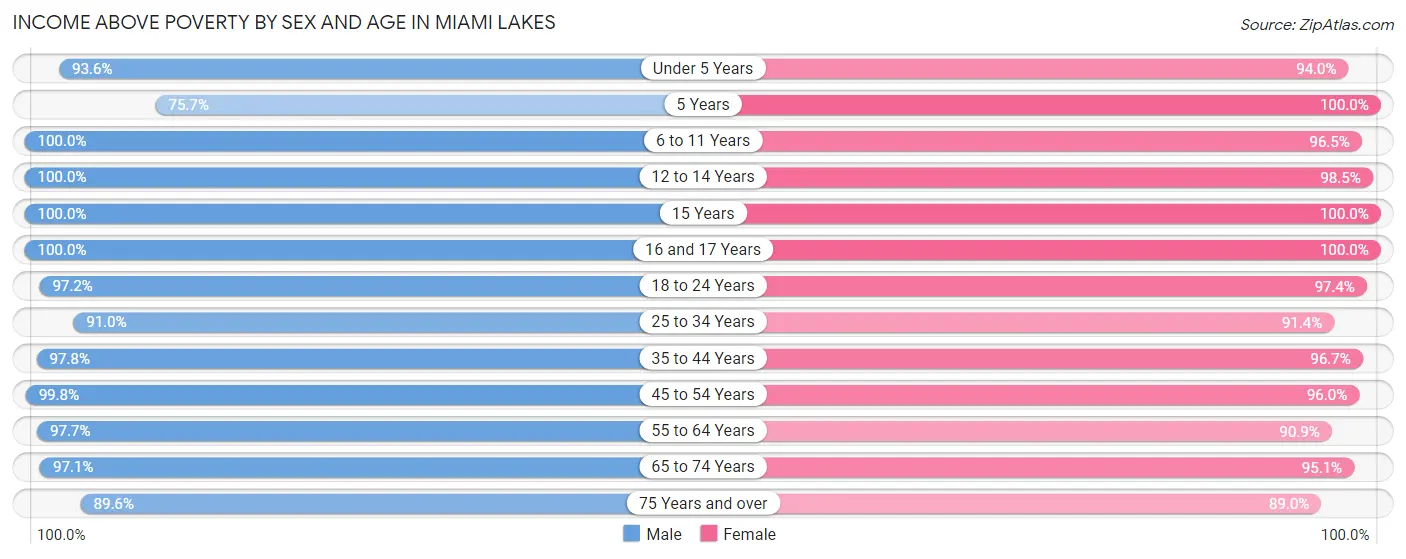
| Age Bracket | Male | Female |
| Under 5 Years | 658 (93.6%) | 690 (94.0%) |
| 5 Years | 109 (75.7%) | 104 (100.0%) |
| 6 to 11 Years | 980 (100.0%) | 1,040 (96.5%) |
| 12 to 14 Years | 434 (100.0%) | 592 (98.5%) |
| 15 Years | 329 (100.0%) | 67 (100.0%) |
| 16 and 17 Years | 573 (100.0%) | 291 (100.0%) |
| 18 to 24 Years | 1,514 (97.2%) | 943 (97.4%) |
| 25 to 34 Years | 1,618 (90.9%) | 1,861 (91.4%) |
| 35 to 44 Years | 2,155 (97.8%) | 1,795 (96.7%) |
| 45 to 54 Years | 2,291 (99.8%) | 2,465 (96.0%) |
| 55 to 64 Years | 1,972 (97.7%) | 2,049 (90.9%) |
| 65 to 74 Years | 1,185 (97.1%) | 1,480 (95.1%) |
| 75 Years and over | 698 (89.6%) | 1,315 (89.0%) |
| Total | 14,516 (96.7%) | 14,692 (94.2%) |
Income Below Poverty Among Married-Couple Families in Miami Lakes
The poverty statistics for married-couple families in Miami Lakes show that 0.6% or 34 of the total 5,556 families live below the poverty line. Families with no children have the highest poverty rate of 0.6%, comprising of 20 families. On the other hand, families with 3 or 4 children have the lowest poverty rate of 0.0%, which includes 0 families.
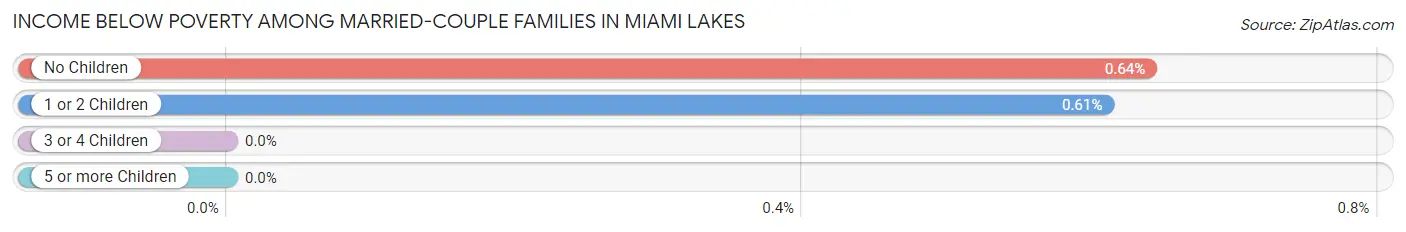
| Children | Above Poverty | Below Poverty |
| No Children | 3,121 (99.4%) | 20 (0.6%) |
| 1 or 2 Children | 2,293 (99.4%) | 14 (0.6%) |
| 3 or 4 Children | 108 (100.0%) | 0 (0.0%) |
| 5 or more Children | 0 (0.0%) | 0 (0.0%) |
| Total | 5,522 (99.4%) | 34 (0.6%) |
Income Below Poverty Among Single-Parent Households in Miami Lakes
According to the poverty data in Miami Lakes, 2.8% or 20 single-father households and 7.2% or 123 single-mother households are living below the poverty line. Among single-father households, those with no children have the highest poverty rate, with 11 households (3.9%) experiencing poverty. Likewise, among single-mother households, those with 1 or 2 children have the highest poverty rate, with 71 households (9.3%) falling below the poverty line.
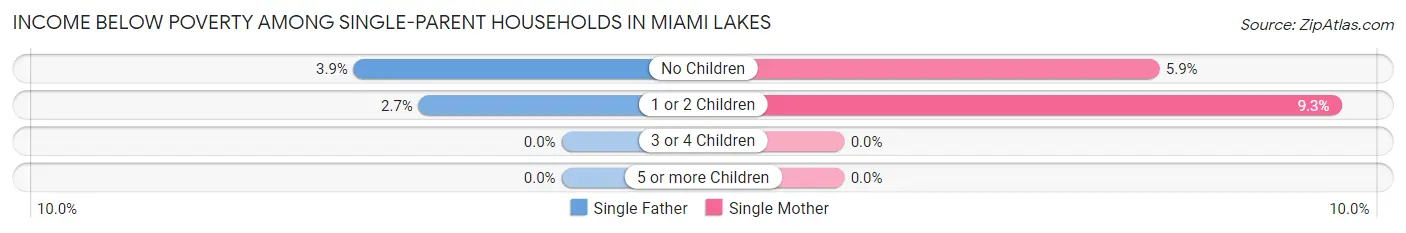
| Children | Single Father | Single Mother |
| No Children | 11 (3.9%) | 52 (5.9%) |
| 1 or 2 Children | 9 (2.7%) | 71 (9.3%) |
| 3 or 4 Children | 0 (0.0%) | 0 (0.0%) |
| 5 or more Children | 0 (0.0%) | 0 (0.0%) |
| Total | 20 (2.8%) | 123 (7.2%) |
Income Below Poverty Among Married-Couple vs Single-Parent Households in Miami Lakes
The poverty data for Miami Lakes shows that 34 of the married-couple family households (0.6%) and 143 of the single-parent households (5.9%) are living below the poverty level. Within the married-couple family households, those with no children have the highest poverty rate, with 20 households (0.6%) falling below the poverty line. Among the single-parent households, those with 1 or 2 children have the highest poverty rate, with 80 household (7.2%) living below poverty.
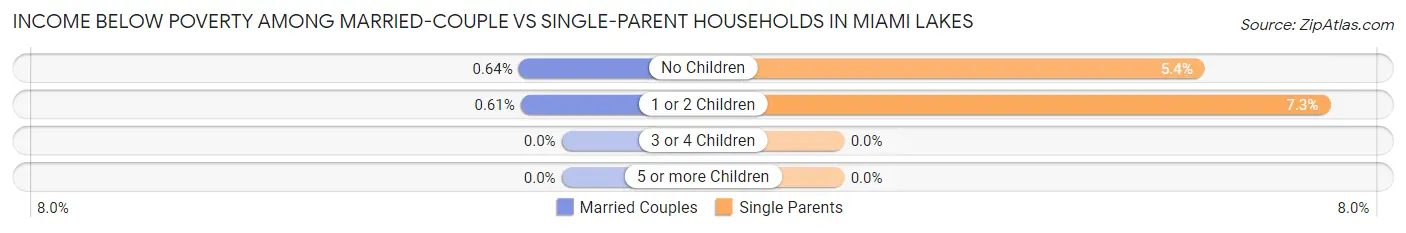
| Children | Married-Couple Families | Single-Parent Households |
| No Children | 20 (0.6%) | 63 (5.4%) |
| 1 or 2 Children | 14 (0.6%) | 80 (7.2%) |
| 3 or 4 Children | 0 (0.0%) | 0 (0.0%) |
| 5 or more Children | 0 (0.0%) | 0 (0.0%) |
| Total | 34 (0.6%) | 143 (5.9%) |
Race in Miami Lakes
The most populous races in Miami Lakes are Hispanic or Latino (27,384 | 89.4%), White / Caucasian (15,921 | 52.0%), and Two or more Races (11,571 | 37.8%).
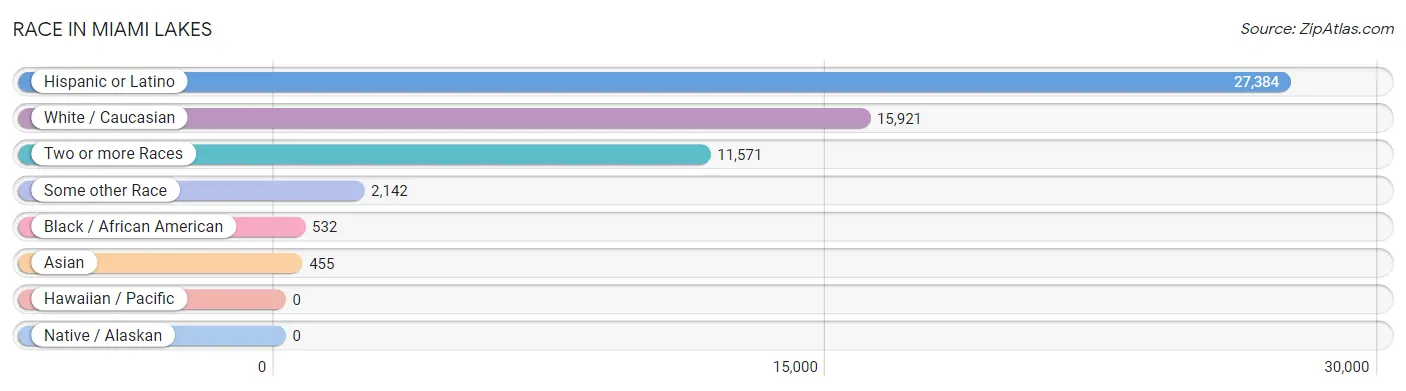
| Race | # Population | % Population |
| Asian | 455 | 1.5% |
| Black / African American | 532 | 1.7% |
| Hawaiian / Pacific | 0 | 0.0% |
| Hispanic or Latino | 27,384 | 89.4% |
| Native / Alaskan | 0 | 0.0% |
| White / Caucasian | 15,921 | 52.0% |
| Two or more Races | 11,571 | 37.8% |
| Some other Race | 2,142 | 7.0% |
| Total | 30,621 | 100.0% |
Ancestry in Miami Lakes
The most populous ancestries reported in Miami Lakes are Cuban (18,932 | 61.8%), South American (3,713 | 12.1%), Central American (1,299 | 4.2%), Colombian (1,243 | 4.1%), and Puerto Rican (1,166 | 3.8%), together accounting for 86.1% of all Miami Lakes residents.
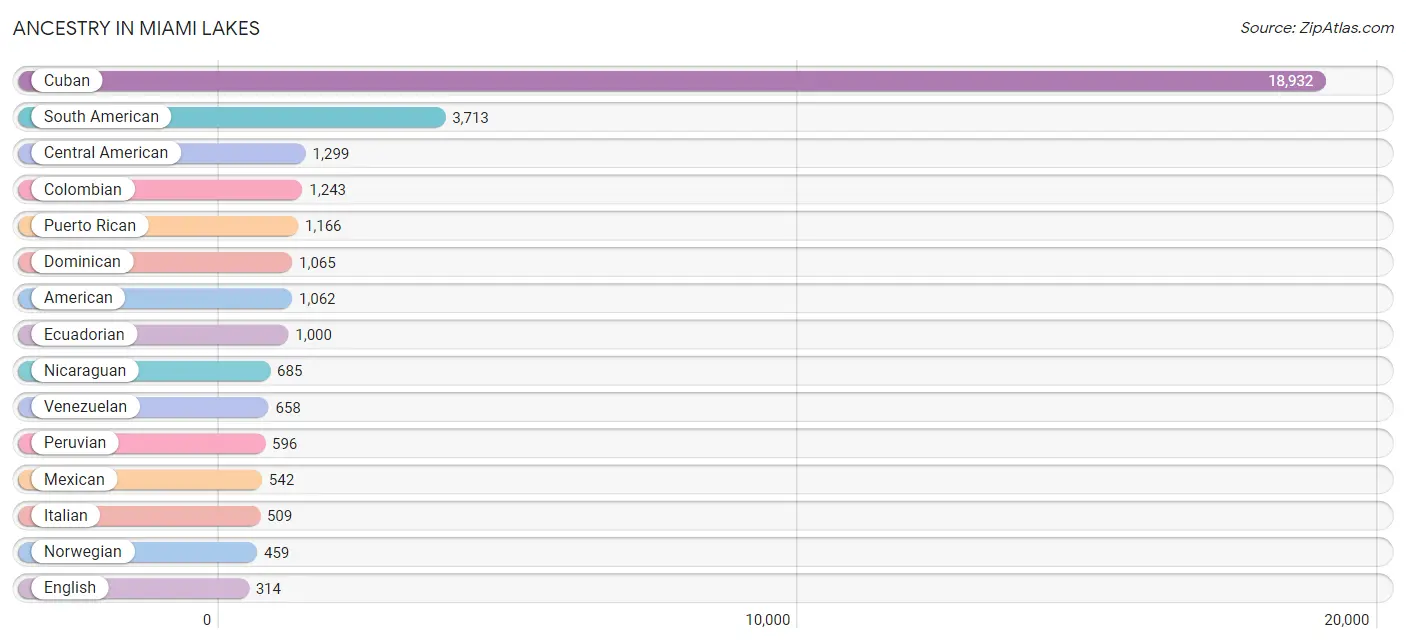
| Ancestry | # Population | % Population |
| African | 29 | 0.1% |
| American | 1,062 | 3.5% |
| Arab | 249 | 0.8% |
| Argentinean | 153 | 0.5% |
| Armenian | 12 | 0.0% |
| Austrian | 6 | 0.0% |
| Bahamian | 20 | 0.1% |
| Belgian | 7 | 0.0% |
| Bhutanese | 102 | 0.3% |
| Brazilian | 124 | 0.4% |
| British | 28 | 0.1% |
| Burmese | 18 | 0.1% |
| Central American | 1,299 | 4.2% |
| Chilean | 32 | 0.1% |
| Choctaw | 9 | 0.0% |
| Colombian | 1,243 | 4.1% |
| Costa Rican | 232 | 0.8% |
| Cuban | 18,932 | 61.8% |
| Czech | 9 | 0.0% |
| Danish | 10 | 0.0% |
| Dominican | 1,065 | 3.5% |
| Dutch | 37 | 0.1% |
| Eastern European | 10 | 0.0% |
| Ecuadorian | 1,000 | 3.3% |
| Egyptian | 19 | 0.1% |
| English | 314 | 1.0% |
| European | 147 | 0.5% |
| French | 67 | 0.2% |
| German | 307 | 1.0% |
| German Russian | 8 | 0.0% |
| Greek | 68 | 0.2% |
| Guatemalan | 53 | 0.2% |
| Guyanese | 42 | 0.1% |
| Haitian | 142 | 0.5% |
| Honduran | 191 | 0.6% |
| Hungarian | 6 | 0.0% |
| Indian (Asian) | 67 | 0.2% |
| Iraqi | 5 | 0.0% |
| Irish | 256 | 0.8% |
| Italian | 509 | 1.7% |
| Jamaican | 17 | 0.1% |
| Korean | 40 | 0.1% |
| Latvian | 7 | 0.0% |
| Lebanese | 144 | 0.5% |
| Mexican | 542 | 1.8% |
| Mexican American Indian | 18 | 0.1% |
| Nicaraguan | 685 | 2.2% |
| Norwegian | 459 | 1.5% |
| Pakistani | 18 | 0.1% |
| Panamanian | 26 | 0.1% |
| Peruvian | 596 | 1.9% |
| Polish | 105 | 0.3% |
| Portuguese | 91 | 0.3% |
| Puerto Rican | 1,166 | 3.8% |
| Romanian | 34 | 0.1% |
| Russian | 23 | 0.1% |
| Salvadoran | 112 | 0.4% |
| Scotch-Irish | 14 | 0.1% |
| Scottish | 48 | 0.2% |
| Slavic | 12 | 0.0% |
| South American | 3,713 | 12.1% |
| South American Indian | 20 | 0.1% |
| Spaniard | 107 | 0.4% |
| Spanish | 14 | 0.1% |
| Subsaharan African | 29 | 0.1% |
| Swedish | 9 | 0.0% |
| Syrian | 7 | 0.0% |
| Thai | 291 | 0.9% |
| Trinidadian and Tobagonian | 14 | 0.1% |
| Ukrainian | 55 | 0.2% |
| Uruguayan | 9 | 0.0% |
| Venezuelan | 658 | 2.1% |
| Welsh | 15 | 0.1% |
| West Indian | 18 | 0.1% |
| Yugoslavian | 2 | 0.0% | View All 75 Rows |
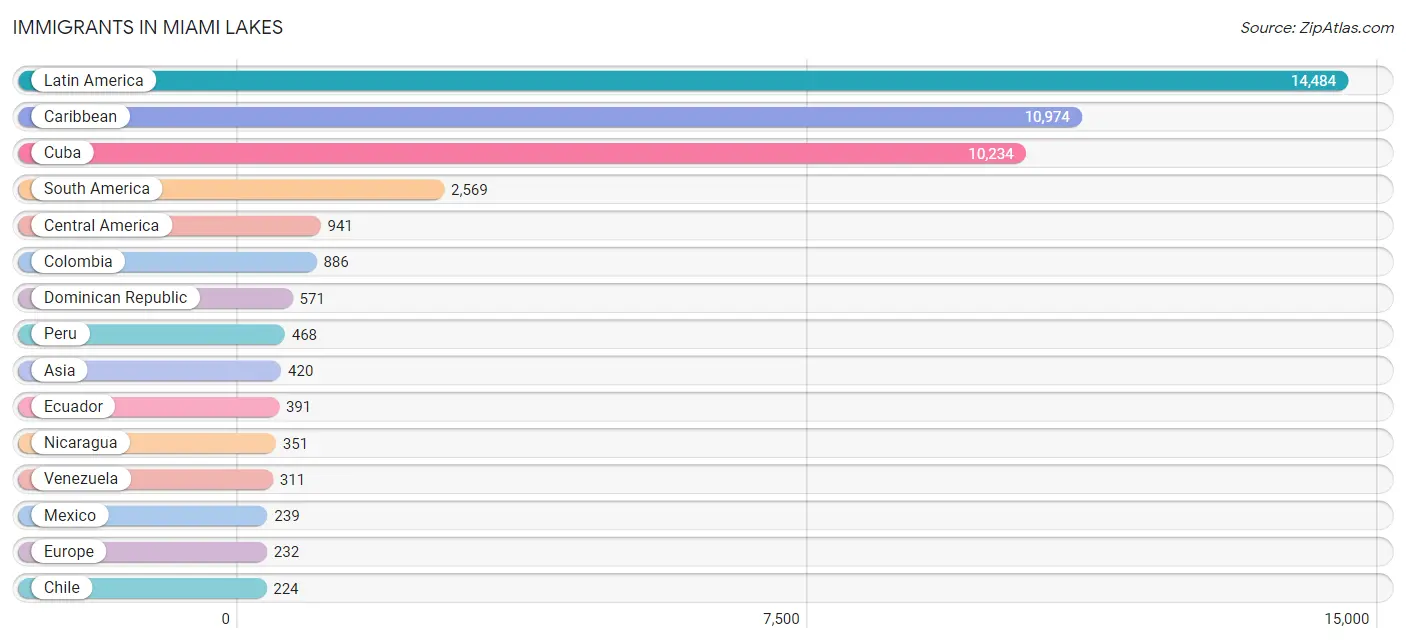
Immigrants in Miami Lakes
The most numerous immigrant groups reported in Miami Lakes came from Latin America (14,484 | 47.3%), Caribbean (10,974 | 35.8%), Cuba (10,234 | 33.4%), South America (2,569 | 8.4%), and Central America (941 | 3.1%), together accounting for 128.0% of all Miami Lakes residents.
| Immigration Origin | # Population | % Population |
| Africa | 15 | 0.1% |
| Argentina | 147 | 0.5% |
| Asia | 420 | 1.4% |
| Australia | 8 | 0.0% |
| Austria | 6 | 0.0% |
| Bahamas | 44 | 0.1% |
| Brazil | 133 | 0.4% |
| Canada | 11 | 0.0% |
| Caribbean | 10,974 | 35.8% |
| Central America | 941 | 3.1% |
| Chile | 224 | 0.7% |
| China | 52 | 0.2% |
| Colombia | 886 | 2.9% |
| Costa Rica | 79 | 0.3% |
| Cuba | 10,234 | 33.4% |
| Denmark | 10 | 0.0% |
| Dominican Republic | 571 | 1.9% |
| Eastern Africa | 4 | 0.0% |
| Eastern Asia | 118 | 0.4% |
| Eastern Europe | 30 | 0.1% |
| Ecuador | 391 | 1.3% |
| Egypt | 11 | 0.0% |
| El Salvador | 33 | 0.1% |
| Europe | 232 | 0.8% |
| France | 25 | 0.1% |
| Guatemala | 53 | 0.2% |
| Haiti | 79 | 0.3% |
| Honduras | 148 | 0.5% |
| India | 119 | 0.4% |
| Iraq | 30 | 0.1% |
| Italy | 31 | 0.1% |
| Jamaica | 28 | 0.1% |
| Japan | 48 | 0.2% |
| Jordan | 99 | 0.3% |
| Kenya | 4 | 0.0% |
| Korea | 18 | 0.1% |
| Latin America | 14,484 | 47.3% |
| Lebanon | 37 | 0.1% |
| Mexico | 239 | 0.8% |
| Nicaragua | 351 | 1.1% |
| Northern Africa | 11 | 0.0% |
| Northern Europe | 48 | 0.2% |
| Oceania | 8 | 0.0% |
| Pakistan | 8 | 0.0% |
| Panama | 38 | 0.1% |
| Peru | 468 | 1.5% |
| Portugal | 15 | 0.1% |
| Russia | 18 | 0.1% |
| Scotland | 10 | 0.0% |
| South America | 2,569 | 8.4% |
| South Central Asia | 127 | 0.4% |
| South Eastern Asia | 9 | 0.0% |
| Southern Europe | 123 | 0.4% |
| Spain | 77 | 0.3% |
| Taiwan | 15 | 0.1% |
| Thailand | 9 | 0.0% |
| Ukraine | 12 | 0.0% |
| Uruguay | 9 | 0.0% |
| Venezuela | 311 | 1.0% |
| Western Asia | 166 | 0.5% |
| Western Europe | 31 | 0.1% | View All 61 Rows |
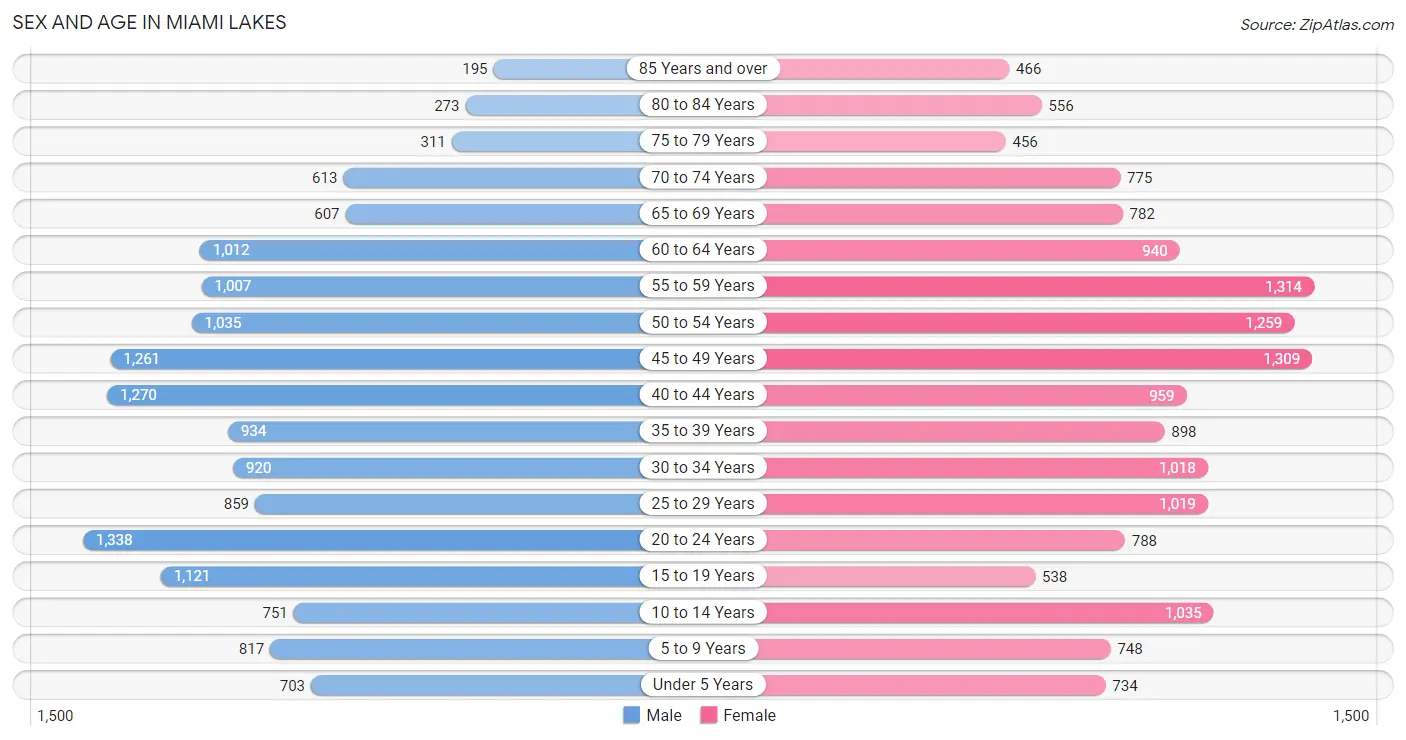
Sex and Age in Miami Lakes
Sex and Age in Miami Lakes
The most populous age groups in Miami Lakes are 20 to 24 Years (1,338 | 8.9%) for men and 55 to 59 Years (1,314 | 8.4%) for women.
| Age Bracket | Male | Female |
| Under 5 Years | 703 (4.7%) | 734 (4.7%) |
| 5 to 9 Years | 817 (5.4%) | 748 (4.8%) |
| 10 to 14 Years | 751 (5.0%) | 1,035 (6.6%) |
| 15 to 19 Years | 1,121 (7.5%) | 538 (3.5%) |
| 20 to 24 Years | 1,338 (8.9%) | 788 (5.1%) |
| 25 to 29 Years | 859 (5.7%) | 1,019 (6.5%) |
| 30 to 34 Years | 920 (6.1%) | 1,018 (6.5%) |
| 35 to 39 Years | 934 (6.2%) | 898 (5.8%) |
| 40 to 44 Years | 1,270 (8.5%) | 959 (6.1%) |
| 45 to 49 Years | 1,261 (8.4%) | 1,309 (8.4%) |
| 50 to 54 Years | 1,035 (6.9%) | 1,259 (8.1%) |
| 55 to 59 Years | 1,007 (6.7%) | 1,314 (8.4%) |
| 60 to 64 Years | 1,012 (6.7%) | 940 (6.0%) |
| 65 to 69 Years | 607 (4.0%) | 782 (5.0%) |
| 70 to 74 Years | 613 (4.1%) | 775 (5.0%) |
| 75 to 79 Years | 311 (2.1%) | 456 (2.9%) |
| 80 to 84 Years | 273 (1.8%) | 556 (3.6%) |
| 85 Years and over | 195 (1.3%) | 466 (3.0%) |
| Total | 15,027 (100.0%) | 15,594 (100.0%) |
Families and Households in Miami Lakes
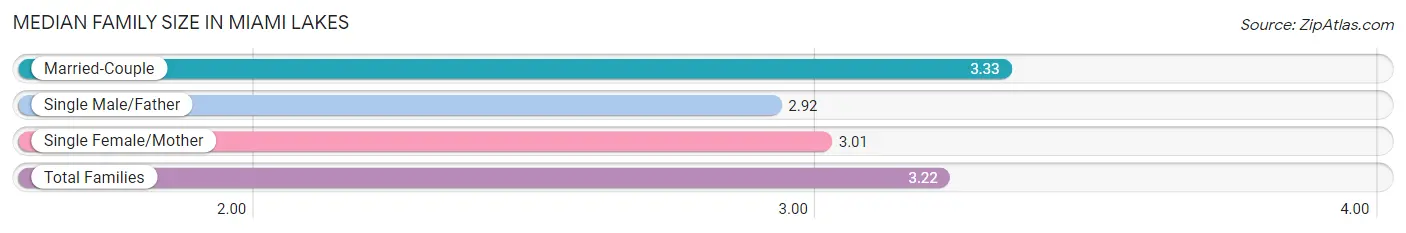
Median Family Size in Miami Lakes
The median family size in Miami Lakes is 3.22 persons per family, with married-couple families (5,556 | 69.7%) accounting for the largest median family size of 3.33 persons per family. On the other hand, single male/father families (714 | 9.0%) represent the smallest median family size with 2.92 persons per family.
| Family Type | # Families | Family Size |
| Married-Couple | 5,556 (69.7%) | 3.33 |
| Single Male/Father | 714 (9.0%) | 2.92 |
| Single Female/Mother | 1,702 (21.3%) | 3.01 |
| Total Families | 7,972 (100.0%) | 3.22 |
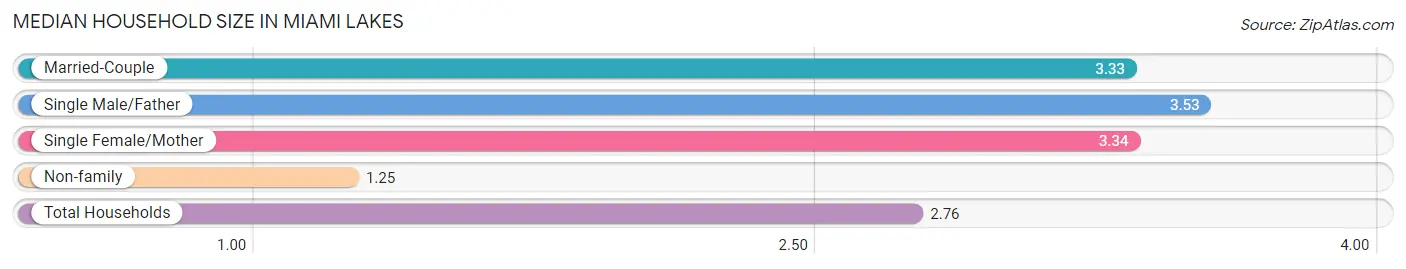
Median Household Size in Miami Lakes
The median household size in Miami Lakes is 2.76 persons per household, with single male/father households (714 | 6.5%) accounting for the largest median household size of 3.53 persons per household. non-family households (3,101 | 28.0%) represent the smallest median household size with 1.25 persons per household.
| Household Type | # Households | Household Size |
| Married-Couple | 5,556 (50.2%) | 3.33 |
| Single Male/Father | 714 (6.5%) | 3.53 |
| Single Female/Mother | 1,702 (15.4%) | 3.34 |
| Non-family | 3,101 (28.0%) | 1.25 |
| Total Households | 11,073 (100.0%) | 2.76 |
Household Size by Marriage Status in Miami Lakes
Out of a total of 11,073 households in Miami Lakes, 7,972 (72.0%) are family households, while 3,101 (28.0%) are nonfamily households. The most numerous type of family households are 3-person households, comprising 2,551, and the most common type of nonfamily households are 1-person households, comprising 2,404.
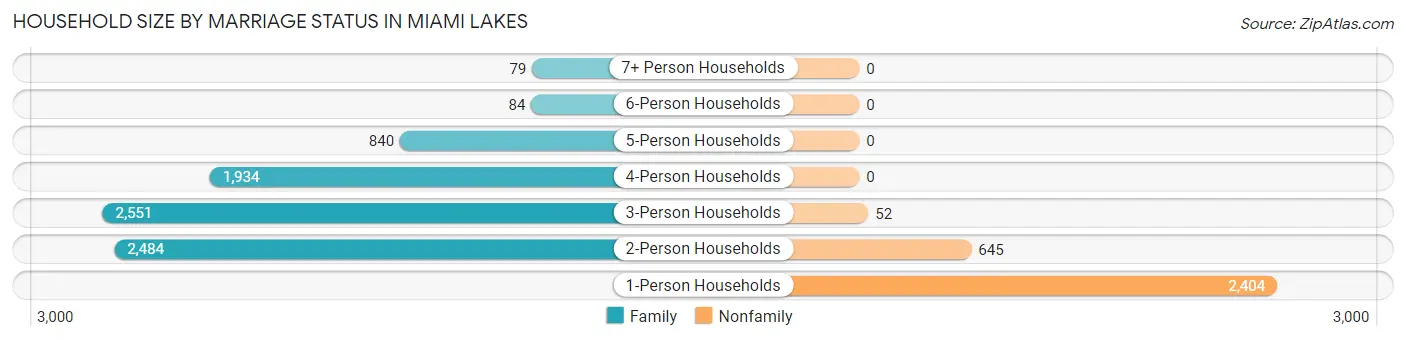
| Household Size | Family Households | Nonfamily Households |
| 1-Person Households | - | 2,404 (21.7%) |
| 2-Person Households | 2,484 (22.4%) | 645 (5.8%) |
| 3-Person Households | 2,551 (23.0%) | 52 (0.5%) |
| 4-Person Households | 1,934 (17.5%) | 0 (0.0%) |
| 5-Person Households | 840 (7.6%) | 0 (0.0%) |
| 6-Person Households | 84 (0.8%) | 0 (0.0%) |
| 7+ Person Households | 79 (0.7%) | 0 (0.0%) |
| Total | 7,972 (72.0%) | 3,101 (28.0%) |
Female Fertility in Miami Lakes
Fertility by Age in Miami Lakes
Average fertility rate in Miami Lakes is 50.0 births per 1,000 women. Women in the age bracket of 20 to 34 years have the highest fertility rate with 76.0 births per 1,000 women. Women in the age bracket of 20 to 34 years acount for 61.7% of all women with births.
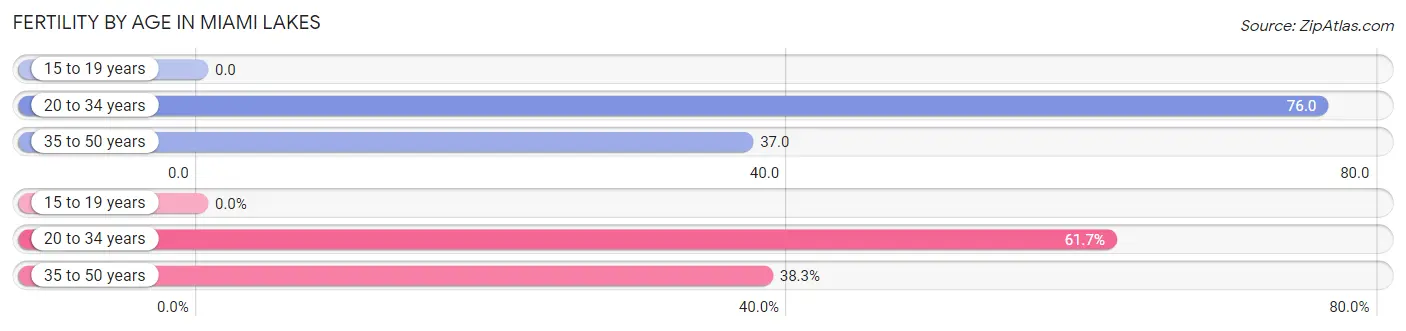
| Age Bracket | Women with Births | Births / 1,000 Women |
| 15 to 19 years | 0 (0.0%) | 0.0 |
| 20 to 34 years | 214 (61.7%) | 76.0 |
| 35 to 50 years | 133 (38.3%) | 37.0 |
| Total | 347 (100.0%) | 50.0 |
Fertility by Age by Marriage Status in Miami Lakes
38.0% of women with births (347) in Miami Lakes are married. The highest percentage of unmarried women with births falls into 20 to 34 years age bracket with 87.4% of them unmarried at the time of birth, while the lowest percentage of unmarried women with births belong to 35 to 50 years age bracket with 21.1% of them unmarried.
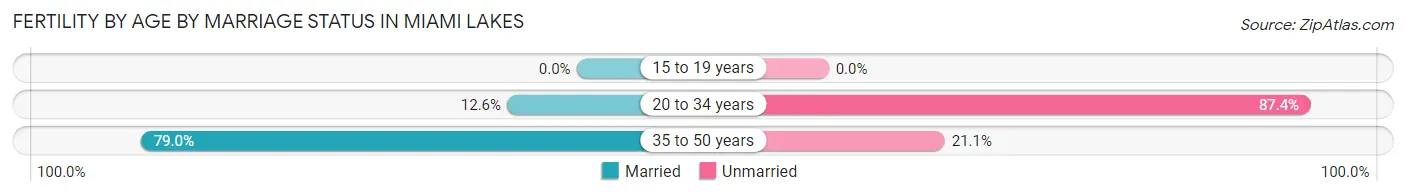
| Age Bracket | Married | Unmarried |
| 15 to 19 years | 0 (0.0%) | 0 (0.0%) |
| 20 to 34 years | 27 (12.6%) | 187 (87.4%) |
| 35 to 50 years | 105 (78.9%) | 28 (21.0%) |
| Total | 132 (38.0%) | 215 (62.0%) |
Fertility by Education in Miami Lakes
Average fertility rate in Miami Lakes is 50.0 births per 1,000 women. Women with the education attainment of graduate degree have the highest fertility rate of 74.0 births per 1,000 women, while women with the education attainment of less than high school have the lowest fertility at 14.0 births per 1,000 women. Women with the education attainment of college or associate's degree represent 38.6% of all women with births.
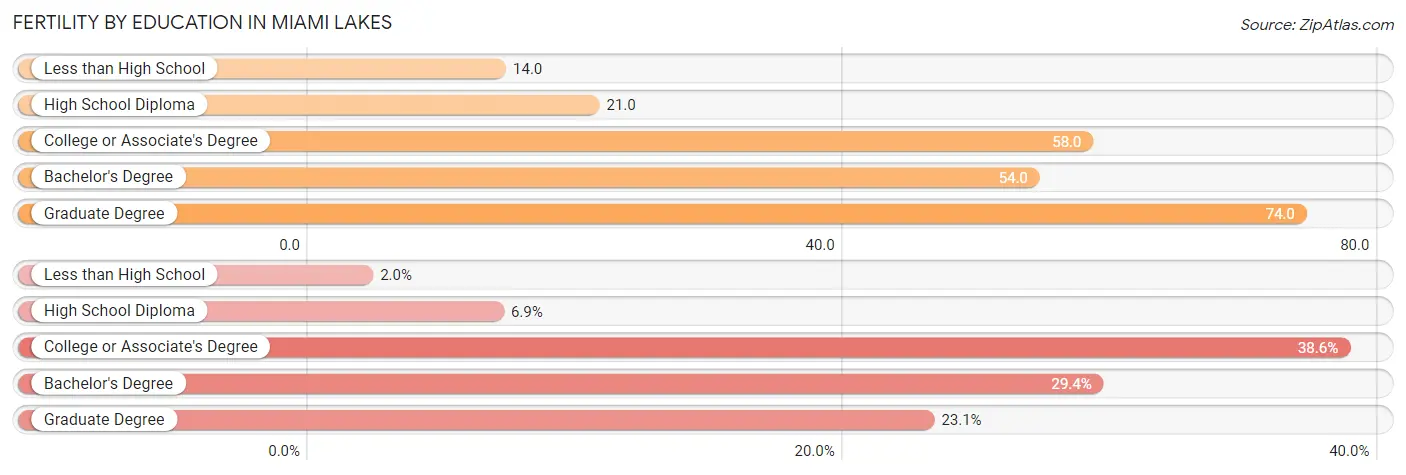
| Educational Attainment | Women with Births | Births / 1,000 Women |
| Less than High School | 7 (2.0%) | 14.0 |
| High School Diploma | 24 (6.9%) | 21.0 |
| College or Associate's Degree | 134 (38.6%) | 58.0 |
| Bachelor's Degree | 102 (29.4%) | 54.0 |
| Graduate Degree | 80 (23.1%) | 74.0 |
| Total | 347 (100.0%) | 50.0 |
Fertility by Education by Marriage Status in Miami Lakes
62.0% of women with births in Miami Lakes are unmarried. Women with the educational attainment of high school diploma are most likely to be married with 100.0% of them married at childbirth, while women with the educational attainment of less than high school are least likely to be married with 100.0% of them unmarried at childbirth.
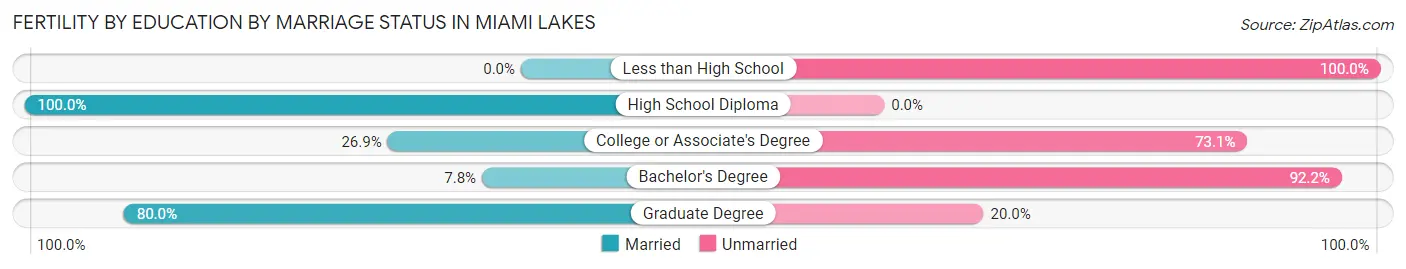
| Educational Attainment | Married | Unmarried |
| Less than High School | 0 (0.0%) | 7 (100.0%) |
| High School Diploma | 24 (100.0%) | 0 (0.0%) |
| College or Associate's Degree | 36 (26.9%) | 98 (73.1%) |
| Bachelor's Degree | 8 (7.8%) | 94 (92.2%) |
| Graduate Degree | 64 (80.0%) | 16 (20.0%) |
| Total | 132 (38.0%) | 215 (62.0%) |
Employment Characteristics in Miami Lakes
Employment by Class of Employer in Miami Lakes
Among the 16,878 employed individuals in Miami Lakes, private company employees (11,747 | 69.6%), self-employed (incorporated) (1,578 | 9.3%), and local government employees (1,214 | 7.2%) make up the most common classes of employment.
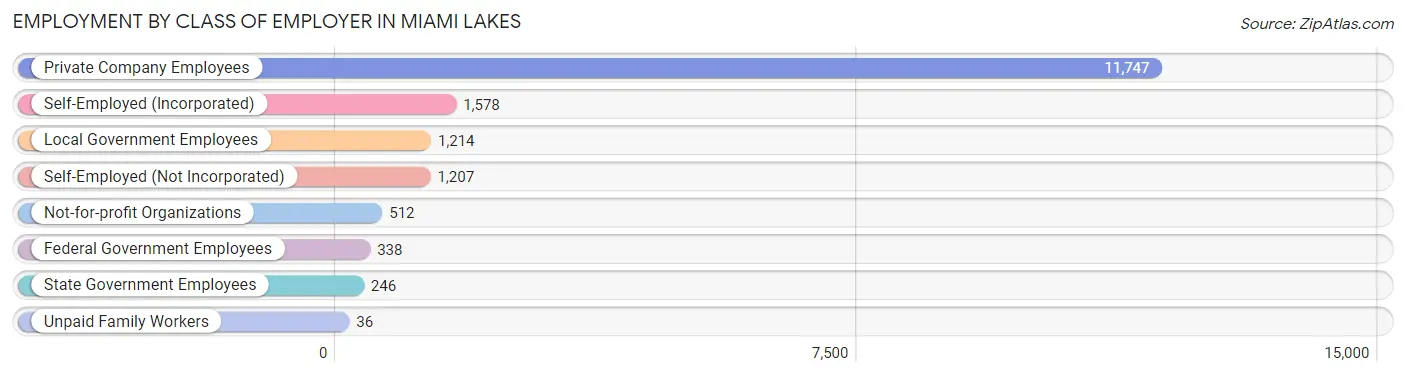
| Employer Class | # Employees | % Employees |
| Private Company Employees | 11,747 | 69.6% |
| Self-Employed (Incorporated) | 1,578 | 9.3% |
| Self-Employed (Not Incorporated) | 1,207 | 7.1% |
| Not-for-profit Organizations | 512 | 3.0% |
| Local Government Employees | 1,214 | 7.2% |
| State Government Employees | 246 | 1.5% |
| Federal Government Employees | 338 | 2.0% |
| Unpaid Family Workers | 36 | 0.2% |
| Total | 16,878 | 100.0% |
Employment Status by Age in Miami Lakes
According to the labor force statistics for Miami Lakes, out of the total population over 16 years of age (25,437), 69.6% or 17,704 individuals are in the labor force, with 3.2% or 567 of them unemployed. The age group with the highest labor force participation rate is 30 to 34 years, with 91.3% or 1,769 individuals in the labor force. Within the labor force, the 20 to 24 years age range has the highest percentage of unemployed individuals, with 7.2% or 117 of them being unemployed.
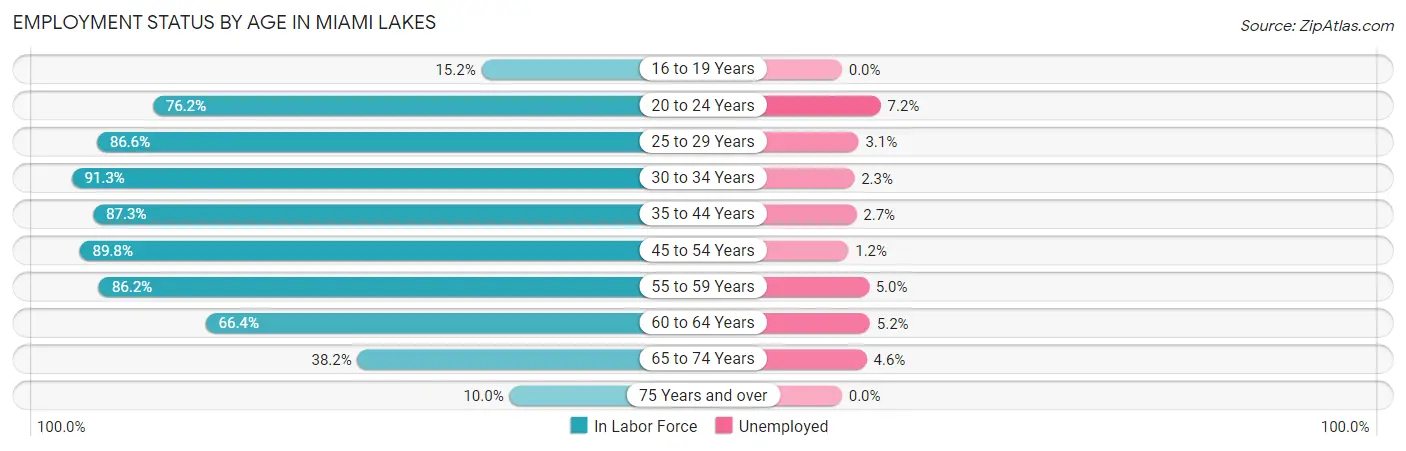
| Age Bracket | In Labor Force | Unemployed |
| 16 to 19 Years | 192 (15.2%) | 0 (0.0%) |
| 20 to 24 Years | 1,620 (76.2%) | 117 (7.2%) |
| 25 to 29 Years | 1,626 (86.6%) | 50 (3.1%) |
| 30 to 34 Years | 1,769 (91.3%) | 41 (2.3%) |
| 35 to 44 Years | 3,545 (87.3%) | 96 (2.7%) |
| 45 to 54 Years | 4,368 (89.8%) | 52 (1.2%) |
| 55 to 59 Years | 2,001 (86.2%) | 100 (5.0%) |
| 60 to 64 Years | 1,296 (66.4%) | 67 (5.2%) |
| 65 to 74 Years | 1,061 (38.2%) | 49 (4.6%) |
| 75 Years and over | 226 (10.0%) | 0 (0.0%) |
| Total | 17,704 (69.6%) | 567 (3.2%) |
Employment Status by Educational Attainment in Miami Lakes
According to labor force statistics for Miami Lakes, 85.9% of individuals (14,615) out of the total population between 25 and 64 years of age (17,014) are in the labor force, with 2.8% or 409 of them being unemployed. The group with the highest labor force participation rate are those with the educational attainment of college / associate degree, with 90.6% or 5,036 individuals in the labor force. Within the labor force, individuals with less than high school education have the highest percentage of unemployment, with 6.1% or 37 of them being unemployed.
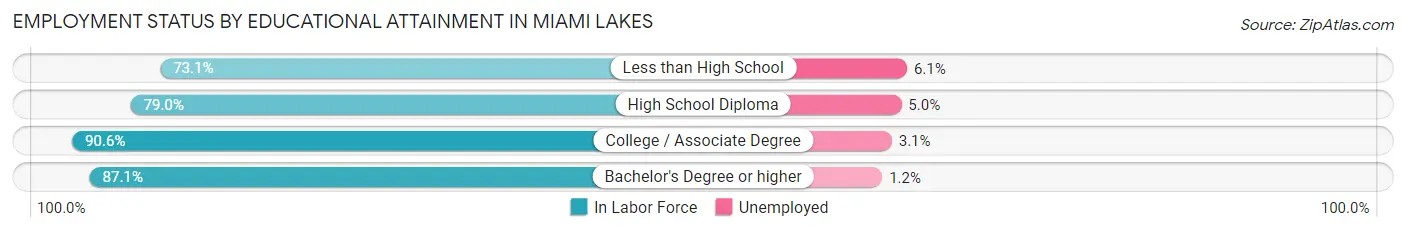
| Educational Attainment | In Labor Force | Unemployed |
| Less than High School | 605 (73.1%) | 51 (6.1%) |
| High School Diploma | 2,847 (79.0%) | 180 (5.0%) |
| College / Associate Degree | 5,036 (90.6%) | 172 (3.1%) |
| Bachelor's Degree or higher | 6,117 (87.1%) | 84 (1.2%) |
| Total | 14,615 (85.9%) | 476 (2.8%) |
Employment Occupations by Sex in Miami Lakes
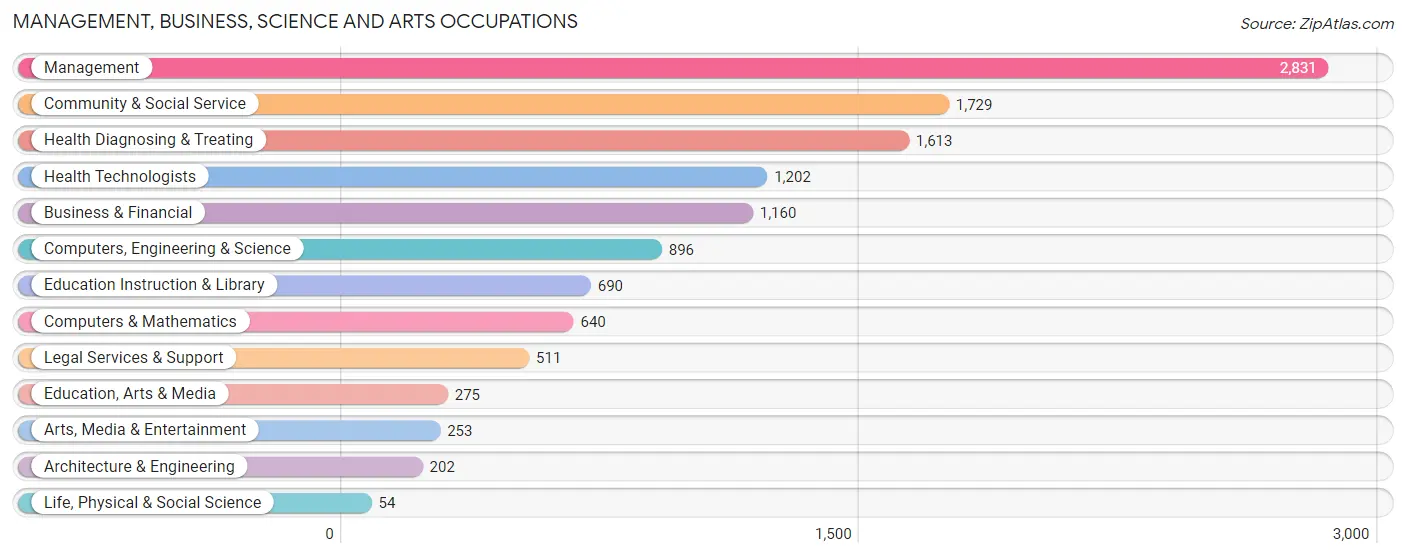
Management, Business, Science and Arts Occupations
The most common Management, Business, Science and Arts occupations in Miami Lakes are Management (2,831 | 16.6%), Community & Social Service (1,729 | 10.1%), Health Diagnosing & Treating (1,613 | 9.4%), Health Technologists (1,202 | 7.0%), and Business & Financial (1,160 | 6.8%).
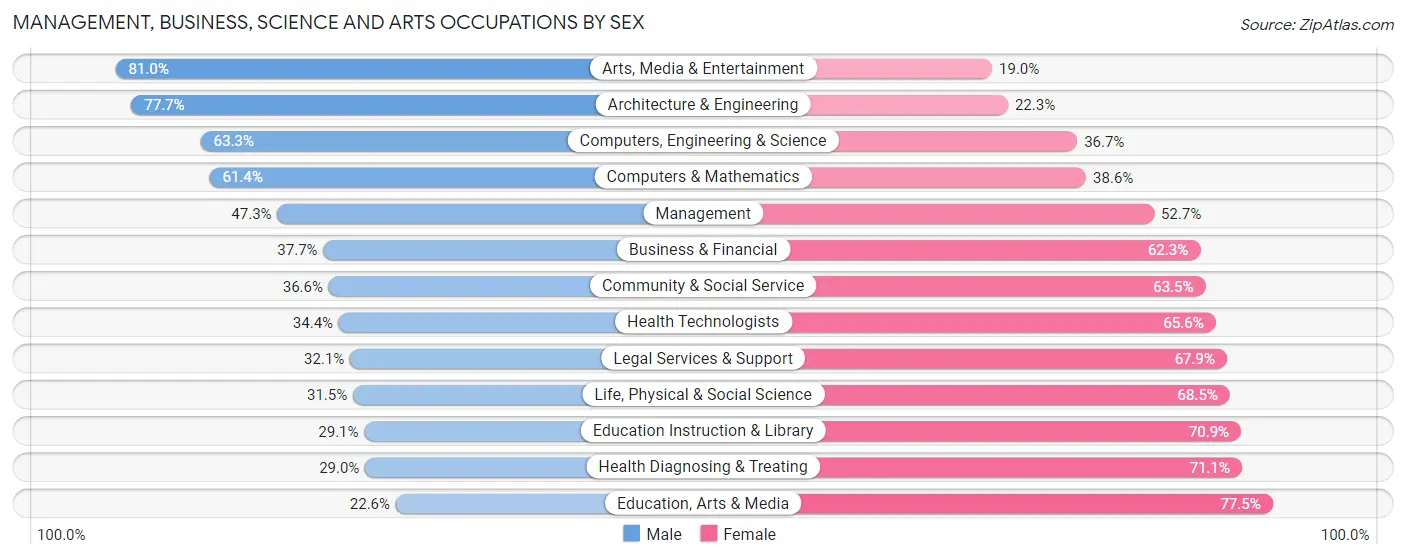
Management, Business, Science and Arts Occupations by Sex
Within the Management, Business, Science and Arts occupations in Miami Lakes, the most male-oriented occupations are Arts, Media & Entertainment (81.0%), Architecture & Engineering (77.7%), and Computers, Engineering & Science (63.3%), while the most female-oriented occupations are Education, Arts & Media (77.4%), Health Diagnosing & Treating (71.1%), and Education Instruction & Library (70.9%).
| Occupation | Male | Female |
| Management | 1,338 (47.3%) | 1,493 (52.7%) |
| Business & Financial | 437 (37.7%) | 723 (62.3%) |
| Computers, Engineering & Science | 567 (63.3%) | 329 (36.7%) |
| Computers & Mathematics | 393 (61.4%) | 247 (38.6%) |
| Architecture & Engineering | 157 (77.7%) | 45 (22.3%) |
| Life, Physical & Social Science | 17 (31.5%) | 37 (68.5%) |
| Community & Social Service | 632 (36.5%) | 1,097 (63.4%) |
| Education, Arts & Media | 62 (22.6%) | 213 (77.4%) |
| Legal Services & Support | 164 (32.1%) | 347 (67.9%) |
| Education Instruction & Library | 201 (29.1%) | 489 (70.9%) |
| Arts, Media & Entertainment | 205 (81.0%) | 48 (19.0%) |
| Health Diagnosing & Treating | 467 (28.9%) | 1,146 (71.1%) |
| Health Technologists | 414 (34.4%) | 788 (65.6%) |
| Total (Category) | 3,441 (41.8%) | 4,788 (58.2%) |
| Total (Overall) | 8,860 (51.8%) | 8,241 (48.2%) |
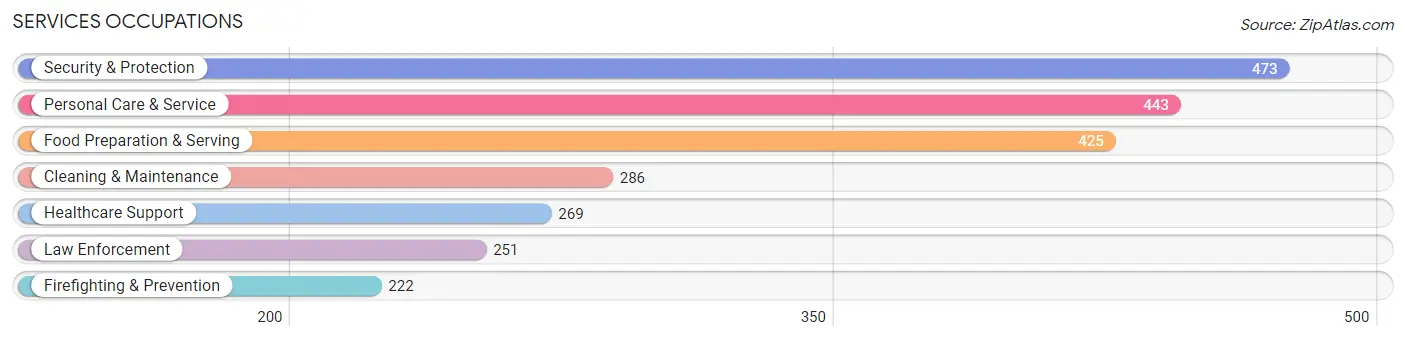
Services Occupations
The most common Services occupations in Miami Lakes are Security & Protection (473 | 2.8%), Personal Care & Service (443 | 2.6%), Food Preparation & Serving (425 | 2.5%), Cleaning & Maintenance (286 | 1.7%), and Healthcare Support (269 | 1.6%).
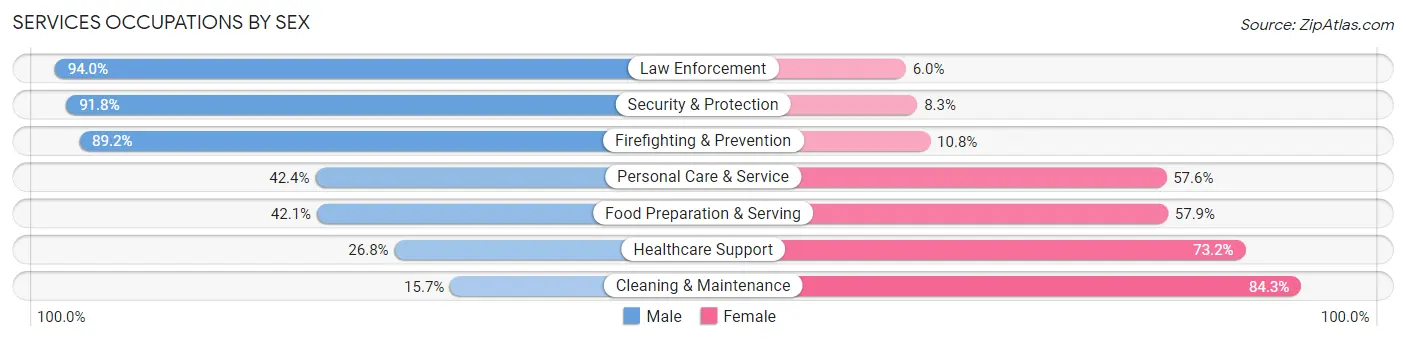
Services Occupations by Sex
Within the Services occupations in Miami Lakes, the most male-oriented occupations are Law Enforcement (94.0%), Security & Protection (91.7%), and Firefighting & Prevention (89.2%), while the most female-oriented occupations are Cleaning & Maintenance (84.3%), Healthcare Support (73.2%), and Food Preparation & Serving (57.9%).
| Occupation | Male | Female |
| Healthcare Support | 72 (26.8%) | 197 (73.2%) |
| Security & Protection | 434 (91.7%) | 39 (8.3%) |
| Firefighting & Prevention | 198 (89.2%) | 24 (10.8%) |
| Law Enforcement | 236 (94.0%) | 15 (6.0%) |
| Food Preparation & Serving | 179 (42.1%) | 246 (57.9%) |
| Cleaning & Maintenance | 45 (15.7%) | 241 (84.3%) |
| Personal Care & Service | 188 (42.4%) | 255 (57.6%) |
| Total (Category) | 918 (48.4%) | 978 (51.6%) |
| Total (Overall) | 8,860 (51.8%) | 8,241 (48.2%) |
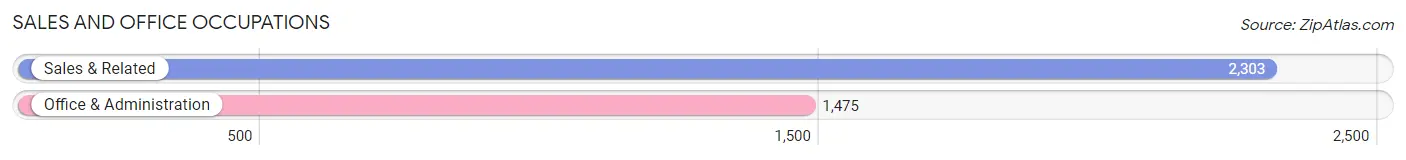
Sales and Office Occupations
The most common Sales and Office occupations in Miami Lakes are Sales & Related (2,303 | 13.5%), and Office & Administration (1,475 | 8.6%).
Sales and Office Occupations by Sex
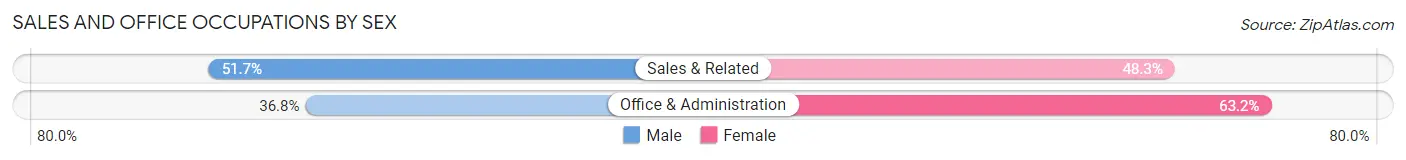
| Occupation | Male | Female |
| Sales & Related | 1,190 (51.7%) | 1,113 (48.3%) |
| Office & Administration | 543 (36.8%) | 932 (63.2%) |
| Total (Category) | 1,733 (45.9%) | 2,045 (54.1%) |
| Total (Overall) | 8,860 (51.8%) | 8,241 (48.2%) |
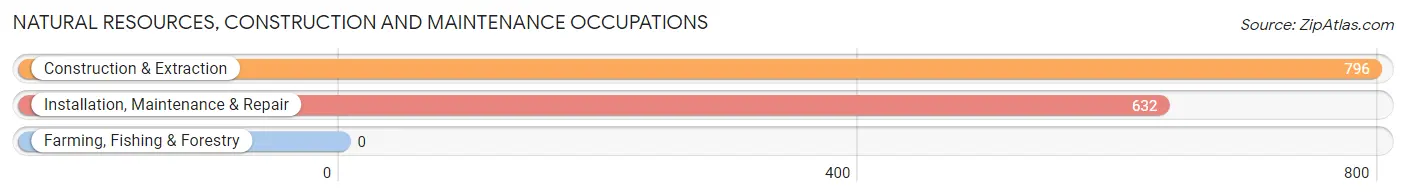
Natural Resources, Construction and Maintenance Occupations
The most common Natural Resources, Construction and Maintenance occupations in Miami Lakes are Construction & Extraction (796 | 4.6%), and Installation, Maintenance & Repair (632 | 3.7%).
Natural Resources, Construction and Maintenance Occupations by Sex
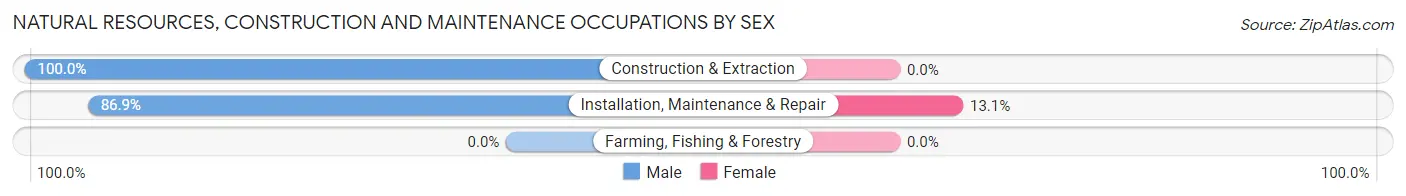
| Occupation | Male | Female |
| Farming, Fishing & Forestry | 0 (0.0%) | 0 (0.0%) |
| Construction & Extraction | 796 (100.0%) | 0 (0.0%) |
| Installation, Maintenance & Repair | 549 (86.9%) | 83 (13.1%) |
| Total (Category) | 1,345 (94.2%) | 83 (5.8%) |
| Total (Overall) | 8,860 (51.8%) | 8,241 (48.2%) |
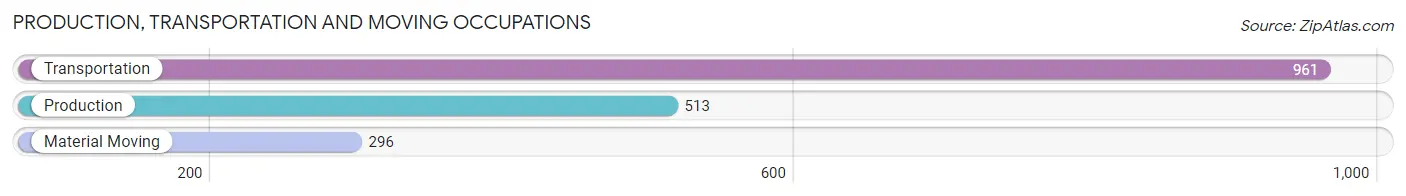
Production, Transportation and Moving Occupations
The most common Production, Transportation and Moving occupations in Miami Lakes are Transportation (961 | 5.6%), Production (513 | 3.0%), and Material Moving (296 | 1.7%).
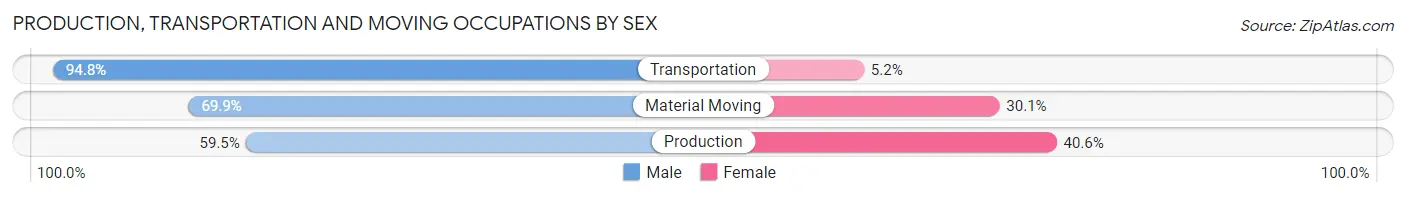
Production, Transportation and Moving Occupations by Sex
| Occupation | Male | Female |
| Production | 305 (59.5%) | 208 (40.6%) |
| Transportation | 911 (94.8%) | 50 (5.2%) |
| Material Moving | 207 (69.9%) | 89 (30.1%) |
| Total (Category) | 1,423 (80.4%) | 347 (19.6%) |
| Total (Overall) | 8,860 (51.8%) | 8,241 (48.2%) |
Employment Industries by Sex in Miami Lakes
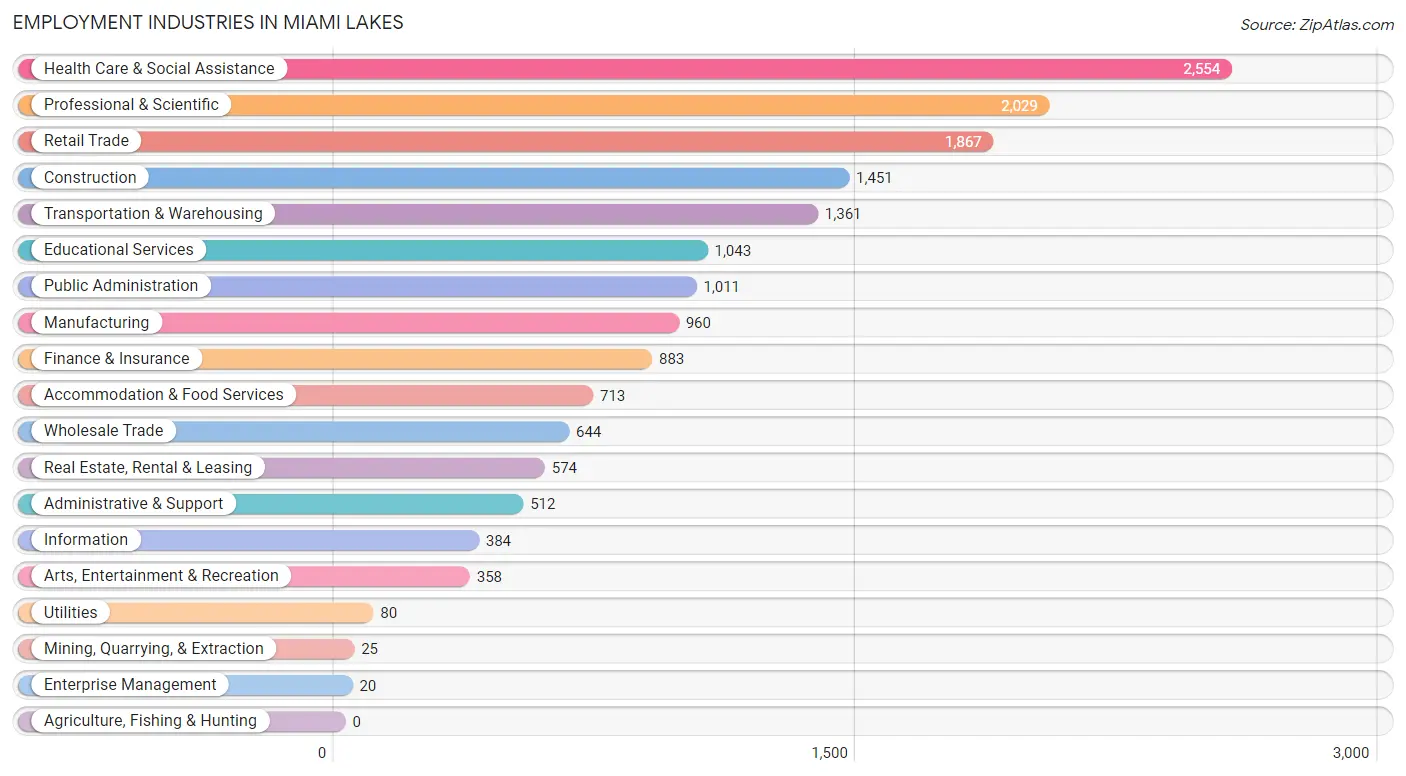
Employment Industries in Miami Lakes
The major employment industries in Miami Lakes include Health Care & Social Assistance (2,554 | 14.9%), Professional & Scientific (2,029 | 11.9%), Retail Trade (1,867 | 10.9%), Construction (1,451 | 8.5%), and Transportation & Warehousing (1,361 | 8.0%).
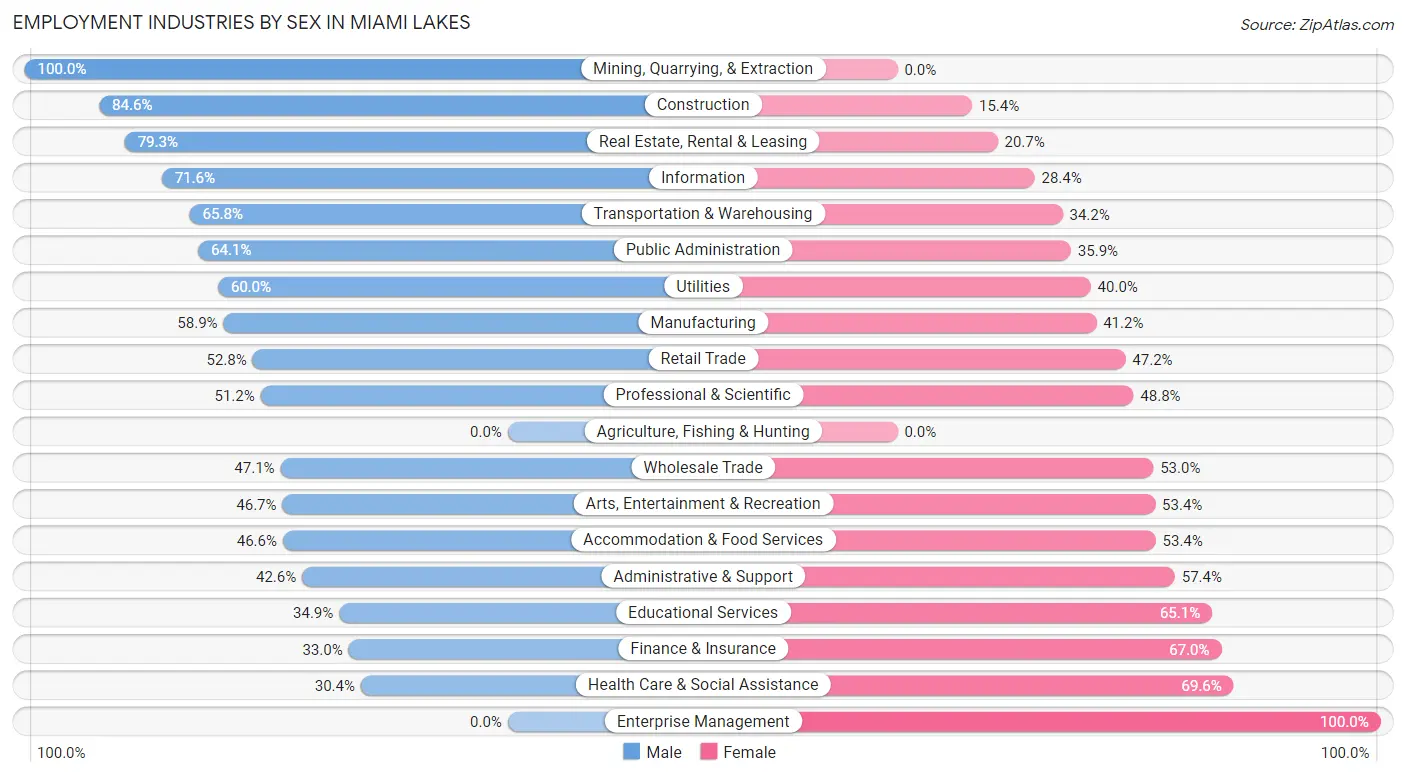
Employment Industries by Sex in Miami Lakes
The Miami Lakes industries that see more men than women are Mining, Quarrying, & Extraction (100.0%), Construction (84.6%), and Real Estate, Rental & Leasing (79.3%), whereas the industries that tend to have a higher number of women are Enterprise Management (100.0%), Health Care & Social Assistance (69.6%), and Finance & Insurance (67.0%).
| Industry | Male | Female |
| Agriculture, Fishing & Hunting | 0 (0.0%) | 0 (0.0%) |
| Mining, Quarrying, & Extraction | 25 (100.0%) | 0 (0.0%) |
| Construction | 1,227 (84.6%) | 224 (15.4%) |
| Manufacturing | 565 (58.9%) | 395 (41.1%) |
| Wholesale Trade | 303 (47.0%) | 341 (52.9%) |
| Retail Trade | 986 (52.8%) | 881 (47.2%) |
| Transportation & Warehousing | 896 (65.8%) | 465 (34.2%) |
| Utilities | 48 (60.0%) | 32 (40.0%) |
| Information | 275 (71.6%) | 109 (28.4%) |
| Finance & Insurance | 291 (33.0%) | 592 (67.0%) |
| Real Estate, Rental & Leasing | 455 (79.3%) | 119 (20.7%) |
| Professional & Scientific | 1,038 (51.2%) | 991 (48.8%) |
| Enterprise Management | 0 (0.0%) | 20 (100.0%) |
| Administrative & Support | 218 (42.6%) | 294 (57.4%) |
| Educational Services | 364 (34.9%) | 679 (65.1%) |
| Health Care & Social Assistance | 777 (30.4%) | 1,777 (69.6%) |
| Arts, Entertainment & Recreation | 167 (46.7%) | 191 (53.3%) |
| Accommodation & Food Services | 332 (46.6%) | 381 (53.4%) |
| Public Administration | 648 (64.1%) | 363 (35.9%) |
| Total | 8,860 (51.8%) | 8,241 (48.2%) |
Education in Miami Lakes
School Enrollment in Miami Lakes
The most common levels of schooling among the 8,145 students in Miami Lakes are college / undergraduate (1,883 | 23.1%), high school (1,590 | 19.5%), and middle school (1,512 | 18.6%).
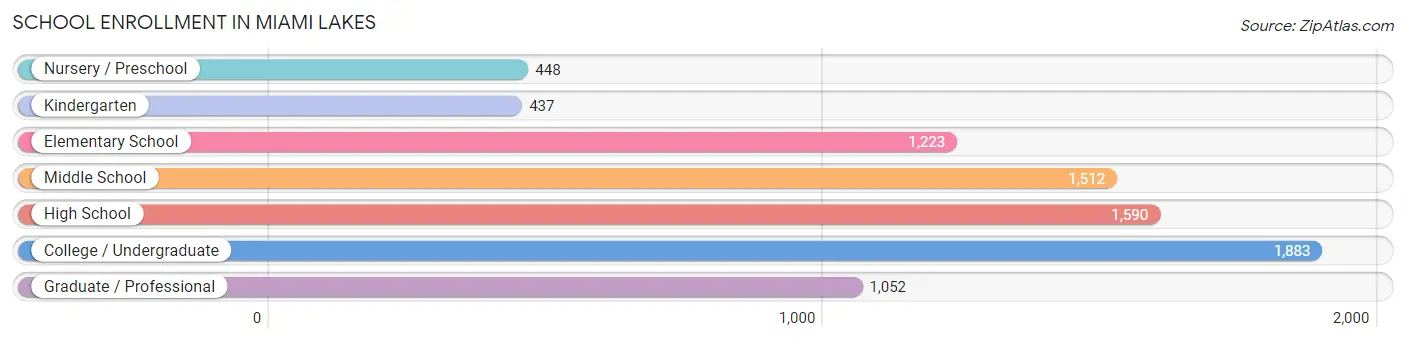
| School Level | # Students | % Students |
| Nursery / Preschool | 448 | 5.5% |
| Kindergarten | 437 | 5.4% |
| Elementary School | 1,223 | 15.0% |
| Middle School | 1,512 | 18.6% |
| High School | 1,590 | 19.5% |
| College / Undergraduate | 1,883 | 23.1% |
| Graduate / Professional | 1,052 | 12.9% |
| Total | 8,145 | 100.0% |
School Enrollment by Age by Funding Source in Miami Lakes
Out of a total of 8,145 students who are enrolled in schools in Miami Lakes, 2,175 (26.7%) attend a private institution, while the remaining 5,970 (73.3%) are enrolled in public schools. The age group of 25 to 34 year olds has the highest likelihood of being enrolled in private schools, with 563 (57.3% in the age bracket) enrolled. Conversely, the age group of 20 to 24 year olds has the lowest likelihood of being enrolled in a private school, with 1,202 (86.7% in the age bracket) attending a public institution.
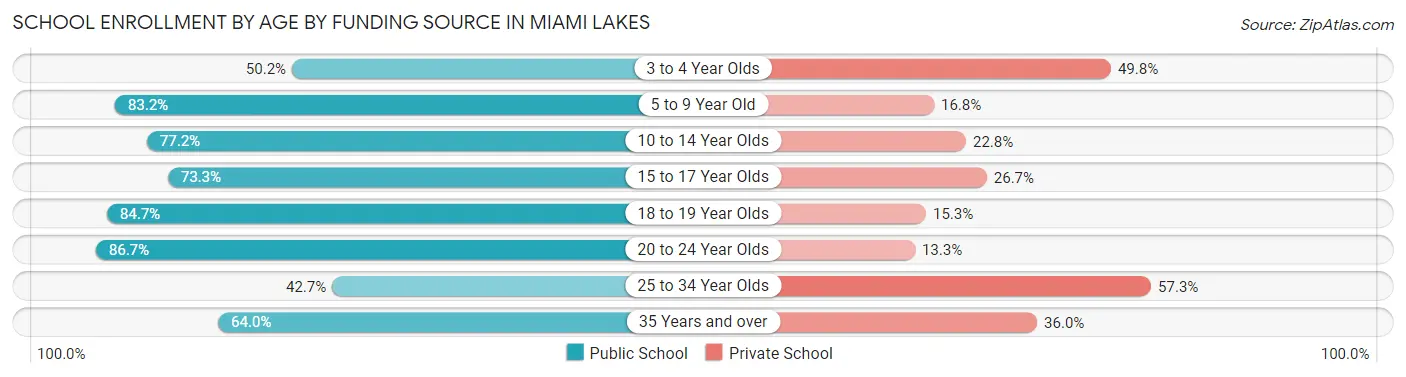
| Age Bracket | Public School | Private School |
| 3 to 4 Year Olds | 234 (50.2%) | 232 (49.8%) |
| 5 to 9 Year Old | 1,295 (83.2%) | 262 (16.8%) |
| 10 to 14 Year Olds | 1,379 (77.2%) | 407 (22.8%) |
| 15 to 17 Year Olds | 924 (73.3%) | 336 (26.7%) |
| 18 to 19 Year Olds | 265 (84.7%) | 48 (15.3%) |
| 20 to 24 Year Olds | 1,202 (86.7%) | 184 (13.3%) |
| 25 to 34 Year Olds | 420 (42.7%) | 563 (57.3%) |
| 35 Years and over | 252 (64.0%) | 142 (36.0%) |
| Total | 5,970 (73.3%) | 2,175 (26.7%) |
Educational Attainment by Field of Study in Miami Lakes
Business (2,427 | 25.7%), education (1,316 | 13.9%), science & technology (1,030 | 10.9%), engineering (982 | 10.4%), and psychology (564 | 6.0%) are the most common fields of study among 9,445 individuals in Miami Lakes who have obtained a bachelor's degree or higher.
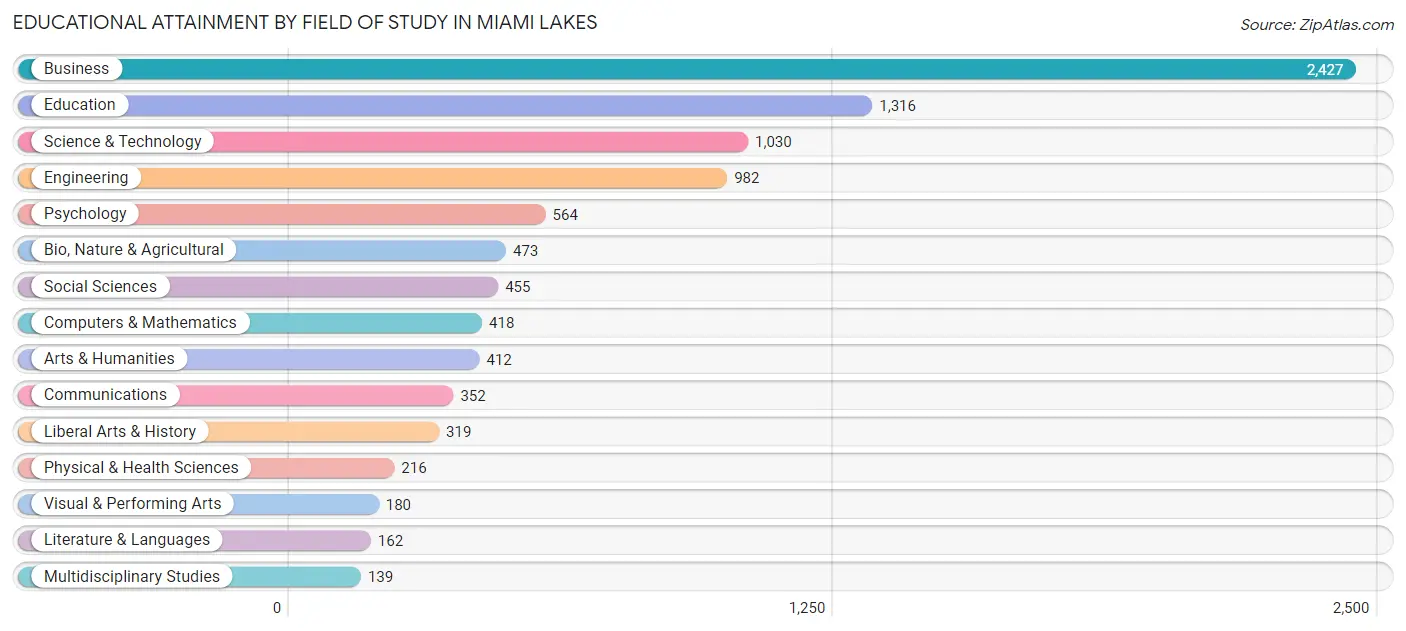
| Field of Study | # Graduates | % Graduates |
| Computers & Mathematics | 418 | 4.4% |
| Bio, Nature & Agricultural | 473 | 5.0% |
| Physical & Health Sciences | 216 | 2.3% |
| Psychology | 564 | 6.0% |
| Social Sciences | 455 | 4.8% |
| Engineering | 982 | 10.4% |
| Multidisciplinary Studies | 139 | 1.5% |
| Science & Technology | 1,030 | 10.9% |
| Business | 2,427 | 25.7% |
| Education | 1,316 | 13.9% |
| Literature & Languages | 162 | 1.7% |
| Liberal Arts & History | 319 | 3.4% |
| Visual & Performing Arts | 180 | 1.9% |
| Communications | 352 | 3.7% |
| Arts & Humanities | 412 | 4.4% |
| Total | 9,445 | 100.0% |
Transportation & Commute in Miami Lakes
Vehicle Availability by Sex in Miami Lakes
The most prevalent vehicle ownership categories in Miami Lakes are males with 2 vehicles (3,799, accounting for 43.2%) and females with 2 vehicles (3,448, making up 46.9%).
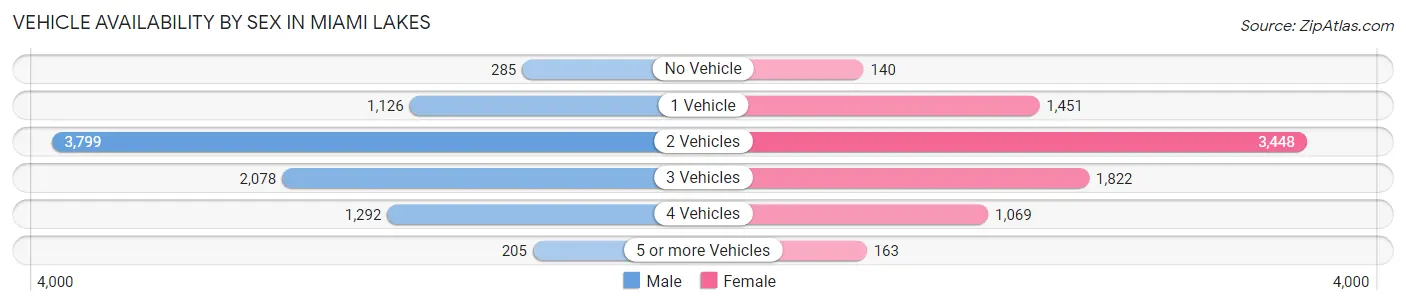
| Vehicles Available | Male | Female |
| No Vehicle | 285 (3.2%) | 140 (1.7%) |
| 1 Vehicle | 1,126 (12.8%) | 1,451 (17.9%) |
| 2 Vehicles | 3,799 (43.2%) | 3,448 (42.6%) |
| 3 Vehicles | 2,078 (23.6%) | 1,822 (22.5%) |
| 4 Vehicles | 1,292 (14.7%) | 1,069 (13.2%) |
| 5 or more Vehicles | 205 (2.3%) | 163 (2.0%) |
| Total | 8,785 (100.0%) | 8,093 (100.0%) |
Commute Time in Miami Lakes
The most frequently occuring commute durations in Miami Lakes are 30 to 34 minutes (2,697 commuters, 17.6%), 45 to 59 minutes (2,459 commuters, 16.0%), and 15 to 19 minutes (1,914 commuters, 12.5%).
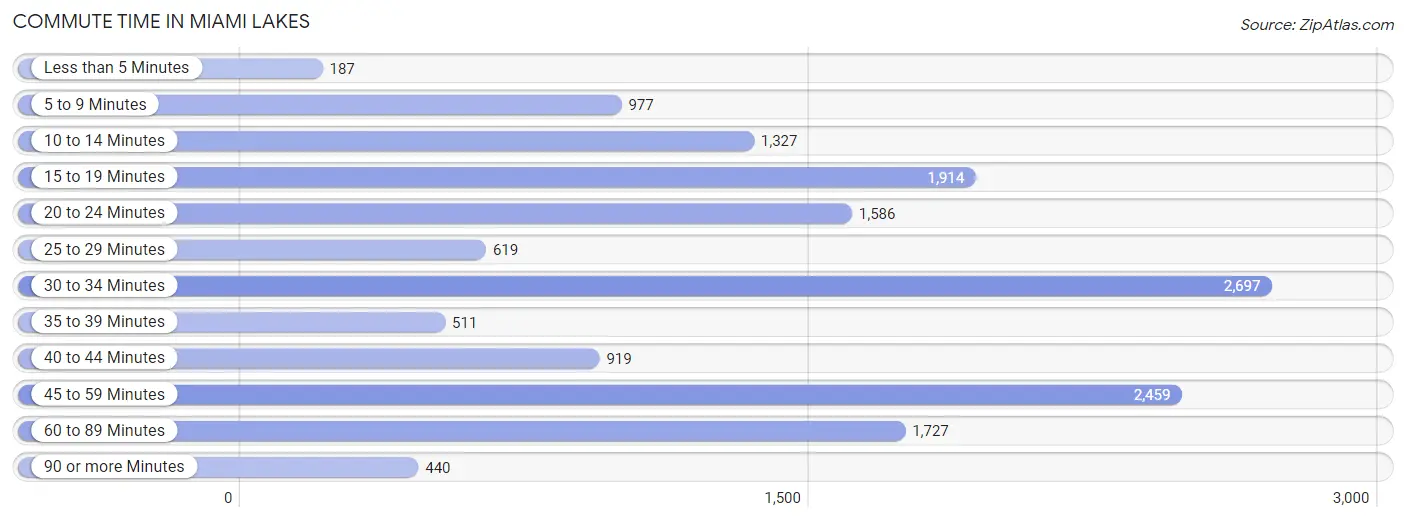
| Commute Time | # Commuters | % Commuters |
| Less than 5 Minutes | 187 | 1.2% |
| 5 to 9 Minutes | 977 | 6.4% |
| 10 to 14 Minutes | 1,327 | 8.6% |
| 15 to 19 Minutes | 1,914 | 12.5% |
| 20 to 24 Minutes | 1,586 | 10.3% |
| 25 to 29 Minutes | 619 | 4.0% |
| 30 to 34 Minutes | 2,697 | 17.6% |
| 35 to 39 Minutes | 511 | 3.3% |
| 40 to 44 Minutes | 919 | 6.0% |
| 45 to 59 Minutes | 2,459 | 16.0% |
| 60 to 89 Minutes | 1,727 | 11.2% |
| 90 or more Minutes | 440 | 2.9% |
Commute Time by Sex in Miami Lakes
The most common commute times in Miami Lakes are 45 to 59 minutes (1,385 commuters, 17.0%) for males and 30 to 34 minutes (1,347 commuters, 18.6%) for females.
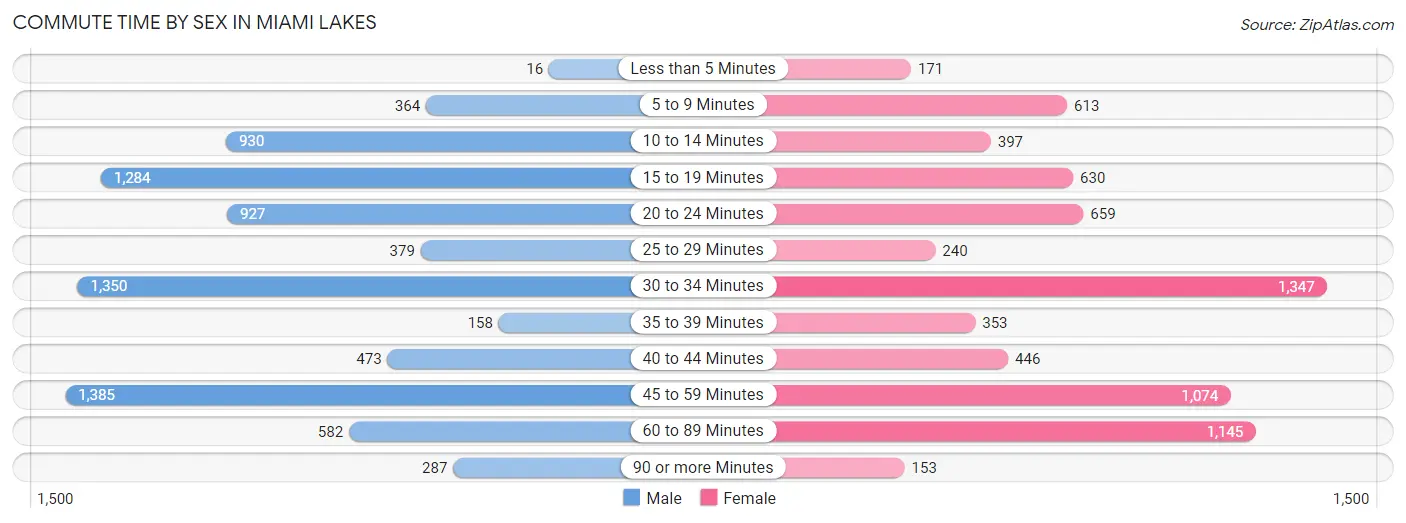
| Commute Time | Male | Female |
| Less than 5 Minutes | 16 (0.2%) | 171 (2.4%) |
| 5 to 9 Minutes | 364 (4.5%) | 613 (8.5%) |
| 10 to 14 Minutes | 930 (11.4%) | 397 (5.5%) |
| 15 to 19 Minutes | 1,284 (15.8%) | 630 (8.7%) |
| 20 to 24 Minutes | 927 (11.4%) | 659 (9.1%) |
| 25 to 29 Minutes | 379 (4.7%) | 240 (3.3%) |
| 30 to 34 Minutes | 1,350 (16.6%) | 1,347 (18.6%) |
| 35 to 39 Minutes | 158 (1.9%) | 353 (4.9%) |
| 40 to 44 Minutes | 473 (5.8%) | 446 (6.2%) |
| 45 to 59 Minutes | 1,385 (17.0%) | 1,074 (14.9%) |
| 60 to 89 Minutes | 582 (7.1%) | 1,145 (15.8%) |
| 90 or more Minutes | 287 (3.5%) | 153 (2.1%) |
Time of Departure to Work by Sex in Miami Lakes
The most frequent times of departure to work in Miami Lakes are 7:30 AM to 7:59 AM (1,227, 15.1%) for males and 8:00 AM to 8:29 AM (1,580, 21.9%) for females.
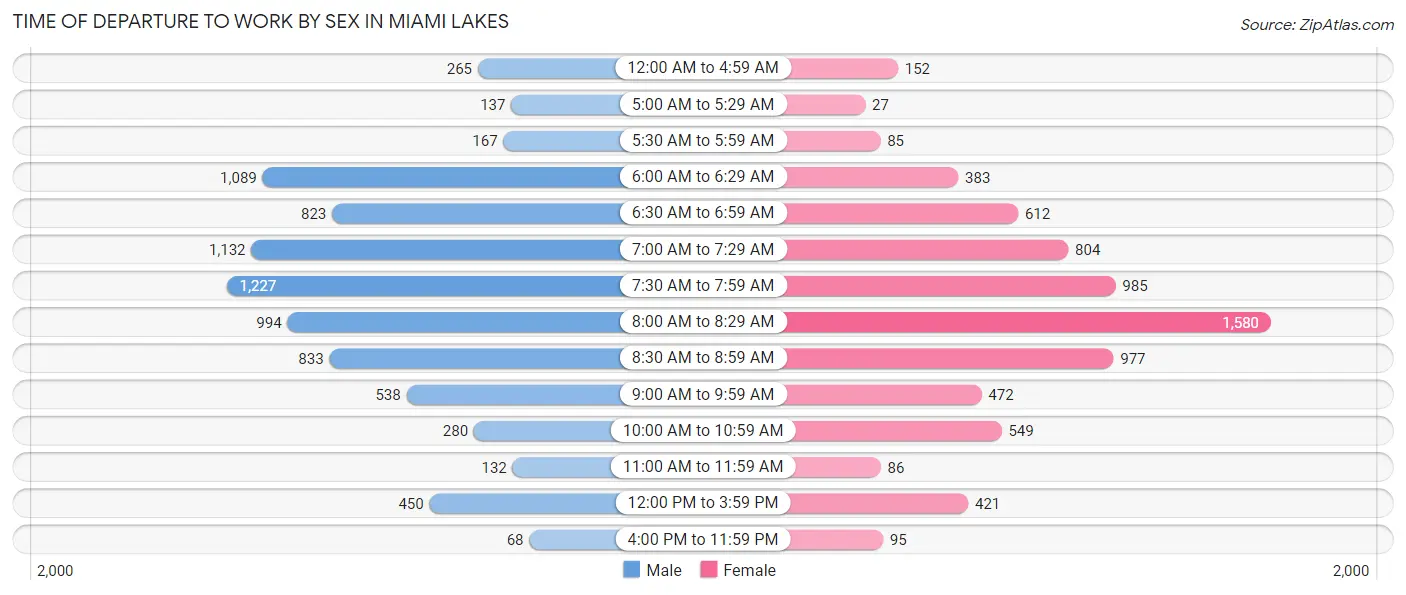
| Time of Departure | Male | Female |
| 12:00 AM to 4:59 AM | 265 (3.3%) | 152 (2.1%) |
| 5:00 AM to 5:29 AM | 137 (1.7%) | 27 (0.4%) |
| 5:30 AM to 5:59 AM | 167 (2.1%) | 85 (1.2%) |
| 6:00 AM to 6:29 AM | 1,089 (13.4%) | 383 (5.3%) |
| 6:30 AM to 6:59 AM | 823 (10.1%) | 612 (8.5%) |
| 7:00 AM to 7:29 AM | 1,132 (13.9%) | 804 (11.1%) |
| 7:30 AM to 7:59 AM | 1,227 (15.1%) | 985 (13.6%) |
| 8:00 AM to 8:29 AM | 994 (12.2%) | 1,580 (21.9%) |
| 8:30 AM to 8:59 AM | 833 (10.2%) | 977 (13.5%) |
| 9:00 AM to 9:59 AM | 538 (6.6%) | 472 (6.5%) |
| 10:00 AM to 10:59 AM | 280 (3.4%) | 549 (7.6%) |
| 11:00 AM to 11:59 AM | 132 (1.6%) | 86 (1.2%) |
| 12:00 PM to 3:59 PM | 450 (5.5%) | 421 (5.8%) |
| 4:00 PM to 11:59 PM | 68 (0.8%) | 95 (1.3%) |
| Total | 8,135 (100.0%) | 7,228 (100.0%) |
Housing Occupancy in Miami Lakes
Occupancy by Ownership in Miami Lakes
Of the total 11,073 dwellings in Miami Lakes, owner-occupied units account for 7,077 (63.9%), while renter-occupied units make up 3,996 (36.1%).
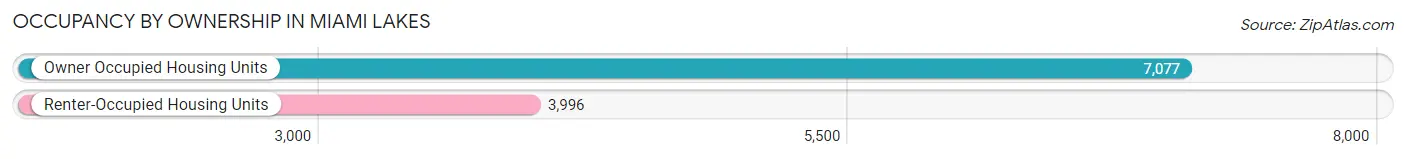
| Occupancy | # Housing Units | % Housing Units |
| Owner Occupied Housing Units | 7,077 | 63.9% |
| Renter-Occupied Housing Units | 3,996 | 36.1% |
| Total Occupied Housing Units | 11,073 | 100.0% |
Occupancy by Household Size in Miami Lakes
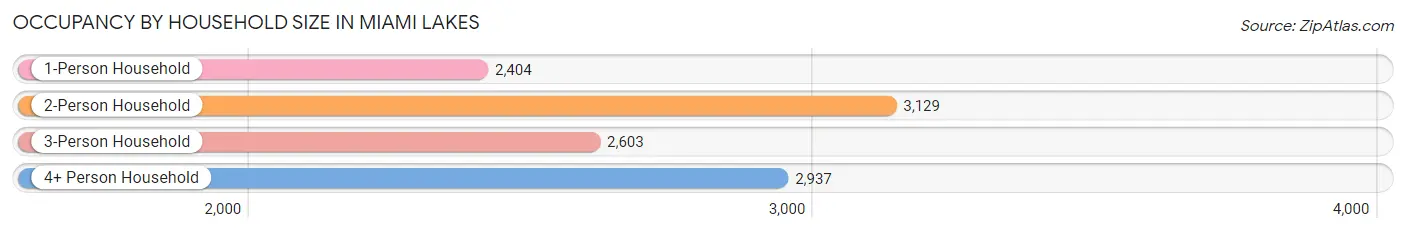
| Household Size | # Housing Units | % Housing Units |
| 1-Person Household | 2,404 | 21.7% |
| 2-Person Household | 3,129 | 28.3% |
| 3-Person Household | 2,603 | 23.5% |
| 4+ Person Household | 2,937 | 26.5% |
| Total Housing Units | 11,073 | 100.0% |
Occupancy by Ownership by Household Size in Miami Lakes
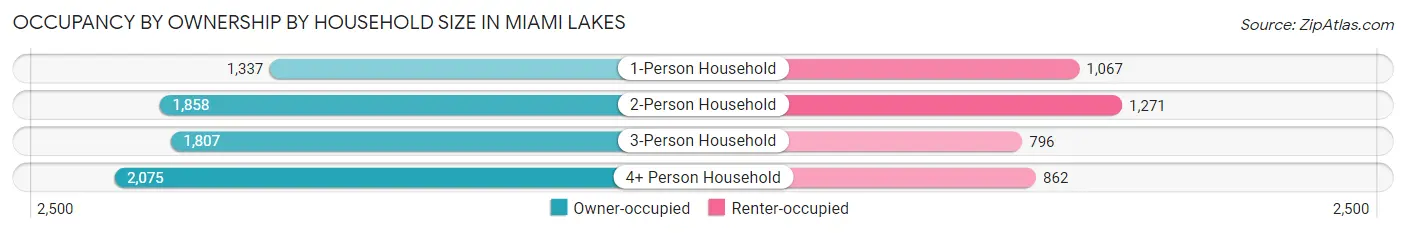
| Household Size | Owner-occupied | Renter-occupied |
| 1-Person Household | 1,337 (55.6%) | 1,067 (44.4%) |
| 2-Person Household | 1,858 (59.4%) | 1,271 (40.6%) |
| 3-Person Household | 1,807 (69.4%) | 796 (30.6%) |
| 4+ Person Household | 2,075 (70.7%) | 862 (29.3%) |
| Total Housing Units | 7,077 (63.9%) | 3,996 (36.1%) |
Occupancy by Educational Attainment in Miami Lakes
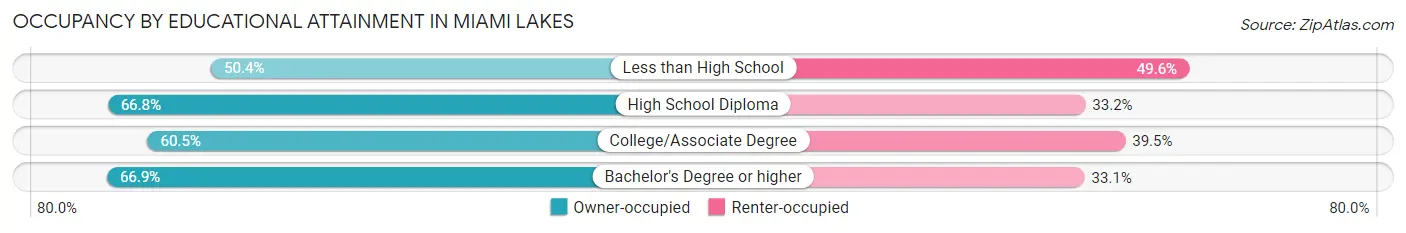
| Household Size | Owner-occupied | Renter-occupied |
| Less than High School | 317 (50.4%) | 312 (49.6%) |
| High School Diploma | 1,284 (66.8%) | 638 (33.2%) |
| College/Associate Degree | 2,137 (60.5%) | 1,396 (39.5%) |
| Bachelor's Degree or higher | 3,339 (66.9%) | 1,650 (33.1%) |
Occupancy by Age of Householder in Miami Lakes
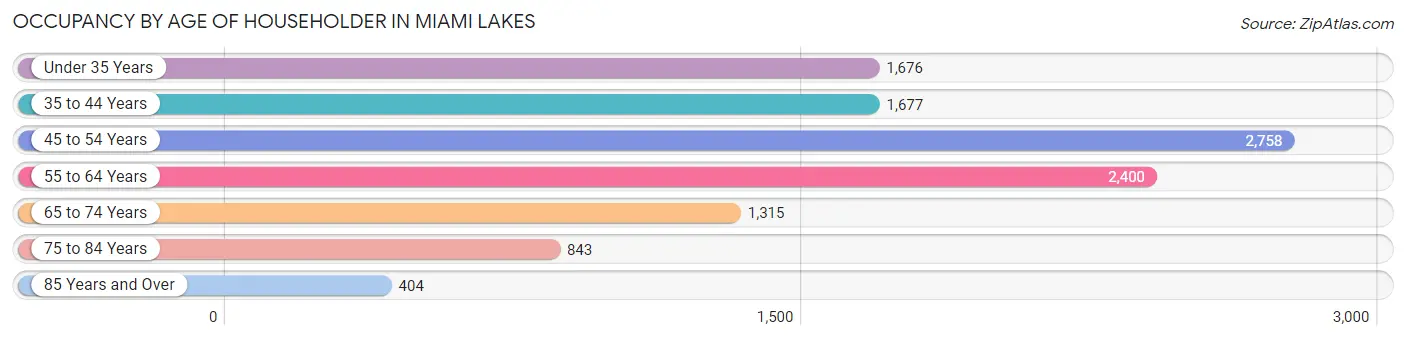
| Age Bracket | # Households | % Households |
| Under 35 Years | 1,676 | 15.1% |
| 35 to 44 Years | 1,677 | 15.1% |
| 45 to 54 Years | 2,758 | 24.9% |
| 55 to 64 Years | 2,400 | 21.7% |
| 65 to 74 Years | 1,315 | 11.9% |
| 75 to 84 Years | 843 | 7.6% |
| 85 Years and Over | 404 | 3.6% |
| Total | 11,073 | 100.0% |
Housing Finances in Miami Lakes
Median Income by Occupancy in Miami Lakes
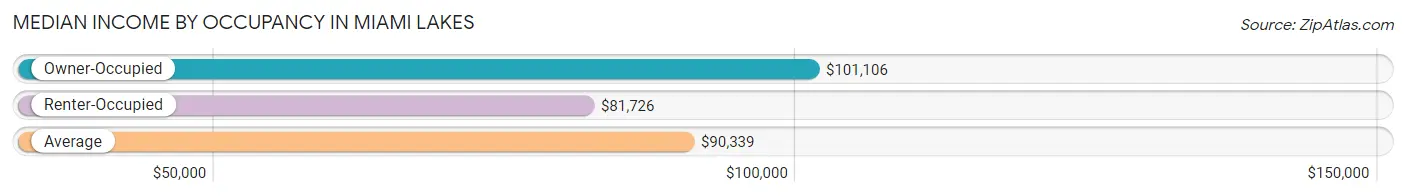
| Occupancy Type | # Households | Median Income |
| Owner-Occupied | 7,077 (63.9%) | $101,106 |
| Renter-Occupied | 3,996 (36.1%) | $81,726 |
| Average | 11,073 (100.0%) | $90,339 |
Occupancy by Householder Income Bracket in Miami Lakes
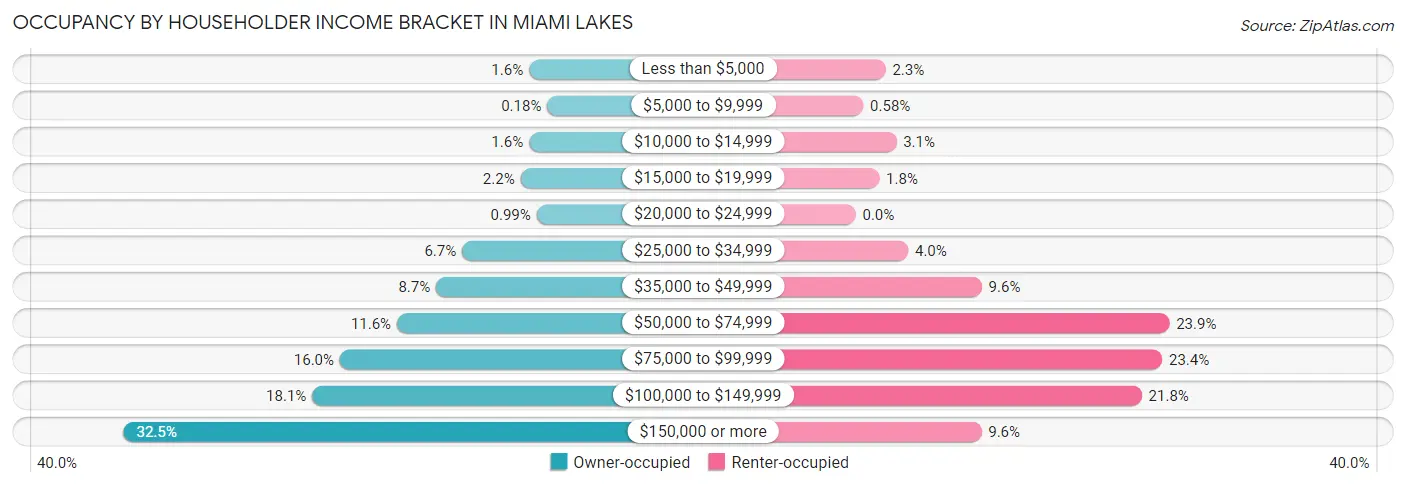
| Income Bracket | Owner-occupied | Renter-occupied |
| Less than $5,000 | 111 (1.6%) | 91 (2.3%) |
| $5,000 to $9,999 | 13 (0.2%) | 23 (0.6%) |
| $10,000 to $14,999 | 111 (1.6%) | 124 (3.1%) |
| $15,000 to $19,999 | 157 (2.2%) | 72 (1.8%) |
| $20,000 to $24,999 | 70 (1.0%) | 0 (0.0%) |
| $25,000 to $34,999 | 472 (6.7%) | 160 (4.0%) |
| $35,000 to $49,999 | 612 (8.6%) | 384 (9.6%) |
| $50,000 to $74,999 | 823 (11.6%) | 955 (23.9%) |
| $75,000 to $99,999 | 1,131 (16.0%) | 933 (23.4%) |
| $100,000 to $149,999 | 1,280 (18.1%) | 871 (21.8%) |
| $150,000 or more | 2,297 (32.5%) | 383 (9.6%) |
| Total | 7,077 (100.0%) | 3,996 (100.0%) |
Monthly Housing Cost Tiers in Miami Lakes
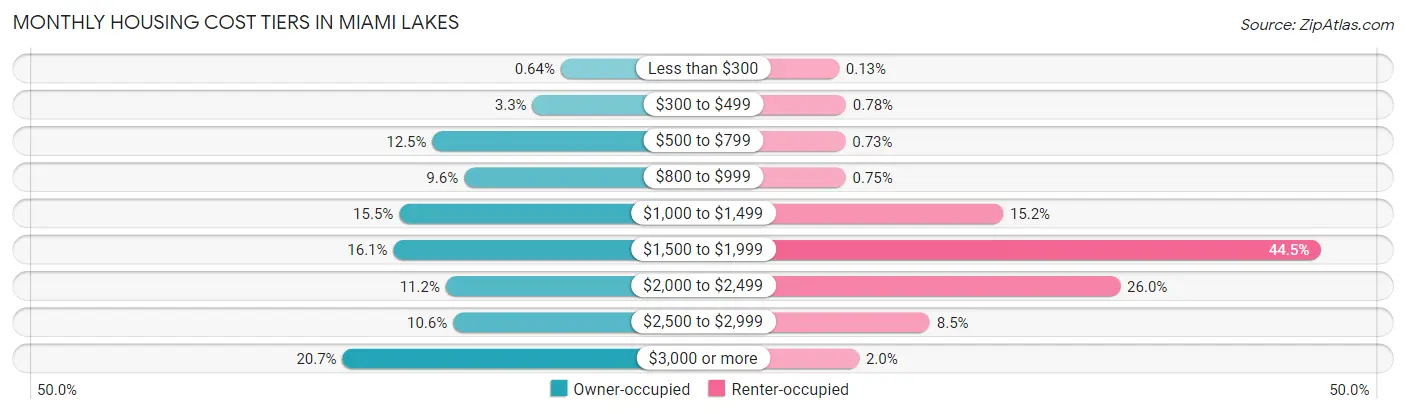
| Monthly Cost | Owner-occupied | Renter-occupied |
| Less than $300 | 45 (0.6%) | 5 (0.1%) |
| $300 to $499 | 230 (3.3%) | 31 (0.8%) |
| $500 to $799 | 882 (12.5%) | 29 (0.7%) |
| $800 to $999 | 676 (9.6%) | 30 (0.7%) |
| $1,000 to $1,499 | 1,098 (15.5%) | 609 (15.2%) |
| $1,500 to $1,999 | 1,136 (16.1%) | 1,779 (44.5%) |
| $2,000 to $2,499 | 795 (11.2%) | 1,040 (26.0%) |
| $2,500 to $2,999 | 747 (10.6%) | 340 (8.5%) |
| $3,000 or more | 1,468 (20.7%) | 79 (2.0%) |
| Total | 7,077 (100.0%) | 3,996 (100.0%) |
Physical Housing Characteristics in Miami Lakes
Housing Structures in Miami Lakes
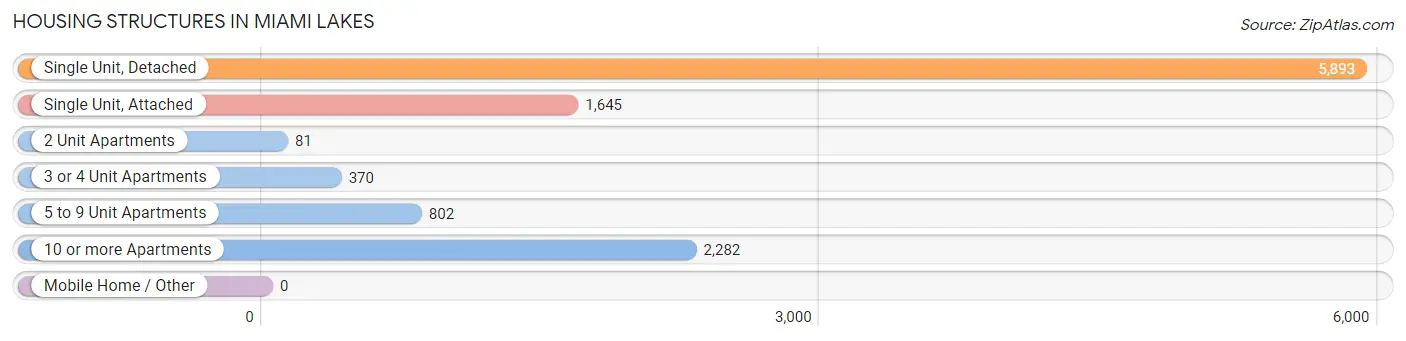
| Structure Type | # Housing Units | % Housing Units |
| Single Unit, Detached | 5,893 | 53.2% |
| Single Unit, Attached | 1,645 | 14.9% |
| 2 Unit Apartments | 81 | 0.7% |
| 3 or 4 Unit Apartments | 370 | 3.3% |
| 5 to 9 Unit Apartments | 802 | 7.2% |
| 10 or more Apartments | 2,282 | 20.6% |
| Mobile Home / Other | 0 | 0.0% |
| Total | 11,073 | 100.0% |
Housing Structures by Occupancy in Miami Lakes
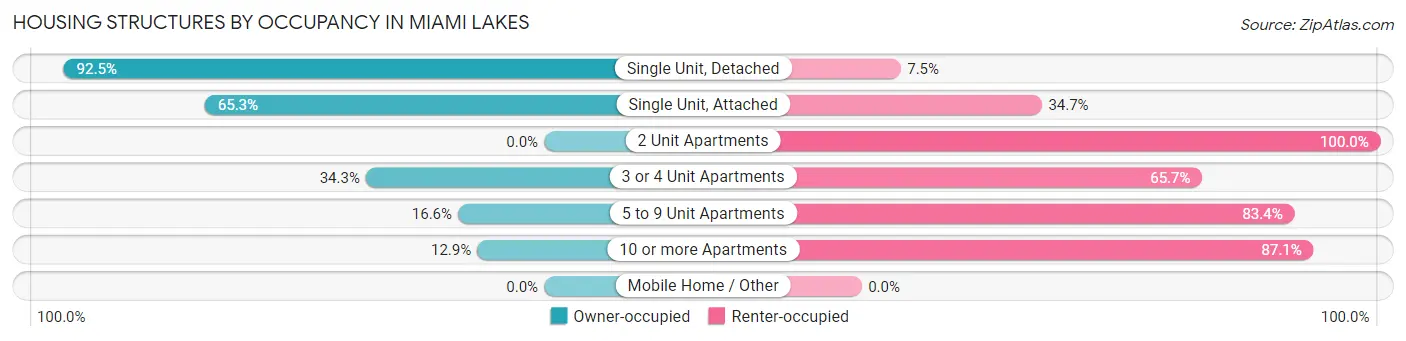
| Structure Type | Owner-occupied | Renter-occupied |
| Single Unit, Detached | 5,449 (92.5%) | 444 (7.5%) |
| Single Unit, Attached | 1,074 (65.3%) | 571 (34.7%) |
| 2 Unit Apartments | 0 (0.0%) | 81 (100.0%) |
| 3 or 4 Unit Apartments | 127 (34.3%) | 243 (65.7%) |
| 5 to 9 Unit Apartments | 133 (16.6%) | 669 (83.4%) |
| 10 or more Apartments | 294 (12.9%) | 1,988 (87.1%) |
| Mobile Home / Other | 0 (0.0%) | 0 (0.0%) |
| Total | 7,077 (63.9%) | 3,996 (36.1%) |
Housing Structures by Number of Rooms in Miami Lakes
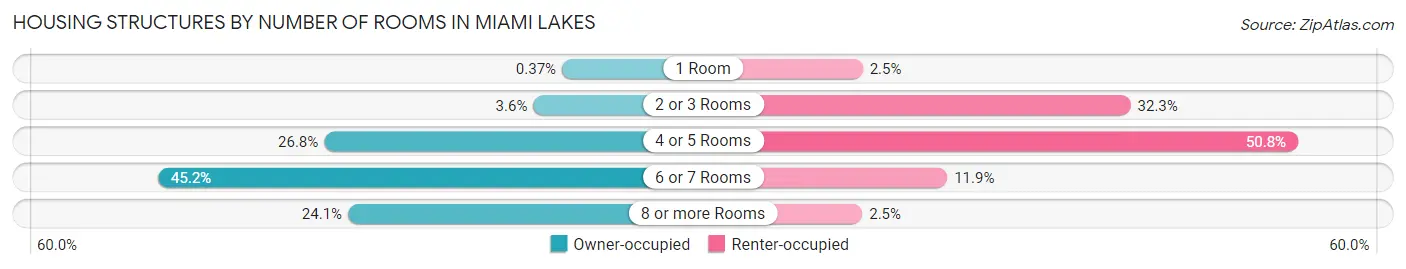
| Number of Rooms | Owner-occupied | Renter-occupied |
| 1 Room | 26 (0.4%) | 101 (2.5%) |
| 2 or 3 Rooms | 251 (3.5%) | 1,289 (32.3%) |
| 4 or 5 Rooms | 1,894 (26.8%) | 2,031 (50.8%) |
| 6 or 7 Rooms | 3,199 (45.2%) | 476 (11.9%) |
| 8 or more Rooms | 1,707 (24.1%) | 99 (2.5%) |
| Total | 7,077 (100.0%) | 3,996 (100.0%) |
Housing Structure by Heating Type in Miami Lakes
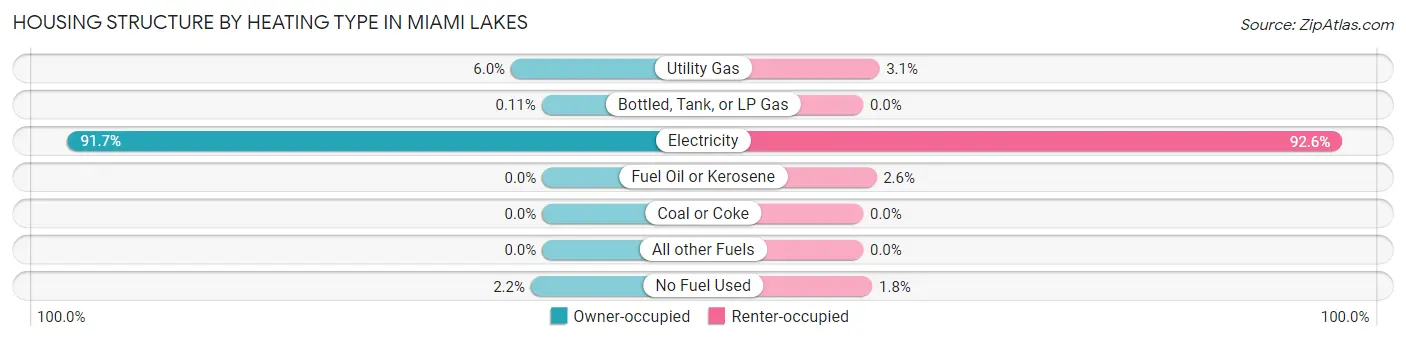
| Heating Type | Owner-occupied | Renter-occupied |
| Utility Gas | 426 (6.0%) | 125 (3.1%) |
| Bottled, Tank, or LP Gas | 8 (0.1%) | 0 (0.0%) |
| Electricity | 6,488 (91.7%) | 3,699 (92.6%) |
| Fuel Oil or Kerosene | 0 (0.0%) | 102 (2.5%) |
| Coal or Coke | 0 (0.0%) | 0 (0.0%) |
| All other Fuels | 0 (0.0%) | 0 (0.0%) |
| No Fuel Used | 155 (2.2%) | 70 (1.8%) |
| Total | 7,077 (100.0%) | 3,996 (100.0%) |
Household Vehicle Usage in Miami Lakes
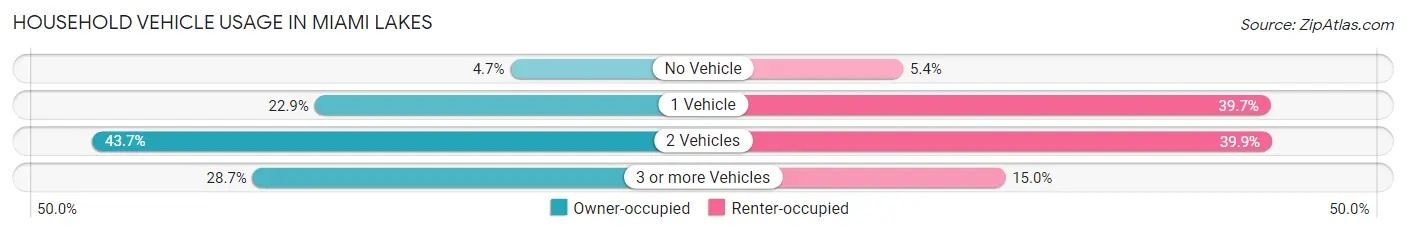
| Vehicles per Household | Owner-occupied | Renter-occupied |
| No Vehicle | 330 (4.7%) | 217 (5.4%) |
| 1 Vehicle | 1,623 (22.9%) | 1,588 (39.7%) |
| 2 Vehicles | 3,092 (43.7%) | 1,593 (39.9%) |
| 3 or more Vehicles | 2,032 (28.7%) | 598 (15.0%) |
| Total | 7,077 (100.0%) | 3,996 (100.0%) |
Real Estate & Mortgages in Miami Lakes
Real Estate and Mortgage Overview in Miami Lakes
| Characteristic | Without Mortgage | With Mortgage |
| Housing Units | 2,896 | 4,181 |
| Median Property Value | $480,200 | $488,600 |
| Median Household Income | $77,714 | $1,641 |
| Monthly Housing Costs | $887 | $1,468 |
| Real Estate Taxes | $3,976 | $41 |
Property Value by Mortgage Status in Miami Lakes
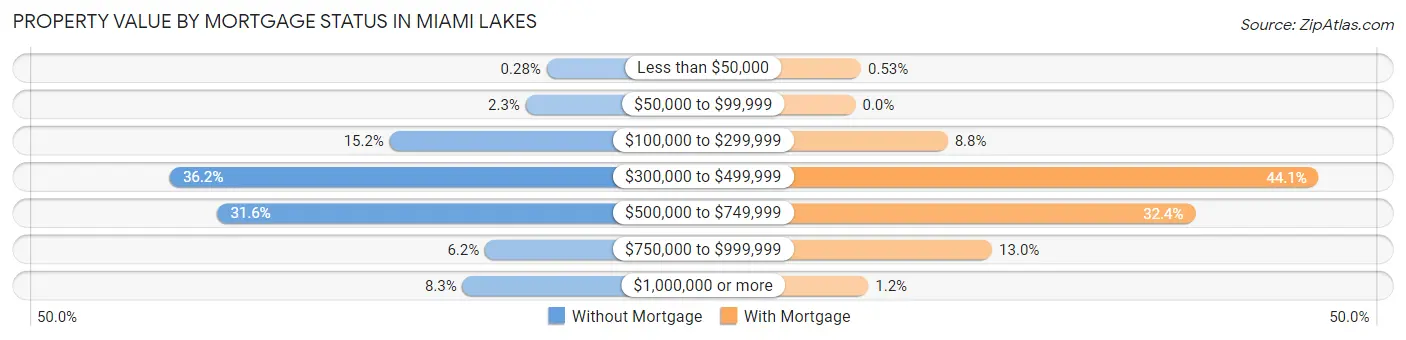
| Property Value | Without Mortgage | With Mortgage |
| Less than $50,000 | 8 (0.3%) | 22 (0.5%) |
| $50,000 to $99,999 | 66 (2.3%) | 0 (0.0%) |
| $100,000 to $299,999 | 441 (15.2%) | 367 (8.8%) |
| $300,000 to $499,999 | 1,047 (36.1%) | 1,844 (44.1%) |
| $500,000 to $749,999 | 916 (31.6%) | 1,353 (32.4%) |
| $750,000 to $999,999 | 178 (6.1%) | 544 (13.0%) |
| $1,000,000 or more | 240 (8.3%) | 51 (1.2%) |
| Total | 2,896 (100.0%) | 4,181 (100.0%) |
Household Income by Mortgage Status in Miami Lakes
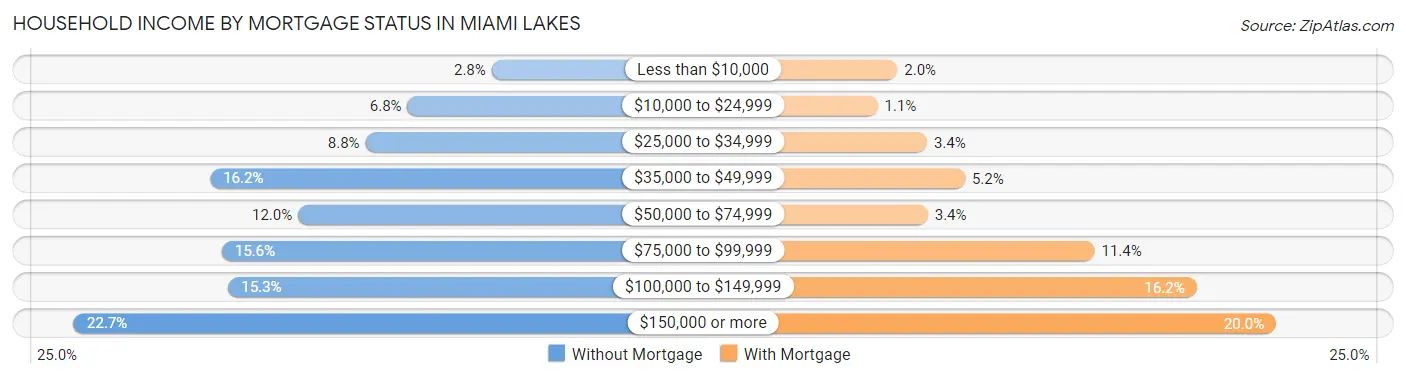
| Household Income | Without Mortgage | With Mortgage |
| Less than $10,000 | 80 (2.8%) | 83 (2.0%) |
| $10,000 to $24,999 | 196 (6.8%) | 44 (1.1%) |
| $25,000 to $34,999 | 254 (8.8%) | 142 (3.4%) |
| $35,000 to $49,999 | 468 (16.2%) | 218 (5.2%) |
| $50,000 to $74,999 | 347 (12.0%) | 144 (3.4%) |
| $75,000 to $99,999 | 452 (15.6%) | 476 (11.4%) |
| $100,000 to $149,999 | 443 (15.3%) | 679 (16.2%) |
| $150,000 or more | 656 (22.7%) | 837 (20.0%) |
| Total | 2,896 (100.0%) | 4,181 (100.0%) |
Property Value to Household Income Ratio in Miami Lakes
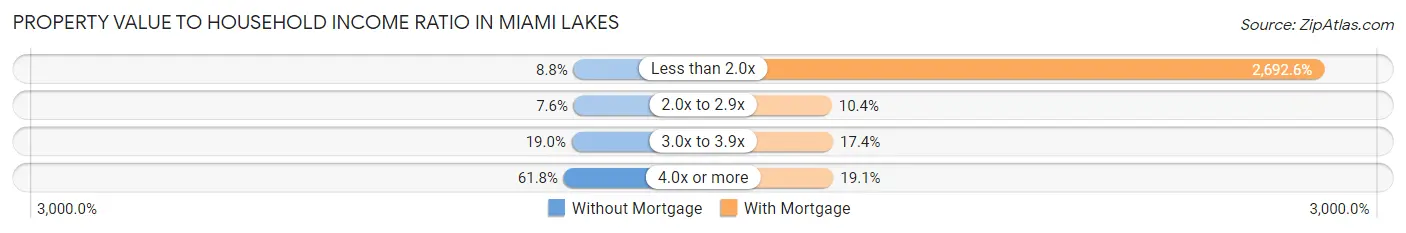
| Value-to-Income Ratio | Without Mortgage | With Mortgage |
| Less than 2.0x | 256 (8.8%) | 112,578 (2,692.6%) |
| 2.0x to 2.9x | 219 (7.6%) | 433 (10.4%) |
| 3.0x to 3.9x | 550 (19.0%) | 728 (17.4%) |
| 4.0x or more | 1,791 (61.8%) | 797 (19.1%) |
| Total | 2,896 (100.0%) | 4,181 (100.0%) |
Real Estate Taxes by Mortgage Status in Miami Lakes
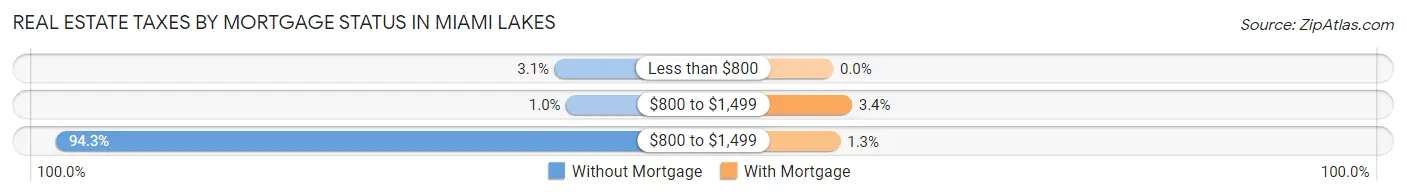
| Property Taxes | Without Mortgage | With Mortgage |
| Less than $800 | 91 (3.1%) | 0 (0.0%) |
| $800 to $1,499 | 30 (1.0%) | 143 (3.4%) |
| $800 to $1,499 | 2,730 (94.3%) | 55 (1.3%) |
| Total | 2,896 (100.0%) | 4,181 (100.0%) |
Health & Disability in Miami Lakes
Health Insurance Coverage by Age in Miami Lakes
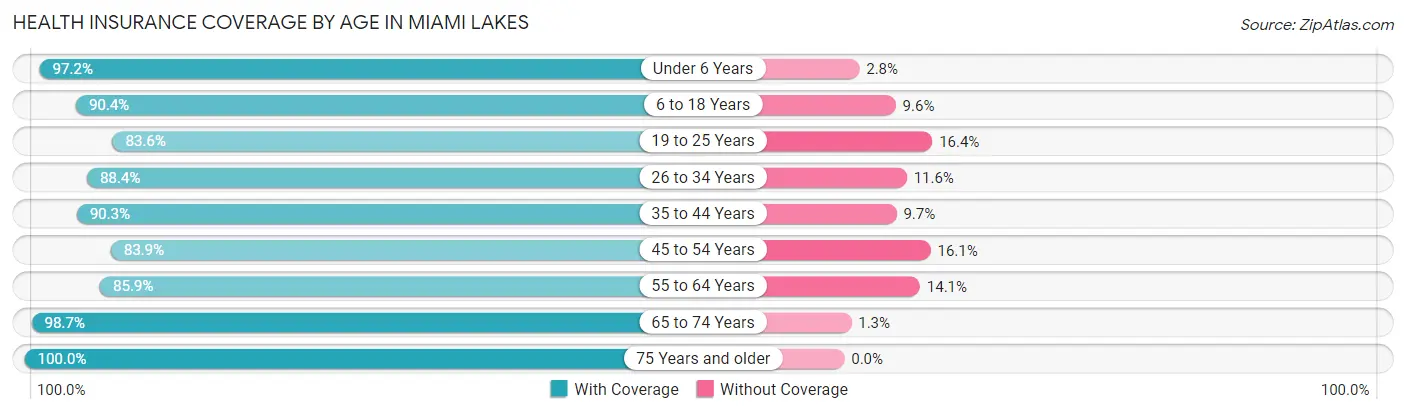
| Age Bracket | With Coverage | Without Coverage |
| Under 6 Years | 1,638 (97.2%) | 47 (2.8%) |
| 6 to 18 Years | 4,170 (90.4%) | 442 (9.6%) |
| 19 to 25 Years | 2,280 (83.6%) | 447 (16.4%) |
| 26 to 34 Years | 2,946 (88.4%) | 388 (11.6%) |
| 35 to 44 Years | 3,666 (90.3%) | 395 (9.7%) |
| 45 to 54 Years | 4,082 (83.9%) | 782 (16.1%) |
| 55 to 64 Years | 3,671 (85.9%) | 602 (14.1%) |
| 65 to 74 Years | 2,741 (98.7%) | 36 (1.3%) |
| 75 Years and older | 2,257 (100.0%) | 0 (0.0%) |
| Total | 27,451 (89.7%) | 3,139 (10.3%) |
Health Insurance Coverage by Citizenship Status in Miami Lakes
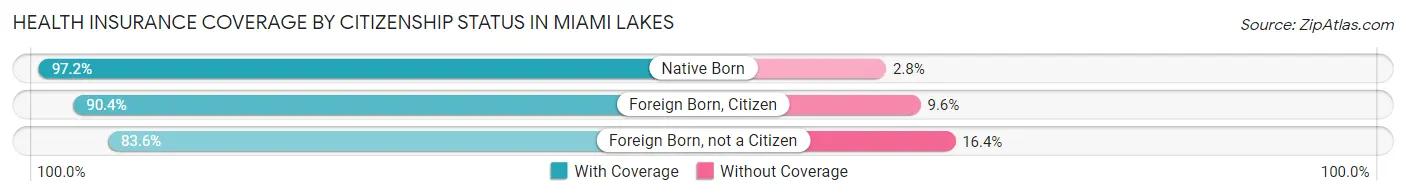
| Citizenship Status | With Coverage | Without Coverage |
| Native Born | 1,638 (97.2%) | 47 (2.8%) |
| Foreign Born, Citizen | 4,170 (90.4%) | 442 (9.6%) |
| Foreign Born, not a Citizen | 2,280 (83.6%) | 447 (16.4%) |
Health Insurance Coverage by Household Income in Miami Lakes
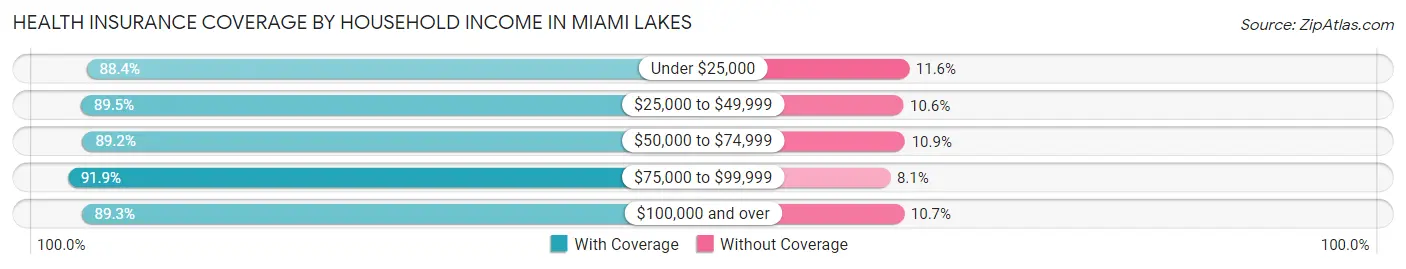
| Household Income | With Coverage | Without Coverage |
| Under $25,000 | 1,041 (88.4%) | 137 (11.6%) |
| $25,000 to $49,999 | 3,232 (89.4%) | 381 (10.5%) |
| $50,000 to $74,999 | 3,737 (89.1%) | 455 (10.8%) |
| $75,000 to $99,999 | 5,165 (91.9%) | 454 (8.1%) |
| $100,000 and over | 14,240 (89.3%) | 1,704 (10.7%) |
Public vs Private Health Insurance Coverage by Age in Miami Lakes
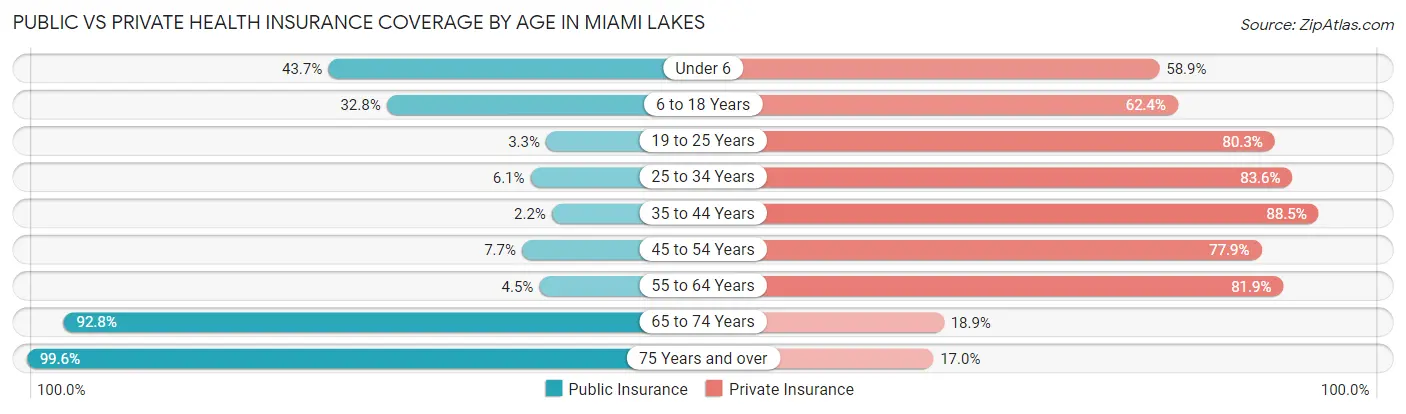
| Age Bracket | Public Insurance | Private Insurance |
| Under 6 | 736 (43.7%) | 993 (58.9%) |
| 6 to 18 Years | 1,514 (32.8%) | 2,876 (62.4%) |
| 19 to 25 Years | 89 (3.3%) | 2,191 (80.3%) |
| 25 to 34 Years | 204 (6.1%) | 2,788 (83.6%) |
| 35 to 44 Years | 88 (2.2%) | 3,594 (88.5%) |
| 45 to 54 Years | 375 (7.7%) | 3,787 (77.9%) |
| 55 to 64 Years | 192 (4.5%) | 3,501 (81.9%) |
| 65 to 74 Years | 2,576 (92.8%) | 525 (18.9%) |
| 75 Years and over | 2,248 (99.6%) | 383 (17.0%) |
| Total | 8,022 (26.2%) | 20,638 (67.5%) |
Disability Status by Sex by Age in Miami Lakes
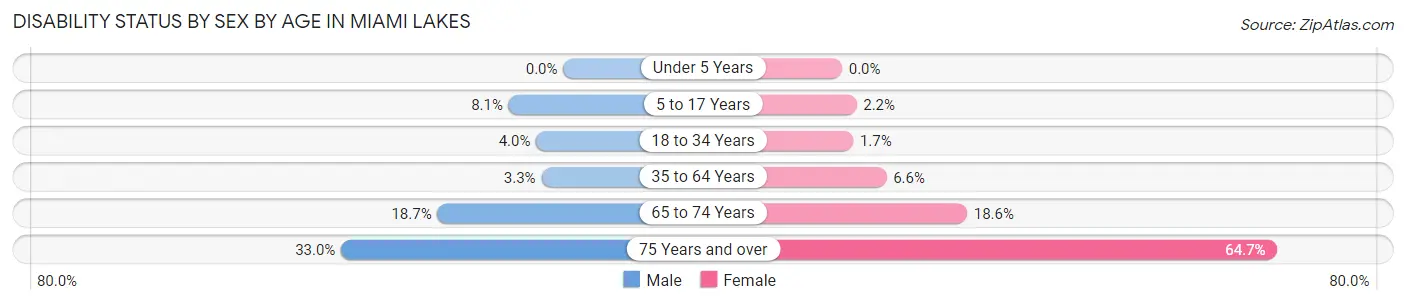
| Age Bracket | Male | Female |
| Under 5 Years | 0 (0.0%) | 0 (0.0%) |
| 5 to 17 Years | 200 (8.1%) | 46 (2.1%) |
| 18 to 34 Years | 133 (4.0%) | 50 (1.7%) |
| 35 to 64 Years | 212 (3.3%) | 440 (6.6%) |
| 65 to 74 Years | 228 (18.7%) | 289 (18.6%) |
| 75 Years and over | 257 (33.0%) | 956 (64.7%) |
Disability Class by Sex by Age in Miami Lakes
Disability Class: Hearing Difficulty
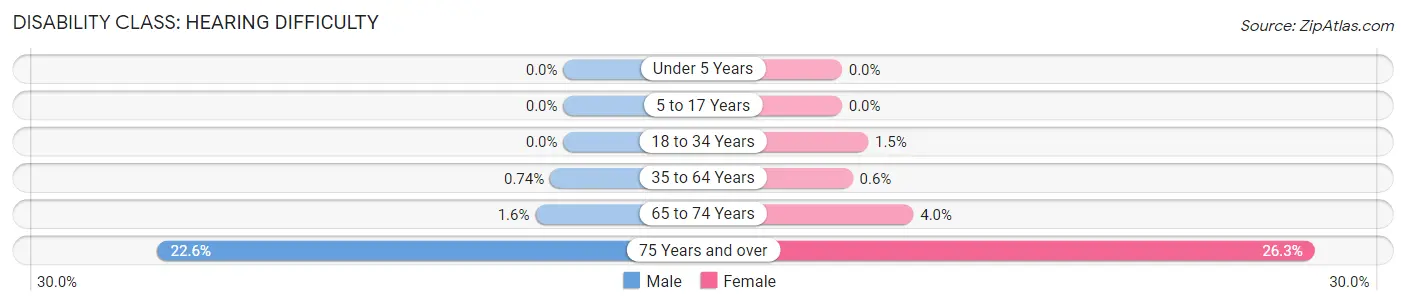
| Age Bracket | Male | Female |
| Under 5 Years | 0 (0.0%) | 0 (0.0%) |
| 5 to 17 Years | 0 (0.0%) | 0 (0.0%) |
| 18 to 34 Years | 0 (0.0%) | 44 (1.5%) |
| 35 to 64 Years | 48 (0.7%) | 40 (0.6%) |
| 65 to 74 Years | 19 (1.6%) | 62 (4.0%) |
| 75 Years and over | 176 (22.6%) | 389 (26.3%) |
Disability Class: Vision Difficulty
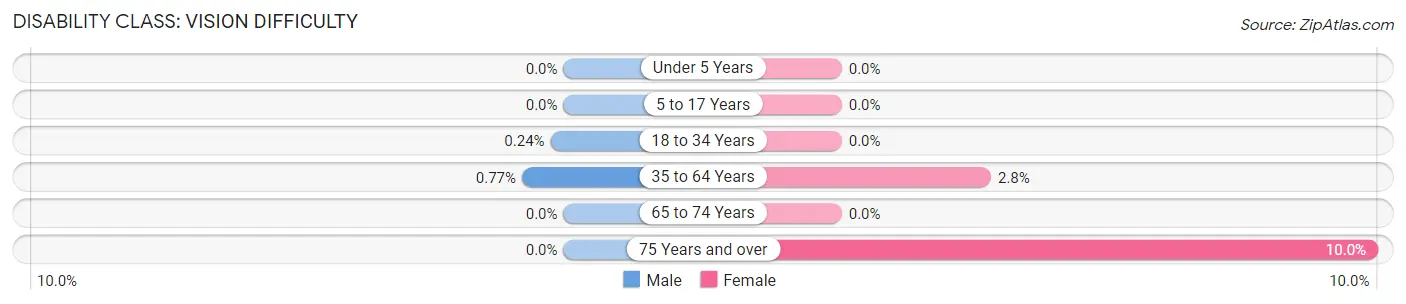
| Age Bracket | Male | Female |
| Under 5 Years | 0 (0.0%) | 0 (0.0%) |
| 5 to 17 Years | 0 (0.0%) | 0 (0.0%) |
| 18 to 34 Years | 8 (0.2%) | 0 (0.0%) |
| 35 to 64 Years | 50 (0.8%) | 185 (2.8%) |
| 65 to 74 Years | 0 (0.0%) | 0 (0.0%) |
| 75 Years and over | 0 (0.0%) | 147 (10.0%) |
Disability Class: Cognitive Difficulty
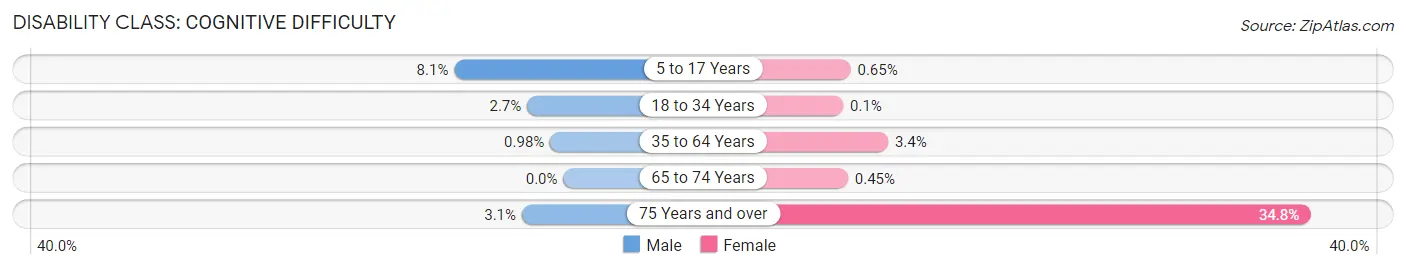
| Age Bracket | Male | Female |
| 5 to 17 Years | 200 (8.1%) | 14 (0.6%) |
| 18 to 34 Years | 89 (2.7%) | 3 (0.1%) |
| 35 to 64 Years | 64 (1.0%) | 229 (3.4%) |
| 65 to 74 Years | 0 (0.0%) | 7 (0.4%) |
| 75 Years and over | 24 (3.1%) | 515 (34.8%) |
Disability Class: Ambulatory Difficulty
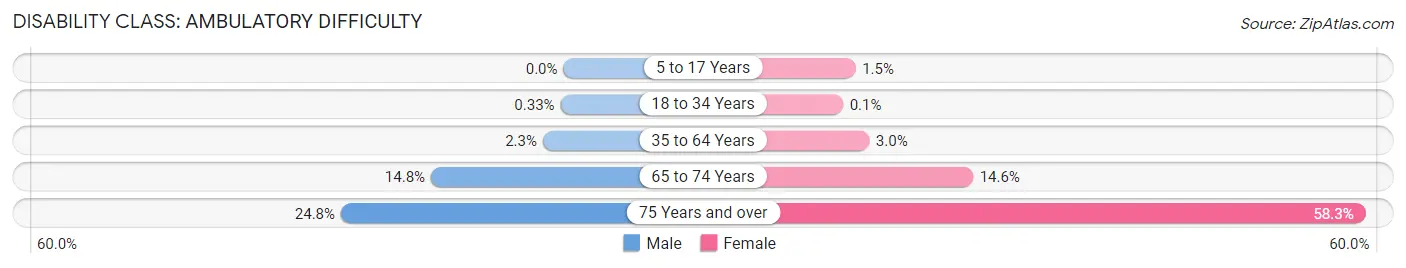
| Age Bracket | Male | Female |
| 5 to 17 Years | 0 (0.0%) | 32 (1.5%) |
| 18 to 34 Years | 11 (0.3%) | 3 (0.1%) |
| 35 to 64 Years | 149 (2.3%) | 202 (3.0%) |
| 65 to 74 Years | 180 (14.7%) | 227 (14.6%) |
| 75 Years and over | 193 (24.8%) | 862 (58.3%) |
Disability Class: Self-Care Difficulty
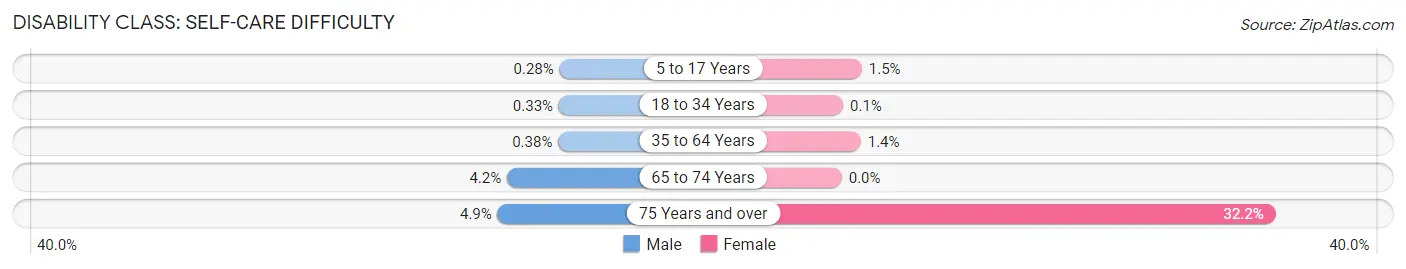
| Age Bracket | Male | Female |
| 5 to 17 Years | 7 (0.3%) | 32 (1.5%) |
| 18 to 34 Years | 11 (0.3%) | 3 (0.1%) |
| 35 to 64 Years | 25 (0.4%) | 94 (1.4%) |
| 65 to 74 Years | 51 (4.2%) | 0 (0.0%) |
| 75 Years and over | 38 (4.9%) | 476 (32.2%) |
Technology Access in Miami Lakes
Computing Device Access in Miami Lakes
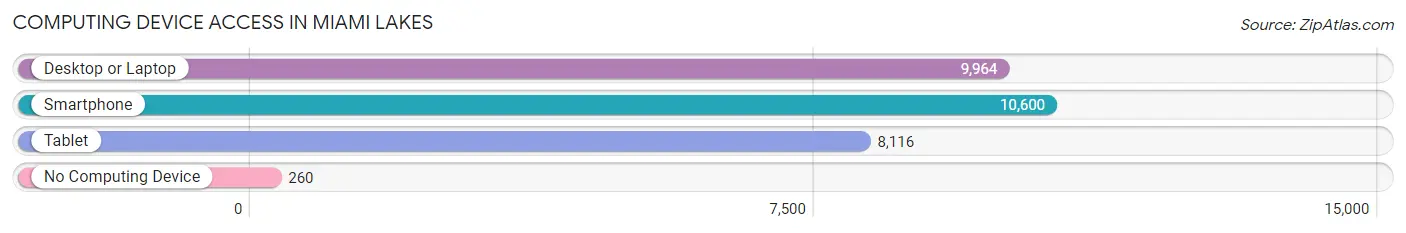
| Device Type | # Households | % Households |
| Desktop or Laptop | 9,964 | 90.0% |
| Smartphone | 10,600 | 95.7% |
| Tablet | 8,116 | 73.3% |
| No Computing Device | 260 | 2.4% |
| Total | 11,073 | 100.0% |
Internet Access in Miami Lakes
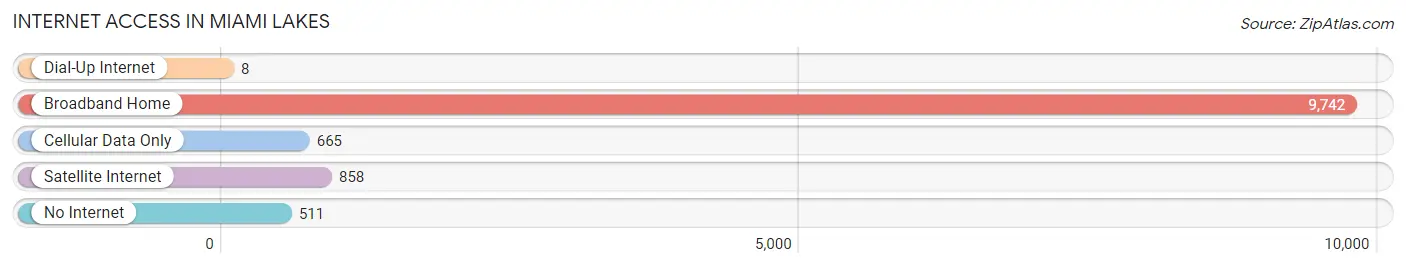
| Internet Type | # Households | % Households |
| Dial-Up Internet | 8 | 0.1% |
| Broadband Home | 9,742 | 88.0% |
| Cellular Data Only | 665 | 6.0% |
| Satellite Internet | 858 | 7.7% |
| No Internet | 511 | 4.6% |
| Total | 11,073 | 100.0% |
Miami Lakes Summary
Miami Lakes is a town located in Miami-Dade County, Florida, United States. It is located about 15 miles northwest of Downtown Miami and is part of the Miami metropolitan area. The town was incorporated in December 2000 and is one of the youngest municipalities in Miami-Dade County. As of the 2010 census, the population of Miami Lakes was 29,364.
History
The area that is now Miami Lakes was originally part of the Everglades and was inhabited by the Tequesta Indians. In the early 1900s, the area was developed as a dairy farm by the Graham family. In the 1950s, the Grahams sold the land to developers who planned to build a residential community. The development was named “Country Club Estates” and was designed to be a golf course community.
In the 1960s, the development was renamed “Miami Lakes” and the first homes were built. The town was officially incorporated in December 2000 and is one of the youngest municipalities in Miami-Dade County.
Geography
Miami Lakes is located at 25°53'25" North, 80°17'45" West (25.8903, -80.2958). It is situated in the northwest corner of Miami-Dade County, about 15 miles northwest of Downtown Miami. The town has a total area of 8.2 square miles, of which 8.1 square miles is land and 0.1 square miles is water.
Economy
Miami Lakes is home to many businesses and corporate headquarters, including American Express, Burger King, Carnival Corporation, Ryder System, and Telemundo. The town is also home to the Miami Lakes Educational Center, which is a public school that serves students in grades 6-12.
Demographics
As of the 2010 census, there were 29,364 people, 10,845 households, and 7,845 families residing in the town. The population density was 3,611.3 people per square mile. The racial makeup of the town was 64.2% White, 22.3% African American, 0.3% Native American, 3.2% Asian, 0.1% Pacific Islander, 7.2% from other races, and 2.7% from two or more races. Hispanic or Latino of any race were 57.3% of the population.
The median income for a household in the town was $50,945, and the median income for a family was $60,945. Males had a median income of $41,945 versus $31,945 for females. The per capita income for the town was $25,945. About 6.2% of families and 8.2% of the population were below the poverty line, including 10.2% of those under age 18 and 6.2% of those age 65 or over.
Common Questions
What is Per Capita Income in Miami Lakes?
Per Capita income in Miami Lakes is $42,709.
What is the Median Family Income in Miami Lakes?
Median Family Income in Miami Lakes is $100,217.
What is the Median Household income in Miami Lakes?
Median Household Income in Miami Lakes is $90,339.
What is Income or Wage Gap in Miami Lakes?
Income or Wage Gap in Miami Lakes is 7.2%.
Women in Miami Lakes earn 92.8 cents for every dollar earned by a man.
What is Inequality or Gini Index in Miami Lakes?
Inequality or Gini Index in Miami Lakes is 0.41.
What is the Total Population of Miami Lakes?
Total Population of Miami Lakes is 30,621.
What is the Total Male Population of Miami Lakes?
Total Male Population of Miami Lakes is 15,027.
What is the Total Female Population of Miami Lakes?
Total Female Population of Miami Lakes is 15,594.
What is the Ratio of Males per 100 Females in Miami Lakes?
There are 96.36 Males per 100 Females in Miami Lakes.
What is the Ratio of Females per 100 Males in Miami Lakes?
There are 103.77 Females per 100 Males in Miami Lakes.
What is the Median Population Age in Miami Lakes?
Median Population Age in Miami Lakes is 42.8 Years.
What is the Average Family Size in Miami Lakes
Average Family Size in Miami Lakes is 3.2 People.
What is the Average Household Size in Miami Lakes
Average Household Size in Miami Lakes is 2.8 People.
How Large is the Labor Force in Miami Lakes?
There are 17,704 People in the Labor Forcein in Miami Lakes.
What is the Percentage of People in the Labor Force in Miami Lakes?
69.6% of People are in the Labor Force in Miami Lakes.
What is the Unemployment Rate in Miami Lakes?
Unemployment Rate in Miami Lakes is 3.2%.