Coconut Creek, FL Map & Demographics
Coconut Creek Map
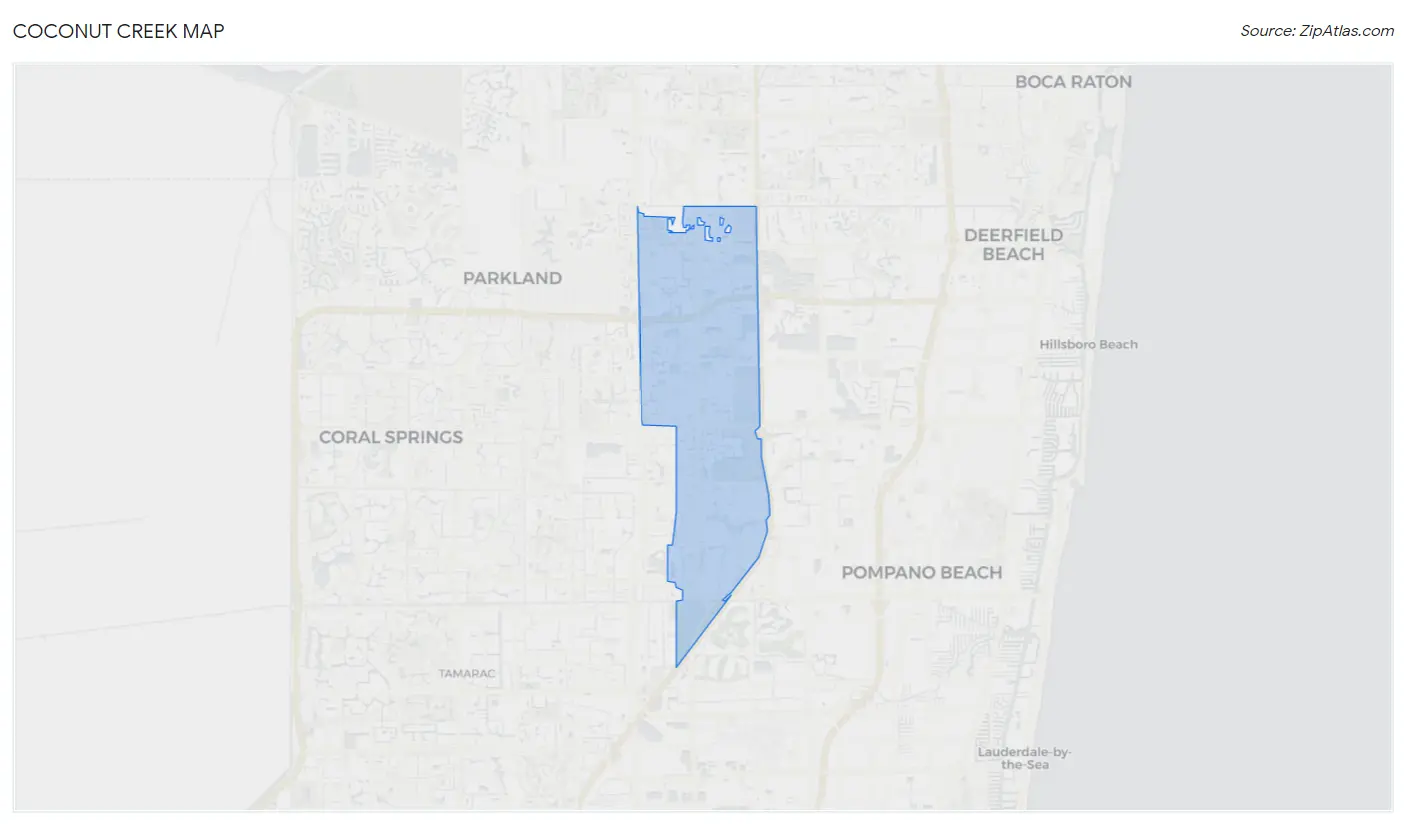
Coconut Creek Overview
$45,657
PER CAPITA INCOME
$91,612
AVG FAMILY INCOME
$72,740
AVG HOUSEHOLD INCOME
20.8%
WAGE / INCOME GAP [ % ]
79.2¢/ $1
WAGE / INCOME GAP [ $ ]
$13,322
FAMILY INCOME DEFICIT
0.52
INEQUALITY / GINI INDEX
57,574
TOTAL POPULATION
27,492
MALE POPULATION
30,082
FEMALE POPULATION
91.39
MALES / 100 FEMALES
109.42
FEMALES / 100 MALES
42.4
MEDIAN AGE
3.2
AVG FAMILY SIZE
2.4
AVG HOUSEHOLD SIZE
31,514
LABOR FORCE [ PEOPLE ]
66.7%
PERCENT IN LABOR FORCE
4.8%
UNEMPLOYMENT RATE
Income in Coconut Creek
Income Overview in Coconut Creek
Per Capita Income in Coconut Creek is $45,657, while median incomes of families and households are $91,612 and $72,740 respectively.
| Characteristic | Number | Measure |
| Per Capita Income | 57,574 | $45,657 |
| Median Family Income | 14,084 | $91,612 |
| Mean Family Income | 14,084 | $108,573 |
| Median Household Income | 23,696 | $72,740 |
| Mean Household Income | 23,696 | $108,686 |
| Income Deficit | 14,084 | $13,322 |
| Wage / Income Gap (%) | 57,574 | 20.79% |
| Wage / Income Gap ($) | 57,574 | 79.21¢ per $1 |
| Gini / Inequality Index | 57,574 | 0.52 |
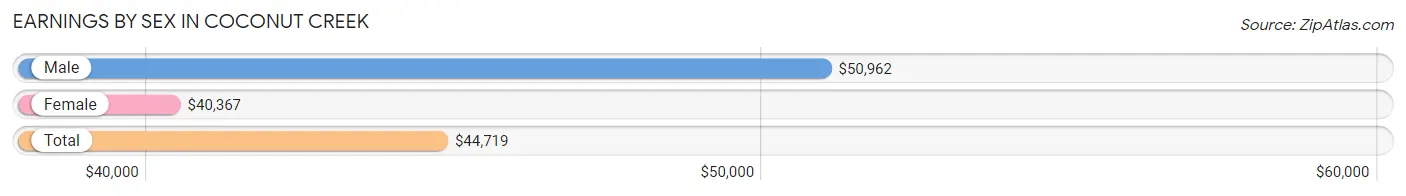
Earnings by Sex in Coconut Creek
Average Earnings in Coconut Creek are $44,719, $50,962 for men and $40,367 for women, a difference of 20.8%.
| Sex | Number | Average Earnings |
| Male | 15,543 (49.0%) | $50,962 |
| Female | 16,196 (51.0%) | $40,367 |
| Total | 31,739 (100.0%) | $44,719 |
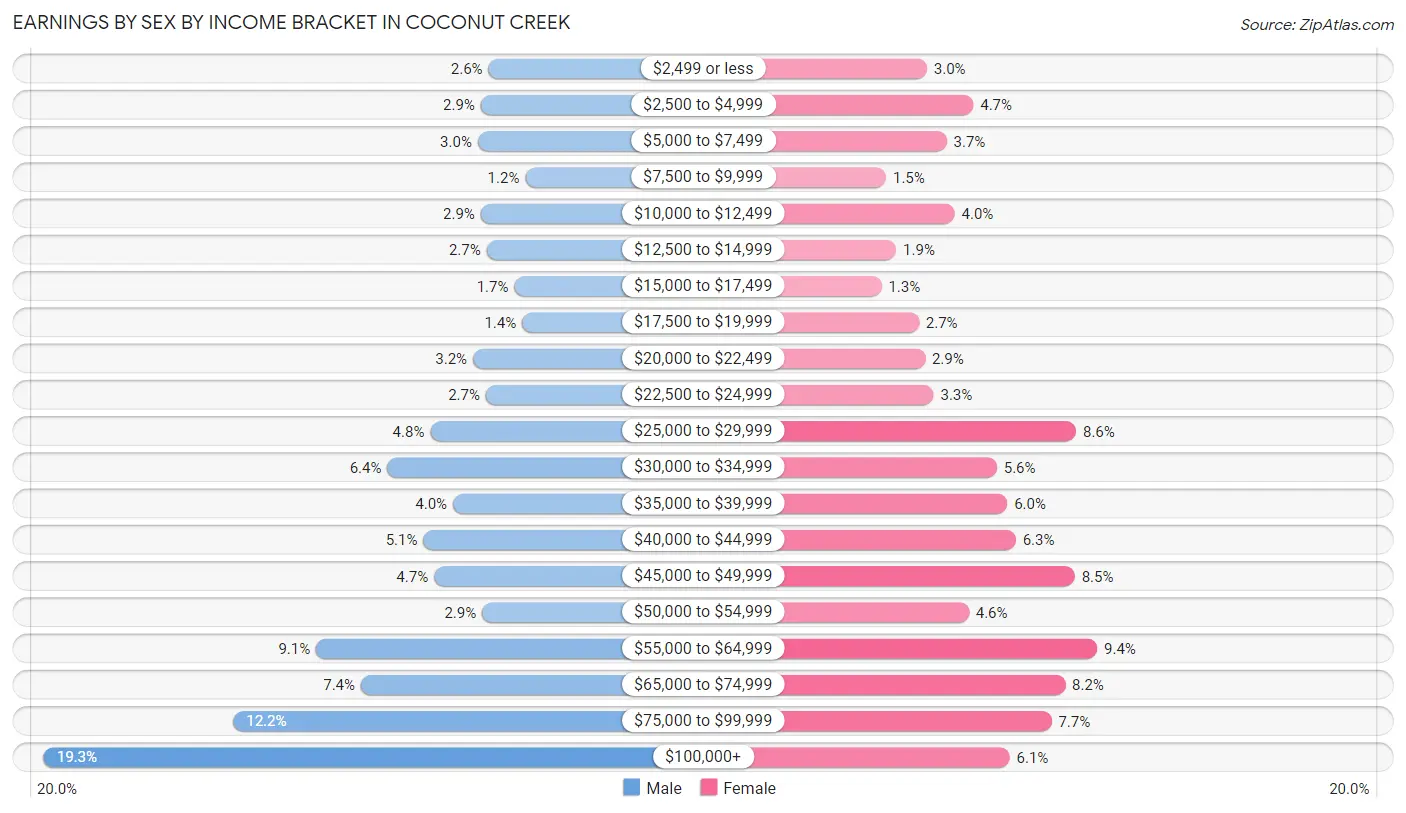
Earnings by Sex by Income Bracket in Coconut Creek
The most common earnings brackets in Coconut Creek are $100,000+ for men (2,996 | 19.3%) and $55,000 to $64,999 for women (1,519 | 9.4%).
| Income | Male | Female |
| $2,499 or less | 407 (2.6%) | 486 (3.0%) |
| $2,500 to $4,999 | 453 (2.9%) | 767 (4.7%) |
| $5,000 to $7,499 | 469 (3.0%) | 605 (3.7%) |
| $7,500 to $9,999 | 192 (1.2%) | 238 (1.5%) |
| $10,000 to $12,499 | 452 (2.9%) | 654 (4.0%) |
| $12,500 to $14,999 | 418 (2.7%) | 299 (1.8%) |
| $15,000 to $17,499 | 257 (1.7%) | 211 (1.3%) |
| $17,500 to $19,999 | 211 (1.4%) | 437 (2.7%) |
| $20,000 to $22,499 | 498 (3.2%) | 475 (2.9%) |
| $22,500 to $24,999 | 422 (2.7%) | 526 (3.3%) |
| $25,000 to $29,999 | 746 (4.8%) | 1,391 (8.6%) |
| $30,000 to $34,999 | 997 (6.4%) | 910 (5.6%) |
| $35,000 to $39,999 | 614 (4.0%) | 974 (6.0%) |
| $40,000 to $44,999 | 787 (5.1%) | 1,025 (6.3%) |
| $45,000 to $49,999 | 725 (4.7%) | 1,383 (8.5%) |
| $50,000 to $54,999 | 445 (2.9%) | 740 (4.6%) |
| $55,000 to $64,999 | 1,411 (9.1%) | 1,519 (9.4%) |
| $65,000 to $74,999 | 1,150 (7.4%) | 1,325 (8.2%) |
| $75,000 to $99,999 | 1,893 (12.2%) | 1,243 (7.7%) |
| $100,000+ | 2,996 (19.3%) | 988 (6.1%) |
| Total | 15,543 (100.0%) | 16,196 (100.0%) |
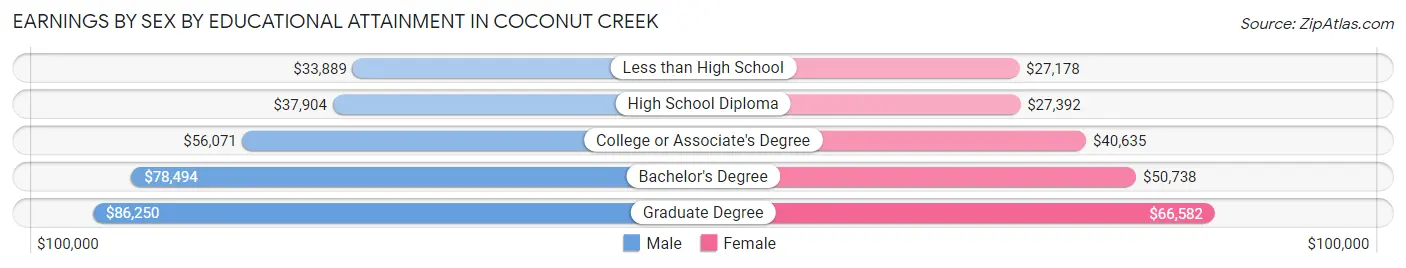
Earnings by Sex by Educational Attainment in Coconut Creek
Average earnings in Coconut Creek are $57,569 for men and $41,912 for women, a difference of 27.2%. Men with an educational attainment of graduate degree enjoy the highest average annual earnings of $86,250, while those with less than high school education earn the least with $33,889. Women with an educational attainment of graduate degree earn the most with the average annual earnings of $66,582, while those with less than high school education have the smallest earnings of $27,178.
| Educational Attainment | Male Income | Female Income |
| Less than High School | $33,889 | $27,178 |
| High School Diploma | $37,904 | $27,392 |
| College or Associate's Degree | $56,071 | $40,635 |
| Bachelor's Degree | $78,494 | $50,738 |
| Graduate Degree | $86,250 | $66,582 |
| Total | $57,569 | $41,912 |
Family Income in Coconut Creek
Family Income Brackets in Coconut Creek
According to the Coconut Creek family income data, there are 3,282 families falling into the $100,000 to $149,999 income range, which is the most common income bracket and makes up 23.3% of all families. Conversely, the $10,000 to $14,999 income bracket is the least frequent group with only 99 families (0.7%) belonging to this category.
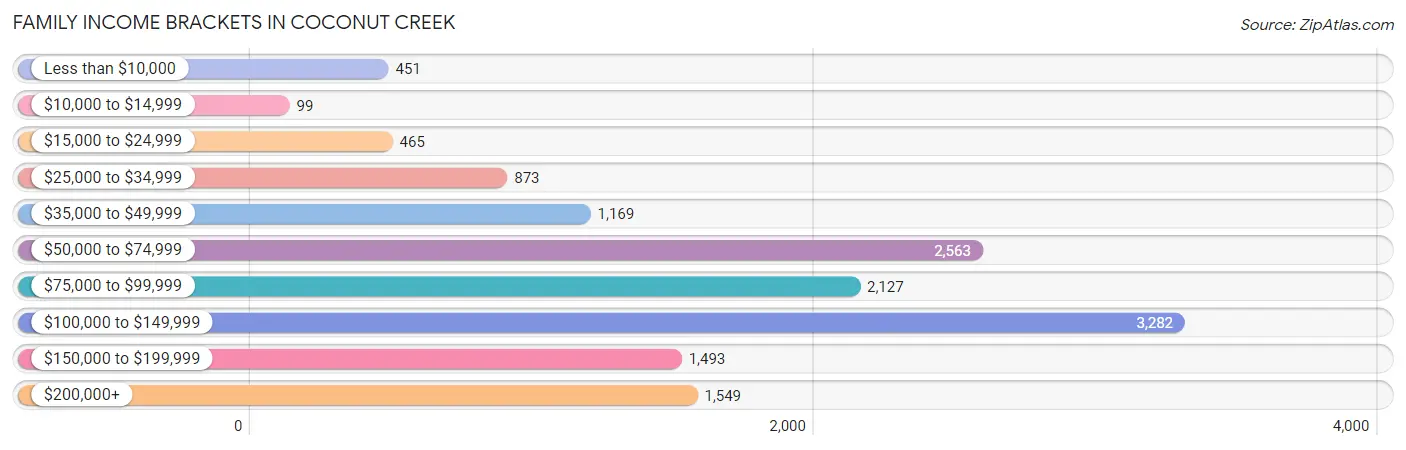
| Income Bracket | # Families | % Families |
| Less than $10,000 | 451 | 3.2% |
| $10,000 to $14,999 | 99 | 0.7% |
| $15,000 to $24,999 | 465 | 3.3% |
| $25,000 to $34,999 | 873 | 6.2% |
| $35,000 to $49,999 | 1,169 | 8.3% |
| $50,000 to $74,999 | 2,563 | 18.2% |
| $75,000 to $99,999 | 2,127 | 15.1% |
| $100,000 to $149,999 | 3,282 | 23.3% |
| $150,000 to $199,999 | 1,493 | 10.6% |
| $200,000+ | 1,549 | 11.0% |
Family Income by Famaliy Size in Coconut Creek
6-person families (398 | 2.8%) account for the highest median family income in Coconut Creek with $130,942 per family, while 2-person families (6,815 | 48.4%) have the highest median income of $38,553 per family member.
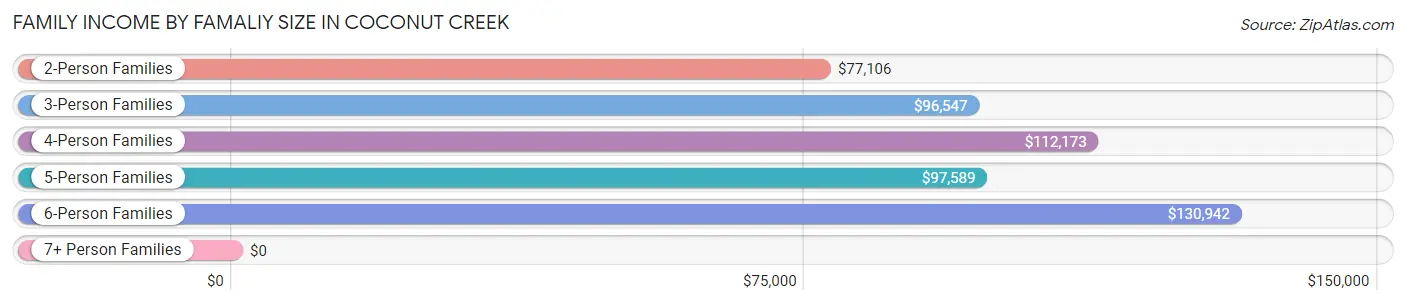
| Income Bracket | # Families | Median Income |
| 2-Person Families | 6,815 (48.4%) | $77,106 |
| 3-Person Families | 3,138 (22.3%) | $96,547 |
| 4-Person Families | 2,509 (17.8%) | $112,173 |
| 5-Person Families | 1,063 (7.5%) | $97,589 |
| 6-Person Families | 398 (2.8%) | $130,942 |
| 7+ Person Families | 161 (1.1%) | $0 |
| Total | 14,084 (100.0%) | $91,612 |
Family Income by Number of Earners in Coconut Creek
The median family income in Coconut Creek is $91,612, with families comprising 3+ earners (1,788) having the highest median family income of $137,950, while families with no earners (1,855) have the lowest median family income of $50,018, accounting for 12.7% and 13.2% of families, respectively.
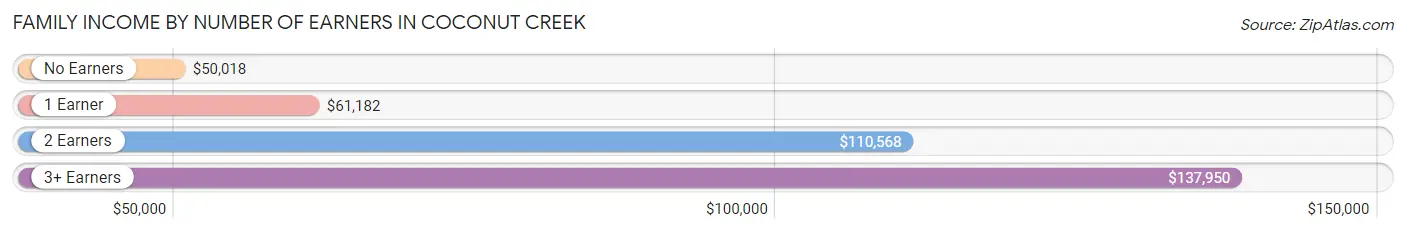
| Number of Earners | # Families | Median Income |
| No Earners | 1,855 (13.2%) | $50,018 |
| 1 Earner | 3,761 (26.7%) | $61,182 |
| 2 Earners | 6,680 (47.4%) | $110,568 |
| 3+ Earners | 1,788 (12.7%) | $137,950 |
| Total | 14,084 (100.0%) | $91,612 |
Household Income in Coconut Creek
Household Income Brackets in Coconut Creek
With 4,313 households falling in the category, the $100,000 to $149,999 income range is the most frequent in Coconut Creek, accounting for 18.2% of all households. In contrast, only 569 households (2.4%) fall into the $10,000 to $14,999 income bracket, making it the least populous group.
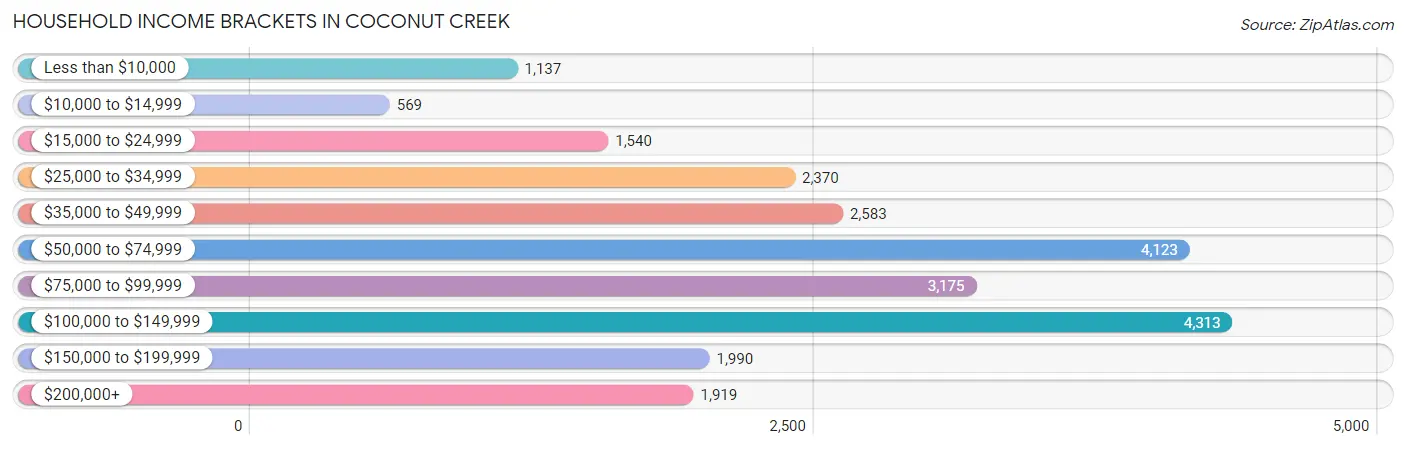
| Income Bracket | # Households | % Households |
| Less than $10,000 | 1,137 | 4.8% |
| $10,000 to $14,999 | 569 | 2.4% |
| $15,000 to $24,999 | 1,540 | 6.5% |
| $25,000 to $34,999 | 2,370 | 10.0% |
| $35,000 to $49,999 | 2,583 | 10.9% |
| $50,000 to $74,999 | 4,123 | 17.4% |
| $75,000 to $99,999 | 3,175 | 13.4% |
| $100,000 to $149,999 | 4,313 | 18.2% |
| $150,000 to $199,999 | 1,990 | 8.4% |
| $200,000+ | 1,919 | 8.1% |
Household Income by Householder Age in Coconut Creek
The median household income in Coconut Creek is $72,740, with the highest median household income of $91,237 found in the 25 to 44 years age bracket for the primary householder. A total of 6,982 households (29.5%) fall into this category. Meanwhile, the 65+ years age bracket for the primary householder has the lowest median household income of $49,148, with 7,085 households (29.9%) in this group.
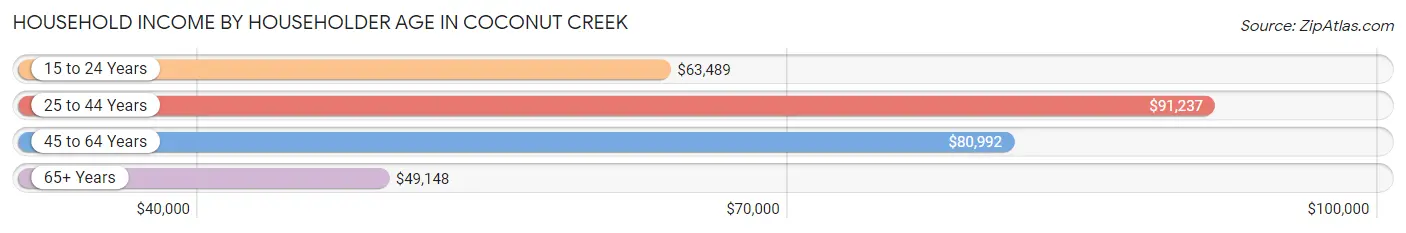
| Income Bracket | # Households | Median Income |
| 15 to 24 Years | 367 (1.5%) | $63,489 |
| 25 to 44 Years | 6,982 (29.5%) | $91,237 |
| 45 to 64 Years | 9,262 (39.1%) | $80,992 |
| 65+ Years | 7,085 (29.9%) | $49,148 |
| Total | 23,696 (100.0%) | $72,740 |
Poverty in Coconut Creek
Income Below Poverty by Sex and Age in Coconut Creek
With 10.5% poverty level for males and 9.4% for females among the residents of Coconut Creek, 15 year old males and 16 and 17 year old females are the most vulnerable to poverty, with 126 males (22.7%) and 190 females (20.2%) in their respective age groups living below the poverty level.
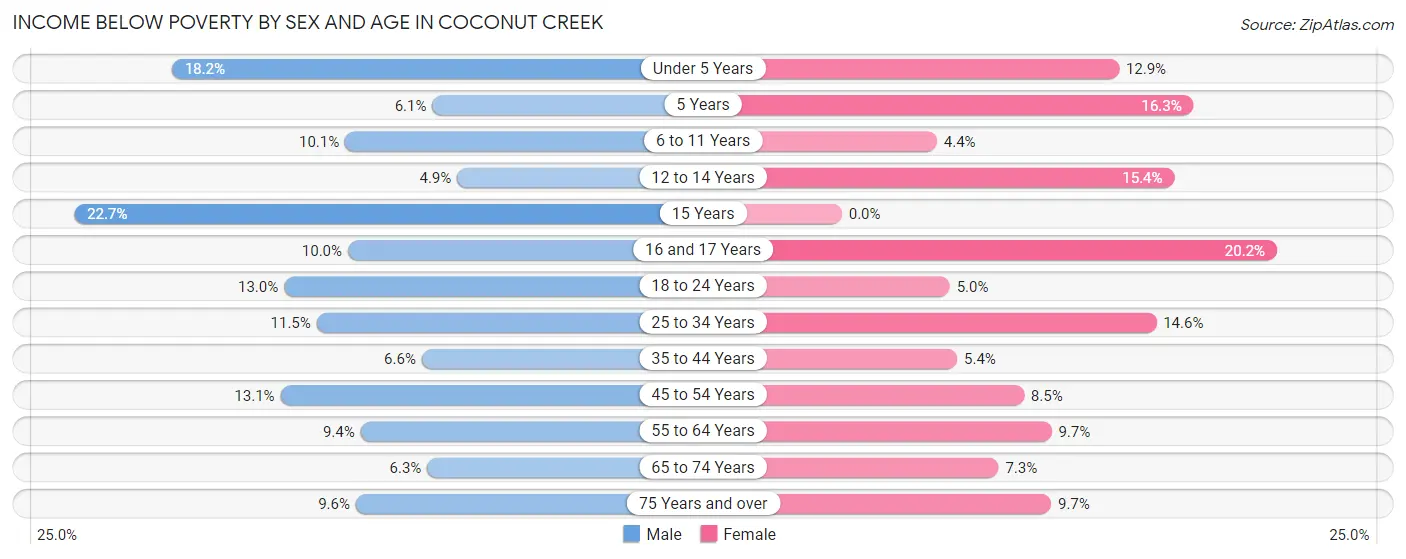
| Age Bracket | Male | Female |
| Under 5 Years | 286 (18.2%) | 214 (12.9%) |
| 5 Years | 11 (6.1%) | 47 (16.3%) |
| 6 to 11 Years | 185 (10.1%) | 60 (4.4%) |
| 12 to 14 Years | 56 (4.9%) | 144 (15.4%) |
| 15 Years | 126 (22.7%) | 0 (0.0%) |
| 16 and 17 Years | 54 (10.0%) | 190 (20.2%) |
| 18 to 24 Years | 312 (13.0%) | 77 (5.0%) |
| 25 to 34 Years | 422 (11.5%) | 569 (14.6%) |
| 35 to 44 Years | 248 (6.6%) | 210 (5.3%) |
| 45 to 54 Years | 488 (13.1%) | 348 (8.5%) |
| 55 to 64 Years | 324 (9.4%) | 415 (9.7%) |
| 65 to 74 Years | 145 (6.3%) | 228 (7.3%) |
| 75 Years and over | 197 (9.6%) | 322 (9.7%) |
| Total | 2,854 (10.5%) | 2,824 (9.4%) |
Income Above Poverty by Sex and Age in Coconut Creek
According to the poverty statistics in Coconut Creek, males aged 12 to 14 years and females aged 15 years are the age groups that are most secure financially, with 95.1% of males and 100.0% of females in these age groups living above the poverty line.
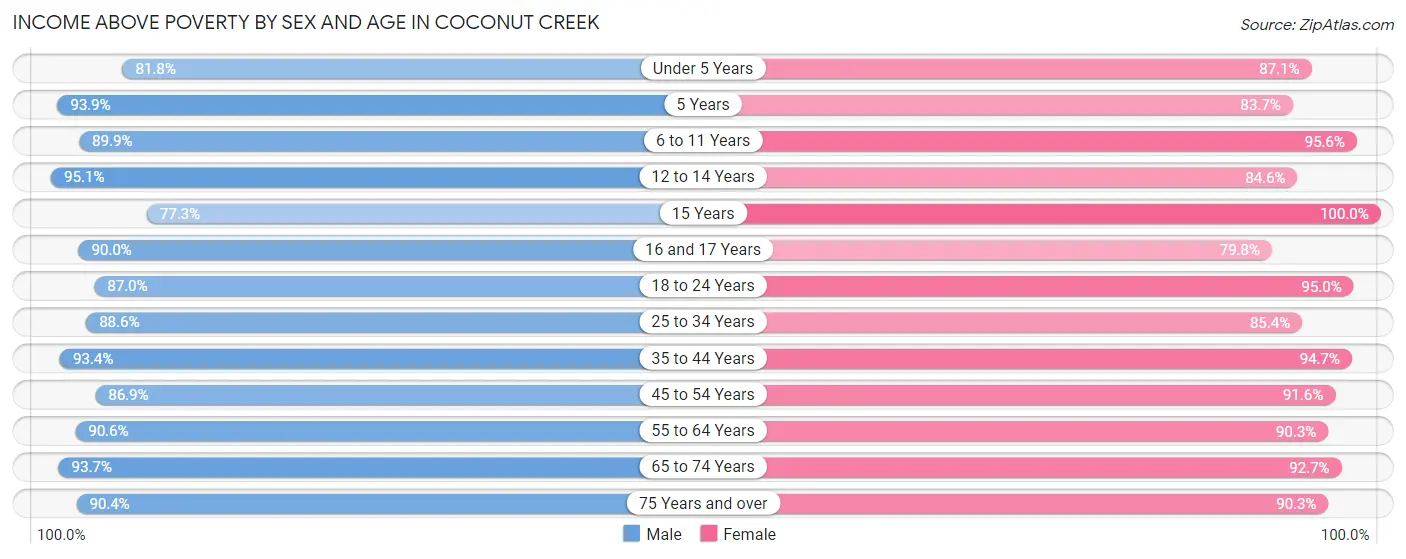
| Age Bracket | Male | Female |
| Under 5 Years | 1,288 (81.8%) | 1,450 (87.1%) |
| 5 Years | 170 (93.9%) | 241 (83.7%) |
| 6 to 11 Years | 1,641 (89.9%) | 1,301 (95.6%) |
| 12 to 14 Years | 1,079 (95.1%) | 789 (84.6%) |
| 15 Years | 429 (77.3%) | 575 (100.0%) |
| 16 and 17 Years | 486 (90.0%) | 751 (79.8%) |
| 18 to 24 Years | 2,095 (87.0%) | 1,461 (95.0%) |
| 25 to 34 Years | 3,264 (88.5%) | 3,332 (85.4%) |
| 35 to 44 Years | 3,524 (93.4%) | 3,712 (94.7%) |
| 45 to 54 Years | 3,229 (86.9%) | 3,772 (91.5%) |
| 55 to 64 Years | 3,118 (90.6%) | 3,850 (90.3%) |
| 65 to 74 Years | 2,148 (93.7%) | 2,909 (92.7%) |
| 75 Years and over | 1,849 (90.4%) | 2,994 (90.3%) |
| Total | 24,320 (89.5%) | 27,137 (90.6%) |
Income Below Poverty Among Married-Couple Families in Coconut Creek
The poverty statistics for married-couple families in Coconut Creek show that 5.6% or 544 of the total 9,736 families live below the poverty line. Families with 3 or 4 children have the highest poverty rate of 14.6%, comprising of 107 families. On the other hand, families with 5 or more children have the lowest poverty rate of 0.0%, which includes 0 families.
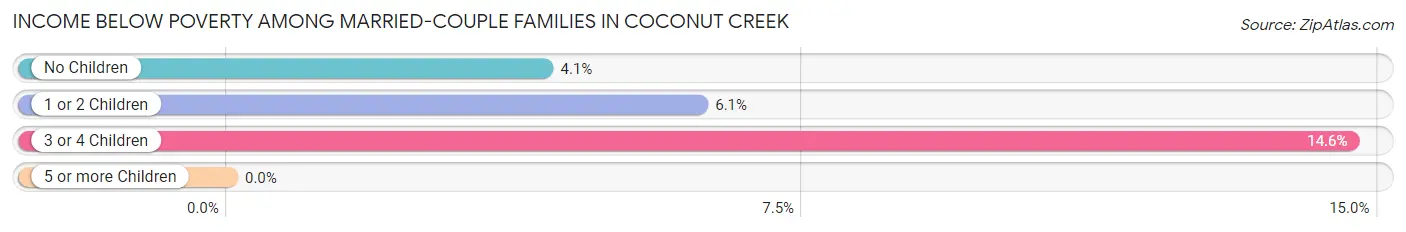
| Children | Above Poverty | Below Poverty |
| No Children | 5,333 (95.9%) | 229 (4.1%) |
| 1 or 2 Children | 3,182 (93.9%) | 208 (6.1%) |
| 3 or 4 Children | 624 (85.4%) | 107 (14.6%) |
| 5 or more Children | 53 (100.0%) | 0 (0.0%) |
| Total | 9,192 (94.4%) | 544 (5.6%) |
Income Below Poverty Among Single-Parent Households in Coconut Creek
According to the poverty data in Coconut Creek, 8.3% or 118 single-father households and 7.3% or 214 single-mother households are living below the poverty line. Among single-father households, those with 1 or 2 children have the highest poverty rate, with 78 households (18.6%) experiencing poverty. Likewise, among single-mother households, those with 3 or 4 children have the highest poverty rate, with 9 households (32.1%) falling below the poverty line.
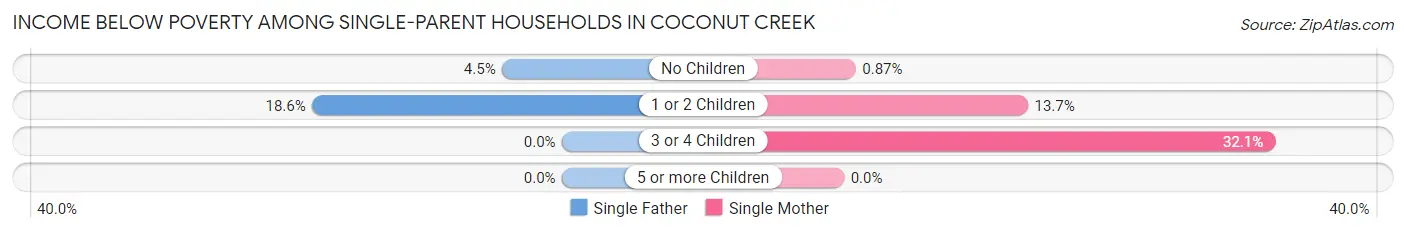
| Children | Single Father | Single Mother |
| No Children | 40 (4.5%) | 13 (0.9%) |
| 1 or 2 Children | 78 (18.6%) | 192 (13.7%) |
| 3 or 4 Children | 0 (0.0%) | 9 (32.1%) |
| 5 or more Children | 0 (0.0%) | 0 (0.0%) |
| Total | 118 (8.3%) | 214 (7.3%) |
Income Below Poverty Among Married-Couple vs Single-Parent Households in Coconut Creek
The poverty data for Coconut Creek shows that 544 of the married-couple family households (5.6%) and 332 of the single-parent households (7.6%) are living below the poverty level. Within the married-couple family households, those with 3 or 4 children have the highest poverty rate, with 107 households (14.6%) falling below the poverty line. Among the single-parent households, those with 1 or 2 children have the highest poverty rate, with 270 household (14.8%) living below poverty.
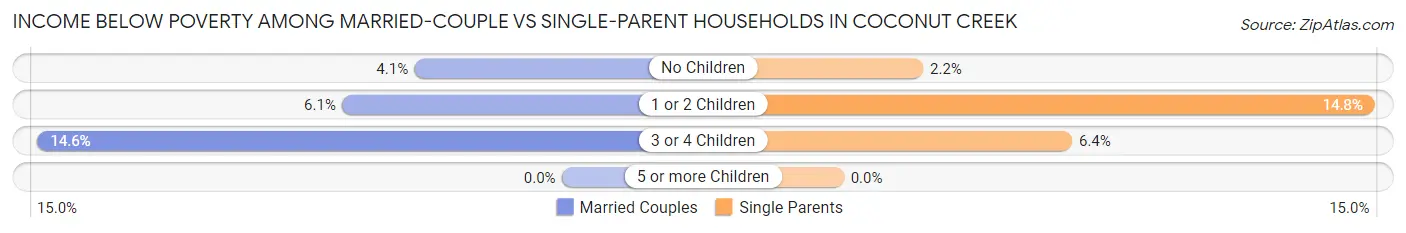
| Children | Married-Couple Families | Single-Parent Households |
| No Children | 229 (4.1%) | 53 (2.2%) |
| 1 or 2 Children | 208 (6.1%) | 270 (14.8%) |
| 3 or 4 Children | 107 (14.6%) | 9 (6.4%) |
| 5 or more Children | 0 (0.0%) | 0 (0.0%) |
| Total | 544 (5.6%) | 332 (7.6%) |
Race in Coconut Creek
The most populous races in Coconut Creek are White / Caucasian (35,105 | 61.0%), Hispanic or Latino (15,362 | 26.7%), and Two or more Races (8,990 | 15.6%).
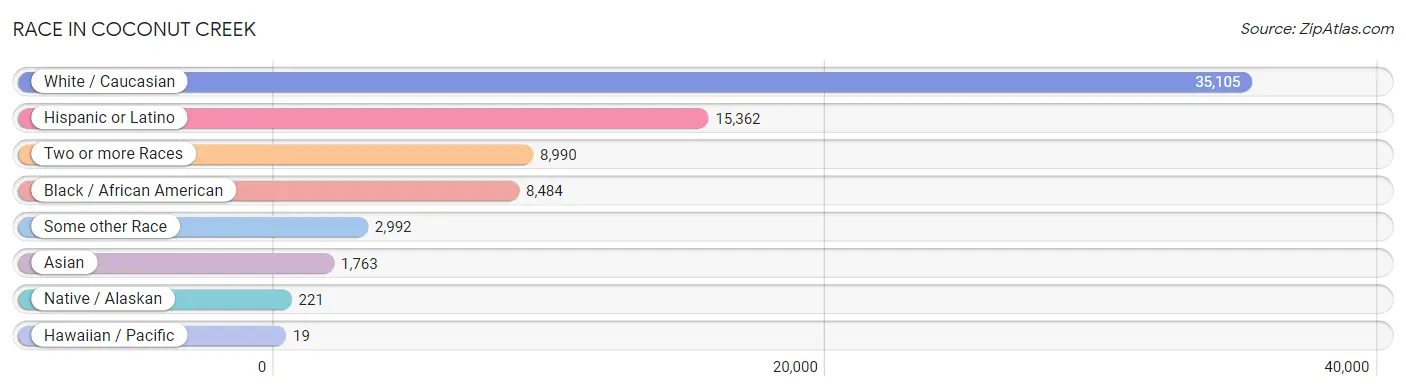
| Race | # Population | % Population |
| Asian | 1,763 | 3.1% |
| Black / African American | 8,484 | 14.7% |
| Hawaiian / Pacific | 19 | 0.0% |
| Hispanic or Latino | 15,362 | 26.7% |
| Native / Alaskan | 221 | 0.4% |
| White / Caucasian | 35,105 | 61.0% |
| Two or more Races | 8,990 | 15.6% |
| Some other Race | 2,992 | 5.2% |
| Total | 57,574 | 100.0% |
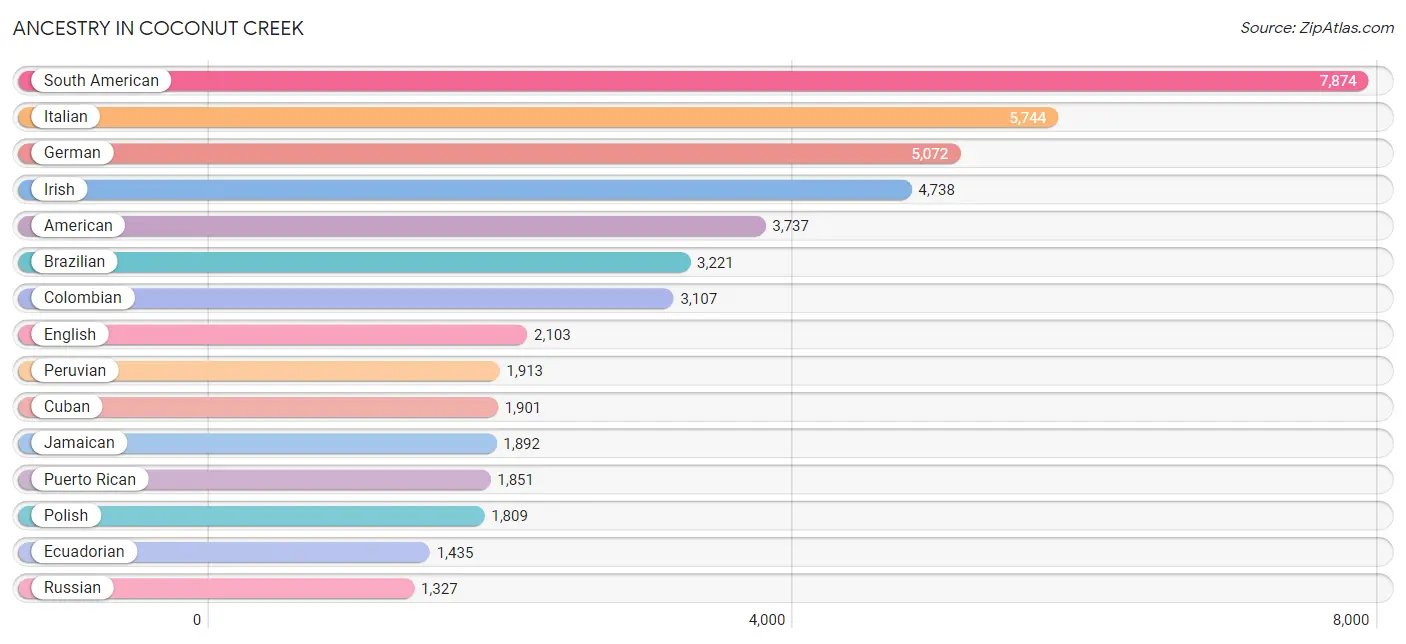
Ancestry in Coconut Creek
The most populous ancestries reported in Coconut Creek are South American (7,874 | 13.7%), Italian (5,744 | 10.0%), German (5,072 | 8.8%), Irish (4,738 | 8.2%), and American (3,737 | 6.5%), together accounting for 47.2% of all Coconut Creek residents.
| Ancestry | # Population | % Population |
| African | 764 | 1.3% |
| American | 3,737 | 6.5% |
| Arab | 504 | 0.9% |
| Argentinean | 391 | 0.7% |
| Armenian | 84 | 0.2% |
| Austrian | 133 | 0.2% |
| Bahamian | 26 | 0.1% |
| Barbadian | 19 | 0.0% |
| Basque | 34 | 0.1% |
| Belgian | 106 | 0.2% |
| Belizean | 38 | 0.1% |
| Bhutanese | 62 | 0.1% |
| Blackfeet | 18 | 0.0% |
| Bolivian | 11 | 0.0% |
| Brazilian | 3,221 | 5.6% |
| British | 161 | 0.3% |
| British West Indian | 46 | 0.1% |
| Bulgarian | 46 | 0.1% |
| Burmese | 246 | 0.4% |
| Cajun | 10 | 0.0% |
| Canadian | 201 | 0.4% |
| Central American | 1,291 | 2.2% |
| Central American Indian | 113 | 0.2% |
| Cherokee | 50 | 0.1% |
| Chilean | 268 | 0.5% |
| Colombian | 3,107 | 5.4% |
| Costa Rican | 115 | 0.2% |
| Croatian | 43 | 0.1% |
| Cuban | 1,901 | 3.3% |
| Czech | 34 | 0.1% |
| Czechoslovakian | 28 | 0.1% |
| Danish | 23 | 0.0% |
| Dominican | 848 | 1.5% |
| Dutch | 397 | 0.7% |
| Eastern European | 293 | 0.5% |
| Ecuadorian | 1,435 | 2.5% |
| English | 2,103 | 3.6% |
| European | 832 | 1.5% |
| French | 788 | 1.4% |
| French Canadian | 319 | 0.5% |
| German | 5,072 | 8.8% |
| Greek | 119 | 0.2% |
| Guatemalan | 147 | 0.3% |
| Guyanese | 167 | 0.3% |
| Haitian | 1,269 | 2.2% |
| Honduran | 110 | 0.2% |
| Hungarian | 313 | 0.5% |
| Indian (Asian) | 409 | 0.7% |
| Irish | 4,738 | 8.2% |
| Iroquois | 11 | 0.0% |
| Israeli | 198 | 0.3% |
| Italian | 5,744 | 10.0% |
| Jamaican | 1,892 | 3.3% |
| Japanese | 12 | 0.0% |
| Korean | 83 | 0.1% |
| Latvian | 90 | 0.2% |
| Lebanese | 224 | 0.4% |
| Lithuanian | 239 | 0.4% |
| Macedonian | 9 | 0.0% |
| Mexican | 1,084 | 1.9% |
| Mexican American Indian | 48 | 0.1% |
| Mongolian | 10 | 0.0% |
| Moroccan | 153 | 0.3% |
| Native Hawaiian | 4 | 0.0% |
| Navajo | 19 | 0.0% |
| Nicaraguan | 409 | 0.7% |
| Nigerian | 78 | 0.1% |
| Northern European | 56 | 0.1% |
| Norwegian | 649 | 1.1% |
| Pakistani | 118 | 0.2% |
| Palestinian | 58 | 0.1% |
| Panamanian | 348 | 0.6% |
| Peruvian | 1,913 | 3.3% |
| Polish | 1,809 | 3.1% |
| Portuguese | 735 | 1.3% |
| Puerto Rican | 1,851 | 3.2% |
| Romanian | 119 | 0.2% |
| Russian | 1,327 | 2.3% |
| Salvadoran | 162 | 0.3% |
| Scandinavian | 27 | 0.1% |
| Scotch-Irish | 288 | 0.5% |
| Scottish | 767 | 1.3% |
| Serbian | 19 | 0.0% |
| Slavic | 12 | 0.0% |
| Slovak | 23 | 0.0% |
| Slovene | 13 | 0.0% |
| South African | 7 | 0.0% |
| South American | 7,874 | 13.7% |
| South American Indian | 742 | 1.3% |
| Spaniard | 56 | 0.1% |
| Spanish | 80 | 0.1% |
| Sri Lankan | 305 | 0.5% |
| Subsaharan African | 874 | 1.5% |
| Swedish | 417 | 0.7% |
| Swiss | 11 | 0.0% |
| Syrian | 50 | 0.1% |
| Thai | 736 | 1.3% |
| Trinidadian and Tobagonian | 404 | 0.7% |
| Turkish | 19 | 0.0% |
| U.S. Virgin Islander | 11 | 0.0% |
| Ukrainian | 262 | 0.5% |
| Uruguayan | 30 | 0.1% |
| Venezuelan | 719 | 1.3% |
| Welsh | 60 | 0.1% |
| West Indian | 107 | 0.2% |
| Yugoslavian | 17 | 0.0% | View All 106 Rows |
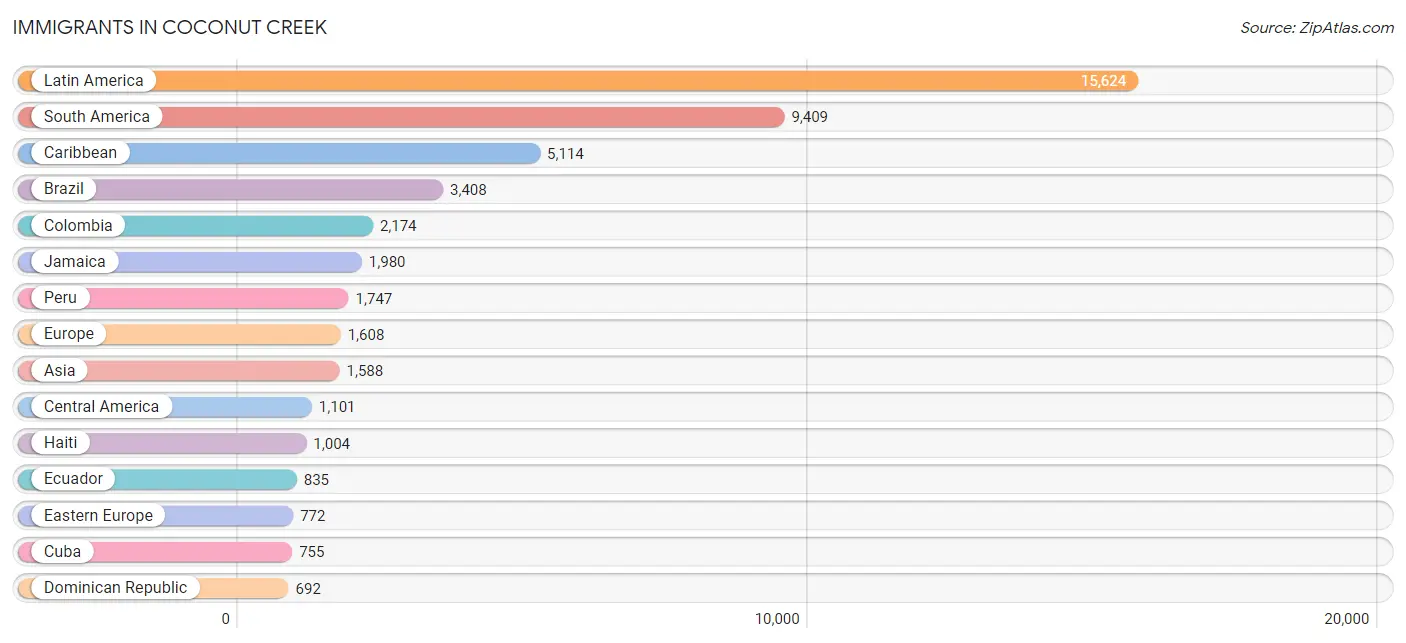
Immigrants in Coconut Creek
The most numerous immigrant groups reported in Coconut Creek came from Latin America (15,624 | 27.1%), South America (9,409 | 16.3%), Caribbean (5,114 | 8.9%), Brazil (3,408 | 5.9%), and Colombia (2,174 | 3.8%), together accounting for 62.1% of all Coconut Creek residents.
| Immigration Origin | # Population | % Population |
| Africa | 234 | 0.4% |
| Argentina | 340 | 0.6% |
| Asia | 1,588 | 2.8% |
| Bahamas | 18 | 0.0% |
| Barbados | 37 | 0.1% |
| Belize | 218 | 0.4% |
| Bolivia | 11 | 0.0% |
| Bosnia and Herzegovina | 35 | 0.1% |
| Brazil | 3,408 | 5.9% |
| Bulgaria | 66 | 0.1% |
| Canada | 352 | 0.6% |
| Caribbean | 5,114 | 8.9% |
| Central America | 1,101 | 1.9% |
| Chile | 118 | 0.2% |
| China | 168 | 0.3% |
| Colombia | 2,174 | 3.8% |
| Costa Rica | 74 | 0.1% |
| Cuba | 755 | 1.3% |
| Czechoslovakia | 19 | 0.0% |
| Denmark | 10 | 0.0% |
| Dominican Republic | 692 | 1.2% |
| Eastern Africa | 46 | 0.1% |
| Eastern Asia | 276 | 0.5% |
| Eastern Europe | 772 | 1.3% |
| Ecuador | 835 | 1.5% |
| El Salvador | 90 | 0.2% |
| England | 46 | 0.1% |
| Ethiopia | 15 | 0.0% |
| Europe | 1,608 | 2.8% |
| France | 88 | 0.2% |
| Germany | 47 | 0.1% |
| Greece | 48 | 0.1% |
| Guatemala | 109 | 0.2% |
| Guyana | 172 | 0.3% |
| Haiti | 1,004 | 1.7% |
| Honduras | 28 | 0.1% |
| Hong Kong | 23 | 0.0% |
| Hungary | 11 | 0.0% |
| India | 419 | 0.7% |
| Indonesia | 11 | 0.0% |
| Iran | 41 | 0.1% |
| Iraq | 54 | 0.1% |
| Ireland | 6 | 0.0% |
| Israel | 133 | 0.2% |
| Italy | 261 | 0.4% |
| Jamaica | 1,980 | 3.4% |
| Korea | 108 | 0.2% |
| Kuwait | 67 | 0.1% |
| Latin America | 15,624 | 27.1% |
| Lebanon | 69 | 0.1% |
| Lithuania | 63 | 0.1% |
| Malaysia | 10 | 0.0% |
| Mexico | 277 | 0.5% |
| Nepal | 48 | 0.1% |
| Netherlands | 19 | 0.0% |
| Nicaragua | 102 | 0.2% |
| Nigeria | 58 | 0.1% |
| North Macedonia | 14 | 0.0% |
| Northern Africa | 43 | 0.1% |
| Northern Europe | 240 | 0.4% |
| Oceania | 17 | 0.0% |
| Panama | 203 | 0.4% |
| Peru | 1,747 | 3.0% |
| Philippines | 50 | 0.1% |
| Poland | 148 | 0.3% |
| Portugal | 60 | 0.1% |
| Romania | 8 | 0.0% |
| Russia | 246 | 0.4% |
| Scotland | 63 | 0.1% |
| Senegal | 32 | 0.1% |
| South Africa | 4 | 0.0% |
| South America | 9,409 | 16.3% |
| South Central Asia | 529 | 0.9% |
| South Eastern Asia | 357 | 0.6% |
| Southern Europe | 412 | 0.7% |
| Spain | 43 | 0.1% |
| Sri Lanka | 9 | 0.0% |
| Switzerland | 30 | 0.1% |
| Syria | 25 | 0.0% |
| Thailand | 73 | 0.1% |
| Trinidad and Tobago | 500 | 0.9% |
| Turkey | 19 | 0.0% |
| Ukraine | 143 | 0.3% |
| Uruguay | 30 | 0.1% |
| Uzbekistan | 12 | 0.0% |
| Venezuela | 574 | 1.0% |
| Vietnam | 213 | 0.4% |
| Western Africa | 90 | 0.2% |
| Western Asia | 367 | 0.6% |
| Western Europe | 184 | 0.3% | View All 90 Rows |
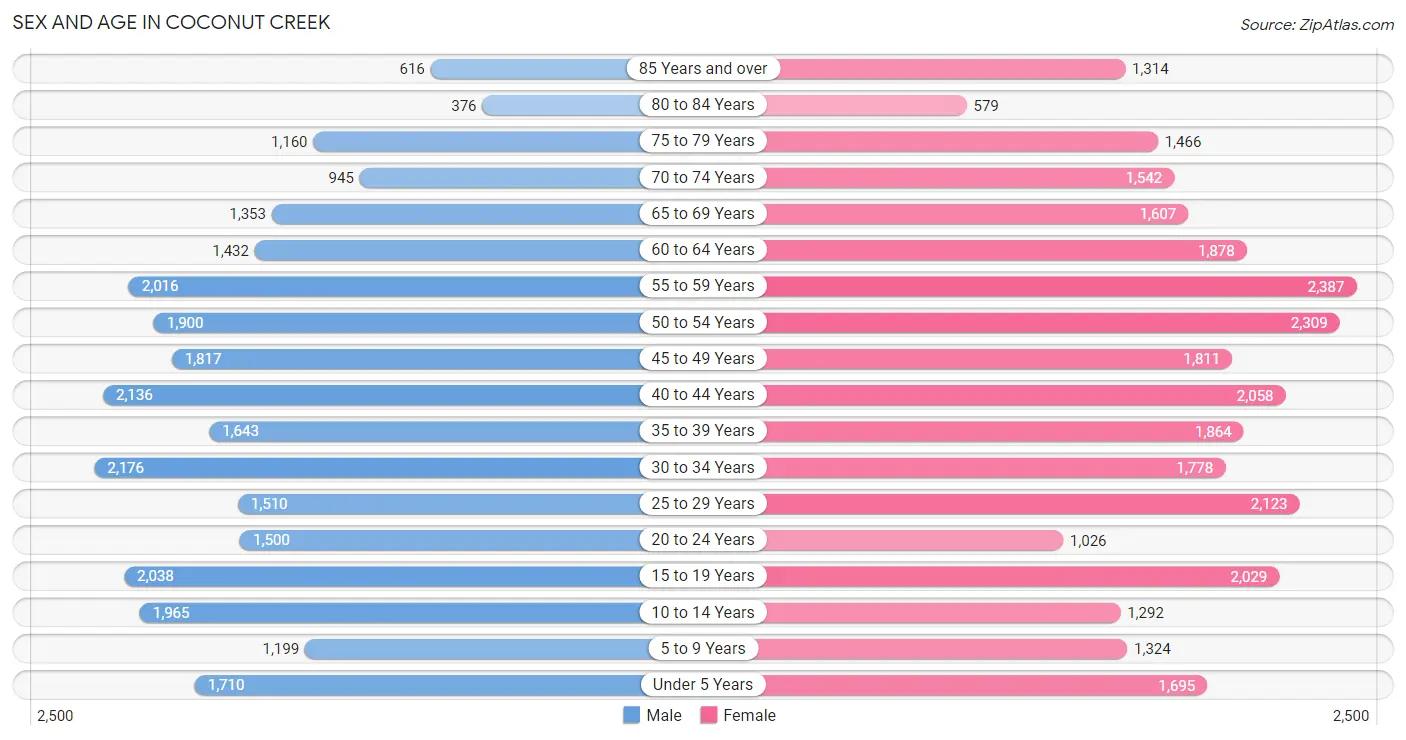
Sex and Age in Coconut Creek
Sex and Age in Coconut Creek
The most populous age groups in Coconut Creek are 30 to 34 Years (2,176 | 7.9%) for men and 55 to 59 Years (2,387 | 7.9%) for women.
| Age Bracket | Male | Female |
| Under 5 Years | 1,710 (6.2%) | 1,695 (5.6%) |
| 5 to 9 Years | 1,199 (4.4%) | 1,324 (4.4%) |
| 10 to 14 Years | 1,965 (7.1%) | 1,292 (4.3%) |
| 15 to 19 Years | 2,038 (7.4%) | 2,029 (6.7%) |
| 20 to 24 Years | 1,500 (5.5%) | 1,026 (3.4%) |
| 25 to 29 Years | 1,510 (5.5%) | 2,123 (7.1%) |
| 30 to 34 Years | 2,176 (7.9%) | 1,778 (5.9%) |
| 35 to 39 Years | 1,643 (6.0%) | 1,864 (6.2%) |
| 40 to 44 Years | 2,136 (7.8%) | 2,058 (6.8%) |
| 45 to 49 Years | 1,817 (6.6%) | 1,811 (6.0%) |
| 50 to 54 Years | 1,900 (6.9%) | 2,309 (7.7%) |
| 55 to 59 Years | 2,016 (7.3%) | 2,387 (7.9%) |
| 60 to 64 Years | 1,432 (5.2%) | 1,878 (6.2%) |
| 65 to 69 Years | 1,353 (4.9%) | 1,607 (5.3%) |
| 70 to 74 Years | 945 (3.4%) | 1,542 (5.1%) |
| 75 to 79 Years | 1,160 (4.2%) | 1,466 (4.9%) |
| 80 to 84 Years | 376 (1.4%) | 579 (1.9%) |
| 85 Years and over | 616 (2.2%) | 1,314 (4.4%) |
| Total | 27,492 (100.0%) | 30,082 (100.0%) |
Families and Households in Coconut Creek
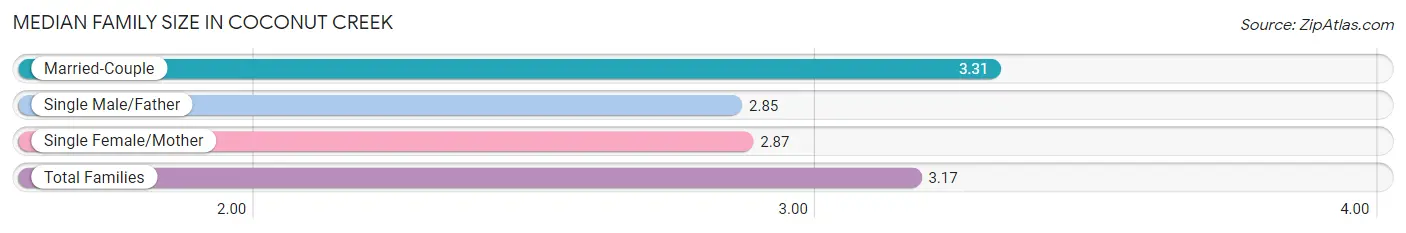
Median Family Size in Coconut Creek
The median family size in Coconut Creek is 3.17 persons per family, with married-couple families (9,736 | 69.1%) accounting for the largest median family size of 3.31 persons per family. On the other hand, single male/father families (1,427 | 10.1%) represent the smallest median family size with 2.85 persons per family.
| Family Type | # Families | Family Size |
| Married-Couple | 9,736 (69.1%) | 3.31 |
| Single Male/Father | 1,427 (10.1%) | 2.85 |
| Single Female/Mother | 2,921 (20.7%) | 2.87 |
| Total Families | 14,084 (100.0%) | 3.17 |
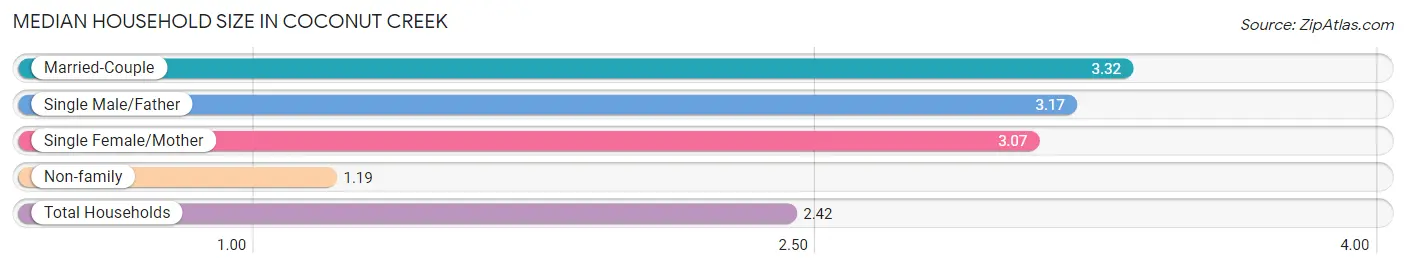
Median Household Size in Coconut Creek
The median household size in Coconut Creek is 2.42 persons per household, with married-couple households (9,736 | 41.1%) accounting for the largest median household size of 3.32 persons per household. non-family households (9,612 | 40.6%) represent the smallest median household size with 1.19 persons per household.
| Household Type | # Households | Household Size |
| Married-Couple | 9,736 (41.1%) | 3.32 |
| Single Male/Father | 1,427 (6.0%) | 3.17 |
| Single Female/Mother | 2,921 (12.3%) | 3.07 |
| Non-family | 9,612 (40.6%) | 1.19 |
| Total Households | 23,696 (100.0%) | 2.42 |
Household Size by Marriage Status in Coconut Creek
Out of a total of 23,696 households in Coconut Creek, 14,084 (59.4%) are family households, while 9,612 (40.6%) are nonfamily households. The most numerous type of family households are 2-person households, comprising 6,413, and the most common type of nonfamily households are 1-person households, comprising 8,017.
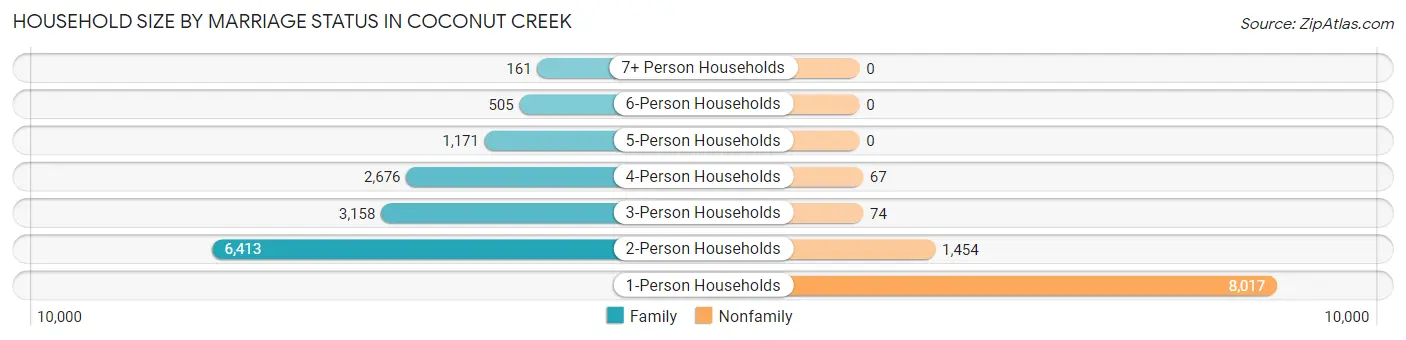
| Household Size | Family Households | Nonfamily Households |
| 1-Person Households | - | 8,017 (33.8%) |
| 2-Person Households | 6,413 (27.1%) | 1,454 (6.1%) |
| 3-Person Households | 3,158 (13.3%) | 74 (0.3%) |
| 4-Person Households | 2,676 (11.3%) | 67 (0.3%) |
| 5-Person Households | 1,171 (4.9%) | 0 (0.0%) |
| 6-Person Households | 505 (2.1%) | 0 (0.0%) |
| 7+ Person Households | 161 (0.7%) | 0 (0.0%) |
| Total | 14,084 (59.4%) | 9,612 (40.6%) |
Female Fertility in Coconut Creek
Fertility by Age in Coconut Creek
Average fertility rate in Coconut Creek is 41.0 births per 1,000 women. Women in the age bracket of 20 to 34 years have the highest fertility rate with 74.0 births per 1,000 women. Women in the age bracket of 20 to 34 years acount for 66.4% of all women with births.
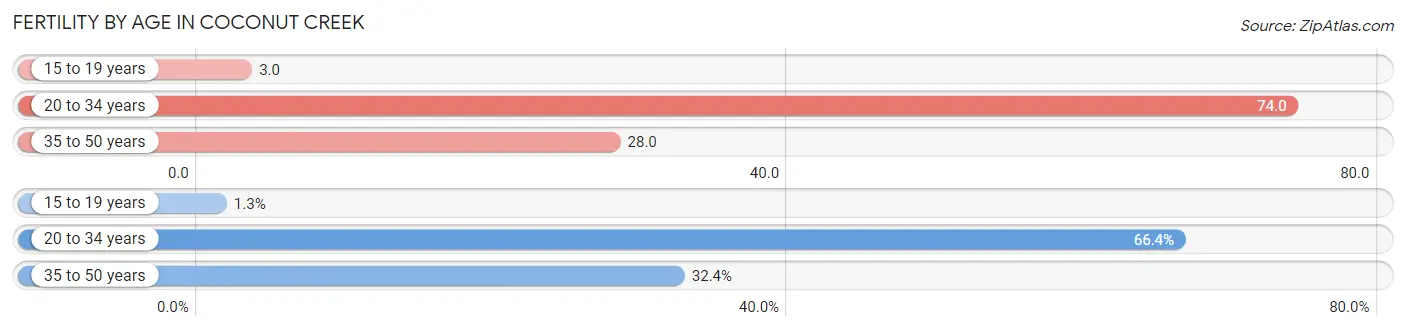
| Age Bracket | Women with Births | Births / 1,000 Women |
| 15 to 19 years | 7 (1.3%) | 3.0 |
| 20 to 34 years | 363 (66.4%) | 74.0 |
| 35 to 50 years | 177 (32.4%) | 28.0 |
| Total | 547 (100.0%) | 41.0 |
Fertility by Age by Marriage Status in Coconut Creek
68.6% of women with births (547) in Coconut Creek are married. The highest percentage of unmarried women with births falls into 15 to 19 years age bracket with 100.0% of them unmarried at the time of birth, while the lowest percentage of unmarried women with births belong to 35 to 50 years age bracket with 0.0% of them unmarried.
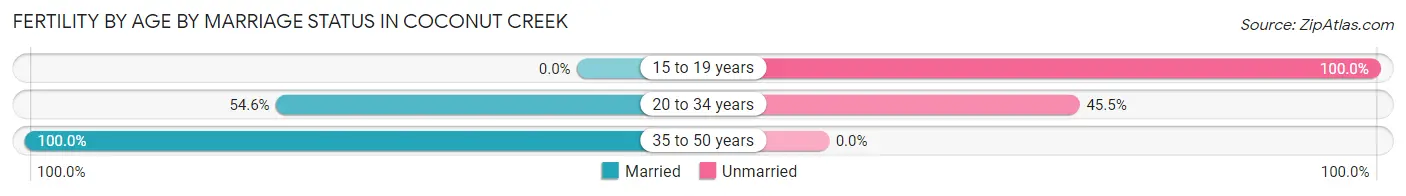
| Age Bracket | Married | Unmarried |
| 15 to 19 years | 0 (0.0%) | 7 (100.0%) |
| 20 to 34 years | 198 (54.5%) | 165 (45.5%) |
| 35 to 50 years | 177 (100.0%) | 0 (0.0%) |
| Total | 375 (68.6%) | 172 (31.4%) |
Fertility by Education in Coconut Creek
Average fertility rate in Coconut Creek is 41.0 births per 1,000 women. Women with the education attainment of college or associate's degree have the highest fertility rate of 77.0 births per 1,000 women, while women with the education attainment of less than high school have the lowest fertility at 8.0 births per 1,000 women. Women with the education attainment of college or associate's degree represent 48.8% of all women with births.
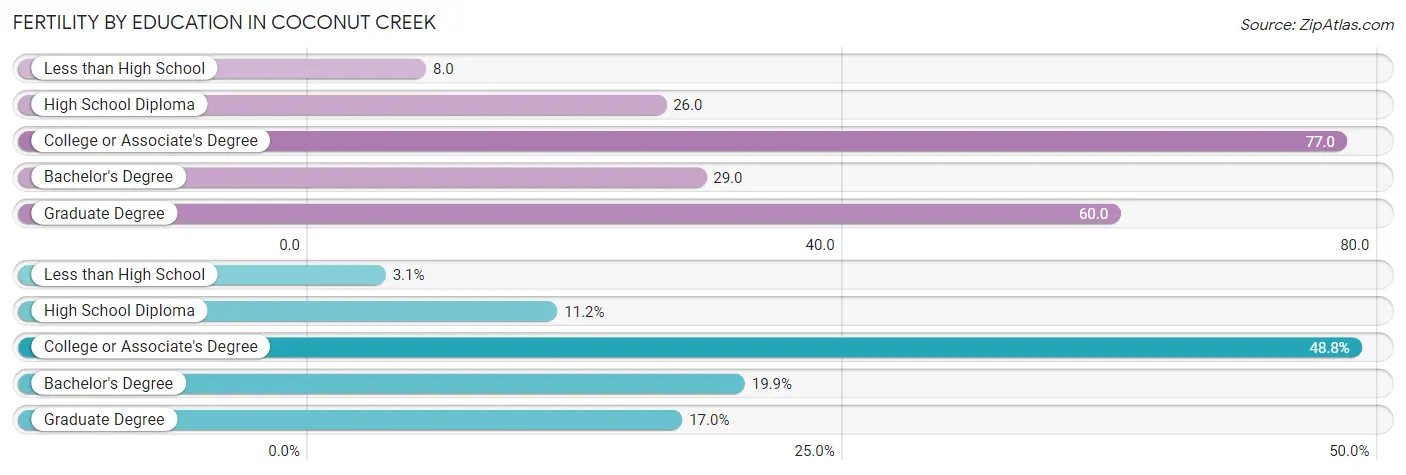
| Educational Attainment | Women with Births | Births / 1,000 Women |
| Less than High School | 17 (3.1%) | 8.0 |
| High School Diploma | 61 (11.2%) | 26.0 |
| College or Associate's Degree | 267 (48.8%) | 77.0 |
| Bachelor's Degree | 109 (19.9%) | 29.0 |
| Graduate Degree | 93 (17.0%) | 60.0 |
| Total | 547 (100.0%) | 41.0 |
Fertility by Education by Marriage Status in Coconut Creek
31.4% of women with births in Coconut Creek are unmarried. Women with the educational attainment of high school diploma are most likely to be married with 100.0% of them married at childbirth, while women with the educational attainment of bachelor's degree are least likely to be married with 51.4% of them unmarried at childbirth.
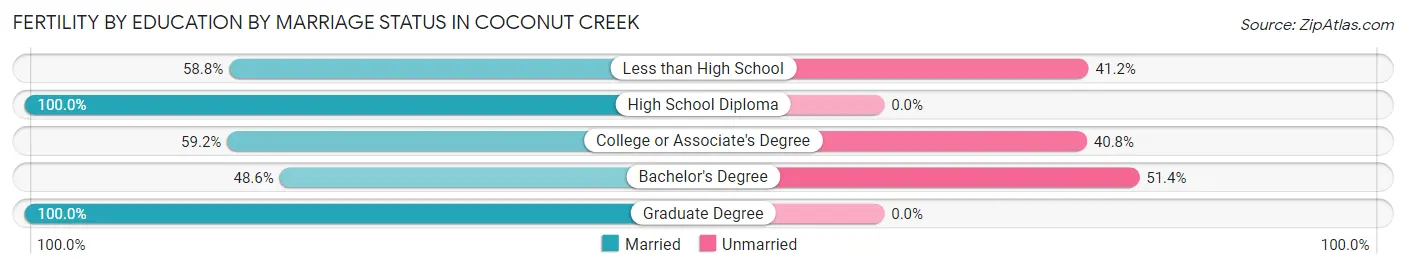
| Educational Attainment | Married | Unmarried |
| Less than High School | 10 (58.8%) | 7 (41.2%) |
| High School Diploma | 61 (100.0%) | 0 (0.0%) |
| College or Associate's Degree | 158 (59.2%) | 109 (40.8%) |
| Bachelor's Degree | 53 (48.6%) | 56 (51.4%) |
| Graduate Degree | 93 (100.0%) | 0 (0.0%) |
| Total | 375 (68.6%) | 172 (31.4%) |
Employment Characteristics in Coconut Creek
Employment by Class of Employer in Coconut Creek
Among the 29,430 employed individuals in Coconut Creek, private company employees (20,391 | 69.3%), self-employed (not incorporated) (2,181 | 7.4%), and not-for-profit organizations (2,166 | 7.4%) make up the most common classes of employment.
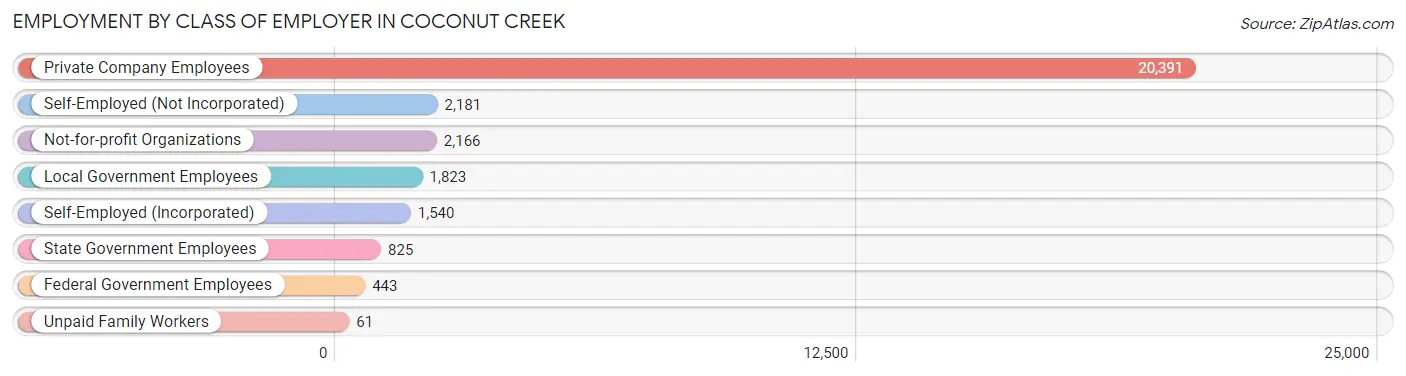
| Employer Class | # Employees | % Employees |
| Private Company Employees | 20,391 | 69.3% |
| Self-Employed (Incorporated) | 1,540 | 5.2% |
| Self-Employed (Not Incorporated) | 2,181 | 7.4% |
| Not-for-profit Organizations | 2,166 | 7.4% |
| Local Government Employees | 1,823 | 6.2% |
| State Government Employees | 825 | 2.8% |
| Federal Government Employees | 443 | 1.5% |
| Unpaid Family Workers | 61 | 0.2% |
| Total | 29,430 | 100.0% |
Employment Status by Age in Coconut Creek
According to the labor force statistics for Coconut Creek, out of the total population over 16 years of age (47,248), 66.7% or 31,514 individuals are in the labor force, with 4.8% or 1,513 of them unemployed. The age group with the highest labor force participation rate is 35 to 44 years, with 90.1% or 6,939 individuals in the labor force. Within the labor force, the 16 to 19 years age range has the highest percentage of unemployed individuals, with 11.2% or 106 of them being unemployed.
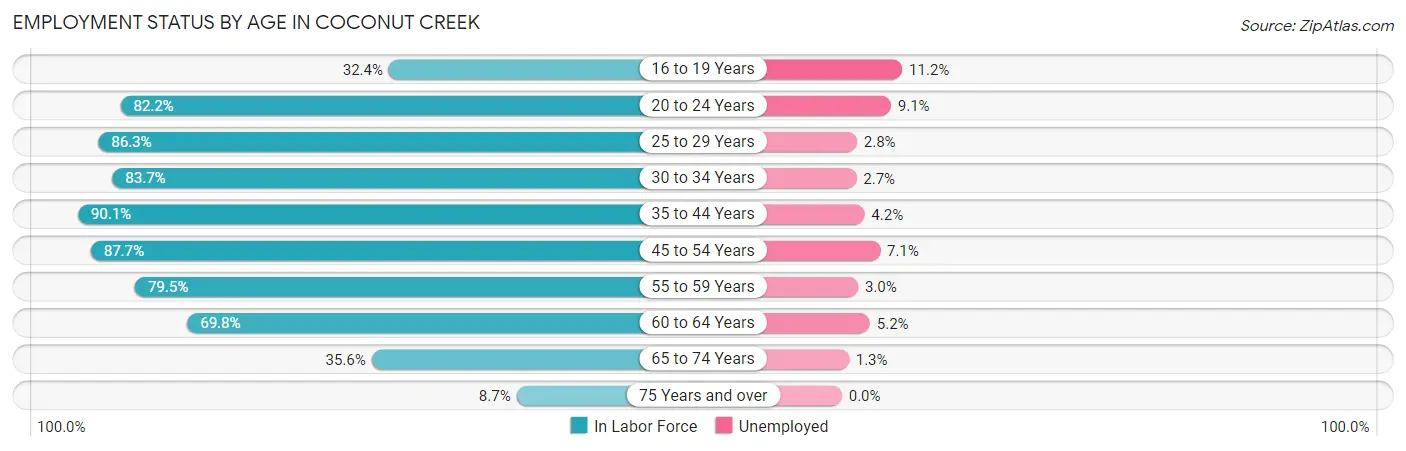
| Age Bracket | In Labor Force | Unemployed |
| 16 to 19 Years | 948 (32.4%) | 106 (11.2%) |
| 20 to 24 Years | 2,076 (82.2%) | 189 (9.1%) |
| 25 to 29 Years | 3,135 (86.3%) | 88 (2.8%) |
| 30 to 34 Years | 3,309 (83.7%) | 89 (2.7%) |
| 35 to 44 Years | 6,939 (90.1%) | 291 (4.2%) |
| 45 to 54 Years | 6,873 (87.7%) | 488 (7.1%) |
| 55 to 59 Years | 3,500 (79.5%) | 105 (3.0%) |
| 60 to 64 Years | 2,310 (69.8%) | 120 (5.2%) |
| 65 to 74 Years | 1,939 (35.6%) | 25 (1.3%) |
| 75 Years and over | 479 (8.7%) | 0 (0.0%) |
| Total | 31,514 (66.7%) | 1,513 (4.8%) |
Employment Status by Educational Attainment in Coconut Creek
According to labor force statistics for Coconut Creek, 84.5% of individuals (26,058) out of the total population between 25 and 64 years of age (30,838) are in the labor force, with 4.5% or 1,173 of them being unemployed. The group with the highest labor force participation rate are those with the educational attainment of bachelor's degree or higher, with 89.0% or 10,367 individuals in the labor force. Within the labor force, individuals with high school diploma education have the highest percentage of unemployment, with 8.1% or 490 of them being unemployed.
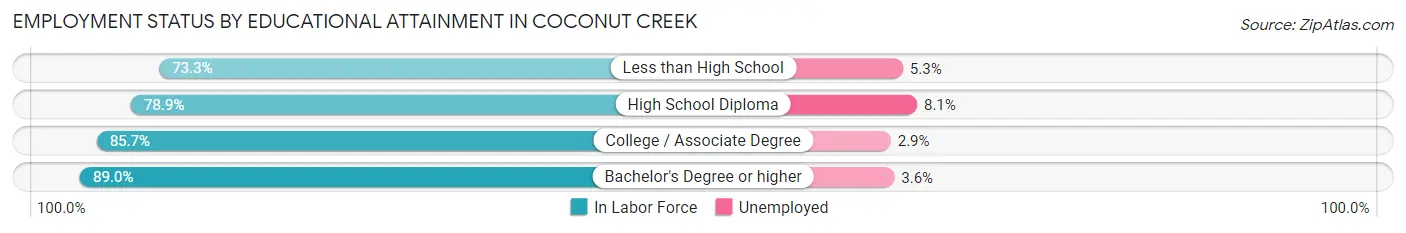
| Educational Attainment | In Labor Force | Unemployed |
| Less than High School | 1,342 (73.3%) | 97 (5.3%) |
| High School Diploma | 6,044 (78.9%) | 620 (8.1%) |
| College / Associate Degree | 8,312 (85.7%) | 281 (2.9%) |
| Bachelor's Degree or higher | 10,367 (89.0%) | 419 (3.6%) |
| Total | 26,058 (84.5%) | 1,388 (4.5%) |
Employment Occupations by Sex in Coconut Creek
Management, Business, Science and Arts Occupations
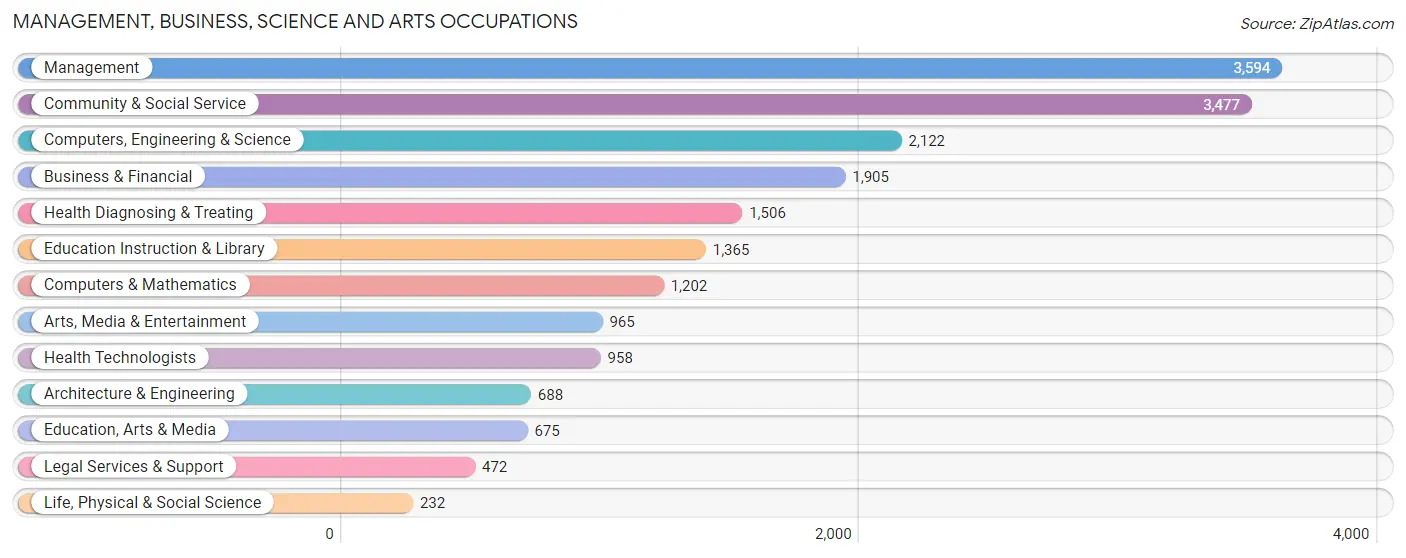
The most common Management, Business, Science and Arts occupations in Coconut Creek are Management (3,594 | 12.0%), Community & Social Service (3,477 | 11.6%), Computers, Engineering & Science (2,122 | 7.1%), Business & Financial (1,905 | 6.4%), and Health Diagnosing & Treating (1,506 | 5.0%).
Management, Business, Science and Arts Occupations by Sex
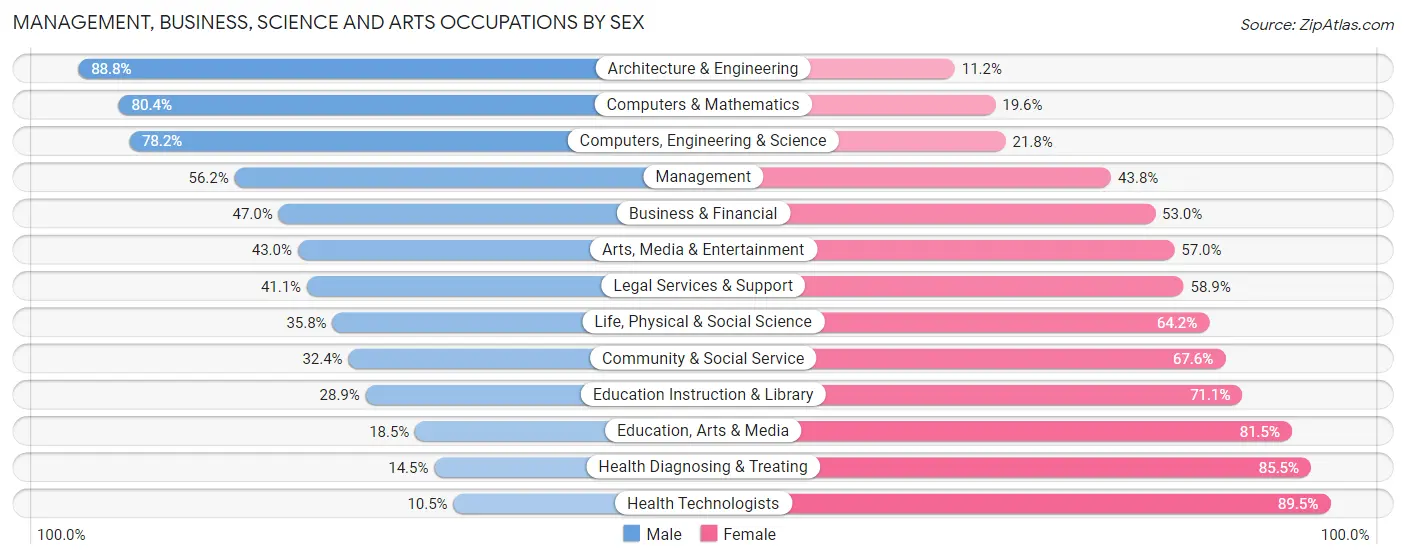
Within the Management, Business, Science and Arts occupations in Coconut Creek, the most male-oriented occupations are Architecture & Engineering (88.8%), Computers & Mathematics (80.4%), and Computers, Engineering & Science (78.2%), while the most female-oriented occupations are Health Technologists (89.5%), Health Diagnosing & Treating (85.5%), and Education, Arts & Media (81.5%).
| Occupation | Male | Female |
| Management | 2,020 (56.2%) | 1,574 (43.8%) |
| Business & Financial | 896 (47.0%) | 1,009 (53.0%) |
| Computers, Engineering & Science | 1,660 (78.2%) | 462 (21.8%) |
| Computers & Mathematics | 966 (80.4%) | 236 (19.6%) |
| Architecture & Engineering | 611 (88.8%) | 77 (11.2%) |
| Life, Physical & Social Science | 83 (35.8%) | 149 (64.2%) |
| Community & Social Service | 1,128 (32.4%) | 2,349 (67.6%) |
| Education, Arts & Media | 125 (18.5%) | 550 (81.5%) |
| Legal Services & Support | 194 (41.1%) | 278 (58.9%) |
| Education Instruction & Library | 394 (28.9%) | 971 (71.1%) |
| Arts, Media & Entertainment | 415 (43.0%) | 550 (57.0%) |
| Health Diagnosing & Treating | 219 (14.5%) | 1,287 (85.5%) |
| Health Technologists | 101 (10.5%) | 857 (89.5%) |
| Total (Category) | 5,923 (47.0%) | 6,681 (53.0%) |
| Total (Overall) | 14,643 (48.8%) | 15,369 (51.2%) |
Services Occupations
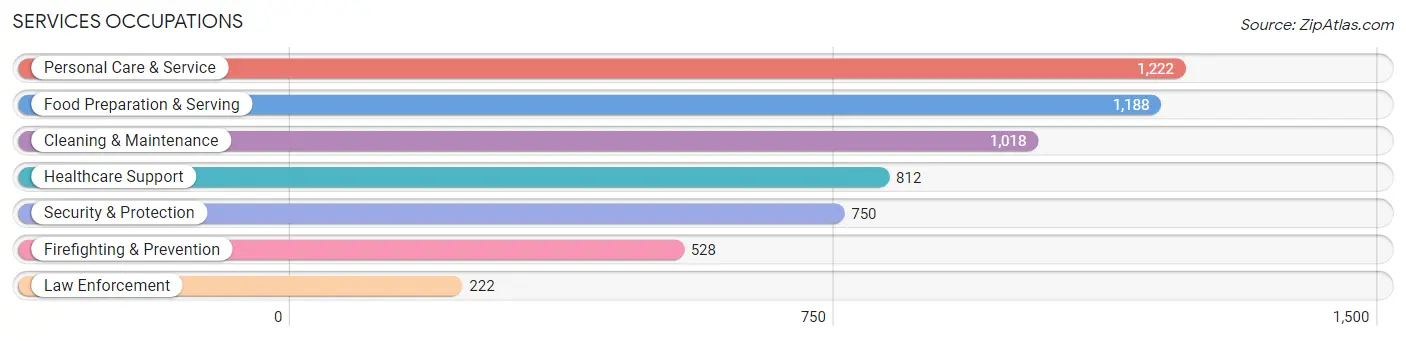
The most common Services occupations in Coconut Creek are Personal Care & Service (1,222 | 4.1%), Food Preparation & Serving (1,188 | 4.0%), Cleaning & Maintenance (1,018 | 3.4%), Healthcare Support (812 | 2.7%), and Security & Protection (750 | 2.5%).
Services Occupations by Sex
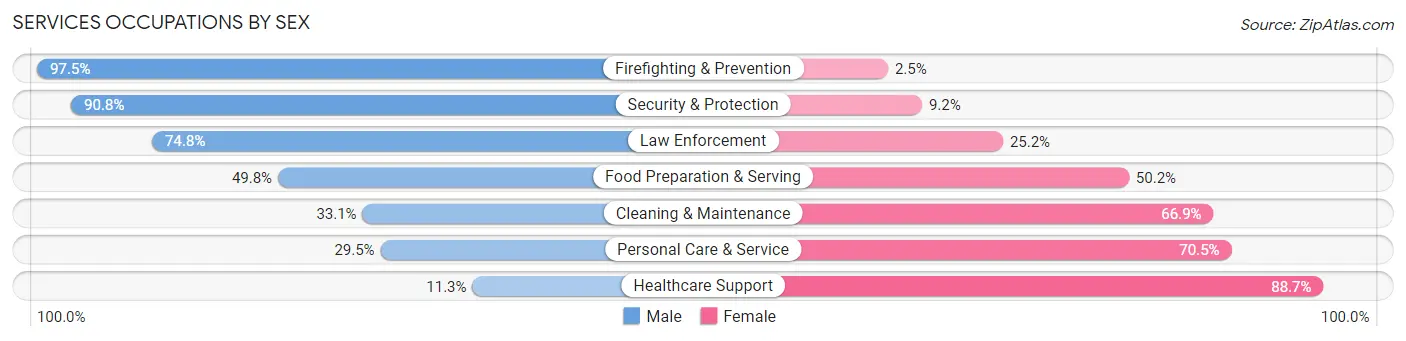
Within the Services occupations in Coconut Creek, the most male-oriented occupations are Firefighting & Prevention (97.5%), Security & Protection (90.8%), and Law Enforcement (74.8%), while the most female-oriented occupations are Healthcare Support (88.7%), Personal Care & Service (70.5%), and Cleaning & Maintenance (66.9%).
| Occupation | Male | Female |
| Healthcare Support | 92 (11.3%) | 720 (88.7%) |
| Security & Protection | 681 (90.8%) | 69 (9.2%) |
| Firefighting & Prevention | 515 (97.5%) | 13 (2.5%) |
| Law Enforcement | 166 (74.8%) | 56 (25.2%) |
| Food Preparation & Serving | 592 (49.8%) | 596 (50.2%) |
| Cleaning & Maintenance | 337 (33.1%) | 681 (66.9%) |
| Personal Care & Service | 361 (29.5%) | 861 (70.5%) |
| Total (Category) | 2,063 (41.3%) | 2,927 (58.7%) |
| Total (Overall) | 14,643 (48.8%) | 15,369 (51.2%) |
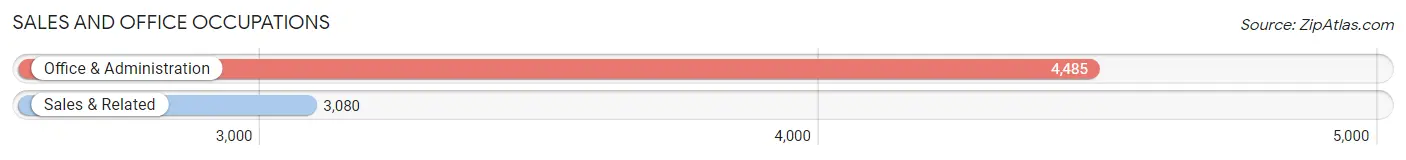
Sales and Office Occupations
The most common Sales and Office occupations in Coconut Creek are Office & Administration (4,485 | 14.9%), and Sales & Related (3,080 | 10.3%).
Sales and Office Occupations by Sex
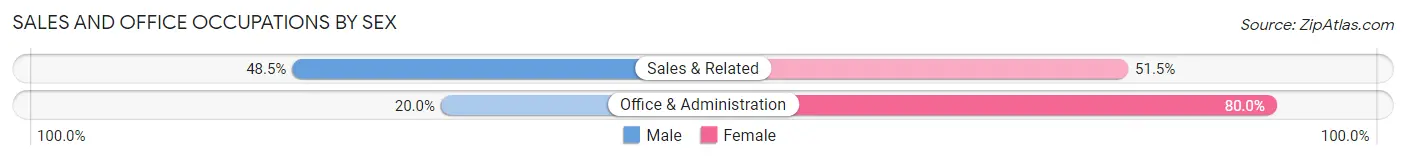
| Occupation | Male | Female |
| Sales & Related | 1,495 (48.5%) | 1,585 (51.5%) |
| Office & Administration | 895 (20.0%) | 3,590 (80.0%) |
| Total (Category) | 2,390 (31.6%) | 5,175 (68.4%) |
| Total (Overall) | 14,643 (48.8%) | 15,369 (51.2%) |
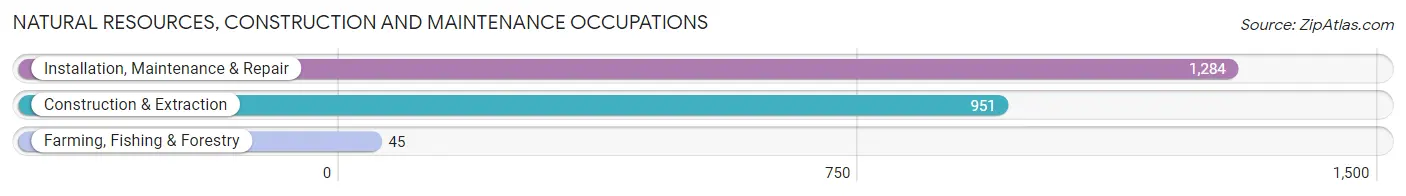
Natural Resources, Construction and Maintenance Occupations
The most common Natural Resources, Construction and Maintenance occupations in Coconut Creek are Installation, Maintenance & Repair (1,284 | 4.3%), Construction & Extraction (951 | 3.2%), and Farming, Fishing & Forestry (45 | 0.2%).
Natural Resources, Construction and Maintenance Occupations by Sex
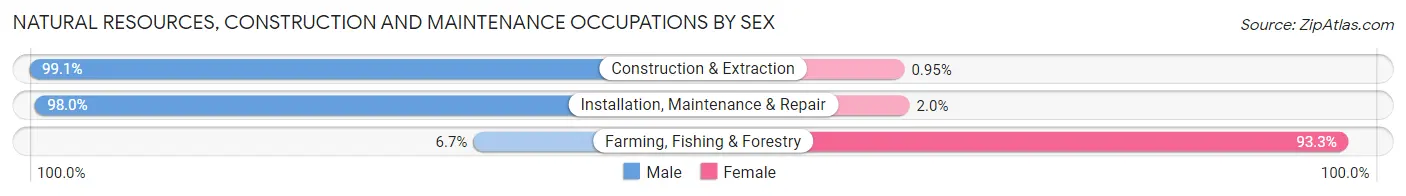
| Occupation | Male | Female |
| Farming, Fishing & Forestry | 3 (6.7%) | 42 (93.3%) |
| Construction & Extraction | 942 (99.1%) | 9 (0.9%) |
| Installation, Maintenance & Repair | 1,258 (98.0%) | 26 (2.0%) |
| Total (Category) | 2,203 (96.6%) | 77 (3.4%) |
| Total (Overall) | 14,643 (48.8%) | 15,369 (51.2%) |
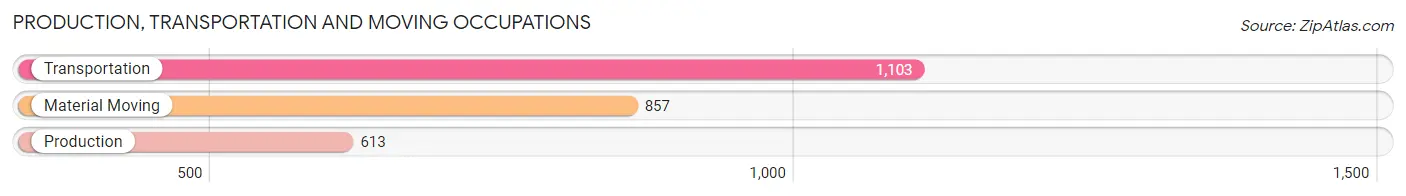
Production, Transportation and Moving Occupations
The most common Production, Transportation and Moving occupations in Coconut Creek are Transportation (1,103 | 3.7%), Material Moving (857 | 2.9%), and Production (613 | 2.0%).
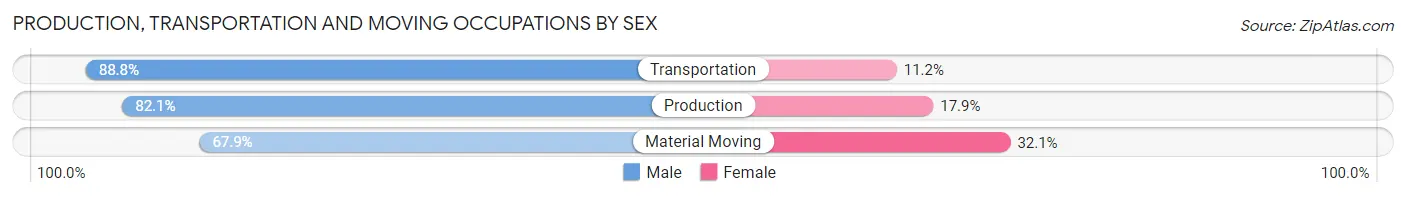
Production, Transportation and Moving Occupations by Sex
| Occupation | Male | Female |
| Production | 503 (82.1%) | 110 (17.9%) |
| Transportation | 979 (88.8%) | 124 (11.2%) |
| Material Moving | 582 (67.9%) | 275 (32.1%) |
| Total (Category) | 2,064 (80.2%) | 509 (19.8%) |
| Total (Overall) | 14,643 (48.8%) | 15,369 (51.2%) |
Employment Industries by Sex in Coconut Creek
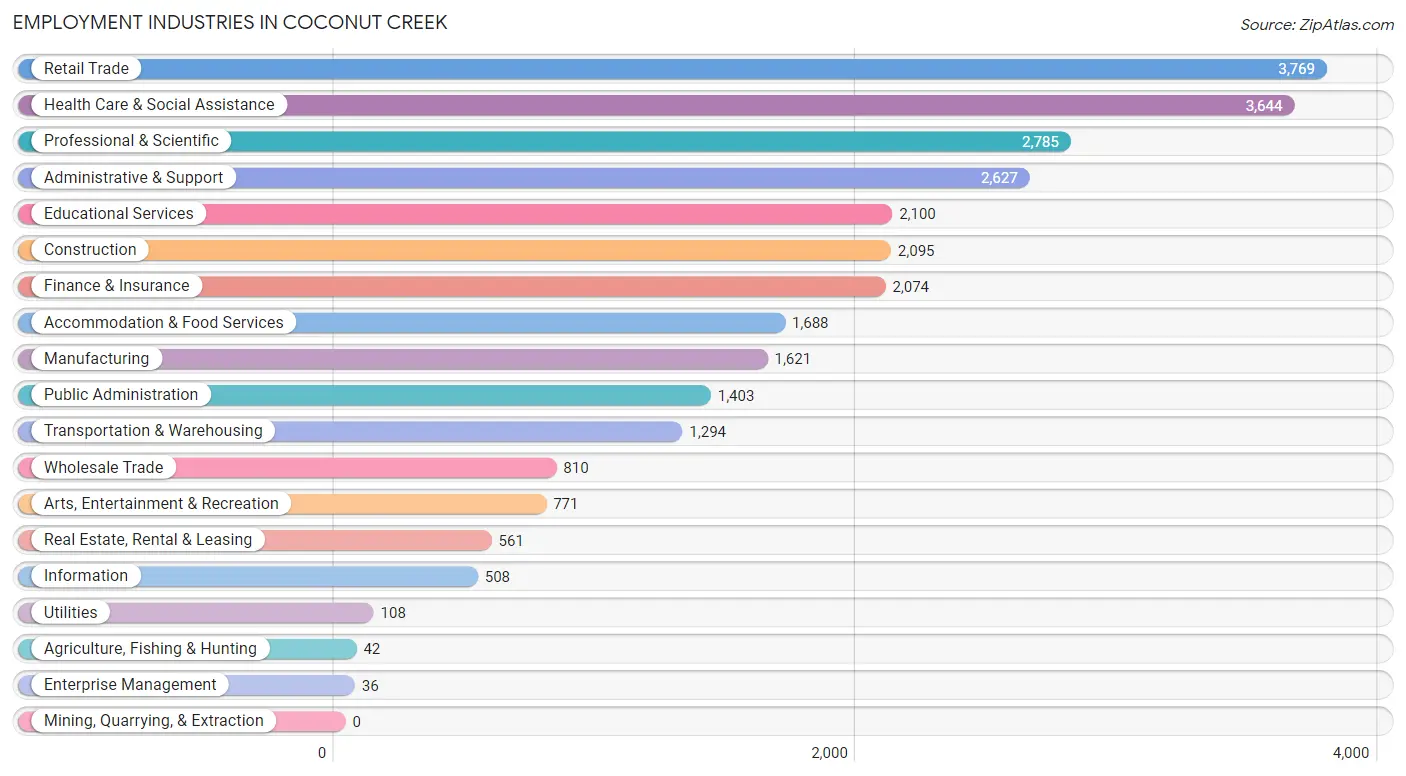
Employment Industries in Coconut Creek
The major employment industries in Coconut Creek include Retail Trade (3,769 | 12.6%), Health Care & Social Assistance (3,644 | 12.1%), Professional & Scientific (2,785 | 9.3%), Administrative & Support (2,627 | 8.7%), and Educational Services (2,100 | 7.0%).
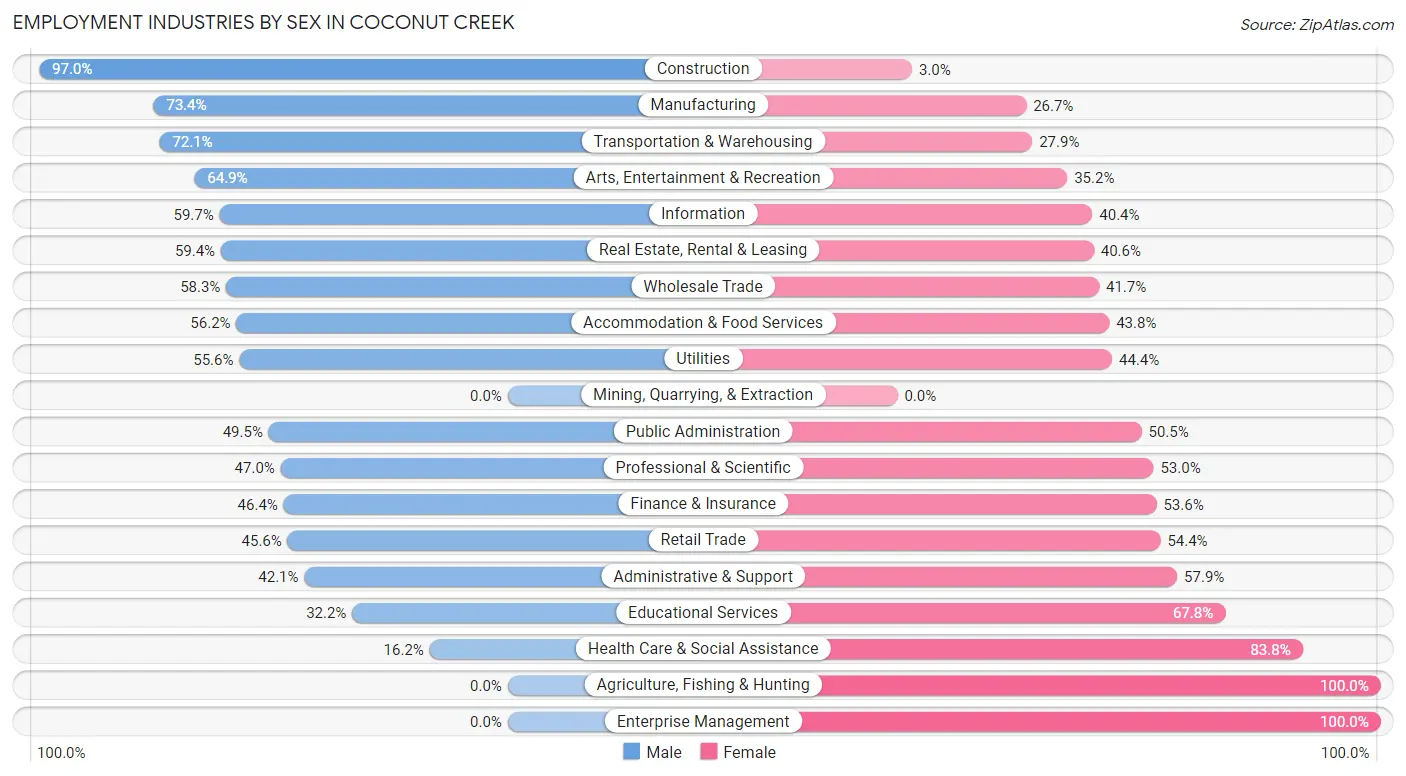
Employment Industries by Sex in Coconut Creek
The Coconut Creek industries that see more men than women are Construction (97.0%), Manufacturing (73.4%), and Transportation & Warehousing (72.1%), whereas the industries that tend to have a higher number of women are Agriculture, Fishing & Hunting (100.0%), Enterprise Management (100.0%), and Health Care & Social Assistance (83.8%).
| Industry | Male | Female |
| Agriculture, Fishing & Hunting | 0 (0.0%) | 42 (100.0%) |
| Mining, Quarrying, & Extraction | 0 (0.0%) | 0 (0.0%) |
| Construction | 2,032 (97.0%) | 63 (3.0%) |
| Manufacturing | 1,189 (73.4%) | 432 (26.7%) |
| Wholesale Trade | 472 (58.3%) | 338 (41.7%) |
| Retail Trade | 1,717 (45.6%) | 2,052 (54.4%) |
| Transportation & Warehousing | 933 (72.1%) | 361 (27.9%) |
| Utilities | 60 (55.6%) | 48 (44.4%) |
| Information | 303 (59.7%) | 205 (40.4%) |
| Finance & Insurance | 962 (46.4%) | 1,112 (53.6%) |
| Real Estate, Rental & Leasing | 333 (59.4%) | 228 (40.6%) |
| Professional & Scientific | 1,309 (47.0%) | 1,476 (53.0%) |
| Enterprise Management | 0 (0.0%) | 36 (100.0%) |
| Administrative & Support | 1,106 (42.1%) | 1,521 (57.9%) |
| Educational Services | 676 (32.2%) | 1,424 (67.8%) |
| Health Care & Social Assistance | 589 (16.2%) | 3,055 (83.8%) |
| Arts, Entertainment & Recreation | 500 (64.8%) | 271 (35.1%) |
| Accommodation & Food Services | 948 (56.2%) | 740 (43.8%) |
| Public Administration | 694 (49.5%) | 709 (50.5%) |
| Total | 14,643 (48.8%) | 15,369 (51.2%) |
Education in Coconut Creek
School Enrollment in Coconut Creek
The most common levels of schooling among the 13,487 students in Coconut Creek are high school (3,338 | 24.7%), middle school (2,762 | 20.5%), and college / undergraduate (2,582 | 19.1%).
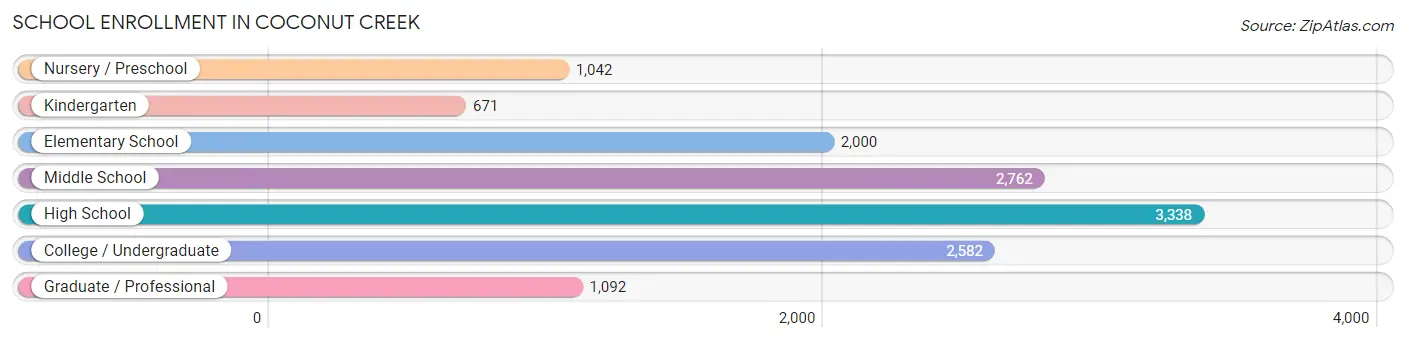
| School Level | # Students | % Students |
| Nursery / Preschool | 1,042 | 7.7% |
| Kindergarten | 671 | 5.0% |
| Elementary School | 2,000 | 14.8% |
| Middle School | 2,762 | 20.5% |
| High School | 3,338 | 24.7% |
| College / Undergraduate | 2,582 | 19.1% |
| Graduate / Professional | 1,092 | 8.1% |
| Total | 13,487 | 100.0% |
School Enrollment by Age by Funding Source in Coconut Creek
Out of a total of 13,487 students who are enrolled in schools in Coconut Creek, 3,385 (25.1%) attend a private institution, while the remaining 10,102 (74.9%) are enrolled in public schools. The age group of 3 to 4 year olds has the highest likelihood of being enrolled in private schools, with 533 (53.2% in the age bracket) enrolled. Conversely, the age group of 15 to 17 year olds has the lowest likelihood of being enrolled in a private school, with 2,192 (86.1% in the age bracket) attending a public institution.
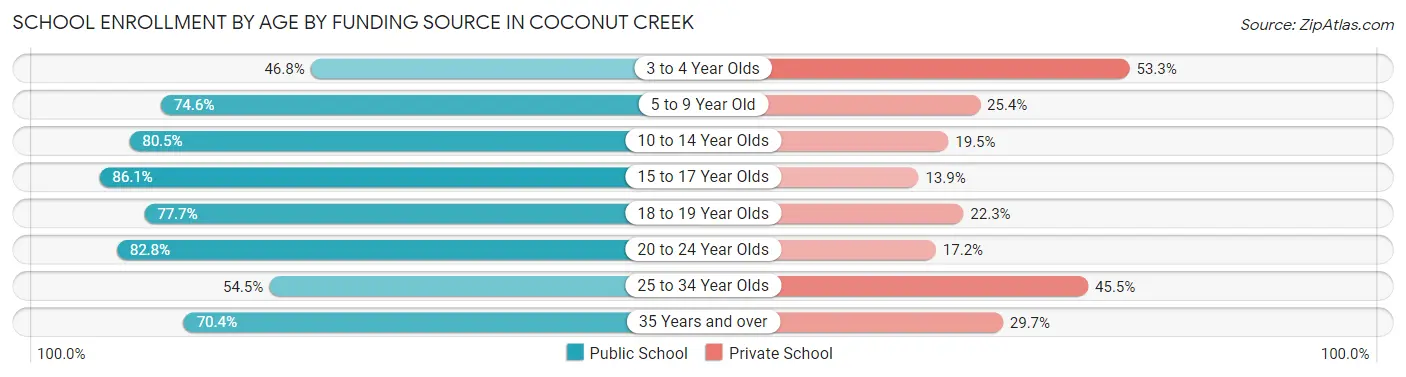
| Age Bracket | Public School | Private School |
| 3 to 4 Year Olds | 468 (46.8%) | 533 (53.2%) |
| 5 to 9 Year Old | 1,805 (74.6%) | 615 (25.4%) |
| 10 to 14 Year Olds | 2,576 (80.5%) | 624 (19.5%) |
| 15 to 17 Year Olds | 2,192 (86.1%) | 355 (13.9%) |
| 18 to 19 Year Olds | 749 (77.7%) | 215 (22.3%) |
| 20 to 24 Year Olds | 906 (82.8%) | 188 (17.2%) |
| 25 to 34 Year Olds | 616 (54.5%) | 515 (45.5%) |
| 35 Years and over | 795 (70.4%) | 335 (29.6%) |
| Total | 10,102 (74.9%) | 3,385 (25.1%) |
Educational Attainment by Field of Study in Coconut Creek
Business (3,856 | 24.2%), science & technology (1,908 | 12.0%), engineering (1,475 | 9.2%), education (1,374 | 8.6%), and social sciences (1,308 | 8.2%) are the most common fields of study among 15,939 individuals in Coconut Creek who have obtained a bachelor's degree or higher.
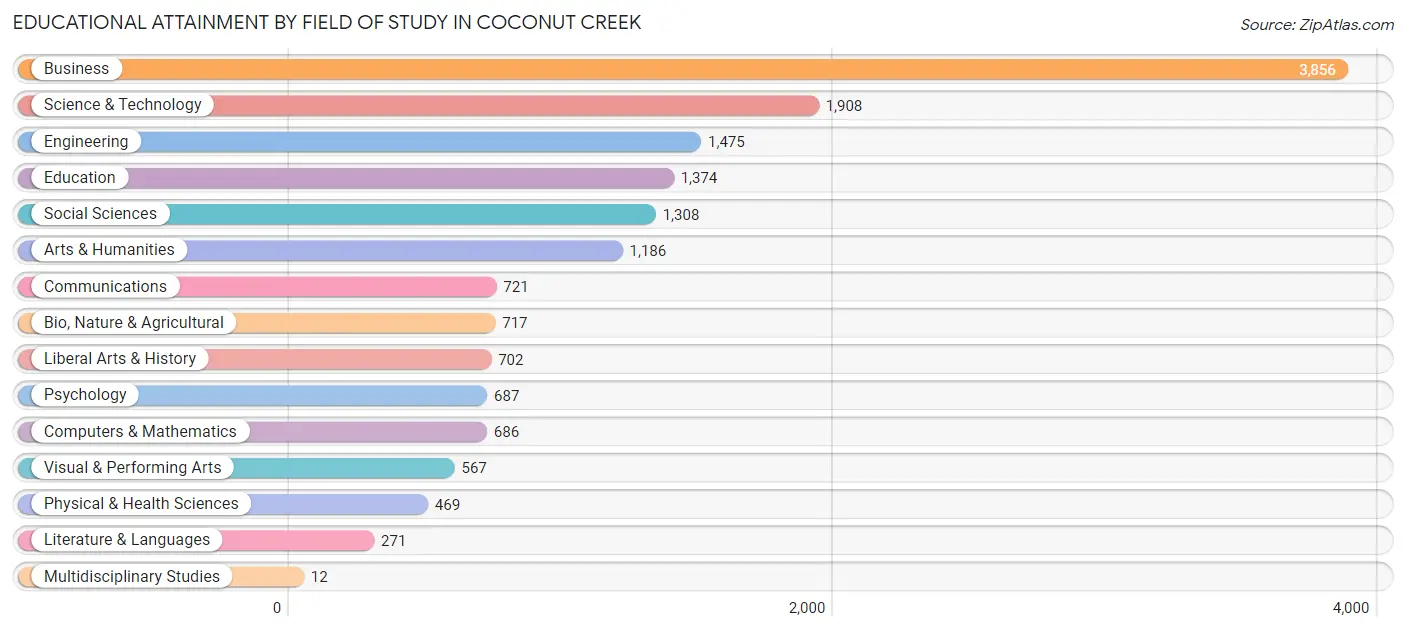
| Field of Study | # Graduates | % Graduates |
| Computers & Mathematics | 686 | 4.3% |
| Bio, Nature & Agricultural | 717 | 4.5% |
| Physical & Health Sciences | 469 | 2.9% |
| Psychology | 687 | 4.3% |
| Social Sciences | 1,308 | 8.2% |
| Engineering | 1,475 | 9.2% |
| Multidisciplinary Studies | 12 | 0.1% |
| Science & Technology | 1,908 | 12.0% |
| Business | 3,856 | 24.2% |
| Education | 1,374 | 8.6% |
| Literature & Languages | 271 | 1.7% |
| Liberal Arts & History | 702 | 4.4% |
| Visual & Performing Arts | 567 | 3.6% |
| Communications | 721 | 4.5% |
| Arts & Humanities | 1,186 | 7.4% |
| Total | 15,939 | 100.0% |
Transportation & Commute in Coconut Creek
Vehicle Availability by Sex in Coconut Creek
The most prevalent vehicle ownership categories in Coconut Creek are males with 2 vehicles (7,633, accounting for 53.3%) and females with 2 vehicles (7,111, making up 50.5%).
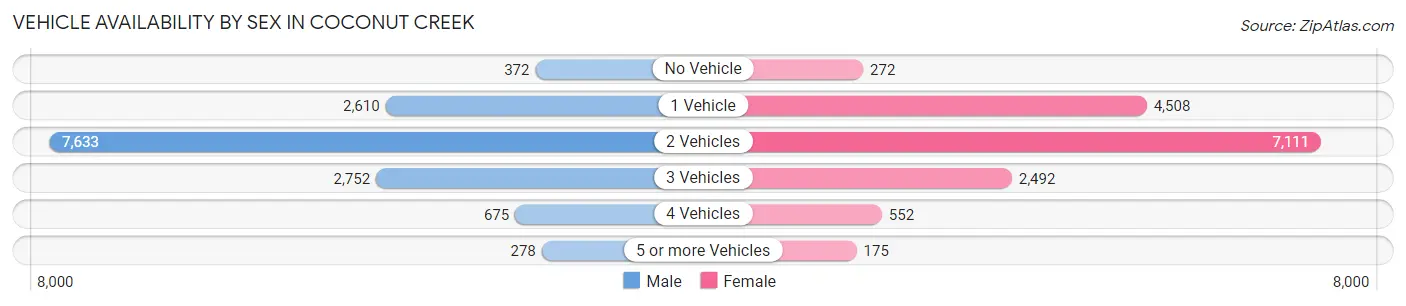
| Vehicles Available | Male | Female |
| No Vehicle | 372 (2.6%) | 272 (1.8%) |
| 1 Vehicle | 2,610 (18.2%) | 4,508 (29.8%) |
| 2 Vehicles | 7,633 (53.3%) | 7,111 (47.1%) |
| 3 Vehicles | 2,752 (19.2%) | 2,492 (16.5%) |
| 4 Vehicles | 675 (4.7%) | 552 (3.6%) |
| 5 or more Vehicles | 278 (1.9%) | 175 (1.2%) |
| Total | 14,320 (100.0%) | 15,110 (100.0%) |
Commute Time in Coconut Creek
The most frequently occuring commute durations in Coconut Creek are 30 to 34 minutes (5,114 commuters, 19.8%), 20 to 24 minutes (4,217 commuters, 16.4%), and 15 to 19 minutes (3,077 commuters, 11.9%).
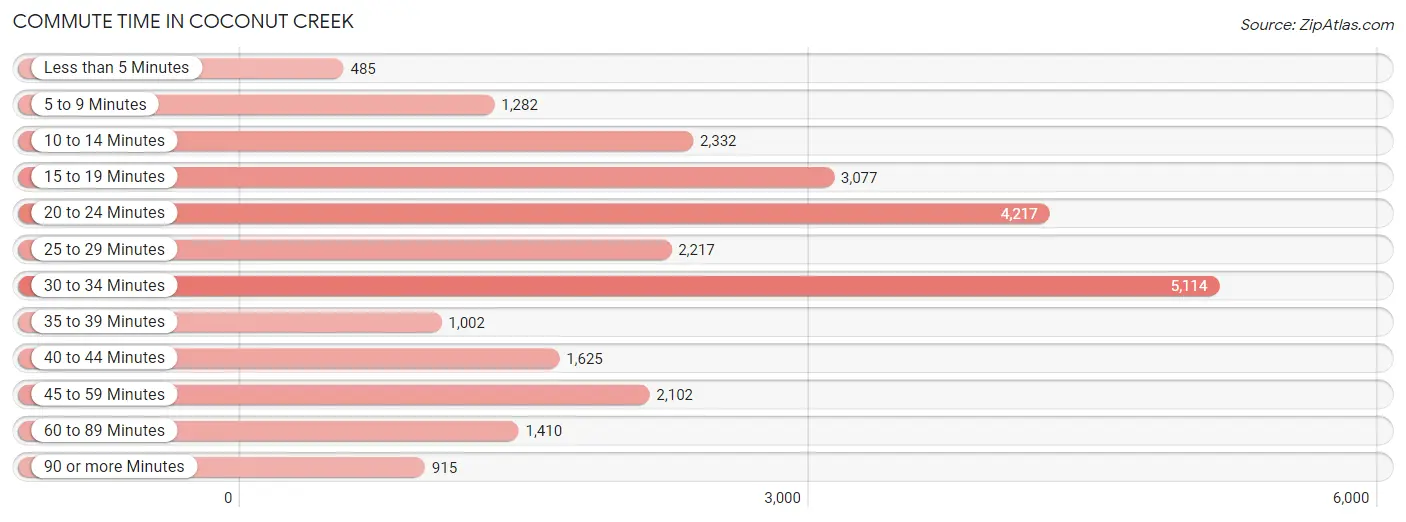
| Commute Time | # Commuters | % Commuters |
| Less than 5 Minutes | 485 | 1.9% |
| 5 to 9 Minutes | 1,282 | 5.0% |
| 10 to 14 Minutes | 2,332 | 9.0% |
| 15 to 19 Minutes | 3,077 | 11.9% |
| 20 to 24 Minutes | 4,217 | 16.4% |
| 25 to 29 Minutes | 2,217 | 8.6% |
| 30 to 34 Minutes | 5,114 | 19.8% |
| 35 to 39 Minutes | 1,002 | 3.9% |
| 40 to 44 Minutes | 1,625 | 6.3% |
| 45 to 59 Minutes | 2,102 | 8.2% |
| 60 to 89 Minutes | 1,410 | 5.5% |
| 90 or more Minutes | 915 | 3.5% |
Commute Time by Sex in Coconut Creek
The most common commute times in Coconut Creek are 30 to 34 minutes (2,286 commuters, 18.8%) for males and 30 to 34 minutes (2,828 commuters, 20.8%) for females.
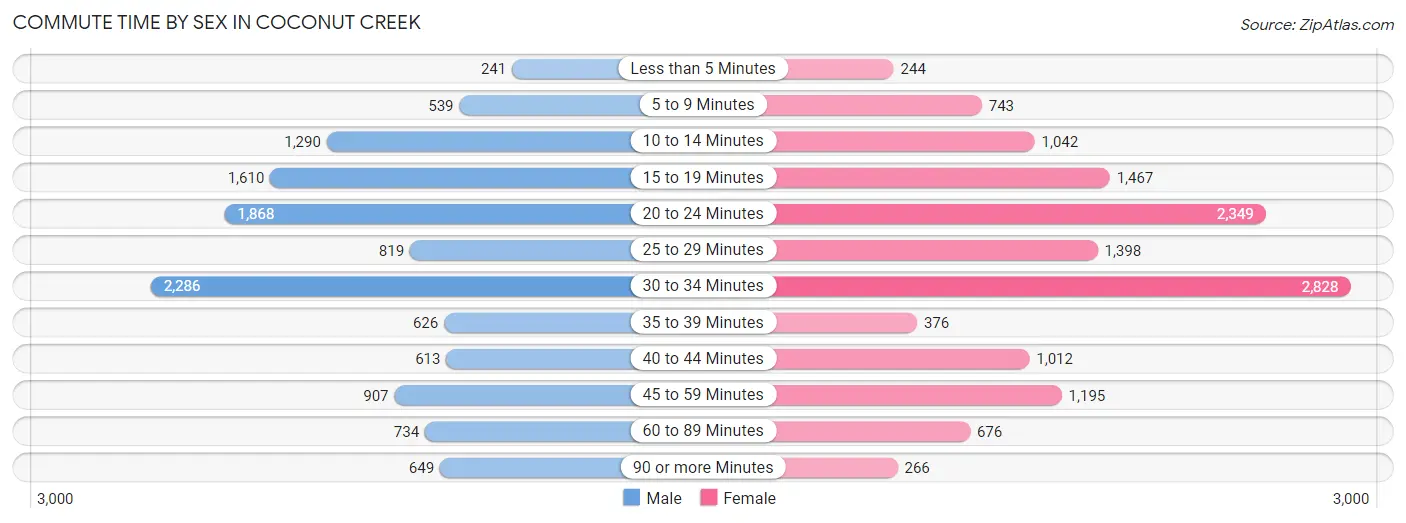
| Commute Time | Male | Female |
| Less than 5 Minutes | 241 (2.0%) | 244 (1.8%) |
| 5 to 9 Minutes | 539 (4.4%) | 743 (5.5%) |
| 10 to 14 Minutes | 1,290 (10.6%) | 1,042 (7.7%) |
| 15 to 19 Minutes | 1,610 (13.2%) | 1,467 (10.8%) |
| 20 to 24 Minutes | 1,868 (15.3%) | 2,349 (17.3%) |
| 25 to 29 Minutes | 819 (6.7%) | 1,398 (10.3%) |
| 30 to 34 Minutes | 2,286 (18.8%) | 2,828 (20.8%) |
| 35 to 39 Minutes | 626 (5.1%) | 376 (2.8%) |
| 40 to 44 Minutes | 613 (5.0%) | 1,012 (7.4%) |
| 45 to 59 Minutes | 907 (7.4%) | 1,195 (8.8%) |
| 60 to 89 Minutes | 734 (6.0%) | 676 (5.0%) |
| 90 or more Minutes | 649 (5.3%) | 266 (2.0%) |
Time of Departure to Work by Sex in Coconut Creek
The most frequent times of departure to work in Coconut Creek are 7:30 AM to 7:59 AM (1,880, 15.4%) for males and 7:30 AM to 7:59 AM (2,396, 17.6%) for females.
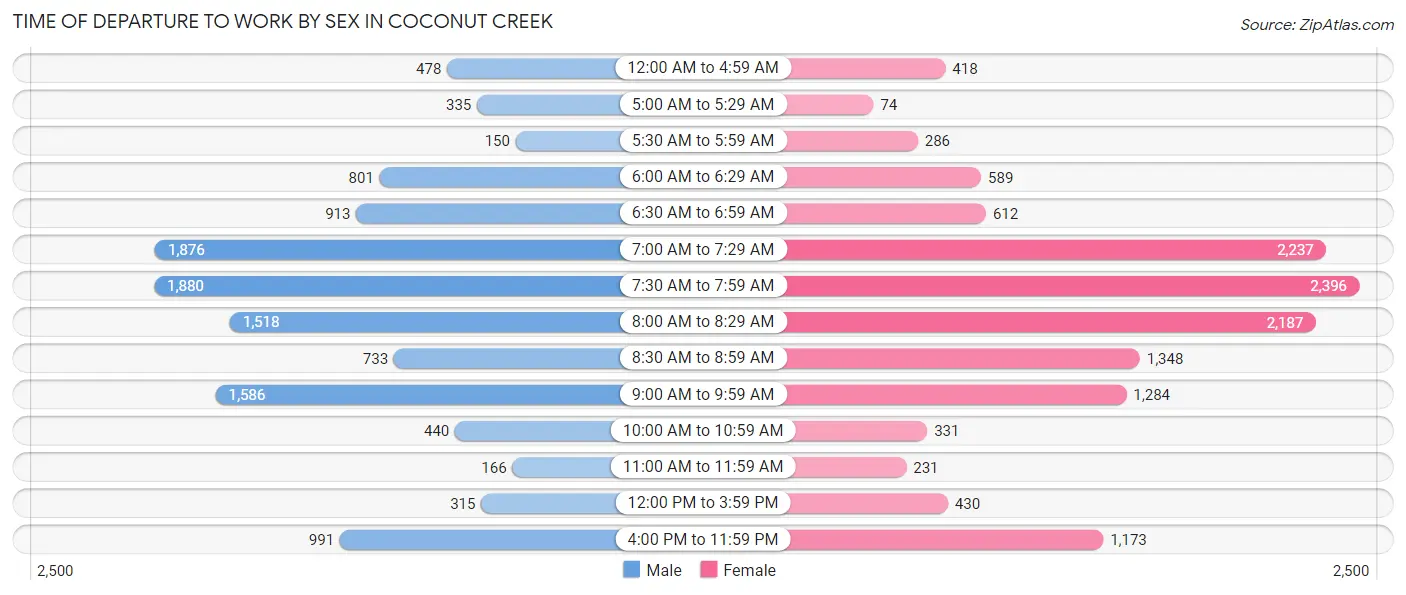
| Time of Departure | Male | Female |
| 12:00 AM to 4:59 AM | 478 (3.9%) | 418 (3.1%) |
| 5:00 AM to 5:29 AM | 335 (2.8%) | 74 (0.5%) |
| 5:30 AM to 5:59 AM | 150 (1.2%) | 286 (2.1%) |
| 6:00 AM to 6:29 AM | 801 (6.6%) | 589 (4.3%) |
| 6:30 AM to 6:59 AM | 913 (7.5%) | 612 (4.5%) |
| 7:00 AM to 7:29 AM | 1,876 (15.4%) | 2,237 (16.5%) |
| 7:30 AM to 7:59 AM | 1,880 (15.4%) | 2,396 (17.6%) |
| 8:00 AM to 8:29 AM | 1,518 (12.5%) | 2,187 (16.1%) |
| 8:30 AM to 8:59 AM | 733 (6.0%) | 1,348 (9.9%) |
| 9:00 AM to 9:59 AM | 1,586 (13.0%) | 1,284 (9.4%) |
| 10:00 AM to 10:59 AM | 440 (3.6%) | 331 (2.4%) |
| 11:00 AM to 11:59 AM | 166 (1.4%) | 231 (1.7%) |
| 12:00 PM to 3:59 PM | 315 (2.6%) | 430 (3.2%) |
| 4:00 PM to 11:59 PM | 991 (8.1%) | 1,173 (8.6%) |
| Total | 12,182 (100.0%) | 13,596 (100.0%) |
Housing Occupancy in Coconut Creek
Occupancy by Ownership in Coconut Creek
Of the total 23,696 dwellings in Coconut Creek, owner-occupied units account for 15,551 (65.6%), while renter-occupied units make up 8,145 (34.4%).
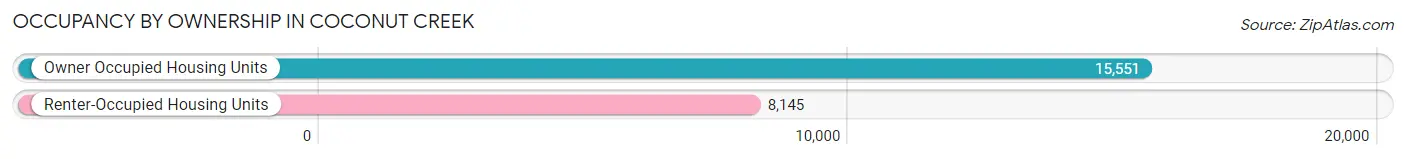
| Occupancy | # Housing Units | % Housing Units |
| Owner Occupied Housing Units | 15,551 | 65.6% |
| Renter-Occupied Housing Units | 8,145 | 34.4% |
| Total Occupied Housing Units | 23,696 | 100.0% |
Occupancy by Household Size in Coconut Creek
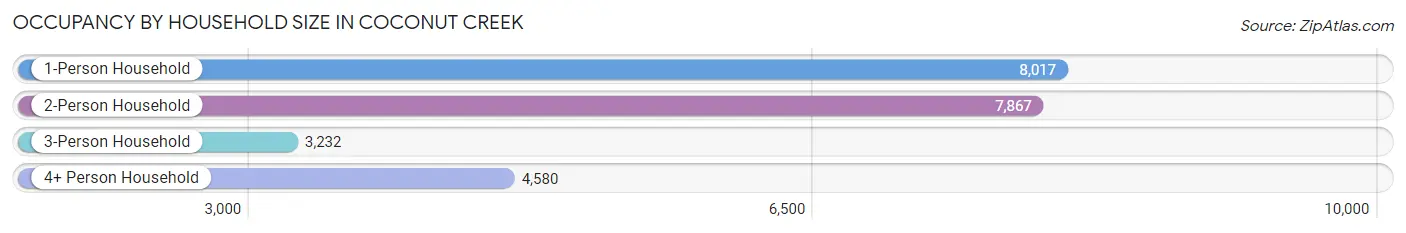
| Household Size | # Housing Units | % Housing Units |
| 1-Person Household | 8,017 | 33.8% |
| 2-Person Household | 7,867 | 33.2% |
| 3-Person Household | 3,232 | 13.6% |
| 4+ Person Household | 4,580 | 19.3% |
| Total Housing Units | 23,696 | 100.0% |
Occupancy by Ownership by Household Size in Coconut Creek
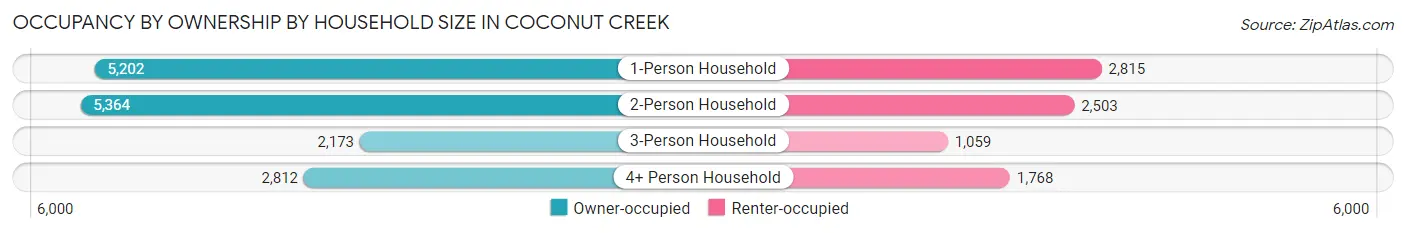
| Household Size | Owner-occupied | Renter-occupied |
| 1-Person Household | 5,202 (64.9%) | 2,815 (35.1%) |
| 2-Person Household | 5,364 (68.2%) | 2,503 (31.8%) |
| 3-Person Household | 2,173 (67.2%) | 1,059 (32.8%) |
| 4+ Person Household | 2,812 (61.4%) | 1,768 (38.6%) |
| Total Housing Units | 15,551 (65.6%) | 8,145 (34.4%) |
Occupancy by Educational Attainment in Coconut Creek
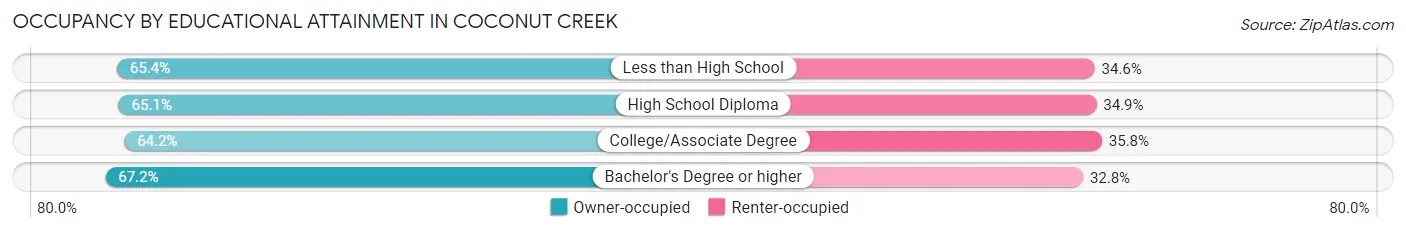
| Household Size | Owner-occupied | Renter-occupied |
| Less than High School | 883 (65.4%) | 468 (34.6%) |
| High School Diploma | 3,904 (65.1%) | 2,095 (34.9%) |
| College/Associate Degree | 4,719 (64.2%) | 2,631 (35.8%) |
| Bachelor's Degree or higher | 6,045 (67.2%) | 2,951 (32.8%) |
Occupancy by Age of Householder in Coconut Creek
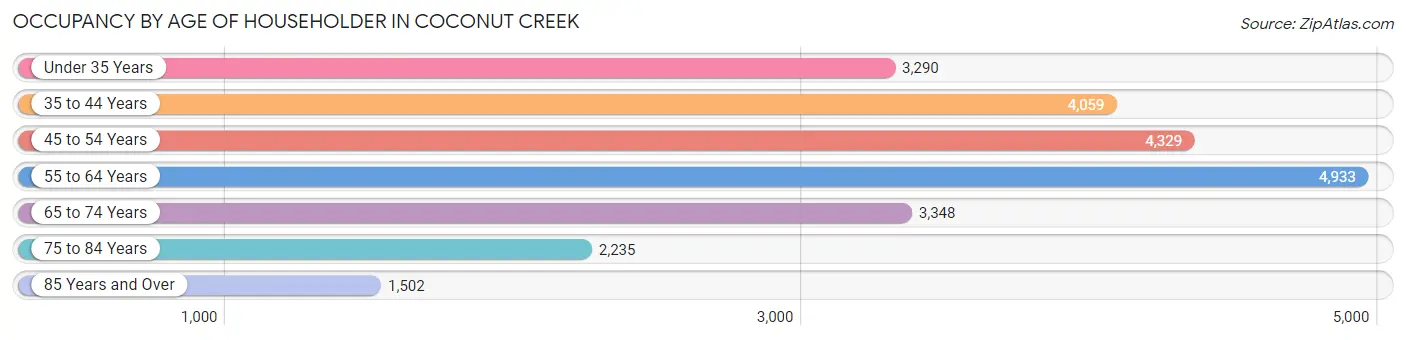
| Age Bracket | # Households | % Households |
| Under 35 Years | 3,290 | 13.9% |
| 35 to 44 Years | 4,059 | 17.1% |
| 45 to 54 Years | 4,329 | 18.3% |
| 55 to 64 Years | 4,933 | 20.8% |
| 65 to 74 Years | 3,348 | 14.1% |
| 75 to 84 Years | 2,235 | 9.4% |
| 85 Years and Over | 1,502 | 6.3% |
| Total | 23,696 | 100.0% |
Housing Finances in Coconut Creek
Median Income by Occupancy in Coconut Creek
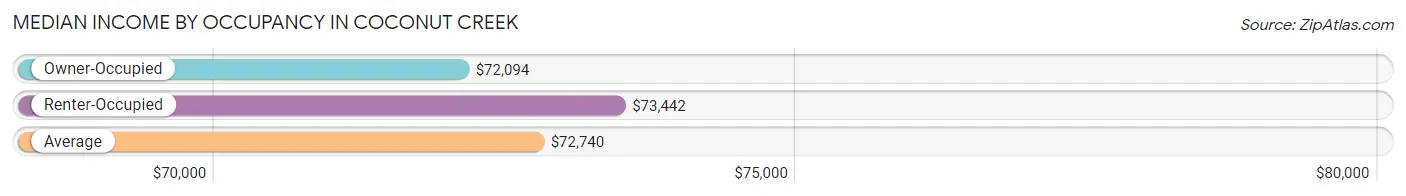
| Occupancy Type | # Households | Median Income |
| Owner-Occupied | 15,551 (65.6%) | $72,094 |
| Renter-Occupied | 8,145 (34.4%) | $73,442 |
| Average | 23,696 (100.0%) | $72,740 |
Occupancy by Householder Income Bracket in Coconut Creek
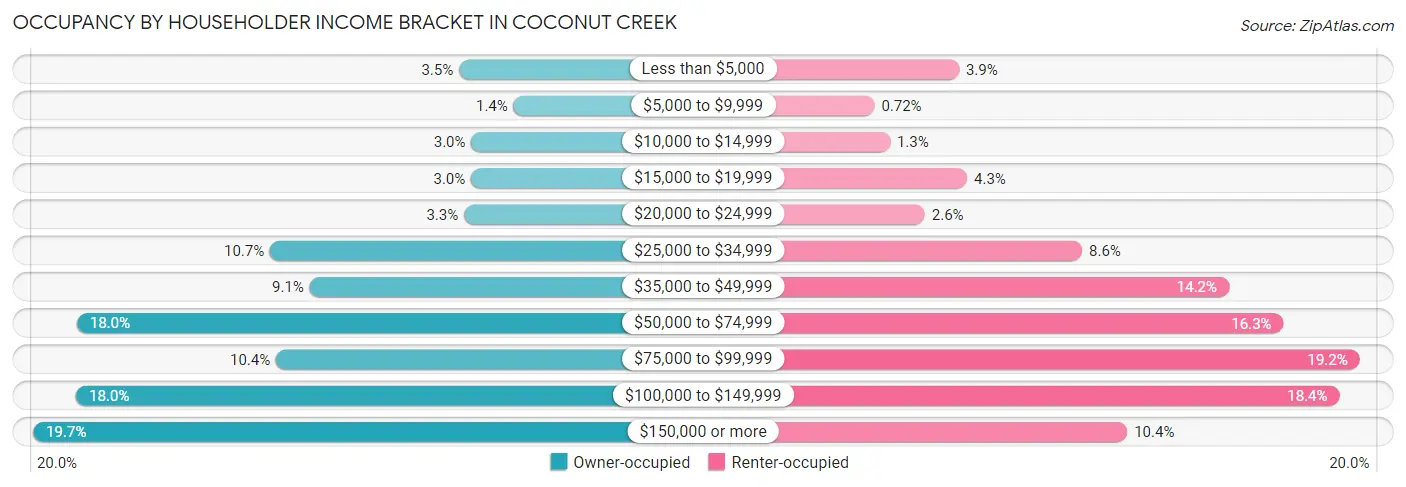
| Income Bracket | Owner-occupied | Renter-occupied |
| Less than $5,000 | 537 (3.5%) | 321 (3.9%) |
| $5,000 to $9,999 | 213 (1.4%) | 59 (0.7%) |
| $10,000 to $14,999 | 464 (3.0%) | 107 (1.3%) |
| $15,000 to $19,999 | 465 (3.0%) | 346 (4.3%) |
| $20,000 to $24,999 | 507 (3.3%) | 215 (2.6%) |
| $25,000 to $34,999 | 1,656 (10.6%) | 703 (8.6%) |
| $35,000 to $49,999 | 1,421 (9.1%) | 1,158 (14.2%) |
| $50,000 to $74,999 | 2,801 (18.0%) | 1,328 (16.3%) |
| $75,000 to $99,999 | 1,621 (10.4%) | 1,564 (19.2%) |
| $100,000 to $149,999 | 2,806 (18.0%) | 1,501 (18.4%) |
| $150,000 or more | 3,060 (19.7%) | 843 (10.3%) |
| Total | 15,551 (100.0%) | 8,145 (100.0%) |
Monthly Housing Cost Tiers in Coconut Creek
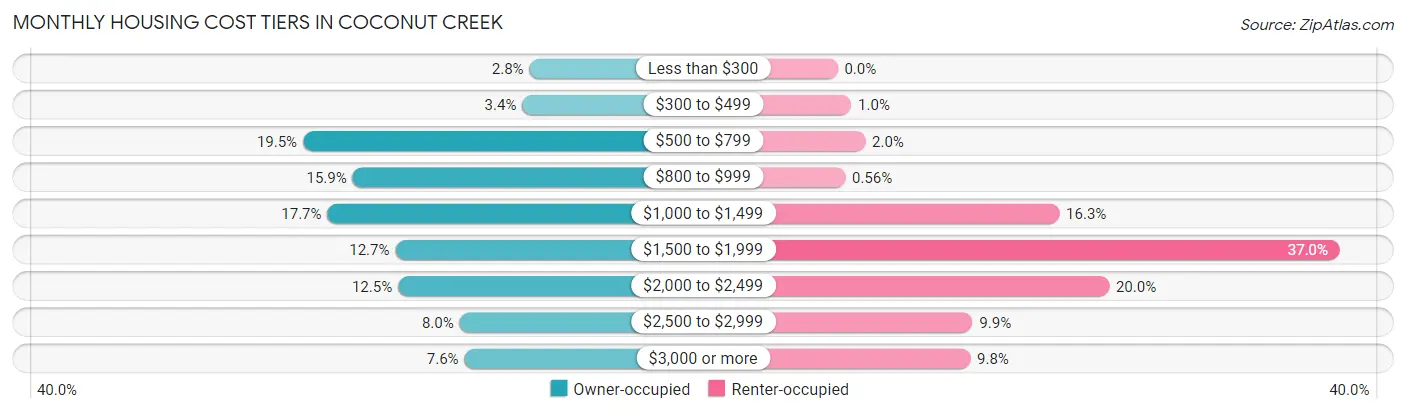
| Monthly Cost | Owner-occupied | Renter-occupied |
| Less than $300 | 438 (2.8%) | 0 (0.0%) |
| $300 to $499 | 521 (3.4%) | 82 (1.0%) |
| $500 to $799 | 3,032 (19.5%) | 166 (2.0%) |
| $800 to $999 | 2,465 (15.9%) | 46 (0.6%) |
| $1,000 to $1,499 | 2,753 (17.7%) | 1,330 (16.3%) |
| $1,500 to $1,999 | 1,975 (12.7%) | 3,014 (37.0%) |
| $2,000 to $2,499 | 1,944 (12.5%) | 1,629 (20.0%) |
| $2,500 to $2,999 | 1,239 (8.0%) | 810 (9.9%) |
| $3,000 or more | 1,184 (7.6%) | 796 (9.8%) |
| Total | 15,551 (100.0%) | 8,145 (100.0%) |
Physical Housing Characteristics in Coconut Creek
Housing Structures in Coconut Creek
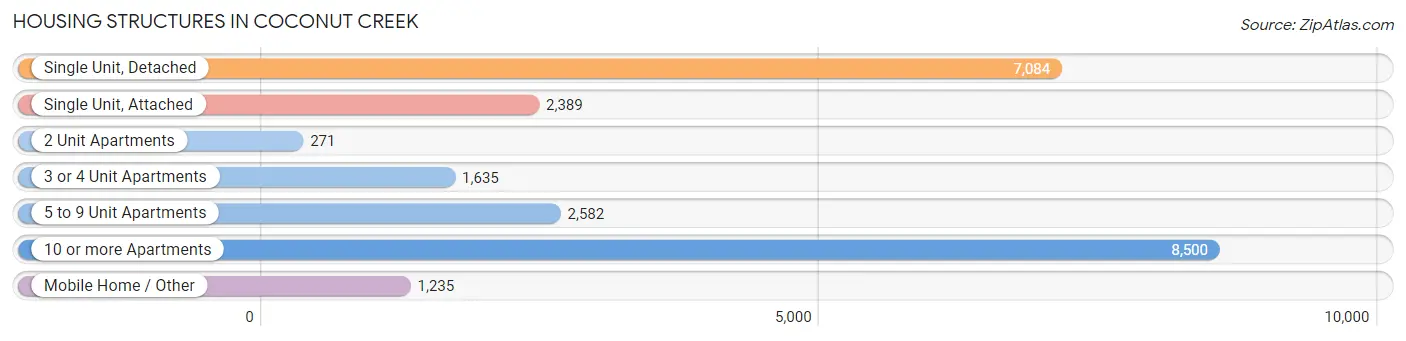
| Structure Type | # Housing Units | % Housing Units |
| Single Unit, Detached | 7,084 | 29.9% |
| Single Unit, Attached | 2,389 | 10.1% |
| 2 Unit Apartments | 271 | 1.1% |
| 3 or 4 Unit Apartments | 1,635 | 6.9% |
| 5 to 9 Unit Apartments | 2,582 | 10.9% |
| 10 or more Apartments | 8,500 | 35.9% |
| Mobile Home / Other | 1,235 | 5.2% |
| Total | 23,696 | 100.0% |
Housing Structures by Occupancy in Coconut Creek
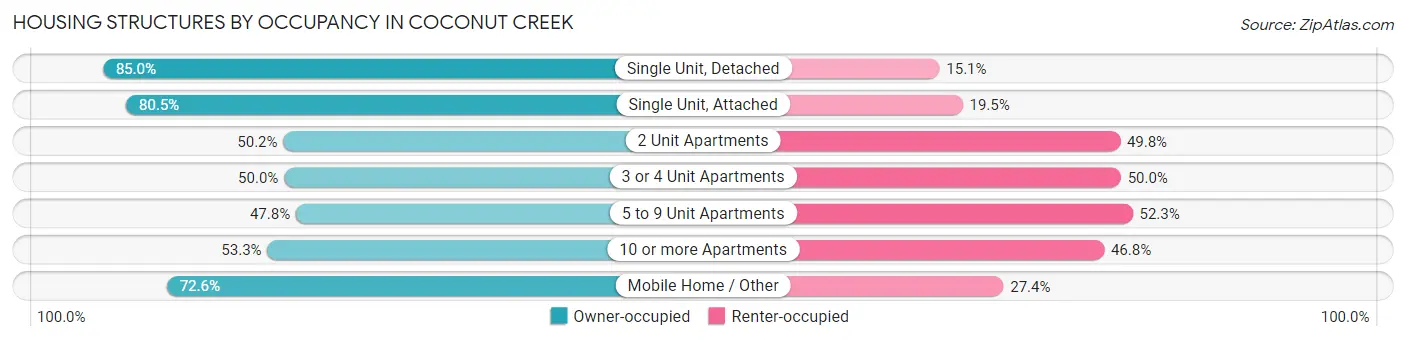
| Structure Type | Owner-occupied | Renter-occupied |
| Single Unit, Detached | 6,018 (85.0%) | 1,066 (15.0%) |
| Single Unit, Attached | 1,923 (80.5%) | 466 (19.5%) |
| 2 Unit Apartments | 136 (50.2%) | 135 (49.8%) |
| 3 or 4 Unit Apartments | 818 (50.0%) | 817 (50.0%) |
| 5 to 9 Unit Apartments | 1,233 (47.7%) | 1,349 (52.2%) |
| 10 or more Apartments | 4,526 (53.2%) | 3,974 (46.8%) |
| Mobile Home / Other | 897 (72.6%) | 338 (27.4%) |
| Total | 15,551 (65.6%) | 8,145 (34.4%) |
Housing Structures by Number of Rooms in Coconut Creek
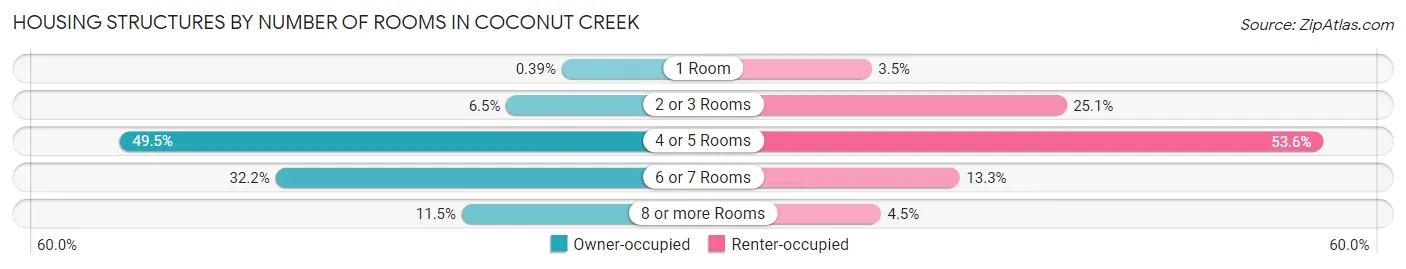
| Number of Rooms | Owner-occupied | Renter-occupied |
| 1 Room | 61 (0.4%) | 284 (3.5%) |
| 2 or 3 Rooms | 1,017 (6.5%) | 2,045 (25.1%) |
| 4 or 5 Rooms | 7,690 (49.4%) | 4,369 (53.6%) |
| 6 or 7 Rooms | 4,999 (32.2%) | 1,080 (13.3%) |
| 8 or more Rooms | 1,784 (11.5%) | 367 (4.5%) |
| Total | 15,551 (100.0%) | 8,145 (100.0%) |
Housing Structure by Heating Type in Coconut Creek
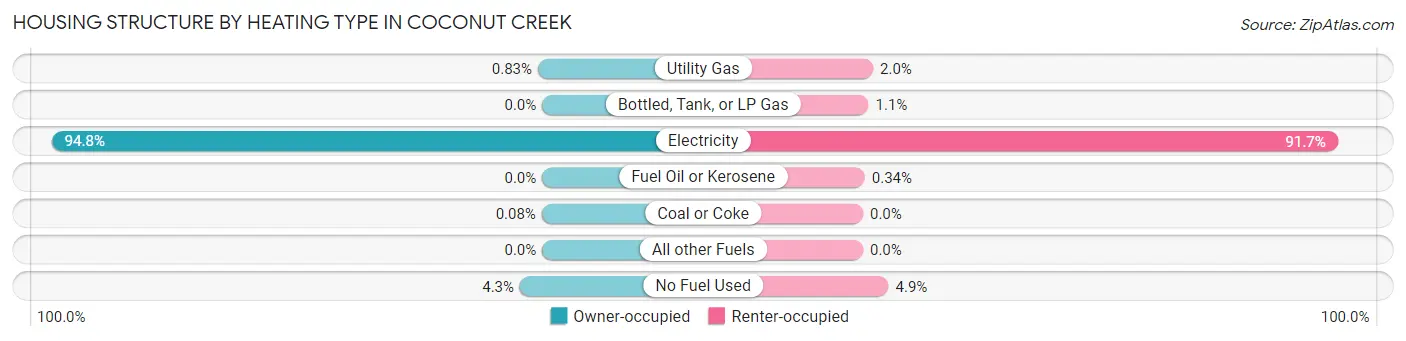
| Heating Type | Owner-occupied | Renter-occupied |
| Utility Gas | 129 (0.8%) | 159 (1.9%) |
| Bottled, Tank, or LP Gas | 0 (0.0%) | 87 (1.1%) |
| Electricity | 14,740 (94.8%) | 7,469 (91.7%) |
| Fuel Oil or Kerosene | 0 (0.0%) | 28 (0.3%) |
| Coal or Coke | 13 (0.1%) | 0 (0.0%) |
| All other Fuels | 0 (0.0%) | 0 (0.0%) |
| No Fuel Used | 669 (4.3%) | 402 (4.9%) |
| Total | 15,551 (100.0%) | 8,145 (100.0%) |
Household Vehicle Usage in Coconut Creek
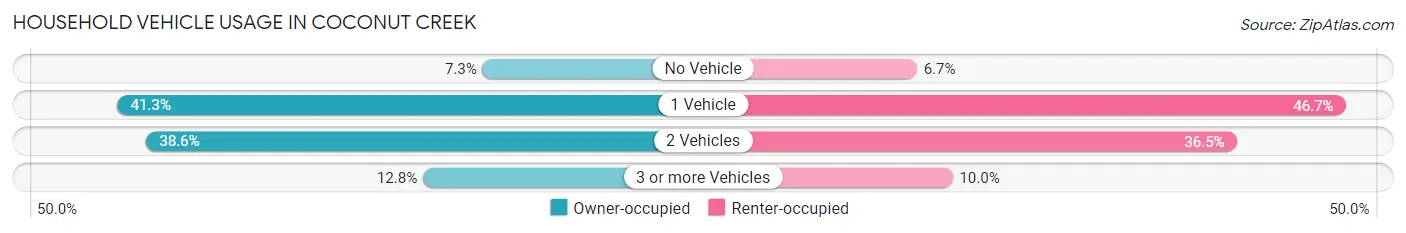
| Vehicles per Household | Owner-occupied | Renter-occupied |
| No Vehicle | 1,127 (7.2%) | 546 (6.7%) |
| 1 Vehicle | 6,425 (41.3%) | 3,805 (46.7%) |
| 2 Vehicles | 6,007 (38.6%) | 2,976 (36.5%) |
| 3 or more Vehicles | 1,992 (12.8%) | 818 (10.0%) |
| Total | 15,551 (100.0%) | 8,145 (100.0%) |
Real Estate & Mortgages in Coconut Creek
Real Estate and Mortgage Overview in Coconut Creek
| Characteristic | Without Mortgage | With Mortgage |
| Housing Units | 6,819 | 8,732 |
| Median Property Value | $173,400 | $343,200 |
| Median Household Income | $51,858 | $2,095 |
| Monthly Housing Costs | $768 | $1,184 |
| Real Estate Taxes | $1,445 | $240 |
Property Value by Mortgage Status in Coconut Creek
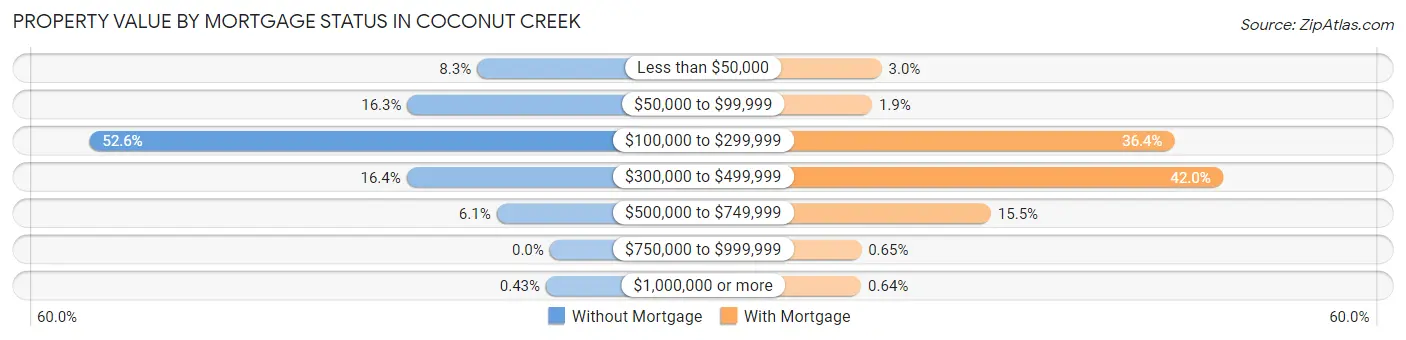
| Property Value | Without Mortgage | With Mortgage |
| Less than $50,000 | 566 (8.3%) | 260 (3.0%) |
| $50,000 to $99,999 | 1,109 (16.3%) | 164 (1.9%) |
| $100,000 to $299,999 | 3,586 (52.6%) | 3,181 (36.4%) |
| $300,000 to $499,999 | 1,115 (16.4%) | 3,663 (41.9%) |
| $500,000 to $749,999 | 414 (6.1%) | 1,351 (15.5%) |
| $750,000 to $999,999 | 0 (0.0%) | 57 (0.6%) |
| $1,000,000 or more | 29 (0.4%) | 56 (0.6%) |
| Total | 6,819 (100.0%) | 8,732 (100.0%) |
Household Income by Mortgage Status in Coconut Creek
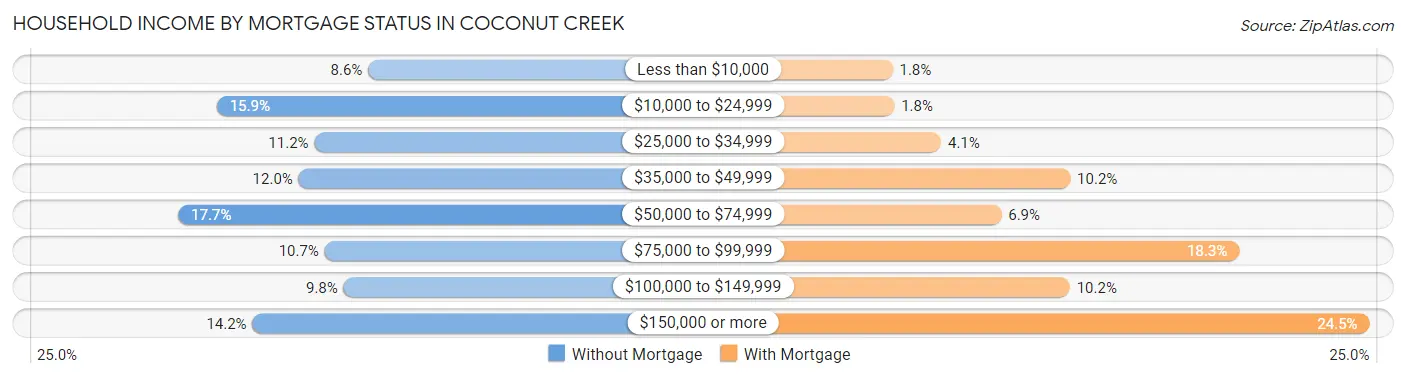
| Household Income | Without Mortgage | With Mortgage |
| Less than $10,000 | 589 (8.6%) | 154 (1.8%) |
| $10,000 to $24,999 | 1,081 (15.9%) | 161 (1.8%) |
| $25,000 to $34,999 | 764 (11.2%) | 355 (4.1%) |
| $35,000 to $49,999 | 815 (11.9%) | 892 (10.2%) |
| $50,000 to $74,999 | 1,206 (17.7%) | 606 (6.9%) |
| $75,000 to $99,999 | 730 (10.7%) | 1,595 (18.3%) |
| $100,000 to $149,999 | 669 (9.8%) | 891 (10.2%) |
| $150,000 or more | 965 (14.1%) | 2,137 (24.5%) |
| Total | 6,819 (100.0%) | 8,732 (100.0%) |
Property Value to Household Income Ratio in Coconut Creek
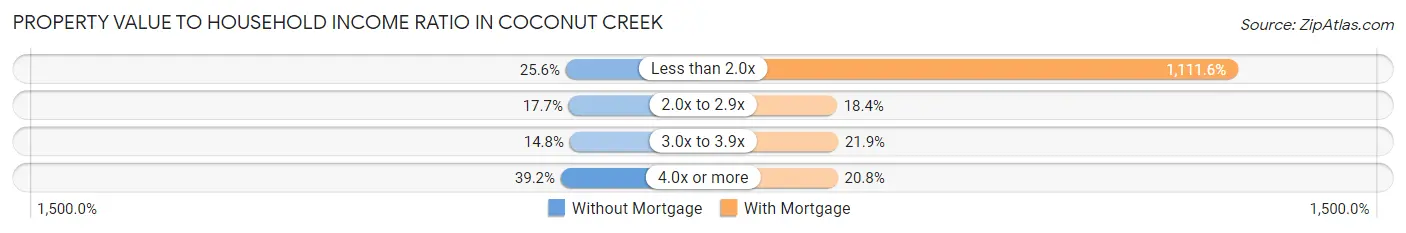
| Value-to-Income Ratio | Without Mortgage | With Mortgage |
| Less than 2.0x | 1,744 (25.6%) | 97,066 (1,111.6%) |
| 2.0x to 2.9x | 1,204 (17.7%) | 1,610 (18.4%) |
| 3.0x to 3.9x | 1,010 (14.8%) | 1,909 (21.9%) |
| 4.0x or more | 2,672 (39.2%) | 1,817 (20.8%) |
| Total | 6,819 (100.0%) | 8,732 (100.0%) |
Real Estate Taxes by Mortgage Status in Coconut Creek
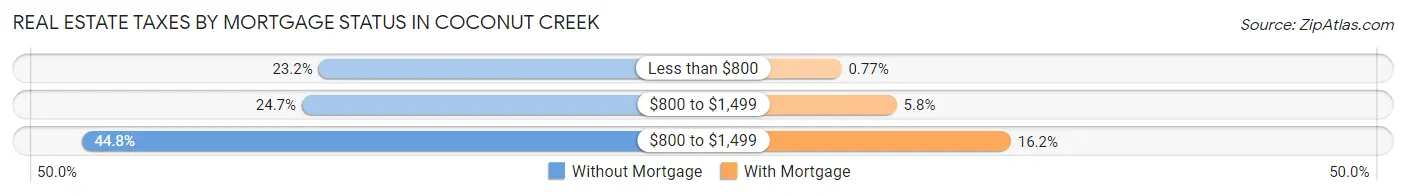
| Property Taxes | Without Mortgage | With Mortgage |
| Less than $800 | 1,579 (23.2%) | 67 (0.8%) |
| $800 to $1,499 | 1,683 (24.7%) | 507 (5.8%) |
| $800 to $1,499 | 3,054 (44.8%) | 1,417 (16.2%) |
| Total | 6,819 (100.0%) | 8,732 (100.0%) |
Health & Disability in Coconut Creek
Health Insurance Coverage by Age in Coconut Creek
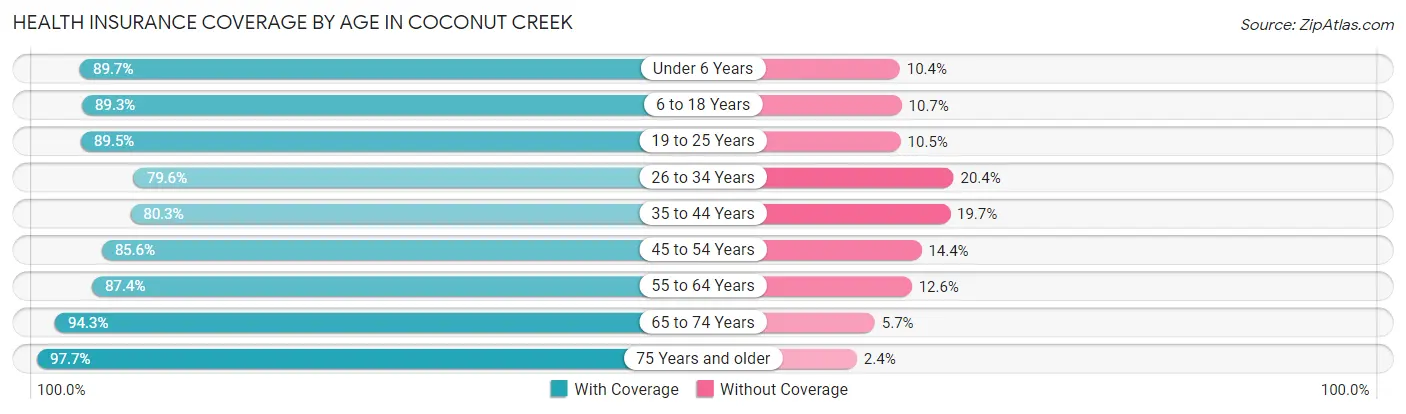
| Age Bracket | With Coverage | Without Coverage |
| Under 6 Years | 3,473 (89.6%) | 401 (10.3%) |
| 6 to 18 Years | 7,861 (89.3%) | 941 (10.7%) |
| 19 to 25 Years | 3,260 (89.5%) | 383 (10.5%) |
| 26 to 34 Years | 5,554 (79.6%) | 1,421 (20.4%) |
| 35 to 44 Years | 6,177 (80.3%) | 1,517 (19.7%) |
| 45 to 54 Years | 6,709 (85.6%) | 1,128 (14.4%) |
| 55 to 64 Years | 6,738 (87.4%) | 969 (12.6%) |
| 65 to 74 Years | 5,121 (94.3%) | 309 (5.7%) |
| 75 Years and older | 5,236 (97.7%) | 126 (2.4%) |
| Total | 50,129 (87.5%) | 7,195 (12.6%) |
Health Insurance Coverage by Citizenship Status in Coconut Creek
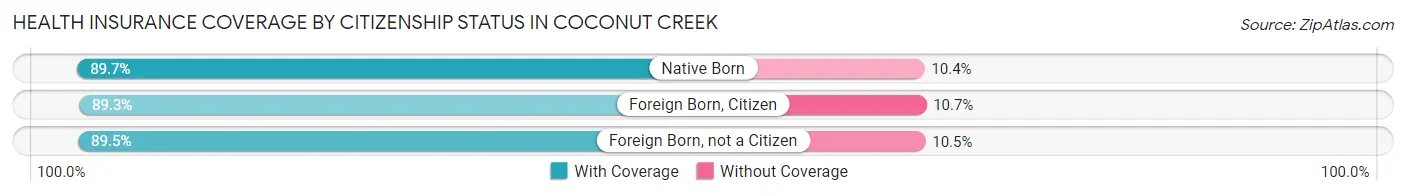
| Citizenship Status | With Coverage | Without Coverage |
| Native Born | 3,473 (89.6%) | 401 (10.3%) |
| Foreign Born, Citizen | 7,861 (89.3%) | 941 (10.7%) |
| Foreign Born, not a Citizen | 3,260 (89.5%) | 383 (10.5%) |
Health Insurance Coverage by Household Income in Coconut Creek
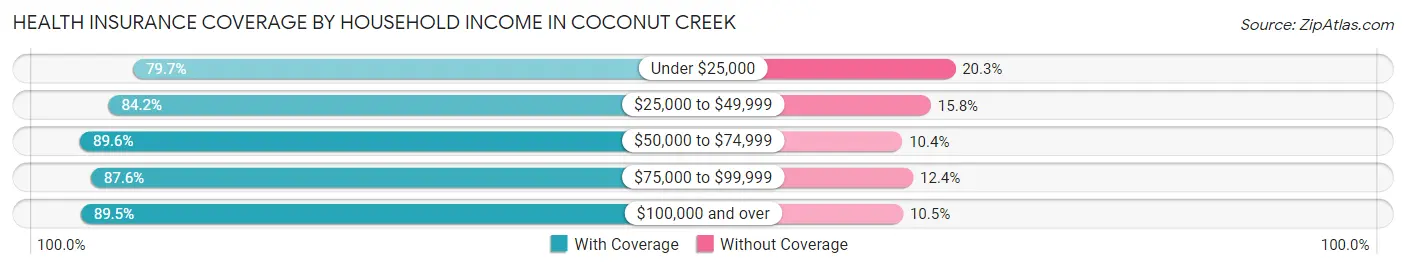
| Household Income | With Coverage | Without Coverage |
| Under $25,000 | 4,159 (79.7%) | 1,060 (20.3%) |
| $25,000 to $49,999 | 8,010 (84.2%) | 1,498 (15.8%) |
| $50,000 to $74,999 | 8,156 (89.6%) | 946 (10.4%) |
| $75,000 to $99,999 | 7,543 (87.6%) | 1,071 (12.4%) |
| $100,000 and over | 22,252 (89.5%) | 2,620 (10.5%) |
Public vs Private Health Insurance Coverage by Age in Coconut Creek
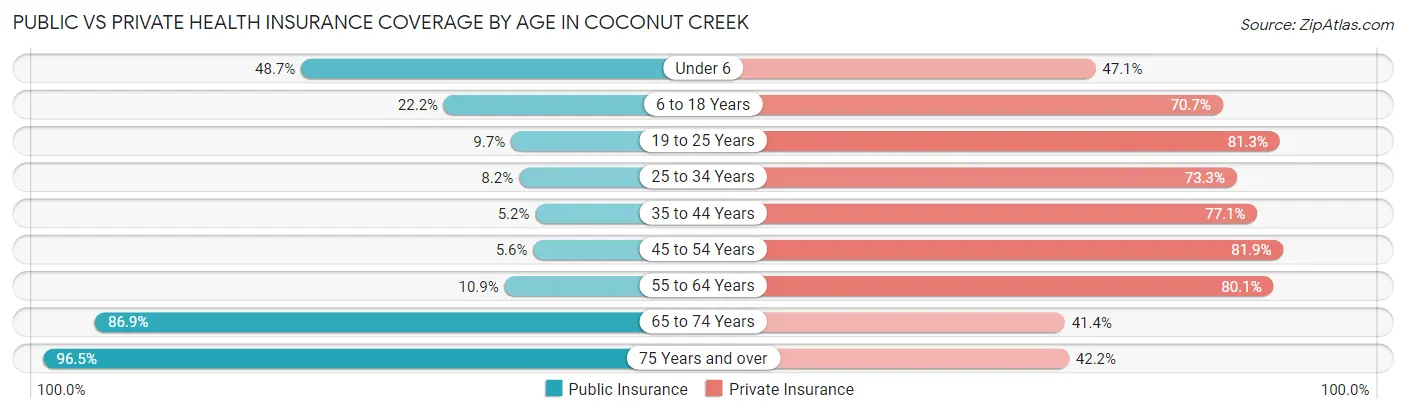
| Age Bracket | Public Insurance | Private Insurance |
| Under 6 | 1,886 (48.7%) | 1,823 (47.1%) |
| 6 to 18 Years | 1,951 (22.2%) | 6,222 (70.7%) |
| 19 to 25 Years | 354 (9.7%) | 2,961 (81.3%) |
| 25 to 34 Years | 574 (8.2%) | 5,114 (73.3%) |
| 35 to 44 Years | 400 (5.2%) | 5,934 (77.1%) |
| 45 to 54 Years | 437 (5.6%) | 6,422 (81.9%) |
| 55 to 64 Years | 841 (10.9%) | 6,175 (80.1%) |
| 65 to 74 Years | 4,719 (86.9%) | 2,247 (41.4%) |
| 75 Years and over | 5,173 (96.5%) | 2,260 (42.1%) |
| Total | 16,335 (28.5%) | 39,158 (68.3%) |
Disability Status by Sex by Age in Coconut Creek
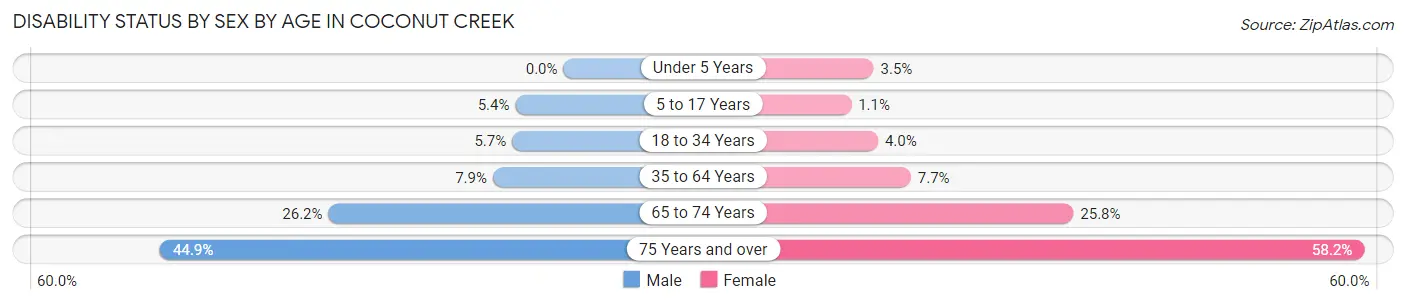
| Age Bracket | Male | Female |
| Under 5 Years | 0 (0.0%) | 60 (3.5%) |
| 5 to 17 Years | 228 (5.3%) | 43 (1.1%) |
| 18 to 34 Years | 348 (5.7%) | 219 (4.0%) |
| 35 to 64 Years | 859 (7.9%) | 946 (7.7%) |
| 65 to 74 Years | 600 (26.2%) | 809 (25.8%) |
| 75 Years and over | 919 (44.9%) | 1,929 (58.2%) |
Disability Class by Sex by Age in Coconut Creek
Disability Class: Hearing Difficulty
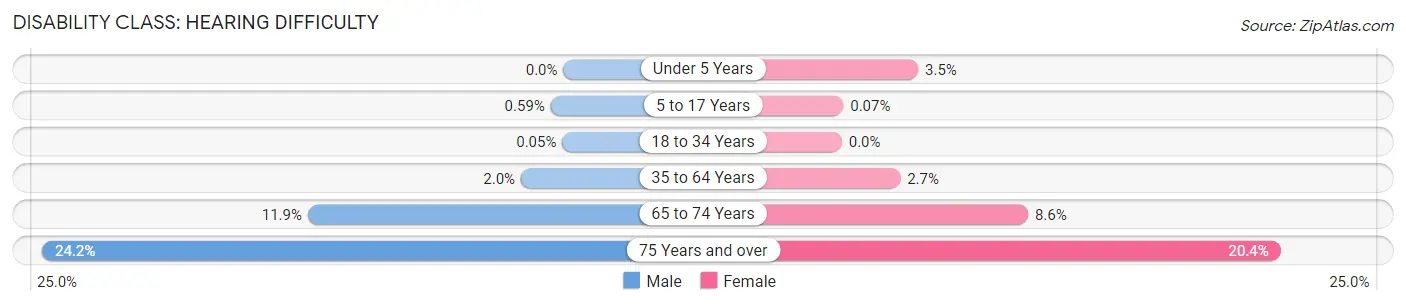
| Age Bracket | Male | Female |
| Under 5 Years | 0 (0.0%) | 60 (3.5%) |
| 5 to 17 Years | 25 (0.6%) | 3 (0.1%) |
| 18 to 34 Years | 3 (0.1%) | 0 (0.0%) |
| 35 to 64 Years | 215 (2.0%) | 333 (2.7%) |
| 65 to 74 Years | 272 (11.9%) | 271 (8.6%) |
| 75 Years and over | 495 (24.2%) | 675 (20.4%) |
Disability Class: Vision Difficulty
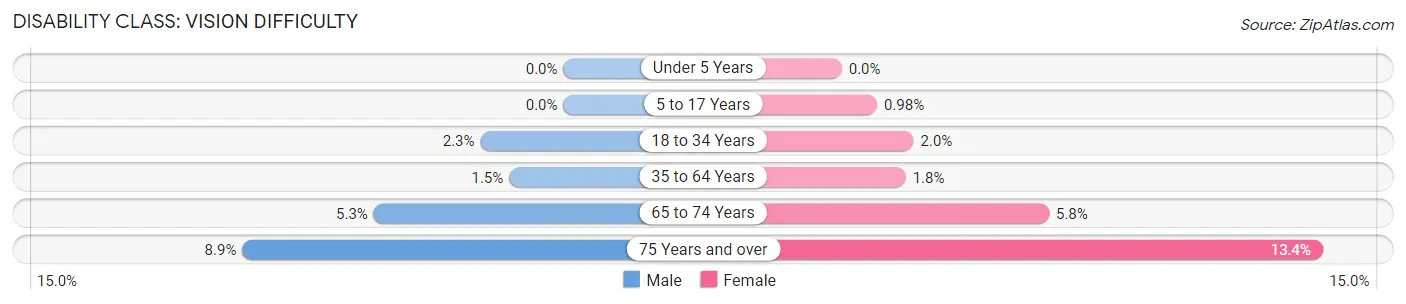
| Age Bracket | Male | Female |
| Under 5 Years | 0 (0.0%) | 0 (0.0%) |
| 5 to 17 Years | 0 (0.0%) | 40 (1.0%) |
| 18 to 34 Years | 141 (2.3%) | 109 (2.0%) |
| 35 to 64 Years | 165 (1.5%) | 219 (1.8%) |
| 65 to 74 Years | 121 (5.3%) | 181 (5.8%) |
| 75 Years and over | 183 (8.9%) | 444 (13.4%) |
Disability Class: Cognitive Difficulty
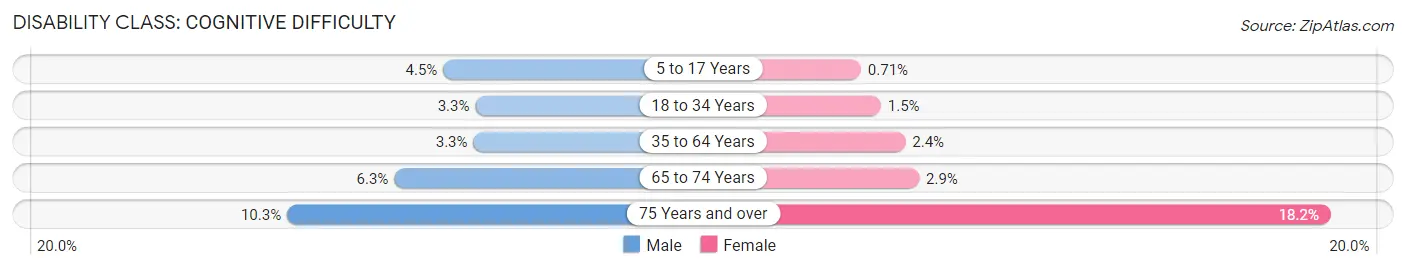
| Age Bracket | Male | Female |
| 5 to 17 Years | 190 (4.5%) | 29 (0.7%) |
| 18 to 34 Years | 199 (3.3%) | 79 (1.5%) |
| 35 to 64 Years | 365 (3.3%) | 290 (2.4%) |
| 65 to 74 Years | 144 (6.3%) | 90 (2.9%) |
| 75 Years and over | 210 (10.3%) | 602 (18.1%) |
Disability Class: Ambulatory Difficulty
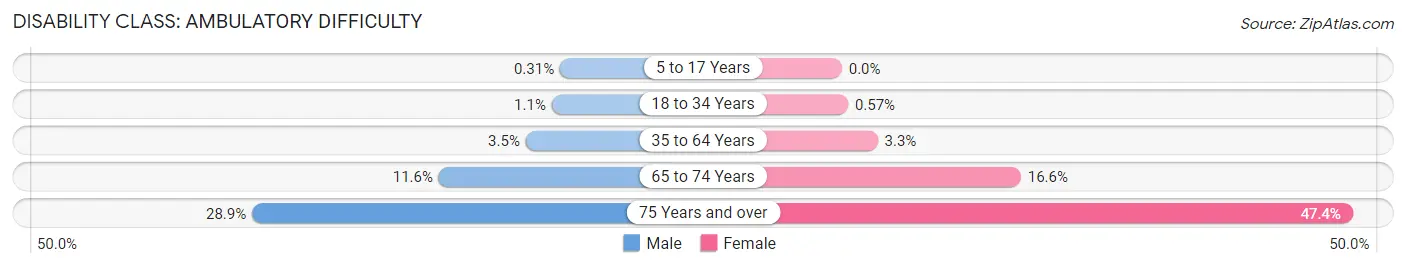
| Age Bracket | Male | Female |
| 5 to 17 Years | 13 (0.3%) | 0 (0.0%) |
| 18 to 34 Years | 66 (1.1%) | 31 (0.6%) |
| 35 to 64 Years | 381 (3.5%) | 408 (3.3%) |
| 65 to 74 Years | 265 (11.6%) | 521 (16.6%) |
| 75 Years and over | 591 (28.9%) | 1,572 (47.4%) |
Disability Class: Self-Care Difficulty
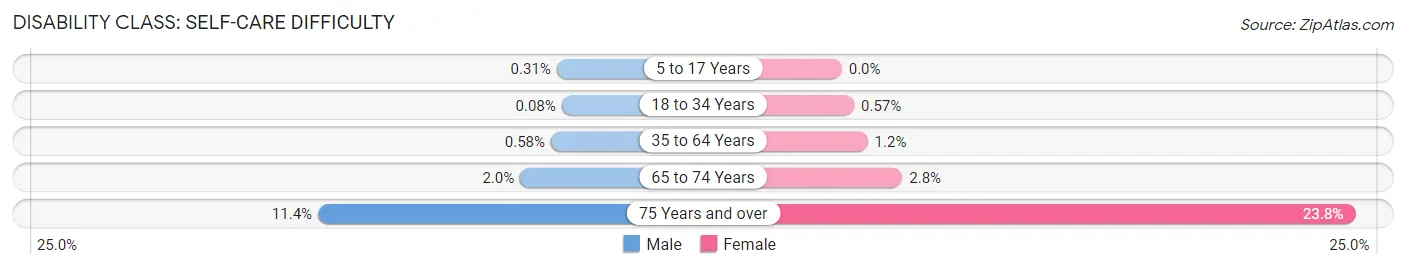
| Age Bracket | Male | Female |
| 5 to 17 Years | 13 (0.3%) | 0 (0.0%) |
| 18 to 34 Years | 5 (0.1%) | 31 (0.6%) |
| 35 to 64 Years | 63 (0.6%) | 148 (1.2%) |
| 65 to 74 Years | 46 (2.0%) | 88 (2.8%) |
| 75 Years and over | 233 (11.4%) | 790 (23.8%) |
Technology Access in Coconut Creek
Computing Device Access in Coconut Creek
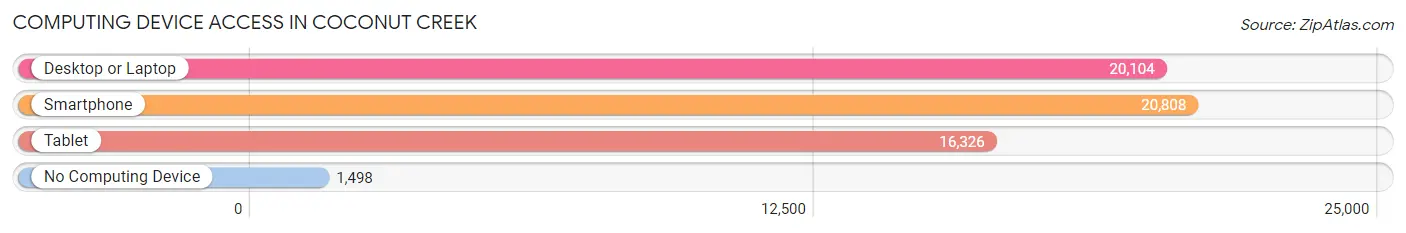
| Device Type | # Households | % Households |
| Desktop or Laptop | 20,104 | 84.8% |
| Smartphone | 20,808 | 87.8% |
| Tablet | 16,326 | 68.9% |
| No Computing Device | 1,498 | 6.3% |
| Total | 23,696 | 100.0% |
Internet Access in Coconut Creek
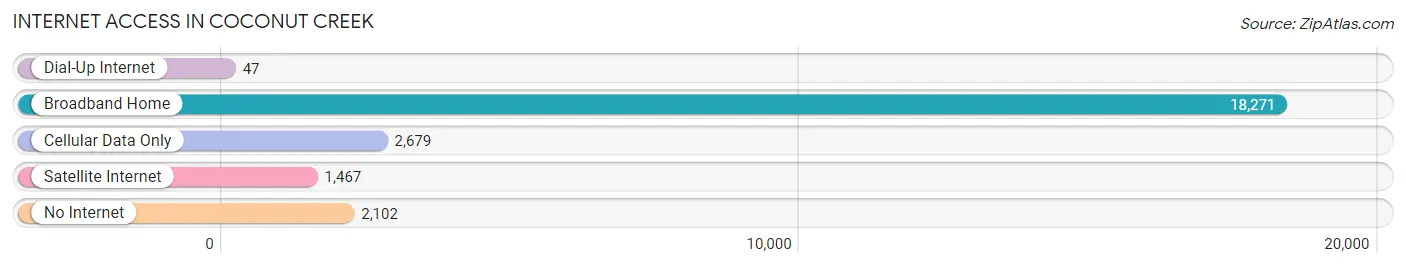
| Internet Type | # Households | % Households |
| Dial-Up Internet | 47 | 0.2% |
| Broadband Home | 18,271 | 77.1% |
| Cellular Data Only | 2,679 | 11.3% |
| Satellite Internet | 1,467 | 6.2% |
| No Internet | 2,102 | 8.9% |
| Total | 23,696 | 100.0% |
Coconut Creek Summary
Coconut Creek is a city located in Broward County, Florida, United States. It had a population of 54,593 at the 2010 census. It is part of the Miami metropolitan area, which was home to an estimated 6,012,331 people in 2015.
Geography
Coconut Creek is located at 26°17'N 80°12'W (26.28, -80.20). According to the United States Census Bureau, the city has a total area of 11.4 square miles (29.6 km2), of which 11.3 square miles (29.4 km2) is land and 0.1 square miles (0.2 km2) (0.87%) is water.
The city is bordered by the cities of Margate, Coral Springs, and Parkland to the north, Pompano Beach to the east, and Tamarac to the south.
History
Coconut Creek was founded in 1955 by a group of developers led by Robert E. Bateman. The city was named after the many coconut trees that were planted in the area by early settlers.
The city was incorporated in 1967 and has grown steadily since then. In the 1970s, the city began to develop its own identity, with the construction of the Promenade at Coconut Creek, a shopping center that features a variety of stores and restaurants.
In the 1980s, the city continued to grow, with the construction of the Coconut Creek Casino, which opened in 1995. The casino has become a major source of revenue for the city, and has helped to spur further development in the area.
Economy
Coconut Creek is home to a variety of businesses, including retail stores, restaurants, and professional services. The city is also home to the Seminole Casino Coconut Creek, which is one of the largest employers in the city.
The city is also home to a number of corporate headquarters, including JM Family Enterprises, Inc., a Fortune 500 company that is the largest independent distributor of Toyota vehicles in the United States.
Demographics
As of the 2010 census, there were 54,593 people, 20,890 households, and 14,845 families residing in the city. The population density was 4,811.3 people per square mile (1,859.2/km2). There were 22,890 housing units at an average density of 2,019.3 per square mile (779.2/km2). The racial makeup of the city was 68.2% White (non-Hispanic), 16.2% African American, 0.3% Native American, 4.2% Asian, 0.1% Pacific Islander, 7.3% from other races, and 3.8% from two or more races. Hispanic or Latino of any race were 24.2% of the population.
The median income for a household in the city was $45,945, and the median income for a family was $51,890. Males had a median income of $36,813 versus $30,917 for females. The per capita income for the city was $22,845. About 6.7% of families and 8.9% of the population were below the poverty line, including 11.2% of those under age 18 and 8.2% of those age 65 or over.
Coconut Creek is served by the Broward County Public Schools system. The city is home to two public high schools, Coconut Creek High School and Monarch High School. The city is also home to a number of private schools, including St. Andrew's Catholic School and the American Heritage School.
Common Questions
What is Per Capita Income in Coconut Creek?
Per Capita income in Coconut Creek is $45,657.
What is the Median Family Income in Coconut Creek?
Median Family Income in Coconut Creek is $91,612.
What is the Median Household income in Coconut Creek?
Median Household Income in Coconut Creek is $72,740.
What is Income or Wage Gap in Coconut Creek?
Income or Wage Gap in Coconut Creek is 20.8%.
Women in Coconut Creek earn 79.2 cents for every dollar earned by a man.
What is Family Income Deficit in Coconut Creek?
Family Income Deficit in Coconut Creek is $13,322.
Families that are below poverty line in Coconut Creek earn $13,322 less on average than the poverty threshold level.
What is Inequality or Gini Index in Coconut Creek?
Inequality or Gini Index in Coconut Creek is 0.52.
What is the Total Population of Coconut Creek?
Total Population of Coconut Creek is 57,574.
What is the Total Male Population of Coconut Creek?
Total Male Population of Coconut Creek is 27,492.
What is the Total Female Population of Coconut Creek?
Total Female Population of Coconut Creek is 30,082.
What is the Ratio of Males per 100 Females in Coconut Creek?
There are 91.39 Males per 100 Females in Coconut Creek.
What is the Ratio of Females per 100 Males in Coconut Creek?
There are 109.42 Females per 100 Males in Coconut Creek.
What is the Median Population Age in Coconut Creek?
Median Population Age in Coconut Creek is 42.4 Years.
What is the Average Family Size in Coconut Creek
Average Family Size in Coconut Creek is 3.2 People.
What is the Average Household Size in Coconut Creek
Average Household Size in Coconut Creek is 2.4 People.
How Large is the Labor Force in Coconut Creek?
There are 31,514 People in the Labor Forcein in Coconut Creek.
What is the Percentage of People in the Labor Force in Coconut Creek?
66.7% of People are in the Labor Force in Coconut Creek.
What is the Unemployment Rate in Coconut Creek?
Unemployment Rate in Coconut Creek is 4.8%.