Kissimmee, FL Map & Demographics
Kissimmee Map
Kissimmee Overview
$22,769
PER CAPITA INCOME
$51,078
AVG FAMILY INCOME
$45,319
AVG HOUSEHOLD INCOME
19.9%
WAGE / INCOME GAP [ % ]
80.1¢/ $1
WAGE / INCOME GAP [ $ ]
$11,095
FAMILY INCOME DEFICIT
0.45
INEQUALITY / GINI INDEX
78,478
TOTAL POPULATION
39,559
MALE POPULATION
38,919
FEMALE POPULATION
101.64
MALES / 100 FEMALES
98.38
FEMALES / 100 MALES
35.7
MEDIAN AGE
3.9
AVG FAMILY SIZE
3.2
AVG HOUSEHOLD SIZE
40,104
LABOR FORCE [ PEOPLE ]
64.6%
PERCENT IN LABOR FORCE
6.6%
UNEMPLOYMENT RATE
Income in Kissimmee
Income Overview in Kissimmee
Per Capita Income in Kissimmee is $22,769, while median incomes of families and households are $51,078 and $45,319 respectively.
| Characteristic | Number | Measure |
| Per Capita Income | 78,478 | $22,769 |
| Median Family Income | 16,543 | $51,078 |
| Mean Family Income | 16,543 | $65,577 |
| Median Household Income | 24,291 | $45,319 |
| Mean Household Income | 24,291 | $61,487 |
| Income Deficit | 16,543 | $11,095 |
| Wage / Income Gap (%) | 78,478 | 19.93% |
| Wage / Income Gap ($) | 78,478 | 80.07¢ per $1 |
| Gini / Inequality Index | 78,478 | 0.45 |
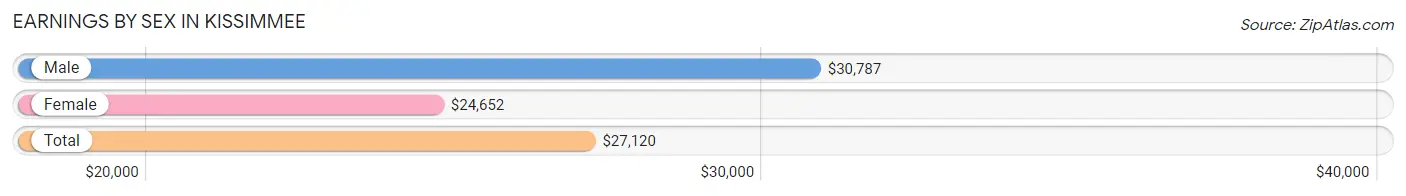
Earnings by Sex in Kissimmee
Average Earnings in Kissimmee are $27,120, $30,787 for men and $24,652 for women, a difference of 19.9%.
| Sex | Number | Average Earnings |
| Male | 20,998 (52.1%) | $30,787 |
| Female | 19,264 (47.8%) | $24,652 |
| Total | 40,262 (100.0%) | $27,120 |
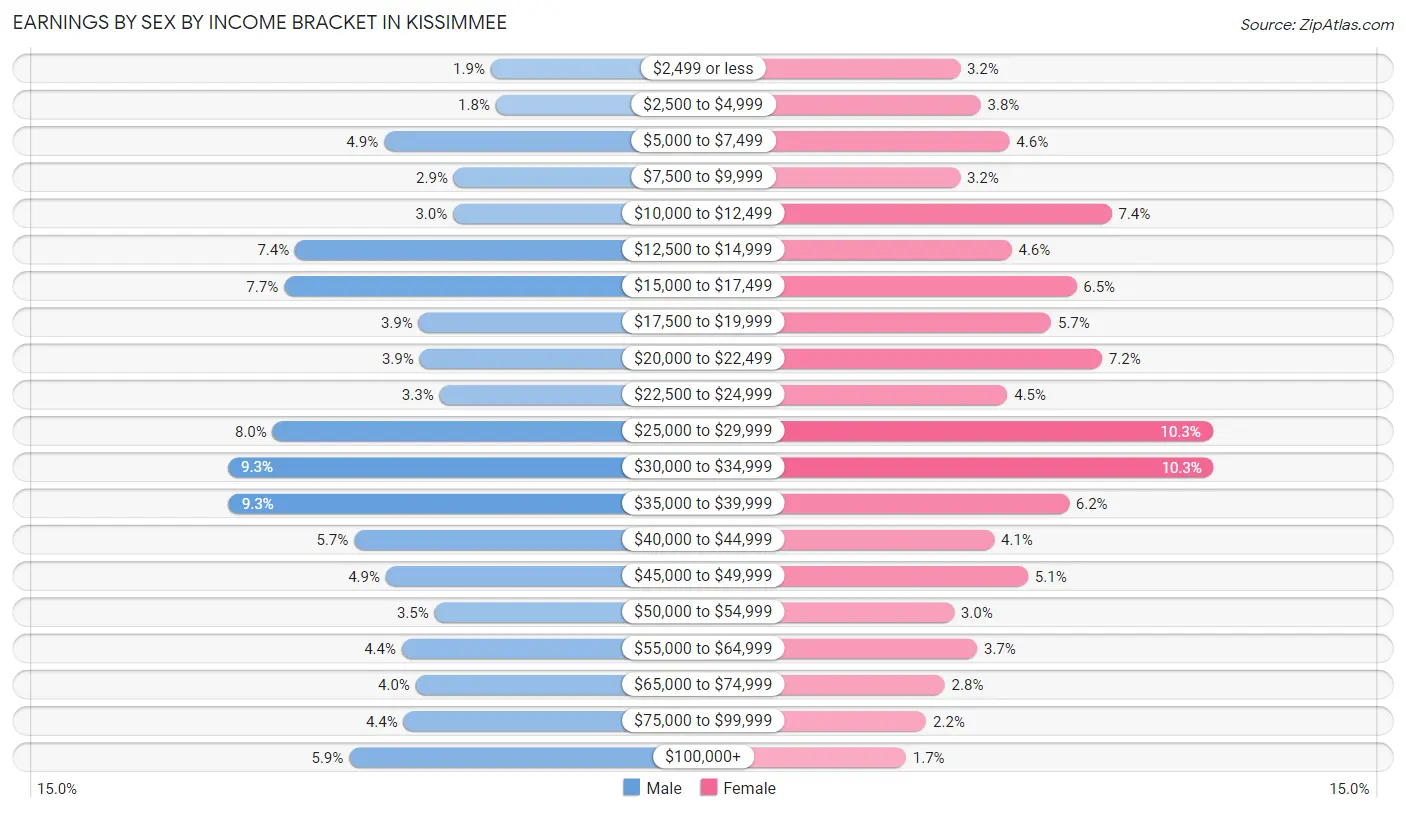
Earnings by Sex by Income Bracket in Kissimmee
The most common earnings brackets in Kissimmee are $30,000 to $34,999 for men (1,949 | 9.3%) and $30,000 to $34,999 for women (1,987 | 10.3%).
| Income | Male | Female |
| $2,499 or less | 399 (1.9%) | 612 (3.2%) |
| $2,500 to $4,999 | 369 (1.8%) | 725 (3.8%) |
| $5,000 to $7,499 | 1,028 (4.9%) | 880 (4.6%) |
| $7,500 to $9,999 | 617 (2.9%) | 612 (3.2%) |
| $10,000 to $12,499 | 621 (3.0%) | 1,434 (7.4%) |
| $12,500 to $14,999 | 1,554 (7.4%) | 891 (4.6%) |
| $15,000 to $17,499 | 1,618 (7.7%) | 1,243 (6.5%) |
| $17,500 to $19,999 | 825 (3.9%) | 1,105 (5.7%) |
| $20,000 to $22,499 | 818 (3.9%) | 1,382 (7.2%) |
| $22,500 to $24,999 | 701 (3.3%) | 869 (4.5%) |
| $25,000 to $29,999 | 1,687 (8.0%) | 1,980 (10.3%) |
| $30,000 to $34,999 | 1,949 (9.3%) | 1,987 (10.3%) |
| $35,000 to $39,999 | 1,945 (9.3%) | 1,203 (6.2%) |
| $40,000 to $44,999 | 1,206 (5.7%) | 798 (4.1%) |
| $45,000 to $49,999 | 1,018 (4.9%) | 981 (5.1%) |
| $50,000 to $54,999 | 731 (3.5%) | 579 (3.0%) |
| $55,000 to $64,999 | 923 (4.4%) | 706 (3.7%) |
| $65,000 to $74,999 | 841 (4.0%) | 529 (2.8%) |
| $75,000 to $99,999 | 914 (4.3%) | 429 (2.2%) |
| $100,000+ | 1,234 (5.9%) | 319 (1.7%) |
| Total | 20,998 (100.0%) | 19,264 (100.0%) |
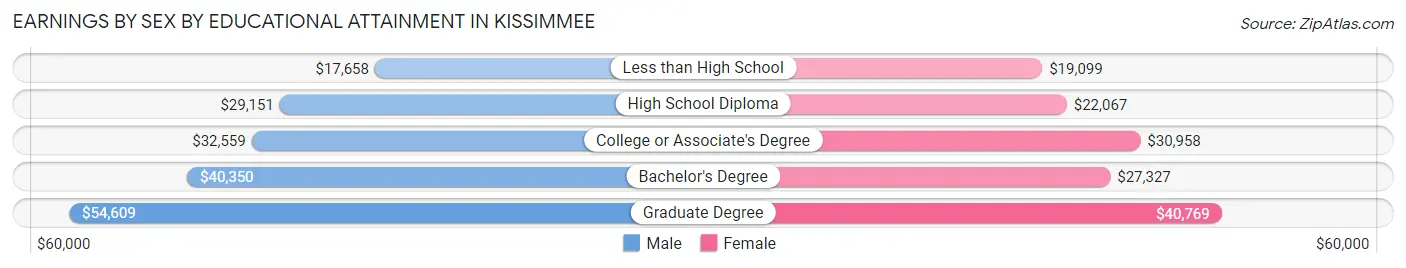
Earnings by Sex by Educational Attainment in Kissimmee
Average earnings in Kissimmee are $32,535 for men and $26,856 for women, a difference of 17.5%. Men with an educational attainment of graduate degree enjoy the highest average annual earnings of $54,609, while those with less than high school education earn the least with $17,658. Women with an educational attainment of graduate degree earn the most with the average annual earnings of $40,769, while those with less than high school education have the smallest earnings of $19,099.
| Educational Attainment | Male Income | Female Income |
| Less than High School | $17,658 | $19,099 |
| High School Diploma | $29,151 | $22,067 |
| College or Associate's Degree | $32,559 | $30,958 |
| Bachelor's Degree | $40,350 | $27,327 |
| Graduate Degree | $54,609 | $40,769 |
| Total | $32,535 | $26,856 |
Family Income in Kissimmee
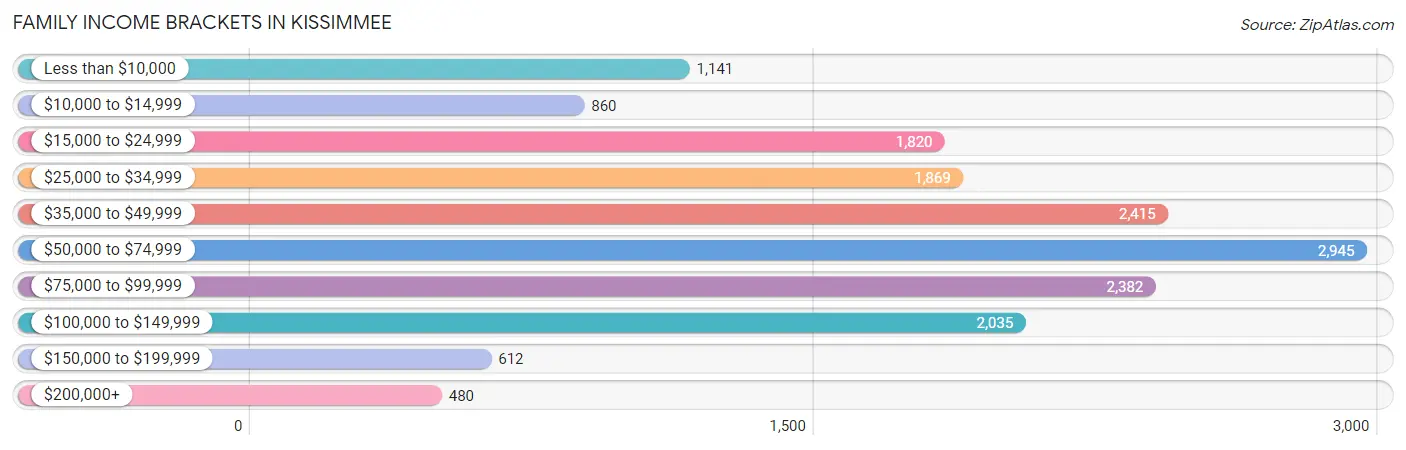
Family Income Brackets in Kissimmee
According to the Kissimmee family income data, there are 2,945 families falling into the $50,000 to $74,999 income range, which is the most common income bracket and makes up 17.8% of all families. Conversely, the $200,000+ income bracket is the least frequent group with only 480 families (2.9%) belonging to this category.
| Income Bracket | # Families | % Families |
| Less than $10,000 | 1,141 | 6.9% |
| $10,000 to $14,999 | 860 | 5.2% |
| $15,000 to $24,999 | 1,820 | 11.0% |
| $25,000 to $34,999 | 1,869 | 11.3% |
| $35,000 to $49,999 | 2,415 | 14.6% |
| $50,000 to $74,999 | 2,945 | 17.8% |
| $75,000 to $99,999 | 2,382 | 14.4% |
| $100,000 to $149,999 | 2,035 | 12.3% |
| $150,000 to $199,999 | 612 | 3.7% |
| $200,000+ | 480 | 2.9% |
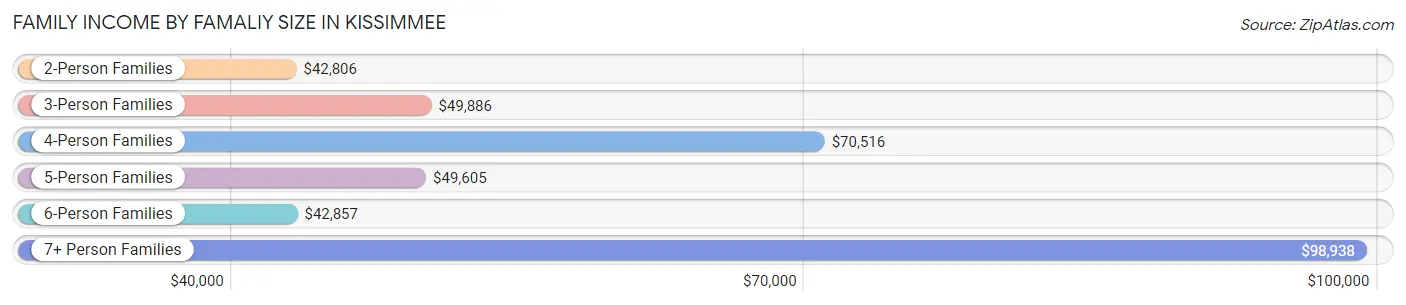
Family Income by Famaliy Size in Kissimmee
7+ person families (149 | 0.9%) account for the highest median family income in Kissimmee with $98,938 per family, while 2-person families (6,899 | 41.7%) have the highest median income of $21,403 per family member.
| Income Bracket | # Families | Median Income |
| 2-Person Families | 6,899 (41.7%) | $42,806 |
| 3-Person Families | 3,965 (24.0%) | $49,886 |
| 4-Person Families | 3,176 (19.2%) | $70,516 |
| 5-Person Families | 1,870 (11.3%) | $49,605 |
| 6-Person Families | 484 (2.9%) | $42,857 |
| 7+ Person Families | 149 (0.9%) | $98,938 |
| Total | 16,543 (100.0%) | $51,078 |
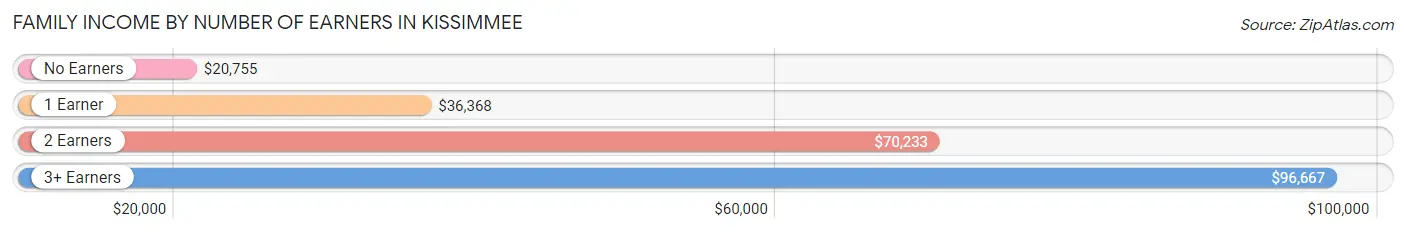
Family Income by Number of Earners in Kissimmee
The median family income in Kissimmee is $51,078, with families comprising 3+ earners (2,192) having the highest median family income of $96,667, while families with no earners (2,419) have the lowest median family income of $20,755, accounting for 13.3% and 14.6% of families, respectively.
| Number of Earners | # Families | Median Income |
| No Earners | 2,419 (14.6%) | $20,755 |
| 1 Earner | 6,540 (39.5%) | $36,368 |
| 2 Earners | 5,392 (32.6%) | $70,233 |
| 3+ Earners | 2,192 (13.3%) | $96,667 |
| Total | 16,543 (100.0%) | $51,078 |
Household Income in Kissimmee
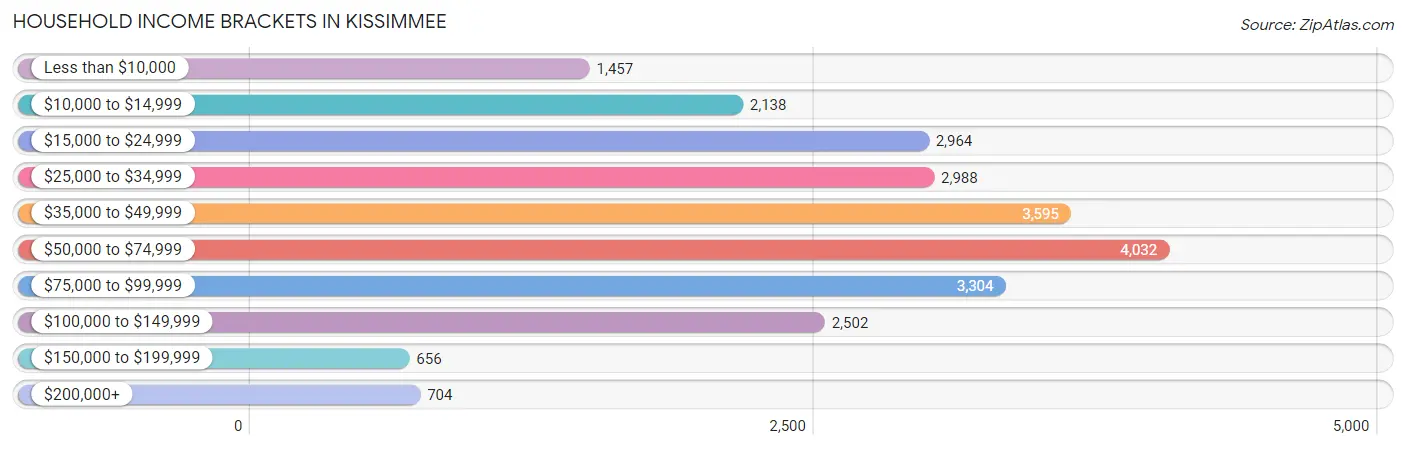
Household Income Brackets in Kissimmee
With 4,032 households falling in the category, the $50,000 to $74,999 income range is the most frequent in Kissimmee, accounting for 16.6% of all households. In contrast, only 656 households (2.7%) fall into the $150,000 to $199,999 income bracket, making it the least populous group.
| Income Bracket | # Households | % Households |
| Less than $10,000 | 1,457 | 6.0% |
| $10,000 to $14,999 | 2,138 | 8.8% |
| $15,000 to $24,999 | 2,964 | 12.2% |
| $25,000 to $34,999 | 2,988 | 12.3% |
| $35,000 to $49,999 | 3,595 | 14.8% |
| $50,000 to $74,999 | 4,032 | 16.6% |
| $75,000 to $99,999 | 3,304 | 13.6% |
| $100,000 to $149,999 | 2,502 | 10.3% |
| $150,000 to $199,999 | 656 | 2.7% |
| $200,000+ | 704 | 2.9% |
Household Income by Householder Age in Kissimmee
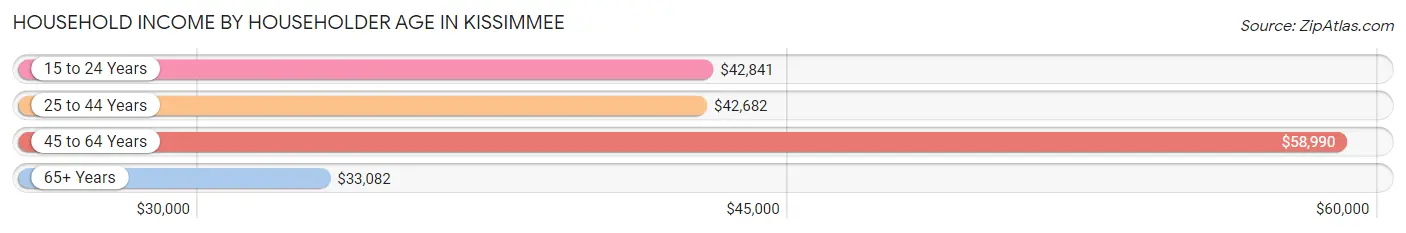
The median household income in Kissimmee is $45,319, with the highest median household income of $58,990 found in the 45 to 64 years age bracket for the primary householder. A total of 8,259 households (34.0%) fall into this category. Meanwhile, the 65+ years age bracket for the primary householder has the lowest median household income of $33,082, with 5,017 households (20.6%) in this group.
| Income Bracket | # Households | Median Income |
| 15 to 24 Years | 665 (2.7%) | $42,841 |
| 25 to 44 Years | 10,350 (42.6%) | $42,682 |
| 45 to 64 Years | 8,259 (34.0%) | $58,990 |
| 65+ Years | 5,017 (20.6%) | $33,082 |
| Total | 24,291 (100.0%) | $45,319 |
Poverty in Kissimmee
Income Below Poverty by Sex and Age in Kissimmee
With 25.4% poverty level for males and 26.5% for females among the residents of Kissimmee, 5 year old males and 12 to 14 year old females are the most vulnerable to poverty, with 382 males (56.3%) and 890 females (49.5%) in their respective age groups living below the poverty level.
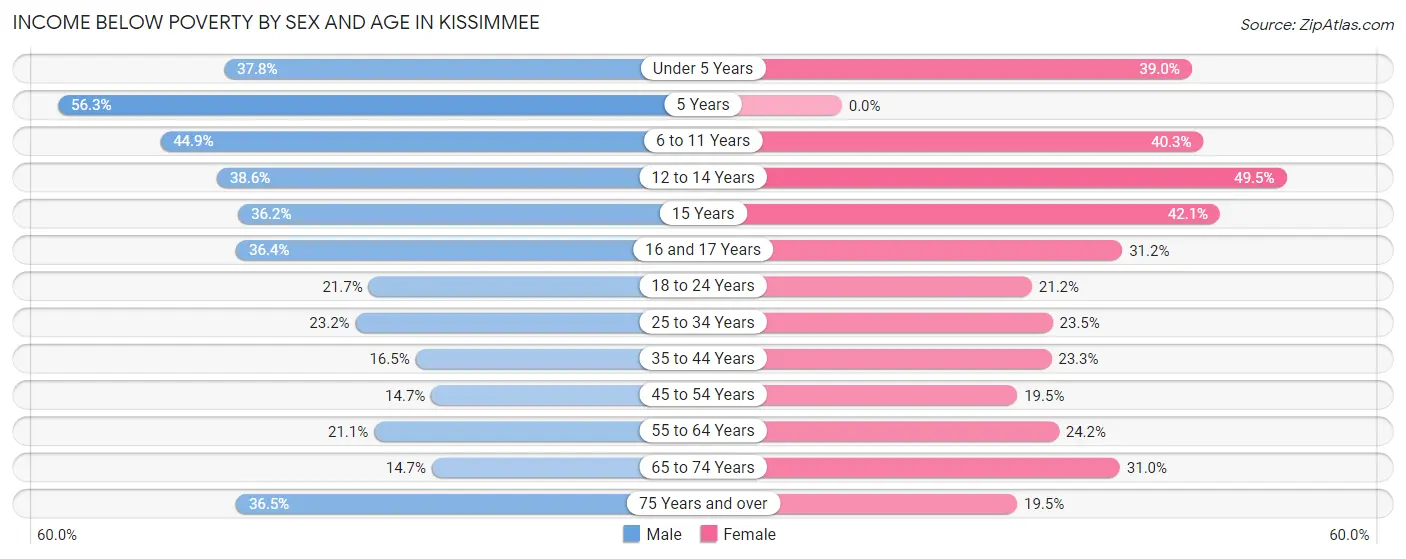
| Age Bracket | Male | Female |
| Under 5 Years | 927 (37.8%) | 872 (39.0%) |
| 5 Years | 382 (56.3%) | 0 (0.0%) |
| 6 to 11 Years | 1,537 (44.9%) | 880 (40.3%) |
| 12 to 14 Years | 765 (38.6%) | 890 (49.5%) |
| 15 Years | 163 (36.2%) | 224 (42.1%) |
| 16 and 17 Years | 328 (36.4%) | 347 (31.2%) |
| 18 to 24 Years | 861 (21.7%) | 768 (21.2%) |
| 25 to 34 Years | 1,518 (23.2%) | 1,252 (23.5%) |
| 35 to 44 Years | 1,016 (16.5%) | 1,552 (23.3%) |
| 45 to 54 Years | 634 (14.7%) | 937 (19.5%) |
| 55 to 64 Years | 787 (21.1%) | 1,135 (24.2%) |
| 65 to 74 Years | 401 (14.6%) | 920 (31.0%) |
| 75 Years and over | 575 (36.5%) | 435 (19.5%) |
| Total | 9,894 (25.4%) | 10,212 (26.5%) |
Income Above Poverty by Sex and Age in Kissimmee
According to the poverty statistics in Kissimmee, males aged 65 to 74 years and females aged 5 years are the age groups that are most secure financially, with 85.4% of males and 100.0% of females in these age groups living above the poverty line.
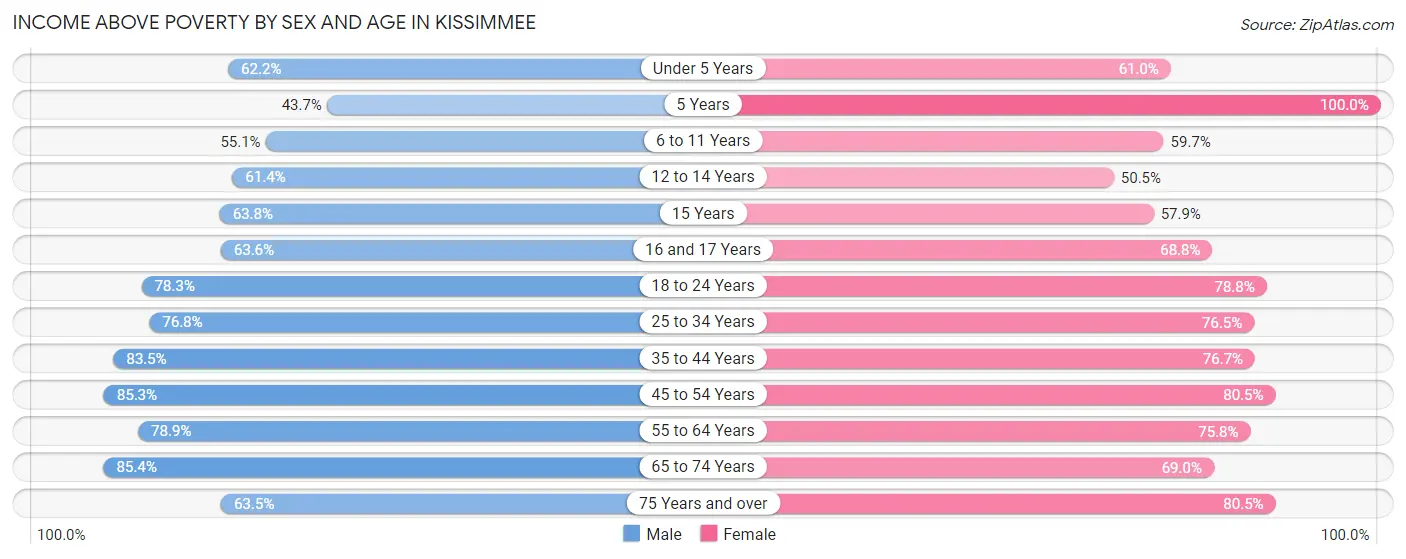
| Age Bracket | Male | Female |
| Under 5 Years | 1,527 (62.2%) | 1,366 (61.0%) |
| 5 Years | 297 (43.7%) | 360 (100.0%) |
| 6 to 11 Years | 1,887 (55.1%) | 1,306 (59.7%) |
| 12 to 14 Years | 1,218 (61.4%) | 908 (50.5%) |
| 15 Years | 287 (63.8%) | 308 (57.9%) |
| 16 and 17 Years | 572 (63.6%) | 764 (68.8%) |
| 18 to 24 Years | 3,106 (78.3%) | 2,860 (78.8%) |
| 25 to 34 Years | 5,036 (76.8%) | 4,081 (76.5%) |
| 35 to 44 Years | 5,154 (83.5%) | 5,099 (76.7%) |
| 45 to 54 Years | 3,672 (85.3%) | 3,858 (80.5%) |
| 55 to 64 Years | 2,947 (78.9%) | 3,560 (75.8%) |
| 65 to 74 Years | 2,337 (85.4%) | 2,051 (69.0%) |
| 75 Years and over | 1,002 (63.5%) | 1,793 (80.5%) |
| Total | 29,042 (74.6%) | 28,314 (73.5%) |
Income Below Poverty Among Married-Couple Families in Kissimmee
The poverty statistics for married-couple families in Kissimmee show that 15.6% or 1,561 of the total 10,004 families live below the poverty line. Families with 3 or 4 children have the highest poverty rate of 29.5%, comprising of 213 families. On the other hand, families with 5 or more children have the lowest poverty rate of 0.0%, which includes 0 families.
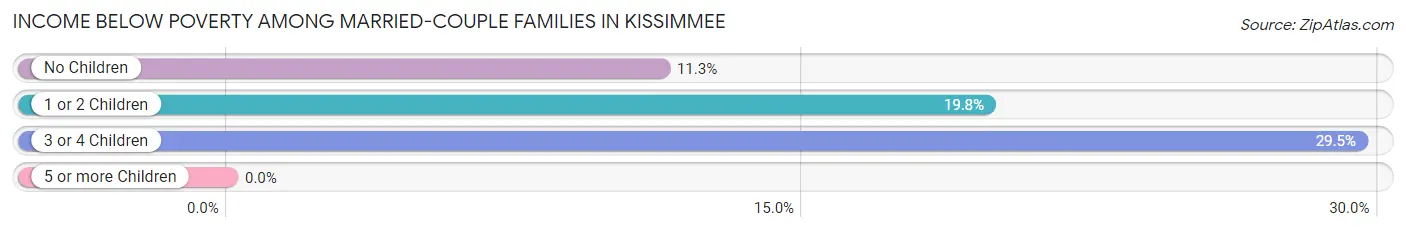
| Children | Above Poverty | Below Poverty |
| No Children | 5,056 (88.7%) | 643 (11.3%) |
| 1 or 2 Children | 2,858 (80.2%) | 705 (19.8%) |
| 3 or 4 Children | 509 (70.5%) | 213 (29.5%) |
| 5 or more Children | 20 (100.0%) | 0 (0.0%) |
| Total | 8,443 (84.4%) | 1,561 (15.6%) |
Income Below Poverty Among Single-Parent Households in Kissimmee
According to the poverty data in Kissimmee, 30.2% or 386 single-father households and 33.4% or 1,756 single-mother households are living below the poverty line. Among single-father households, those with 3 or 4 children have the highest poverty rate, with 31 households (100.0%) experiencing poverty. Likewise, among single-mother households, those with 3 or 4 children have the highest poverty rate, with 729 households (84.3%) falling below the poverty line.
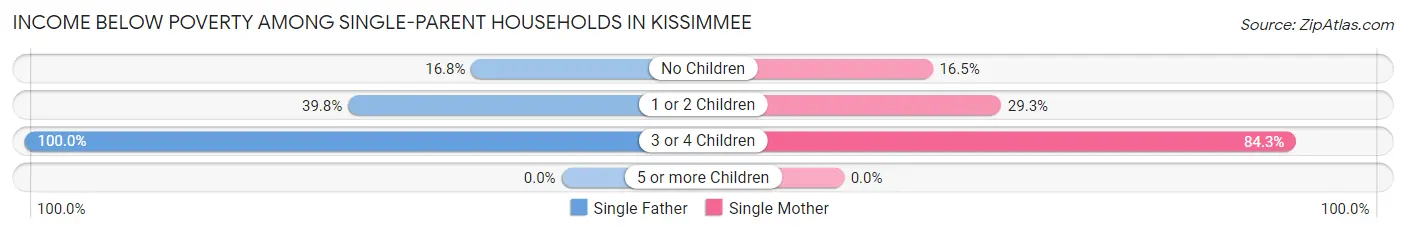
| Children | Single Father | Single Mother |
| No Children | 103 (16.8%) | 338 (16.5%) |
| 1 or 2 Children | 252 (39.8%) | 689 (29.3%) |
| 3 or 4 Children | 31 (100.0%) | 729 (84.3%) |
| 5 or more Children | 0 (0.0%) | 0 (0.0%) |
| Total | 386 (30.2%) | 1,756 (33.4%) |
Income Below Poverty Among Married-Couple vs Single-Parent Households in Kissimmee
The poverty data for Kissimmee shows that 1,561 of the married-couple family households (15.6%) and 2,142 of the single-parent households (32.8%) are living below the poverty level. Within the married-couple family households, those with 3 or 4 children have the highest poverty rate, with 213 households (29.5%) falling below the poverty line. Among the single-parent households, those with 3 or 4 children have the highest poverty rate, with 760 household (84.8%) living below poverty.
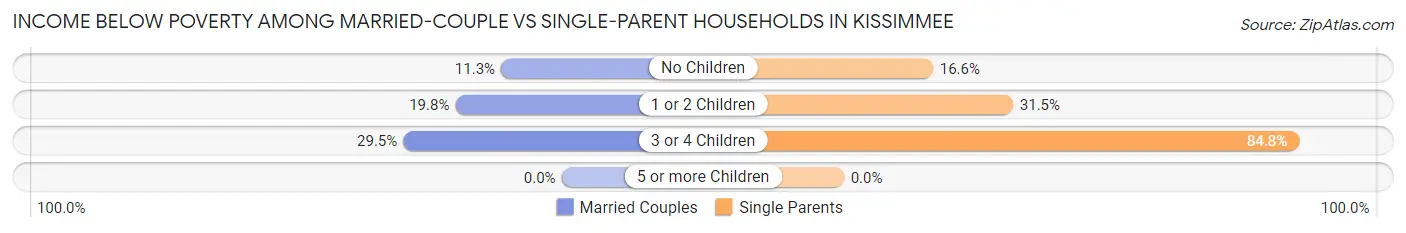
| Children | Married-Couple Families | Single-Parent Households |
| No Children | 643 (11.3%) | 441 (16.6%) |
| 1 or 2 Children | 705 (19.8%) | 941 (31.5%) |
| 3 or 4 Children | 213 (29.5%) | 760 (84.8%) |
| 5 or more Children | 0 (0.0%) | 0 (0.0%) |
| Total | 1,561 (15.6%) | 2,142 (32.8%) |
Race in Kissimmee
The most populous races in Kissimmee are Hispanic or Latino (55,351 | 70.5%), White / Caucasian (31,881 | 40.6%), and Some other Race (21,335 | 27.2%).
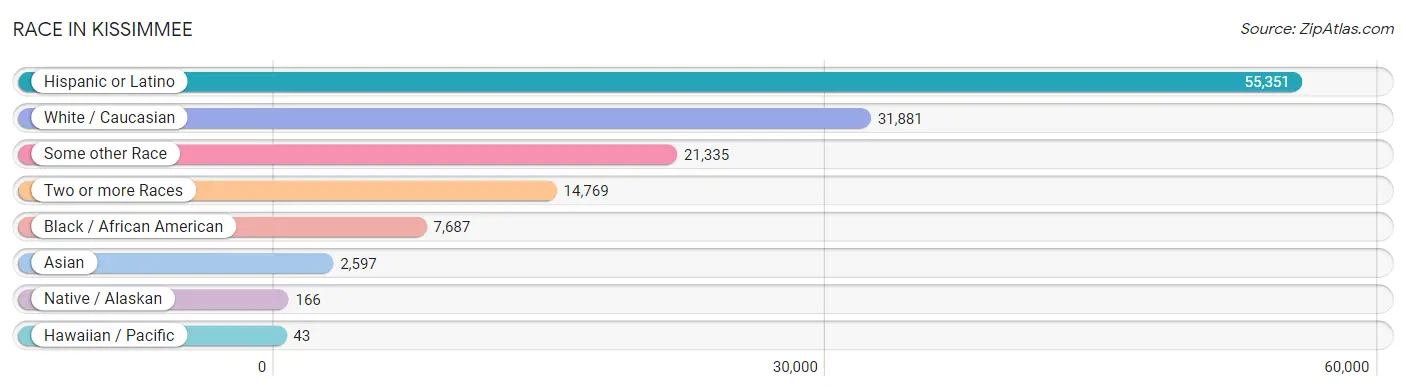
| Race | # Population | % Population |
| Asian | 2,597 | 3.3% |
| Black / African American | 7,687 | 9.8% |
| Hawaiian / Pacific | 43 | 0.1% |
| Hispanic or Latino | 55,351 | 70.5% |
| Native / Alaskan | 166 | 0.2% |
| White / Caucasian | 31,881 | 40.6% |
| Two or more Races | 14,769 | 18.8% |
| Some other Race | 21,335 | 27.2% |
| Total | 78,478 | 100.0% |
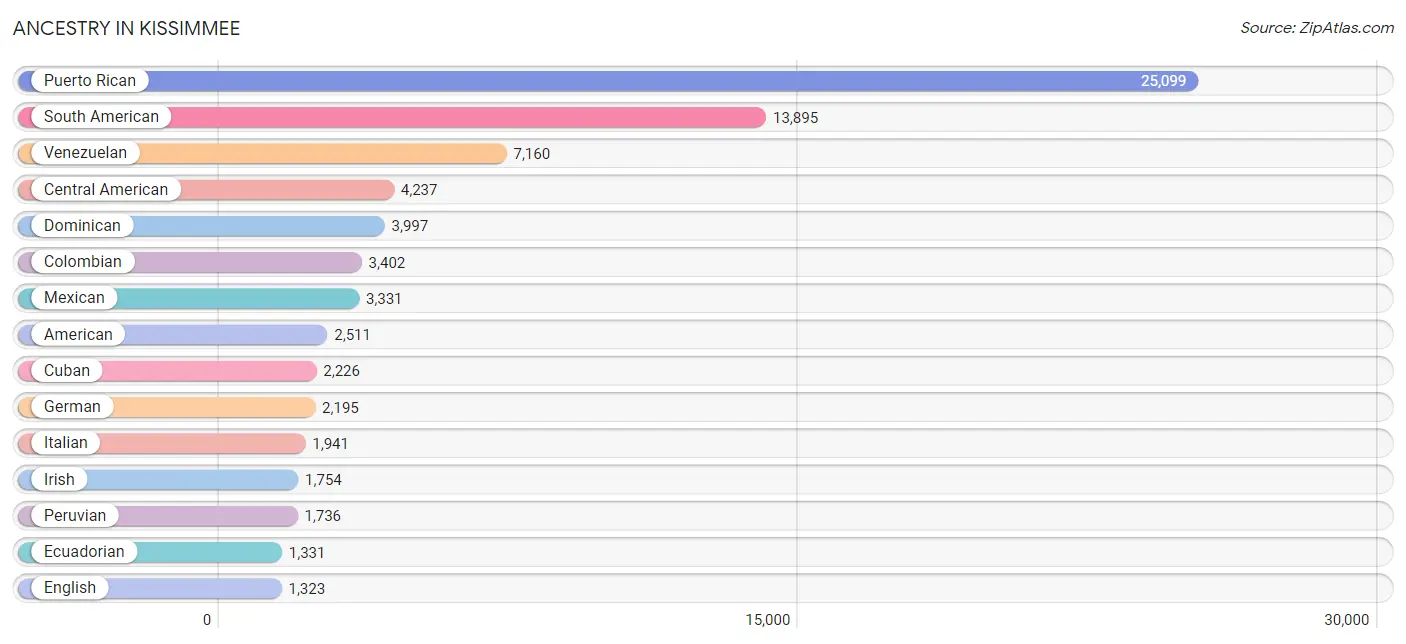
Ancestry in Kissimmee
The most populous ancestries reported in Kissimmee are Puerto Rican (25,099 | 32.0%), South American (13,895 | 17.7%), Venezuelan (7,160 | 9.1%), Central American (4,237 | 5.4%), and Dominican (3,997 | 5.1%), together accounting for 69.3% of all Kissimmee residents.
| Ancestry | # Population | % Population |
| African | 555 | 0.7% |
| American | 2,511 | 3.2% |
| Arab | 984 | 1.3% |
| Argentinean | 29 | 0.0% |
| Australian | 8 | 0.0% |
| Austrian | 138 | 0.2% |
| Bahamian | 12 | 0.0% |
| Bhutanese | 27 | 0.0% |
| Bolivian | 19 | 0.0% |
| Brazilian | 50 | 0.1% |
| British | 93 | 0.1% |
| British West Indian | 110 | 0.1% |
| Burmese | 10 | 0.0% |
| Cajun | 40 | 0.1% |
| Canadian | 42 | 0.1% |
| Cape Verdean | 9 | 0.0% |
| Central American | 4,237 | 5.4% |
| Central American Indian | 220 | 0.3% |
| Cherokee | 20 | 0.0% |
| Chilean | 83 | 0.1% |
| Colombian | 3,402 | 4.3% |
| Costa Rican | 87 | 0.1% |
| Croatian | 40 | 0.1% |
| Cuban | 2,226 | 2.8% |
| Czech | 7 | 0.0% |
| Czechoslovakian | 8 | 0.0% |
| Danish | 16 | 0.0% |
| Dominican | 3,997 | 5.1% |
| Dutch | 153 | 0.2% |
| Dutch West Indian | 23 | 0.0% |
| Eastern European | 56 | 0.1% |
| Ecuadorian | 1,331 | 1.7% |
| Egyptian | 57 | 0.1% |
| English | 1,323 | 1.7% |
| European | 141 | 0.2% |
| French | 316 | 0.4% |
| French American Indian | 11 | 0.0% |
| French Canadian | 301 | 0.4% |
| German | 2,195 | 2.8% |
| Greek | 75 | 0.1% |
| Guamanian / Chamorro | 46 | 0.1% |
| Guatemalan | 343 | 0.4% |
| Guyanese | 43 | 0.1% |
| Haitian | 422 | 0.5% |
| Honduran | 876 | 1.1% |
| Hungarian | 90 | 0.1% |
| Indian (Asian) | 416 | 0.5% |
| Iranian | 52 | 0.1% |
| Iraqi | 11 | 0.0% |
| Irish | 1,754 | 2.2% |
| Israeli | 4 | 0.0% |
| Italian | 1,941 | 2.5% |
| Jamaican | 783 | 1.0% |
| Japanese | 52 | 0.1% |
| Korean | 1,140 | 1.5% |
| Lebanese | 67 | 0.1% |
| Lithuanian | 55 | 0.1% |
| Luxembourger | 14 | 0.0% |
| Malaysian | 52 | 0.1% |
| Maltese | 5 | 0.0% |
| Mexican | 3,331 | 4.2% |
| Moroccan | 441 | 0.6% |
| Native Hawaiian | 106 | 0.1% |
| Nicaraguan | 1,132 | 1.4% |
| Norwegian | 127 | 0.2% |
| Palestinian | 185 | 0.2% |
| Panamanian | 697 | 0.9% |
| Peruvian | 1,736 | 2.2% |
| Polish | 470 | 0.6% |
| Portuguese | 274 | 0.4% |
| Puerto Rican | 25,099 | 32.0% |
| Romanian | 11 | 0.0% |
| Russian | 7 | 0.0% |
| Salvadoran | 1,102 | 1.4% |
| Samoan | 42 | 0.1% |
| Scandinavian | 29 | 0.0% |
| Scotch-Irish | 76 | 0.1% |
| Scottish | 193 | 0.3% |
| Slovak | 45 | 0.1% |
| Somali | 10 | 0.0% |
| South American | 13,895 | 17.7% |
| Spaniard | 108 | 0.1% |
| Spanish | 90 | 0.1% |
| Sri Lankan | 83 | 0.1% |
| Subsaharan African | 659 | 0.8% |
| Swedish | 146 | 0.2% |
| Swiss | 25 | 0.0% |
| Syrian | 94 | 0.1% |
| Thai | 768 | 1.0% |
| Trinidadian and Tobagonian | 126 | 0.2% |
| Turkish | 4 | 0.0% |
| U.S. Virgin Islander | 72 | 0.1% |
| Ukrainian | 33 | 0.0% |
| Uruguayan | 135 | 0.2% |
| Venezuelan | 7,160 | 9.1% |
| Vietnamese | 367 | 0.5% |
| Welsh | 553 | 0.7% |
| West Indian | 190 | 0.2% |
| Yugoslavian | 14 | 0.0% | View All 99 Rows |
Immigrants in Kissimmee
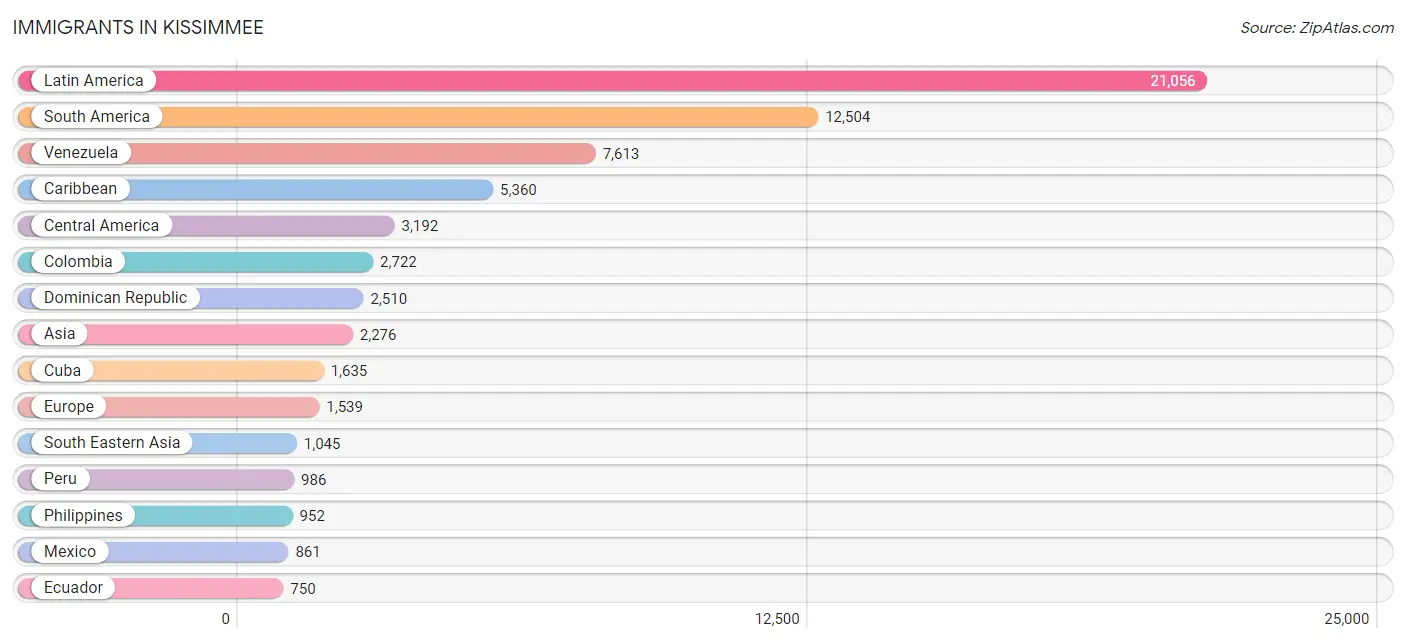
The most numerous immigrant groups reported in Kissimmee came from Latin America (21,056 | 26.8%), South America (12,504 | 15.9%), Venezuela (7,613 | 9.7%), Caribbean (5,360 | 6.8%), and Central America (3,192 | 4.1%), together accounting for 63.4% of all Kissimmee residents.
| Immigration Origin | # Population | % Population |
| Africa | 681 | 0.9% |
| Argentina | 29 | 0.0% |
| Asia | 2,276 | 2.9% |
| Bangladesh | 234 | 0.3% |
| Bolivia | 19 | 0.0% |
| Brazil | 269 | 0.3% |
| Cabo Verde | 62 | 0.1% |
| Canada | 52 | 0.1% |
| Caribbean | 5,360 | 6.8% |
| Central America | 3,192 | 4.1% |
| China | 61 | 0.1% |
| Colombia | 2,722 | 3.5% |
| Costa Rica | 87 | 0.1% |
| Cuba | 1,635 | 2.1% |
| Czechoslovakia | 38 | 0.1% |
| Dominica | 26 | 0.0% |
| Dominican Republic | 2,510 | 3.2% |
| Eastern Asia | 125 | 0.2% |
| Eastern Europe | 481 | 0.6% |
| Ecuador | 750 | 1.0% |
| Egypt | 8 | 0.0% |
| El Salvador | 380 | 0.5% |
| Europe | 1,539 | 2.0% |
| France | 611 | 0.8% |
| Germany | 99 | 0.1% |
| Grenada | 26 | 0.0% |
| Guatemala | 178 | 0.2% |
| Guyana | 63 | 0.1% |
| Haiti | 279 | 0.4% |
| Honduras | 666 | 0.9% |
| India | 128 | 0.2% |
| Iran | 41 | 0.1% |
| Italy | 68 | 0.1% |
| Jamaica | 504 | 0.6% |
| Jordan | 26 | 0.0% |
| Korea | 64 | 0.1% |
| Latin America | 21,056 | 26.8% |
| Malaysia | 10 | 0.0% |
| Mexico | 861 | 1.1% |
| Morocco | 409 | 0.5% |
| Nicaragua | 484 | 0.6% |
| Northern Africa | 442 | 0.6% |
| Northern Europe | 275 | 0.4% |
| Pakistan | 316 | 0.4% |
| Panama | 536 | 0.7% |
| Peru | 986 | 1.3% |
| Philippines | 952 | 1.2% |
| Poland | 421 | 0.5% |
| Portugal | 5 | 0.0% |
| Saudi Arabia | 6 | 0.0% |
| Senegal | 22 | 0.0% |
| Sierra Leone | 26 | 0.0% |
| South America | 12,504 | 15.9% |
| South Central Asia | 719 | 0.9% |
| South Eastern Asia | 1,045 | 1.3% |
| Southern Europe | 73 | 0.1% |
| Syria | 165 | 0.2% |
| Trinidad and Tobago | 198 | 0.3% |
| Ukraine | 17 | 0.0% |
| Uruguay | 30 | 0.0% |
| Venezuela | 7,613 | 9.7% |
| Vietnam | 83 | 0.1% |
| Western Africa | 182 | 0.2% |
| Western Asia | 197 | 0.3% |
| Western Europe | 710 | 0.9% | View All 65 Rows |
Sex and Age in Kissimmee
Sex and Age in Kissimmee
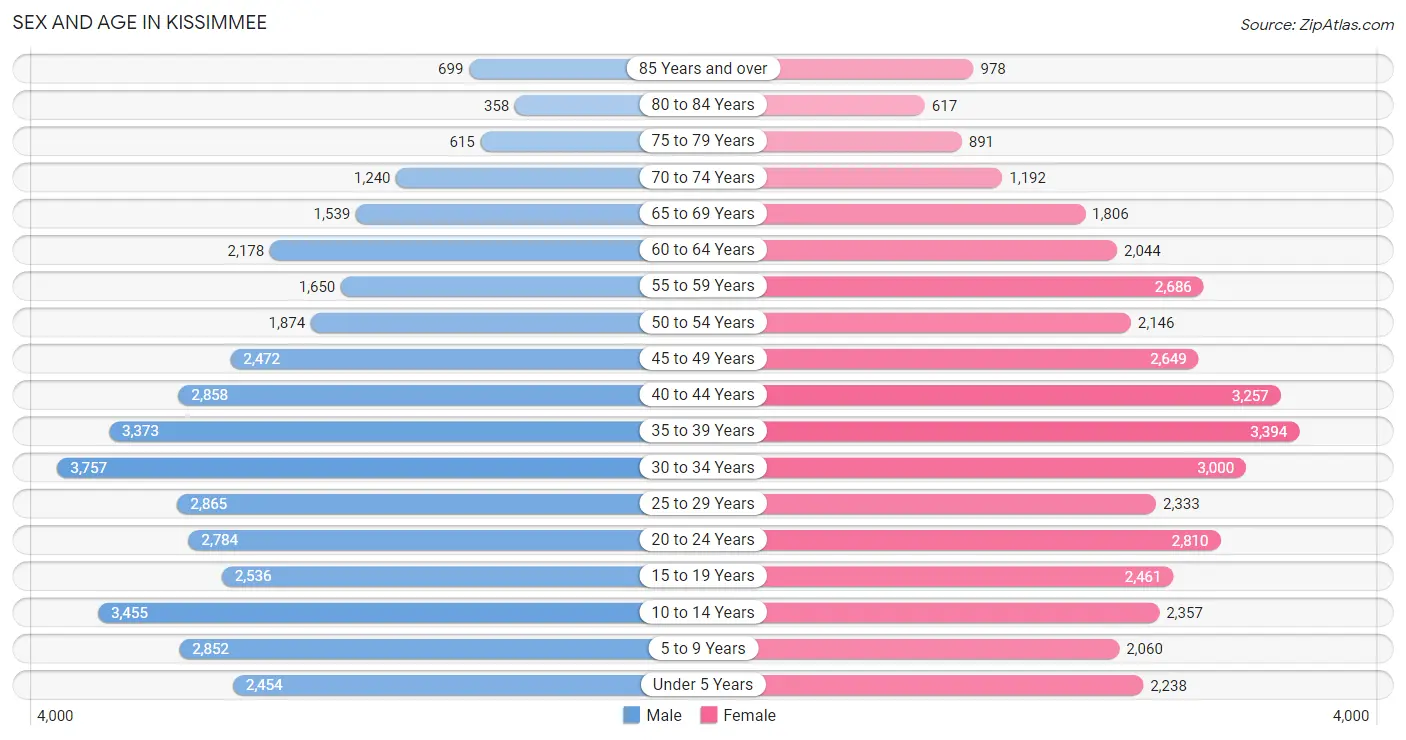
The most populous age groups in Kissimmee are 30 to 34 Years (3,757 | 9.5%) for men and 35 to 39 Years (3,394 | 8.7%) for women.
| Age Bracket | Male | Female |
| Under 5 Years | 2,454 (6.2%) | 2,238 (5.8%) |
| 5 to 9 Years | 2,852 (7.2%) | 2,060 (5.3%) |
| 10 to 14 Years | 3,455 (8.7%) | 2,357 (6.1%) |
| 15 to 19 Years | 2,536 (6.4%) | 2,461 (6.3%) |
| 20 to 24 Years | 2,784 (7.0%) | 2,810 (7.2%) |
| 25 to 29 Years | 2,865 (7.2%) | 2,333 (6.0%) |
| 30 to 34 Years | 3,757 (9.5%) | 3,000 (7.7%) |
| 35 to 39 Years | 3,373 (8.5%) | 3,394 (8.7%) |
| 40 to 44 Years | 2,858 (7.2%) | 3,257 (8.4%) |
| 45 to 49 Years | 2,472 (6.2%) | 2,649 (6.8%) |
| 50 to 54 Years | 1,874 (4.7%) | 2,146 (5.5%) |
| 55 to 59 Years | 1,650 (4.2%) | 2,686 (6.9%) |
| 60 to 64 Years | 2,178 (5.5%) | 2,044 (5.2%) |
| 65 to 69 Years | 1,539 (3.9%) | 1,806 (4.6%) |
| 70 to 74 Years | 1,240 (3.1%) | 1,192 (3.1%) |
| 75 to 79 Years | 615 (1.5%) | 891 (2.3%) |
| 80 to 84 Years | 358 (0.9%) | 617 (1.6%) |
| 85 Years and over | 699 (1.8%) | 978 (2.5%) |
| Total | 39,559 (100.0%) | 38,919 (100.0%) |
Families and Households in Kissimmee
Median Family Size in Kissimmee
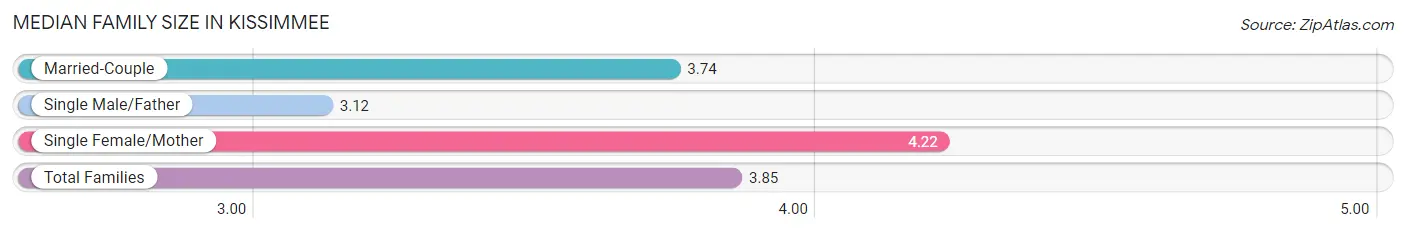
The median family size in Kissimmee is 3.85 persons per family, with single female/mother families (5,261 | 31.8%) accounting for the largest median family size of 4.22 persons per family. On the other hand, single male/father families (1,278 | 7.7%) represent the smallest median family size with 3.12 persons per family.
| Family Type | # Families | Family Size |
| Married-Couple | 10,004 (60.5%) | 3.74 |
| Single Male/Father | 1,278 (7.7%) | 3.12 |
| Single Female/Mother | 5,261 (31.8%) | 4.22 |
| Total Families | 16,543 (100.0%) | 3.85 |
Median Household Size in Kissimmee
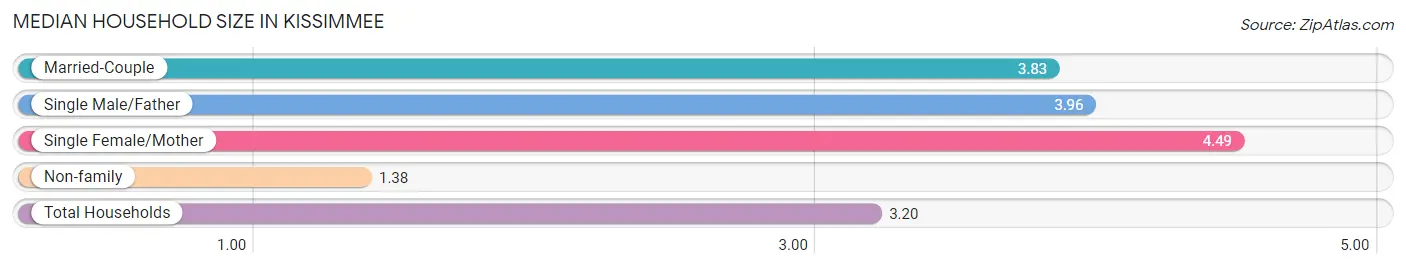
The median household size in Kissimmee is 3.20 persons per household, with single female/mother households (5,261 | 21.7%) accounting for the largest median household size of 4.49 persons per household. non-family households (7,748 | 31.9%) represent the smallest median household size with 1.38 persons per household.
| Household Type | # Households | Household Size |
| Married-Couple | 10,004 (41.2%) | 3.83 |
| Single Male/Father | 1,278 (5.3%) | 3.96 |
| Single Female/Mother | 5,261 (21.7%) | 4.49 |
| Non-family | 7,748 (31.9%) | 1.38 |
| Total Households | 24,291 (100.0%) | 3.20 |
Household Size by Marriage Status in Kissimmee
Out of a total of 24,291 households in Kissimmee, 16,543 (68.1%) are family households, while 7,748 (31.9%) are nonfamily households. The most numerous type of family households are 2-person households, comprising 6,107, and the most common type of nonfamily households are 1-person households, comprising 6,084.
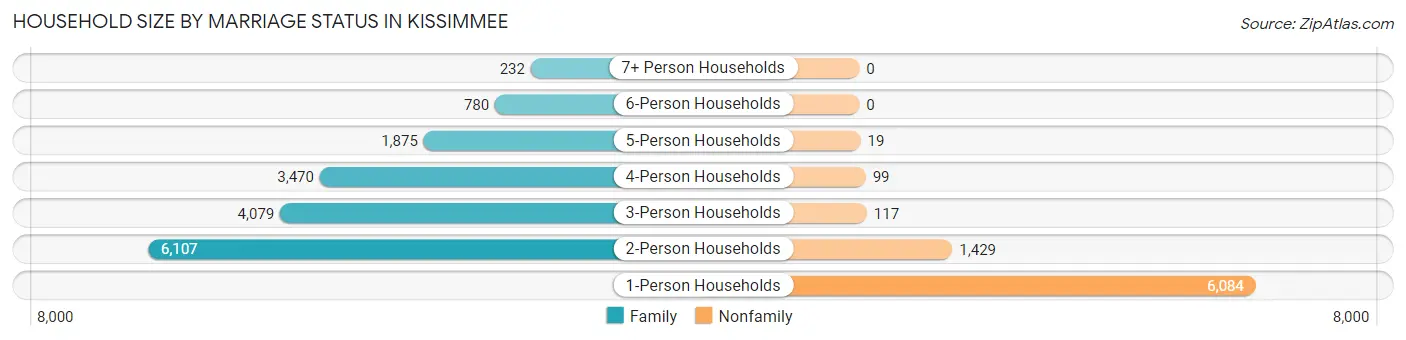
| Household Size | Family Households | Nonfamily Households |
| 1-Person Households | - | 6,084 (25.1%) |
| 2-Person Households | 6,107 (25.1%) | 1,429 (5.9%) |
| 3-Person Households | 4,079 (16.8%) | 117 (0.5%) |
| 4-Person Households | 3,470 (14.3%) | 99 (0.4%) |
| 5-Person Households | 1,875 (7.7%) | 19 (0.1%) |
| 6-Person Households | 780 (3.2%) | 0 (0.0%) |
| 7+ Person Households | 232 (1.0%) | 0 (0.0%) |
| Total | 16,543 (68.1%) | 7,748 (31.9%) |
Female Fertility in Kissimmee
Fertility by Age in Kissimmee
Average fertility rate in Kissimmee is 43.0 births per 1,000 women. Women in the age bracket of 20 to 34 years have the highest fertility rate with 59.0 births per 1,000 women. Women in the age bracket of 20 to 34 years acount for 55.9% of all women with births.
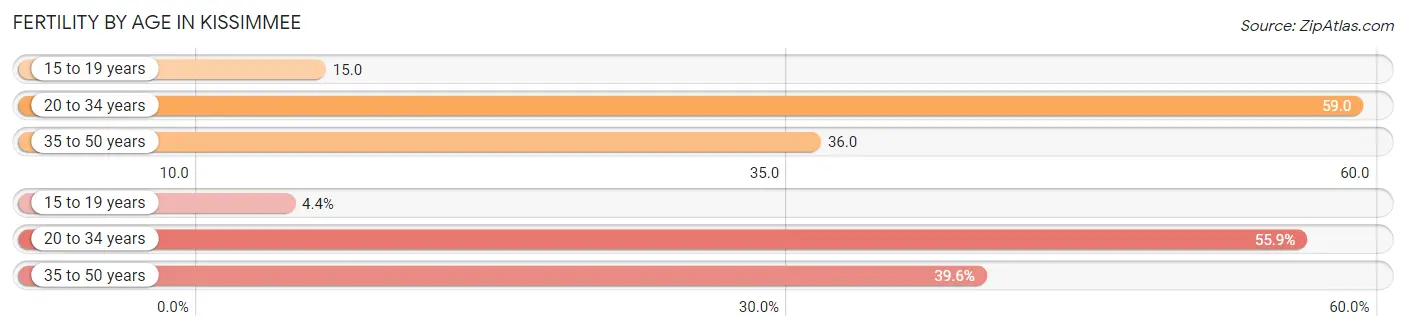
| Age Bracket | Women with Births | Births / 1,000 Women |
| 15 to 19 years | 38 (4.4%) | 15.0 |
| 20 to 34 years | 480 (55.9%) | 59.0 |
| 35 to 50 years | 340 (39.6%) | 36.0 |
| Total | 858 (100.0%) | 43.0 |
Fertility by Age by Marriage Status in Kissimmee
64.2% of women with births (858) in Kissimmee are married. The highest percentage of unmarried women with births falls into 15 to 19 years age bracket with 100.0% of them unmarried at the time of birth, while the lowest percentage of unmarried women with births belong to 35 to 50 years age bracket with 5.6% of them unmarried.
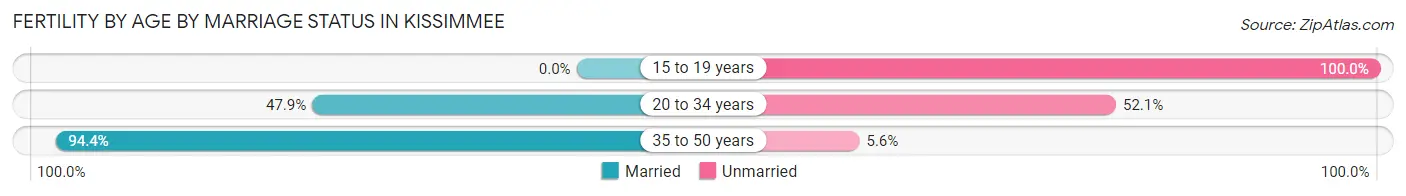
| Age Bracket | Married | Unmarried |
| 15 to 19 years | 0 (0.0%) | 38 (100.0%) |
| 20 to 34 years | 230 (47.9%) | 250 (52.1%) |
| 35 to 50 years | 321 (94.4%) | 19 (5.6%) |
| Total | 551 (64.2%) | 307 (35.8%) |
Fertility by Education in Kissimmee
Average fertility rate in Kissimmee is 43.0 births per 1,000 women. Women with the education attainment of college or associate's degree have the highest fertility rate of 64.0 births per 1,000 women, while women with the education attainment of high school diploma have the lowest fertility at 12.0 births per 1,000 women. Women with the education attainment of college or associate's degree represent 58.7% of all women with births.
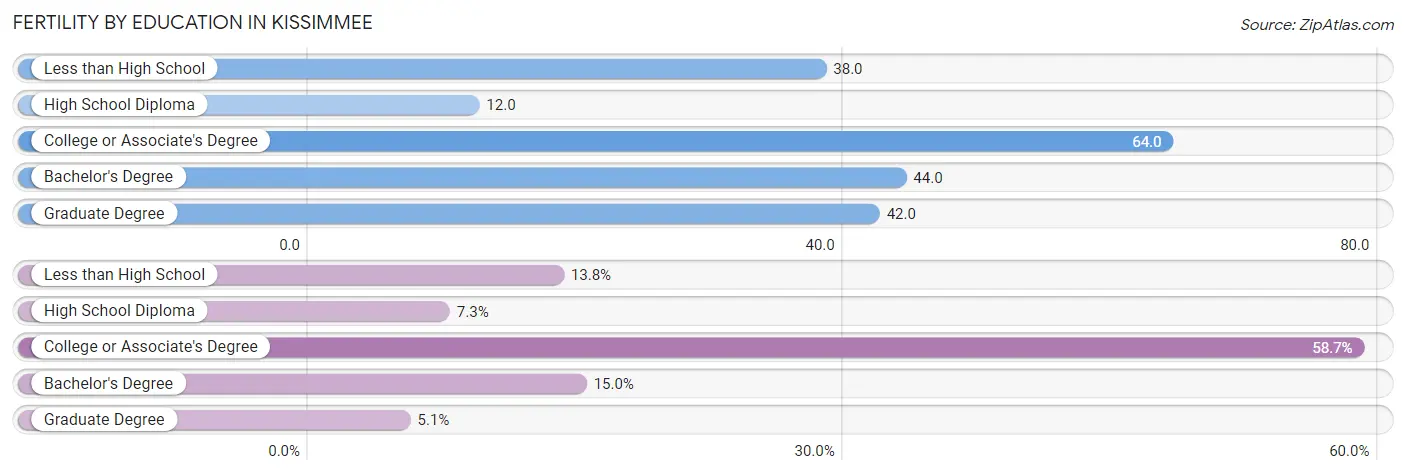
| Educational Attainment | Women with Births | Births / 1,000 Women |
| Less than High School | 118 (13.8%) | 38.0 |
| High School Diploma | 63 (7.3%) | 12.0 |
| College or Associate's Degree | 504 (58.7%) | 64.0 |
| Bachelor's Degree | 129 (15.0%) | 44.0 |
| Graduate Degree | 44 (5.1%) | 42.0 |
| Total | 858 (100.0%) | 43.0 |
Fertility by Education by Marriage Status in Kissimmee
35.8% of women with births in Kissimmee are unmarried. Women with the educational attainment of bachelor's degree are most likely to be married with 100.0% of them married at childbirth, while women with the educational attainment of high school diploma are least likely to be married with 58.7% of them unmarried at childbirth.
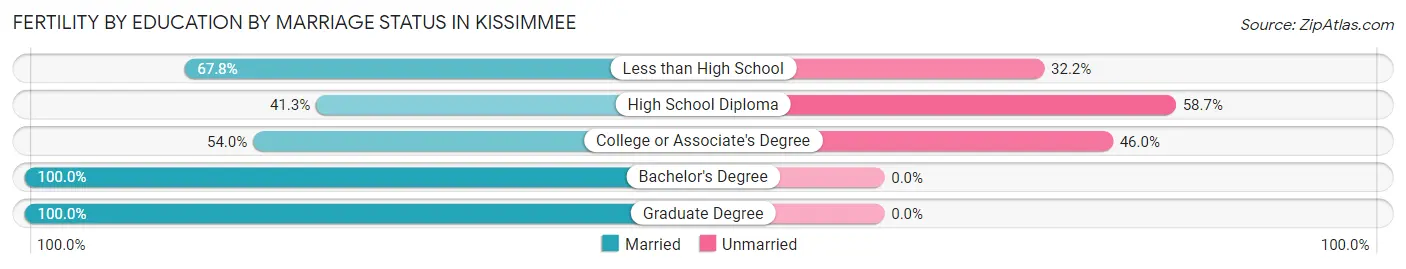
| Educational Attainment | Married | Unmarried |
| Less than High School | 80 (67.8%) | 38 (32.2%) |
| High School Diploma | 26 (41.3%) | 37 (58.7%) |
| College or Associate's Degree | 272 (54.0%) | 232 (46.0%) |
| Bachelor's Degree | 129 (100.0%) | 0 (0.0%) |
| Graduate Degree | 44 (100.0%) | 0 (0.0%) |
| Total | 551 (64.2%) | 307 (35.8%) |
Employment Characteristics in Kissimmee
Employment by Class of Employer in Kissimmee
Among the 36,679 employed individuals in Kissimmee, private company employees (27,974 | 76.3%), local government employees (2,845 | 7.8%), and self-employed (not incorporated) (1,829 | 5.0%) make up the most common classes of employment.
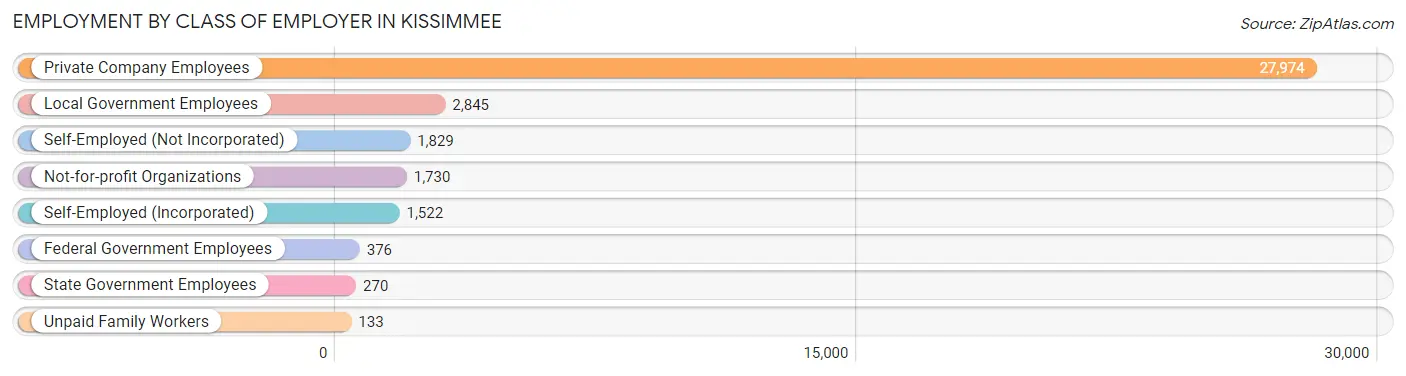
| Employer Class | # Employees | % Employees |
| Private Company Employees | 27,974 | 76.3% |
| Self-Employed (Incorporated) | 1,522 | 4.2% |
| Self-Employed (Not Incorporated) | 1,829 | 5.0% |
| Not-for-profit Organizations | 1,730 | 4.7% |
| Local Government Employees | 2,845 | 7.8% |
| State Government Employees | 270 | 0.7% |
| Federal Government Employees | 376 | 1.0% |
| Unpaid Family Workers | 133 | 0.4% |
| Total | 36,679 | 100.0% |
Employment Status by Age in Kissimmee
According to the labor force statistics for Kissimmee, out of the total population over 16 years of age (62,080), 64.6% or 40,104 individuals are in the labor force, with 6.6% or 2,647 of them unemployed. The age group with the highest labor force participation rate is 35 to 44 years, with 83.3% or 10,731 individuals in the labor force. Within the labor force, the 16 to 19 years age range has the highest percentage of unemployed individuals, with 22.8% or 262 of them being unemployed.
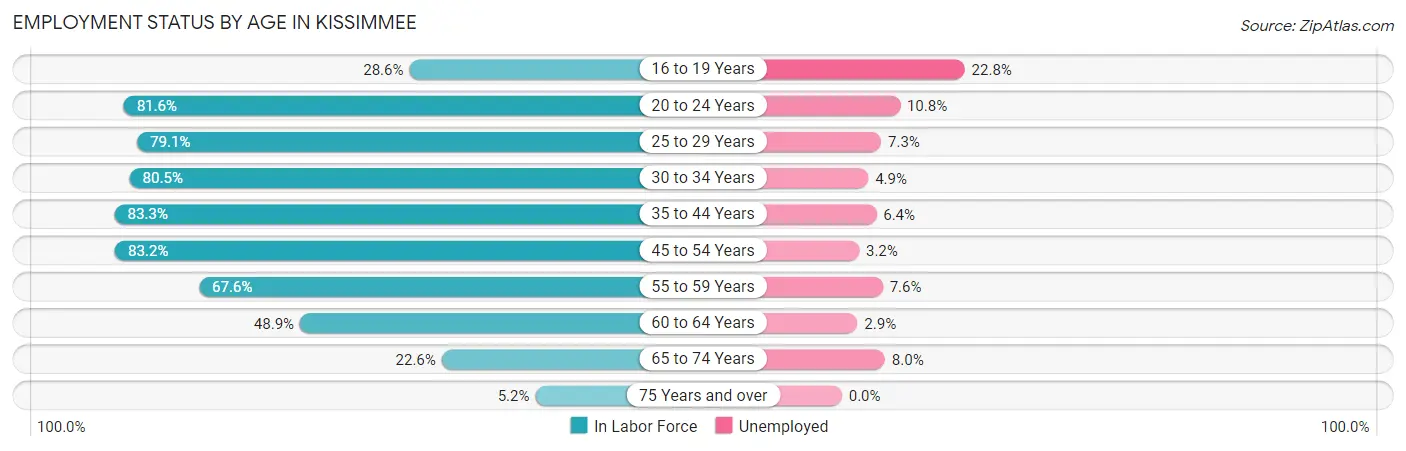
| Age Bracket | In Labor Force | Unemployed |
| 16 to 19 Years | 1,148 (28.6%) | 262 (22.8%) |
| 20 to 24 Years | 4,565 (81.6%) | 493 (10.8%) |
| 25 to 29 Years | 4,112 (79.1%) | 300 (7.3%) |
| 30 to 34 Years | 5,439 (80.5%) | 267 (4.9%) |
| 35 to 44 Years | 10,731 (83.3%) | 687 (6.4%) |
| 45 to 54 Years | 7,605 (83.2%) | 243 (3.2%) |
| 55 to 59 Years | 2,931 (67.6%) | 223 (7.6%) |
| 60 to 64 Years | 2,065 (48.9%) | 60 (2.9%) |
| 65 to 74 Years | 1,306 (22.6%) | 104 (8.0%) |
| 75 Years and over | 216 (5.2%) | 0 (0.0%) |
| Total | 40,104 (64.6%) | 2,647 (6.6%) |
Employment Status by Educational Attainment in Kissimmee
According to labor force statistics for Kissimmee, 77.3% of individuals (32,880) out of the total population between 25 and 64 years of age (42,536) are in the labor force, with 5.4% or 1,776 of them being unemployed. The group with the highest labor force participation rate are those with the educational attainment of bachelor's degree or higher, with 89.4% or 9,249 individuals in the labor force. Within the labor force, individuals with high school diploma education have the highest percentage of unemployment, with 7.3% or 668 of them being unemployed.
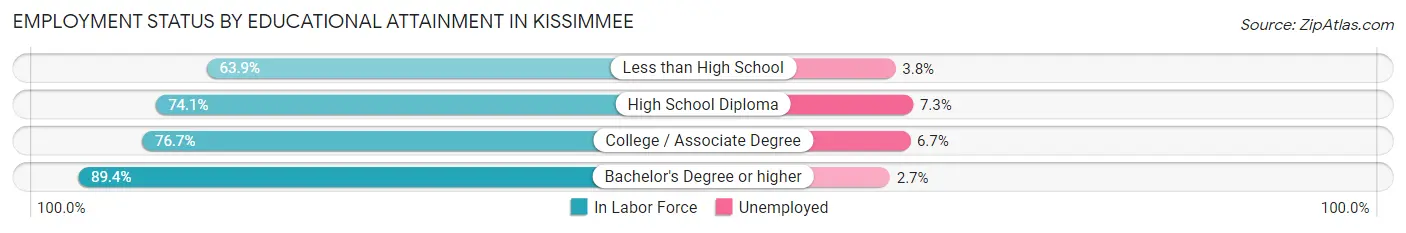
| Educational Attainment | In Labor Force | Unemployed |
| Less than High School | 3,716 (63.9%) | 221 (3.8%) |
| High School Diploma | 9,152 (74.1%) | 902 (7.3%) |
| College / Associate Degree | 10,756 (76.7%) | 940 (6.7%) |
| Bachelor's Degree or higher | 9,249 (89.4%) | 279 (2.7%) |
| Total | 32,880 (77.3%) | 2,297 (5.4%) |
Employment Occupations by Sex in Kissimmee
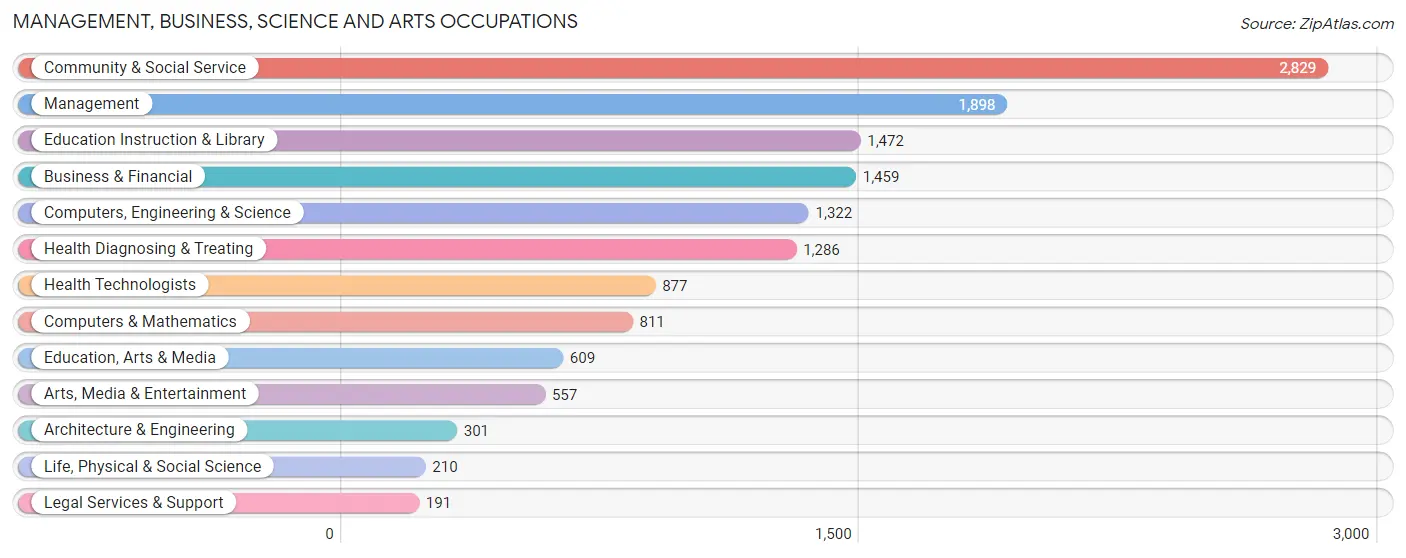
Management, Business, Science and Arts Occupations
The most common Management, Business, Science and Arts occupations in Kissimmee are Community & Social Service (2,829 | 7.5%), Management (1,898 | 5.1%), Education Instruction & Library (1,472 | 3.9%), Business & Financial (1,459 | 3.9%), and Computers, Engineering & Science (1,322 | 3.5%).
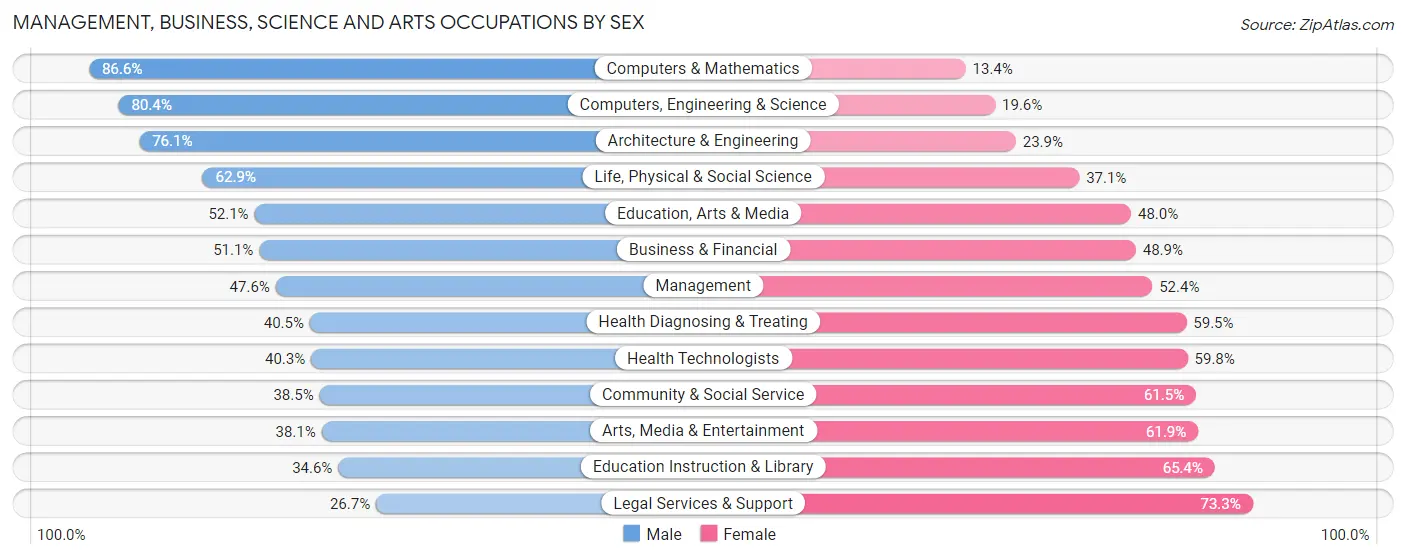
Management, Business, Science and Arts Occupations by Sex
Within the Management, Business, Science and Arts occupations in Kissimmee, the most male-oriented occupations are Computers & Mathematics (86.6%), Computers, Engineering & Science (80.4%), and Architecture & Engineering (76.1%), while the most female-oriented occupations are Legal Services & Support (73.3%), Education Instruction & Library (65.4%), and Arts, Media & Entertainment (61.9%).
| Occupation | Male | Female |
| Management | 904 (47.6%) | 994 (52.4%) |
| Business & Financial | 745 (51.1%) | 714 (48.9%) |
| Computers, Engineering & Science | 1,063 (80.4%) | 259 (19.6%) |
| Computers & Mathematics | 702 (86.6%) | 109 (13.4%) |
| Architecture & Engineering | 229 (76.1%) | 72 (23.9%) |
| Life, Physical & Social Science | 132 (62.9%) | 78 (37.1%) |
| Community & Social Service | 1,089 (38.5%) | 1,740 (61.5%) |
| Education, Arts & Media | 317 (52.0%) | 292 (47.9%) |
| Legal Services & Support | 51 (26.7%) | 140 (73.3%) |
| Education Instruction & Library | 509 (34.6%) | 963 (65.4%) |
| Arts, Media & Entertainment | 212 (38.1%) | 345 (61.9%) |
| Health Diagnosing & Treating | 521 (40.5%) | 765 (59.5%) |
| Health Technologists | 353 (40.3%) | 524 (59.8%) |
| Total (Category) | 4,322 (49.1%) | 4,472 (50.8%) |
| Total (Overall) | 20,158 (53.8%) | 17,303 (46.2%) |
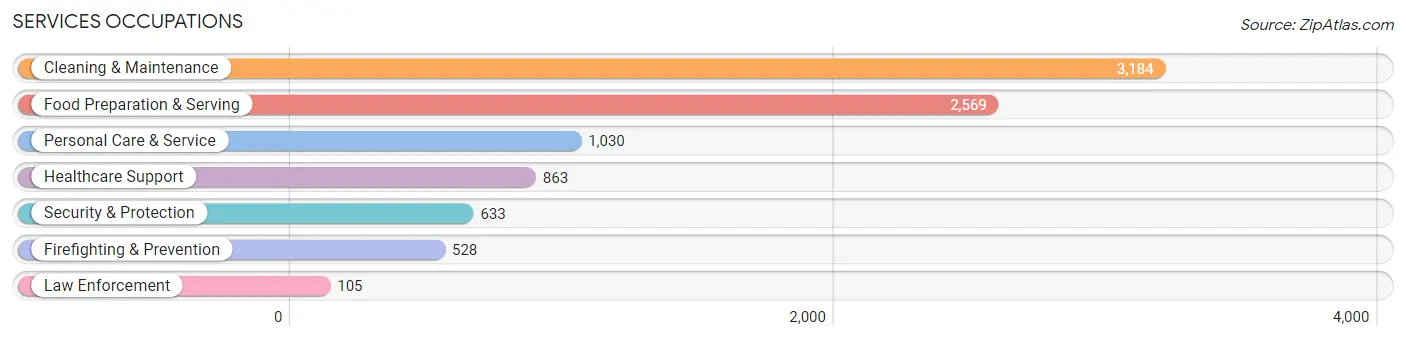
Services Occupations
The most common Services occupations in Kissimmee are Cleaning & Maintenance (3,184 | 8.5%), Food Preparation & Serving (2,569 | 6.9%), Personal Care & Service (1,030 | 2.8%), Healthcare Support (863 | 2.3%), and Security & Protection (633 | 1.7%).
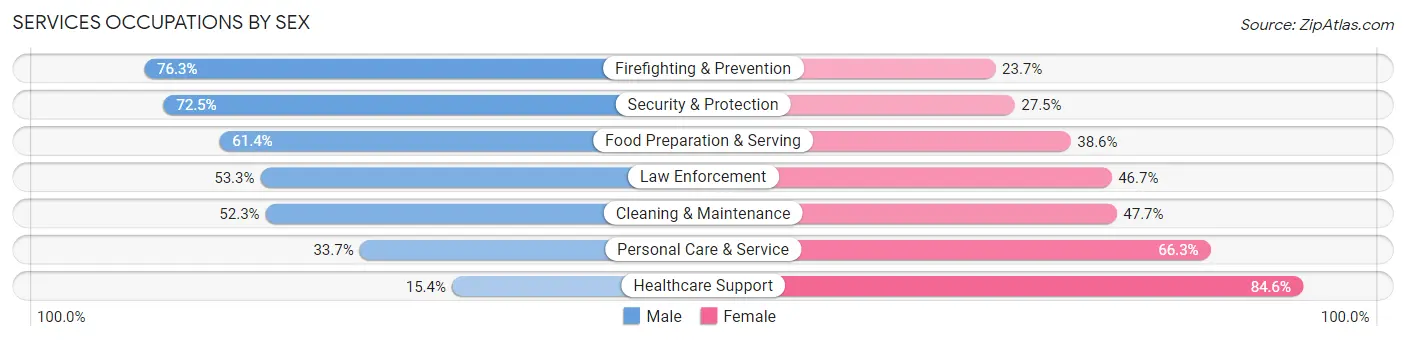
Services Occupations by Sex
Within the Services occupations in Kissimmee, the most male-oriented occupations are Firefighting & Prevention (76.3%), Security & Protection (72.5%), and Food Preparation & Serving (61.4%), while the most female-oriented occupations are Healthcare Support (84.6%), Personal Care & Service (66.3%), and Cleaning & Maintenance (47.7%).
| Occupation | Male | Female |
| Healthcare Support | 133 (15.4%) | 730 (84.6%) |
| Security & Protection | 459 (72.5%) | 174 (27.5%) |
| Firefighting & Prevention | 403 (76.3%) | 125 (23.7%) |
| Law Enforcement | 56 (53.3%) | 49 (46.7%) |
| Food Preparation & Serving | 1,578 (61.4%) | 991 (38.6%) |
| Cleaning & Maintenance | 1,666 (52.3%) | 1,518 (47.7%) |
| Personal Care & Service | 347 (33.7%) | 683 (66.3%) |
| Total (Category) | 4,183 (50.5%) | 4,096 (49.5%) |
| Total (Overall) | 20,158 (53.8%) | 17,303 (46.2%) |
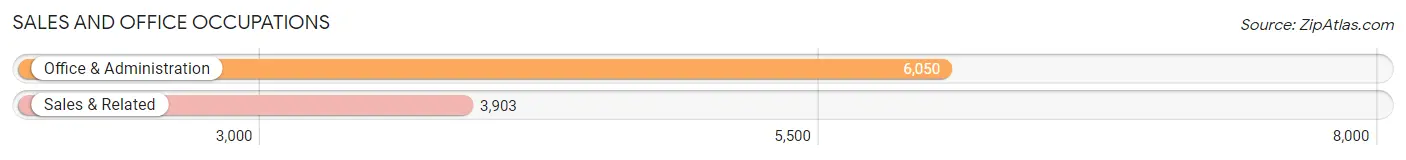
Sales and Office Occupations
The most common Sales and Office occupations in Kissimmee are Office & Administration (6,050 | 16.2%), and Sales & Related (3,903 | 10.4%).
Sales and Office Occupations by Sex
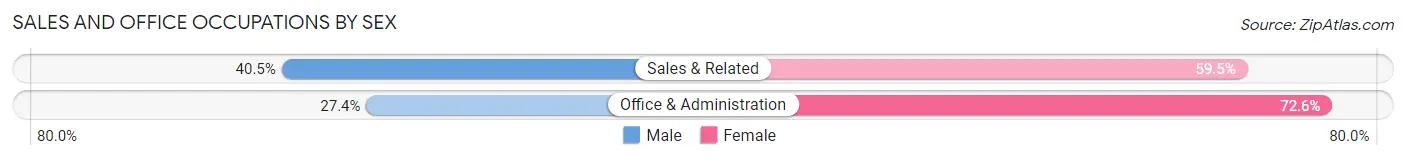
| Occupation | Male | Female |
| Sales & Related | 1,579 (40.5%) | 2,324 (59.5%) |
| Office & Administration | 1,659 (27.4%) | 4,391 (72.6%) |
| Total (Category) | 3,238 (32.5%) | 6,715 (67.5%) |
| Total (Overall) | 20,158 (53.8%) | 17,303 (46.2%) |
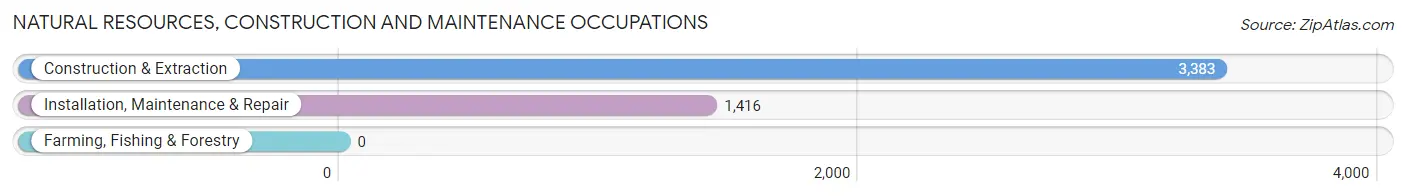
Natural Resources, Construction and Maintenance Occupations
The most common Natural Resources, Construction and Maintenance occupations in Kissimmee are Construction & Extraction (3,383 | 9.0%), and Installation, Maintenance & Repair (1,416 | 3.8%).
Natural Resources, Construction and Maintenance Occupations by Sex
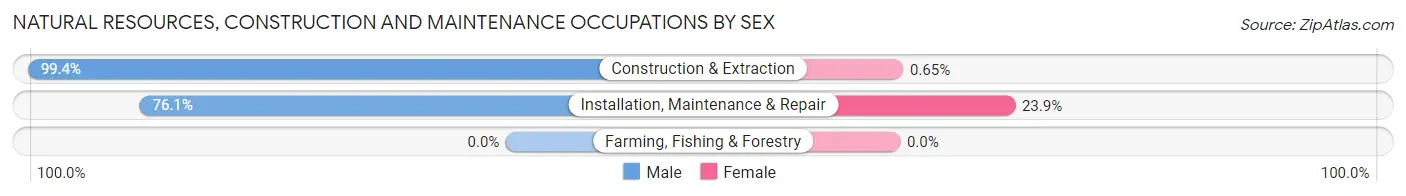
| Occupation | Male | Female |
| Farming, Fishing & Forestry | 0 (0.0%) | 0 (0.0%) |
| Construction & Extraction | 3,361 (99.4%) | 22 (0.6%) |
| Installation, Maintenance & Repair | 1,077 (76.1%) | 339 (23.9%) |
| Total (Category) | 4,438 (92.5%) | 361 (7.5%) |
| Total (Overall) | 20,158 (53.8%) | 17,303 (46.2%) |
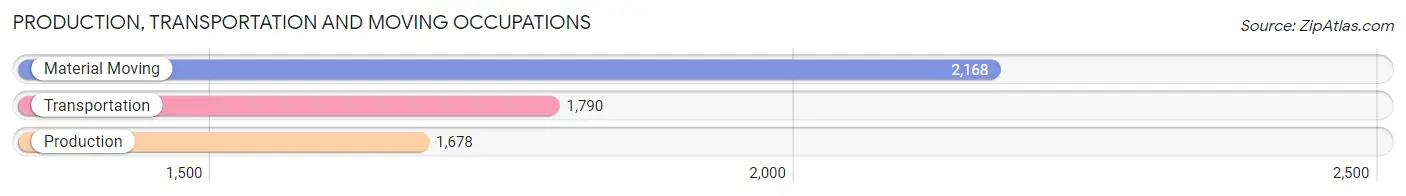
Production, Transportation and Moving Occupations
The most common Production, Transportation and Moving occupations in Kissimmee are Material Moving (2,168 | 5.8%), Transportation (1,790 | 4.8%), and Production (1,678 | 4.5%).
Production, Transportation and Moving Occupations by Sex
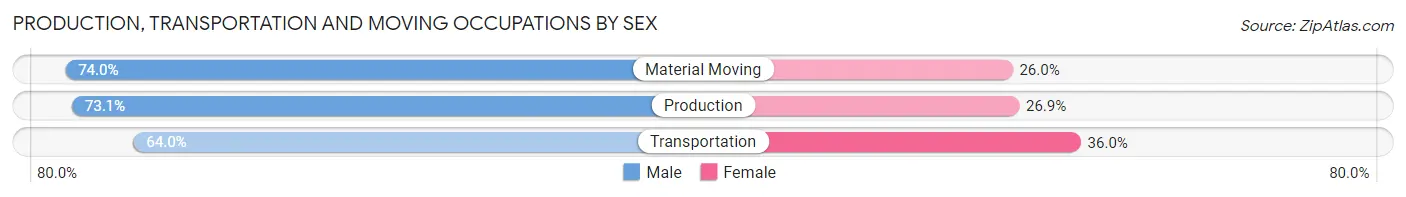
| Occupation | Male | Female |
| Production | 1,226 (73.1%) | 452 (26.9%) |
| Transportation | 1,146 (64.0%) | 644 (36.0%) |
| Material Moving | 1,605 (74.0%) | 563 (26.0%) |
| Total (Category) | 3,977 (70.6%) | 1,659 (29.4%) |
| Total (Overall) | 20,158 (53.8%) | 17,303 (46.2%) |
Employment Industries by Sex in Kissimmee
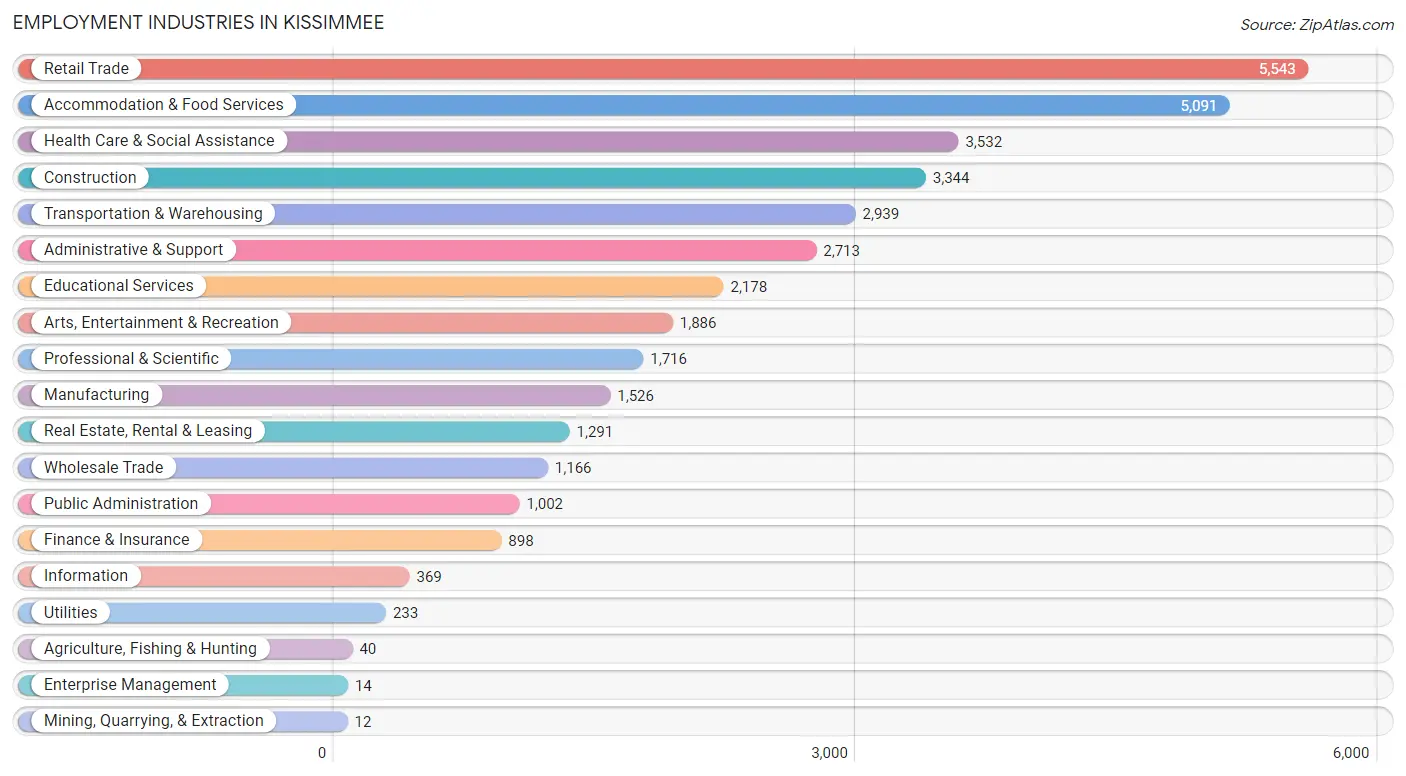
Employment Industries in Kissimmee
The major employment industries in Kissimmee include Retail Trade (5,543 | 14.8%), Accommodation & Food Services (5,091 | 13.6%), Health Care & Social Assistance (3,532 | 9.4%), Construction (3,344 | 8.9%), and Transportation & Warehousing (2,939 | 7.9%).
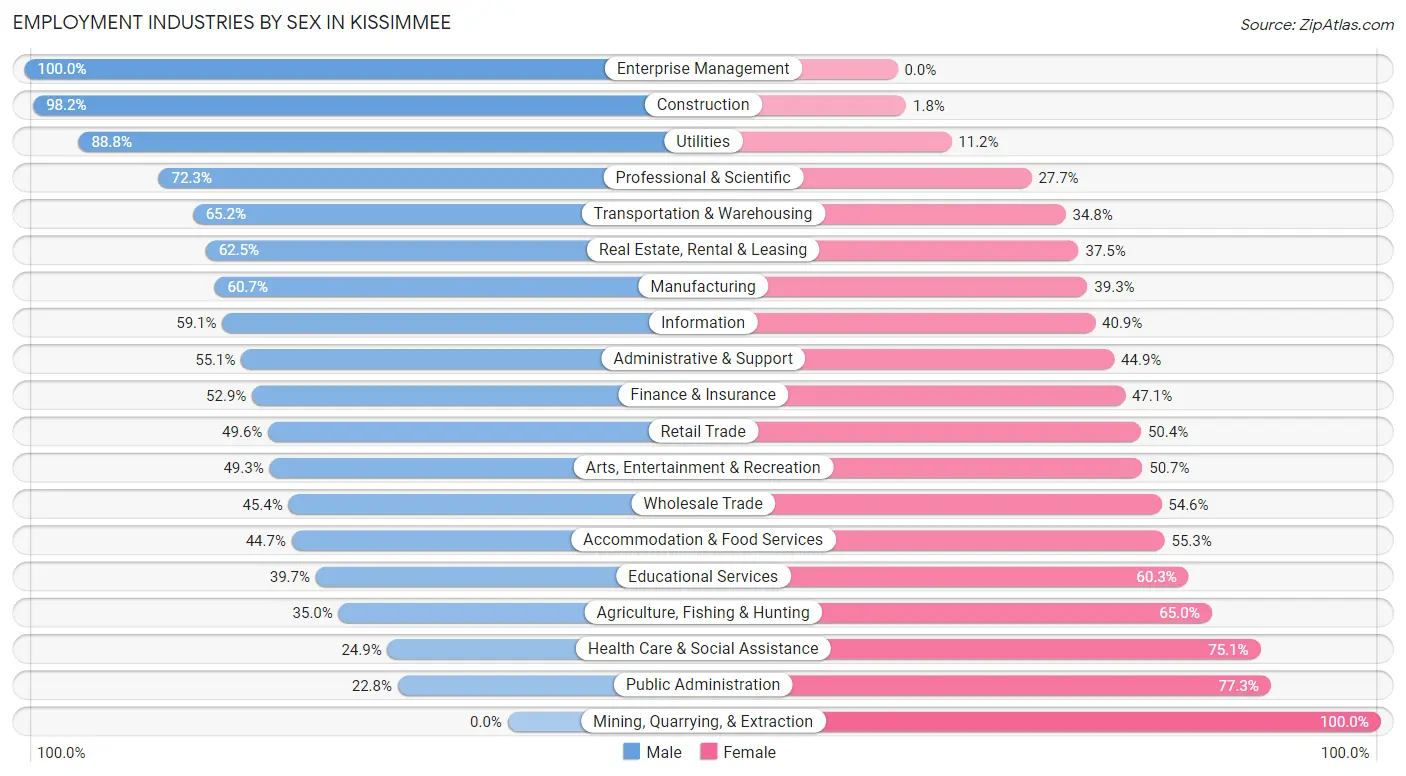
Employment Industries by Sex in Kissimmee
The Kissimmee industries that see more men than women are Enterprise Management (100.0%), Construction (98.2%), and Utilities (88.8%), whereas the industries that tend to have a higher number of women are Mining, Quarrying, & Extraction (100.0%), Public Administration (77.2%), and Health Care & Social Assistance (75.1%).
| Industry | Male | Female |
| Agriculture, Fishing & Hunting | 14 (35.0%) | 26 (65.0%) |
| Mining, Quarrying, & Extraction | 0 (0.0%) | 12 (100.0%) |
| Construction | 3,284 (98.2%) | 60 (1.8%) |
| Manufacturing | 926 (60.7%) | 600 (39.3%) |
| Wholesale Trade | 529 (45.4%) | 637 (54.6%) |
| Retail Trade | 2,749 (49.6%) | 2,794 (50.4%) |
| Transportation & Warehousing | 1,916 (65.2%) | 1,023 (34.8%) |
| Utilities | 207 (88.8%) | 26 (11.2%) |
| Information | 218 (59.1%) | 151 (40.9%) |
| Finance & Insurance | 475 (52.9%) | 423 (47.1%) |
| Real Estate, Rental & Leasing | 807 (62.5%) | 484 (37.5%) |
| Professional & Scientific | 1,240 (72.3%) | 476 (27.7%) |
| Enterprise Management | 14 (100.0%) | 0 (0.0%) |
| Administrative & Support | 1,496 (55.1%) | 1,217 (44.9%) |
| Educational Services | 865 (39.7%) | 1,313 (60.3%) |
| Health Care & Social Assistance | 879 (24.9%) | 2,653 (75.1%) |
| Arts, Entertainment & Recreation | 930 (49.3%) | 956 (50.7%) |
| Accommodation & Food Services | 2,276 (44.7%) | 2,815 (55.3%) |
| Public Administration | 228 (22.8%) | 774 (77.2%) |
| Total | 20,158 (53.8%) | 17,303 (46.2%) |
Education in Kissimmee
School Enrollment in Kissimmee
The most common levels of schooling among the 19,066 students in Kissimmee are middle school (4,809 | 25.2%), high school (4,166 | 21.8%), and elementary school (4,021 | 21.1%).
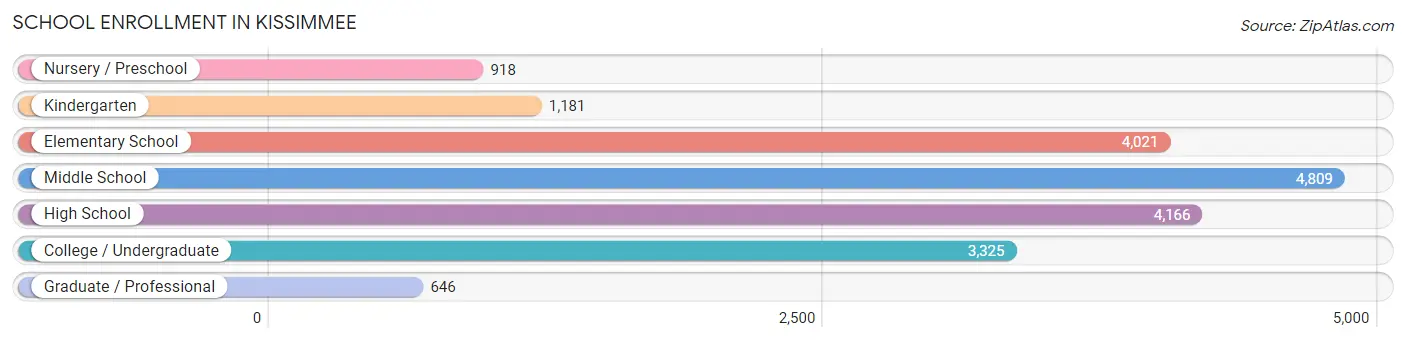
| School Level | # Students | % Students |
| Nursery / Preschool | 918 | 4.8% |
| Kindergarten | 1,181 | 6.2% |
| Elementary School | 4,021 | 21.1% |
| Middle School | 4,809 | 25.2% |
| High School | 4,166 | 21.8% |
| College / Undergraduate | 3,325 | 17.4% |
| Graduate / Professional | 646 | 3.4% |
| Total | 19,066 | 100.0% |
School Enrollment by Age by Funding Source in Kissimmee
Out of a total of 19,066 students who are enrolled in schools in Kissimmee, 3,489 (18.3%) attend a private institution, while the remaining 15,577 (81.7%) are enrolled in public schools. The age group of 35 years and over has the highest likelihood of being enrolled in private schools, with 495 (52.4% in the age bracket) enrolled. Conversely, the age group of 15 to 17 year olds has the lowest likelihood of being enrolled in a private school, with 2,773 (97.1% in the age bracket) attending a public institution.
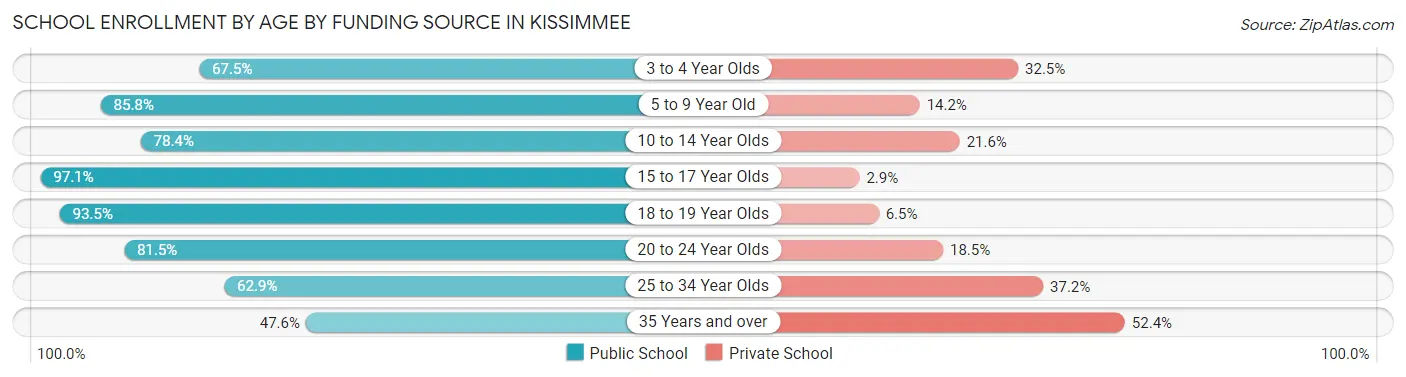
| Age Bracket | Public School | Private School |
| 3 to 4 Year Olds | 611 (67.5%) | 294 (32.5%) |
| 5 to 9 Year Old | 4,067 (85.8%) | 671 (14.2%) |
| 10 to 14 Year Olds | 4,549 (78.4%) | 1,254 (21.6%) |
| 15 to 17 Year Olds | 2,773 (97.1%) | 84 (2.9%) |
| 18 to 19 Year Olds | 1,147 (93.5%) | 80 (6.5%) |
| 20 to 24 Year Olds | 1,506 (81.5%) | 342 (18.5%) |
| 25 to 34 Year Olds | 467 (62.8%) | 276 (37.1%) |
| 35 Years and over | 450 (47.6%) | 495 (52.4%) |
| Total | 15,577 (81.7%) | 3,489 (18.3%) |
Educational Attainment by Field of Study in Kissimmee
Business (3,656 | 27.3%), science & technology (1,457 | 10.9%), education (1,398 | 10.4%), engineering (1,212 | 9.1%), and arts & humanities (884 | 6.6%) are the most common fields of study among 13,376 individuals in Kissimmee who have obtained a bachelor's degree or higher.
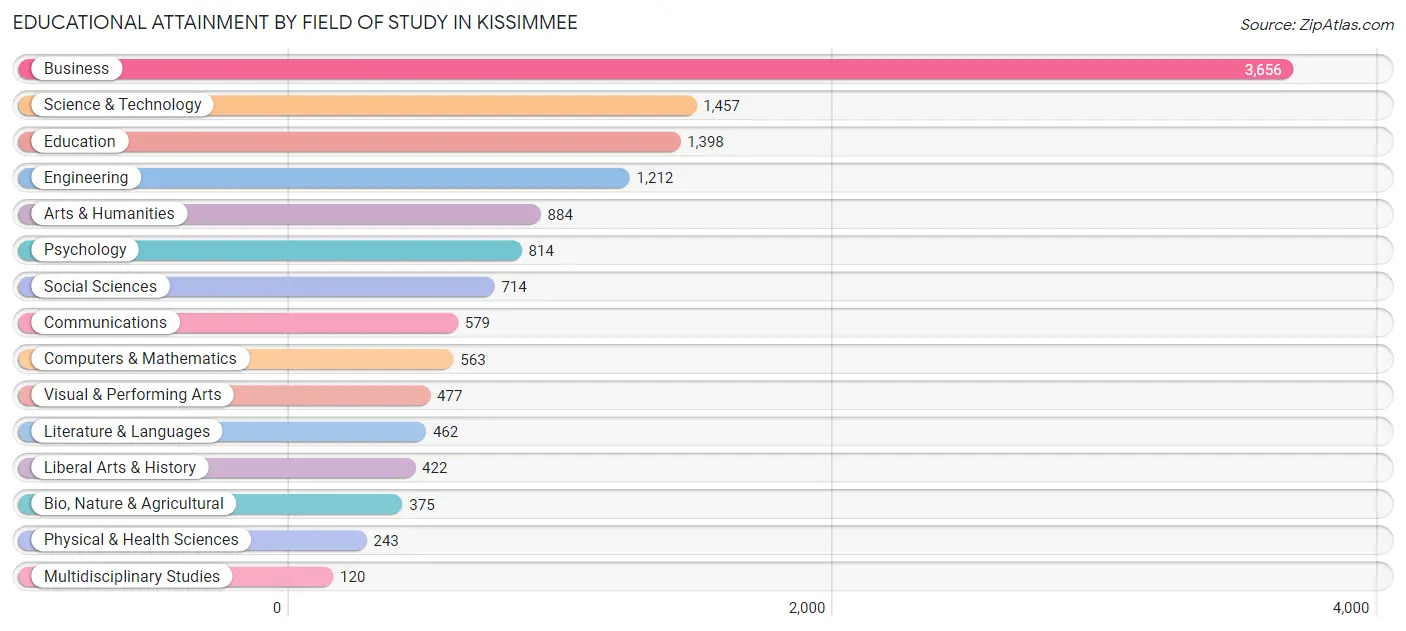
| Field of Study | # Graduates | % Graduates |
| Computers & Mathematics | 563 | 4.2% |
| Bio, Nature & Agricultural | 375 | 2.8% |
| Physical & Health Sciences | 243 | 1.8% |
| Psychology | 814 | 6.1% |
| Social Sciences | 714 | 5.3% |
| Engineering | 1,212 | 9.1% |
| Multidisciplinary Studies | 120 | 0.9% |
| Science & Technology | 1,457 | 10.9% |
| Business | 3,656 | 27.3% |
| Education | 1,398 | 10.4% |
| Literature & Languages | 462 | 3.5% |
| Liberal Arts & History | 422 | 3.2% |
| Visual & Performing Arts | 477 | 3.6% |
| Communications | 579 | 4.3% |
| Arts & Humanities | 884 | 6.6% |
| Total | 13,376 | 100.0% |
Transportation & Commute in Kissimmee
Vehicle Availability by Sex in Kissimmee
The most prevalent vehicle ownership categories in Kissimmee are males with 2 vehicles (8,713, accounting for 44.3%) and females with 2 vehicles (7,756, making up 51.4%).
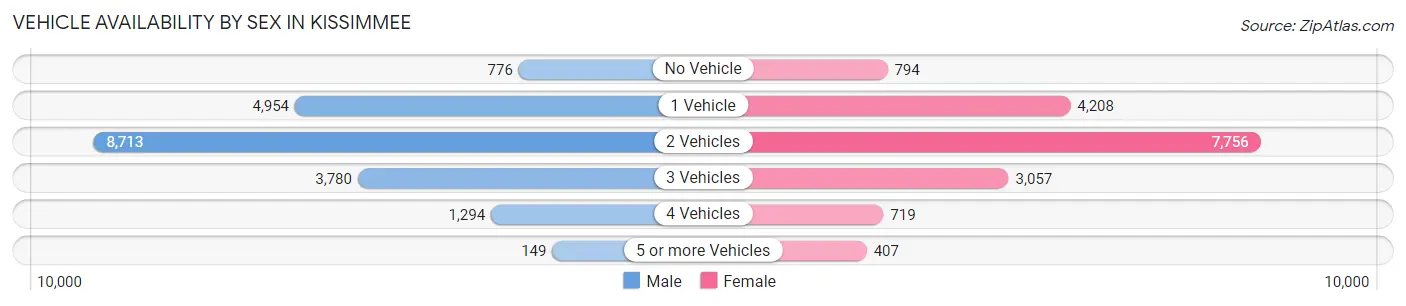
| Vehicles Available | Male | Female |
| No Vehicle | 776 (4.0%) | 794 (4.7%) |
| 1 Vehicle | 4,954 (25.2%) | 4,208 (24.8%) |
| 2 Vehicles | 8,713 (44.3%) | 7,756 (45.8%) |
| 3 Vehicles | 3,780 (19.2%) | 3,057 (18.0%) |
| 4 Vehicles | 1,294 (6.6%) | 719 (4.2%) |
| 5 or more Vehicles | 149 (0.8%) | 407 (2.4%) |
| Total | 19,666 (100.0%) | 16,941 (100.0%) |
Commute Time in Kissimmee
The most frequently occuring commute durations in Kissimmee are 30 to 34 minutes (6,667 commuters, 19.3%), 45 to 59 minutes (4,344 commuters, 12.6%), and 20 to 24 minutes (4,163 commuters, 12.1%).
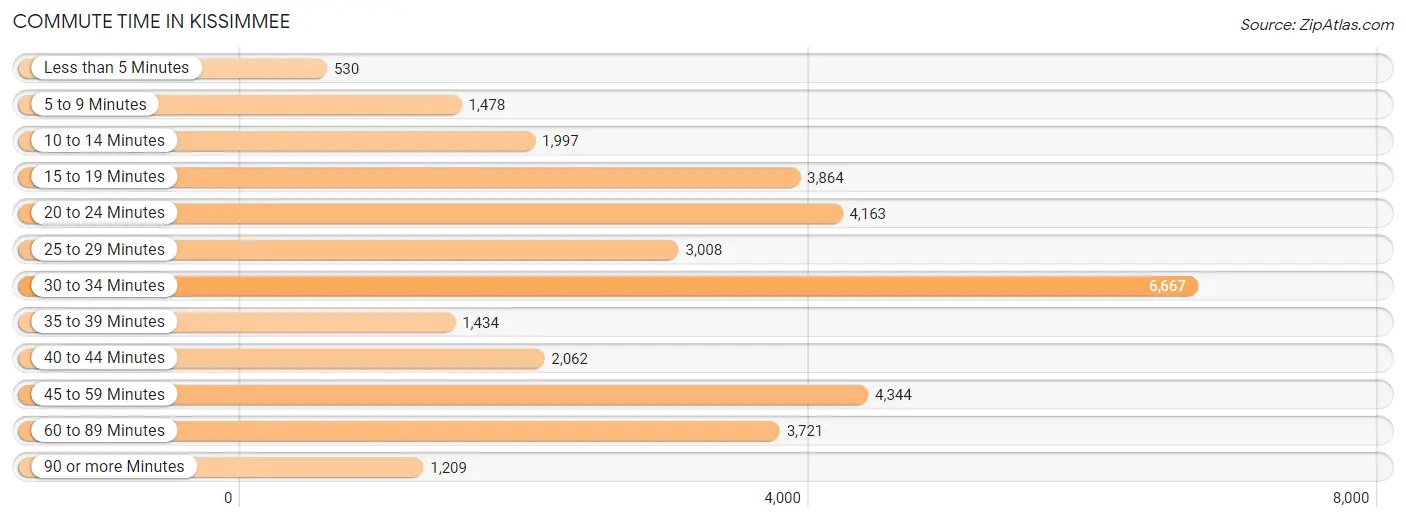
| Commute Time | # Commuters | % Commuters |
| Less than 5 Minutes | 530 | 1.5% |
| 5 to 9 Minutes | 1,478 | 4.3% |
| 10 to 14 Minutes | 1,997 | 5.8% |
| 15 to 19 Minutes | 3,864 | 11.2% |
| 20 to 24 Minutes | 4,163 | 12.1% |
| 25 to 29 Minutes | 3,008 | 8.7% |
| 30 to 34 Minutes | 6,667 | 19.3% |
| 35 to 39 Minutes | 1,434 | 4.2% |
| 40 to 44 Minutes | 2,062 | 6.0% |
| 45 to 59 Minutes | 4,344 | 12.6% |
| 60 to 89 Minutes | 3,721 | 10.8% |
| 90 or more Minutes | 1,209 | 3.5% |
Commute Time by Sex in Kissimmee
The most common commute times in Kissimmee are 30 to 34 minutes (3,467 commuters, 18.4%) for males and 30 to 34 minutes (3,200 commuters, 20.5%) for females.
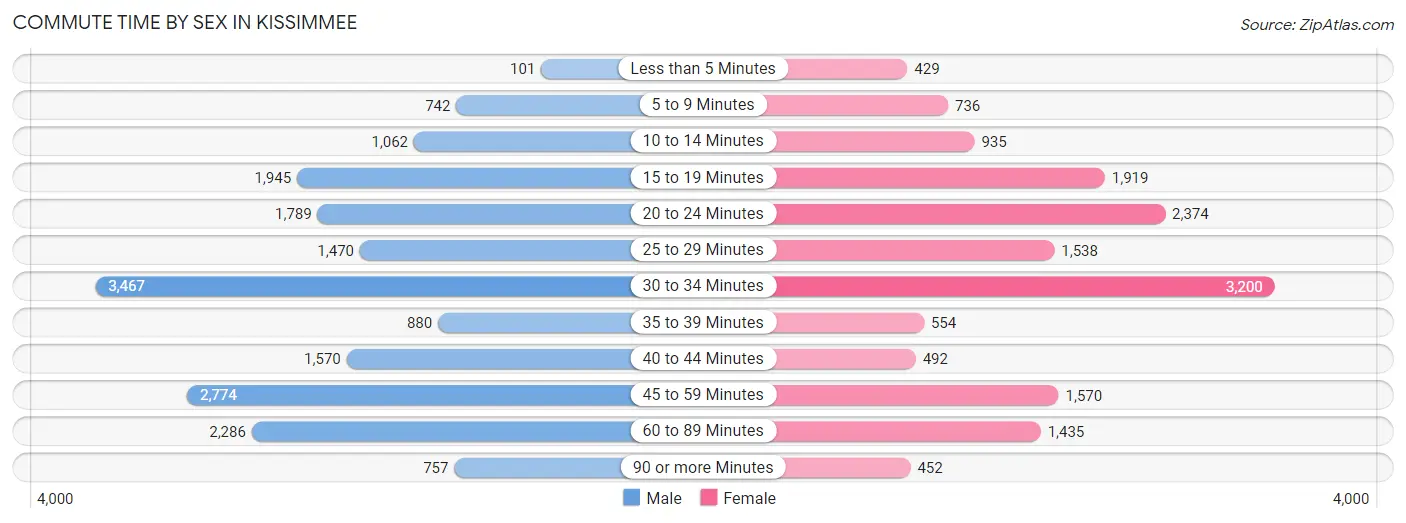
| Commute Time | Male | Female |
| Less than 5 Minutes | 101 (0.5%) | 429 (2.7%) |
| 5 to 9 Minutes | 742 (3.9%) | 736 (4.7%) |
| 10 to 14 Minutes | 1,062 (5.6%) | 935 (6.0%) |
| 15 to 19 Minutes | 1,945 (10.3%) | 1,919 (12.3%) |
| 20 to 24 Minutes | 1,789 (9.5%) | 2,374 (15.2%) |
| 25 to 29 Minutes | 1,470 (7.8%) | 1,538 (9.8%) |
| 30 to 34 Minutes | 3,467 (18.4%) | 3,200 (20.5%) |
| 35 to 39 Minutes | 880 (4.7%) | 554 (3.5%) |
| 40 to 44 Minutes | 1,570 (8.3%) | 492 (3.2%) |
| 45 to 59 Minutes | 2,774 (14.7%) | 1,570 (10.0%) |
| 60 to 89 Minutes | 2,286 (12.1%) | 1,435 (9.2%) |
| 90 or more Minutes | 757 (4.0%) | 452 (2.9%) |
Time of Departure to Work by Sex in Kissimmee
The most frequent times of departure to work in Kissimmee are 7:00 AM to 7:29 AM (2,628, 14.0%) for males and 7:00 AM to 7:29 AM (2,821, 18.0%) for females.
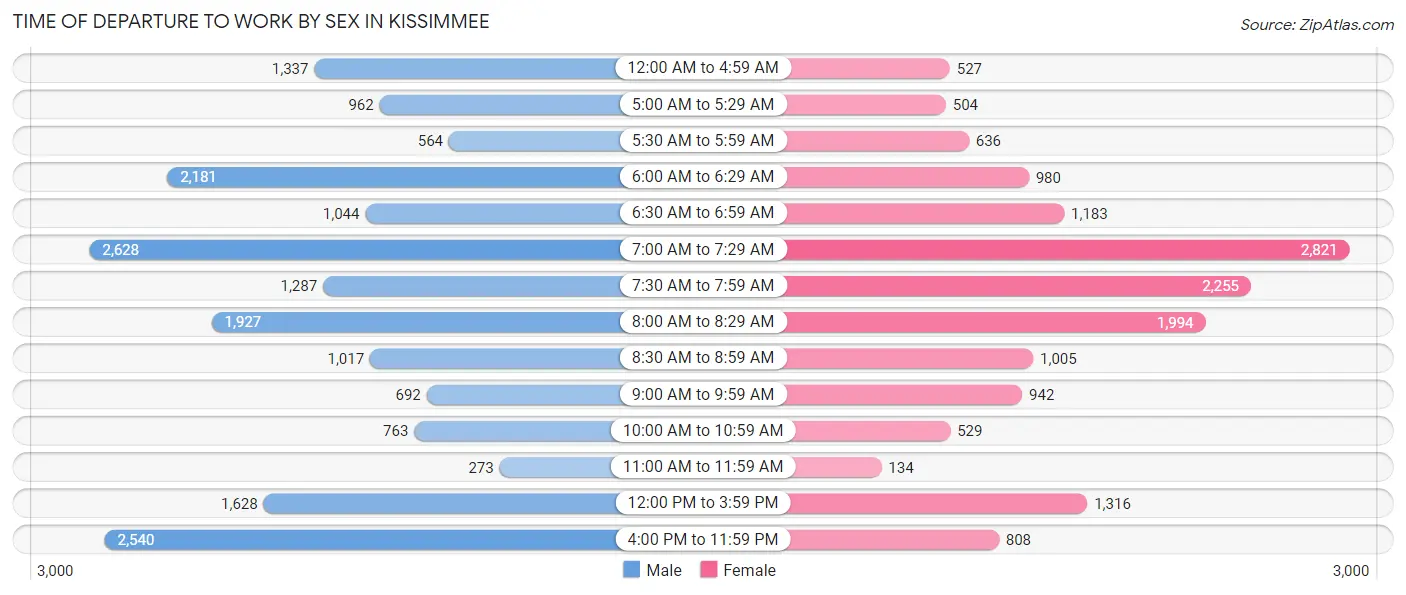
| Time of Departure | Male | Female |
| 12:00 AM to 4:59 AM | 1,337 (7.1%) | 527 (3.4%) |
| 5:00 AM to 5:29 AM | 962 (5.1%) | 504 (3.2%) |
| 5:30 AM to 5:59 AM | 564 (3.0%) | 636 (4.1%) |
| 6:00 AM to 6:29 AM | 2,181 (11.6%) | 980 (6.3%) |
| 6:30 AM to 6:59 AM | 1,044 (5.5%) | 1,183 (7.6%) |
| 7:00 AM to 7:29 AM | 2,628 (14.0%) | 2,821 (18.0%) |
| 7:30 AM to 7:59 AM | 1,287 (6.8%) | 2,255 (14.4%) |
| 8:00 AM to 8:29 AM | 1,927 (10.2%) | 1,994 (12.8%) |
| 8:30 AM to 8:59 AM | 1,017 (5.4%) | 1,005 (6.4%) |
| 9:00 AM to 9:59 AM | 692 (3.7%) | 942 (6.0%) |
| 10:00 AM to 10:59 AM | 763 (4.1%) | 529 (3.4%) |
| 11:00 AM to 11:59 AM | 273 (1.5%) | 134 (0.9%) |
| 12:00 PM to 3:59 PM | 1,628 (8.6%) | 1,316 (8.4%) |
| 4:00 PM to 11:59 PM | 2,540 (13.5%) | 808 (5.2%) |
| Total | 18,843 (100.0%) | 15,634 (100.0%) |
Housing Occupancy in Kissimmee
Occupancy by Ownership in Kissimmee
Of the total 24,291 dwellings in Kissimmee, owner-occupied units account for 11,408 (47.0%), while renter-occupied units make up 12,883 (53.0%).
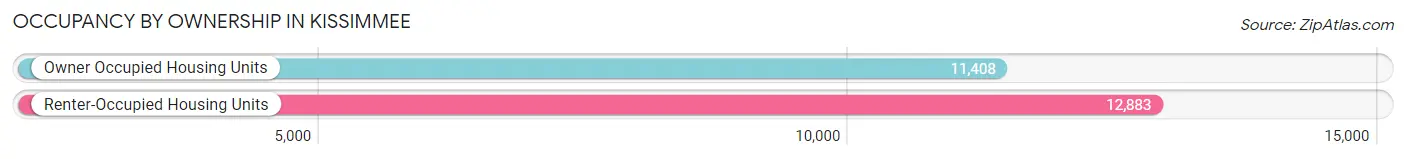
| Occupancy | # Housing Units | % Housing Units |
| Owner Occupied Housing Units | 11,408 | 47.0% |
| Renter-Occupied Housing Units | 12,883 | 53.0% |
| Total Occupied Housing Units | 24,291 | 100.0% |
Occupancy by Household Size in Kissimmee
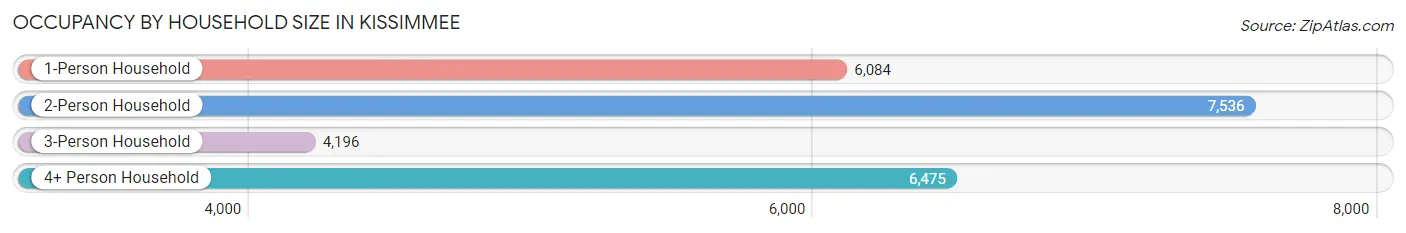
| Household Size | # Housing Units | % Housing Units |
| 1-Person Household | 6,084 | 25.1% |
| 2-Person Household | 7,536 | 31.0% |
| 3-Person Household | 4,196 | 17.3% |
| 4+ Person Household | 6,475 | 26.7% |
| Total Housing Units | 24,291 | 100.0% |
Occupancy by Ownership by Household Size in Kissimmee
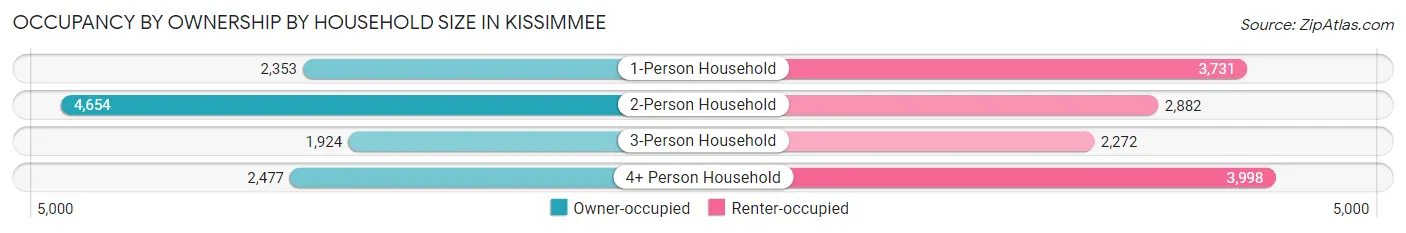
| Household Size | Owner-occupied | Renter-occupied |
| 1-Person Household | 2,353 (38.7%) | 3,731 (61.3%) |
| 2-Person Household | 4,654 (61.8%) | 2,882 (38.2%) |
| 3-Person Household | 1,924 (45.9%) | 2,272 (54.1%) |
| 4+ Person Household | 2,477 (38.3%) | 3,998 (61.8%) |
| Total Housing Units | 11,408 (47.0%) | 12,883 (53.0%) |
Occupancy by Educational Attainment in Kissimmee
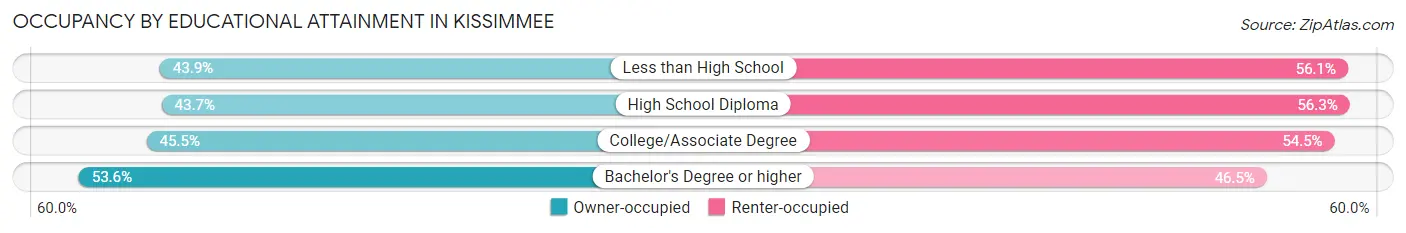
| Household Size | Owner-occupied | Renter-occupied |
| Less than High School | 1,271 (43.9%) | 1,624 (56.1%) |
| High School Diploma | 3,191 (43.7%) | 4,111 (56.3%) |
| College/Associate Degree | 3,393 (45.5%) | 4,066 (54.5%) |
| Bachelor's Degree or higher | 3,553 (53.5%) | 3,082 (46.5%) |
Occupancy by Age of Householder in Kissimmee
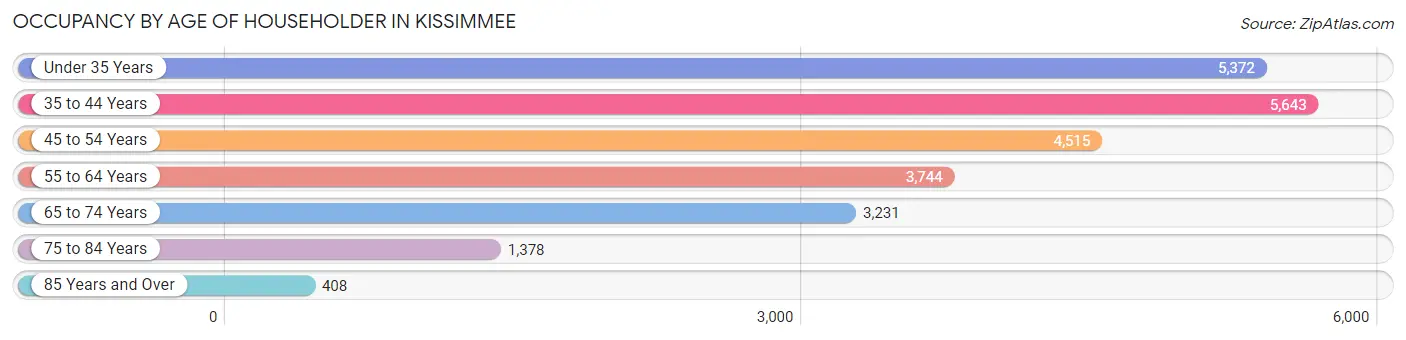
| Age Bracket | # Households | % Households |
| Under 35 Years | 5,372 | 22.1% |
| 35 to 44 Years | 5,643 | 23.2% |
| 45 to 54 Years | 4,515 | 18.6% |
| 55 to 64 Years | 3,744 | 15.4% |
| 65 to 74 Years | 3,231 | 13.3% |
| 75 to 84 Years | 1,378 | 5.7% |
| 85 Years and Over | 408 | 1.7% |
| Total | 24,291 | 100.0% |
Housing Finances in Kissimmee
Median Income by Occupancy in Kissimmee
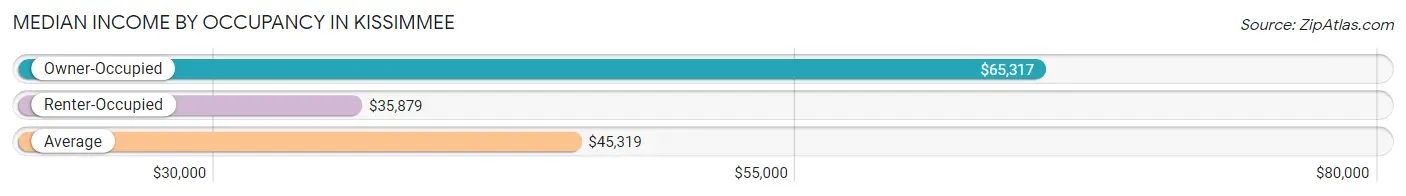
| Occupancy Type | # Households | Median Income |
| Owner-Occupied | 11,408 (47.0%) | $65,317 |
| Renter-Occupied | 12,883 (53.0%) | $35,879 |
| Average | 24,291 (100.0%) | $45,319 |
Occupancy by Householder Income Bracket in Kissimmee
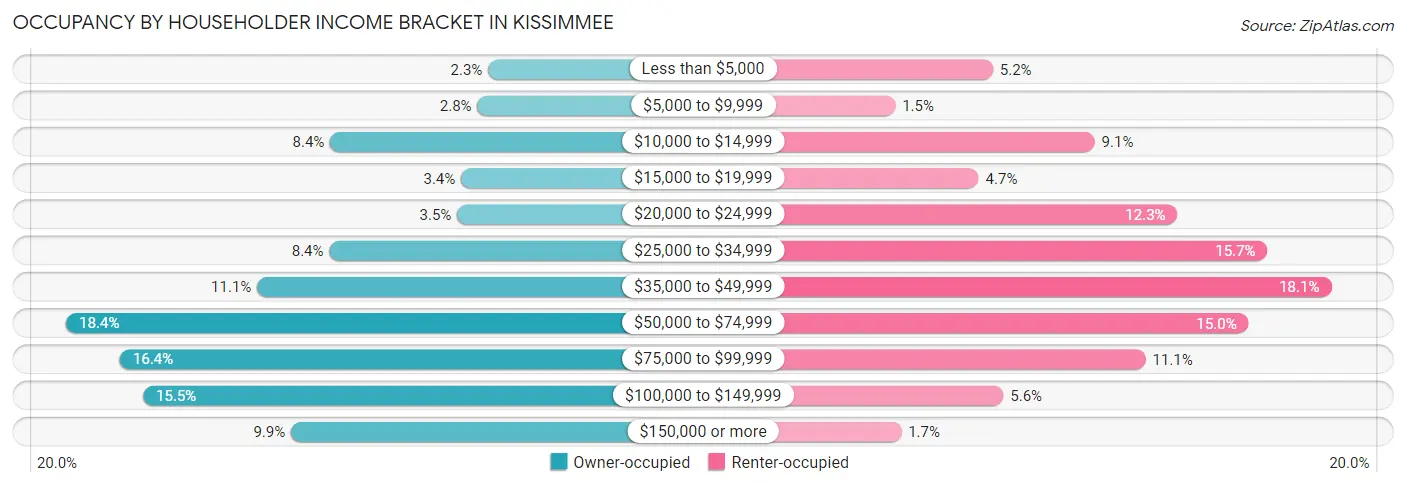
| Income Bracket | Owner-occupied | Renter-occupied |
| Less than $5,000 | 267 (2.3%) | 674 (5.2%) |
| $5,000 to $9,999 | 314 (2.8%) | 195 (1.5%) |
| $10,000 to $14,999 | 954 (8.4%) | 1,173 (9.1%) |
| $15,000 to $19,999 | 384 (3.4%) | 604 (4.7%) |
| $20,000 to $24,999 | 401 (3.5%) | 1,580 (12.3%) |
| $25,000 to $34,999 | 957 (8.4%) | 2,021 (15.7%) |
| $35,000 to $49,999 | 1,271 (11.1%) | 2,334 (18.1%) |
| $50,000 to $74,999 | 2,101 (18.4%) | 1,929 (15.0%) |
| $75,000 to $99,999 | 1,868 (16.4%) | 1,424 (11.1%) |
| $100,000 to $149,999 | 1,767 (15.5%) | 725 (5.6%) |
| $150,000 or more | 1,124 (9.9%) | 224 (1.7%) |
| Total | 11,408 (100.0%) | 12,883 (100.0%) |
Monthly Housing Cost Tiers in Kissimmee
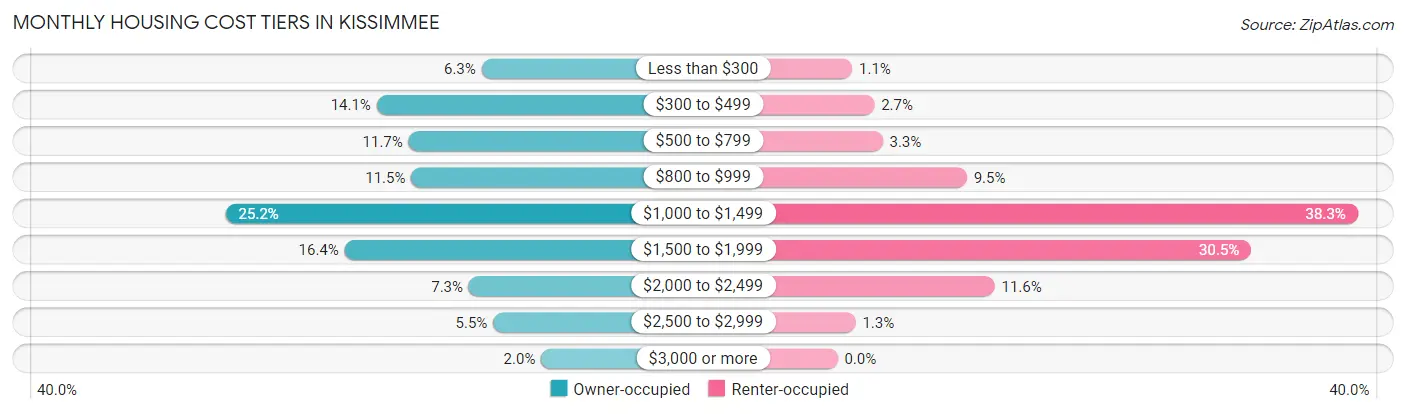
| Monthly Cost | Owner-occupied | Renter-occupied |
| Less than $300 | 723 (6.3%) | 139 (1.1%) |
| $300 to $499 | 1,605 (14.1%) | 349 (2.7%) |
| $500 to $799 | 1,337 (11.7%) | 428 (3.3%) |
| $800 to $999 | 1,314 (11.5%) | 1,226 (9.5%) |
| $1,000 to $1,499 | 2,876 (25.2%) | 4,935 (38.3%) |
| $1,500 to $1,999 | 1,874 (16.4%) | 3,925 (30.5%) |
| $2,000 to $2,499 | 831 (7.3%) | 1,490 (11.6%) |
| $2,500 to $2,999 | 626 (5.5%) | 171 (1.3%) |
| $3,000 or more | 222 (1.9%) | 0 (0.0%) |
| Total | 11,408 (100.0%) | 12,883 (100.0%) |
Physical Housing Characteristics in Kissimmee
Housing Structures in Kissimmee
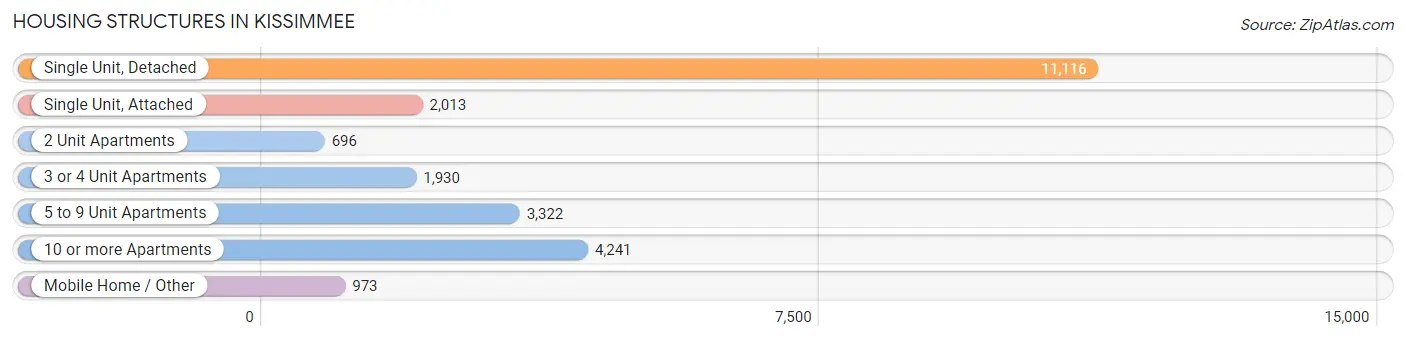
| Structure Type | # Housing Units | % Housing Units |
| Single Unit, Detached | 11,116 | 45.8% |
| Single Unit, Attached | 2,013 | 8.3% |
| 2 Unit Apartments | 696 | 2.9% |
| 3 or 4 Unit Apartments | 1,930 | 8.0% |
| 5 to 9 Unit Apartments | 3,322 | 13.7% |
| 10 or more Apartments | 4,241 | 17.5% |
| Mobile Home / Other | 973 | 4.0% |
| Total | 24,291 | 100.0% |
Housing Structures by Occupancy in Kissimmee
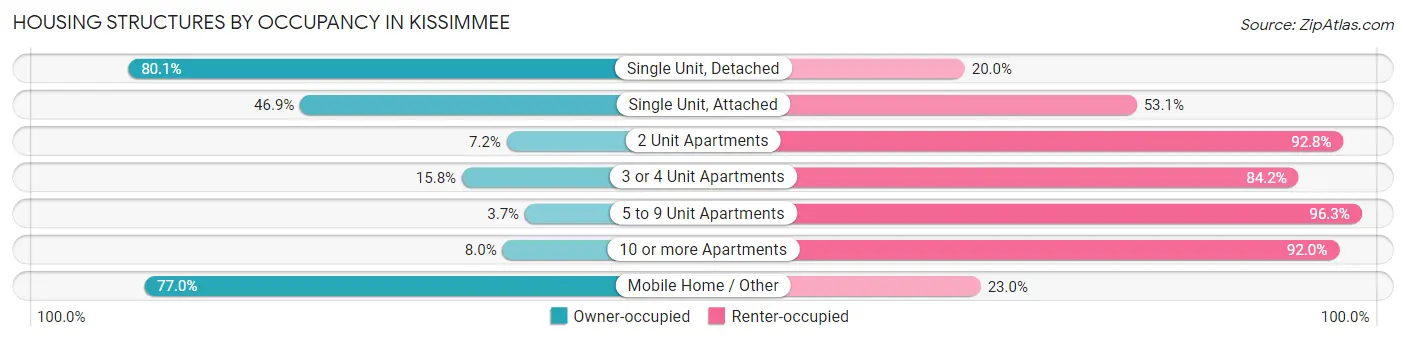
| Structure Type | Owner-occupied | Renter-occupied |
| Single Unit, Detached | 8,898 (80.0%) | 2,218 (20.0%) |
| Single Unit, Attached | 945 (46.9%) | 1,068 (53.1%) |
| 2 Unit Apartments | 50 (7.2%) | 646 (92.8%) |
| 3 or 4 Unit Apartments | 305 (15.8%) | 1,625 (84.2%) |
| 5 to 9 Unit Apartments | 122 (3.7%) | 3,200 (96.3%) |
| 10 or more Apartments | 339 (8.0%) | 3,902 (92.0%) |
| Mobile Home / Other | 749 (77.0%) | 224 (23.0%) |
| Total | 11,408 (47.0%) | 12,883 (53.0%) |
Housing Structures by Number of Rooms in Kissimmee
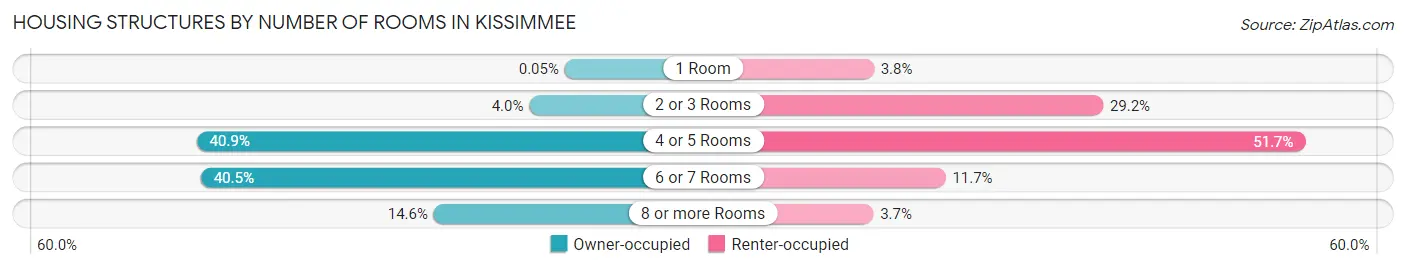
| Number of Rooms | Owner-occupied | Renter-occupied |
| 1 Room | 6 (0.1%) | 483 (3.7%) |
| 2 or 3 Rooms | 455 (4.0%) | 3,761 (29.2%) |
| 4 or 5 Rooms | 4,668 (40.9%) | 6,654 (51.6%) |
| 6 or 7 Rooms | 4,615 (40.5%) | 1,508 (11.7%) |
| 8 or more Rooms | 1,664 (14.6%) | 477 (3.7%) |
| Total | 11,408 (100.0%) | 12,883 (100.0%) |
Housing Structure by Heating Type in Kissimmee
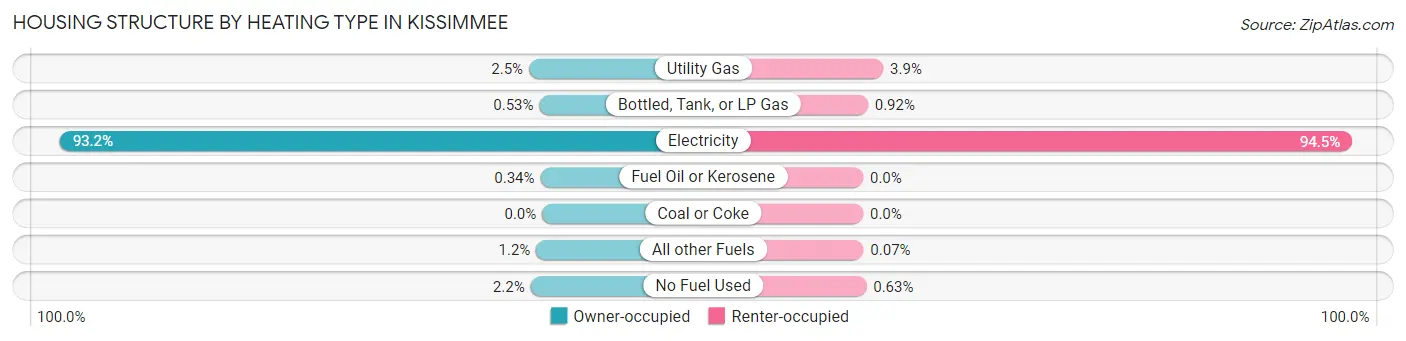
| Heating Type | Owner-occupied | Renter-occupied |
| Utility Gas | 290 (2.5%) | 501 (3.9%) |
| Bottled, Tank, or LP Gas | 60 (0.5%) | 119 (0.9%) |
| Electricity | 10,632 (93.2%) | 12,173 (94.5%) |
| Fuel Oil or Kerosene | 39 (0.3%) | 0 (0.0%) |
| Coal or Coke | 0 (0.0%) | 0 (0.0%) |
| All other Fuels | 131 (1.1%) | 9 (0.1%) |
| No Fuel Used | 256 (2.2%) | 81 (0.6%) |
| Total | 11,408 (100.0%) | 12,883 (100.0%) |
Household Vehicle Usage in Kissimmee
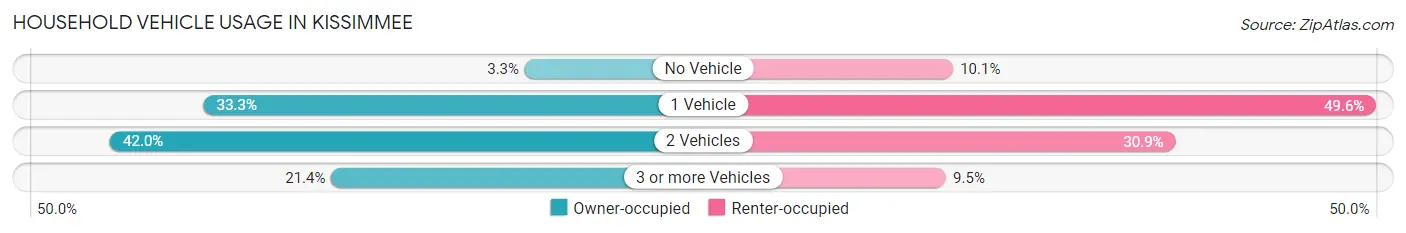
| Vehicles per Household | Owner-occupied | Renter-occupied |
| No Vehicle | 377 (3.3%) | 1,302 (10.1%) |
| 1 Vehicle | 3,798 (33.3%) | 6,389 (49.6%) |
| 2 Vehicles | 4,795 (42.0%) | 3,974 (30.8%) |
| 3 or more Vehicles | 2,438 (21.4%) | 1,218 (9.5%) |
| Total | 11,408 (100.0%) | 12,883 (100.0%) |
Real Estate & Mortgages in Kissimmee
Real Estate and Mortgage Overview in Kissimmee
| Characteristic | Without Mortgage | With Mortgage |
| Housing Units | 4,465 | 6,943 |
| Median Property Value | $214,000 | $279,700 |
| Median Household Income | $45,568 | $822 |
| Monthly Housing Costs | $491 | $222 |
| Real Estate Taxes | $1,189 | $130 |
Property Value by Mortgage Status in Kissimmee
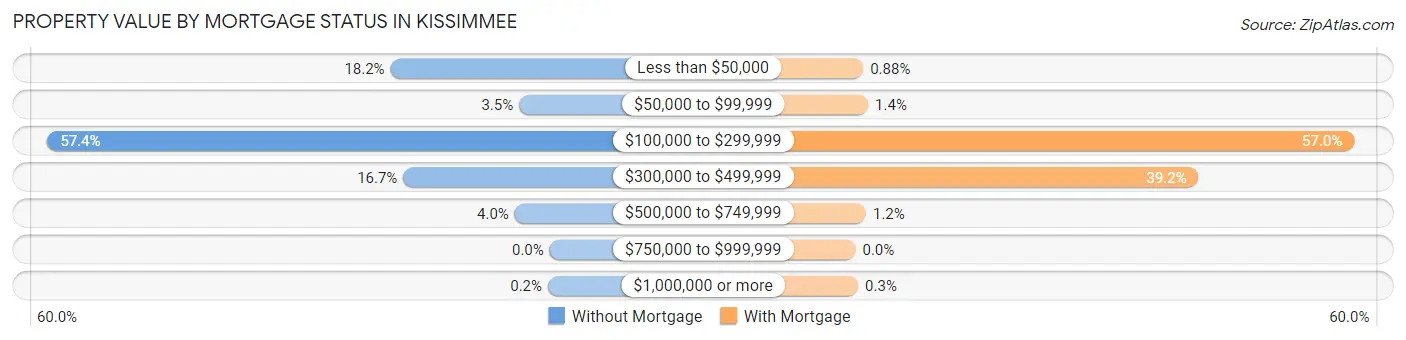
| Property Value | Without Mortgage | With Mortgage |
| Less than $50,000 | 812 (18.2%) | 61 (0.9%) |
| $50,000 to $99,999 | 156 (3.5%) | 100 (1.4%) |
| $100,000 to $299,999 | 2,563 (57.4%) | 3,956 (57.0%) |
| $300,000 to $499,999 | 747 (16.7%) | 2,722 (39.2%) |
| $500,000 to $749,999 | 178 (4.0%) | 83 (1.2%) |
| $750,000 to $999,999 | 0 (0.0%) | 0 (0.0%) |
| $1,000,000 or more | 9 (0.2%) | 21 (0.3%) |
| Total | 4,465 (100.0%) | 6,943 (100.0%) |
Household Income by Mortgage Status in Kissimmee
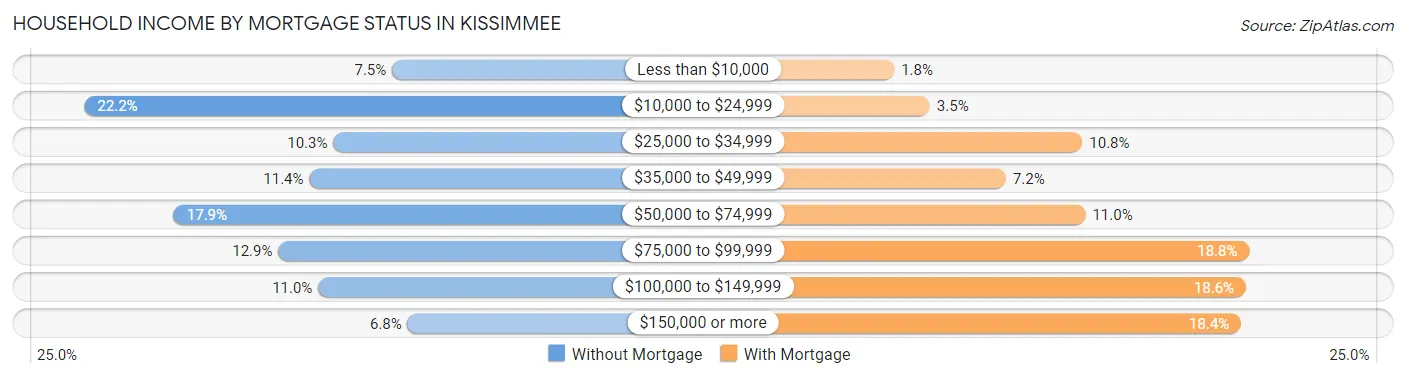
| Household Income | Without Mortgage | With Mortgage |
| Less than $10,000 | 335 (7.5%) | 128 (1.8%) |
| $10,000 to $24,999 | 989 (22.2%) | 246 (3.5%) |
| $25,000 to $34,999 | 460 (10.3%) | 750 (10.8%) |
| $35,000 to $49,999 | 511 (11.4%) | 497 (7.2%) |
| $50,000 to $74,999 | 799 (17.9%) | 760 (11.0%) |
| $75,000 to $99,999 | 577 (12.9%) | 1,302 (18.8%) |
| $100,000 to $149,999 | 492 (11.0%) | 1,291 (18.6%) |
| $150,000 or more | 302 (6.8%) | 1,275 (18.4%) |
| Total | 4,465 (100.0%) | 6,943 (100.0%) |
Property Value to Household Income Ratio in Kissimmee
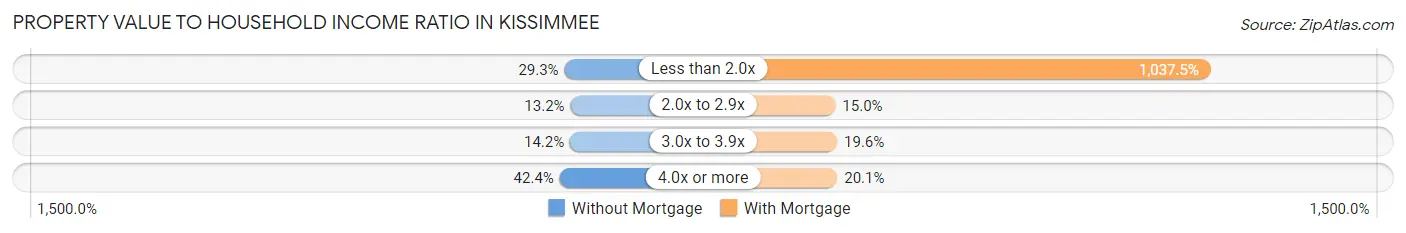
| Value-to-Income Ratio | Without Mortgage | With Mortgage |
| Less than 2.0x | 1,310 (29.3%) | 72,035 (1,037.5%) |
| 2.0x to 2.9x | 589 (13.2%) | 1,041 (15.0%) |
| 3.0x to 3.9x | 634 (14.2%) | 1,361 (19.6%) |
| 4.0x or more | 1,895 (42.4%) | 1,398 (20.1%) |
| Total | 4,465 (100.0%) | 6,943 (100.0%) |
Real Estate Taxes by Mortgage Status in Kissimmee
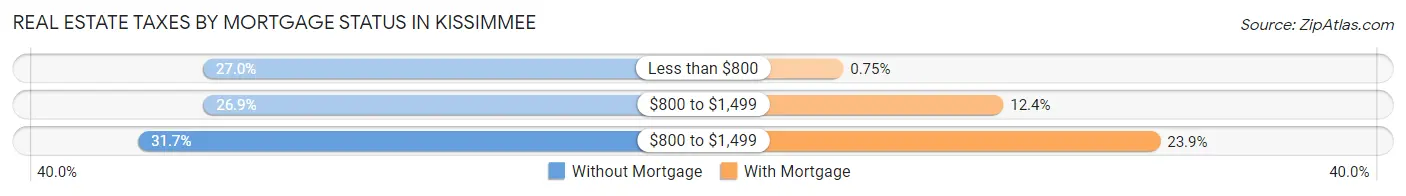
| Property Taxes | Without Mortgage | With Mortgage |
| Less than $800 | 1,204 (27.0%) | 52 (0.7%) |
| $800 to $1,499 | 1,203 (26.9%) | 864 (12.4%) |
| $800 to $1,499 | 1,416 (31.7%) | 1,660 (23.9%) |
| Total | 4,465 (100.0%) | 6,943 (100.0%) |
Health & Disability in Kissimmee
Health Insurance Coverage by Age in Kissimmee
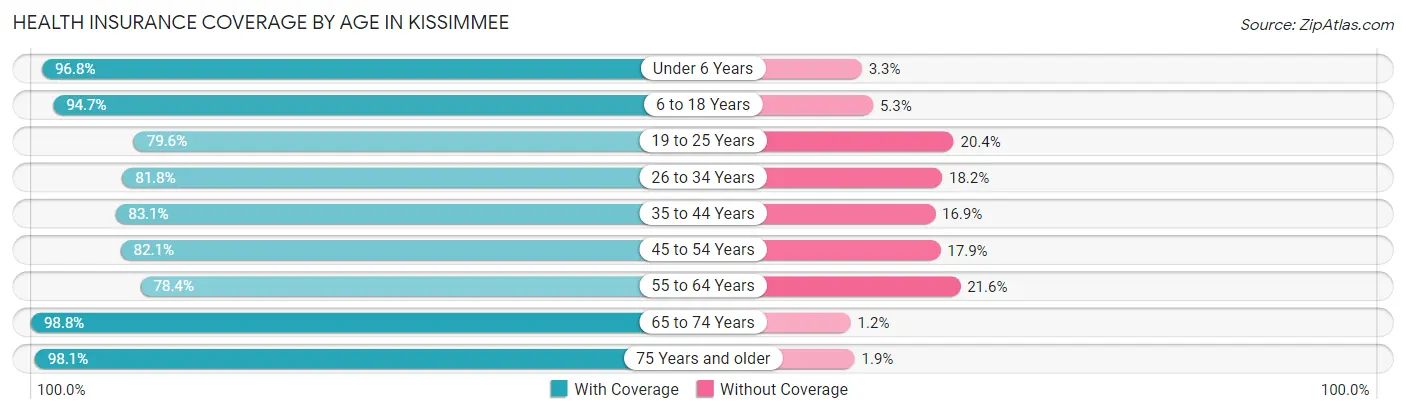
| Age Bracket | With Coverage | Without Coverage |
| Under 6 Years | 5,545 (96.8%) | 186 (3.3%) |
| 6 to 18 Years | 12,948 (94.7%) | 730 (5.3%) |
| 19 to 25 Years | 6,070 (79.6%) | 1,553 (20.4%) |
| 26 to 34 Years | 8,868 (81.8%) | 1,977 (18.2%) |
| 35 to 44 Years | 10,652 (83.1%) | 2,169 (16.9%) |
| 45 to 54 Years | 7,470 (82.1%) | 1,631 (17.9%) |
| 55 to 64 Years | 6,607 (78.4%) | 1,822 (21.6%) |
| 65 to 74 Years | 5,641 (98.8%) | 68 (1.2%) |
| 75 Years and older | 3,732 (98.1%) | 73 (1.9%) |
| Total | 67,533 (86.9%) | 10,209 (13.1%) |
Health Insurance Coverage by Citizenship Status in Kissimmee
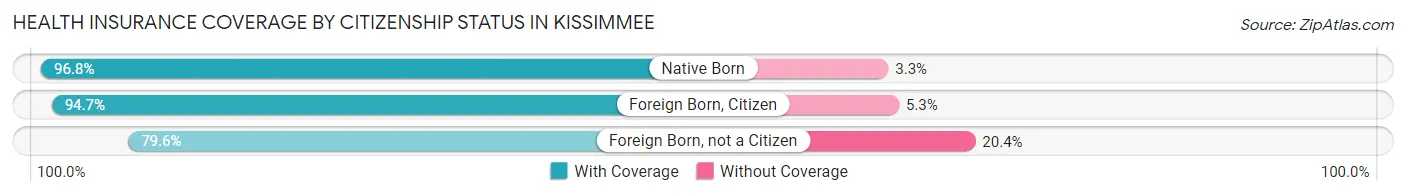
| Citizenship Status | With Coverage | Without Coverage |
| Native Born | 5,545 (96.8%) | 186 (3.3%) |
| Foreign Born, Citizen | 12,948 (94.7%) | 730 (5.3%) |
| Foreign Born, not a Citizen | 6,070 (79.6%) | 1,553 (20.4%) |
Health Insurance Coverage by Household Income in Kissimmee
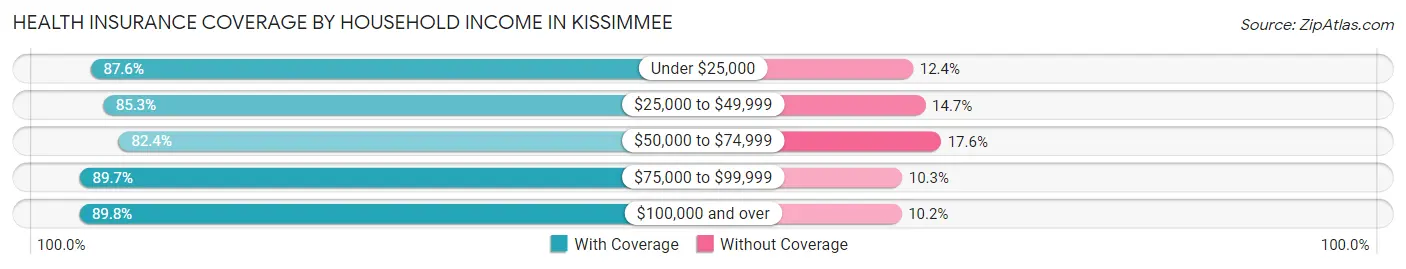
| Household Income | With Coverage | Without Coverage |
| Under $25,000 | 14,244 (87.6%) | 2,008 (12.4%) |
| $25,000 to $49,999 | 15,805 (85.3%) | 2,718 (14.7%) |
| $50,000 to $74,999 | 11,378 (82.4%) | 2,430 (17.6%) |
| $75,000 to $99,999 | 11,243 (89.7%) | 1,292 (10.3%) |
| $100,000 and over | 14,821 (89.8%) | 1,681 (10.2%) |
Public vs Private Health Insurance Coverage by Age in Kissimmee
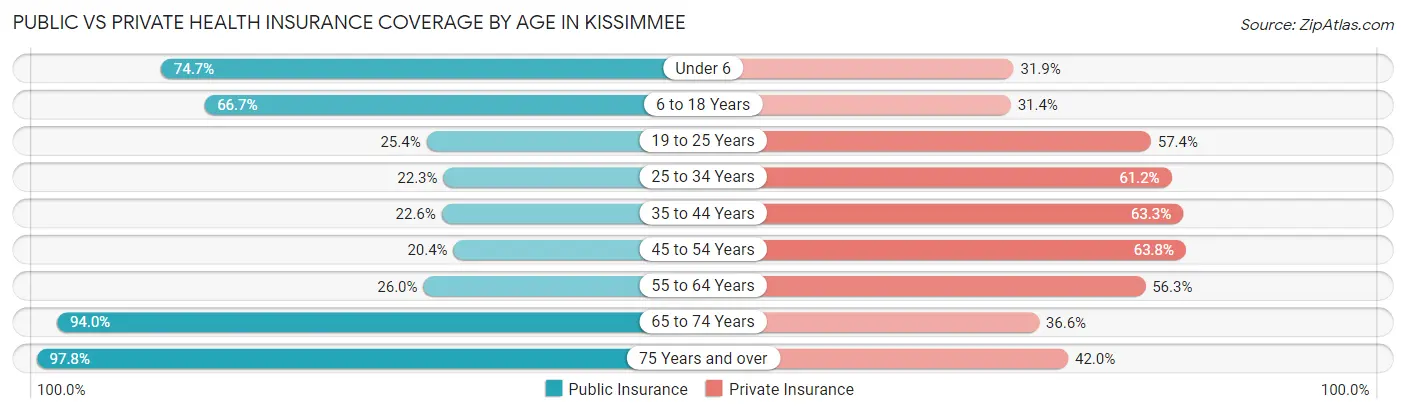
| Age Bracket | Public Insurance | Private Insurance |
| Under 6 | 4,281 (74.7%) | 1,827 (31.9%) |
| 6 to 18 Years | 9,116 (66.6%) | 4,288 (31.4%) |
| 19 to 25 Years | 1,936 (25.4%) | 4,372 (57.4%) |
| 25 to 34 Years | 2,415 (22.3%) | 6,635 (61.2%) |
| 35 to 44 Years | 2,898 (22.6%) | 8,120 (63.3%) |
| 45 to 54 Years | 1,857 (20.4%) | 5,810 (63.8%) |
| 55 to 64 Years | 2,190 (26.0%) | 4,747 (56.3%) |
| 65 to 74 Years | 5,366 (94.0%) | 2,089 (36.6%) |
| 75 Years and over | 3,720 (97.8%) | 1,598 (42.0%) |
| Total | 33,779 (43.4%) | 39,486 (50.8%) |
Disability Status by Sex by Age in Kissimmee
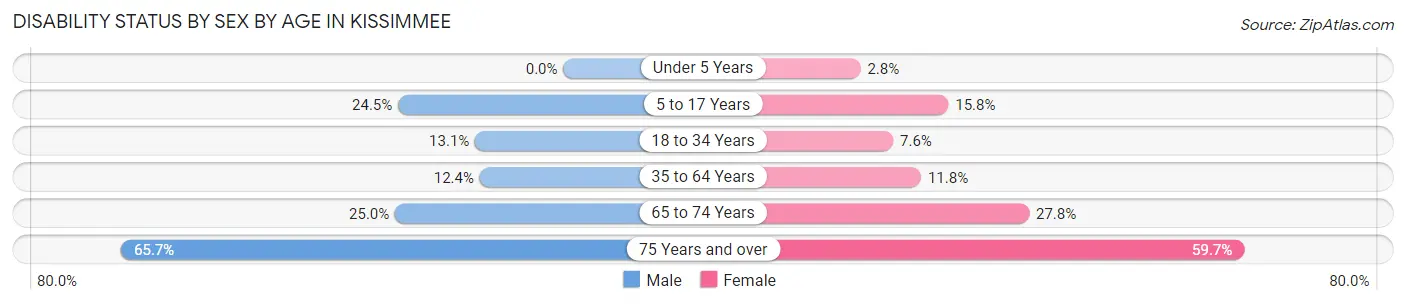
| Age Bracket | Male | Female |
| Under 5 Years | 0 (0.0%) | 62 (2.8%) |
| 5 to 17 Years | 1,879 (24.5%) | 958 (15.8%) |
| 18 to 34 Years | 1,377 (13.1%) | 682 (7.6%) |
| 35 to 64 Years | 1,764 (12.4%) | 1,898 (11.8%) |
| 65 to 74 Years | 684 (25.0%) | 826 (27.8%) |
| 75 Years and over | 1,036 (65.7%) | 1,331 (59.7%) |
Disability Class by Sex by Age in Kissimmee
Disability Class: Hearing Difficulty
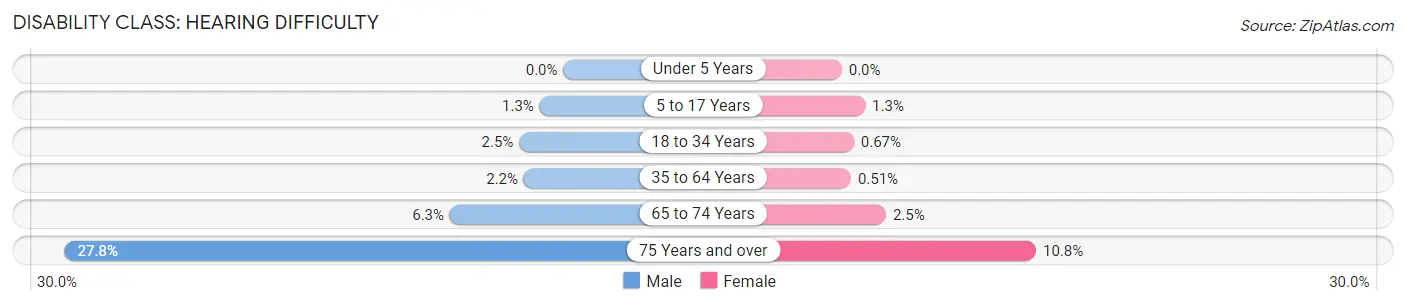
| Age Bracket | Male | Female |
| Under 5 Years | 0 (0.0%) | 0 (0.0%) |
| 5 to 17 Years | 101 (1.3%) | 79 (1.3%) |
| 18 to 34 Years | 259 (2.5%) | 60 (0.7%) |
| 35 to 64 Years | 312 (2.2%) | 82 (0.5%) |
| 65 to 74 Years | 173 (6.3%) | 73 (2.5%) |
| 75 Years and over | 438 (27.8%) | 241 (10.8%) |
Disability Class: Vision Difficulty
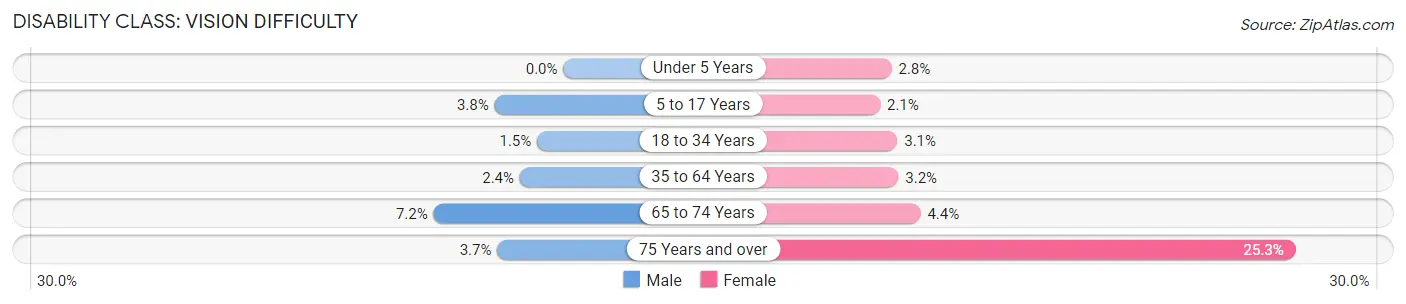
| Age Bracket | Male | Female |
| Under 5 Years | 0 (0.0%) | 62 (2.8%) |
| 5 to 17 Years | 293 (3.8%) | 129 (2.1%) |
| 18 to 34 Years | 153 (1.5%) | 277 (3.1%) |
| 35 to 64 Years | 344 (2.4%) | 508 (3.2%) |
| 65 to 74 Years | 198 (7.2%) | 130 (4.4%) |
| 75 Years and over | 58 (3.7%) | 563 (25.3%) |
Disability Class: Cognitive Difficulty
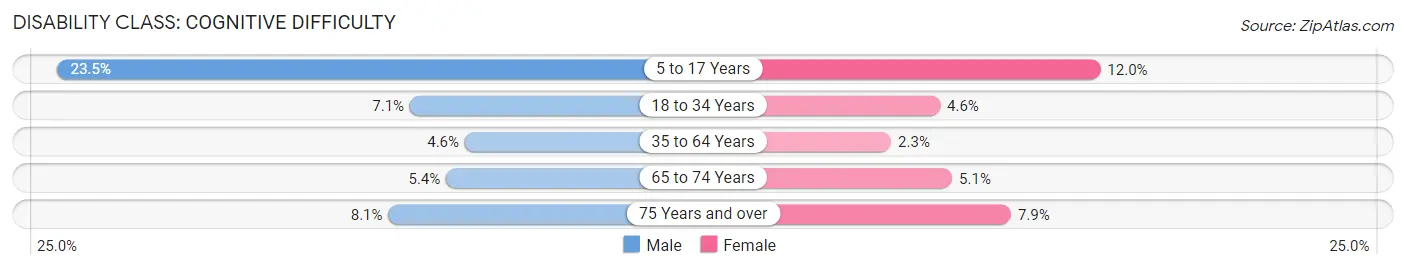
| Age Bracket | Male | Female |
| 5 to 17 Years | 1,797 (23.5%) | 727 (12.0%) |
| 18 to 34 Years | 748 (7.1%) | 408 (4.6%) |
| 35 to 64 Years | 649 (4.6%) | 370 (2.3%) |
| 65 to 74 Years | 149 (5.4%) | 152 (5.1%) |
| 75 Years and over | 128 (8.1%) | 175 (7.9%) |
Disability Class: Ambulatory Difficulty
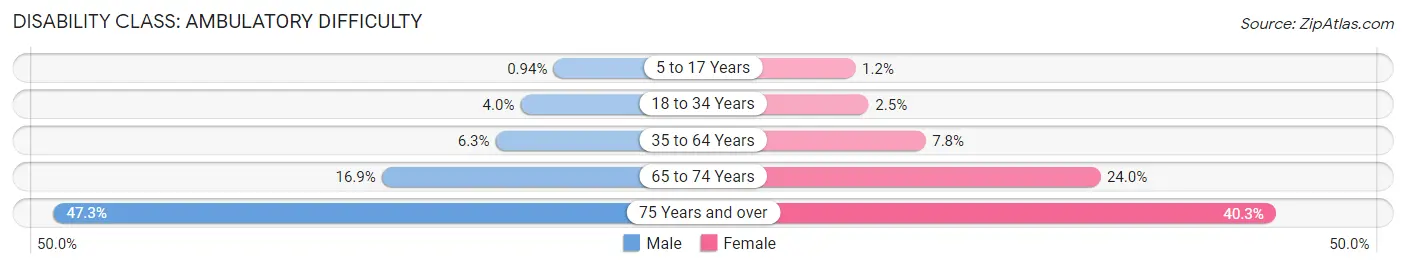
| Age Bracket | Male | Female |
| 5 to 17 Years | 72 (0.9%) | 75 (1.2%) |
| 18 to 34 Years | 421 (4.0%) | 221 (2.5%) |
| 35 to 64 Years | 897 (6.3%) | 1,251 (7.7%) |
| 65 to 74 Years | 462 (16.9%) | 712 (24.0%) |
| 75 Years and over | 746 (47.3%) | 897 (40.3%) |
Disability Class: Self-Care Difficulty
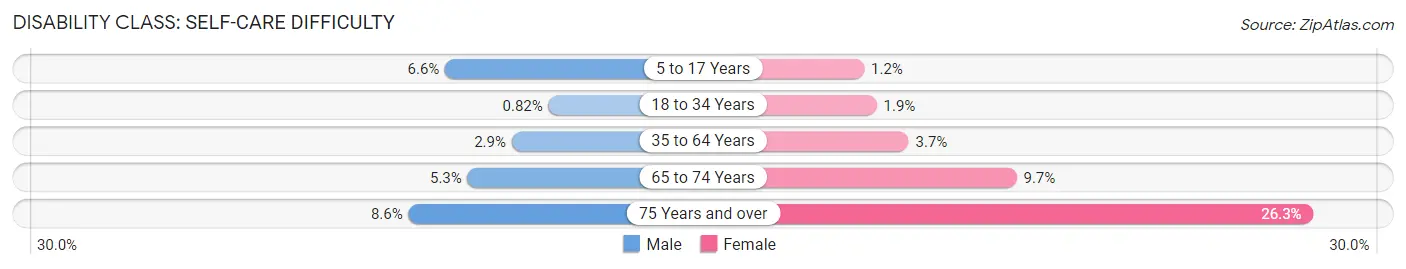
| Age Bracket | Male | Female |
| 5 to 17 Years | 504 (6.6%) | 75 (1.2%) |
| 18 to 34 Years | 86 (0.8%) | 174 (1.9%) |
| 35 to 64 Years | 408 (2.9%) | 600 (3.7%) |
| 65 to 74 Years | 146 (5.3%) | 289 (9.7%) |
| 75 Years and over | 136 (8.6%) | 585 (26.3%) |
Technology Access in Kissimmee
Computing Device Access in Kissimmee
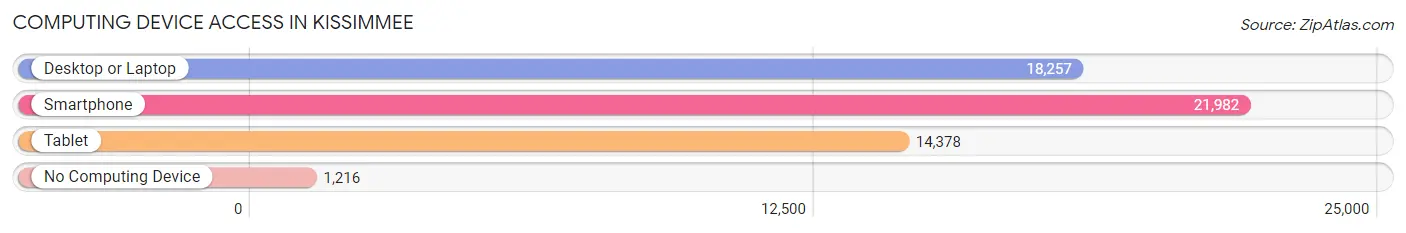
| Device Type | # Households | % Households |
| Desktop or Laptop | 18,257 | 75.2% |
| Smartphone | 21,982 | 90.5% |
| Tablet | 14,378 | 59.2% |
| No Computing Device | 1,216 | 5.0% |
| Total | 24,291 | 100.0% |
Internet Access in Kissimmee
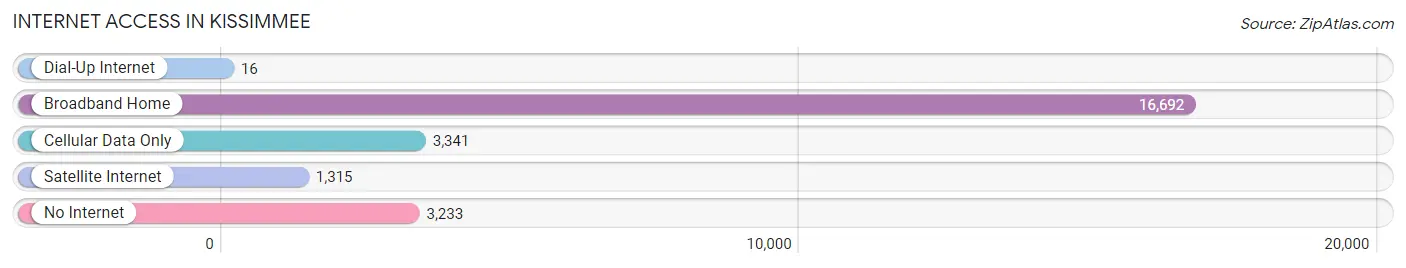
| Internet Type | # Households | % Households |
| Dial-Up Internet | 16 | 0.1% |
| Broadband Home | 16,692 | 68.7% |
| Cellular Data Only | 3,341 | 13.8% |
| Satellite Internet | 1,315 | 5.4% |
| No Internet | 3,233 | 13.3% |
| Total | 24,291 | 100.0% |
Kissimmee Summary
Kissimmee is a city located in Osceola County, Florida, United States. It is the county seat of Osceola County and is located approximately 22 miles south of Orlando and 28 miles east of Tampa. The city is part of the Orlando-Kissimmee-Sanford Metropolitan Statistical Area. As of the 2010 census, the city had a population of 59,682. It is the largest city in Osceola County and the fifth largest in Central Florida.
History
Kissimmee was originally named Allendale after Confederate Major J. H. Allen who operated the first cargo steamboat along the Kissimmee River. In 1883, the town was renamed Kissimmee after the creek that ran through the area. The creek was named after the Seminole Indian word for “long water”.
The city was incorporated in 1883 and was the first incorporated city in Osceola County. The city was a major cattle shipping center and was known as the “Cattle Capital of the World”. In the late 19th century, the city was a major tourist destination and was known as the “Gateway to the South”.
Geography
Kissimmee is located at 28°18'N 81°24'W (28.30, -81.40). According to the United States Census Bureau, the city has a total area of 17.3 square miles (44.9 km2), of which 16.9 square miles (43.7 km2) is land and 0.4 square miles (1.2 km2) (2.37%) is water.
The city is located on the northern shore of Lake Tohopekaliga and is bordered by the cities of St. Cloud to the south and Celebration to the east. The city is located in the Central Florida Highlands region of the Atlantic coastal plain.
Economy
Kissimmee is a major tourist destination and is home to several attractions, including Walt Disney World, Universal Orlando Resort, SeaWorld Orlando, and Gatorland. The city is also home to the Osceola County Stadium, which is the spring training home of the Houston Astros and the Washington Nationals.
The city is also home to several major employers, including the Osceola County School Board, Osceola Regional Medical Center, and the Kissimmee Utility Authority. The city is also home to several major retail centers, including the Loop, the Osceola Square Mall, and the Kissimmee Valley Mall.
Demographics
As of the 2010 census, there were 59,682 people, 22,845 households, and 14,845 families residing in the city. The population density was 3,521.3 people per square mile (1,362.2/km2). There were 24,902 housing units at an average density of 1,476.2 per square mile (571.2/km2). The racial makeup of the city was 68.2% White, 17.3% African American, 0.5% Native American, 2.2% Asian, 0.1% Pacific Islander, 8.7% from other races, and 3.1% from two or more races. Hispanic or Latino of any race were 24.2% of the population.
There were 22,845 households, out of which 33.2% had children under the age of 18 living with them, 44.2% were married couples living together, 16.7% had a female householder with no husband present, and 33.2% were non-families. 25.3% of all households were made up of individuals, and 8.2% had someone living alone who was 65 years of age or older. The average household size was 2.60 and the average family size was 3.12.
In the city, the population was spread out, with 25.9% under the age of 18, 10.2% from 18 to 24, 30.3% from 25 to 44, 21.2% from 45 to 64, and 12.4% who were 65 years of age or older. The median age was 34 years. For every 100 females, there were 95.7 males. For every 100 females age 18 and over, there were 92.2 males.
The median income for a household in the city was $37,845, and the median income for a family was $43,878. Males had a median income of $30,945 versus $23,813 for females. The per capita income for the city was $19,845. About 12.3% of families and 15.7% of the population were below the poverty line, including 22.2% of those under age 18 and 9.2% of those age 65 or over.
Common Questions
What is Per Capita Income in Kissimmee?
Per Capita income in Kissimmee is $22,769.
What is the Median Family Income in Kissimmee?
Median Family Income in Kissimmee is $51,078.
What is the Median Household income in Kissimmee?
Median Household Income in Kissimmee is $45,319.
What is Income or Wage Gap in Kissimmee?
Income or Wage Gap in Kissimmee is 19.9%.
Women in Kissimmee earn 80.1 cents for every dollar earned by a man.
What is Family Income Deficit in Kissimmee?
Family Income Deficit in Kissimmee is $11,095.
Families that are below poverty line in Kissimmee earn $11,095 less on average than the poverty threshold level.
What is Inequality or Gini Index in Kissimmee?
Inequality or Gini Index in Kissimmee is 0.45.
What is the Total Population of Kissimmee?
Total Population of Kissimmee is 78,478.
What is the Total Male Population of Kissimmee?
Total Male Population of Kissimmee is 39,559.
What is the Total Female Population of Kissimmee?
Total Female Population of Kissimmee is 38,919.
What is the Ratio of Males per 100 Females in Kissimmee?
There are 101.64 Males per 100 Females in Kissimmee.
What is the Ratio of Females per 100 Males in Kissimmee?
There are 98.38 Females per 100 Males in Kissimmee.
What is the Median Population Age in Kissimmee?
Median Population Age in Kissimmee is 35.7 Years.
What is the Average Family Size in Kissimmee
Average Family Size in Kissimmee is 3.9 People.
What is the Average Household Size in Kissimmee
Average Household Size in Kissimmee is 3.2 People.
How Large is the Labor Force in Kissimmee?
There are 40,104 People in the Labor Forcein in Kissimmee.
What is the Percentage of People in the Labor Force in Kissimmee?
64.6% of People are in the Labor Force in Kissimmee.
What is the Unemployment Rate in Kissimmee?
Unemployment Rate in Kissimmee is 6.6%.