Pike Creek Valley, DE Map & Demographics
Pike Creek Valley Map
Pike Creek Valley Overview
$48,651
PER CAPITA INCOME
$114,148
AVG FAMILY INCOME
$86,953
AVG HOUSEHOLD INCOME
28.8%
WAGE / INCOME GAP [ % ]
71.2¢/ $1
WAGE / INCOME GAP [ $ ]
0.43
INEQUALITY / GINI INDEX
11,452
TOTAL POPULATION
5,691
MALE POPULATION
5,761
FEMALE POPULATION
98.78
MALES / 100 FEMALES
101.23
FEMALES / 100 MALES
37.8
MEDIAN AGE
2.8
AVG FAMILY SIZE
2.1
AVG HOUSEHOLD SIZE
6,812
LABOR FORCE [ PEOPLE ]
72.2%
PERCENT IN LABOR FORCE
4.1%
UNEMPLOYMENT RATE
Income in Pike Creek Valley
Income Overview in Pike Creek Valley
Per Capita Income in Pike Creek Valley is $48,651, while median incomes of families and households are $114,148 and $86,953 respectively.
| Characteristic | Number | Measure |
| Per Capita Income | 11,452 | $48,651 |
| Median Family Income | 2,937 | $114,148 |
| Mean Family Income | 2,937 | $130,357 |
| Median Household Income | 5,168 | $86,953 |
| Mean Household Income | 5,168 | $108,329 |
| Income Deficit | 2,937 | $0 |
| Wage / Income Gap (%) | 11,452 | 28.78% |
| Wage / Income Gap ($) | 11,452 | 71.22¢ per $1 |
| Gini / Inequality Index | 11,452 | 0.43 |
Earnings by Sex in Pike Creek Valley
Average Earnings in Pike Creek Valley are $52,822, $61,277 for men and $43,640 for women, a difference of 28.8%.
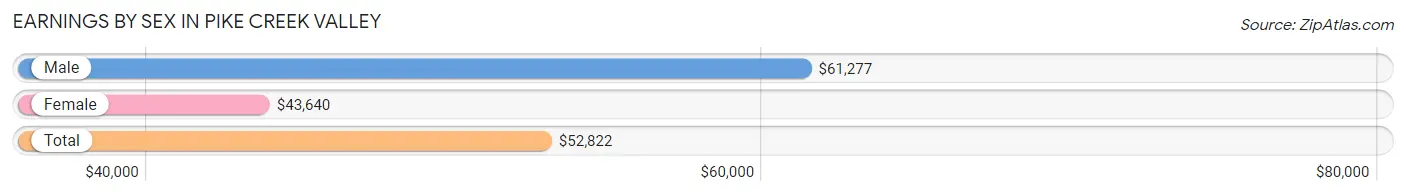
| Sex | Number | Average Earnings |
| Male | 3,526 (49.8%) | $61,277 |
| Female | 3,559 (50.2%) | $43,640 |
| Total | 7,085 (100.0%) | $52,822 |
Earnings by Sex by Income Bracket in Pike Creek Valley
The most common earnings brackets in Pike Creek Valley are $100,000+ for men (899 | 25.5%) and $15,000 to $17,499 for women (388 | 10.9%).
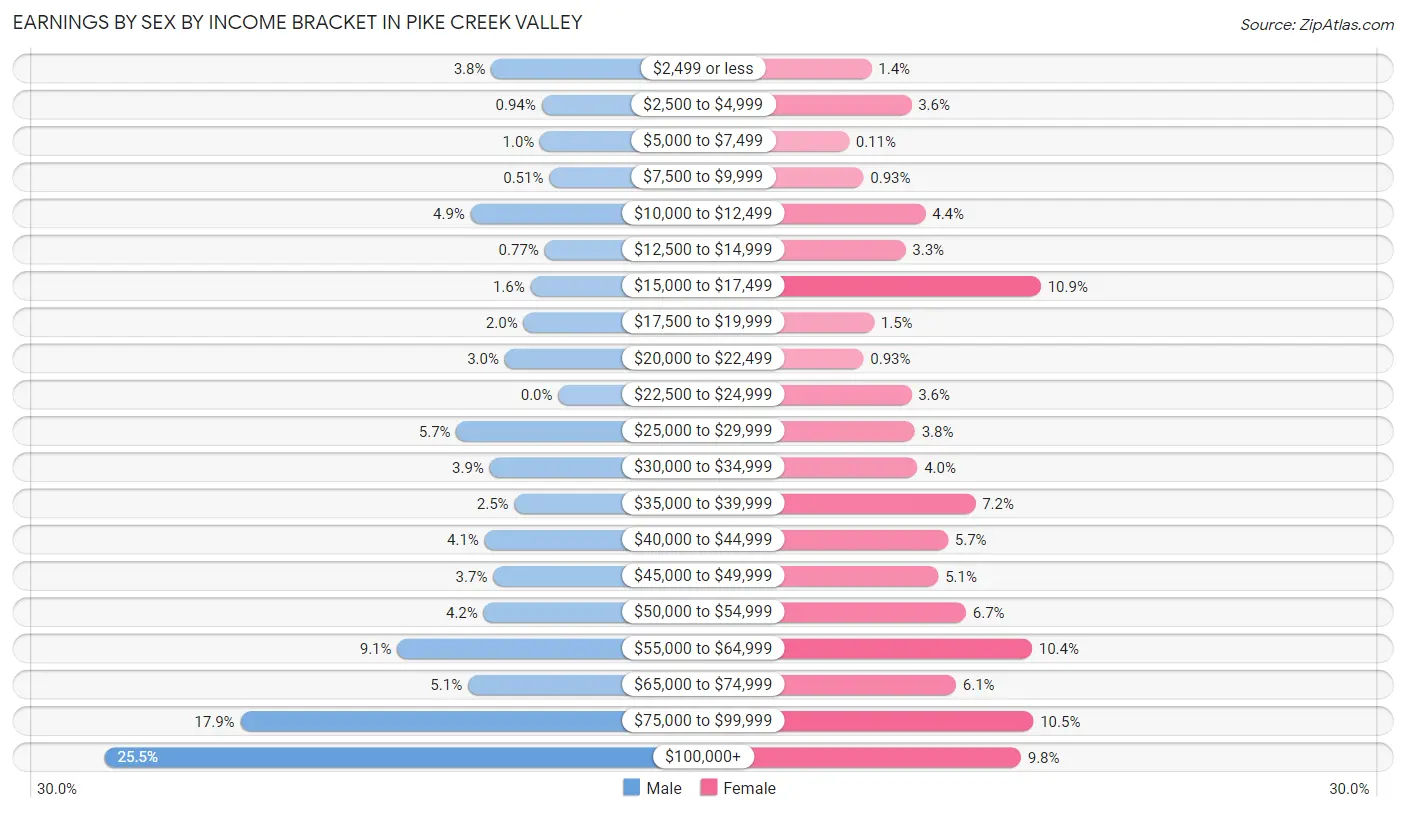
| Income | Male | Female |
| $2,499 or less | 133 (3.8%) | 49 (1.4%) |
| $2,500 to $4,999 | 33 (0.9%) | 129 (3.6%) |
| $5,000 to $7,499 | 36 (1.0%) | 4 (0.1%) |
| $7,500 to $9,999 | 18 (0.5%) | 33 (0.9%) |
| $10,000 to $12,499 | 174 (4.9%) | 157 (4.4%) |
| $12,500 to $14,999 | 27 (0.8%) | 117 (3.3%) |
| $15,000 to $17,499 | 55 (1.6%) | 388 (10.9%) |
| $17,500 to $19,999 | 69 (2.0%) | 54 (1.5%) |
| $20,000 to $22,499 | 106 (3.0%) | 33 (0.9%) |
| $22,500 to $24,999 | 0 (0.0%) | 129 (3.6%) |
| $25,000 to $29,999 | 202 (5.7%) | 136 (3.8%) |
| $30,000 to $34,999 | 136 (3.9%) | 141 (4.0%) |
| $35,000 to $39,999 | 87 (2.5%) | 257 (7.2%) |
| $40,000 to $44,999 | 146 (4.1%) | 202 (5.7%) |
| $45,000 to $49,999 | 129 (3.7%) | 183 (5.1%) |
| $50,000 to $54,999 | 148 (4.2%) | 238 (6.7%) |
| $55,000 to $64,999 | 319 (9.0%) | 370 (10.4%) |
| $65,000 to $74,999 | 179 (5.1%) | 218 (6.1%) |
| $75,000 to $99,999 | 630 (17.9%) | 373 (10.5%) |
| $100,000+ | 899 (25.5%) | 348 (9.8%) |
| Total | 3,526 (100.0%) | 3,559 (100.0%) |
Earnings by Sex by Educational Attainment in Pike Creek Valley
Average earnings in Pike Creek Valley are $67,722 for men and $47,361 for women, a difference of 30.1%. Men with an educational attainment of graduate degree enjoy the highest average annual earnings of $108,466, while those with high school diploma education earn the least with $33,387. Women with an educational attainment of graduate degree earn the most with the average annual earnings of $68,271, while those with college or associate's degree education have the smallest earnings of $36,303.
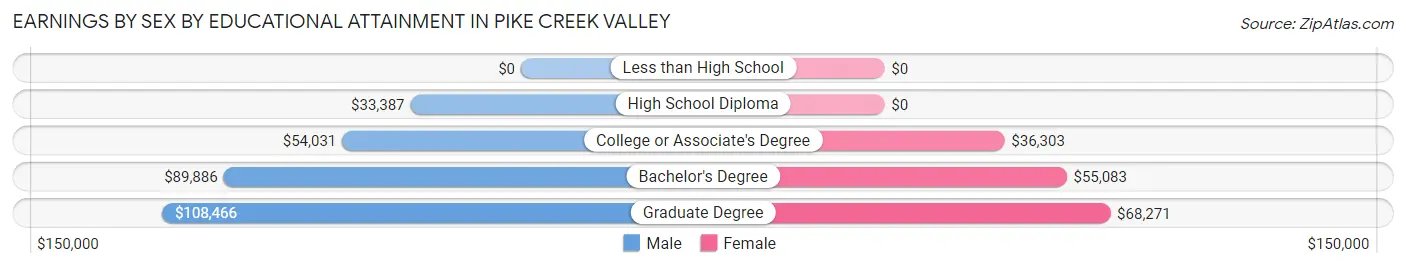
| Educational Attainment | Male Income | Female Income |
| Less than High School | - | - |
| High School Diploma | $33,387 | $0 |
| College or Associate's Degree | $54,031 | $36,303 |
| Bachelor's Degree | $89,886 | $55,083 |
| Graduate Degree | $108,466 | $68,271 |
| Total | $67,722 | $47,361 |
Family Income in Pike Creek Valley
Family Income Brackets in Pike Creek Valley
According to the Pike Creek Valley family income data, there are 808 families falling into the $100,000 to $149,999 income range, which is the most common income bracket and makes up 27.5% of all families. Conversely, the $35,000 to $49,999 income bracket is the least frequent group with only 23 families (0.8%) belonging to this category.
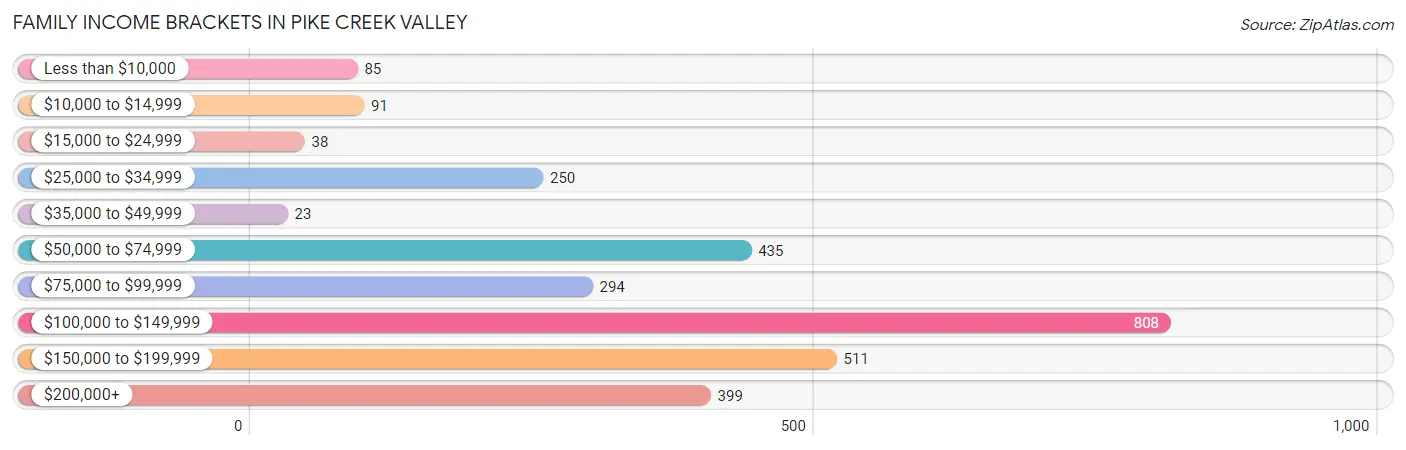
| Income Bracket | # Families | % Families |
| Less than $10,000 | 85 | 2.9% |
| $10,000 to $14,999 | 91 | 3.1% |
| $15,000 to $24,999 | 38 | 1.3% |
| $25,000 to $34,999 | 250 | 8.5% |
| $35,000 to $49,999 | 23 | 0.8% |
| $50,000 to $74,999 | 435 | 14.8% |
| $75,000 to $99,999 | 294 | 10.0% |
| $100,000 to $149,999 | 808 | 27.5% |
| $150,000 to $199,999 | 511 | 17.4% |
| $200,000+ | 399 | 13.6% |
Family Income by Famaliy Size in Pike Creek Valley
3-person families (692 | 23.6%) account for the highest median family income in Pike Creek Valley with $144,000 per family, while 3-person families (692 | 23.6%) have the highest median income of $48,000 per family member.
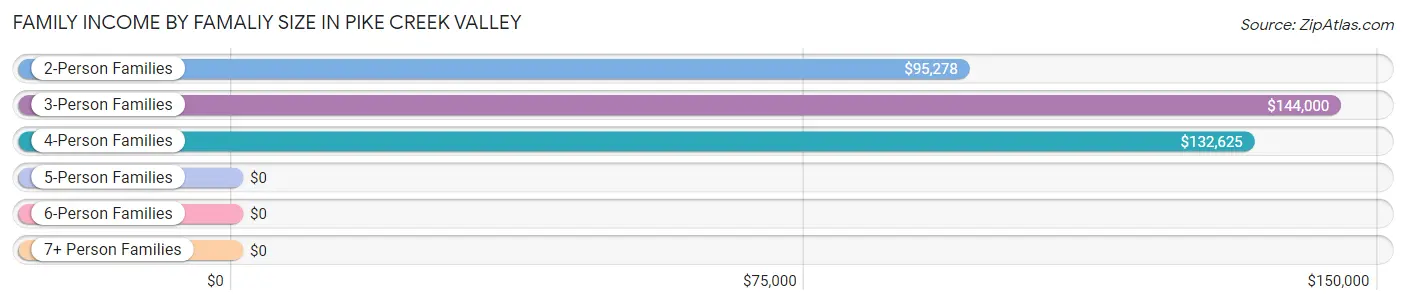
| Income Bracket | # Families | Median Income |
| 2-Person Families | 1,582 (53.9%) | $95,278 |
| 3-Person Families | 692 (23.6%) | $144,000 |
| 4-Person Families | 521 (17.7%) | $132,625 |
| 5-Person Families | 106 (3.6%) | $0 |
| 6-Person Families | 14 (0.5%) | $0 |
| 7+ Person Families | 22 (0.7%) | $0 |
| Total | 2,937 (100.0%) | $114,148 |
Family Income by Number of Earners in Pike Creek Valley
The median family income in Pike Creek Valley is $114,148, with families comprising 3+ earners (368) having the highest median family income of $165,139, while families with no earners (374) have the lowest median family income of $66,154, accounting for 12.5% and 12.7% of families, respectively.
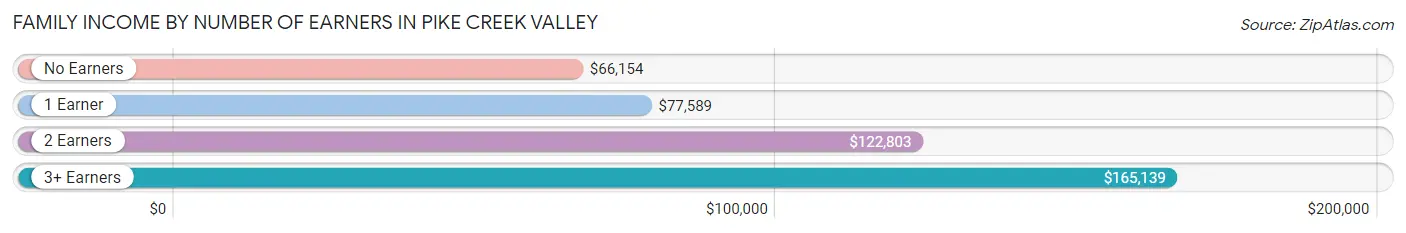
| Number of Earners | # Families | Median Income |
| No Earners | 374 (12.7%) | $66,154 |
| 1 Earner | 615 (20.9%) | $77,589 |
| 2 Earners | 1,580 (53.8%) | $122,803 |
| 3+ Earners | 368 (12.5%) | $165,139 |
| Total | 2,937 (100.0%) | $114,148 |
Household Income in Pike Creek Valley
Household Income Brackets in Pike Creek Valley
With 1,147 households falling in the category, the $100,000 to $149,999 income range is the most frequent in Pike Creek Valley, accounting for 22.2% of all households. In contrast, only 103 households (2.0%) fall into the $15,000 to $24,999 income bracket, making it the least populous group.
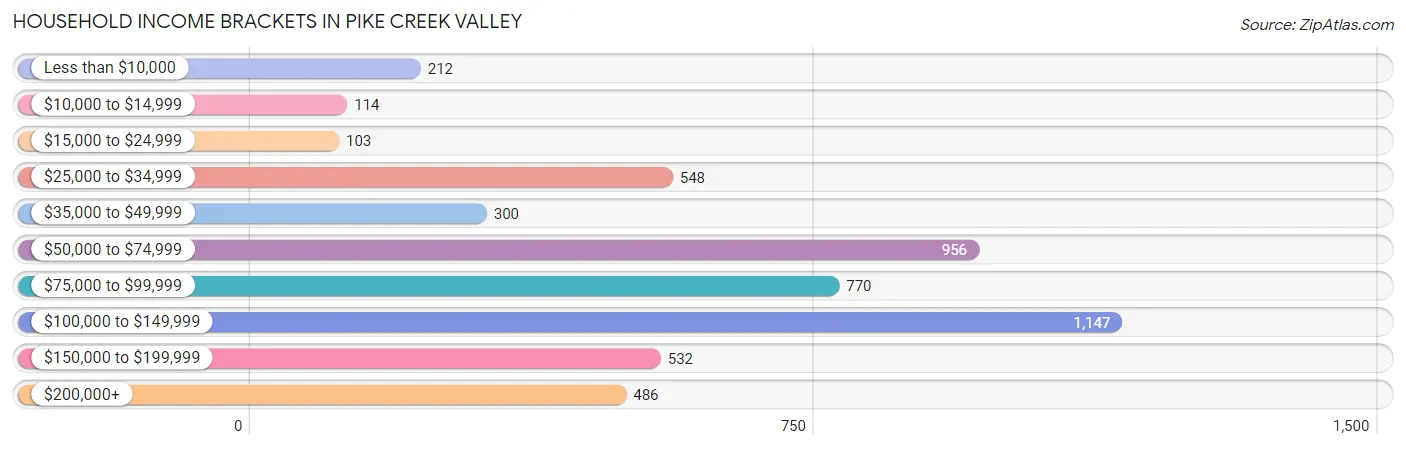
| Income Bracket | # Households | % Households |
| Less than $10,000 | 212 | 4.1% |
| $10,000 to $14,999 | 114 | 2.2% |
| $15,000 to $24,999 | 103 | 2.0% |
| $25,000 to $34,999 | 548 | 10.6% |
| $35,000 to $49,999 | 300 | 5.8% |
| $50,000 to $74,999 | 956 | 18.5% |
| $75,000 to $99,999 | 770 | 14.9% |
| $100,000 to $149,999 | 1,147 | 22.2% |
| $150,000 to $199,999 | 532 | 10.3% |
| $200,000+ | 486 | 9.4% |
Household Income by Householder Age in Pike Creek Valley
The median household income in Pike Creek Valley is $86,953, with the highest median household income of $106,118 found in the 15 to 24 years age bracket for the primary householder. A total of 49 households (0.9%) fall into this category. Meanwhile, the 65+ years age bracket for the primary householder has the lowest median household income of $69,083, with 1,153 households (22.3%) in this group.
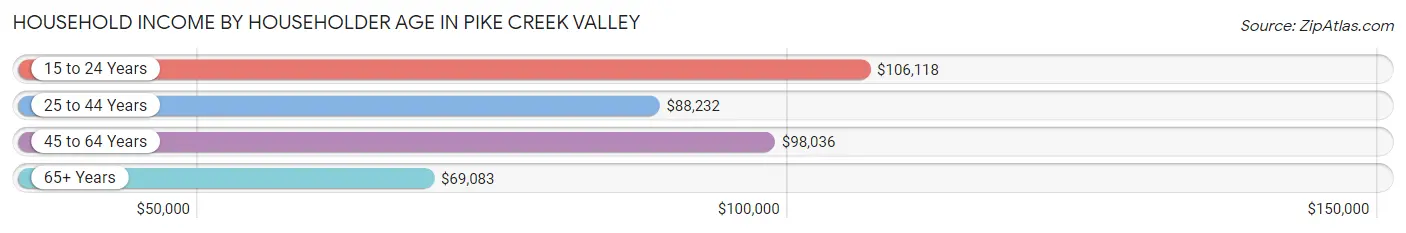
| Income Bracket | # Households | Median Income |
| 15 to 24 Years | 49 (0.9%) | $106,118 |
| 25 to 44 Years | 2,110 (40.8%) | $88,232 |
| 45 to 64 Years | 1,856 (35.9%) | $98,036 |
| 65+ Years | 1,153 (22.3%) | $69,083 |
| Total | 5,168 (100.0%) | $86,953 |
Poverty in Pike Creek Valley
Income Below Poverty by Sex and Age in Pike Creek Valley
With 6.8% poverty level for males and 8.9% for females among the residents of Pike Creek Valley, 5 year old males and 16 and 17 year old females are the most vulnerable to poverty, with 66 males (62.9%) and 87 females (60.4%) in their respective age groups living below the poverty level.
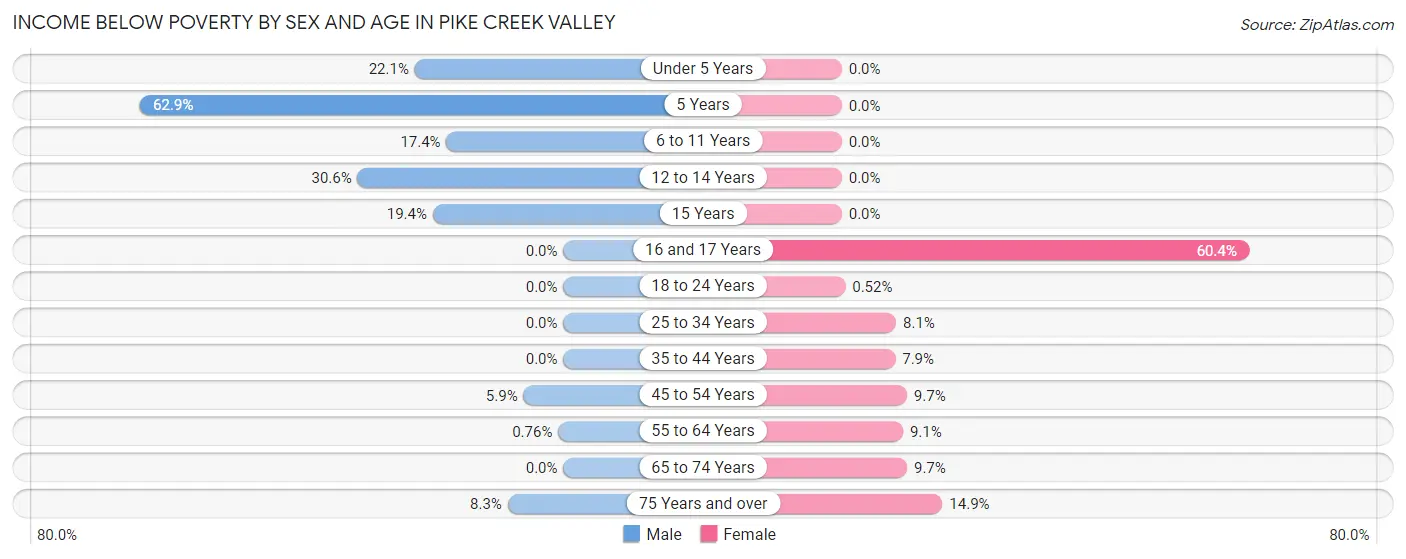
| Age Bracket | Male | Female |
| Under 5 Years | 79 (22.1%) | 0 (0.0%) |
| 5 Years | 66 (62.9%) | 0 (0.0%) |
| 6 to 11 Years | 71 (17.4%) | 0 (0.0%) |
| 12 to 14 Years | 44 (30.6%) | 0 (0.0%) |
| 15 Years | 32 (19.4%) | 0 (0.0%) |
| 16 and 17 Years | 0 (0.0%) | 87 (60.4%) |
| 18 to 24 Years | 0 (0.0%) | 1 (0.5%) |
| 25 to 34 Years | 0 (0.0%) | 104 (8.1%) |
| 35 to 44 Years | 0 (0.0%) | 78 (7.9%) |
| 45 to 54 Years | 54 (5.9%) | 62 (9.7%) |
| 55 to 64 Years | 5 (0.8%) | 65 (9.1%) |
| 65 to 74 Years | 0 (0.0%) | 50 (9.7%) |
| 75 Years and over | 20 (8.3%) | 49 (14.9%) |
| Total | 371 (6.8%) | 496 (8.9%) |
Income Above Poverty by Sex and Age in Pike Creek Valley
According to the poverty statistics in Pike Creek Valley, males aged 16 and 17 years and females aged under 5 years are the age groups that are most secure financially, with 100.0% of males and 100.0% of females in these age groups living above the poverty line.
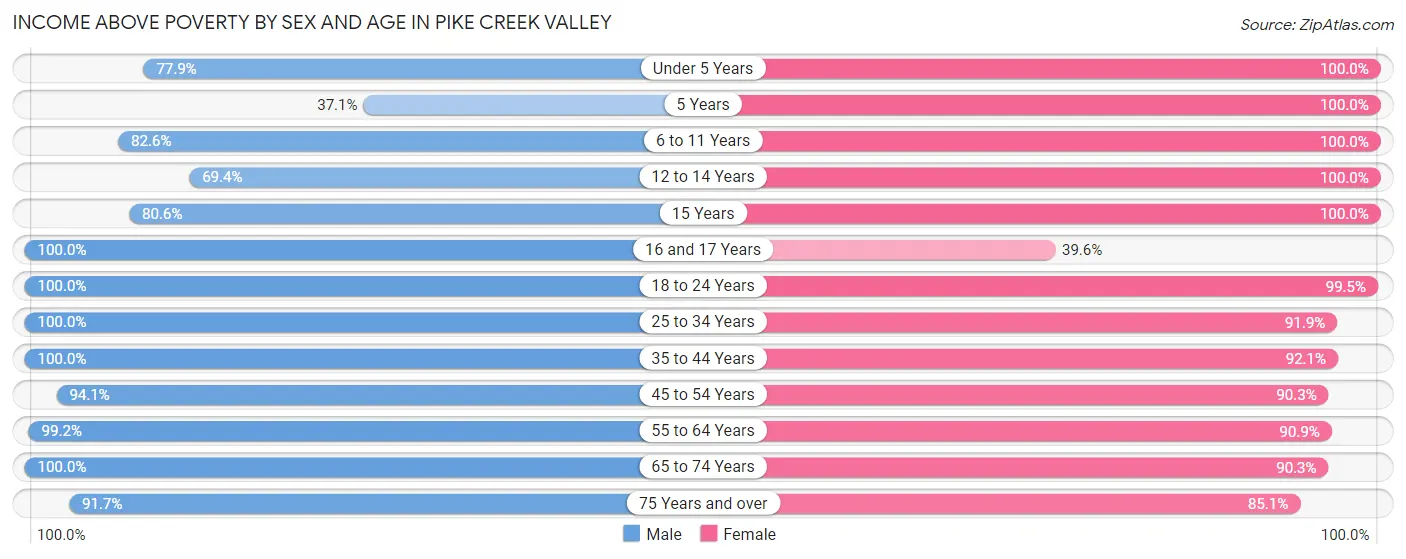
| Age Bracket | Male | Female |
| Under 5 Years | 279 (77.9%) | 189 (100.0%) |
| 5 Years | 39 (37.1%) | 16 (100.0%) |
| 6 to 11 Years | 338 (82.6%) | 261 (100.0%) |
| 12 to 14 Years | 100 (69.4%) | 248 (100.0%) |
| 15 Years | 133 (80.6%) | 15 (100.0%) |
| 16 and 17 Years | 110 (100.0%) | 57 (39.6%) |
| 18 to 24 Years | 184 (100.0%) | 193 (99.5%) |
| 25 to 34 Years | 897 (100.0%) | 1,187 (91.9%) |
| 35 to 44 Years | 793 (100.0%) | 904 (92.1%) |
| 45 to 54 Years | 858 (94.1%) | 579 (90.3%) |
| 55 to 64 Years | 650 (99.2%) | 651 (90.9%) |
| 65 to 74 Years | 513 (100.0%) | 466 (90.3%) |
| 75 Years and over | 222 (91.7%) | 279 (85.1%) |
| Total | 5,116 (93.2%) | 5,045 (91.0%) |
Income Below Poverty Among Married-Couple Families in Pike Creek Valley
The poverty statistics for married-couple families in Pike Creek Valley show that 0.9% or 20 of the total 2,206 families live below the poverty line. Families with no children have the highest poverty rate of 1.4%, comprising of 20 families. On the other hand, families with 1 or 2 children have the lowest poverty rate of 0.0%, which includes 0 families.
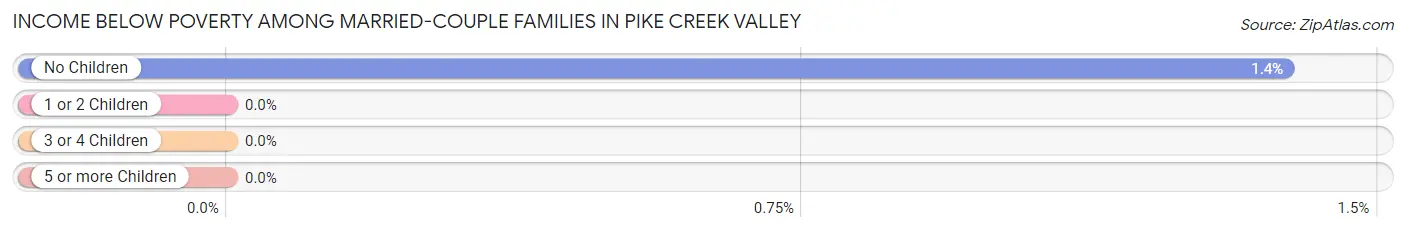
| Children | Above Poverty | Below Poverty |
| No Children | 1,431 (98.6%) | 20 (1.4%) |
| 1 or 2 Children | 649 (100.0%) | 0 (0.0%) |
| 3 or 4 Children | 94 (100.0%) | 0 (0.0%) |
| 5 or more Children | 12 (100.0%) | 0 (0.0%) |
| Total | 2,186 (99.1%) | 20 (0.9%) |
Income Below Poverty Among Single-Parent Households in Pike Creek Valley
According to the poverty data in Pike Creek Valley, 12.9% or 37 single-father households and 34.6% or 154 single-mother households are living below the poverty line. Among single-father households, those with 1 or 2 children have the highest poverty rate, with 37 households (28.7%) experiencing poverty. Likewise, among single-mother households, those with 3 or 4 children have the highest poverty rate, with 60 households (100.0%) falling below the poverty line.
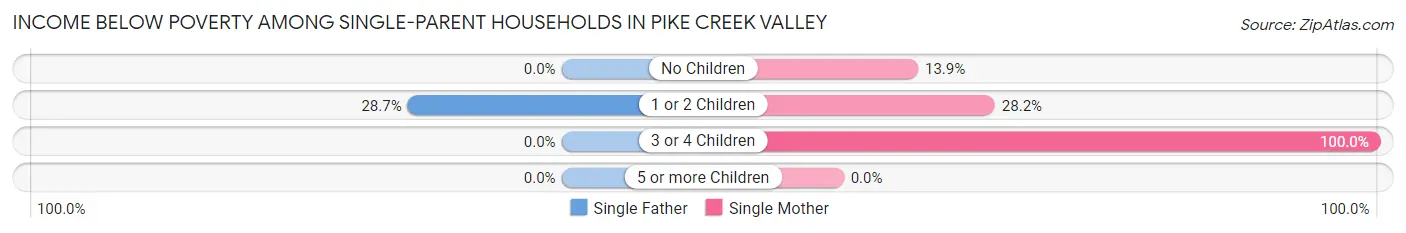
| Children | Single Father | Single Mother |
| No Children | 0 (0.0%) | 14 (13.9%) |
| 1 or 2 Children | 37 (28.7%) | 80 (28.2%) |
| 3 or 4 Children | 0 (0.0%) | 60 (100.0%) |
| 5 or more Children | 0 (0.0%) | 0 (0.0%) |
| Total | 37 (12.9%) | 154 (34.6%) |
Income Below Poverty Among Married-Couple vs Single-Parent Households in Pike Creek Valley
The poverty data for Pike Creek Valley shows that 20 of the married-couple family households (0.9%) and 191 of the single-parent households (26.1%) are living below the poverty level. Within the married-couple family households, those with no children have the highest poverty rate, with 20 households (1.4%) falling below the poverty line. Among the single-parent households, those with 3 or 4 children have the highest poverty rate, with 60 household (100.0%) living below poverty.
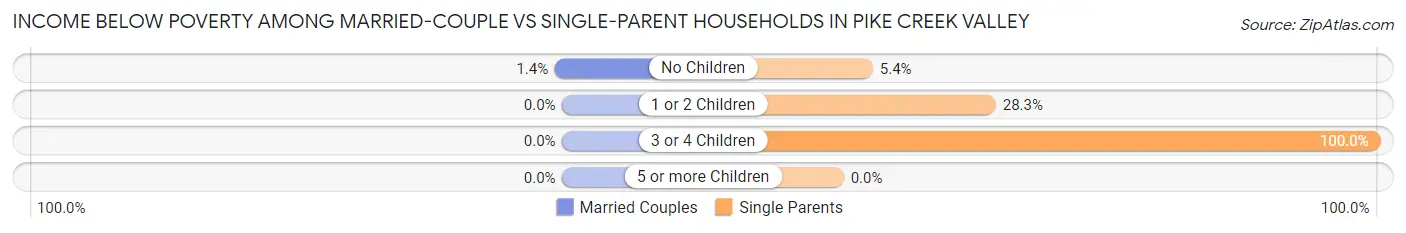
| Children | Married-Couple Families | Single-Parent Households |
| No Children | 20 (1.4%) | 14 (5.4%) |
| 1 or 2 Children | 0 (0.0%) | 117 (28.3%) |
| 3 or 4 Children | 0 (0.0%) | 60 (100.0%) |
| 5 or more Children | 0 (0.0%) | 0 (0.0%) |
| Total | 20 (0.9%) | 191 (26.1%) |
Race in Pike Creek Valley
The most populous races in Pike Creek Valley are White / Caucasian (7,746 | 67.6%), Black / African American (2,003 | 17.5%), and Asian (766 | 6.7%).
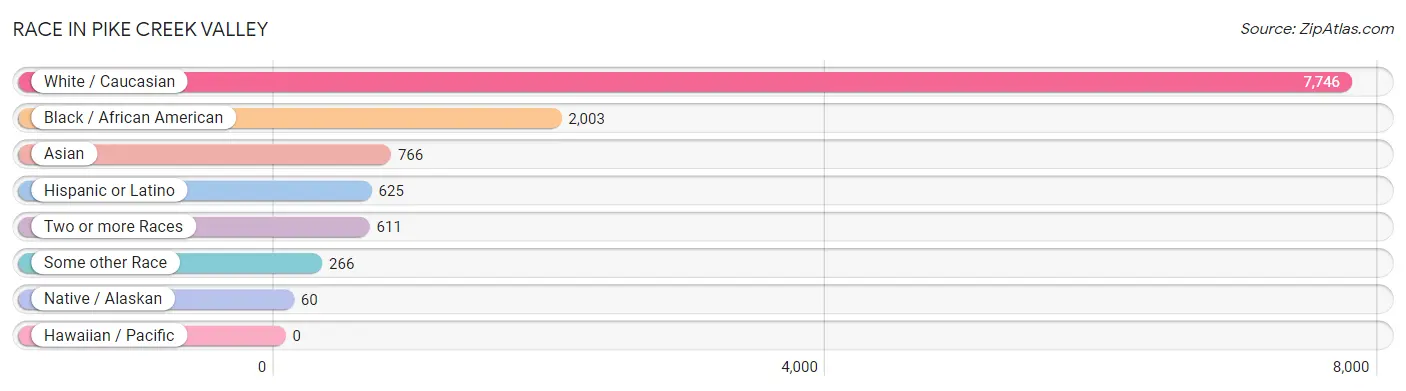
| Race | # Population | % Population |
| Asian | 766 | 6.7% |
| Black / African American | 2,003 | 17.5% |
| Hawaiian / Pacific | 0 | 0.0% |
| Hispanic or Latino | 625 | 5.5% |
| Native / Alaskan | 60 | 0.5% |
| White / Caucasian | 7,746 | 67.6% |
| Two or more Races | 611 | 5.3% |
| Some other Race | 266 | 2.3% |
| Total | 11,452 | 100.0% |
Ancestry in Pike Creek Valley
The most populous ancestries reported in Pike Creek Valley are Irish (1,778 | 15.5%), German (1,696 | 14.8%), Italian (1,408 | 12.3%), English (1,095 | 9.6%), and Polish (667 | 5.8%), together accounting for 58.0% of all Pike Creek Valley residents.
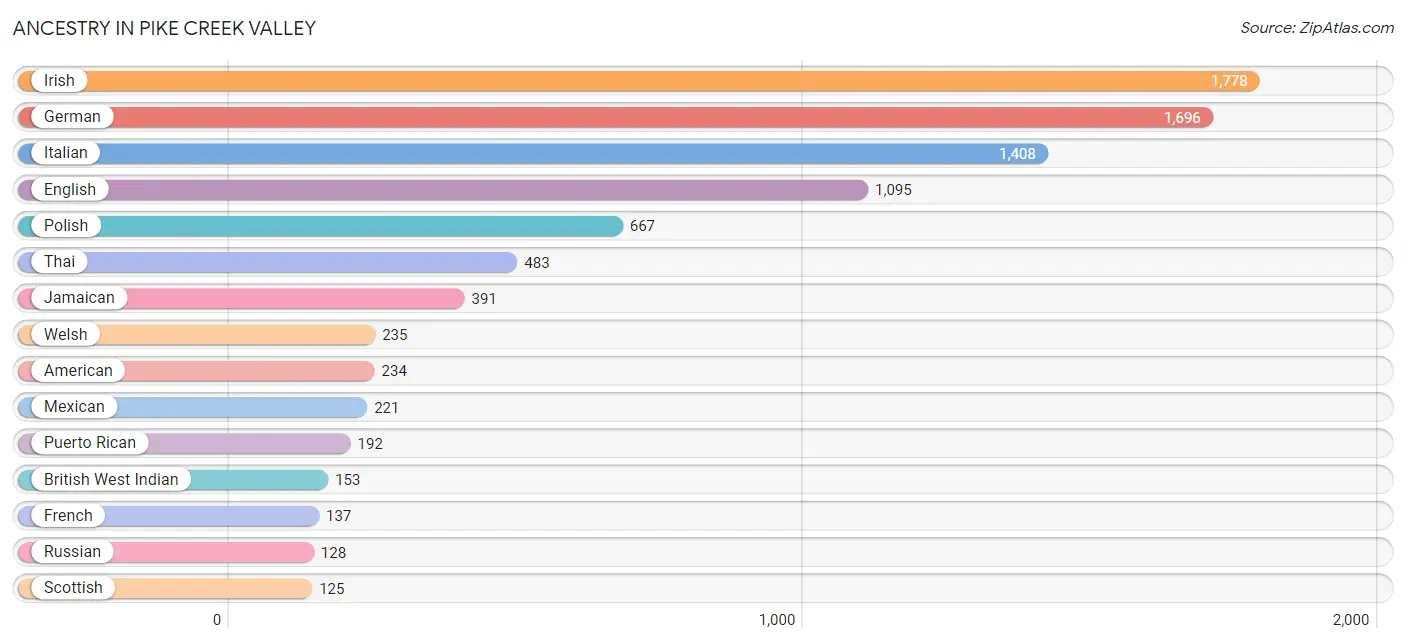
| Ancestry | # Population | % Population |
| African | 20 | 0.2% |
| Albanian | 2 | 0.0% |
| American | 234 | 2.0% |
| Arab | 105 | 0.9% |
| Armenian | 13 | 0.1% |
| Austrian | 71 | 0.6% |
| Bhutanese | 33 | 0.3% |
| British | 94 | 0.8% |
| British West Indian | 153 | 1.3% |
| Bulgarian | 35 | 0.3% |
| Burmese | 34 | 0.3% |
| Canadian | 1 | 0.0% |
| Central American | 47 | 0.4% |
| Cherokee | 30 | 0.3% |
| Croatian | 13 | 0.1% |
| Cuban | 20 | 0.2% |
| Danish | 21 | 0.2% |
| Dominican | 61 | 0.5% |
| Dutch | 86 | 0.7% |
| Eastern European | 108 | 0.9% |
| Ecuadorian | 3 | 0.0% |
| Egyptian | 36 | 0.3% |
| English | 1,095 | 9.6% |
| European | 65 | 0.6% |
| Filipino | 36 | 0.3% |
| French | 137 | 1.2% |
| German | 1,696 | 14.8% |
| Ghanaian | 27 | 0.2% |
| Greek | 46 | 0.4% |
| Guatemalan | 1 | 0.0% |
| Hungarian | 19 | 0.2% |
| Indian (Asian) | 112 | 1.0% |
| Irish | 1,778 | 15.5% |
| Italian | 1,408 | 12.3% |
| Jamaican | 391 | 3.4% |
| Korean | 40 | 0.4% |
| Lithuanian | 26 | 0.2% |
| Mexican | 221 | 1.9% |
| Mexican American Indian | 25 | 0.2% |
| Nigerian | 45 | 0.4% |
| Northern European | 11 | 0.1% |
| Norwegian | 58 | 0.5% |
| Palestinian | 16 | 0.1% |
| Panamanian | 46 | 0.4% |
| Pennsylvania German | 82 | 0.7% |
| Polish | 667 | 5.8% |
| Puerto Rican | 192 | 1.7% |
| Romanian | 40 | 0.4% |
| Russian | 128 | 1.1% |
| Scotch-Irish | 61 | 0.5% |
| Scottish | 125 | 1.1% |
| Slovak | 81 | 0.7% |
| South American | 8 | 0.1% |
| South American Indian | 5 | 0.0% |
| Spanish | 46 | 0.4% |
| Sri Lankan | 15 | 0.1% |
| Subsaharan African | 92 | 0.8% |
| Swedish | 97 | 0.9% |
| Swiss | 42 | 0.4% |
| Thai | 483 | 4.2% |
| Ukrainian | 45 | 0.4% |
| Welsh | 235 | 2.1% | View All 62 Rows |
Immigrants in Pike Creek Valley
The most numerous immigrant groups reported in Pike Creek Valley came from Asia (510 | 4.4%), South Central Asia (296 | 2.6%), India (289 | 2.5%), Latin America (188 | 1.6%), and Eastern Asia (178 | 1.5%), together accounting for 12.7% of all Pike Creek Valley residents.
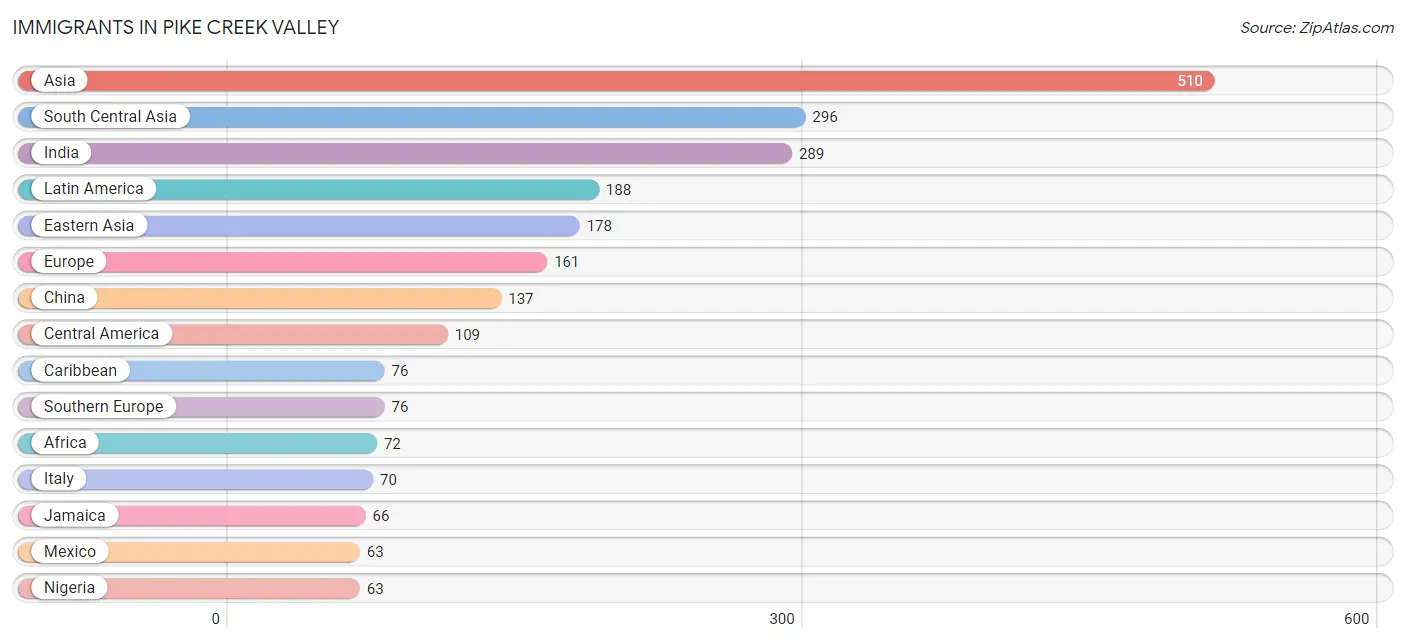
| Immigration Origin | # Population | % Population |
| Africa | 72 | 0.6% |
| Asia | 510 | 4.4% |
| Austria | 13 | 0.1% |
| Bangladesh | 7 | 0.1% |
| Barbados | 8 | 0.1% |
| Brazil | 3 | 0.0% |
| Bulgaria | 18 | 0.2% |
| Canada | 30 | 0.3% |
| Caribbean | 76 | 0.7% |
| Central America | 109 | 0.9% |
| China | 137 | 1.2% |
| Cuba | 1 | 0.0% |
| Eastern Africa | 9 | 0.1% |
| Eastern Asia | 178 | 1.5% |
| Eastern Europe | 23 | 0.2% |
| England | 19 | 0.2% |
| Europe | 161 | 1.4% |
| Germany | 17 | 0.2% |
| Greece | 6 | 0.1% |
| Hong Kong | 14 | 0.1% |
| India | 289 | 2.5% |
| Italy | 70 | 0.6% |
| Jamaica | 66 | 0.6% |
| Japan | 12 | 0.1% |
| Korea | 29 | 0.3% |
| Latin America | 188 | 1.6% |
| Mexico | 63 | 0.5% |
| Nigeria | 63 | 0.5% |
| Northern Europe | 32 | 0.3% |
| Norway | 13 | 0.1% |
| Panama | 46 | 0.4% |
| Philippines | 21 | 0.2% |
| South America | 3 | 0.0% |
| South Central Asia | 296 | 2.6% |
| South Eastern Asia | 36 | 0.3% |
| Southern Europe | 76 | 0.7% |
| Taiwan | 36 | 0.3% |
| Vietnam | 15 | 0.1% |
| Western Africa | 63 | 0.5% |
| Western Europe | 30 | 0.3% | View All 40 Rows |
Sex and Age in Pike Creek Valley
Sex and Age in Pike Creek Valley
The most populous age groups in Pike Creek Valley are 50 to 54 Years (517 | 9.1%) for men and 25 to 29 Years (664 | 11.5%) for women.
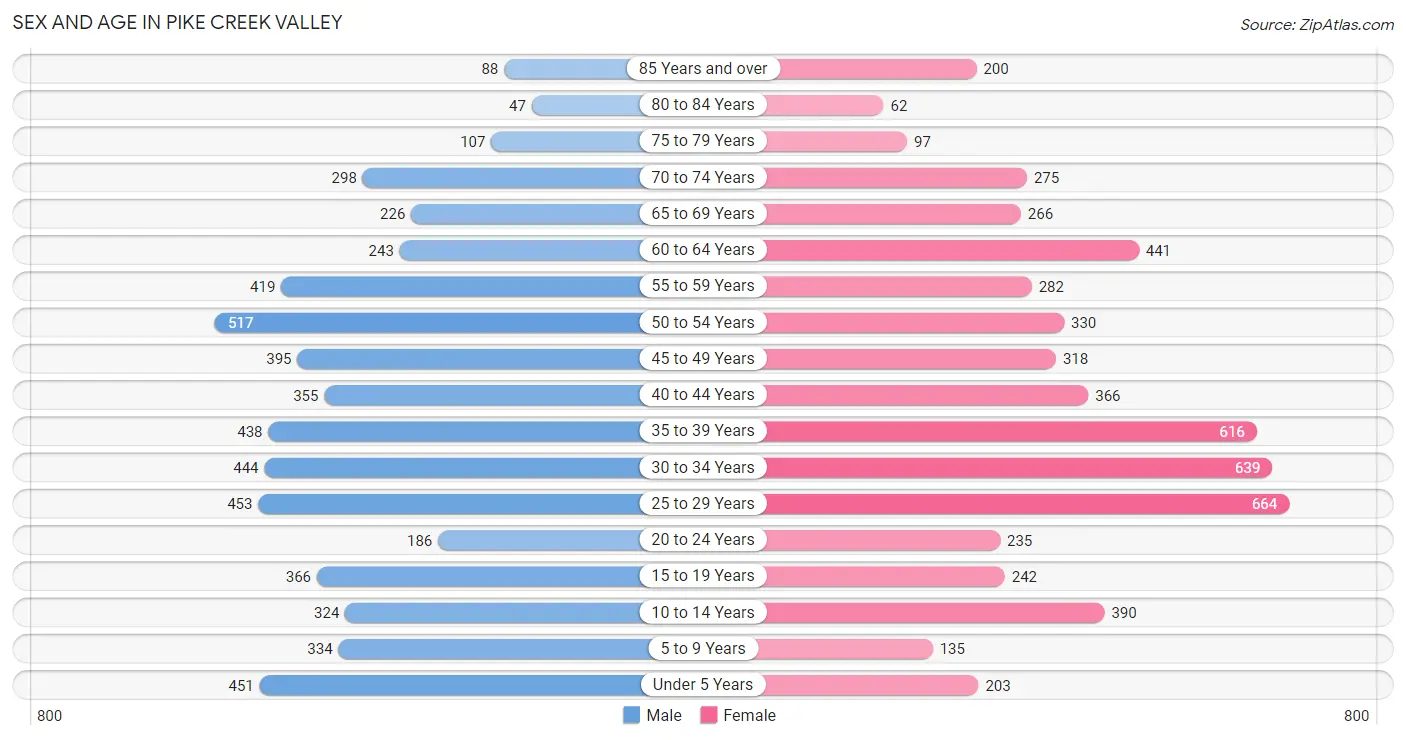
| Age Bracket | Male | Female |
| Under 5 Years | 451 (7.9%) | 203 (3.5%) |
| 5 to 9 Years | 334 (5.9%) | 135 (2.3%) |
| 10 to 14 Years | 324 (5.7%) | 390 (6.8%) |
| 15 to 19 Years | 366 (6.4%) | 242 (4.2%) |
| 20 to 24 Years | 186 (3.3%) | 235 (4.1%) |
| 25 to 29 Years | 453 (8.0%) | 664 (11.5%) |
| 30 to 34 Years | 444 (7.8%) | 639 (11.1%) |
| 35 to 39 Years | 438 (7.7%) | 616 (10.7%) |
| 40 to 44 Years | 355 (6.2%) | 366 (6.4%) |
| 45 to 49 Years | 395 (6.9%) | 318 (5.5%) |
| 50 to 54 Years | 517 (9.1%) | 330 (5.7%) |
| 55 to 59 Years | 419 (7.4%) | 282 (4.9%) |
| 60 to 64 Years | 243 (4.3%) | 441 (7.6%) |
| 65 to 69 Years | 226 (4.0%) | 266 (4.6%) |
| 70 to 74 Years | 298 (5.2%) | 275 (4.8%) |
| 75 to 79 Years | 107 (1.9%) | 97 (1.7%) |
| 80 to 84 Years | 47 (0.8%) | 62 (1.1%) |
| 85 Years and over | 88 (1.5%) | 200 (3.5%) |
| Total | 5,691 (100.0%) | 5,761 (100.0%) |
Families and Households in Pike Creek Valley
Median Family Size in Pike Creek Valley
The median family size in Pike Creek Valley is 2.75 persons per family, with single female/mother families (445 | 15.1%) accounting for the largest median family size of 3.1 persons per family. On the other hand, married-couple families (2,206 | 75.1%) represent the smallest median family size with 2.68 persons per family.
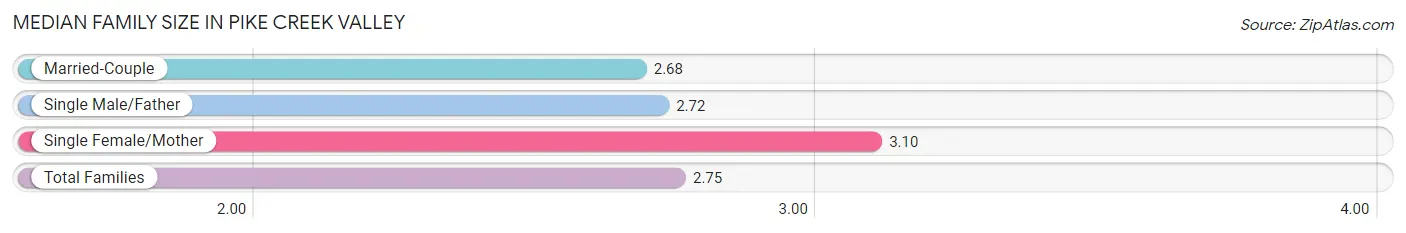
| Family Type | # Families | Family Size |
| Married-Couple | 2,206 (75.1%) | 2.68 |
| Single Male/Father | 286 (9.7%) | 2.72 |
| Single Female/Mother | 445 (15.1%) | 3.10 |
| Total Families | 2,937 (100.0%) | 2.75 |
Median Household Size in Pike Creek Valley
The median household size in Pike Creek Valley is 2.15 persons per household, with single female/mother households (445 | 8.6%) accounting for the largest median household size of 3.46 persons per household. non-family households (2,231 | 43.2%) represent the smallest median household size with 1.27 persons per household.
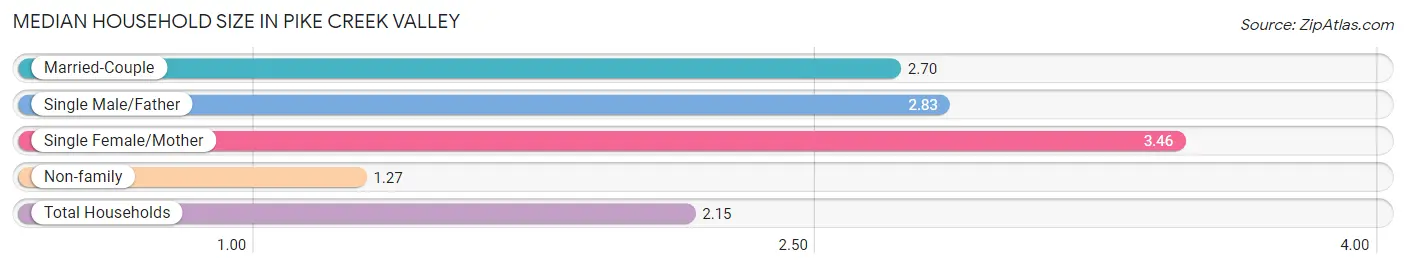
| Household Type | # Households | Household Size |
| Married-Couple | 2,206 (42.7%) | 2.70 |
| Single Male/Father | 286 (5.5%) | 2.83 |
| Single Female/Mother | 445 (8.6%) | 3.46 |
| Non-family | 2,231 (43.2%) | 1.27 |
| Total Households | 5,168 (100.0%) | 2.15 |
Household Size by Marriage Status in Pike Creek Valley
Out of a total of 5,168 households in Pike Creek Valley, 2,937 (56.8%) are family households, while 2,231 (43.2%) are nonfamily households. The most numerous type of family households are 2-person households, comprising 1,435, and the most common type of nonfamily households are 1-person households, comprising 1,835.
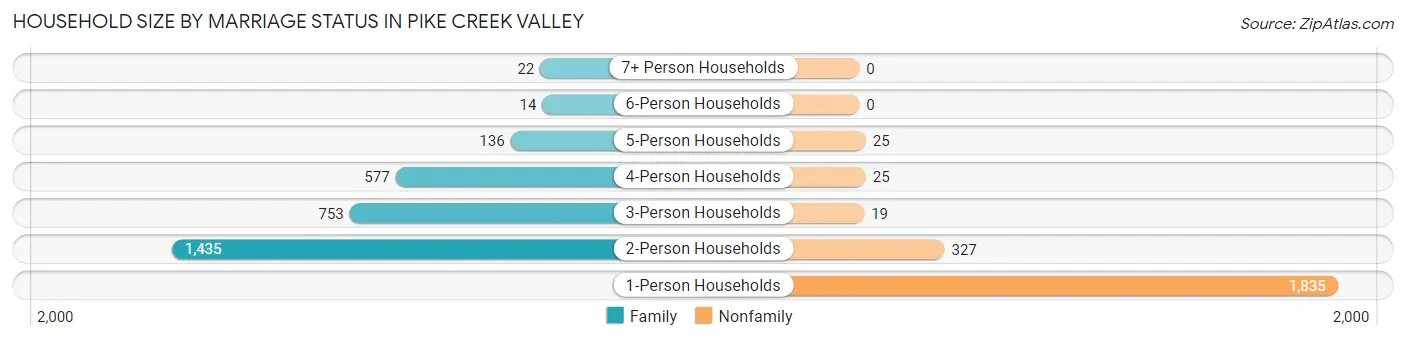
| Household Size | Family Households | Nonfamily Households |
| 1-Person Households | - | 1,835 (35.5%) |
| 2-Person Households | 1,435 (27.8%) | 327 (6.3%) |
| 3-Person Households | 753 (14.6%) | 19 (0.4%) |
| 4-Person Households | 577 (11.2%) | 25 (0.5%) |
| 5-Person Households | 136 (2.6%) | 25 (0.5%) |
| 6-Person Households | 14 (0.3%) | 0 (0.0%) |
| 7+ Person Households | 22 (0.4%) | 0 (0.0%) |
| Total | 2,937 (56.8%) | 2,231 (43.2%) |
Female Fertility in Pike Creek Valley
Fertility by Age in Pike Creek Valley
Average fertility rate in Pike Creek Valley is 20.0 births per 1,000 women. Women in the age bracket of 20 to 34 years have the highest fertility rate with 36.0 births per 1,000 women. Women in the age bracket of 20 to 34 years acount for 87.3% of all women with births.
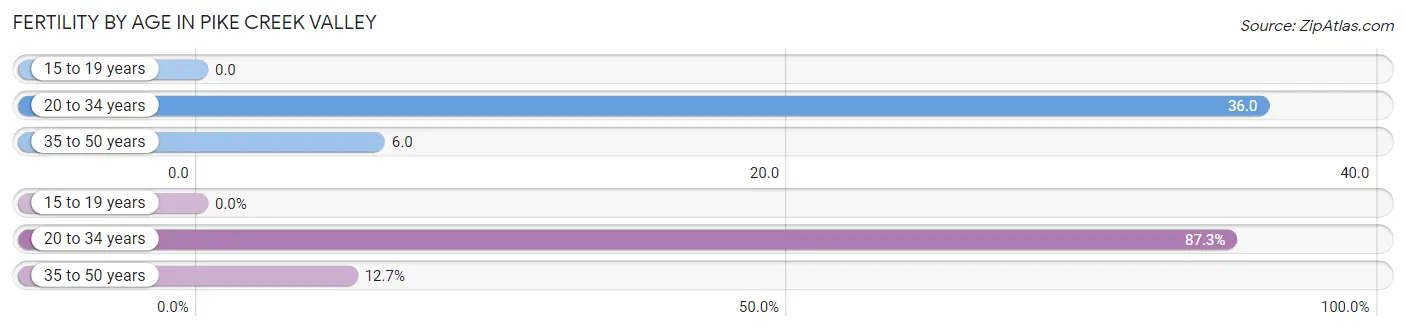
| Age Bracket | Women with Births | Births / 1,000 Women |
| 15 to 19 years | 0 (0.0%) | 0.0 |
| 20 to 34 years | 55 (87.3%) | 36.0 |
| 35 to 50 years | 8 (12.7%) | 6.0 |
| Total | 63 (100.0%) | 20.0 |
Fertility by Age by Marriage Status in Pike Creek Valley
71.4% of women with births (63) in Pike Creek Valley are married. The highest percentage of unmarried women with births falls into 20 to 34 years age bracket with 32.7% of them unmarried at the time of birth, while the lowest percentage of unmarried women with births belong to 35 to 50 years age bracket with 0.0% of them unmarried.
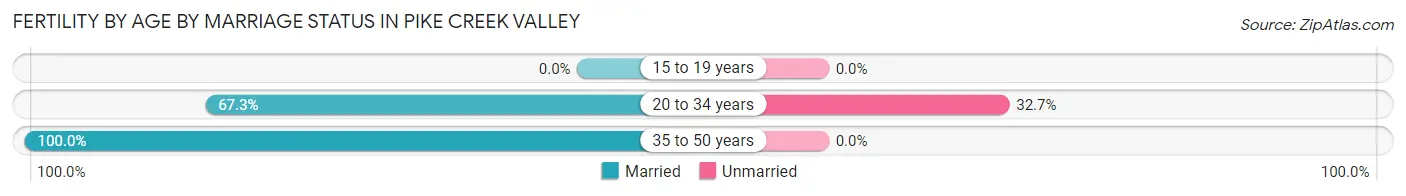
| Age Bracket | Married | Unmarried |
| 15 to 19 years | 0 (0.0%) | 0 (0.0%) |
| 20 to 34 years | 37 (67.3%) | 18 (32.7%) |
| 35 to 50 years | 8 (100.0%) | 0 (0.0%) |
| Total | 45 (71.4%) | 18 (28.6%) |
Fertility by Education in Pike Creek Valley
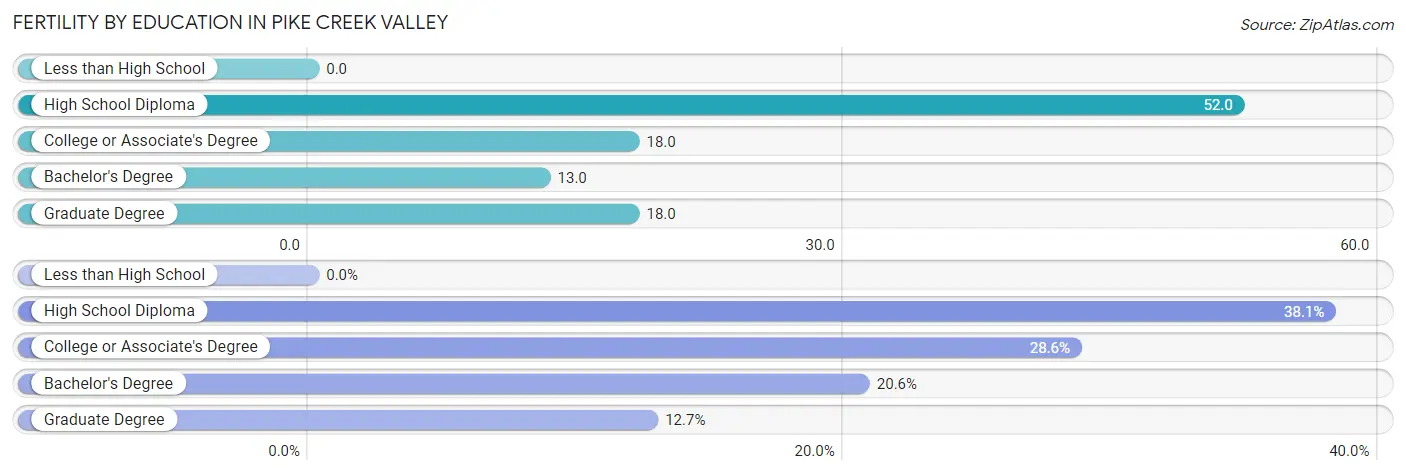
| Educational Attainment | Women with Births | Births / 1,000 Women |
| Less than High School | 0 (0.0%) | 0.0 |
| High School Diploma | 24 (38.1%) | 52.0 |
| College or Associate's Degree | 18 (28.6%) | 18.0 |
| Bachelor's Degree | 13 (20.6%) | 13.0 |
| Graduate Degree | 8 (12.7%) | 18.0 |
| Total | 63 (100.0%) | 20.0 |
Fertility by Education by Marriage Status in Pike Creek Valley
28.6% of women with births in Pike Creek Valley are unmarried. Women with the educational attainment of high school diploma are most likely to be married with 100.0% of them married at childbirth, while women with the educational attainment of college or associate's degree are least likely to be married with 100.0% of them unmarried at childbirth.
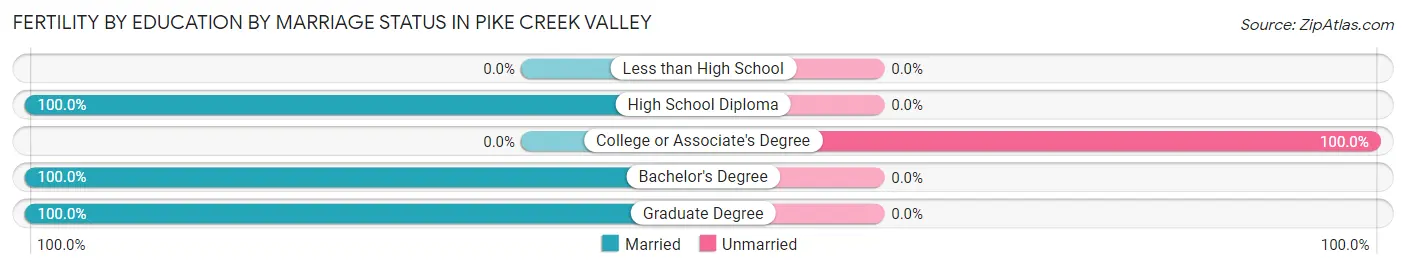
| Educational Attainment | Married | Unmarried |
| Less than High School | 0 (0.0%) | 0 (0.0%) |
| High School Diploma | 24 (100.0%) | 0 (0.0%) |
| College or Associate's Degree | 0 (0.0%) | 18 (100.0%) |
| Bachelor's Degree | 13 (100.0%) | 0 (0.0%) |
| Graduate Degree | 8 (100.0%) | 0 (0.0%) |
| Total | 45 (71.4%) | 18 (28.6%) |
Employment Characteristics in Pike Creek Valley
Employment by Class of Employer in Pike Creek Valley
Among the 6,432 employed individuals in Pike Creek Valley, private company employees (4,307 | 67.0%), not-for-profit organizations (745 | 11.6%), and state government employees (486 | 7.6%) make up the most common classes of employment.
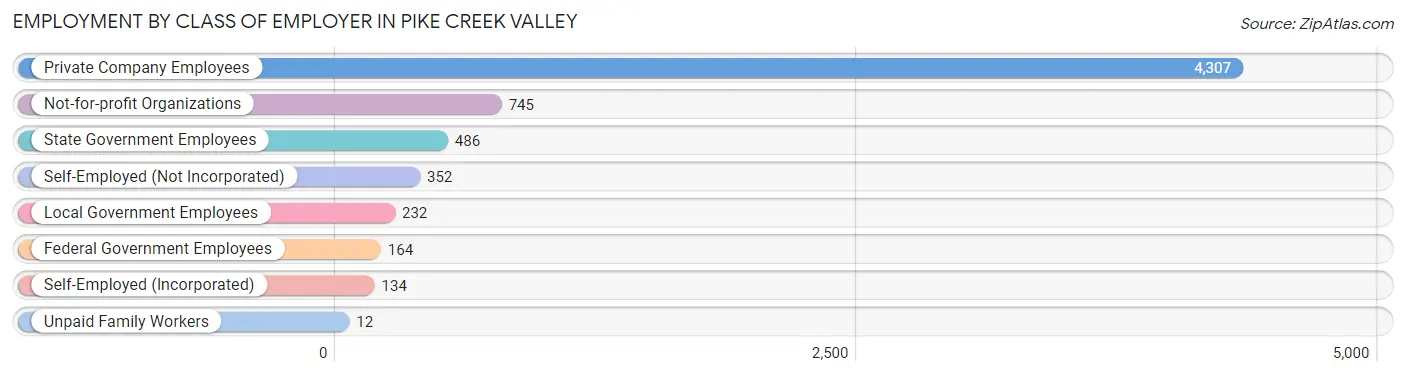
| Employer Class | # Employees | % Employees |
| Private Company Employees | 4,307 | 67.0% |
| Self-Employed (Incorporated) | 134 | 2.1% |
| Self-Employed (Not Incorporated) | 352 | 5.5% |
| Not-for-profit Organizations | 745 | 11.6% |
| Local Government Employees | 232 | 3.6% |
| State Government Employees | 486 | 7.6% |
| Federal Government Employees | 164 | 2.5% |
| Unpaid Family Workers | 12 | 0.2% |
| Total | 6,432 | 100.0% |
Employment Status by Age in Pike Creek Valley
According to the labor force statistics for Pike Creek Valley, out of the total population over 16 years of age (9,435), 72.2% or 6,812 individuals are in the labor force, with 4.1% or 279 of them unemployed. The age group with the highest labor force participation rate is 30 to 34 years, with 94.2% or 1,020 individuals in the labor force. Within the labor force, the 60 to 64 years age range has the highest percentage of unemployed individuals, with 8.5% or 37 of them being unemployed.
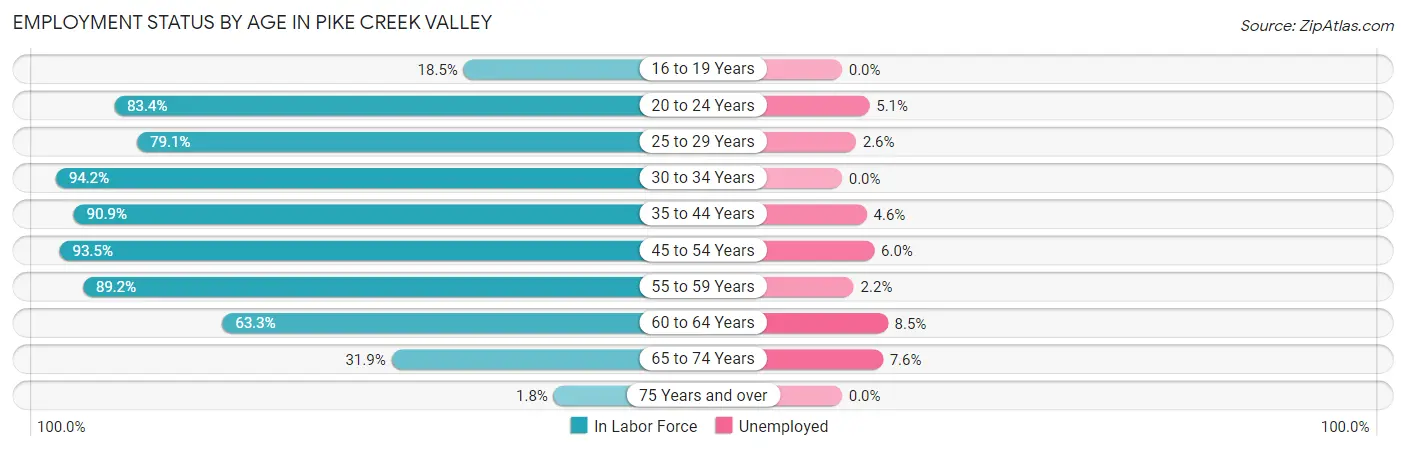
| Age Bracket | In Labor Force | Unemployed |
| 16 to 19 Years | 79 (18.5%) | 0 (0.0%) |
| 20 to 24 Years | 351 (83.4%) | 18 (5.1%) |
| 25 to 29 Years | 884 (79.1%) | 23 (2.6%) |
| 30 to 34 Years | 1,020 (94.2%) | 0 (0.0%) |
| 35 to 44 Years | 1,613 (90.9%) | 74 (4.6%) |
| 45 to 54 Years | 1,459 (93.5%) | 88 (6.0%) |
| 55 to 59 Years | 625 (89.2%) | 14 (2.2%) |
| 60 to 64 Years | 433 (63.3%) | 37 (8.5%) |
| 65 to 74 Years | 340 (31.9%) | 26 (7.6%) |
| 75 Years and over | 11 (1.8%) | 0 (0.0%) |
| Total | 6,812 (72.2%) | 279 (4.1%) |
Employment Status by Educational Attainment in Pike Creek Valley
According to labor force statistics for Pike Creek Valley, 87.2% of individuals (6,034) out of the total population between 25 and 64 years of age (6,920) are in the labor force, with 3.9% or 235 of them being unemployed. The group with the highest labor force participation rate are those with the educational attainment of bachelor's degree or higher, with 93.0% or 3,210 individuals in the labor force. Within the labor force, individuals with high school diploma education have the highest percentage of unemployment, with 10.9% or 94 of them being unemployed.
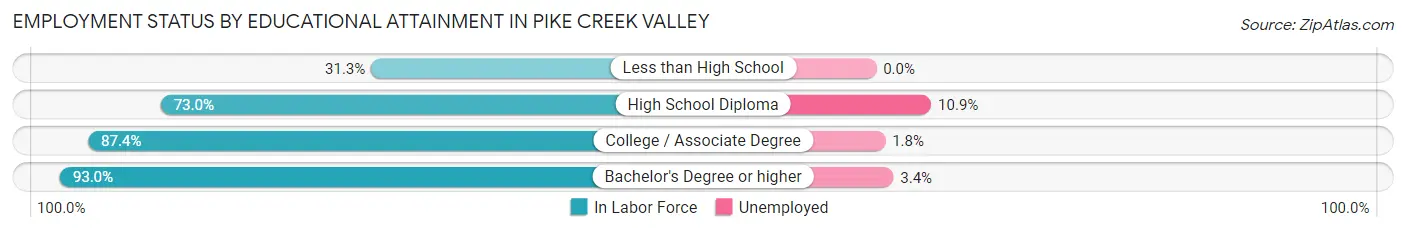
| Educational Attainment | In Labor Force | Unemployed |
| Less than High School | 21 (31.3%) | 0 (0.0%) |
| High School Diploma | 863 (73.0%) | 129 (10.9%) |
| College / Associate Degree | 1,939 (87.4%) | 40 (1.8%) |
| Bachelor's Degree or higher | 3,210 (93.0%) | 117 (3.4%) |
| Total | 6,034 (87.2%) | 270 (3.9%) |
Employment Occupations by Sex in Pike Creek Valley
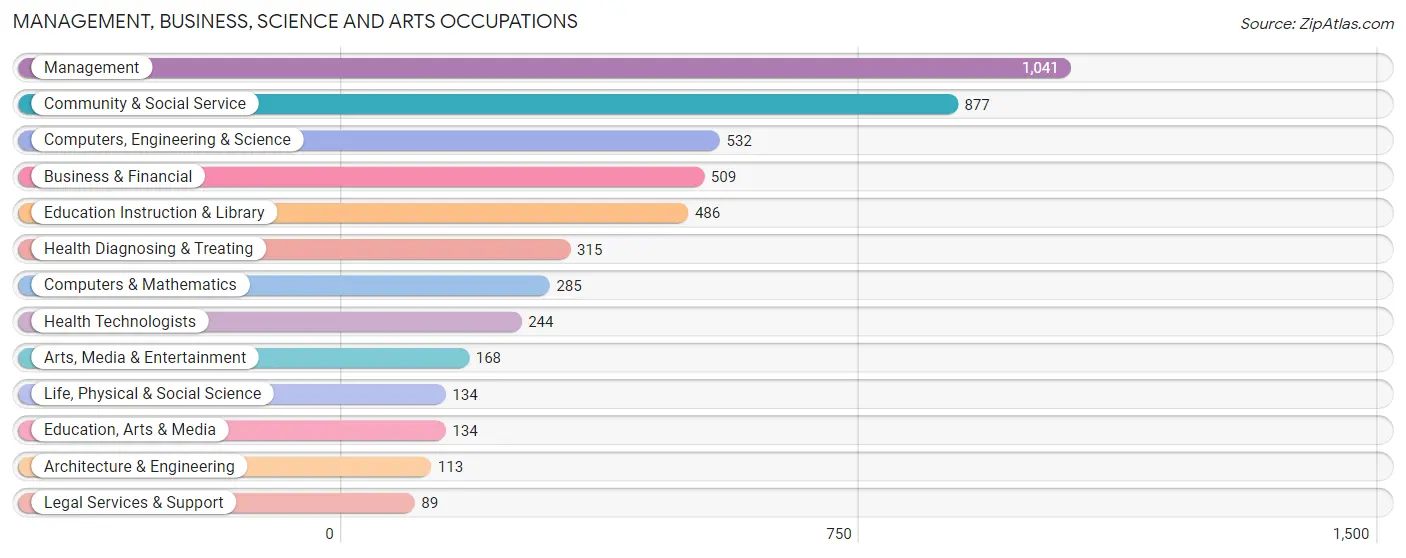
Management, Business, Science and Arts Occupations
The most common Management, Business, Science and Arts occupations in Pike Creek Valley are Management (1,041 | 15.9%), Community & Social Service (877 | 13.4%), Computers, Engineering & Science (532 | 8.1%), Business & Financial (509 | 7.8%), and Education Instruction & Library (486 | 7.4%).
Management, Business, Science and Arts Occupations by Sex
Within the Management, Business, Science and Arts occupations in Pike Creek Valley, the most male-oriented occupations are Architecture & Engineering (97.4%), Computers & Mathematics (90.5%), and Computers, Engineering & Science (81.4%), while the most female-oriented occupations are Health Diagnosing & Treating (94.3%), Health Technologists (93.9%), and Legal Services & Support (76.4%).
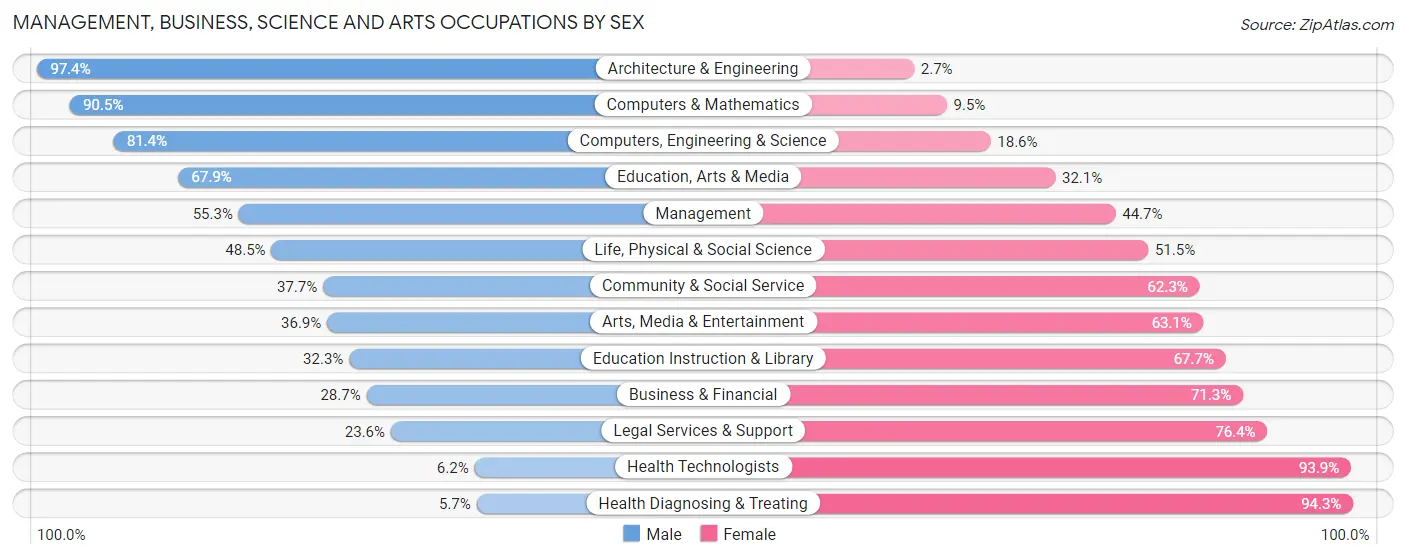
| Occupation | Male | Female |
| Management | 576 (55.3%) | 465 (44.7%) |
| Business & Financial | 146 (28.7%) | 363 (71.3%) |
| Computers, Engineering & Science | 433 (81.4%) | 99 (18.6%) |
| Computers & Mathematics | 258 (90.5%) | 27 (9.5%) |
| Architecture & Engineering | 110 (97.4%) | 3 (2.6%) |
| Life, Physical & Social Science | 65 (48.5%) | 69 (51.5%) |
| Community & Social Service | 331 (37.7%) | 546 (62.3%) |
| Education, Arts & Media | 91 (67.9%) | 43 (32.1%) |
| Legal Services & Support | 21 (23.6%) | 68 (76.4%) |
| Education Instruction & Library | 157 (32.3%) | 329 (67.7%) |
| Arts, Media & Entertainment | 62 (36.9%) | 106 (63.1%) |
| Health Diagnosing & Treating | 18 (5.7%) | 297 (94.3%) |
| Health Technologists | 15 (6.1%) | 229 (93.9%) |
| Total (Category) | 1,504 (45.9%) | 1,770 (54.1%) |
| Total (Overall) | 3,358 (51.4%) | 3,177 (48.6%) |
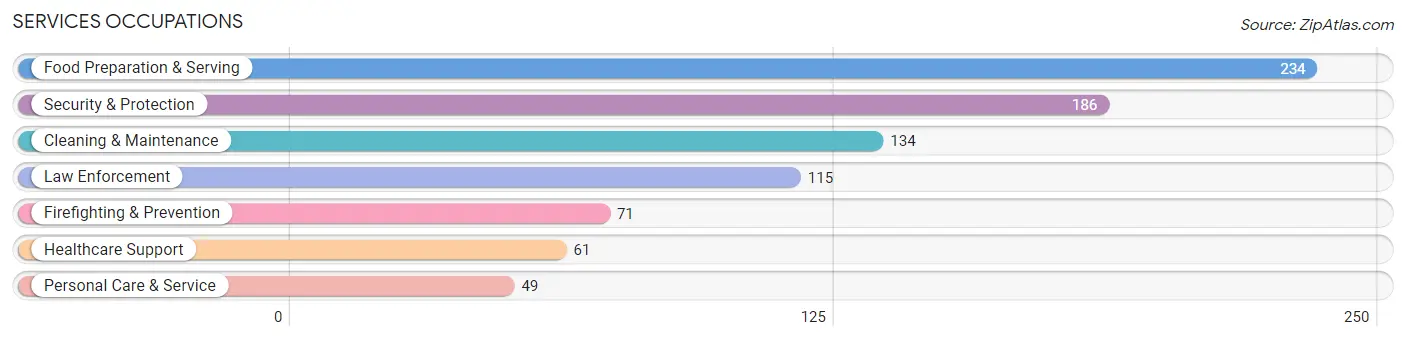
Services Occupations
The most common Services occupations in Pike Creek Valley are Food Preparation & Serving (234 | 3.6%), Security & Protection (186 | 2.9%), Cleaning & Maintenance (134 | 2.1%), Law Enforcement (115 | 1.8%), and Firefighting & Prevention (71 | 1.1%).
Services Occupations by Sex
Within the Services occupations in Pike Creek Valley, the most male-oriented occupations are Law Enforcement (100.0%), Security & Protection (75.8%), and Cleaning & Maintenance (75.4%), while the most female-oriented occupations are Healthcare Support (93.4%), Firefighting & Prevention (63.4%), and Personal Care & Service (57.1%).
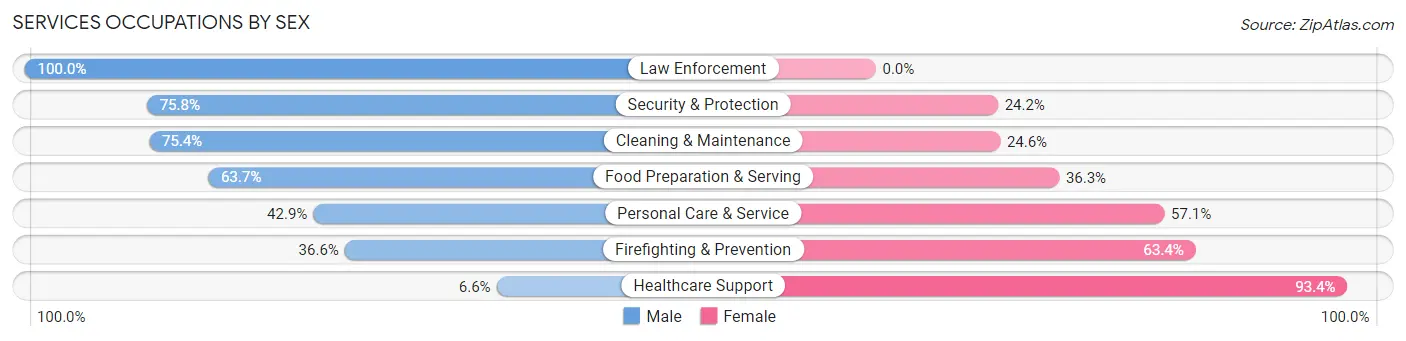
| Occupation | Male | Female |
| Healthcare Support | 4 (6.6%) | 57 (93.4%) |
| Security & Protection | 141 (75.8%) | 45 (24.2%) |
| Firefighting & Prevention | 26 (36.6%) | 45 (63.4%) |
| Law Enforcement | 115 (100.0%) | 0 (0.0%) |
| Food Preparation & Serving | 149 (63.7%) | 85 (36.3%) |
| Cleaning & Maintenance | 101 (75.4%) | 33 (24.6%) |
| Personal Care & Service | 21 (42.9%) | 28 (57.1%) |
| Total (Category) | 416 (62.6%) | 248 (37.3%) |
| Total (Overall) | 3,358 (51.4%) | 3,177 (48.6%) |
Sales and Office Occupations
The most common Sales and Office occupations in Pike Creek Valley are Office & Administration (769 | 11.8%), and Sales & Related (745 | 11.4%).

Sales and Office Occupations by Sex

| Occupation | Male | Female |
| Sales & Related | 323 (43.4%) | 422 (56.6%) |
| Office & Administration | 171 (22.2%) | 598 (77.8%) |
| Total (Category) | 494 (32.6%) | 1,020 (67.4%) |
| Total (Overall) | 3,358 (51.4%) | 3,177 (48.6%) |
Natural Resources, Construction and Maintenance Occupations
The most common Natural Resources, Construction and Maintenance occupations in Pike Creek Valley are Construction & Extraction (252 | 3.9%), Installation, Maintenance & Repair (199 | 3.0%), and Farming, Fishing & Forestry (32 | 0.5%).

Natural Resources, Construction and Maintenance Occupations by Sex
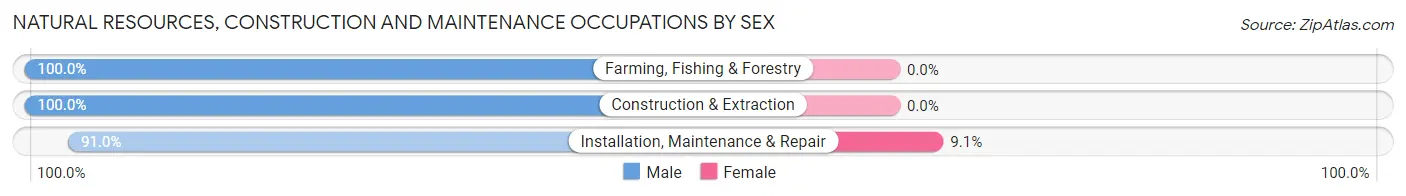
| Occupation | Male | Female |
| Farming, Fishing & Forestry | 32 (100.0%) | 0 (0.0%) |
| Construction & Extraction | 252 (100.0%) | 0 (0.0%) |
| Installation, Maintenance & Repair | 181 (90.9%) | 18 (9.0%) |
| Total (Category) | 465 (96.3%) | 18 (3.7%) |
| Total (Overall) | 3,358 (51.4%) | 3,177 (48.6%) |
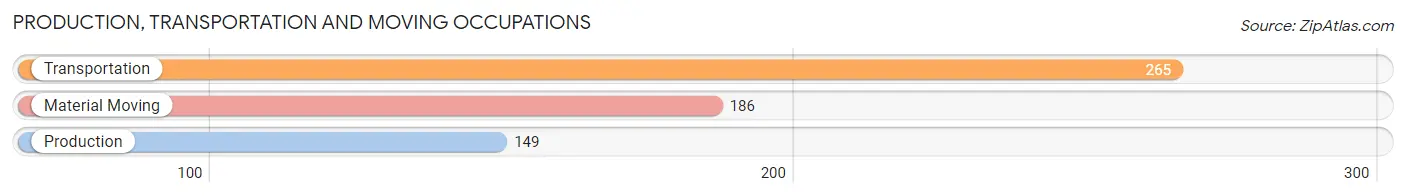
Production, Transportation and Moving Occupations
The most common Production, Transportation and Moving occupations in Pike Creek Valley are Transportation (265 | 4.1%), Material Moving (186 | 2.9%), and Production (149 | 2.3%).
Production, Transportation and Moving Occupations by Sex
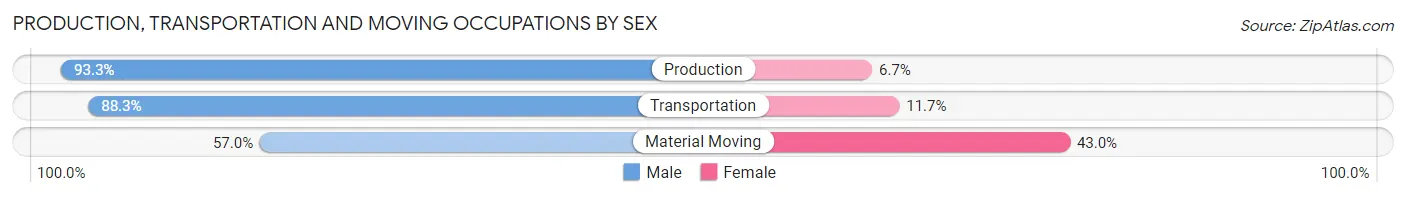
| Occupation | Male | Female |
| Production | 139 (93.3%) | 10 (6.7%) |
| Transportation | 234 (88.3%) | 31 (11.7%) |
| Material Moving | 106 (57.0%) | 80 (43.0%) |
| Total (Category) | 479 (79.8%) | 121 (20.2%) |
| Total (Overall) | 3,358 (51.4%) | 3,177 (48.6%) |
Employment Industries by Sex in Pike Creek Valley
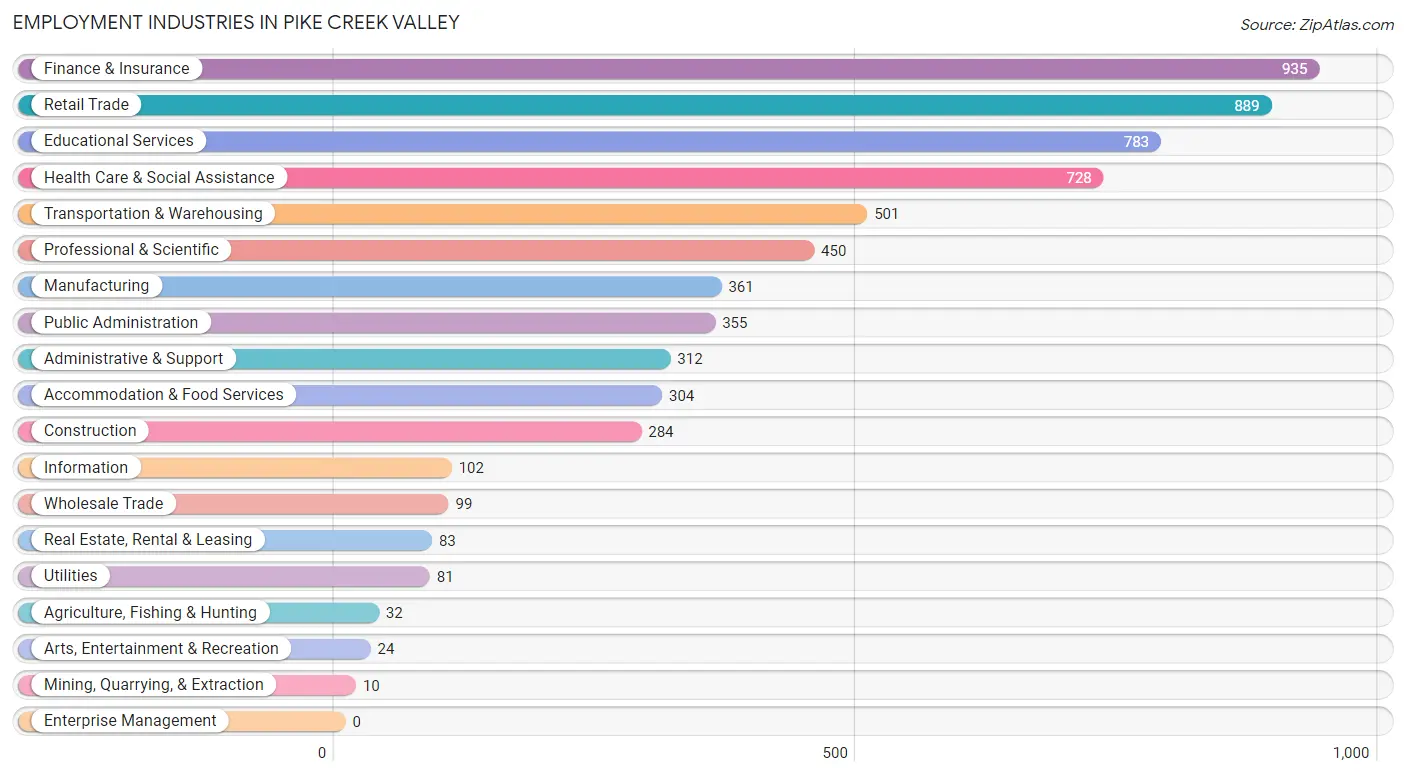
Employment Industries in Pike Creek Valley
The major employment industries in Pike Creek Valley include Finance & Insurance (935 | 14.3%), Retail Trade (889 | 13.6%), Educational Services (783 | 12.0%), Health Care & Social Assistance (728 | 11.1%), and Transportation & Warehousing (501 | 7.7%).
Employment Industries by Sex in Pike Creek Valley
The Pike Creek Valley industries that see more men than women are Agriculture, Fishing & Hunting (100.0%), Mining, Quarrying, & Extraction (100.0%), and Utilities (100.0%), whereas the industries that tend to have a higher number of women are Real Estate, Rental & Leasing (85.5%), Health Care & Social Assistance (81.0%), and Finance & Insurance (72.1%).
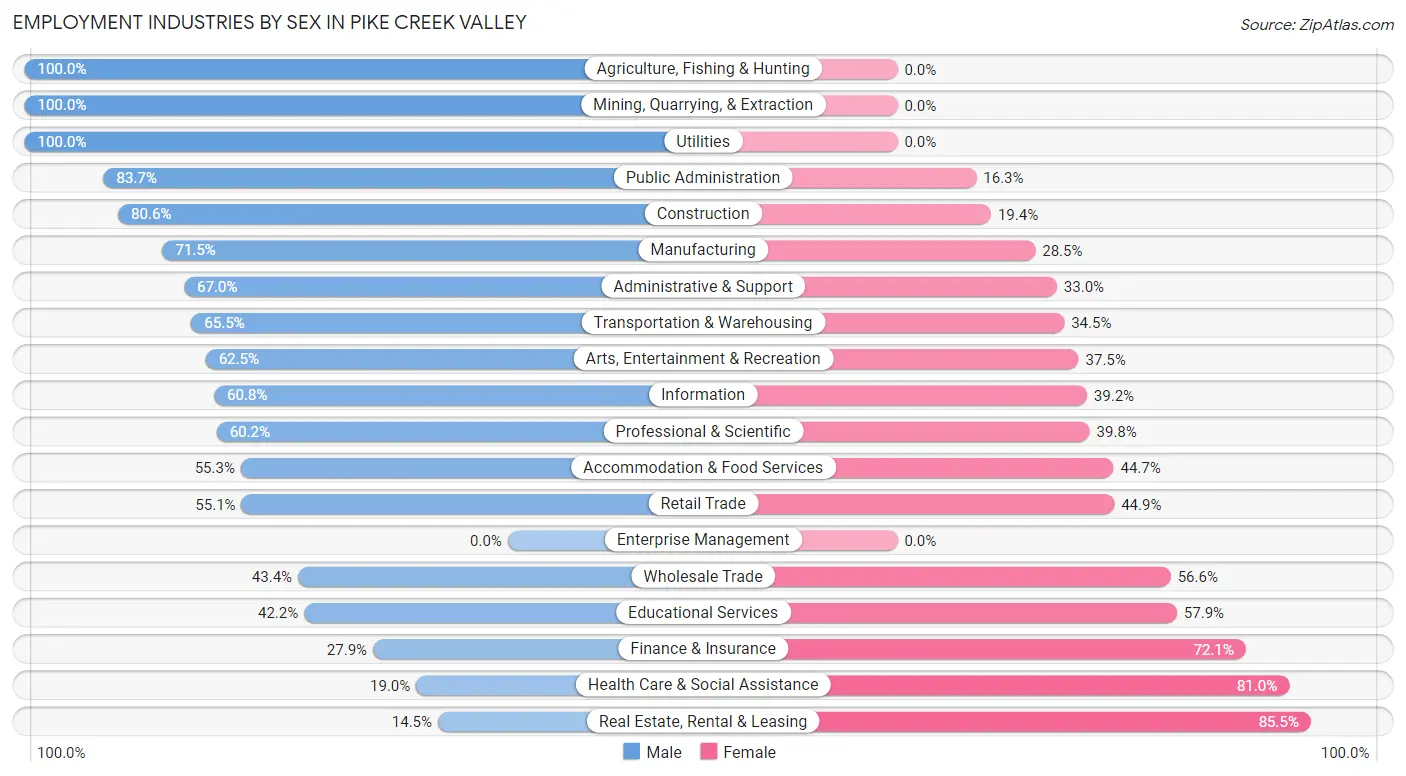
| Industry | Male | Female |
| Agriculture, Fishing & Hunting | 32 (100.0%) | 0 (0.0%) |
| Mining, Quarrying, & Extraction | 10 (100.0%) | 0 (0.0%) |
| Construction | 229 (80.6%) | 55 (19.4%) |
| Manufacturing | 258 (71.5%) | 103 (28.5%) |
| Wholesale Trade | 43 (43.4%) | 56 (56.6%) |
| Retail Trade | 490 (55.1%) | 399 (44.9%) |
| Transportation & Warehousing | 328 (65.5%) | 173 (34.5%) |
| Utilities | 81 (100.0%) | 0 (0.0%) |
| Information | 62 (60.8%) | 40 (39.2%) |
| Finance & Insurance | 261 (27.9%) | 674 (72.1%) |
| Real Estate, Rental & Leasing | 12 (14.5%) | 71 (85.5%) |
| Professional & Scientific | 271 (60.2%) | 179 (39.8%) |
| Enterprise Management | 0 (0.0%) | 0 (0.0%) |
| Administrative & Support | 209 (67.0%) | 103 (33.0%) |
| Educational Services | 330 (42.1%) | 453 (57.9%) |
| Health Care & Social Assistance | 138 (19.0%) | 590 (81.0%) |
| Arts, Entertainment & Recreation | 15 (62.5%) | 9 (37.5%) |
| Accommodation & Food Services | 168 (55.3%) | 136 (44.7%) |
| Public Administration | 297 (83.7%) | 58 (16.3%) |
| Total | 3,358 (51.4%) | 3,177 (48.6%) |
Education in Pike Creek Valley
School Enrollment in Pike Creek Valley
The most common levels of schooling among the 2,461 students in Pike Creek Valley are college / undergraduate (512 | 20.8%), high school (497 | 20.2%), and middle school (495 | 20.1%).
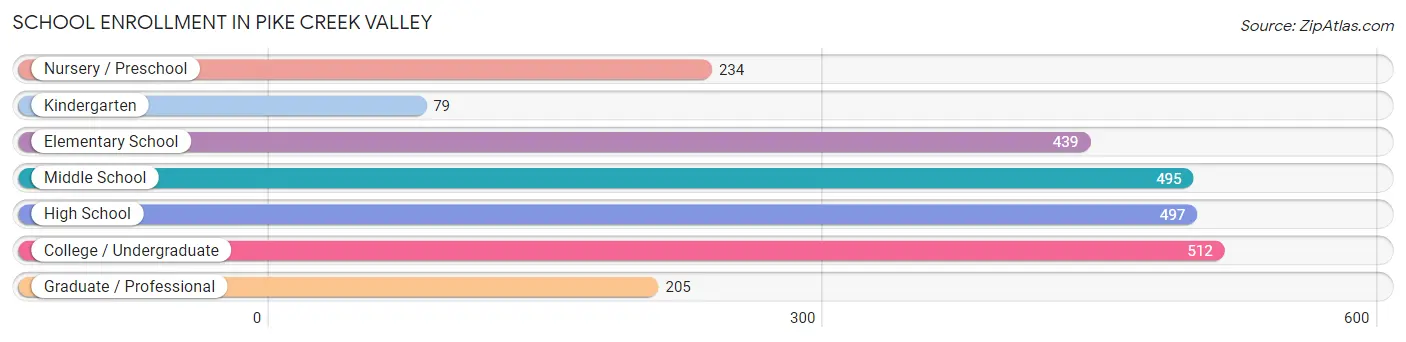
| School Level | # Students | % Students |
| Nursery / Preschool | 234 | 9.5% |
| Kindergarten | 79 | 3.2% |
| Elementary School | 439 | 17.8% |
| Middle School | 495 | 20.1% |
| High School | 497 | 20.2% |
| College / Undergraduate | 512 | 20.8% |
| Graduate / Professional | 205 | 8.3% |
| Total | 2,461 | 100.0% |
School Enrollment by Age by Funding Source in Pike Creek Valley
Out of a total of 2,461 students who are enrolled in schools in Pike Creek Valley, 795 (32.3%) attend a private institution, while the remaining 1,666 (67.7%) are enrolled in public schools. The age group of 3 to 4 year olds has the highest likelihood of being enrolled in private schools, with 153 (100.0% in the age bracket) enrolled. Conversely, the age group of 5 to 9 year old has the lowest likelihood of being enrolled in a private school, with 405 (91.0% in the age bracket) attending a public institution.
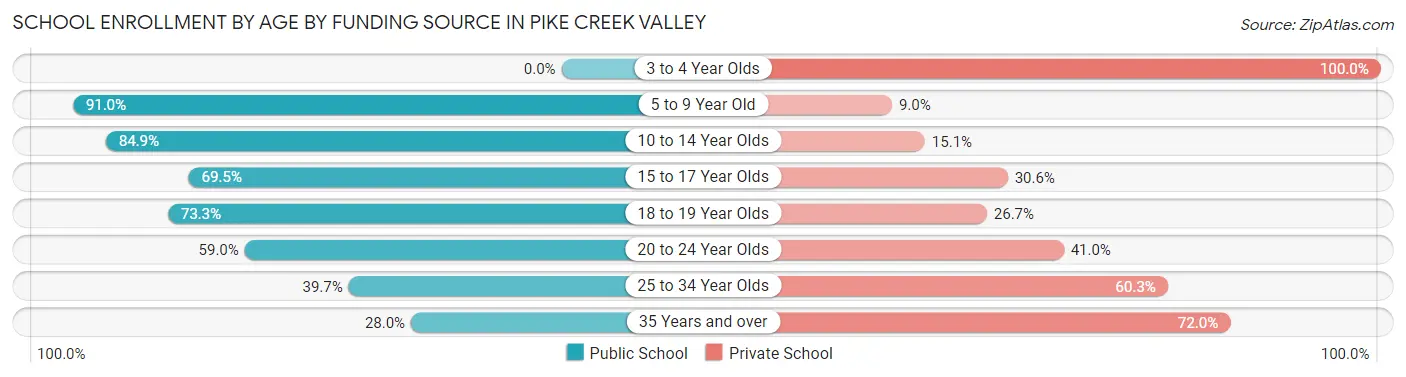
| Age Bracket | Public School | Private School |
| 3 to 4 Year Olds | 0 (0.0%) | 153 (100.0%) |
| 5 to 9 Year Old | 405 (91.0%) | 40 (9.0%) |
| 10 to 14 Year Olds | 606 (84.9%) | 108 (15.1%) |
| 15 to 17 Year Olds | 291 (69.5%) | 128 (30.5%) |
| 18 to 19 Year Olds | 110 (73.3%) | 40 (26.7%) |
| 20 to 24 Year Olds | 108 (59.0%) | 75 (41.0%) |
| 25 to 34 Year Olds | 115 (39.7%) | 175 (60.3%) |
| 35 Years and over | 30 (28.0%) | 77 (72.0%) |
| Total | 1,666 (67.7%) | 795 (32.3%) |
Educational Attainment by Field of Study in Pike Creek Valley
Business (849 | 18.7%), education (540 | 11.9%), engineering (462 | 10.2%), liberal arts & history (398 | 8.8%), and science & technology (352 | 7.8%) are the most common fields of study among 4,535 individuals in Pike Creek Valley who have obtained a bachelor's degree or higher.
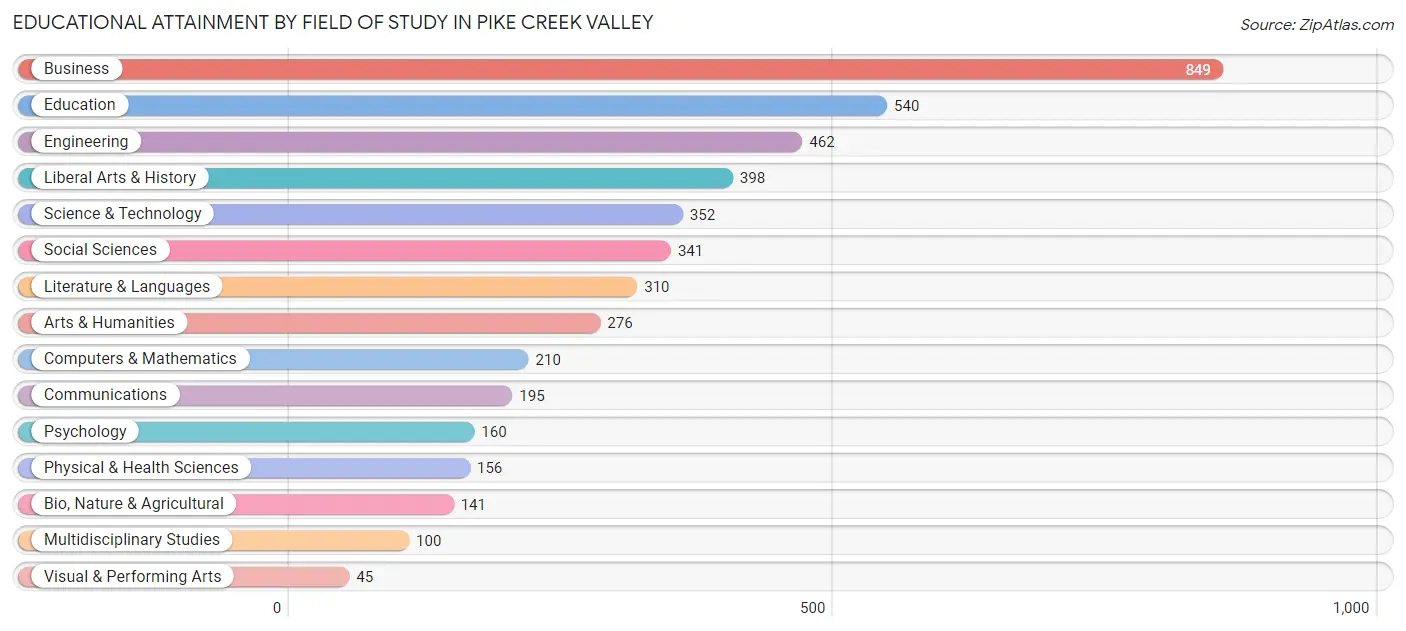
| Field of Study | # Graduates | % Graduates |
| Computers & Mathematics | 210 | 4.6% |
| Bio, Nature & Agricultural | 141 | 3.1% |
| Physical & Health Sciences | 156 | 3.4% |
| Psychology | 160 | 3.5% |
| Social Sciences | 341 | 7.5% |
| Engineering | 462 | 10.2% |
| Multidisciplinary Studies | 100 | 2.2% |
| Science & Technology | 352 | 7.8% |
| Business | 849 | 18.7% |
| Education | 540 | 11.9% |
| Literature & Languages | 310 | 6.8% |
| Liberal Arts & History | 398 | 8.8% |
| Visual & Performing Arts | 45 | 1.0% |
| Communications | 195 | 4.3% |
| Arts & Humanities | 276 | 6.1% |
| Total | 4,535 | 100.0% |
Transportation & Commute in Pike Creek Valley
Vehicle Availability by Sex in Pike Creek Valley
The most prevalent vehicle ownership categories in Pike Creek Valley are males with 2 vehicles (1,549, accounting for 46.8%) and females with 2 vehicles (1,510, making up 50.7%).
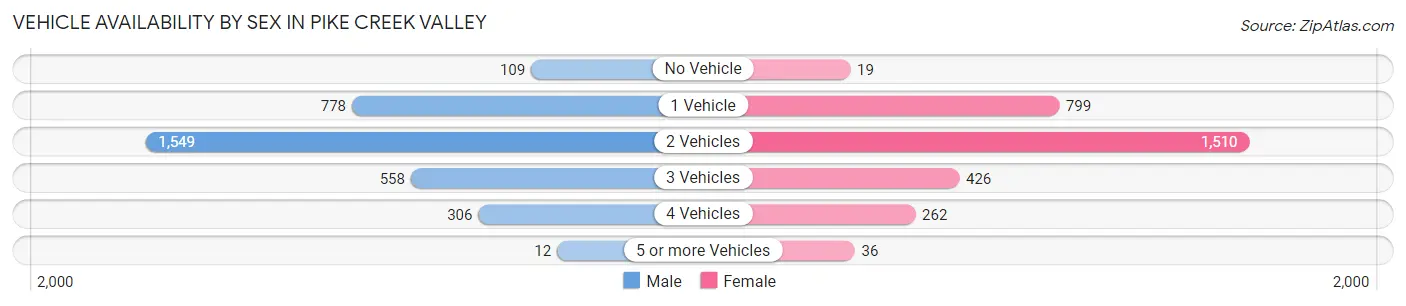
| Vehicles Available | Male | Female |
| No Vehicle | 109 (3.3%) | 19 (0.6%) |
| 1 Vehicle | 778 (23.5%) | 799 (26.2%) |
| 2 Vehicles | 1,549 (46.8%) | 1,510 (49.5%) |
| 3 Vehicles | 558 (16.9%) | 426 (14.0%) |
| 4 Vehicles | 306 (9.2%) | 262 (8.6%) |
| 5 or more Vehicles | 12 (0.4%) | 36 (1.2%) |
| Total | 3,312 (100.0%) | 3,052 (100.0%) |
Commute Time in Pike Creek Valley
The most frequently occuring commute durations in Pike Creek Valley are 15 to 19 minutes (1,084 commuters, 19.8%), 20 to 24 minutes (890 commuters, 16.2%), and 10 to 14 minutes (837 commuters, 15.3%).
| Commute Time | # Commuters | % Commuters |
| Less than 5 Minutes | 432 | 7.9% |
| 5 to 9 Minutes | 206 | 3.8% |
| 10 to 14 Minutes | 837 | 15.3% |
| 15 to 19 Minutes | 1,084 | 19.8% |
| 20 to 24 Minutes | 890 | 16.2% |
| 25 to 29 Minutes | 704 | 12.8% |
| 30 to 34 Minutes | 684 | 12.5% |
| 35 to 39 Minutes | 49 | 0.9% |
| 40 to 44 Minutes | 102 | 1.9% |
| 45 to 59 Minutes | 209 | 3.8% |
| 60 to 89 Minutes | 143 | 2.6% |
| 90 or more Minutes | 144 | 2.6% |
Commute Time by Sex in Pike Creek Valley
The most common commute times in Pike Creek Valley are 15 to 19 minutes (533 commuters, 19.1%) for males and 15 to 19 minutes (551 commuters, 20.5%) for females.
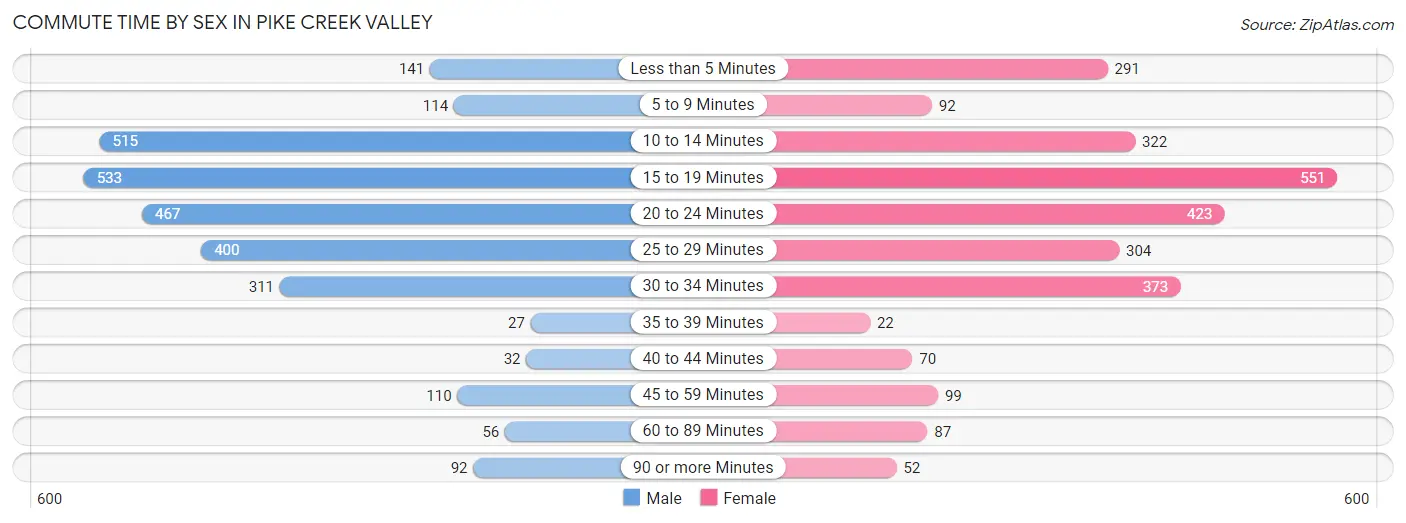
| Commute Time | Male | Female |
| Less than 5 Minutes | 141 (5.0%) | 291 (10.8%) |
| 5 to 9 Minutes | 114 (4.1%) | 92 (3.4%) |
| 10 to 14 Minutes | 515 (18.4%) | 322 (12.0%) |
| 15 to 19 Minutes | 533 (19.1%) | 551 (20.5%) |
| 20 to 24 Minutes | 467 (16.7%) | 423 (15.8%) |
| 25 to 29 Minutes | 400 (14.3%) | 304 (11.3%) |
| 30 to 34 Minutes | 311 (11.1%) | 373 (13.9%) |
| 35 to 39 Minutes | 27 (1.0%) | 22 (0.8%) |
| 40 to 44 Minutes | 32 (1.1%) | 70 (2.6%) |
| 45 to 59 Minutes | 110 (3.9%) | 99 (3.7%) |
| 60 to 89 Minutes | 56 (2.0%) | 87 (3.2%) |
| 90 or more Minutes | 92 (3.3%) | 52 (1.9%) |
Time of Departure to Work by Sex in Pike Creek Valley
The most frequent times of departure to work in Pike Creek Valley are 7:30 AM to 7:59 AM (574, 20.5%) for males and 4:00 PM to 11:59 PM (450, 16.8%) for females.
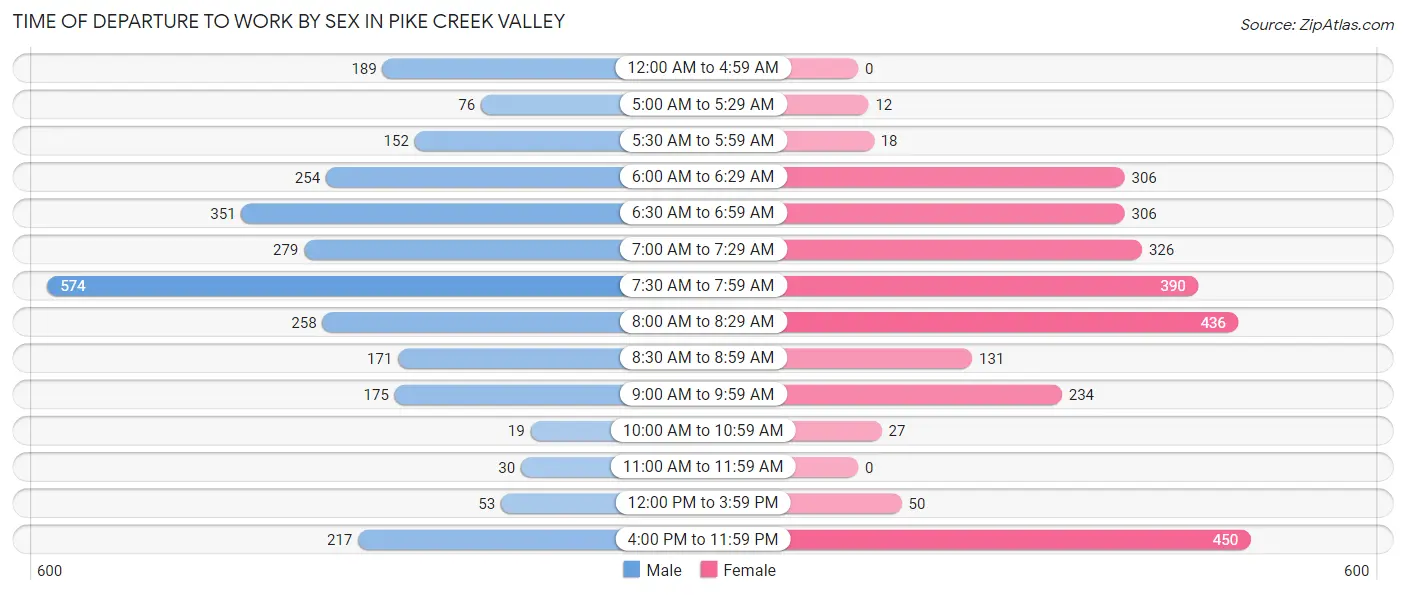
| Time of Departure | Male | Female |
| 12:00 AM to 4:59 AM | 189 (6.8%) | 0 (0.0%) |
| 5:00 AM to 5:29 AM | 76 (2.7%) | 12 (0.4%) |
| 5:30 AM to 5:59 AM | 152 (5.4%) | 18 (0.7%) |
| 6:00 AM to 6:29 AM | 254 (9.1%) | 306 (11.4%) |
| 6:30 AM to 6:59 AM | 351 (12.5%) | 306 (11.4%) |
| 7:00 AM to 7:29 AM | 279 (10.0%) | 326 (12.1%) |
| 7:30 AM to 7:59 AM | 574 (20.5%) | 390 (14.5%) |
| 8:00 AM to 8:29 AM | 258 (9.2%) | 436 (16.2%) |
| 8:30 AM to 8:59 AM | 171 (6.1%) | 131 (4.9%) |
| 9:00 AM to 9:59 AM | 175 (6.2%) | 234 (8.7%) |
| 10:00 AM to 10:59 AM | 19 (0.7%) | 27 (1.0%) |
| 11:00 AM to 11:59 AM | 30 (1.1%) | 0 (0.0%) |
| 12:00 PM to 3:59 PM | 53 (1.9%) | 50 (1.9%) |
| 4:00 PM to 11:59 PM | 217 (7.8%) | 450 (16.8%) |
| Total | 2,798 (100.0%) | 2,686 (100.0%) |
Housing Occupancy in Pike Creek Valley
Occupancy by Ownership in Pike Creek Valley
Of the total 5,168 dwellings in Pike Creek Valley, owner-occupied units account for 3,316 (64.2%), while renter-occupied units make up 1,852 (35.8%).
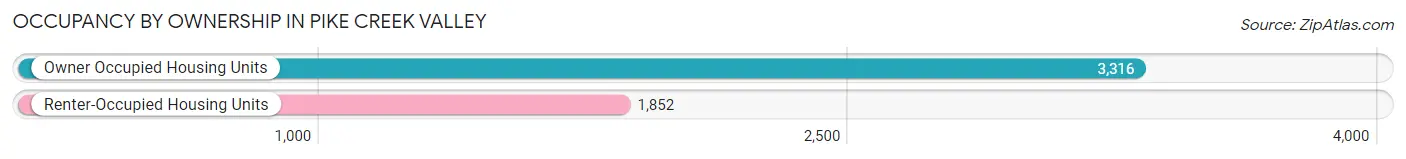
| Occupancy | # Housing Units | % Housing Units |
| Owner Occupied Housing Units | 3,316 | 64.2% |
| Renter-Occupied Housing Units | 1,852 | 35.8% |
| Total Occupied Housing Units | 5,168 | 100.0% |
Occupancy by Household Size in Pike Creek Valley
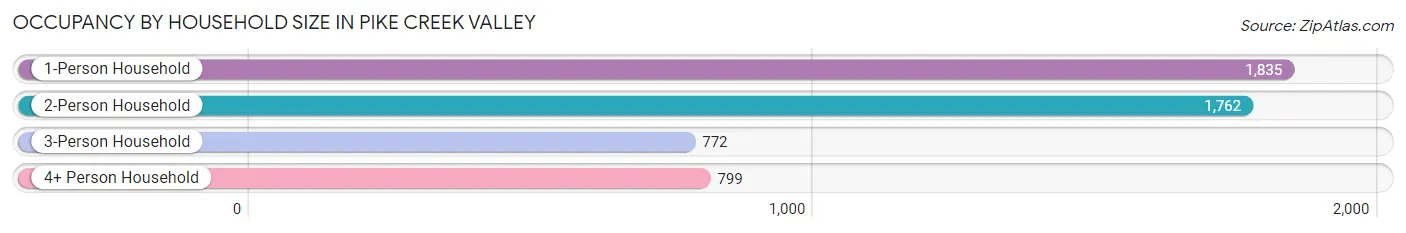
| Household Size | # Housing Units | % Housing Units |
| 1-Person Household | 1,835 | 35.5% |
| 2-Person Household | 1,762 | 34.1% |
| 3-Person Household | 772 | 14.9% |
| 4+ Person Household | 799 | 15.5% |
| Total Housing Units | 5,168 | 100.0% |
Occupancy by Ownership by Household Size in Pike Creek Valley
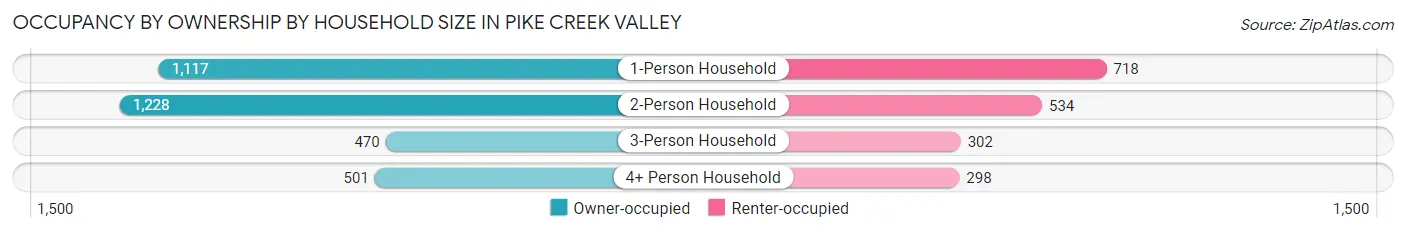
| Household Size | Owner-occupied | Renter-occupied |
| 1-Person Household | 1,117 (60.9%) | 718 (39.1%) |
| 2-Person Household | 1,228 (69.7%) | 534 (30.3%) |
| 3-Person Household | 470 (60.9%) | 302 (39.1%) |
| 4+ Person Household | 501 (62.7%) | 298 (37.3%) |
| Total Housing Units | 3,316 (64.2%) | 1,852 (35.8%) |
Occupancy by Educational Attainment in Pike Creek Valley
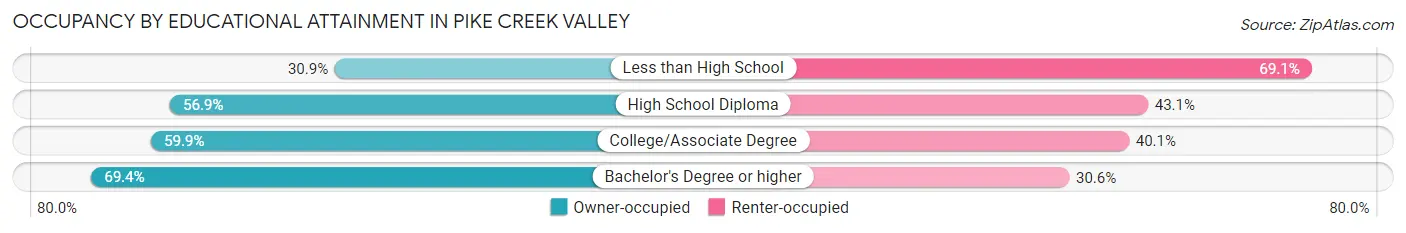
| Household Size | Owner-occupied | Renter-occupied |
| Less than High School | 30 (30.9%) | 67 (69.1%) |
| High School Diploma | 559 (56.9%) | 423 (43.1%) |
| College/Associate Degree | 703 (59.9%) | 470 (40.1%) |
| Bachelor's Degree or higher | 2,024 (69.4%) | 892 (30.6%) |
Occupancy by Age of Householder in Pike Creek Valley
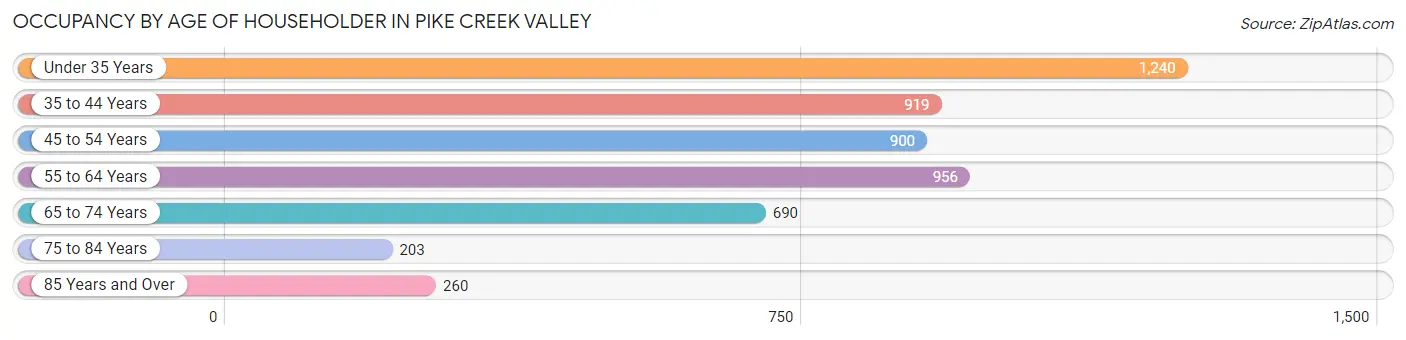
| Age Bracket | # Households | % Households |
| Under 35 Years | 1,240 | 24.0% |
| 35 to 44 Years | 919 | 17.8% |
| 45 to 54 Years | 900 | 17.4% |
| 55 to 64 Years | 956 | 18.5% |
| 65 to 74 Years | 690 | 13.4% |
| 75 to 84 Years | 203 | 3.9% |
| 85 Years and Over | 260 | 5.0% |
| Total | 5,168 | 100.0% |
Housing Finances in Pike Creek Valley
Median Income by Occupancy in Pike Creek Valley
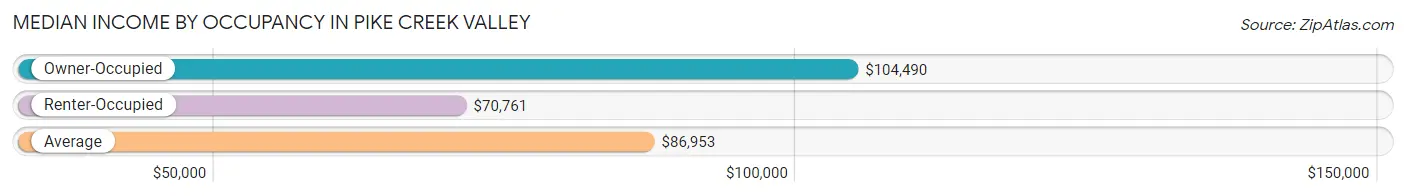
| Occupancy Type | # Households | Median Income |
| Owner-Occupied | 3,316 (64.2%) | $104,490 |
| Renter-Occupied | 1,852 (35.8%) | $70,761 |
| Average | 5,168 (100.0%) | $86,953 |
Occupancy by Householder Income Bracket in Pike Creek Valley
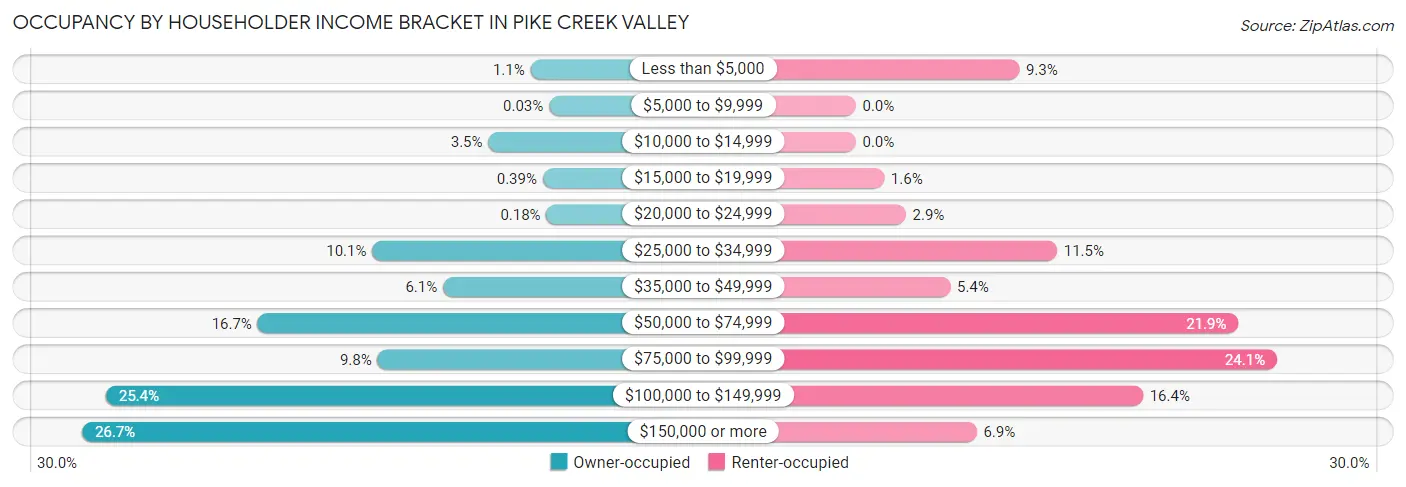
| Income Bracket | Owner-occupied | Renter-occupied |
| Less than $5,000 | 36 (1.1%) | 173 (9.3%) |
| $5,000 to $9,999 | 1 (0.0%) | 0 (0.0%) |
| $10,000 to $14,999 | 116 (3.5%) | 0 (0.0%) |
| $15,000 to $19,999 | 13 (0.4%) | 30 (1.6%) |
| $20,000 to $24,999 | 6 (0.2%) | 53 (2.9%) |
| $25,000 to $34,999 | 336 (10.1%) | 213 (11.5%) |
| $35,000 to $49,999 | 202 (6.1%) | 100 (5.4%) |
| $50,000 to $74,999 | 553 (16.7%) | 405 (21.9%) |
| $75,000 to $99,999 | 326 (9.8%) | 446 (24.1%) |
| $100,000 to $149,999 | 841 (25.4%) | 304 (16.4%) |
| $150,000 or more | 886 (26.7%) | 128 (6.9%) |
| Total | 3,316 (100.0%) | 1,852 (100.0%) |
Monthly Housing Cost Tiers in Pike Creek Valley
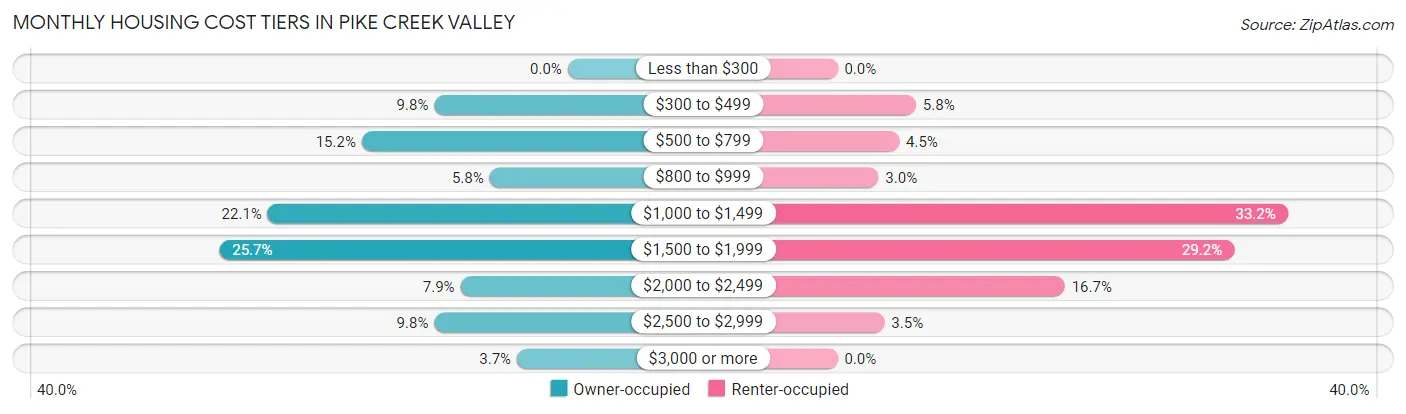
| Monthly Cost | Owner-occupied | Renter-occupied |
| Less than $300 | 0 (0.0%) | 0 (0.0%) |
| $300 to $499 | 326 (9.8%) | 107 (5.8%) |
| $500 to $799 | 503 (15.2%) | 84 (4.5%) |
| $800 to $999 | 191 (5.8%) | 56 (3.0%) |
| $1,000 to $1,499 | 733 (22.1%) | 614 (33.2%) |
| $1,500 to $1,999 | 851 (25.7%) | 541 (29.2%) |
| $2,000 to $2,499 | 262 (7.9%) | 310 (16.7%) |
| $2,500 to $2,999 | 326 (9.8%) | 64 (3.5%) |
| $3,000 or more | 124 (3.7%) | 0 (0.0%) |
| Total | 3,316 (100.0%) | 1,852 (100.0%) |
Physical Housing Characteristics in Pike Creek Valley
Housing Structures in Pike Creek Valley
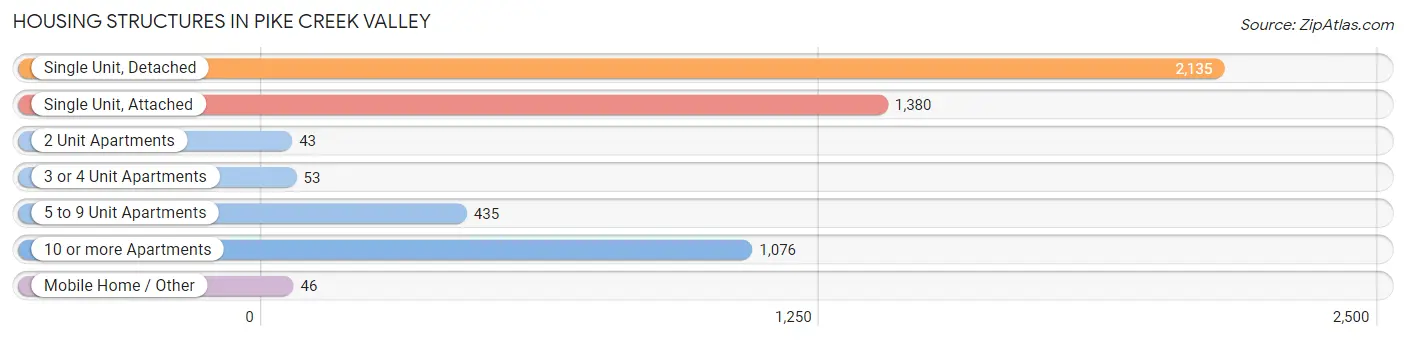
| Structure Type | # Housing Units | % Housing Units |
| Single Unit, Detached | 2,135 | 41.3% |
| Single Unit, Attached | 1,380 | 26.7% |
| 2 Unit Apartments | 43 | 0.8% |
| 3 or 4 Unit Apartments | 53 | 1.0% |
| 5 to 9 Unit Apartments | 435 | 8.4% |
| 10 or more Apartments | 1,076 | 20.8% |
| Mobile Home / Other | 46 | 0.9% |
| Total | 5,168 | 100.0% |
Housing Structures by Occupancy in Pike Creek Valley
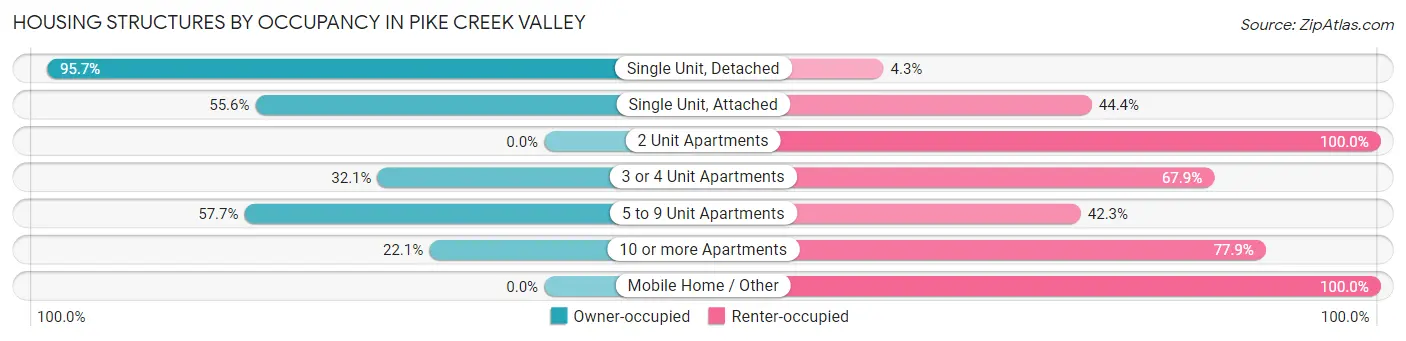
| Structure Type | Owner-occupied | Renter-occupied |
| Single Unit, Detached | 2,043 (95.7%) | 92 (4.3%) |
| Single Unit, Attached | 767 (55.6%) | 613 (44.4%) |
| 2 Unit Apartments | 0 (0.0%) | 43 (100.0%) |
| 3 or 4 Unit Apartments | 17 (32.1%) | 36 (67.9%) |
| 5 to 9 Unit Apartments | 251 (57.7%) | 184 (42.3%) |
| 10 or more Apartments | 238 (22.1%) | 838 (77.9%) |
| Mobile Home / Other | 0 (0.0%) | 46 (100.0%) |
| Total | 3,316 (64.2%) | 1,852 (35.8%) |
Housing Structures by Number of Rooms in Pike Creek Valley
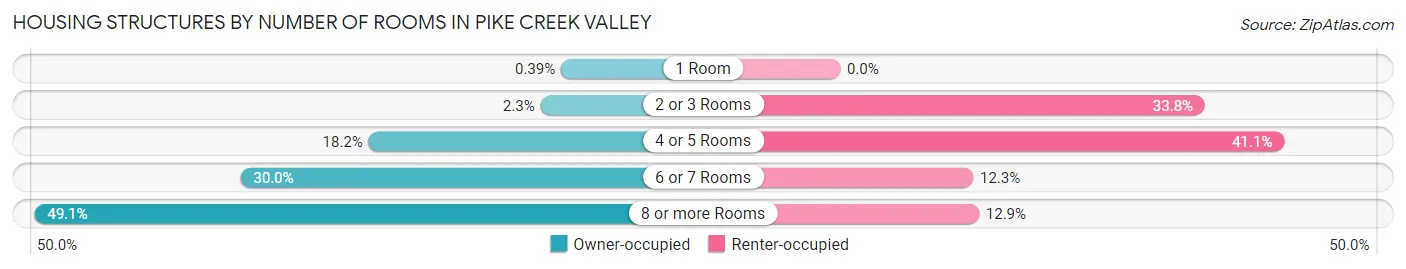
| Number of Rooms | Owner-occupied | Renter-occupied |
| 1 Room | 13 (0.4%) | 0 (0.0%) |
| 2 or 3 Rooms | 76 (2.3%) | 625 (33.8%) |
| 4 or 5 Rooms | 603 (18.2%) | 761 (41.1%) |
| 6 or 7 Rooms | 996 (30.0%) | 228 (12.3%) |
| 8 or more Rooms | 1,628 (49.1%) | 238 (12.9%) |
| Total | 3,316 (100.0%) | 1,852 (100.0%) |
Housing Structure by Heating Type in Pike Creek Valley
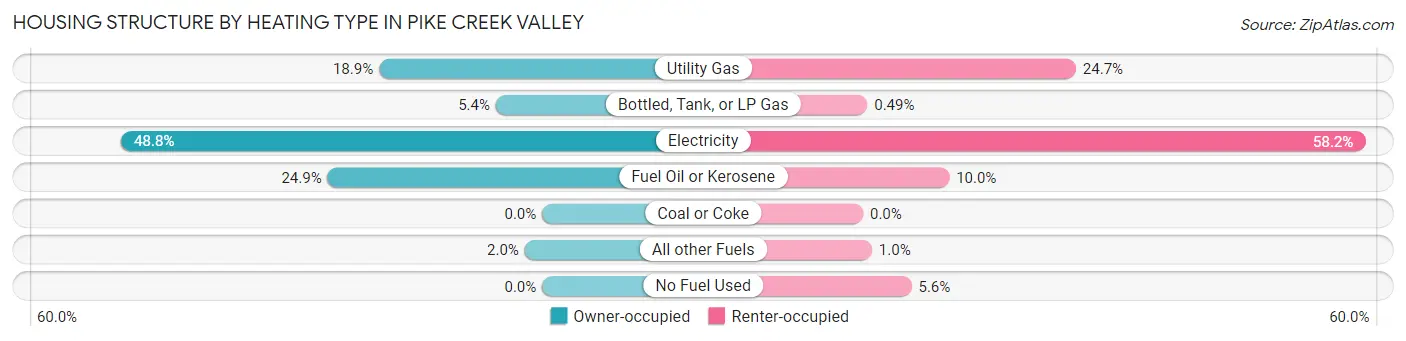
| Heating Type | Owner-occupied | Renter-occupied |
| Utility Gas | 627 (18.9%) | 457 (24.7%) |
| Bottled, Tank, or LP Gas | 178 (5.4%) | 9 (0.5%) |
| Electricity | 1,619 (48.8%) | 1,078 (58.2%) |
| Fuel Oil or Kerosene | 825 (24.9%) | 185 (10.0%) |
| Coal or Coke | 0 (0.0%) | 0 (0.0%) |
| All other Fuels | 67 (2.0%) | 19 (1.0%) |
| No Fuel Used | 0 (0.0%) | 104 (5.6%) |
| Total | 3,316 (100.0%) | 1,852 (100.0%) |
Household Vehicle Usage in Pike Creek Valley
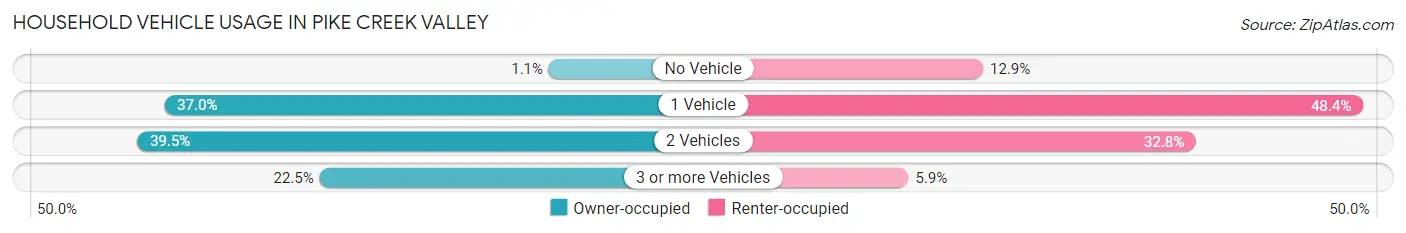
| Vehicles per Household | Owner-occupied | Renter-occupied |
| No Vehicle | 35 (1.1%) | 239 (12.9%) |
| 1 Vehicle | 1,226 (37.0%) | 896 (48.4%) |
| 2 Vehicles | 1,310 (39.5%) | 607 (32.8%) |
| 3 or more Vehicles | 745 (22.5%) | 110 (5.9%) |
| Total | 3,316 (100.0%) | 1,852 (100.0%) |
Real Estate & Mortgages in Pike Creek Valley
Real Estate and Mortgage Overview in Pike Creek Valley
| Characteristic | Without Mortgage | With Mortgage |
| Housing Units | 1,001 | 2,315 |
| Median Property Value | $264,800 | $285,700 |
| Median Household Income | $71,875 | $629 |
| Monthly Housing Costs | $578 | $124 |
| Real Estate Taxes | $2,593 | $46 |
Property Value by Mortgage Status in Pike Creek Valley
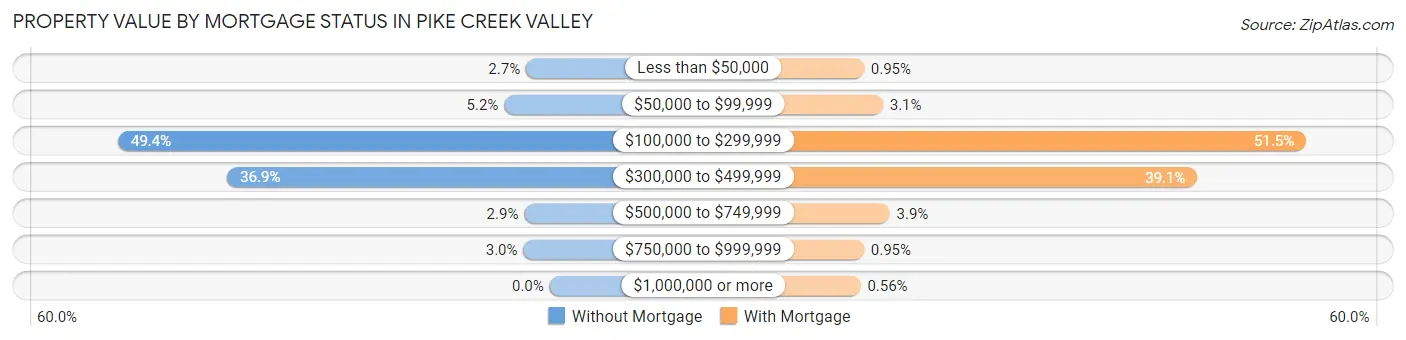
| Property Value | Without Mortgage | With Mortgage |
| Less than $50,000 | 27 (2.7%) | 22 (0.9%) |
| $50,000 to $99,999 | 52 (5.2%) | 72 (3.1%) |
| $100,000 to $299,999 | 494 (49.3%) | 1,192 (51.5%) |
| $300,000 to $499,999 | 369 (36.9%) | 904 (39.1%) |
| $500,000 to $749,999 | 29 (2.9%) | 90 (3.9%) |
| $750,000 to $999,999 | 30 (3.0%) | 22 (0.9%) |
| $1,000,000 or more | 0 (0.0%) | 13 (0.6%) |
| Total | 1,001 (100.0%) | 2,315 (100.0%) |
Household Income by Mortgage Status in Pike Creek Valley
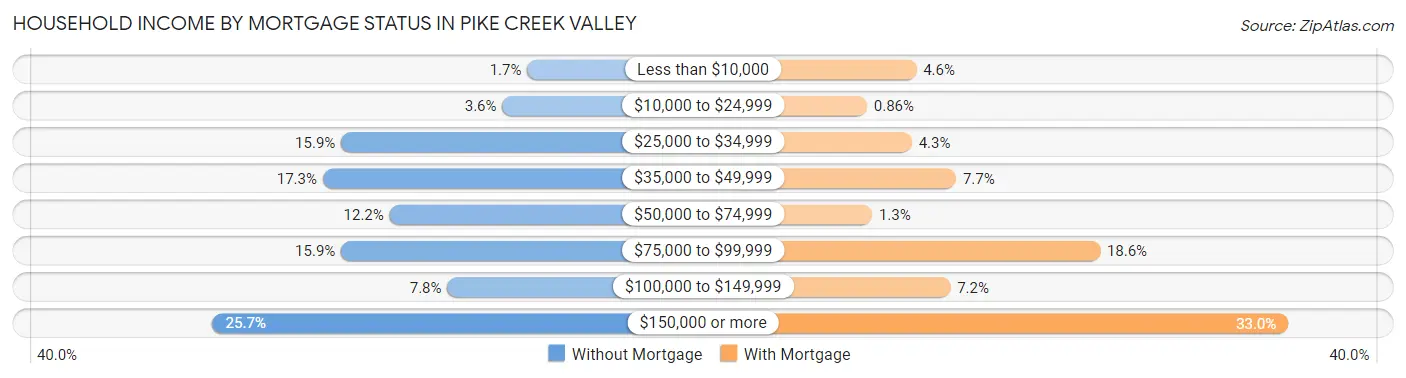
| Household Income | Without Mortgage | With Mortgage |
| Less than $10,000 | 17 (1.7%) | 107 (4.6%) |
| $10,000 to $24,999 | 36 (3.6%) | 20 (0.9%) |
| $25,000 to $34,999 | 159 (15.9%) | 99 (4.3%) |
| $35,000 to $49,999 | 173 (17.3%) | 177 (7.6%) |
| $50,000 to $74,999 | 122 (12.2%) | 29 (1.3%) |
| $75,000 to $99,999 | 159 (15.9%) | 431 (18.6%) |
| $100,000 to $149,999 | 78 (7.8%) | 167 (7.2%) |
| $150,000 or more | 257 (25.7%) | 763 (33.0%) |
| Total | 1,001 (100.0%) | 2,315 (100.0%) |
Property Value to Household Income Ratio in Pike Creek Valley
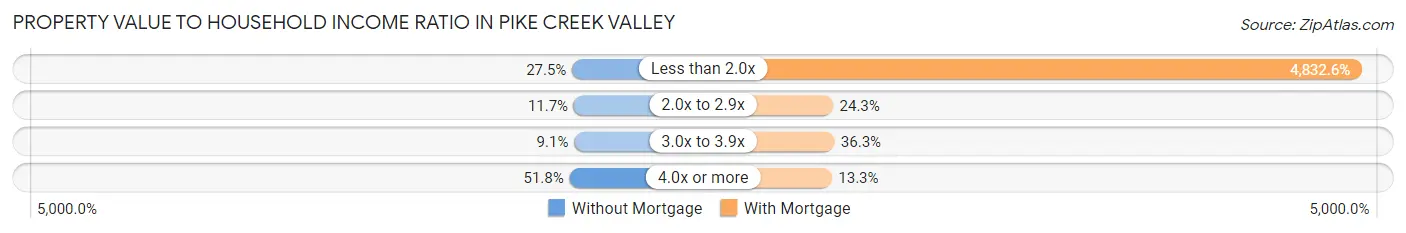
| Value-to-Income Ratio | Without Mortgage | With Mortgage |
| Less than 2.0x | 275 (27.5%) | 111,875 (4,832.6%) |
| 2.0x to 2.9x | 117 (11.7%) | 563 (24.3%) |
| 3.0x to 3.9x | 91 (9.1%) | 841 (36.3%) |
| 4.0x or more | 518 (51.7%) | 308 (13.3%) |
| Total | 1,001 (100.0%) | 2,315 (100.0%) |
Real Estate Taxes by Mortgage Status in Pike Creek Valley

| Property Taxes | Without Mortgage | With Mortgage |
| Less than $800 | 49 (4.9%) | 20 (0.9%) |
| $800 to $1,499 | 106 (10.6%) | 135 (5.8%) |
| $800 to $1,499 | 823 (82.2%) | 184 (8.0%) |
| Total | 1,001 (100.0%) | 2,315 (100.0%) |
Health & Disability in Pike Creek Valley
Health Insurance Coverage by Age in Pike Creek Valley
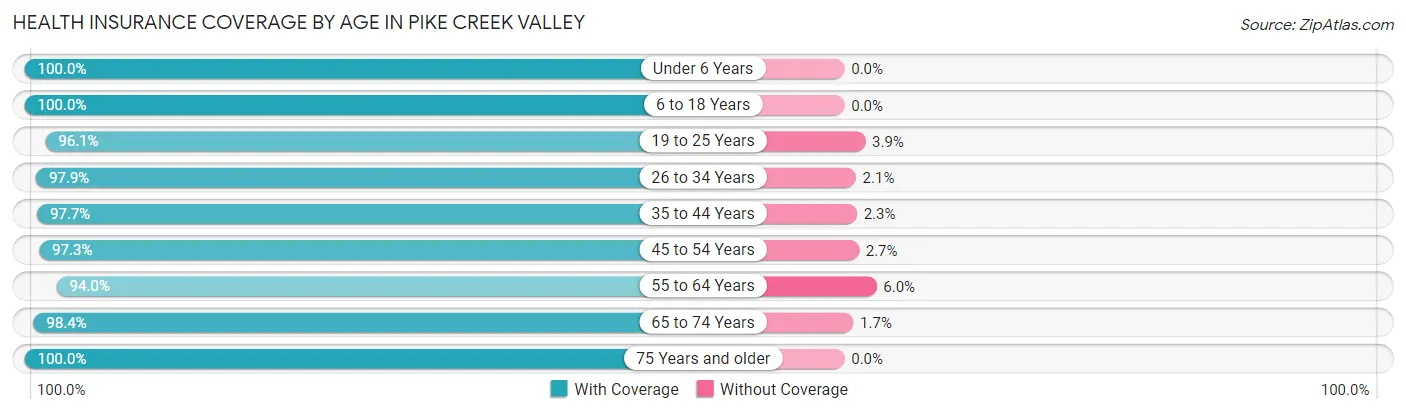
| Age Bracket | With Coverage | Without Coverage |
| Under 6 Years | 775 (100.0%) | 0 (0.0%) |
| 6 to 18 Years | 1,599 (100.0%) | 0 (0.0%) |
| 19 to 25 Years | 594 (96.1%) | 24 (3.9%) |
| 26 to 34 Years | 2,030 (97.9%) | 44 (2.1%) |
| 35 to 44 Years | 1,734 (97.7%) | 41 (2.3%) |
| 45 to 54 Years | 1,511 (97.3%) | 42 (2.7%) |
| 55 to 64 Years | 1,289 (94.0%) | 82 (6.0%) |
| 65 to 74 Years | 1,012 (98.4%) | 17 (1.7%) |
| 75 Years and older | 570 (100.0%) | 0 (0.0%) |
| Total | 11,114 (97.8%) | 250 (2.2%) |
Health Insurance Coverage by Citizenship Status in Pike Creek Valley

| Citizenship Status | With Coverage | Without Coverage |
| Native Born | 775 (100.0%) | 0 (0.0%) |
| Foreign Born, Citizen | 1,599 (100.0%) | 0 (0.0%) |
| Foreign Born, not a Citizen | 594 (96.1%) | 24 (3.9%) |
Health Insurance Coverage by Household Income in Pike Creek Valley
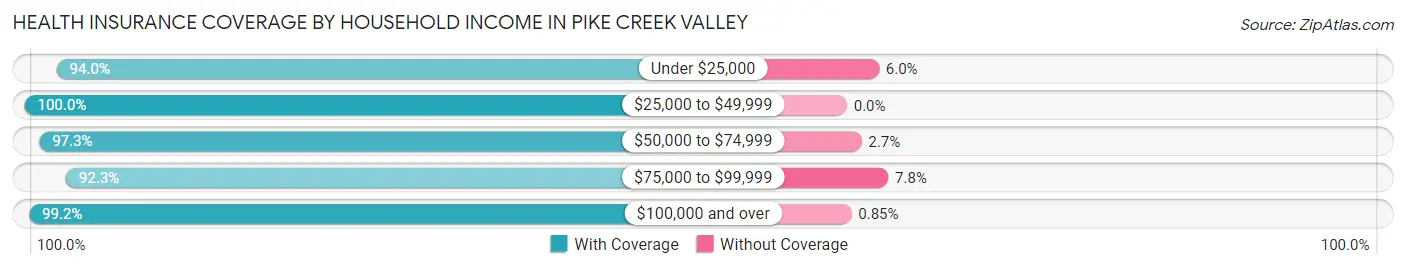
| Household Income | With Coverage | Without Coverage |
| Under $25,000 | 719 (94.0%) | 46 (6.0%) |
| $25,000 to $49,999 | 1,398 (100.0%) | 0 (0.0%) |
| $50,000 to $74,999 | 1,634 (97.3%) | 46 (2.7%) |
| $75,000 to $99,999 | 1,273 (92.2%) | 107 (7.7%) |
| $100,000 and over | 5,860 (99.2%) | 50 (0.9%) |
Public vs Private Health Insurance Coverage by Age in Pike Creek Valley
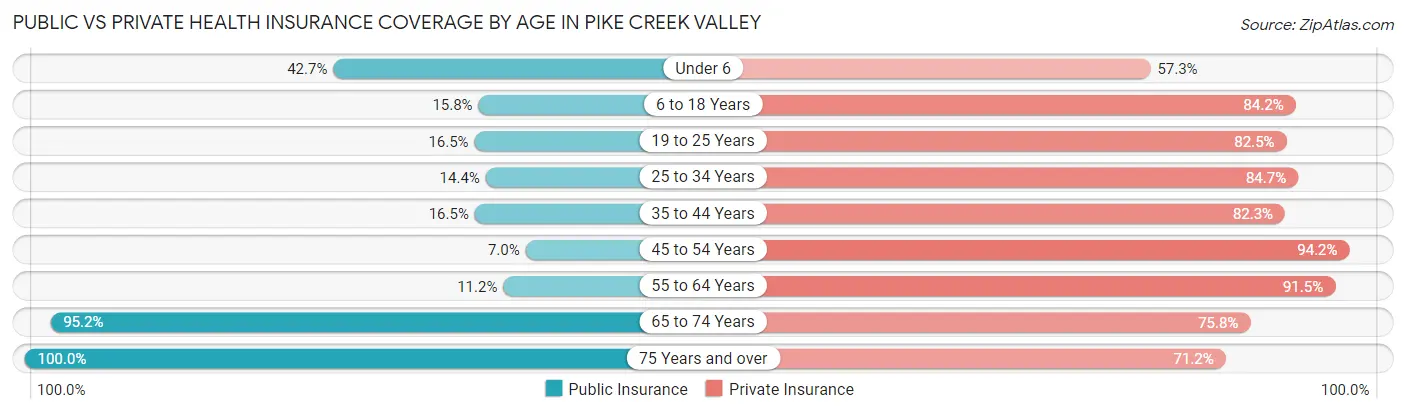
| Age Bracket | Public Insurance | Private Insurance |
| Under 6 | 331 (42.7%) | 444 (57.3%) |
| 6 to 18 Years | 252 (15.8%) | 1,347 (84.2%) |
| 19 to 25 Years | 102 (16.5%) | 510 (82.5%) |
| 25 to 34 Years | 299 (14.4%) | 1,756 (84.7%) |
| 35 to 44 Years | 292 (16.5%) | 1,460 (82.3%) |
| 45 to 54 Years | 109 (7.0%) | 1,463 (94.2%) |
| 55 to 64 Years | 153 (11.2%) | 1,255 (91.5%) |
| 65 to 74 Years | 980 (95.2%) | 780 (75.8%) |
| 75 Years and over | 570 (100.0%) | 406 (71.2%) |
| Total | 3,088 (27.2%) | 9,421 (82.9%) |
Disability Status by Sex by Age in Pike Creek Valley
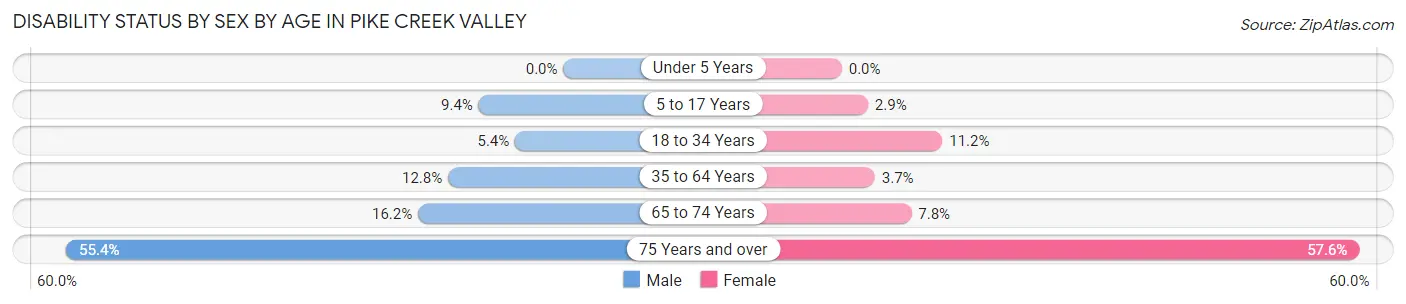
| Age Bracket | Male | Female |
| Under 5 Years | 0 (0.0%) | 0 (0.0%) |
| 5 to 17 Years | 88 (9.4%) | 20 (2.9%) |
| 18 to 34 Years | 63 (5.4%) | 181 (11.2%) |
| 35 to 64 Years | 303 (12.8%) | 86 (3.7%) |
| 65 to 74 Years | 83 (16.2%) | 40 (7.7%) |
| 75 Years and over | 134 (55.4%) | 189 (57.6%) |
Disability Class by Sex by Age in Pike Creek Valley
Disability Class: Hearing Difficulty
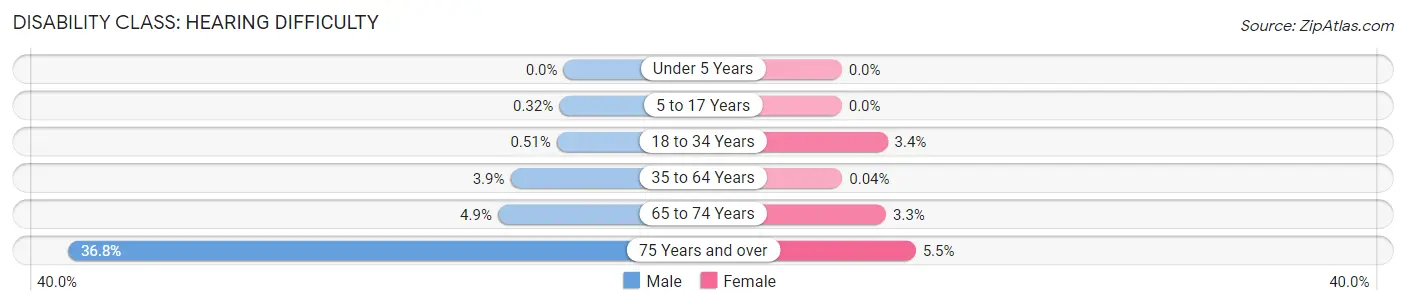
| Age Bracket | Male | Female |
| Under 5 Years | 0 (0.0%) | 0 (0.0%) |
| 5 to 17 Years | 3 (0.3%) | 0 (0.0%) |
| 18 to 34 Years | 6 (0.5%) | 55 (3.4%) |
| 35 to 64 Years | 93 (3.9%) | 1 (0.0%) |
| 65 to 74 Years | 25 (4.9%) | 17 (3.3%) |
| 75 Years and over | 89 (36.8%) | 18 (5.5%) |
Disability Class: Vision Difficulty
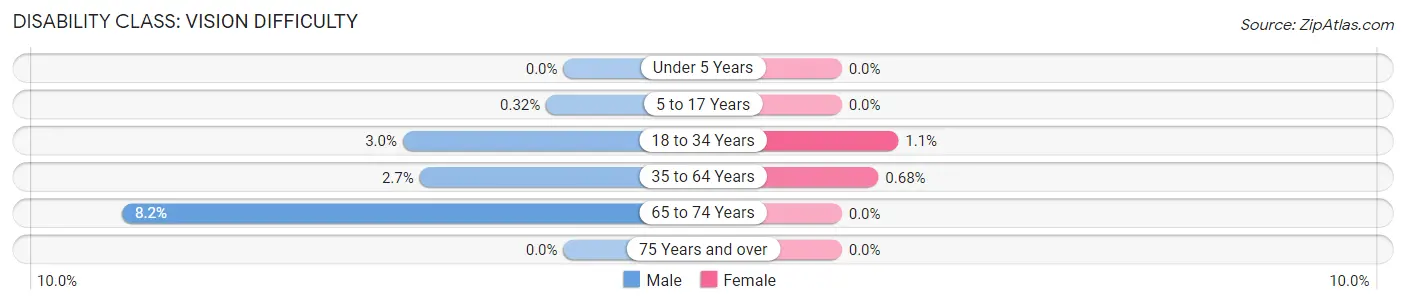
| Age Bracket | Male | Female |
| Under 5 Years | 0 (0.0%) | 0 (0.0%) |
| 5 to 17 Years | 3 (0.3%) | 0 (0.0%) |
| 18 to 34 Years | 35 (3.0%) | 17 (1.1%) |
| 35 to 64 Years | 63 (2.7%) | 16 (0.7%) |
| 65 to 74 Years | 42 (8.2%) | 0 (0.0%) |
| 75 Years and over | 0 (0.0%) | 0 (0.0%) |
Disability Class: Cognitive Difficulty
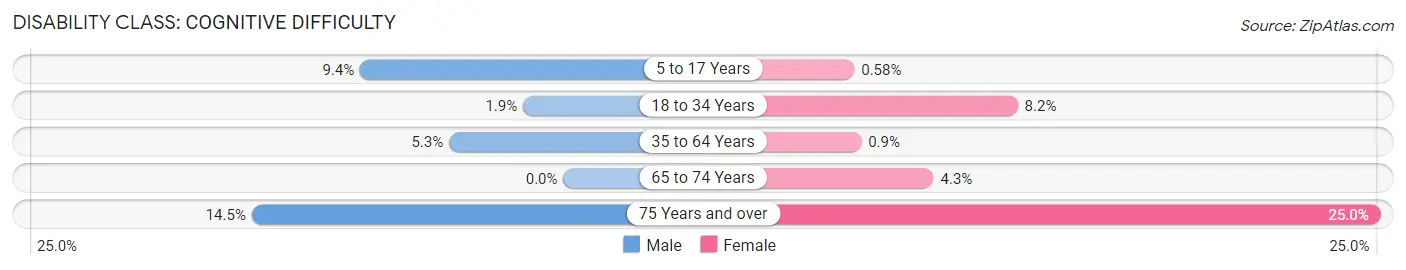
| Age Bracket | Male | Female |
| 5 to 17 Years | 88 (9.4%) | 4 (0.6%) |
| 18 to 34 Years | 22 (1.9%) | 132 (8.2%) |
| 35 to 64 Years | 125 (5.3%) | 21 (0.9%) |
| 65 to 74 Years | 0 (0.0%) | 22 (4.3%) |
| 75 Years and over | 35 (14.5%) | 82 (25.0%) |
Disability Class: Ambulatory Difficulty
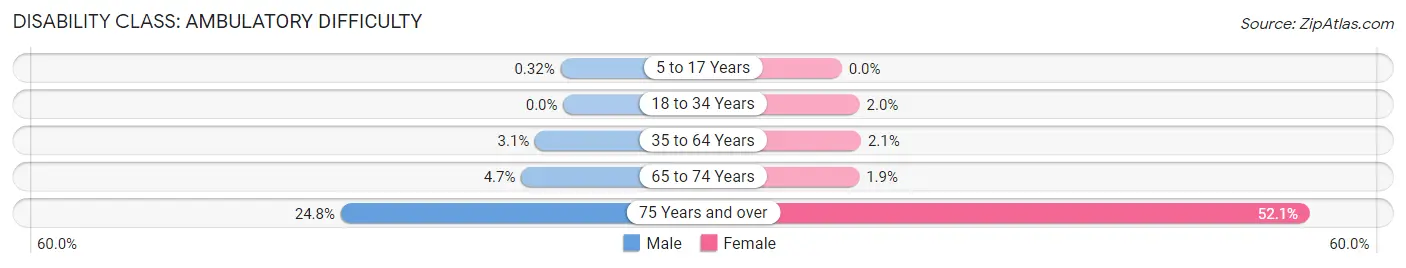
| Age Bracket | Male | Female |
| 5 to 17 Years | 3 (0.3%) | 0 (0.0%) |
| 18 to 34 Years | 0 (0.0%) | 32 (2.0%) |
| 35 to 64 Years | 74 (3.1%) | 50 (2.1%) |
| 65 to 74 Years | 24 (4.7%) | 10 (1.9%) |
| 75 Years and over | 60 (24.8%) | 171 (52.1%) |
Disability Class: Self-Care Difficulty
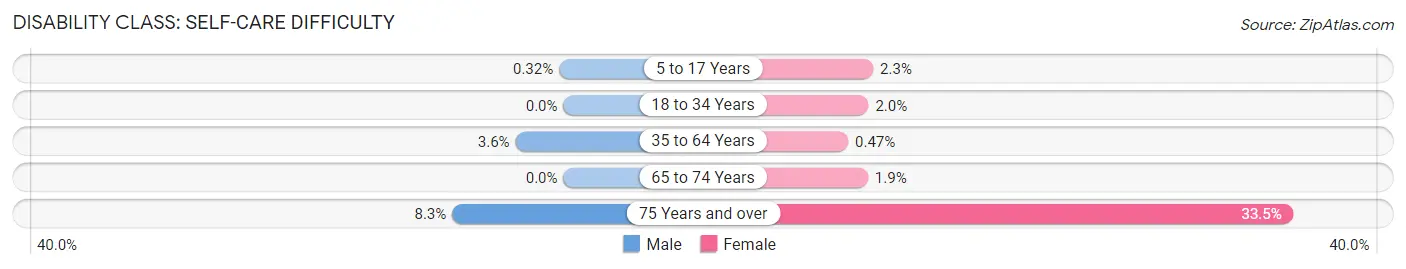
| Age Bracket | Male | Female |
| 5 to 17 Years | 3 (0.3%) | 16 (2.3%) |
| 18 to 34 Years | 0 (0.0%) | 32 (2.0%) |
| 35 to 64 Years | 84 (3.6%) | 11 (0.5%) |
| 65 to 74 Years | 0 (0.0%) | 10 (1.9%) |
| 75 Years and over | 20 (8.3%) | 110 (33.5%) |
Technology Access in Pike Creek Valley
Computing Device Access in Pike Creek Valley
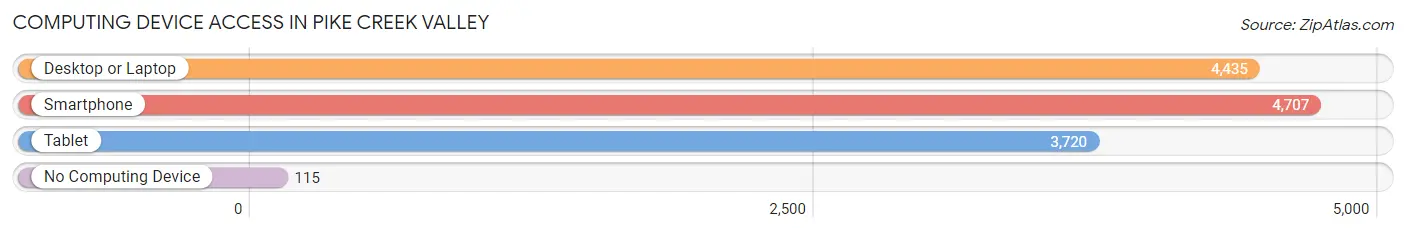
| Device Type | # Households | % Households |
| Desktop or Laptop | 4,435 | 85.8% |
| Smartphone | 4,707 | 91.1% |
| Tablet | 3,720 | 72.0% |
| No Computing Device | 115 | 2.2% |
| Total | 5,168 | 100.0% |
Internet Access in Pike Creek Valley
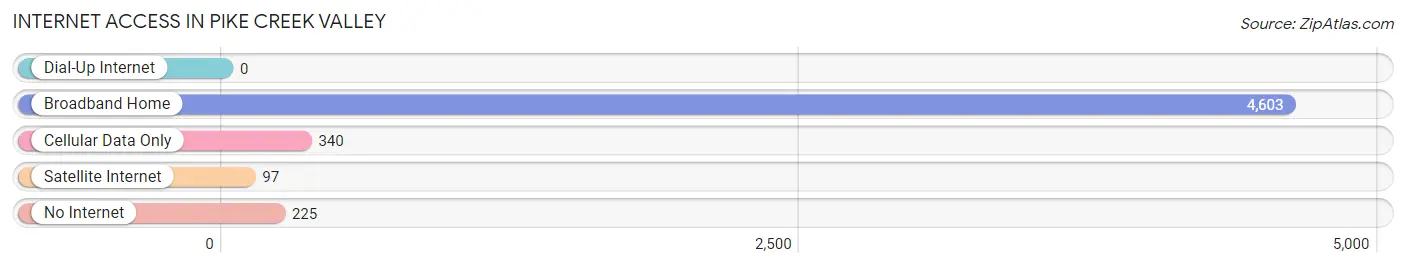
| Internet Type | # Households | % Households |
| Dial-Up Internet | 0 | 0.0% |
| Broadband Home | 4,603 | 89.1% |
| Cellular Data Only | 340 | 6.6% |
| Satellite Internet | 97 | 1.9% |
| No Internet | 225 | 4.3% |
| Total | 5,168 | 100.0% |
Pike Creek Valley Summary
Pike Creek Valley is a small, rural community located in New Castle County, Delaware. It is situated in the northern part of the state, just south of the Pennsylvania border. The valley is bordered by the White Clay Creek to the east and the Red Clay Creek to the west. The area is known for its rolling hills, lush forests, and picturesque views of the surrounding countryside.
Geography
Pike Creek Valley is located in the northern part of New Castle County, Delaware. It is bordered by the White Clay Creek to the east and the Red Clay Creek to the west. The valley is situated in the Piedmont region of the state, which is characterized by rolling hills and lush forests. The area is known for its picturesque views of the surrounding countryside. The valley is home to several small towns, including Hockessin, Pike Creek, and Greenville.
The climate in Pike Creek Valley is typical of the mid-Atlantic region, with hot, humid summers and cold, wet winters. The average annual temperature is around 55 degrees Fahrenheit. The area receives an average of 40 inches of precipitation per year, with most of it falling in the form of rain.
Economy
The economy of Pike Creek Valley is largely based on agriculture and tourism. The area is home to several small farms, which produce a variety of crops, including corn, soybeans, and hay. The valley is also home to several wineries, which produce a variety of wines.
Tourism is an important part of the local economy. The area is home to several popular attractions, including the Delaware Museum of Natural History, the Hagley Museum and Library, and the Winterthur Museum and Gardens. The area is also home to several state parks, including White Clay Creek State Park and Red Clay Creek State Park.
Demographics
As of the 2010 census, the population of Pike Creek Valley was 8,945. The population is largely white (90.3%), with small percentages of African American (4.2%), Asian (2.2%), and Hispanic (2.2%) residents. The median household income in the area is $76,945, and the median home value is $310,000.
The area is home to several small towns, including Hockessin, Pike Creek, and Greenville. The towns are largely residential, with a few small businesses and restaurants. The area is served by the Red Clay Consolidated School District, which includes several elementary, middle, and high schools.
Conclusion
Pike Creek Valley is a small, rural community located in New Castle County, Delaware. It is situated in the northern part of the state, just south of the Pennsylvania border. The valley is bordered by the White Clay Creek to the east and the Red Clay Creek to the west. The area is known for its rolling hills, lush forests, and picturesque views of the surrounding countryside. The economy of the area is largely based on agriculture and tourism, and the population is largely white. The area is home to several small towns, including Hockessin, Pike Creek, and Greenville. The area is served by the Red Clay Consolidated School District, which includes several elementary, middle, and high schools.
Common Questions
What is Per Capita Income in Pike Creek Valley?
Per Capita income in Pike Creek Valley is $48,651.
What is the Median Family Income in Pike Creek Valley?
Median Family Income in Pike Creek Valley is $114,148.
What is the Median Household income in Pike Creek Valley?
Median Household Income in Pike Creek Valley is $86,953.
What is Income or Wage Gap in Pike Creek Valley?
Income or Wage Gap in Pike Creek Valley is 28.8%.
Women in Pike Creek Valley earn 71.2 cents for every dollar earned by a man.
What is Inequality or Gini Index in Pike Creek Valley?
Inequality or Gini Index in Pike Creek Valley is 0.43.
What is the Total Population of Pike Creek Valley?
Total Population of Pike Creek Valley is 11,452.
What is the Total Male Population of Pike Creek Valley?
Total Male Population of Pike Creek Valley is 5,691.
What is the Total Female Population of Pike Creek Valley?
Total Female Population of Pike Creek Valley is 5,761.
What is the Ratio of Males per 100 Females in Pike Creek Valley?
There are 98.78 Males per 100 Females in Pike Creek Valley.
What is the Ratio of Females per 100 Males in Pike Creek Valley?
There are 101.23 Females per 100 Males in Pike Creek Valley.
What is the Median Population Age in Pike Creek Valley?
Median Population Age in Pike Creek Valley is 37.8 Years.
What is the Average Family Size in Pike Creek Valley
Average Family Size in Pike Creek Valley is 2.8 People.
What is the Average Household Size in Pike Creek Valley
Average Household Size in Pike Creek Valley is 2.1 People.
How Large is the Labor Force in Pike Creek Valley?
There are 6,812 People in the Labor Forcein in Pike Creek Valley.
What is the Percentage of People in the Labor Force in Pike Creek Valley?
72.2% of People are in the Labor Force in Pike Creek Valley.
What is the Unemployment Rate in Pike Creek Valley?
Unemployment Rate in Pike Creek Valley is 4.1%.