Prien, LA Map & Demographics
Prien Map
Prien Overview
$42,591
PER CAPITA INCOME
$102,436
AVG FAMILY INCOME
$93,011
AVG HOUSEHOLD INCOME
42.7%
WAGE / INCOME GAP [ % ]
57.3¢/ $1
WAGE / INCOME GAP [ $ ]
0.40
INEQUALITY / GINI INDEX
8,326
TOTAL POPULATION
4,004
MALE POPULATION
4,322
FEMALE POPULATION
92.64
MALES / 100 FEMALES
107.94
FEMALES / 100 MALES
37.0
MEDIAN AGE
3.3
AVG FAMILY SIZE
2.8
AVG HOUSEHOLD SIZE
4,222
LABOR FORCE [ PEOPLE ]
71.2%
PERCENT IN LABOR FORCE
6.5%
UNEMPLOYMENT RATE
Income in Prien
Income Overview in Prien
Per Capita Income in Prien is $42,591, while median incomes of families and households are $102,436 and $93,011 respectively.
| Characteristic | Number | Measure |
| Per Capita Income | 8,326 | $42,591 |
| Median Family Income | 2,184 | $102,436 |
| Mean Family Income | 2,184 | $137,428 |
| Median Household Income | 2,957 | $93,011 |
| Mean Household Income | 2,957 | $121,812 |
| Income Deficit | 2,184 | $0 |
| Wage / Income Gap (%) | 8,326 | 42.65% |
| Wage / Income Gap ($) | 8,326 | 57.35¢ per $1 |
| Gini / Inequality Index | 8,326 | 0.40 |
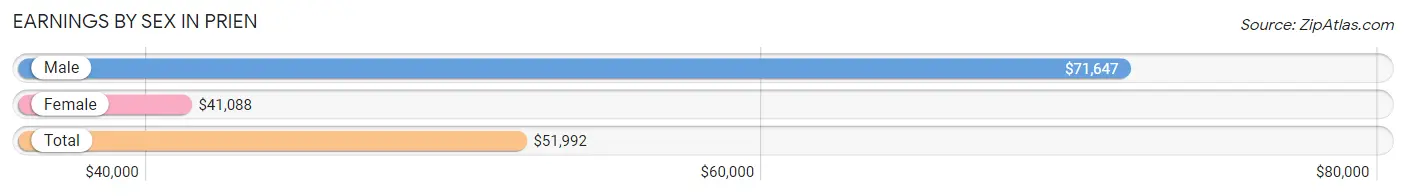
Earnings by Sex in Prien
Average Earnings in Prien are $51,992, $71,647 for men and $41,088 for women, a difference of 42.6%.
| Sex | Number | Average Earnings |
| Male | 2,026 (48.1%) | $71,647 |
| Female | 2,189 (51.9%) | $41,088 |
| Total | 4,215 (100.0%) | $51,992 |
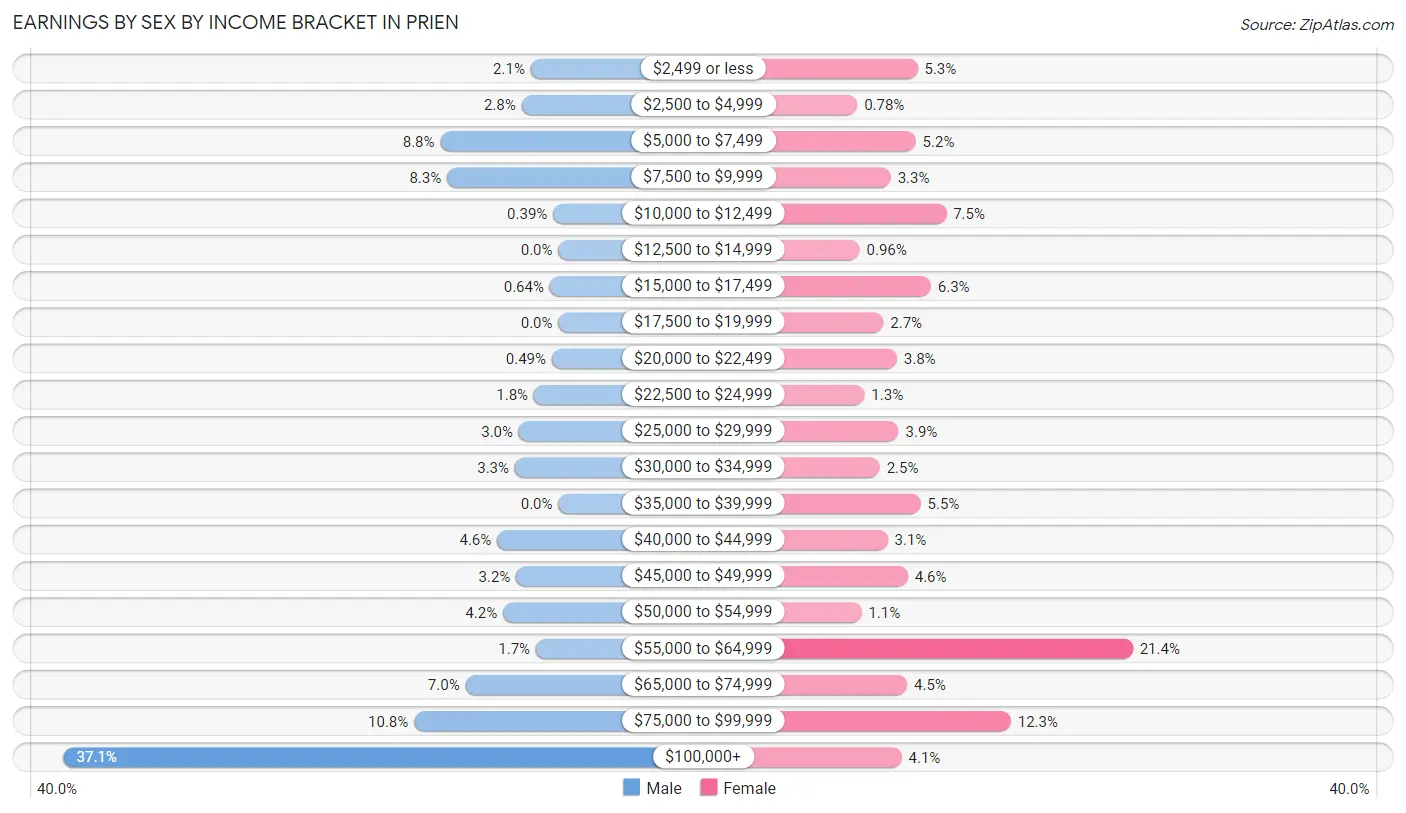
Earnings by Sex by Income Bracket in Prien
The most common earnings brackets in Prien are $100,000+ for men (751 | 37.1%) and $55,000 to $64,999 for women (469 | 21.4%).
| Income | Male | Female |
| $2,499 or less | 42 (2.1%) | 116 (5.3%) |
| $2,500 to $4,999 | 56 (2.8%) | 17 (0.8%) |
| $5,000 to $7,499 | 179 (8.8%) | 113 (5.2%) |
| $7,500 to $9,999 | 169 (8.3%) | 72 (3.3%) |
| $10,000 to $12,499 | 8 (0.4%) | 163 (7.4%) |
| $12,500 to $14,999 | 0 (0.0%) | 21 (1.0%) |
| $15,000 to $17,499 | 13 (0.6%) | 138 (6.3%) |
| $17,500 to $19,999 | 0 (0.0%) | 60 (2.7%) |
| $20,000 to $22,499 | 10 (0.5%) | 82 (3.7%) |
| $22,500 to $24,999 | 37 (1.8%) | 29 (1.3%) |
| $25,000 to $29,999 | 60 (3.0%) | 85 (3.9%) |
| $30,000 to $34,999 | 66 (3.3%) | 54 (2.5%) |
| $35,000 to $39,999 | 0 (0.0%) | 121 (5.5%) |
| $40,000 to $44,999 | 93 (4.6%) | 67 (3.1%) |
| $45,000 to $49,999 | 64 (3.2%) | 100 (4.6%) |
| $50,000 to $54,999 | 84 (4.2%) | 24 (1.1%) |
| $55,000 to $64,999 | 34 (1.7%) | 469 (21.4%) |
| $65,000 to $74,999 | 141 (7.0%) | 99 (4.5%) |
| $75,000 to $99,999 | 219 (10.8%) | 269 (12.3%) |
| $100,000+ | 751 (37.1%) | 90 (4.1%) |
| Total | 2,026 (100.0%) | 2,189 (100.0%) |
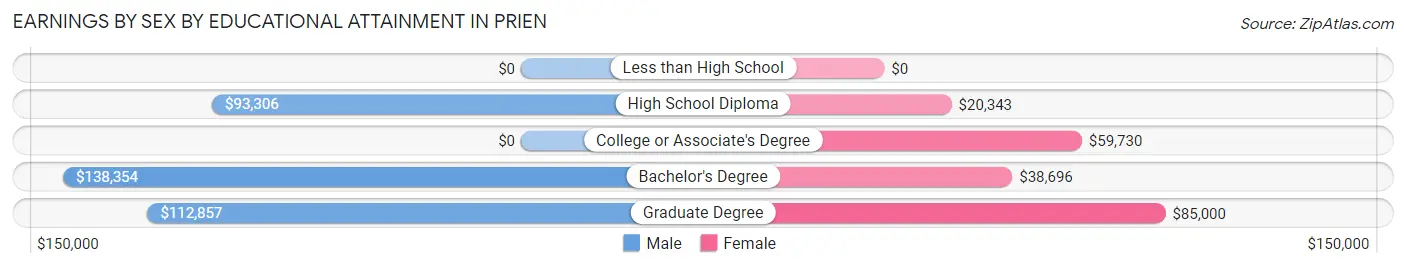
Earnings by Sex by Educational Attainment in Prien
Average earnings in Prien are $92,599 for men and $47,355 for women, a difference of 48.9%. Men with an educational attainment of bachelor's degree enjoy the highest average annual earnings of $138,354, while those with high school diploma education earn the least with $93,306. Women with an educational attainment of graduate degree earn the most with the average annual earnings of $85,000, while those with high school diploma education have the smallest earnings of $20,343.
| Educational Attainment | Male Income | Female Income |
| Less than High School | - | - |
| High School Diploma | $93,306 | $20,343 |
| College or Associate's Degree | - | - |
| Bachelor's Degree | $138,354 | $38,696 |
| Graduate Degree | $112,857 | $85,000 |
| Total | $92,599 | $47,355 |
Family Income in Prien
Family Income Brackets in Prien
According to the Prien family income data, there are 533 families falling into the $150,000 to $199,999 income range, which is the most common income bracket and makes up 24.4% of all families. Conversely, the $10,000 to $14,999 income bracket is the least frequent group with only 22 families (1.0%) belonging to this category.
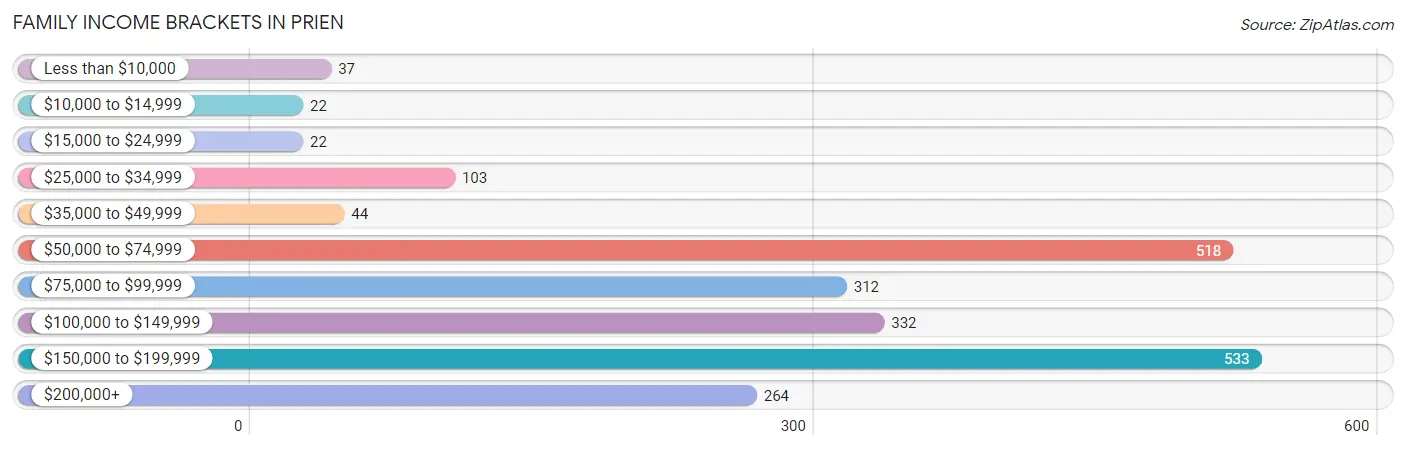
| Income Bracket | # Families | % Families |
| Less than $10,000 | 37 | 1.7% |
| $10,000 to $14,999 | 22 | 1.0% |
| $15,000 to $24,999 | 22 | 1.0% |
| $25,000 to $34,999 | 103 | 4.7% |
| $35,000 to $49,999 | 44 | 2.0% |
| $50,000 to $74,999 | 518 | 23.7% |
| $75,000 to $99,999 | 312 | 14.3% |
| $100,000 to $149,999 | 332 | 15.2% |
| $150,000 to $199,999 | 533 | 24.4% |
| $200,000+ | 264 | 12.1% |
Family Income by Famaliy Size in Prien
4-person families (418 | 19.1%) account for the highest median family income in Prien with $195,201 per family, while 2-person families (1,205 | 55.2%) have the highest median income of $49,058 per family member.
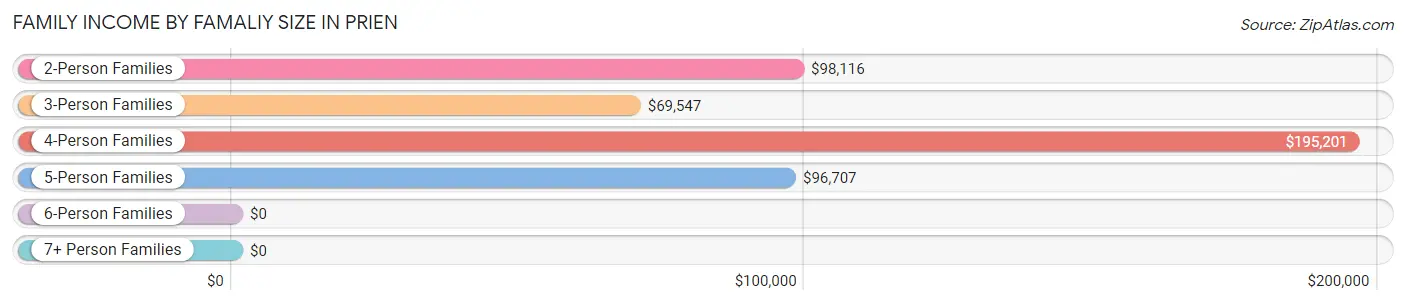
| Income Bracket | # Families | Median Income |
| 2-Person Families | 1,205 (55.2%) | $98,116 |
| 3-Person Families | 209 (9.6%) | $69,547 |
| 4-Person Families | 418 (19.1%) | $195,201 |
| 5-Person Families | 190 (8.7%) | $96,707 |
| 6-Person Families | 117 (5.4%) | $0 |
| 7+ Person Families | 45 (2.1%) | $0 |
| Total | 2,184 (100.0%) | $102,436 |
Family Income by Number of Earners in Prien
The median family income in Prien is $102,436, with families comprising 2 earners (993) having the highest median family income of $159,801, while families with no earners (218) have the lowest median family income of $60,556, accounting for 45.5% and 10.0% of families, respectively.
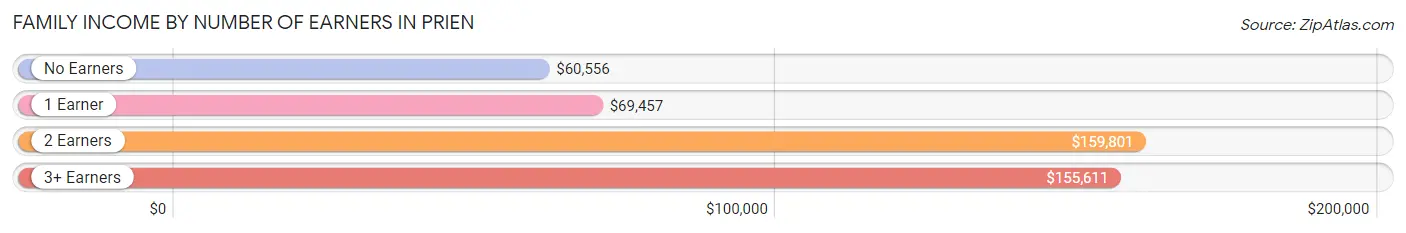
| Number of Earners | # Families | Median Income |
| No Earners | 218 (10.0%) | $60,556 |
| 1 Earner | 801 (36.7%) | $69,457 |
| 2 Earners | 993 (45.5%) | $159,801 |
| 3+ Earners | 172 (7.9%) | $155,611 |
| Total | 2,184 (100.0%) | $102,436 |
Household Income in Prien
Household Income Brackets in Prien
With 645 households falling in the category, the $75,000 to $99,999 income range is the most frequent in Prien, accounting for 21.8% of all households. In contrast, only 53 households (1.8%) fall into the $10,000 to $14,999 income bracket, making it the least populous group.
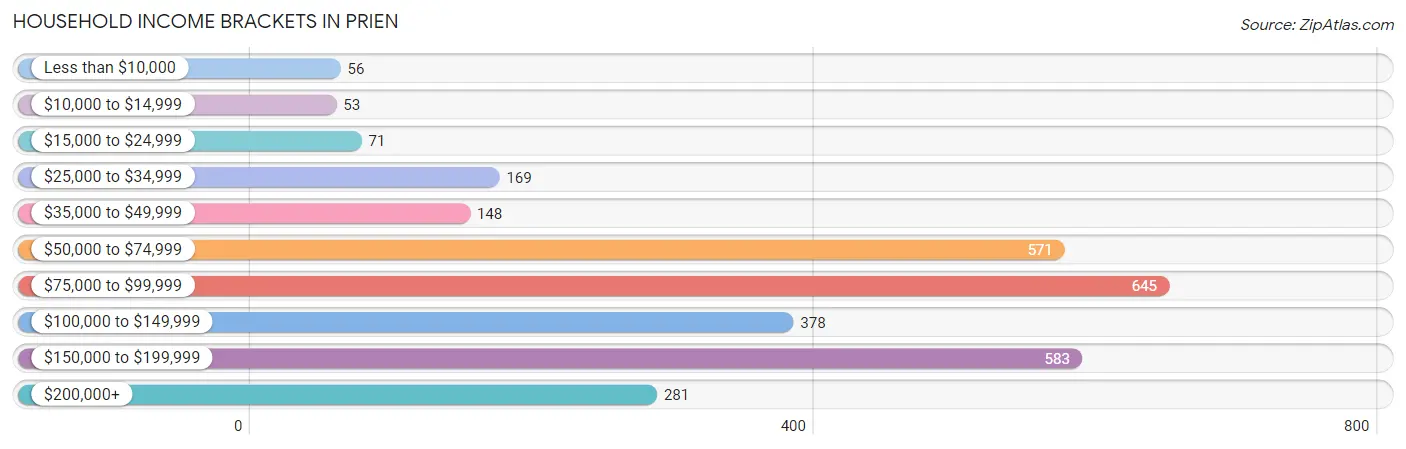
| Income Bracket | # Households | % Households |
| Less than $10,000 | 56 | 1.9% |
| $10,000 to $14,999 | 53 | 1.8% |
| $15,000 to $24,999 | 71 | 2.4% |
| $25,000 to $34,999 | 169 | 5.7% |
| $35,000 to $49,999 | 148 | 5.0% |
| $50,000 to $74,999 | 571 | 19.3% |
| $75,000 to $99,999 | 645 | 21.8% |
| $100,000 to $149,999 | 378 | 12.8% |
| $150,000 to $199,999 | 583 | 19.7% |
| $200,000+ | 281 | 9.5% |
Household Income by Householder Age in Prien
The median household income in Prien is $93,011, with the highest median household income of $138,938 found in the 25 to 44 years age bracket for the primary householder. A total of 649 households (22.0%) fall into this category. Meanwhile, the 15 to 24 years age bracket for the primary householder has the lowest median household income of $58,725, with 106 households (3.6%) in this group.
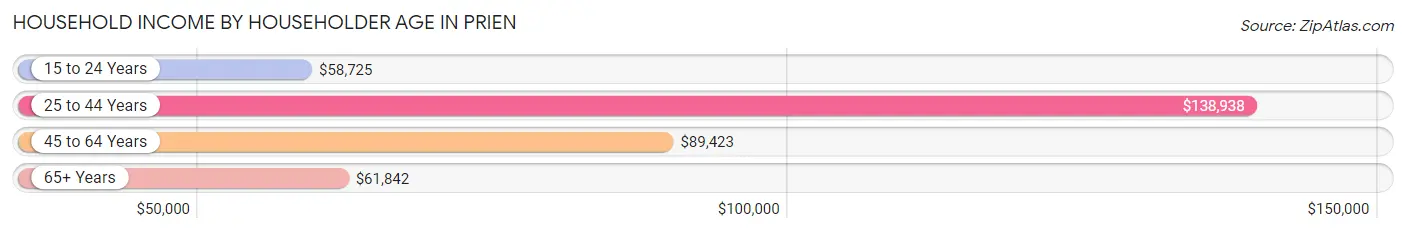
| Income Bracket | # Households | Median Income |
| 15 to 24 Years | 106 (3.6%) | $58,725 |
| 25 to 44 Years | 649 (22.0%) | $138,938 |
| 45 to 64 Years | 1,616 (54.6%) | $89,423 |
| 65+ Years | 586 (19.8%) | $61,842 |
| Total | 2,957 (100.0%) | $93,011 |
Poverty in Prien
Income Below Poverty by Sex and Age in Prien
With 6.1% poverty level for males and 3.5% for females among the residents of Prien, 25 to 34 year old males and 18 to 24 year old females are the most vulnerable to poverty, with 66 males (19.5%) and 65 females (20.8%) in their respective age groups living below the poverty level.
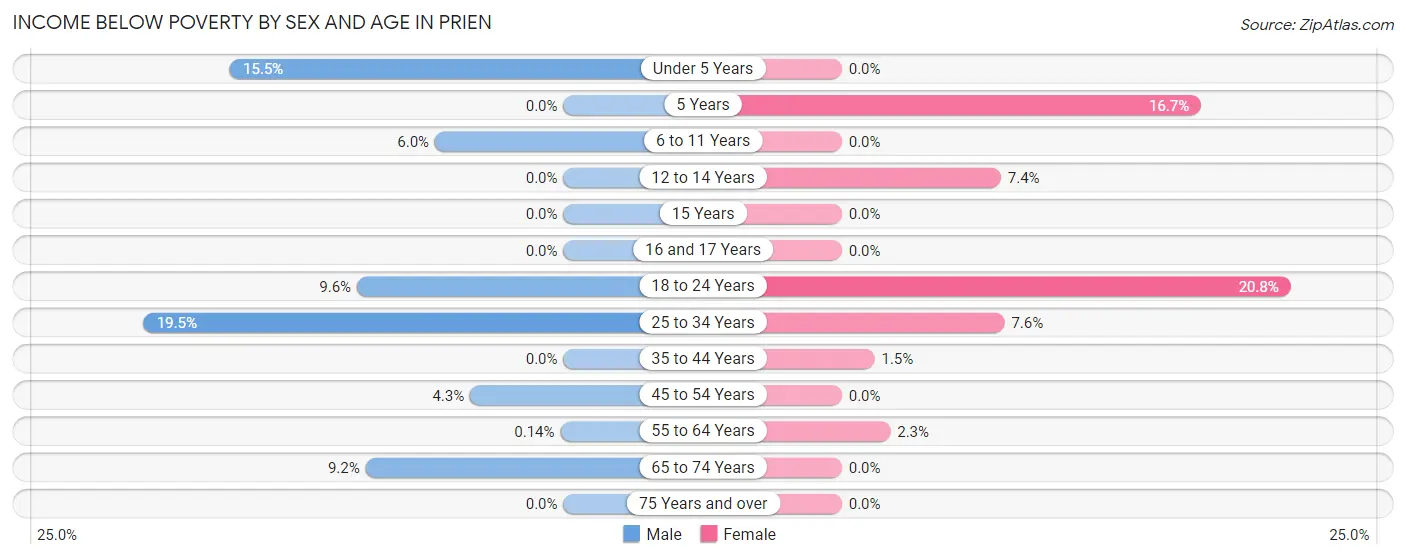
| Age Bracket | Male | Female |
| Under 5 Years | 73 (15.5%) | 0 (0.0%) |
| 5 Years | 0 (0.0%) | 17 (16.7%) |
| 6 to 11 Years | 30 (6.0%) | 0 (0.0%) |
| 12 to 14 Years | 0 (0.0%) | 18 (7.4%) |
| 15 Years | 0 (0.0%) | 0 (0.0%) |
| 16 and 17 Years | 0 (0.0%) | 0 (0.0%) |
| 18 to 24 Years | 25 (9.6%) | 65 (20.8%) |
| 25 to 34 Years | 66 (19.5%) | 21 (7.5%) |
| 35 to 44 Years | 0 (0.0%) | 9 (1.5%) |
| 45 to 54 Years | 21 (4.3%) | 0 (0.0%) |
| 55 to 64 Years | 1 (0.1%) | 20 (2.2%) |
| 65 to 74 Years | 28 (9.2%) | 0 (0.0%) |
| 75 Years and over | 0 (0.0%) | 0 (0.0%) |
| Total | 244 (6.1%) | 150 (3.5%) |
Income Above Poverty by Sex and Age in Prien
According to the poverty statistics in Prien, males aged 5 years and females aged under 5 years are the age groups that are most secure financially, with 100.0% of males and 100.0% of females in these age groups living above the poverty line.
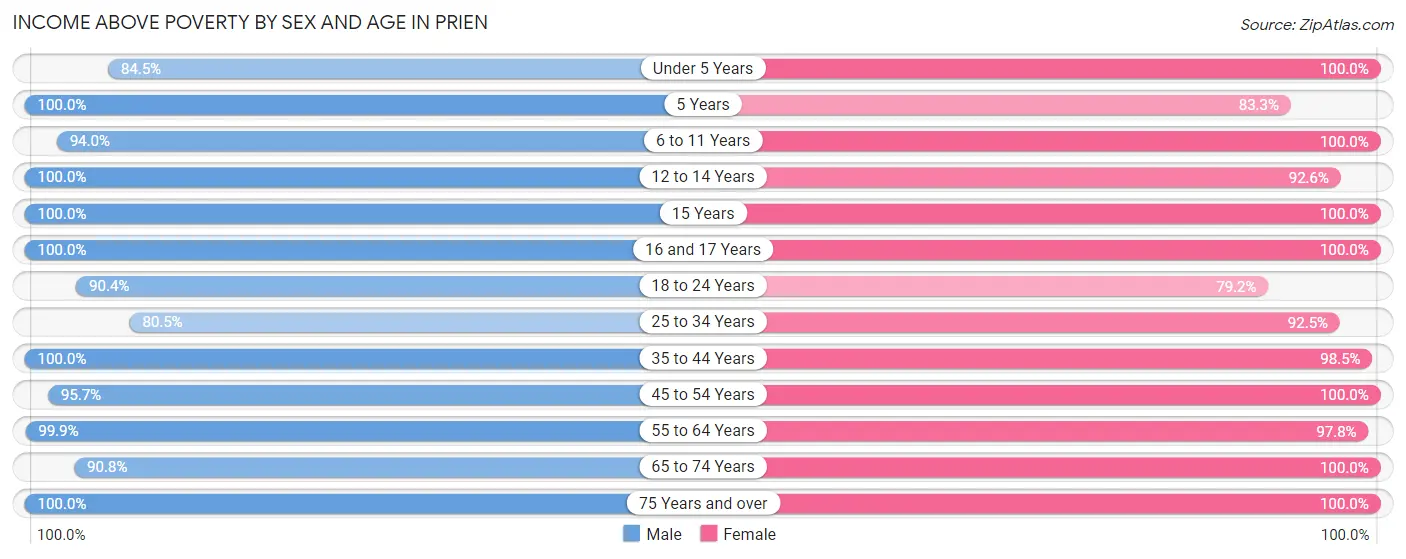
| Age Bracket | Male | Female |
| Under 5 Years | 399 (84.5%) | 422 (100.0%) |
| 5 Years | 121 (100.0%) | 85 (83.3%) |
| 6 to 11 Years | 473 (94.0%) | 327 (100.0%) |
| 12 to 14 Years | 50 (100.0%) | 226 (92.6%) |
| 15 Years | 86 (100.0%) | 51 (100.0%) |
| 16 and 17 Years | 121 (100.0%) | 111 (100.0%) |
| 18 to 24 Years | 236 (90.4%) | 247 (79.2%) |
| 25 to 34 Years | 273 (80.5%) | 257 (92.4%) |
| 35 to 44 Years | 449 (100.0%) | 585 (98.5%) |
| 45 to 54 Years | 464 (95.7%) | 441 (100.0%) |
| 55 to 64 Years | 739 (99.9%) | 869 (97.8%) |
| 65 to 74 Years | 277 (90.8%) | 296 (100.0%) |
| 75 Years and over | 72 (100.0%) | 237 (100.0%) |
| Total | 3,760 (93.9%) | 4,154 (96.5%) |
Income Below Poverty Among Married-Couple Families in Prien
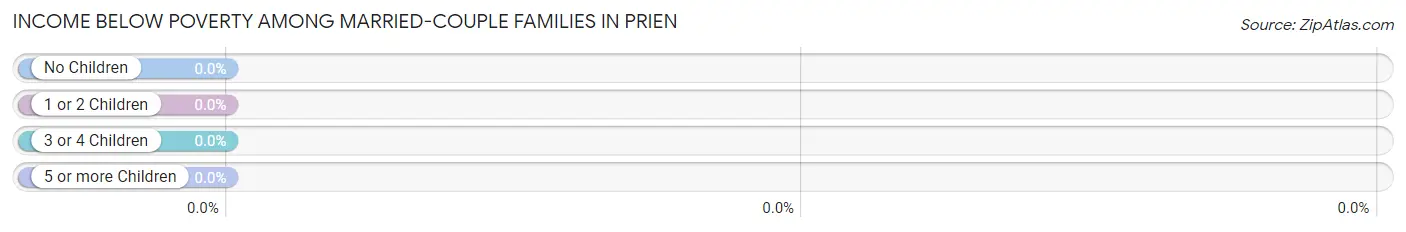
| Children | Above Poverty | Below Poverty |
| No Children | 1,091 (100.0%) | 0 (0.0%) |
| 1 or 2 Children | 453 (100.0%) | 0 (0.0%) |
| 3 or 4 Children | 224 (100.0%) | 0 (0.0%) |
| 5 or more Children | 45 (100.0%) | 0 (0.0%) |
| Total | 1,813 (100.0%) | 0 (0.0%) |
Income Below Poverty Among Single-Parent Households in Prien
According to the poverty data in Prien, 7.6% or 21 single-father households and 61.7% or 58 single-mother households are living below the poverty line. Among single-father households, those with 1 or 2 children have the highest poverty rate, with 21 households (13.2%) experiencing poverty. Likewise, among single-mother households, those with 3 or 4 children have the highest poverty rate, with 21 households (95.5%) falling below the poverty line.
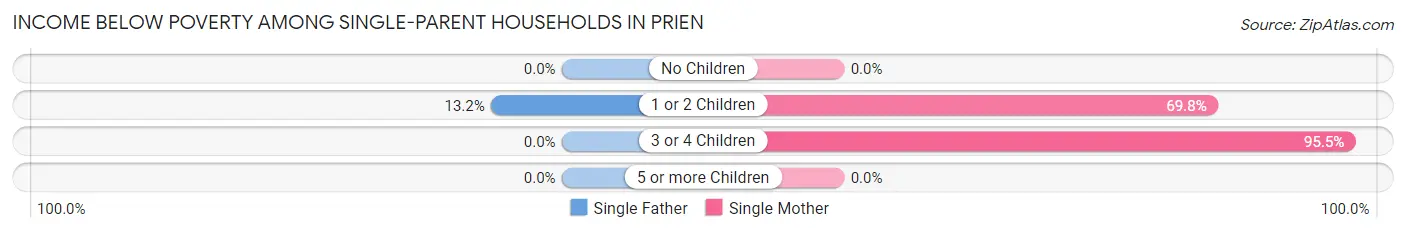
| Children | Single Father | Single Mother |
| No Children | 0 (0.0%) | 0 (0.0%) |
| 1 or 2 Children | 21 (13.2%) | 37 (69.8%) |
| 3 or 4 Children | 0 (0.0%) | 21 (95.5%) |
| 5 or more Children | 0 (0.0%) | 0 (0.0%) |
| Total | 21 (7.6%) | 58 (61.7%) |
Income Below Poverty Among Married-Couple vs Single-Parent Households in Prien
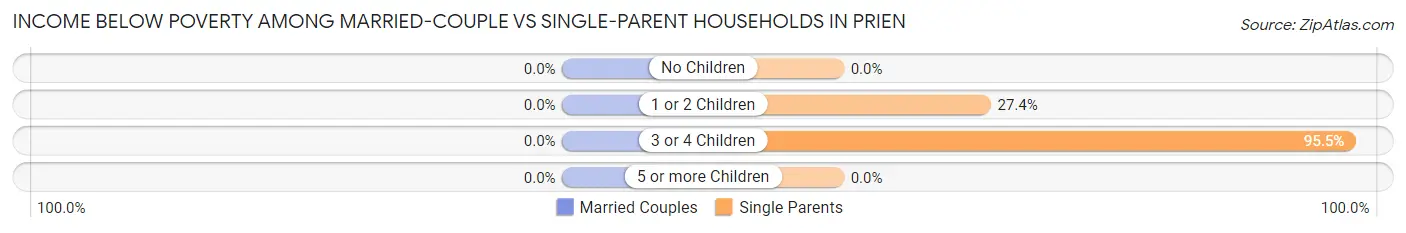
| Children | Married-Couple Families | Single-Parent Households |
| No Children | 0 (0.0%) | 0 (0.0%) |
| 1 or 2 Children | 0 (0.0%) | 58 (27.4%) |
| 3 or 4 Children | 0 (0.0%) | 21 (95.5%) |
| 5 or more Children | 0 (0.0%) | 0 (0.0%) |
| Total | 0 (0.0%) | 79 (21.3%) |
Race in Prien
The most populous races in Prien are White / Caucasian (7,123 | 85.6%), Black / African American (608 | 7.3%), and Two or more Races (445 | 5.3%).
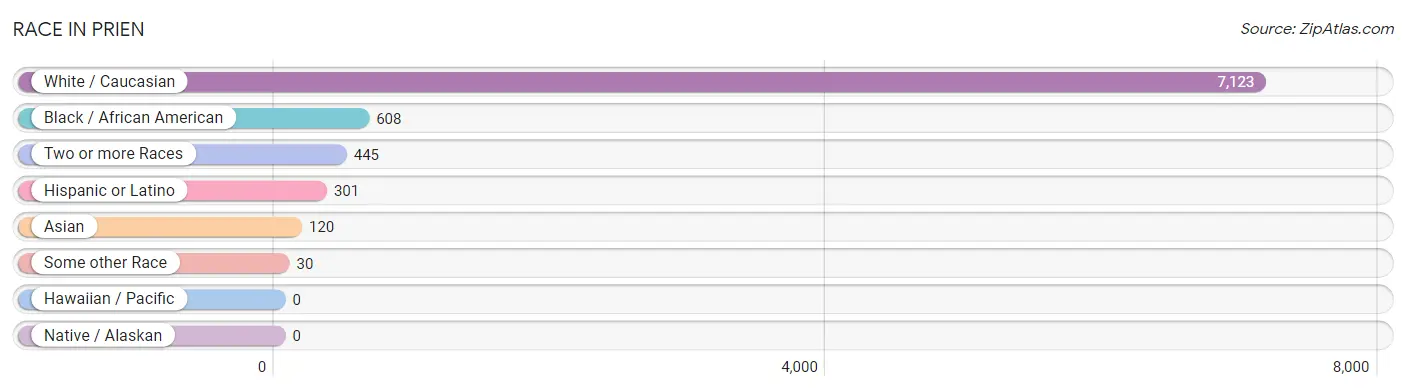
| Race | # Population | % Population |
| Asian | 120 | 1.4% |
| Black / African American | 608 | 7.3% |
| Hawaiian / Pacific | 0 | 0.0% |
| Hispanic or Latino | 301 | 3.6% |
| Native / Alaskan | 0 | 0.0% |
| White / Caucasian | 7,123 | 85.6% |
| Two or more Races | 445 | 5.3% |
| Some other Race | 30 | 0.4% |
| Total | 8,326 | 100.0% |
Ancestry in Prien
The most populous ancestries reported in Prien are French (1,229 | 14.8%), English (847 | 10.2%), American (767 | 9.2%), French Canadian (568 | 6.8%), and German (472 | 5.7%), together accounting for 46.6% of all Prien residents.
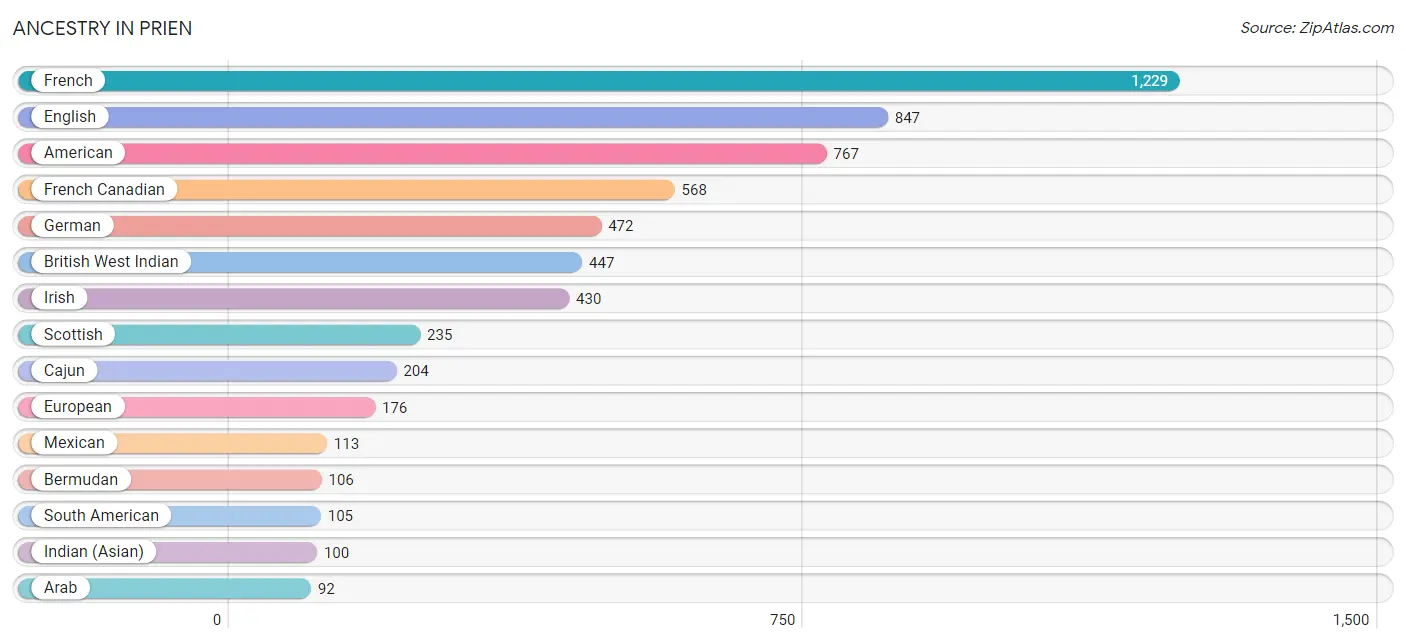
| Ancestry | # Population | % Population |
| American | 767 | 9.2% |
| Arab | 92 | 1.1% |
| Bermudan | 106 | 1.3% |
| British West Indian | 447 | 5.4% |
| Cajun | 204 | 2.5% |
| Central American | 52 | 0.6% |
| Czech | 36 | 0.4% |
| Dutch | 26 | 0.3% |
| English | 847 | 10.2% |
| European | 176 | 2.1% |
| French | 1,229 | 14.8% |
| French Canadian | 568 | 6.8% |
| German | 472 | 5.7% |
| Greek | 40 | 0.5% |
| Guyanese | 20 | 0.2% |
| Honduran | 2 | 0.0% |
| Indian (Asian) | 100 | 1.2% |
| Irish | 430 | 5.2% |
| Italian | 89 | 1.1% |
| Lebanese | 92 | 1.1% |
| Mexican | 113 | 1.4% |
| Nicaraguan | 8 | 0.1% |
| Pakistani | 20 | 0.2% |
| Panamanian | 42 | 0.5% |
| Polish | 71 | 0.9% |
| Russian | 28 | 0.3% |
| Scotch-Irish | 76 | 0.9% |
| Scottish | 235 | 2.8% |
| South American | 105 | 1.3% |
| Spanish | 1 | 0.0% |
| Swedish | 28 | 0.3% |
| Trinidadian and Tobagonian | 30 | 0.4% |
| Venezuelan | 44 | 0.5% | View All 33 Rows |
Immigrants in Prien
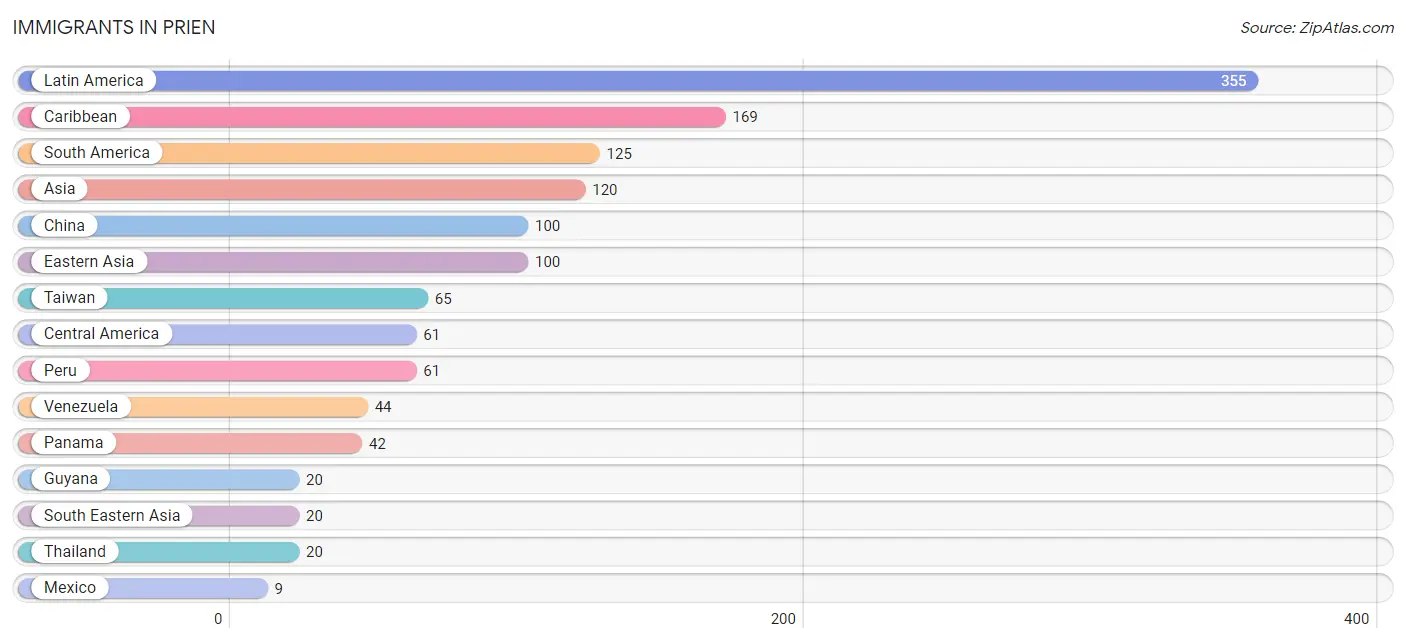
The most numerous immigrant groups reported in Prien came from Latin America (355 | 4.3%), Caribbean (169 | 2.0%), South America (125 | 1.5%), Asia (120 | 1.4%), and China (100 | 1.2%), together accounting for 10.4% of all Prien residents.
| Immigration Origin | # Population | % Population |
| Asia | 120 | 1.4% |
| Caribbean | 169 | 2.0% |
| Central America | 61 | 0.7% |
| China | 100 | 1.2% |
| Eastern Asia | 100 | 1.2% |
| Guyana | 20 | 0.2% |
| Honduras | 2 | 0.0% |
| Latin America | 355 | 4.3% |
| Mexico | 9 | 0.1% |
| Nicaragua | 8 | 0.1% |
| Panama | 42 | 0.5% |
| Peru | 61 | 0.7% |
| South America | 125 | 1.5% |
| South Eastern Asia | 20 | 0.2% |
| Taiwan | 65 | 0.8% |
| Thailand | 20 | 0.2% |
| Venezuela | 44 | 0.5% | View All 17 Rows |
Sex and Age in Prien
Sex and Age in Prien
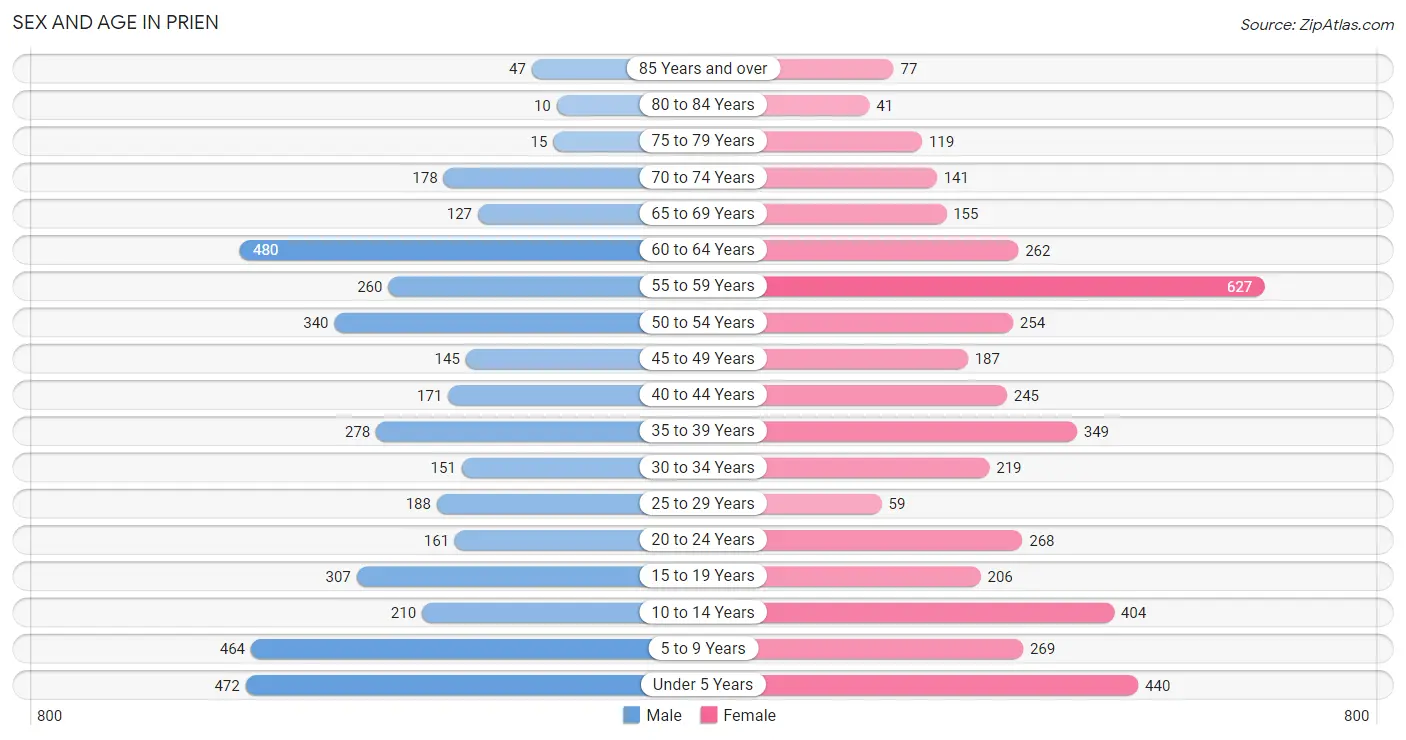
The most populous age groups in Prien are 60 to 64 Years (480 | 12.0%) for men and 55 to 59 Years (627 | 14.5%) for women.
| Age Bracket | Male | Female |
| Under 5 Years | 472 (11.8%) | 440 (10.2%) |
| 5 to 9 Years | 464 (11.6%) | 269 (6.2%) |
| 10 to 14 Years | 210 (5.2%) | 404 (9.3%) |
| 15 to 19 Years | 307 (7.7%) | 206 (4.8%) |
| 20 to 24 Years | 161 (4.0%) | 268 (6.2%) |
| 25 to 29 Years | 188 (4.7%) | 59 (1.4%) |
| 30 to 34 Years | 151 (3.8%) | 219 (5.1%) |
| 35 to 39 Years | 278 (6.9%) | 349 (8.1%) |
| 40 to 44 Years | 171 (4.3%) | 245 (5.7%) |
| 45 to 49 Years | 145 (3.6%) | 187 (4.3%) |
| 50 to 54 Years | 340 (8.5%) | 254 (5.9%) |
| 55 to 59 Years | 260 (6.5%) | 627 (14.5%) |
| 60 to 64 Years | 480 (12.0%) | 262 (6.1%) |
| 65 to 69 Years | 127 (3.2%) | 155 (3.6%) |
| 70 to 74 Years | 178 (4.4%) | 141 (3.3%) |
| 75 to 79 Years | 15 (0.4%) | 119 (2.8%) |
| 80 to 84 Years | 10 (0.3%) | 41 (0.9%) |
| 85 Years and over | 47 (1.2%) | 77 (1.8%) |
| Total | 4,004 (100.0%) | 4,322 (100.0%) |
Families and Households in Prien
Median Family Size in Prien
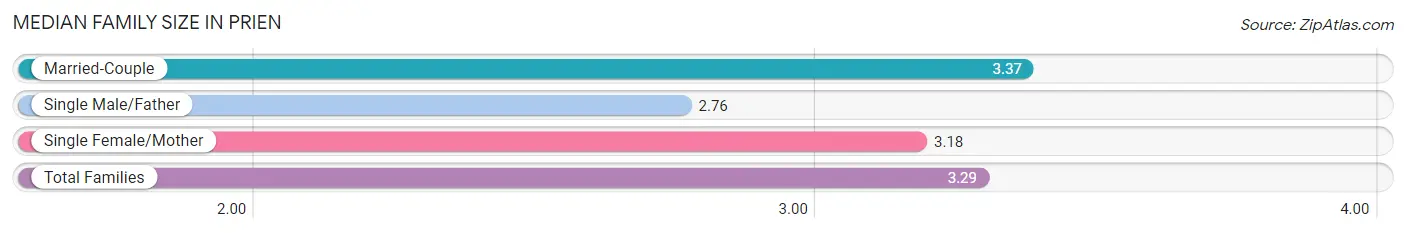
The median family size in Prien is 3.29 persons per family, with married-couple families (1,813 | 83.0%) accounting for the largest median family size of 3.37 persons per family. On the other hand, single male/father families (277 | 12.7%) represent the smallest median family size with 2.76 persons per family.
| Family Type | # Families | Family Size |
| Married-Couple | 1,813 (83.0%) | 3.37 |
| Single Male/Father | 277 (12.7%) | 2.76 |
| Single Female/Mother | 94 (4.3%) | 3.18 |
| Total Families | 2,184 (100.0%) | 3.29 |
Median Household Size in Prien
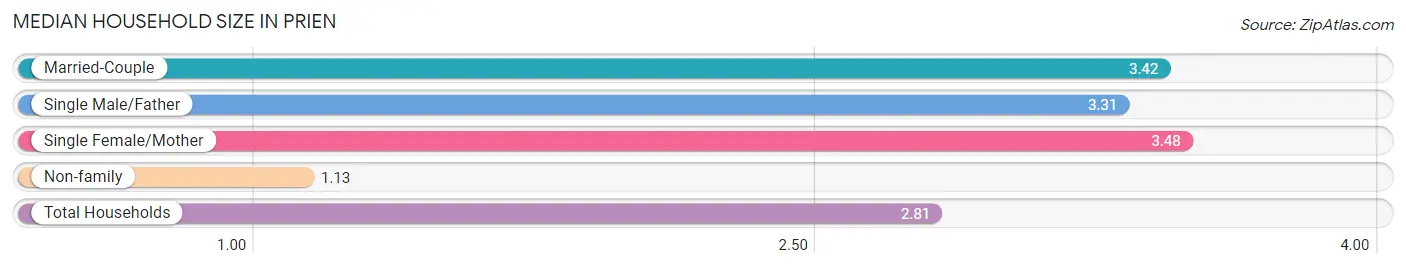
The median household size in Prien is 2.81 persons per household, with single female/mother households (94 | 3.2%) accounting for the largest median household size of 3.48 persons per household. non-family households (773 | 26.1%) represent the smallest median household size with 1.13 persons per household.
| Household Type | # Households | Household Size |
| Married-Couple | 1,813 (61.3%) | 3.42 |
| Single Male/Father | 277 (9.4%) | 3.31 |
| Single Female/Mother | 94 (3.2%) | 3.48 |
| Non-family | 773 (26.1%) | 1.13 |
| Total Households | 2,957 (100.0%) | 2.81 |
Household Size by Marriage Status in Prien
Out of a total of 2,957 households in Prien, 2,184 (73.9%) are family households, while 773 (26.1%) are nonfamily households. The most numerous type of family households are 2-person households, comprising 1,162, and the most common type of nonfamily households are 1-person households, comprising 693.
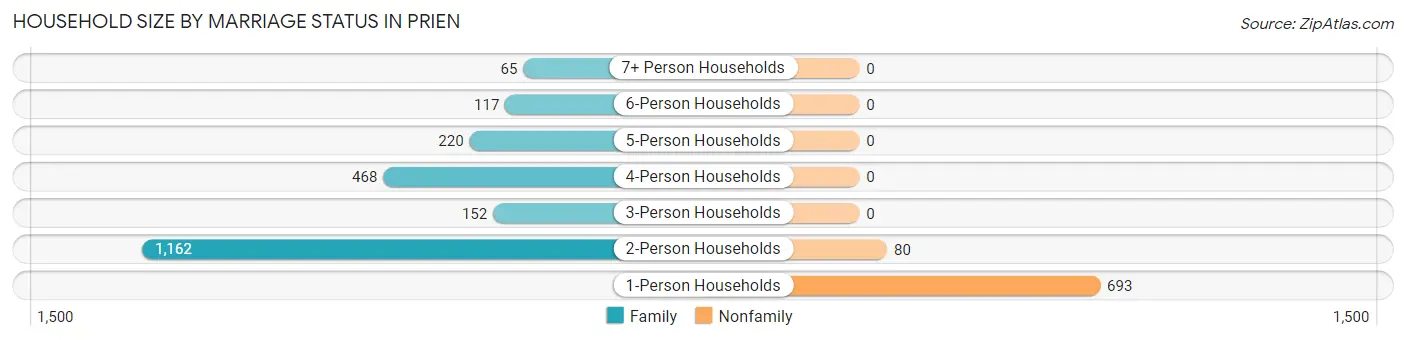
| Household Size | Family Households | Nonfamily Households |
| 1-Person Households | - | 693 (23.4%) |
| 2-Person Households | 1,162 (39.3%) | 80 (2.7%) |
| 3-Person Households | 152 (5.1%) | 0 (0.0%) |
| 4-Person Households | 468 (15.8%) | 0 (0.0%) |
| 5-Person Households | 220 (7.4%) | 0 (0.0%) |
| 6-Person Households | 117 (4.0%) | 0 (0.0%) |
| 7+ Person Households | 65 (2.2%) | 0 (0.0%) |
| Total | 2,184 (73.9%) | 773 (26.1%) |
Female Fertility in Prien
Fertility by Age in Prien
Average fertility rate in Prien is 88.0 births per 1,000 women. Women in the age bracket of 35 to 50 years have the highest fertility rate with 102.0 births per 1,000 women. Women in the age bracket of 35 to 50 years acount for 60.1% of all women with births.
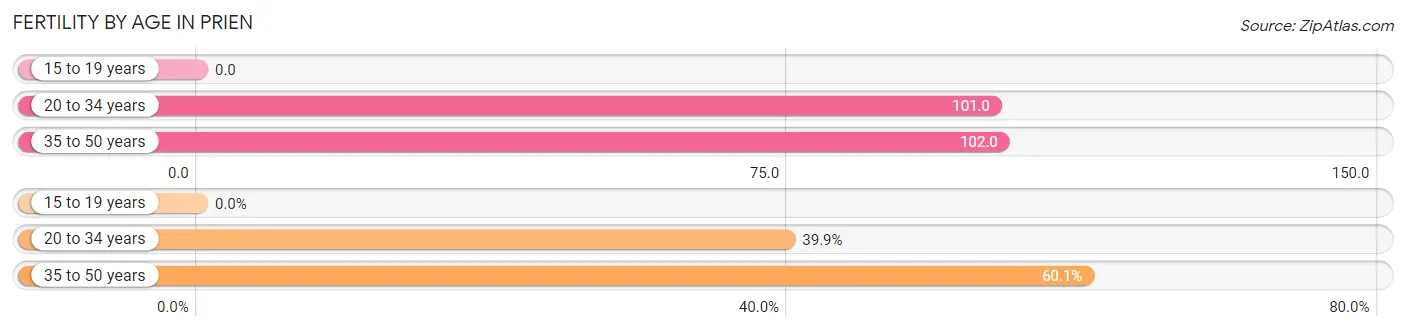
| Age Bracket | Women with Births | Births / 1,000 Women |
| 15 to 19 years | 0 (0.0%) | 0.0 |
| 20 to 34 years | 55 (39.9%) | 101.0 |
| 35 to 50 years | 83 (60.1%) | 102.0 |
| Total | 138 (100.0%) | 88.0 |
Fertility by Age by Marriage Status in Prien
70.3% of women with births (138) in Prien are married. The highest percentage of unmarried women with births falls into 35 to 50 years age bracket with 49.4% of them unmarried at the time of birth, while the lowest percentage of unmarried women with births belong to 20 to 34 years age bracket with 0.0% of them unmarried.
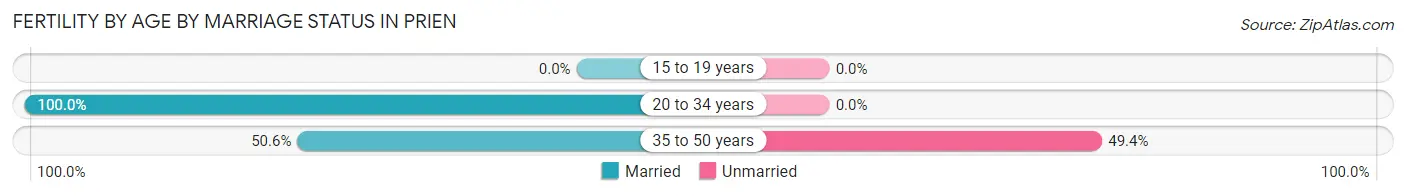
| Age Bracket | Married | Unmarried |
| 15 to 19 years | 0 (0.0%) | 0 (0.0%) |
| 20 to 34 years | 55 (100.0%) | 0 (0.0%) |
| 35 to 50 years | 42 (50.6%) | 41 (49.4%) |
| Total | 97 (70.3%) | 41 (29.7%) |
Fertility by Education in Prien

| Educational Attainment | Women with Births | Births / 1,000 Women |
| Less than High School | 0 (0.0%) | 0.0 |
| High School Diploma | 0 (0.0%) | 0.0 |
| College or Associate's Degree | 67 (48.5%) | 132.0 |
| Bachelor's Degree | 16 (11.6%) | 43.0 |
| Graduate Degree | 55 (39.9%) | 201.0 |
| Total | 138 (100.0%) | 88.0 |
Fertility by Education by Marriage Status in Prien
29.7% of women with births in Prien are unmarried. Women with the educational attainment of bachelor's degree are most likely to be married with 100.0% of them married at childbirth, while women with the educational attainment of college or associate's degree are least likely to be married with 61.2% of them unmarried at childbirth.
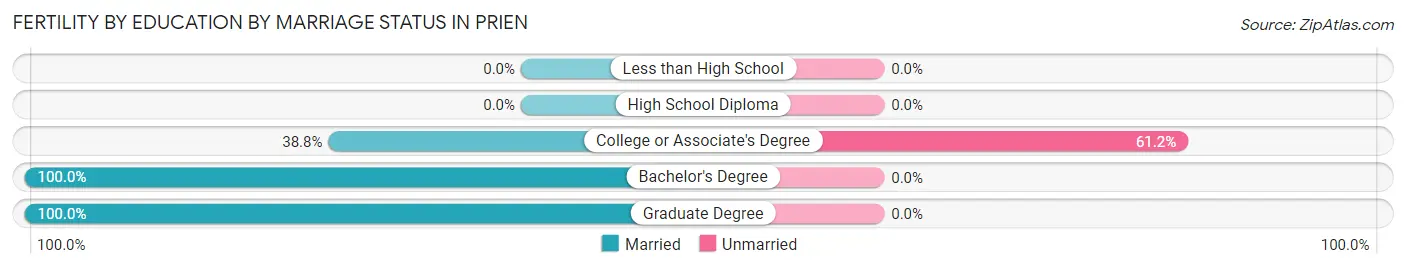
| Educational Attainment | Married | Unmarried |
| Less than High School | 0 (0.0%) | 0 (0.0%) |
| High School Diploma | 0 (0.0%) | 0 (0.0%) |
| College or Associate's Degree | 26 (38.8%) | 41 (61.2%) |
| Bachelor's Degree | 16 (100.0%) | 0 (0.0%) |
| Graduate Degree | 55 (100.0%) | 0 (0.0%) |
| Total | 97 (70.3%) | 41 (29.7%) |
Employment Characteristics in Prien
Employment by Class of Employer in Prien
Among the 3,847 employed individuals in Prien, private company employees (2,525 | 65.6%), not-for-profit organizations (413 | 10.7%), and local government employees (343 | 8.9%) make up the most common classes of employment.
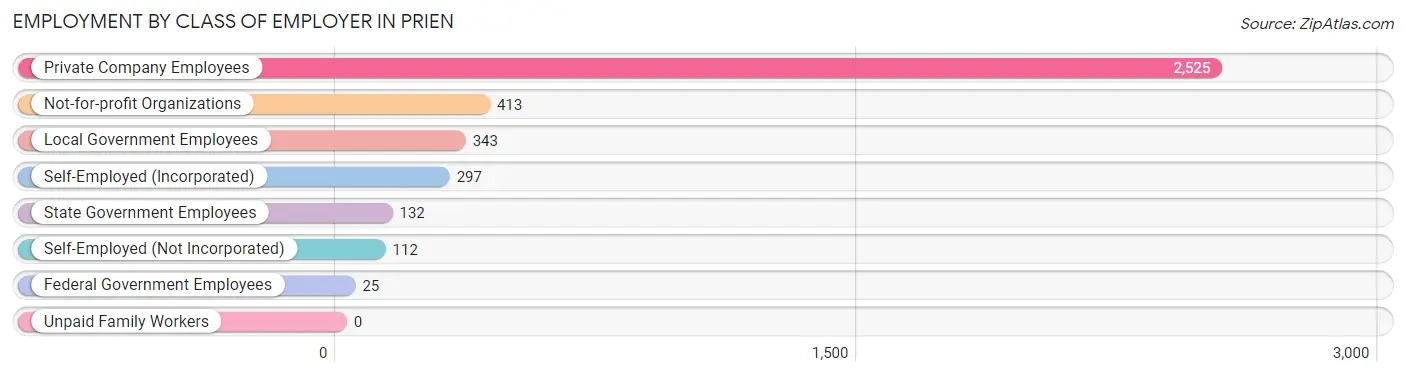
| Employer Class | # Employees | % Employees |
| Private Company Employees | 2,525 | 65.6% |
| Self-Employed (Incorporated) | 297 | 7.7% |
| Self-Employed (Not Incorporated) | 112 | 2.9% |
| Not-for-profit Organizations | 413 | 10.7% |
| Local Government Employees | 343 | 8.9% |
| State Government Employees | 132 | 3.4% |
| Federal Government Employees | 25 | 0.6% |
| Unpaid Family Workers | 0 | 0.0% |
| Total | 3,847 | 100.0% |
Employment Status by Age in Prien
According to the labor force statistics for Prien, out of the total population over 16 years of age (5,930), 71.2% or 4,222 individuals are in the labor force, with 6.5% or 274 of them unemployed. The age group with the highest labor force participation rate is 30 to 34 years, with 94.9% or 351 individuals in the labor force. Within the labor force, the 25 to 29 years age range has the highest percentage of unemployed individuals, with 25.7% or 58 of them being unemployed.
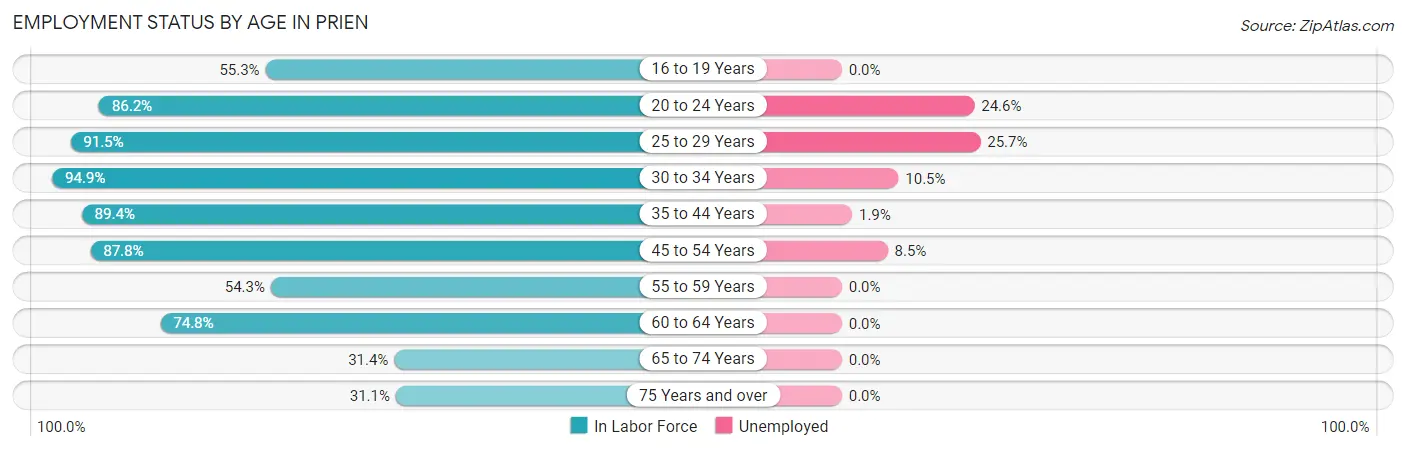
| Age Bracket | In Labor Force | Unemployed |
| 16 to 19 Years | 208 (55.3%) | 0 (0.0%) |
| 20 to 24 Years | 370 (86.2%) | 91 (24.6%) |
| 25 to 29 Years | 226 (91.5%) | 58 (25.7%) |
| 30 to 34 Years | 351 (94.9%) | 37 (10.5%) |
| 35 to 44 Years | 932 (89.4%) | 18 (1.9%) |
| 45 to 54 Years | 813 (87.8%) | 69 (8.5%) |
| 55 to 59 Years | 482 (54.3%) | 0 (0.0%) |
| 60 to 64 Years | 555 (74.8%) | 0 (0.0%) |
| 65 to 74 Years | 189 (31.4%) | 0 (0.0%) |
| 75 Years and over | 96 (31.1%) | 0 (0.0%) |
| Total | 4,222 (71.2%) | 274 (6.5%) |
Employment Status by Educational Attainment in Prien
According to labor force statistics for Prien, 79.7% of individuals (3,359) out of the total population between 25 and 64 years of age (4,215) are in the labor force, with 5.4% or 181 of them being unemployed. The group with the highest labor force participation rate are those with the educational attainment of college / associate degree, with 88.7% or 1,048 individuals in the labor force. Within the labor force, individuals with bachelor's degree or higher education have the highest percentage of unemployment, with 7.9% or 106 of them being unemployed.
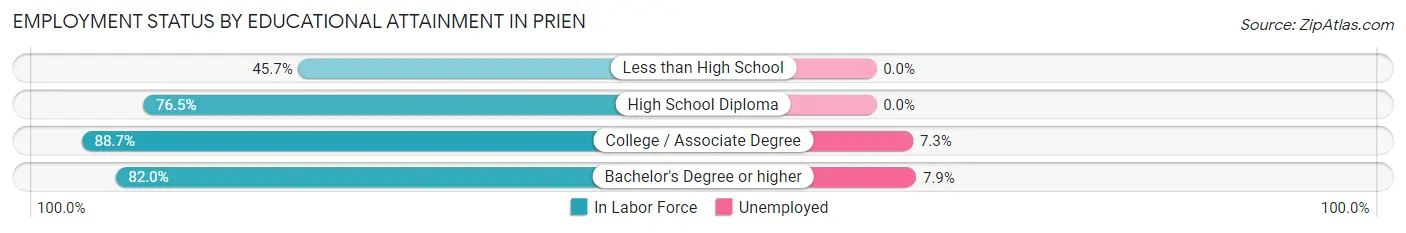
| Educational Attainment | In Labor Force | Unemployed |
| Less than High School | 150 (45.7%) | 0 (0.0%) |
| High School Diploma | 818 (76.5%) | 0 (0.0%) |
| College / Associate Degree | 1,048 (88.7%) | 86 (7.3%) |
| Bachelor's Degree or higher | 1,342 (82.0%) | 129 (7.9%) |
| Total | 3,359 (79.7%) | 228 (5.4%) |
Employment Occupations by Sex in Prien
Management, Business, Science and Arts Occupations
The most common Management, Business, Science and Arts occupations in Prien are Community & Social Service (818 | 20.7%), Education Instruction & Library (572 | 14.5%), Management (400 | 10.1%), Health Diagnosing & Treating (331 | 8.4%), and Health Technologists (236 | 6.0%).
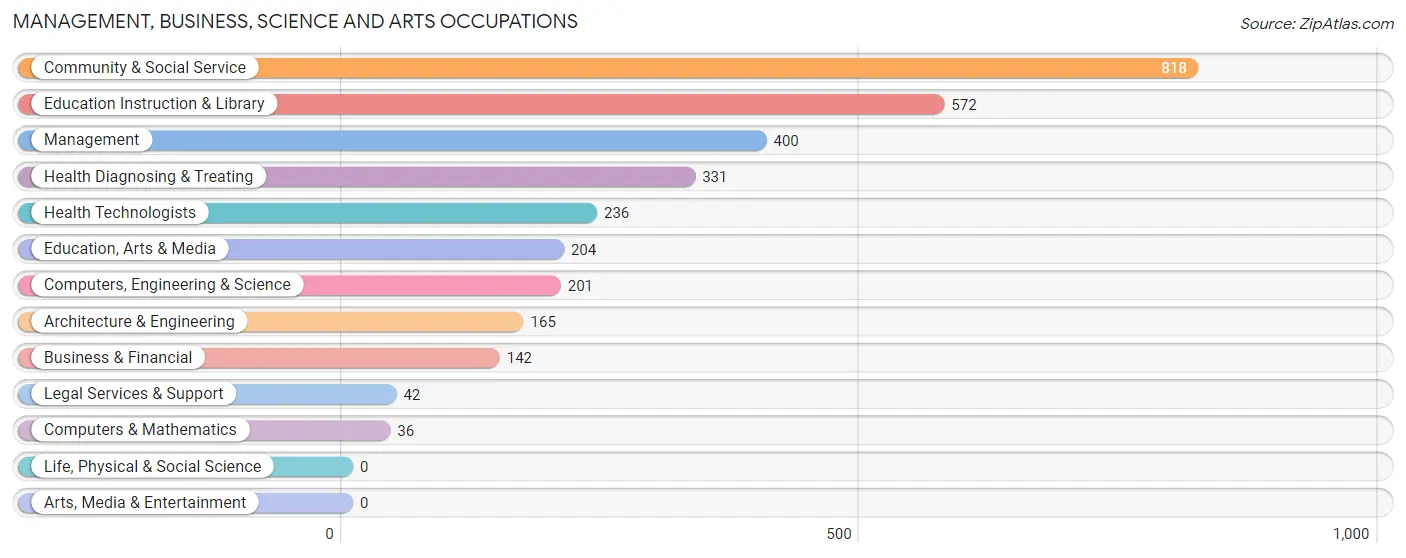
Management, Business, Science and Arts Occupations by Sex
Within the Management, Business, Science and Arts occupations in Prien, the most male-oriented occupations are Computers, Engineering & Science (100.0%), Computers & Mathematics (100.0%), and Architecture & Engineering (100.0%), while the most female-oriented occupations are Education Instruction & Library (100.0%), Community & Social Service (95.6%), and Business & Financial (87.3%).
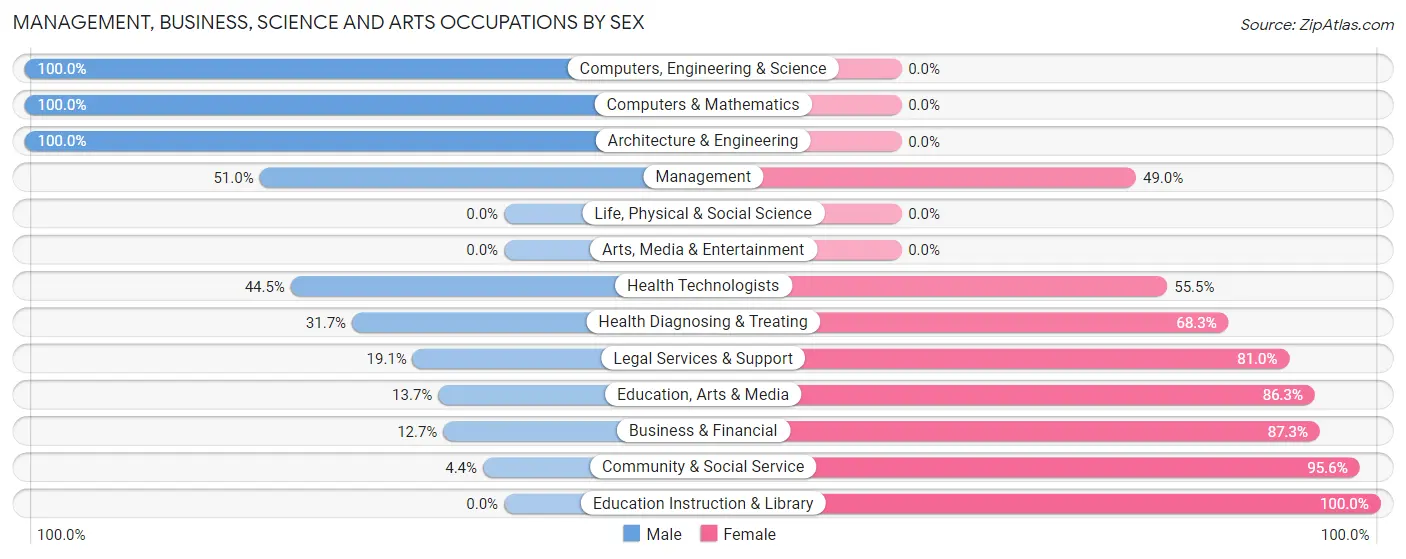
| Occupation | Male | Female |
| Management | 204 (51.0%) | 196 (49.0%) |
| Business & Financial | 18 (12.7%) | 124 (87.3%) |
| Computers, Engineering & Science | 201 (100.0%) | 0 (0.0%) |
| Computers & Mathematics | 36 (100.0%) | 0 (0.0%) |
| Architecture & Engineering | 165 (100.0%) | 0 (0.0%) |
| Life, Physical & Social Science | 0 (0.0%) | 0 (0.0%) |
| Community & Social Service | 36 (4.4%) | 782 (95.6%) |
| Education, Arts & Media | 28 (13.7%) | 176 (86.3%) |
| Legal Services & Support | 8 (19.1%) | 34 (80.9%) |
| Education Instruction & Library | 0 (0.0%) | 572 (100.0%) |
| Arts, Media & Entertainment | 0 (0.0%) | 0 (0.0%) |
| Health Diagnosing & Treating | 105 (31.7%) | 226 (68.3%) |
| Health Technologists | 105 (44.5%) | 131 (55.5%) |
| Total (Category) | 564 (29.8%) | 1,328 (70.2%) |
| Total (Overall) | 1,899 (48.1%) | 2,050 (51.9%) |
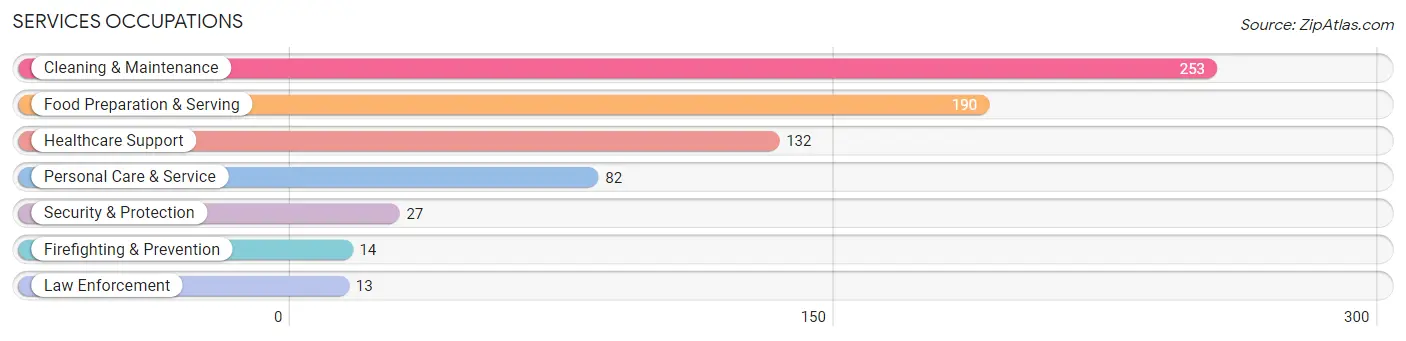
Services Occupations
The most common Services occupations in Prien are Cleaning & Maintenance (253 | 6.4%), Food Preparation & Serving (190 | 4.8%), Healthcare Support (132 | 3.3%), Personal Care & Service (82 | 2.1%), and Security & Protection (27 | 0.7%).
Services Occupations by Sex
Within the Services occupations in Prien, the most male-oriented occupations are Security & Protection (100.0%), Firefighting & Prevention (100.0%), and Law Enforcement (100.0%), while the most female-oriented occupations are Healthcare Support (100.0%), Personal Care & Service (100.0%), and Food Preparation & Serving (55.8%).
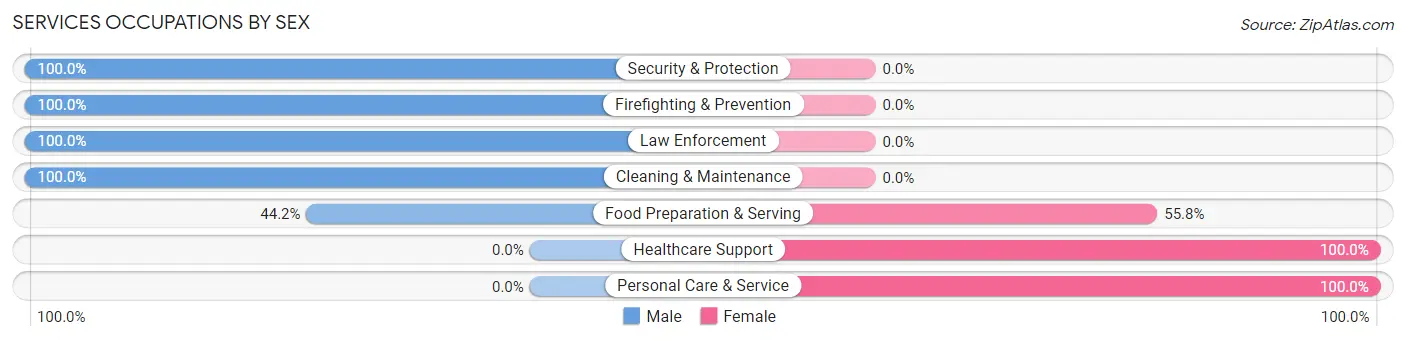
| Occupation | Male | Female |
| Healthcare Support | 0 (0.0%) | 132 (100.0%) |
| Security & Protection | 27 (100.0%) | 0 (0.0%) |
| Firefighting & Prevention | 14 (100.0%) | 0 (0.0%) |
| Law Enforcement | 13 (100.0%) | 0 (0.0%) |
| Food Preparation & Serving | 84 (44.2%) | 106 (55.8%) |
| Cleaning & Maintenance | 253 (100.0%) | 0 (0.0%) |
| Personal Care & Service | 0 (0.0%) | 82 (100.0%) |
| Total (Category) | 364 (53.2%) | 320 (46.8%) |
| Total (Overall) | 1,899 (48.1%) | 2,050 (51.9%) |
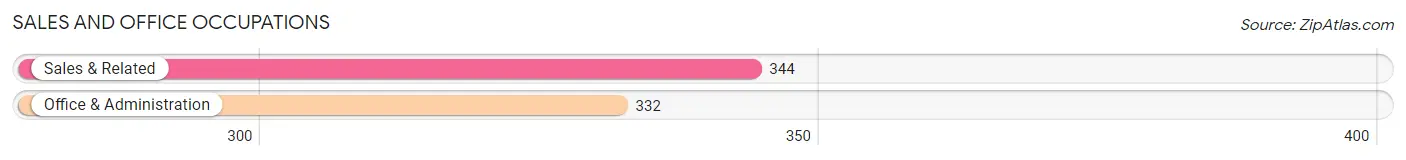
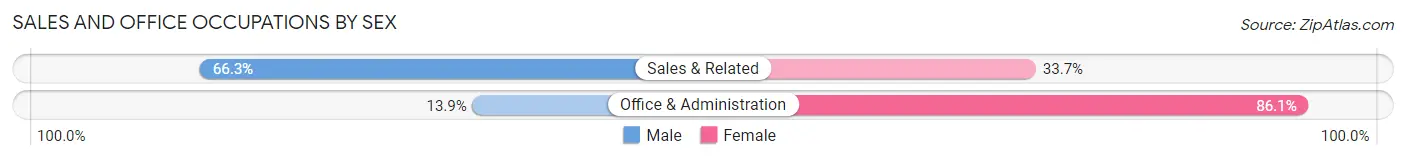
Sales and Office Occupations
The most common Sales and Office occupations in Prien are Sales & Related (344 | 8.7%), and Office & Administration (332 | 8.4%).
Sales and Office Occupations by Sex
| Occupation | Male | Female |
| Sales & Related | 228 (66.3%) | 116 (33.7%) |
| Office & Administration | 46 (13.9%) | 286 (86.1%) |
| Total (Category) | 274 (40.5%) | 402 (59.5%) |
| Total (Overall) | 1,899 (48.1%) | 2,050 (51.9%) |
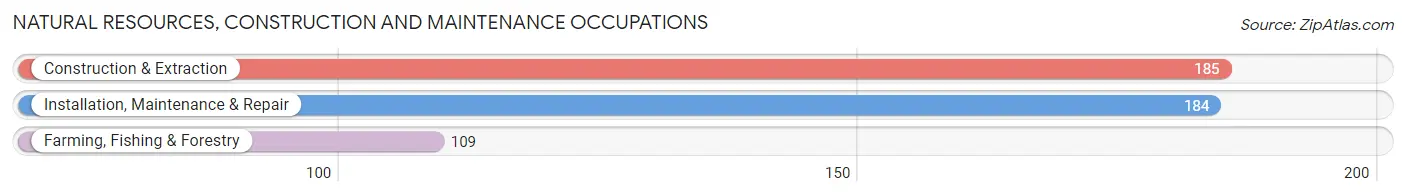
Natural Resources, Construction and Maintenance Occupations
The most common Natural Resources, Construction and Maintenance occupations in Prien are Construction & Extraction (185 | 4.7%), Installation, Maintenance & Repair (184 | 4.7%), and Farming, Fishing & Forestry (109 | 2.8%).
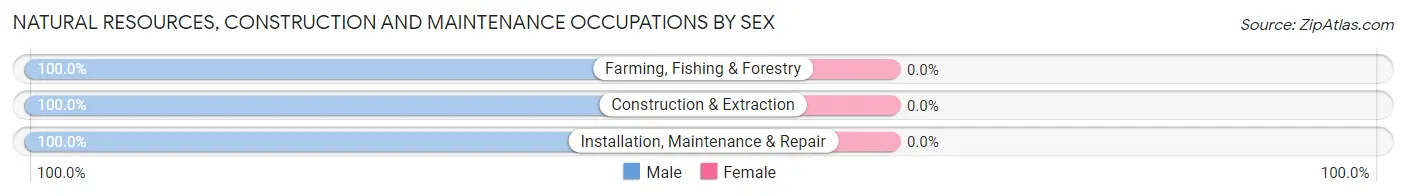
Natural Resources, Construction and Maintenance Occupations by Sex
| Occupation | Male | Female |
| Farming, Fishing & Forestry | 109 (100.0%) | 0 (0.0%) |
| Construction & Extraction | 185 (100.0%) | 0 (0.0%) |
| Installation, Maintenance & Repair | 184 (100.0%) | 0 (0.0%) |
| Total (Category) | 478 (100.0%) | 0 (0.0%) |
| Total (Overall) | 1,899 (48.1%) | 2,050 (51.9%) |
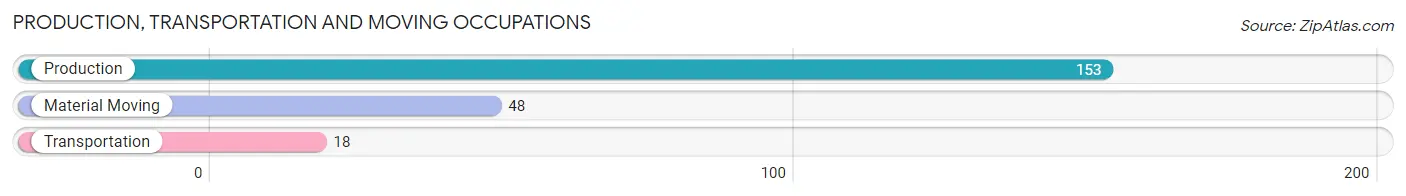
Production, Transportation and Moving Occupations
The most common Production, Transportation and Moving occupations in Prien are Production (153 | 3.9%), Material Moving (48 | 1.2%), and Transportation (18 | 0.5%).
Production, Transportation and Moving Occupations by Sex
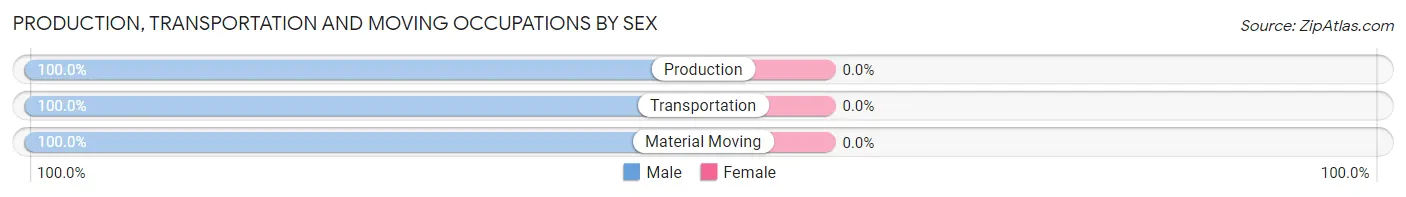
| Occupation | Male | Female |
| Production | 153 (100.0%) | 0 (0.0%) |
| Transportation | 18 (100.0%) | 0 (0.0%) |
| Material Moving | 48 (100.0%) | 0 (0.0%) |
| Total (Category) | 219 (100.0%) | 0 (0.0%) |
| Total (Overall) | 1,899 (48.1%) | 2,050 (51.9%) |
Employment Industries by Sex in Prien
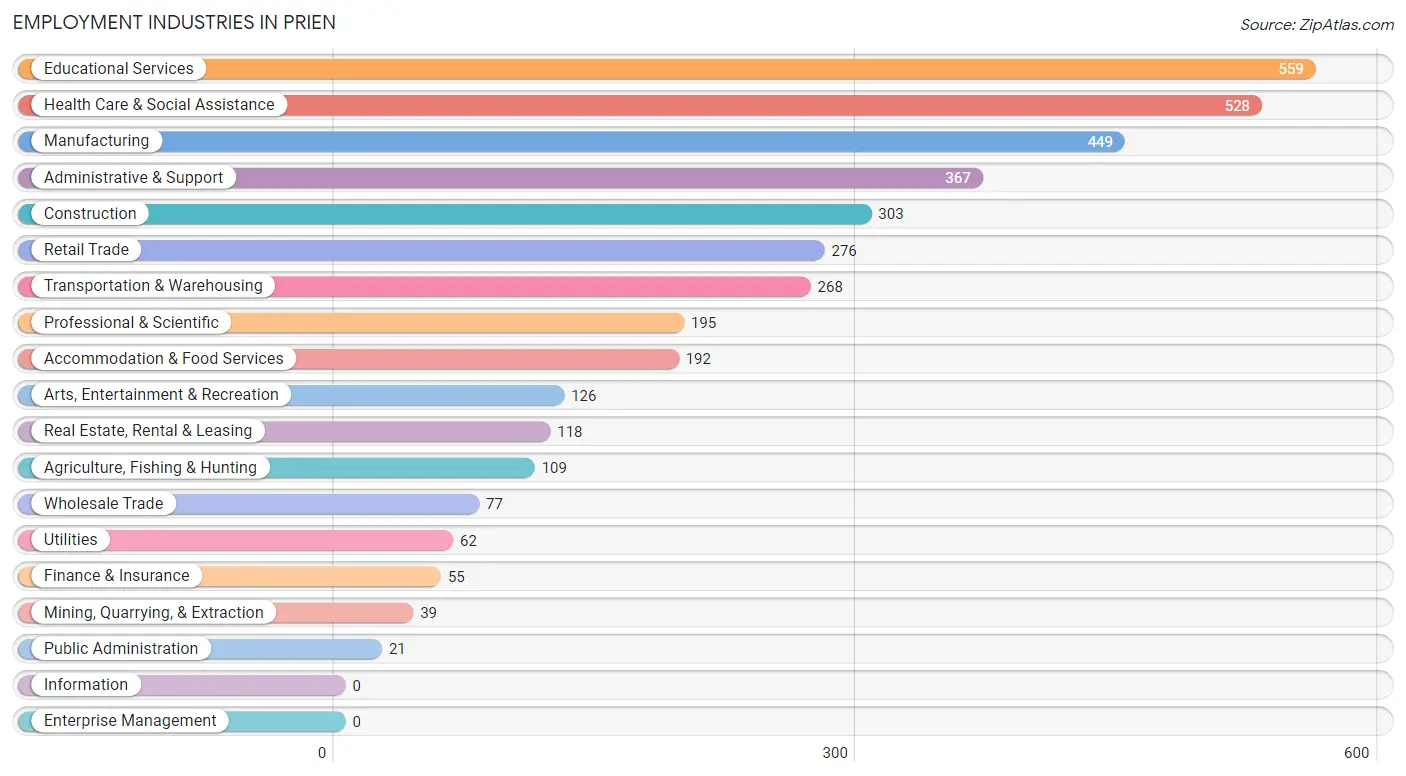
Employment Industries in Prien
The major employment industries in Prien include Educational Services (559 | 14.2%), Health Care & Social Assistance (528 | 13.4%), Manufacturing (449 | 11.4%), Administrative & Support (367 | 9.3%), and Construction (303 | 7.7%).
Employment Industries by Sex in Prien
The Prien industries that see more men than women are Agriculture, Fishing & Hunting (100.0%), Mining, Quarrying, & Extraction (100.0%), and Utilities (100.0%), whereas the industries that tend to have a higher number of women are Finance & Insurance (100.0%), Educational Services (93.9%), and Health Care & Social Assistance (86.4%).
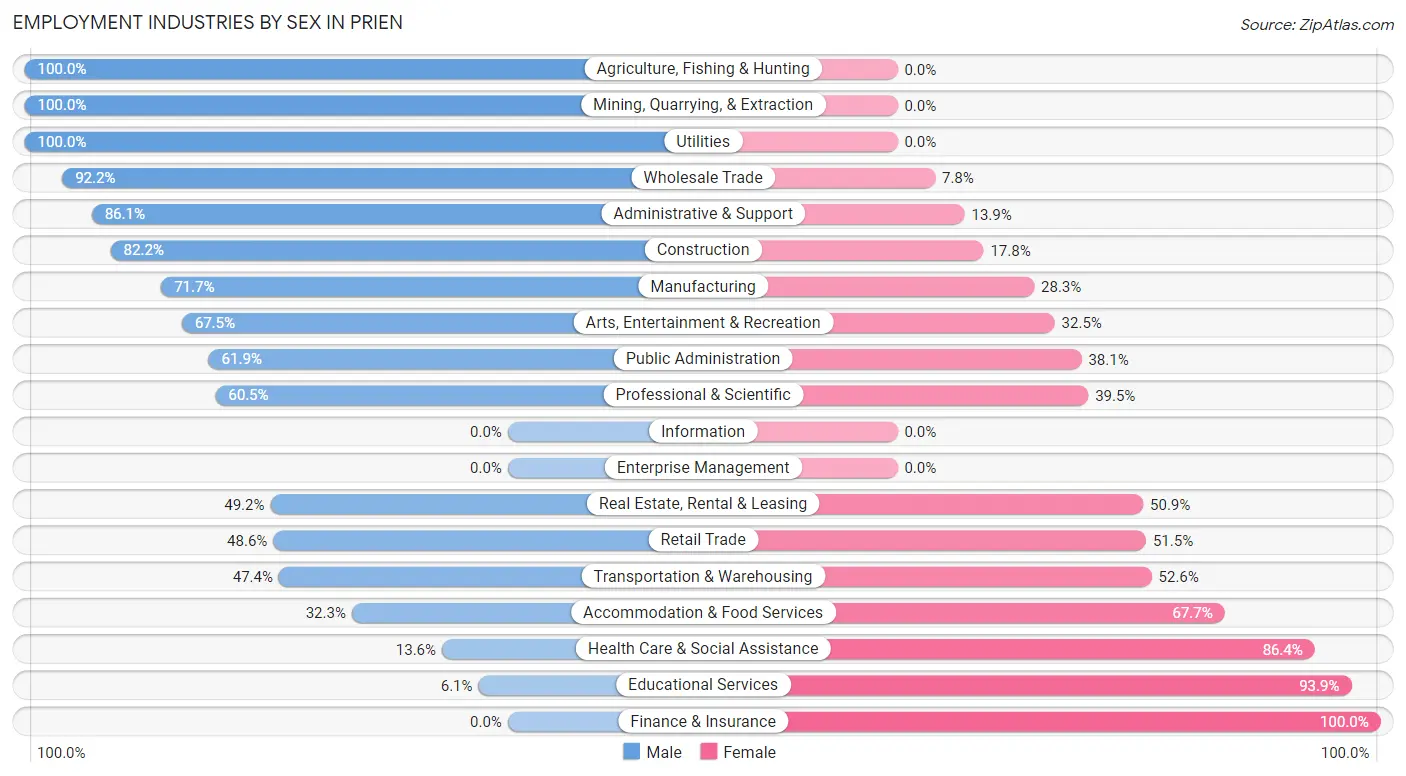
| Industry | Male | Female |
| Agriculture, Fishing & Hunting | 109 (100.0%) | 0 (0.0%) |
| Mining, Quarrying, & Extraction | 39 (100.0%) | 0 (0.0%) |
| Construction | 249 (82.2%) | 54 (17.8%) |
| Manufacturing | 322 (71.7%) | 127 (28.3%) |
| Wholesale Trade | 71 (92.2%) | 6 (7.8%) |
| Retail Trade | 134 (48.5%) | 142 (51.4%) |
| Transportation & Warehousing | 127 (47.4%) | 141 (52.6%) |
| Utilities | 62 (100.0%) | 0 (0.0%) |
| Information | 0 (0.0%) | 0 (0.0%) |
| Finance & Insurance | 0 (0.0%) | 55 (100.0%) |
| Real Estate, Rental & Leasing | 58 (49.1%) | 60 (50.8%) |
| Professional & Scientific | 118 (60.5%) | 77 (39.5%) |
| Enterprise Management | 0 (0.0%) | 0 (0.0%) |
| Administrative & Support | 316 (86.1%) | 51 (13.9%) |
| Educational Services | 34 (6.1%) | 525 (93.9%) |
| Health Care & Social Assistance | 72 (13.6%) | 456 (86.4%) |
| Arts, Entertainment & Recreation | 85 (67.5%) | 41 (32.5%) |
| Accommodation & Food Services | 62 (32.3%) | 130 (67.7%) |
| Public Administration | 13 (61.9%) | 8 (38.1%) |
| Total | 1,899 (48.1%) | 2,050 (51.9%) |
Education in Prien
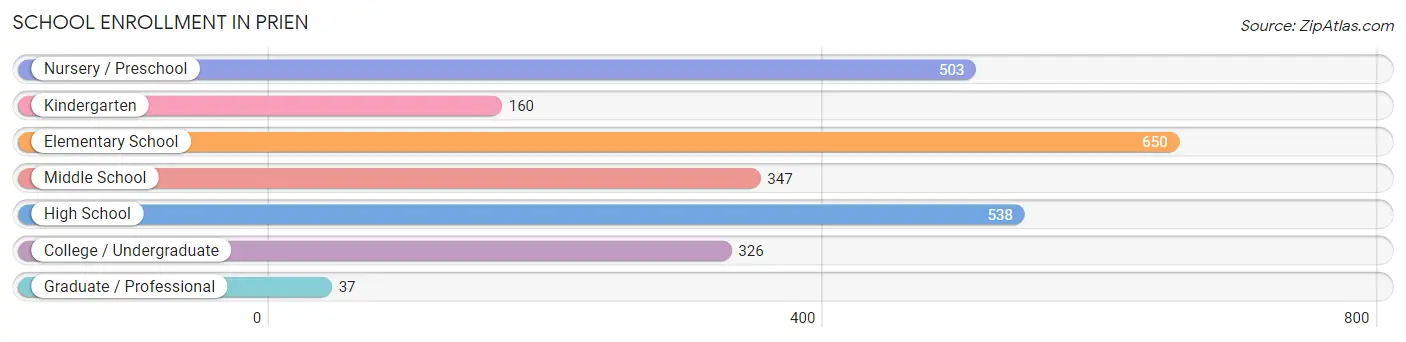
School Enrollment in Prien
The most common levels of schooling among the 2,561 students in Prien are elementary school (650 | 25.4%), high school (538 | 21.0%), and nursery / preschool (503 | 19.6%).
| School Level | # Students | % Students |
| Nursery / Preschool | 503 | 19.6% |
| Kindergarten | 160 | 6.2% |
| Elementary School | 650 | 25.4% |
| Middle School | 347 | 13.6% |
| High School | 538 | 21.0% |
| College / Undergraduate | 326 | 12.7% |
| Graduate / Professional | 37 | 1.4% |
| Total | 2,561 | 100.0% |
School Enrollment by Age by Funding Source in Prien
Out of a total of 2,561 students who are enrolled in schools in Prien, 832 (32.5%) attend a private institution, while the remaining 1,729 (67.5%) are enrolled in public schools. The age group of 10 to 14 year olds has the highest likelihood of being enrolled in private schools, with 333 (56.4% in the age bracket) enrolled. Conversely, the age group of 15 to 17 year olds has the lowest likelihood of being enrolled in a private school, with 369 (100.0% in the age bracket) attending a public institution.
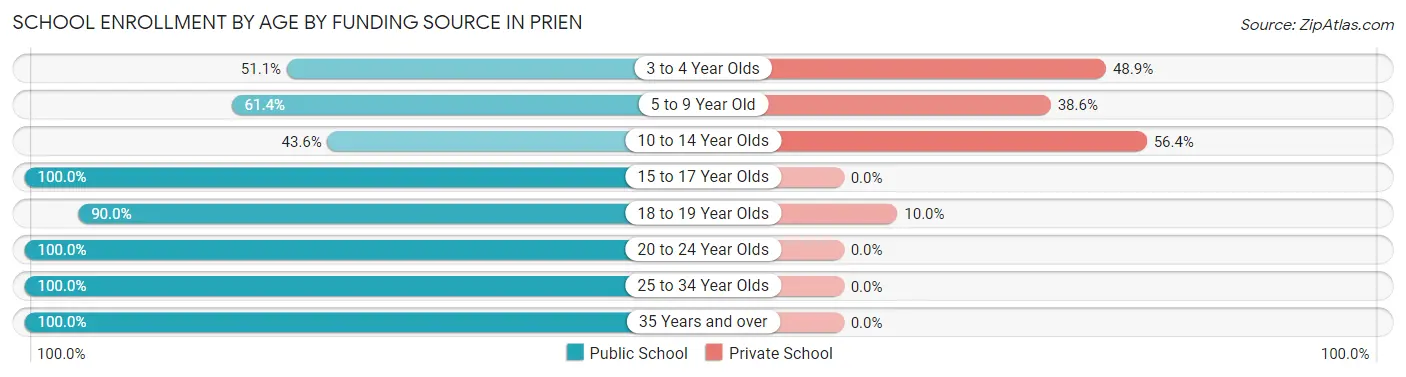
| Age Bracket | Public School | Private School |
| 3 to 4 Year Olds | 225 (51.1%) | 215 (48.9%) |
| 5 to 9 Year Old | 438 (61.4%) | 275 (38.6%) |
| 10 to 14 Year Olds | 257 (43.6%) | 333 (56.4%) |
| 15 to 17 Year Olds | 369 (100.0%) | 0 (0.0%) |
| 18 to 19 Year Olds | 90 (90.0%) | 10 (10.0%) |
| 20 to 24 Year Olds | 215 (100.0%) | 0 (0.0%) |
| 25 to 34 Year Olds | 37 (100.0%) | 0 (0.0%) |
| 35 Years and over | 97 (100.0%) | 0 (0.0%) |
| Total | 1,729 (67.5%) | 832 (32.5%) |
Educational Attainment by Field of Study in Prien
Business (484 | 24.1%), science & technology (314 | 15.7%), education (265 | 13.2%), engineering (256 | 12.8%), and bio, nature & agricultural (132 | 6.6%) are the most common fields of study among 2,007 individuals in Prien who have obtained a bachelor's degree or higher.
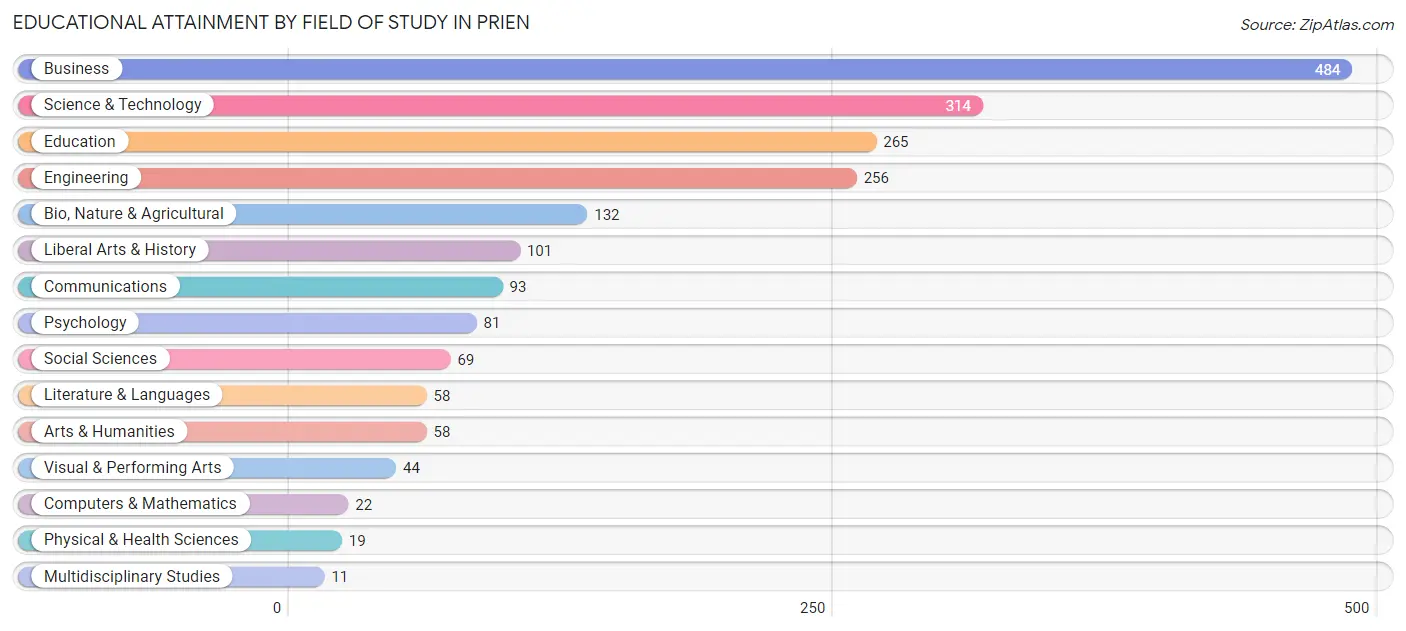
| Field of Study | # Graduates | % Graduates |
| Computers & Mathematics | 22 | 1.1% |
| Bio, Nature & Agricultural | 132 | 6.6% |
| Physical & Health Sciences | 19 | 0.9% |
| Psychology | 81 | 4.0% |
| Social Sciences | 69 | 3.4% |
| Engineering | 256 | 12.8% |
| Multidisciplinary Studies | 11 | 0.5% |
| Science & Technology | 314 | 15.7% |
| Business | 484 | 24.1% |
| Education | 265 | 13.2% |
| Literature & Languages | 58 | 2.9% |
| Liberal Arts & History | 101 | 5.0% |
| Visual & Performing Arts | 44 | 2.2% |
| Communications | 93 | 4.6% |
| Arts & Humanities | 58 | 2.9% |
| Total | 2,007 | 100.0% |
Transportation & Commute in Prien
Vehicle Availability by Sex in Prien
The most prevalent vehicle ownership categories in Prien are males with 2 vehicles (802, accounting for 43.2%) and females with 2 vehicles (594, making up 40.3%).
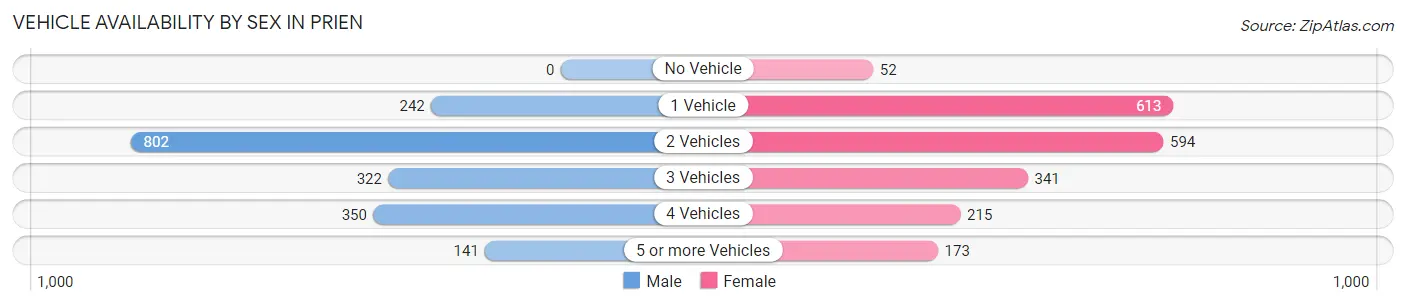
| Vehicles Available | Male | Female |
| No Vehicle | 0 (0.0%) | 52 (2.6%) |
| 1 Vehicle | 242 (13.0%) | 613 (30.8%) |
| 2 Vehicles | 802 (43.2%) | 594 (29.9%) |
| 3 Vehicles | 322 (17.3%) | 341 (17.2%) |
| 4 Vehicles | 350 (18.9%) | 215 (10.8%) |
| 5 or more Vehicles | 141 (7.6%) | 173 (8.7%) |
| Total | 1,857 (100.0%) | 1,988 (100.0%) |
Commute Time in Prien
The most frequently occuring commute durations in Prien are 15 to 19 minutes (1,279 commuters, 34.2%), 20 to 24 minutes (833 commuters, 22.3%), and 10 to 14 minutes (788 commuters, 21.0%).
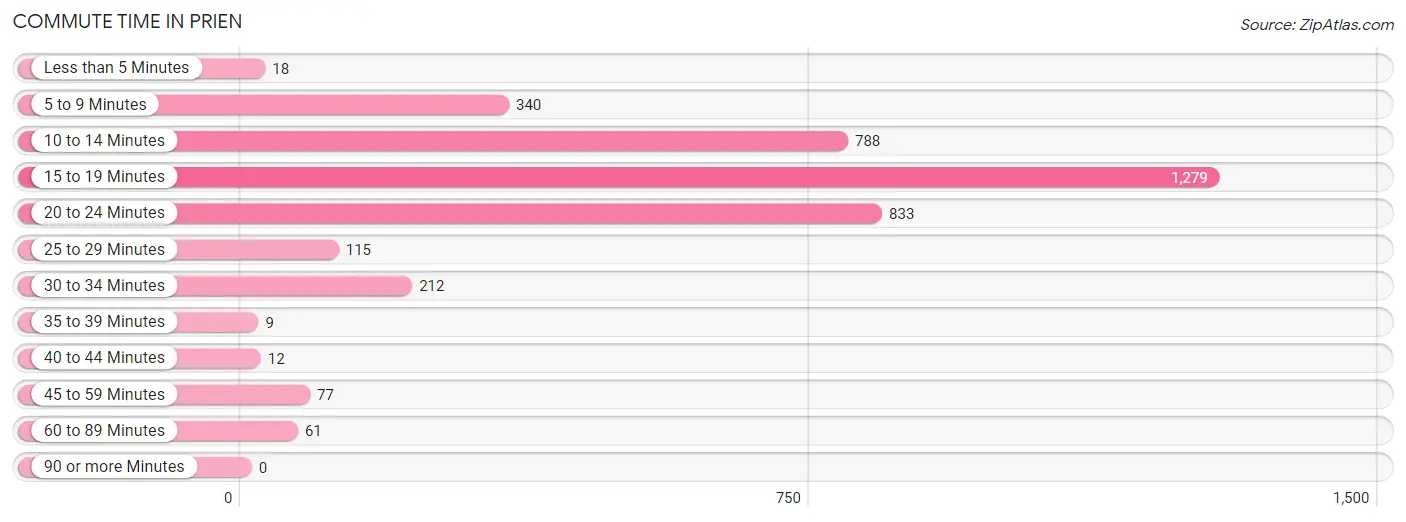
| Commute Time | # Commuters | % Commuters |
| Less than 5 Minutes | 18 | 0.5% |
| 5 to 9 Minutes | 340 | 9.1% |
| 10 to 14 Minutes | 788 | 21.0% |
| 15 to 19 Minutes | 1,279 | 34.2% |
| 20 to 24 Minutes | 833 | 22.3% |
| 25 to 29 Minutes | 115 | 3.1% |
| 30 to 34 Minutes | 212 | 5.7% |
| 35 to 39 Minutes | 9 | 0.2% |
| 40 to 44 Minutes | 12 | 0.3% |
| 45 to 59 Minutes | 77 | 2.1% |
| 60 to 89 Minutes | 61 | 1.6% |
| 90 or more Minutes | 0 | 0.0% |
Commute Time by Sex in Prien
The most common commute times in Prien are 15 to 19 minutes (690 commuters, 38.5%) for males and 15 to 19 minutes (589 commuters, 30.2%) for females.
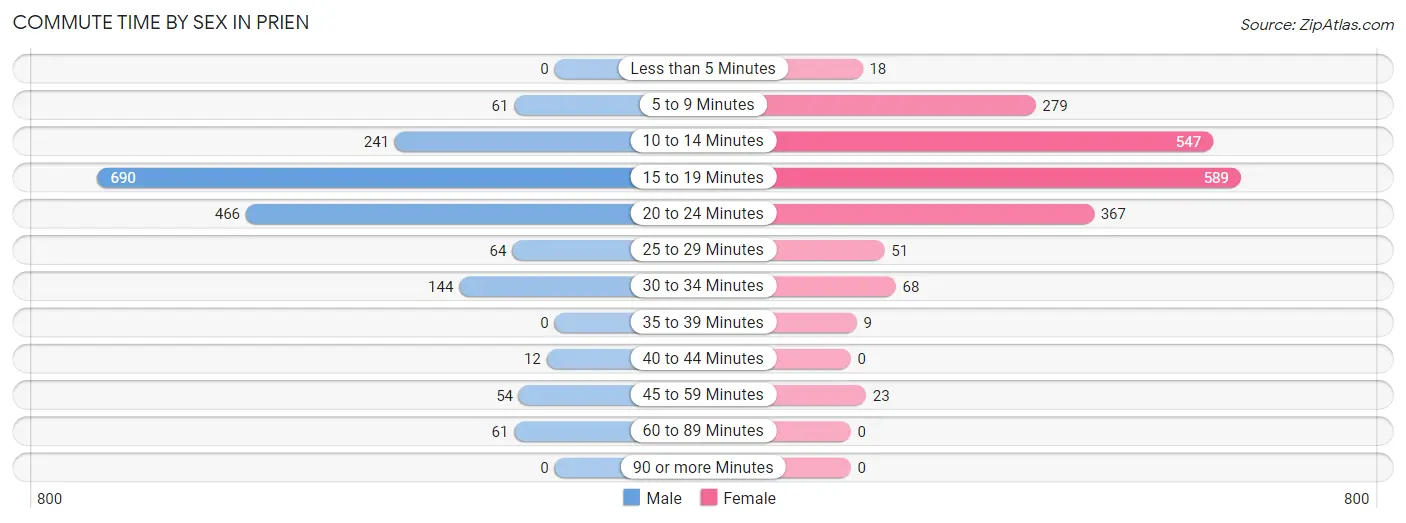
| Commute Time | Male | Female |
| Less than 5 Minutes | 0 (0.0%) | 18 (0.9%) |
| 5 to 9 Minutes | 61 (3.4%) | 279 (14.3%) |
| 10 to 14 Minutes | 241 (13.4%) | 547 (28.0%) |
| 15 to 19 Minutes | 690 (38.5%) | 589 (30.2%) |
| 20 to 24 Minutes | 466 (26.0%) | 367 (18.8%) |
| 25 to 29 Minutes | 64 (3.6%) | 51 (2.6%) |
| 30 to 34 Minutes | 144 (8.0%) | 68 (3.5%) |
| 35 to 39 Minutes | 0 (0.0%) | 9 (0.5%) |
| 40 to 44 Minutes | 12 (0.7%) | 0 (0.0%) |
| 45 to 59 Minutes | 54 (3.0%) | 23 (1.2%) |
| 60 to 89 Minutes | 61 (3.4%) | 0 (0.0%) |
| 90 or more Minutes | 0 (0.0%) | 0 (0.0%) |
Time of Departure to Work by Sex in Prien
The most frequent times of departure to work in Prien are 7:00 AM to 7:29 AM (453, 25.3%) for males and 7:00 AM to 7:29 AM (684, 35.1%) for females.
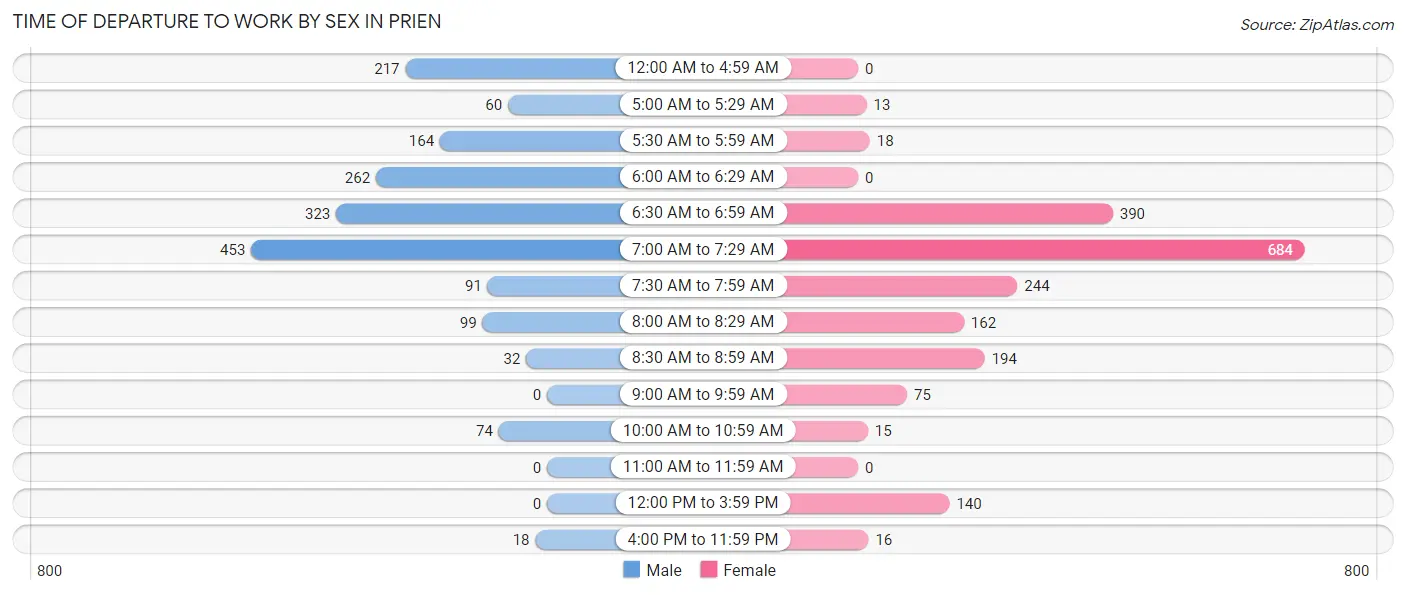
| Time of Departure | Male | Female |
| 12:00 AM to 4:59 AM | 217 (12.1%) | 0 (0.0%) |
| 5:00 AM to 5:29 AM | 60 (3.4%) | 13 (0.7%) |
| 5:30 AM to 5:59 AM | 164 (9.1%) | 18 (0.9%) |
| 6:00 AM to 6:29 AM | 262 (14.6%) | 0 (0.0%) |
| 6:30 AM to 6:59 AM | 323 (18.0%) | 390 (20.0%) |
| 7:00 AM to 7:29 AM | 453 (25.3%) | 684 (35.1%) |
| 7:30 AM to 7:59 AM | 91 (5.1%) | 244 (12.5%) |
| 8:00 AM to 8:29 AM | 99 (5.5%) | 162 (8.3%) |
| 8:30 AM to 8:59 AM | 32 (1.8%) | 194 (9.9%) |
| 9:00 AM to 9:59 AM | 0 (0.0%) | 75 (3.8%) |
| 10:00 AM to 10:59 AM | 74 (4.1%) | 15 (0.8%) |
| 11:00 AM to 11:59 AM | 0 (0.0%) | 0 (0.0%) |
| 12:00 PM to 3:59 PM | 0 (0.0%) | 140 (7.2%) |
| 4:00 PM to 11:59 PM | 18 (1.0%) | 16 (0.8%) |
| Total | 1,793 (100.0%) | 1,951 (100.0%) |
Housing Occupancy in Prien
Occupancy by Ownership in Prien
Of the total 2,957 dwellings in Prien, owner-occupied units account for 2,579 (87.2%), while renter-occupied units make up 378 (12.8%).
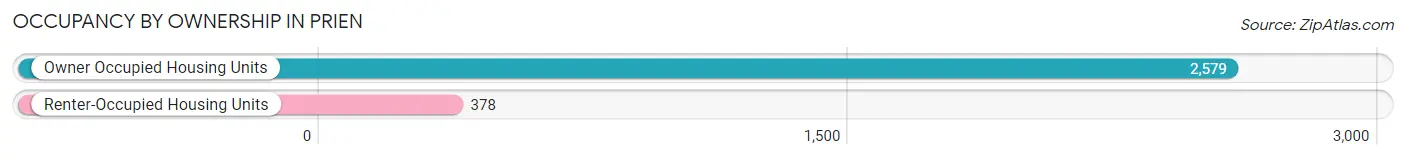
| Occupancy | # Housing Units | % Housing Units |
| Owner Occupied Housing Units | 2,579 | 87.2% |
| Renter-Occupied Housing Units | 378 | 12.8% |
| Total Occupied Housing Units | 2,957 | 100.0% |
Occupancy by Household Size in Prien
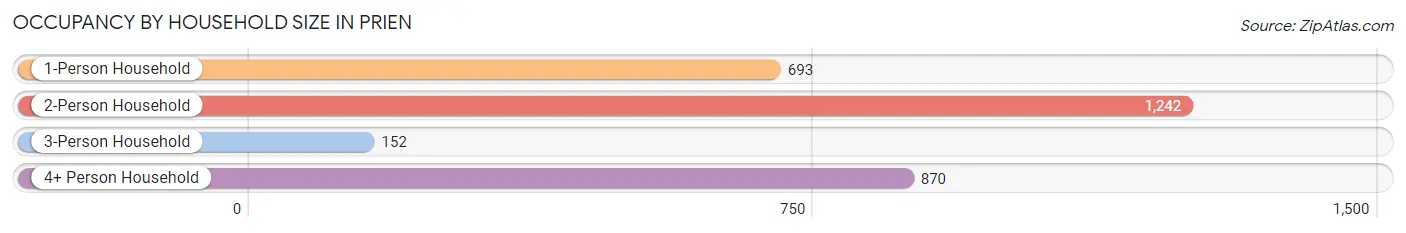
| Household Size | # Housing Units | % Housing Units |
| 1-Person Household | 693 | 23.4% |
| 2-Person Household | 1,242 | 42.0% |
| 3-Person Household | 152 | 5.1% |
| 4+ Person Household | 870 | 29.4% |
| Total Housing Units | 2,957 | 100.0% |
Occupancy by Ownership by Household Size in Prien
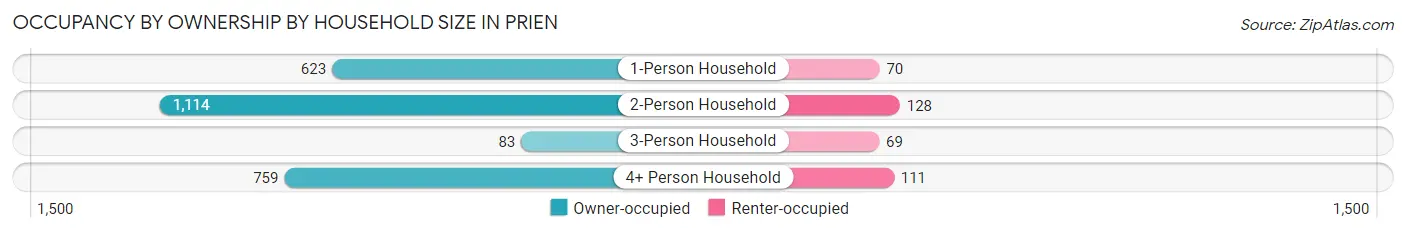
| Household Size | Owner-occupied | Renter-occupied |
| 1-Person Household | 623 (89.9%) | 70 (10.1%) |
| 2-Person Household | 1,114 (89.7%) | 128 (10.3%) |
| 3-Person Household | 83 (54.6%) | 69 (45.4%) |
| 4+ Person Household | 759 (87.2%) | 111 (12.8%) |
| Total Housing Units | 2,579 (87.2%) | 378 (12.8%) |
Occupancy by Educational Attainment in Prien
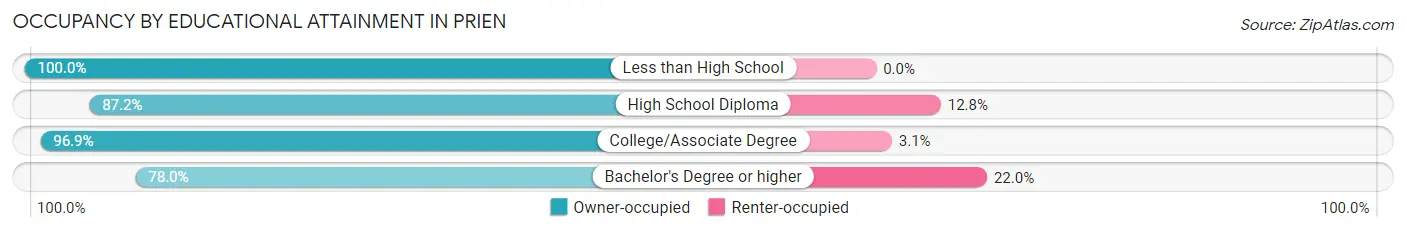
| Household Size | Owner-occupied | Renter-occupied |
| Less than High School | 144 (100.0%) | 0 (0.0%) |
| High School Diploma | 667 (87.2%) | 98 (12.8%) |
| College/Associate Degree | 873 (96.9%) | 28 (3.1%) |
| Bachelor's Degree or higher | 895 (78.0%) | 252 (22.0%) |
Occupancy by Age of Householder in Prien
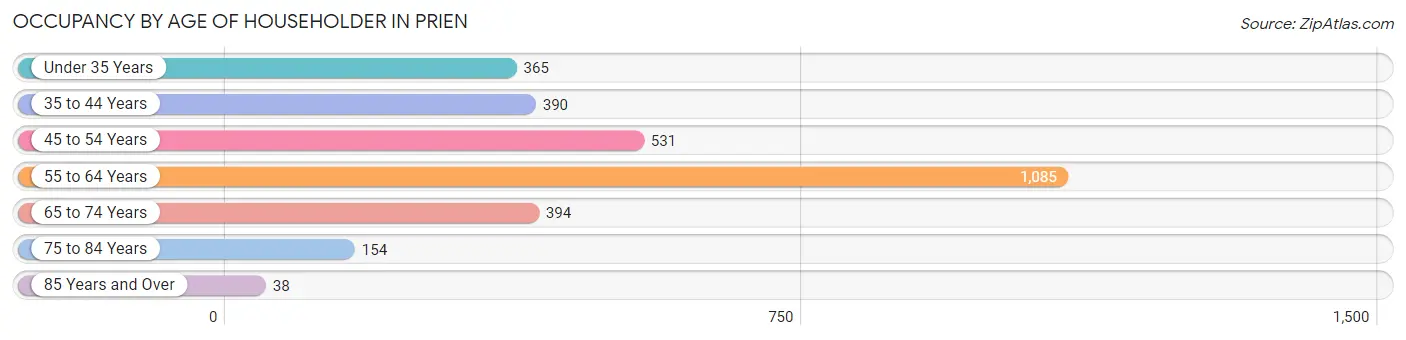
| Age Bracket | # Households | % Households |
| Under 35 Years | 365 | 12.3% |
| 35 to 44 Years | 390 | 13.2% |
| 45 to 54 Years | 531 | 18.0% |
| 55 to 64 Years | 1,085 | 36.7% |
| 65 to 74 Years | 394 | 13.3% |
| 75 to 84 Years | 154 | 5.2% |
| 85 Years and Over | 38 | 1.3% |
| Total | 2,957 | 100.0% |
Housing Finances in Prien
Median Income by Occupancy in Prien
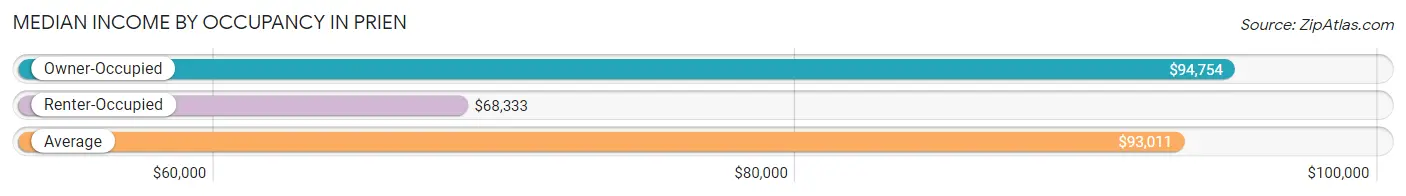
| Occupancy Type | # Households | Median Income |
| Owner-Occupied | 2,579 (87.2%) | $94,754 |
| Renter-Occupied | 378 (12.8%) | $68,333 |
| Average | 2,957 (100.0%) | $93,011 |
Occupancy by Householder Income Bracket in Prien
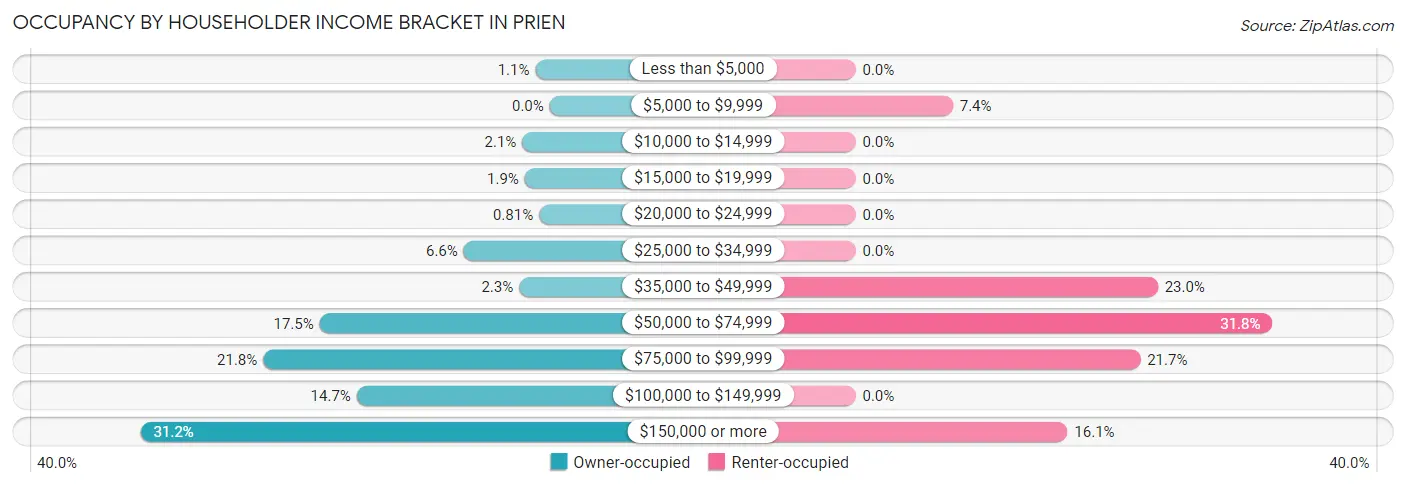
| Income Bracket | Owner-occupied | Renter-occupied |
| Less than $5,000 | 28 (1.1%) | 0 (0.0%) |
| $5,000 to $9,999 | 0 (0.0%) | 28 (7.4%) |
| $10,000 to $14,999 | 54 (2.1%) | 0 (0.0%) |
| $15,000 to $19,999 | 49 (1.9%) | 0 (0.0%) |
| $20,000 to $24,999 | 21 (0.8%) | 0 (0.0%) |
| $25,000 to $34,999 | 169 (6.6%) | 0 (0.0%) |
| $35,000 to $49,999 | 60 (2.3%) | 87 (23.0%) |
| $50,000 to $74,999 | 452 (17.5%) | 120 (31.8%) |
| $75,000 to $99,999 | 563 (21.8%) | 82 (21.7%) |
| $100,000 to $149,999 | 379 (14.7%) | 0 (0.0%) |
| $150,000 or more | 804 (31.2%) | 61 (16.1%) |
| Total | 2,579 (100.0%) | 378 (100.0%) |
Monthly Housing Cost Tiers in Prien
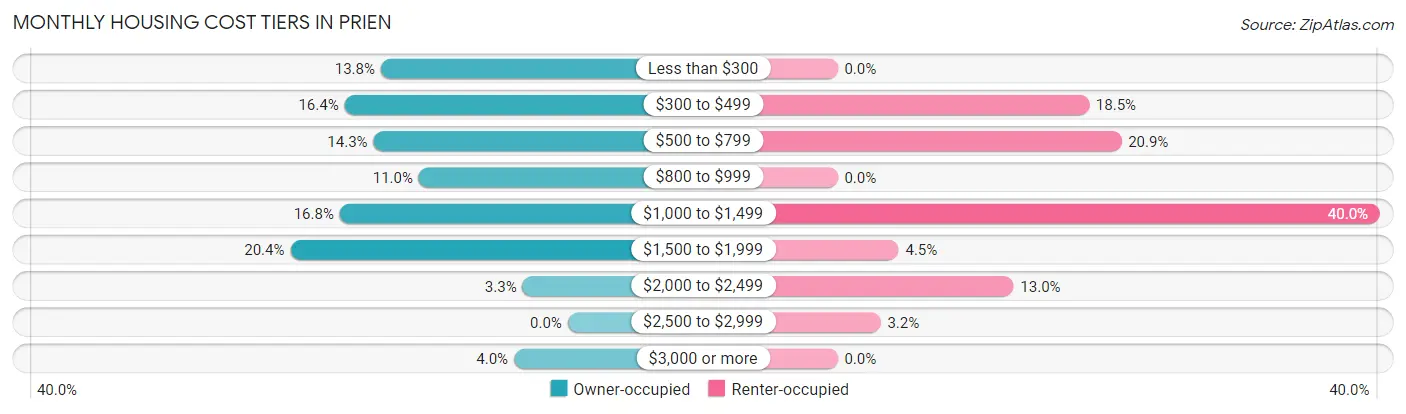
| Monthly Cost | Owner-occupied | Renter-occupied |
| Less than $300 | 355 (13.8%) | 0 (0.0%) |
| $300 to $499 | 424 (16.4%) | 70 (18.5%) |
| $500 to $799 | 369 (14.3%) | 79 (20.9%) |
| $800 to $999 | 283 (11.0%) | 0 (0.0%) |
| $1,000 to $1,499 | 433 (16.8%) | 151 (40.0%) |
| $1,500 to $1,999 | 527 (20.4%) | 17 (4.5%) |
| $2,000 to $2,499 | 86 (3.3%) | 49 (13.0%) |
| $2,500 to $2,999 | 0 (0.0%) | 12 (3.2%) |
| $3,000 or more | 102 (4.0%) | 0 (0.0%) |
| Total | 2,579 (100.0%) | 378 (100.0%) |
Physical Housing Characteristics in Prien
Housing Structures in Prien
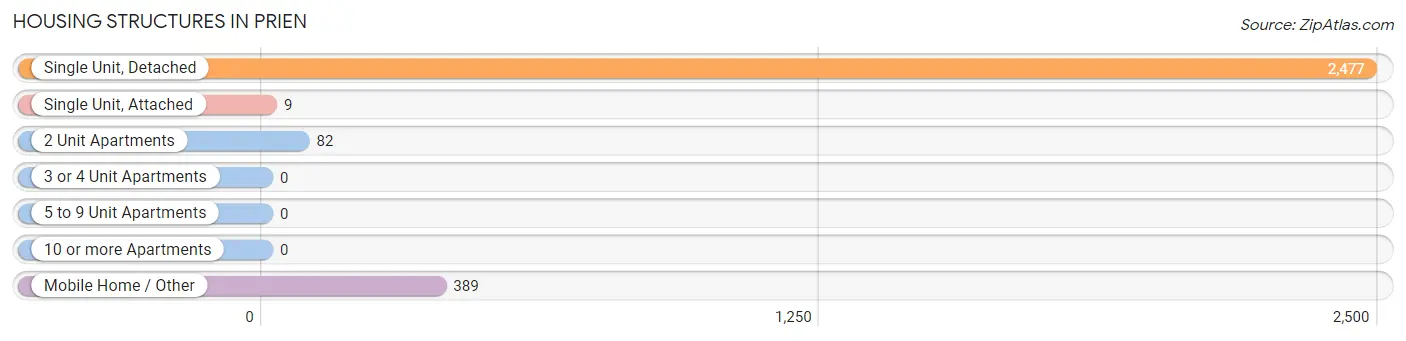
| Structure Type | # Housing Units | % Housing Units |
| Single Unit, Detached | 2,477 | 83.8% |
| Single Unit, Attached | 9 | 0.3% |
| 2 Unit Apartments | 82 | 2.8% |
| 3 or 4 Unit Apartments | 0 | 0.0% |
| 5 to 9 Unit Apartments | 0 | 0.0% |
| 10 or more Apartments | 0 | 0.0% |
| Mobile Home / Other | 389 | 13.2% |
| Total | 2,957 | 100.0% |
Housing Structures by Occupancy in Prien
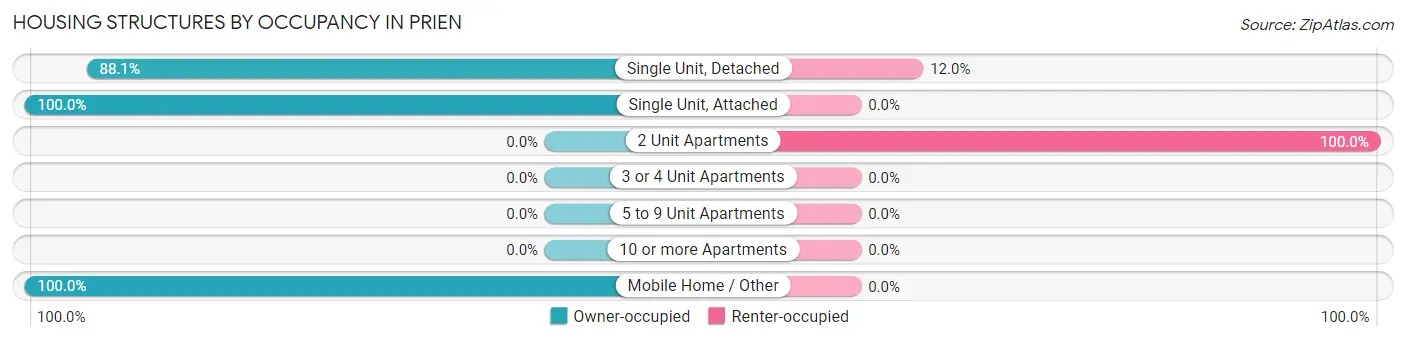
| Structure Type | Owner-occupied | Renter-occupied |
| Single Unit, Detached | 2,181 (88.0%) | 296 (11.9%) |
| Single Unit, Attached | 9 (100.0%) | 0 (0.0%) |
| 2 Unit Apartments | 0 (0.0%) | 82 (100.0%) |
| 3 or 4 Unit Apartments | 0 (0.0%) | 0 (0.0%) |
| 5 to 9 Unit Apartments | 0 (0.0%) | 0 (0.0%) |
| 10 or more Apartments | 0 (0.0%) | 0 (0.0%) |
| Mobile Home / Other | 389 (100.0%) | 0 (0.0%) |
| Total | 2,579 (87.2%) | 378 (12.8%) |
Housing Structures by Number of Rooms in Prien
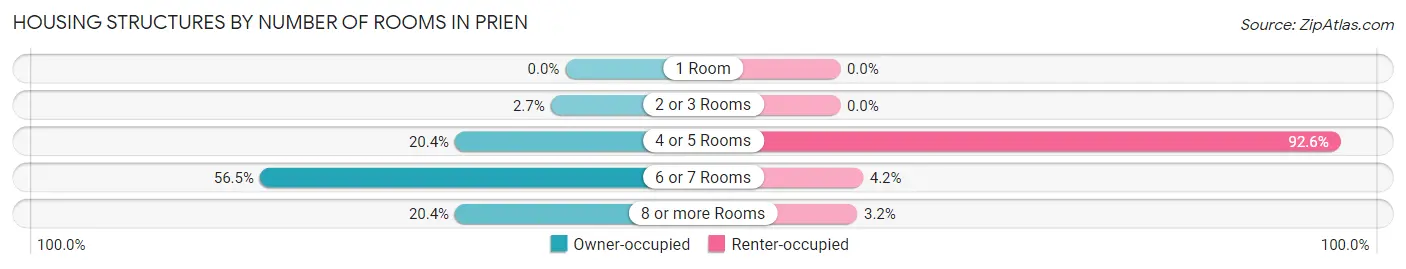
| Number of Rooms | Owner-occupied | Renter-occupied |
| 1 Room | 0 (0.0%) | 0 (0.0%) |
| 2 or 3 Rooms | 70 (2.7%) | 0 (0.0%) |
| 4 or 5 Rooms | 526 (20.4%) | 350 (92.6%) |
| 6 or 7 Rooms | 1,457 (56.5%) | 16 (4.2%) |
| 8 or more Rooms | 526 (20.4%) | 12 (3.2%) |
| Total | 2,579 (100.0%) | 378 (100.0%) |
Housing Structure by Heating Type in Prien
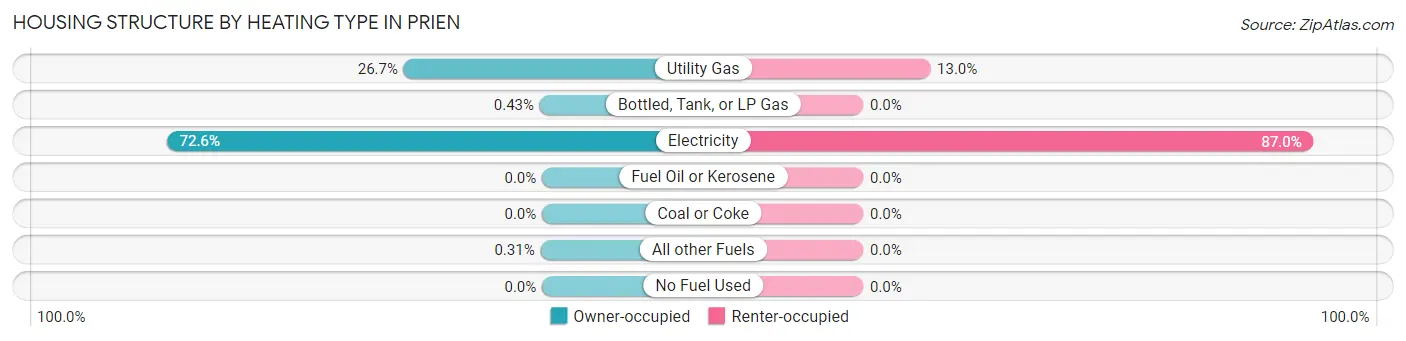
| Heating Type | Owner-occupied | Renter-occupied |
| Utility Gas | 689 (26.7%) | 49 (13.0%) |
| Bottled, Tank, or LP Gas | 11 (0.4%) | 0 (0.0%) |
| Electricity | 1,871 (72.6%) | 329 (87.0%) |
| Fuel Oil or Kerosene | 0 (0.0%) | 0 (0.0%) |
| Coal or Coke | 0 (0.0%) | 0 (0.0%) |
| All other Fuels | 8 (0.3%) | 0 (0.0%) |
| No Fuel Used | 0 (0.0%) | 0 (0.0%) |
| Total | 2,579 (100.0%) | 378 (100.0%) |
Household Vehicle Usage in Prien
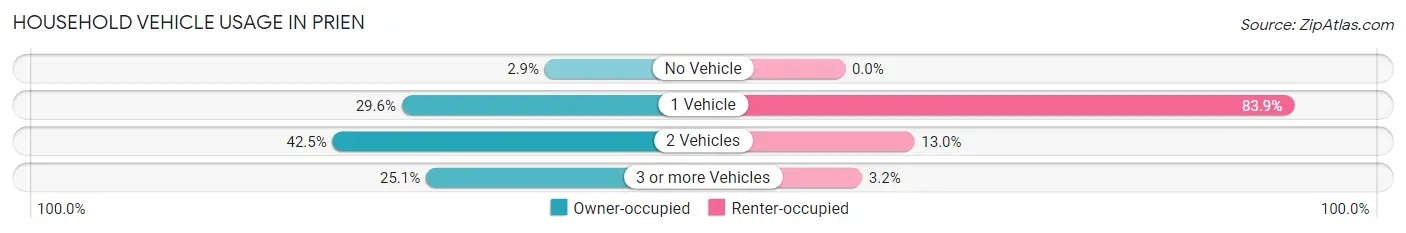
| Vehicles per Household | Owner-occupied | Renter-occupied |
| No Vehicle | 74 (2.9%) | 0 (0.0%) |
| 1 Vehicle | 763 (29.6%) | 317 (83.9%) |
| 2 Vehicles | 1,096 (42.5%) | 49 (13.0%) |
| 3 or more Vehicles | 646 (25.1%) | 12 (3.2%) |
| Total | 2,579 (100.0%) | 378 (100.0%) |
Real Estate & Mortgages in Prien
Real Estate and Mortgage Overview in Prien
| Characteristic | Without Mortgage | With Mortgage |
| Housing Units | 1,307 | 1,272 |
| Median Property Value | $258,400 | $272,200 |
| Median Household Income | $68,774 | $595 |
| Monthly Housing Costs | $448 | $102 |
| Real Estate Taxes | $1,707 | $74 |
Property Value by Mortgage Status in Prien
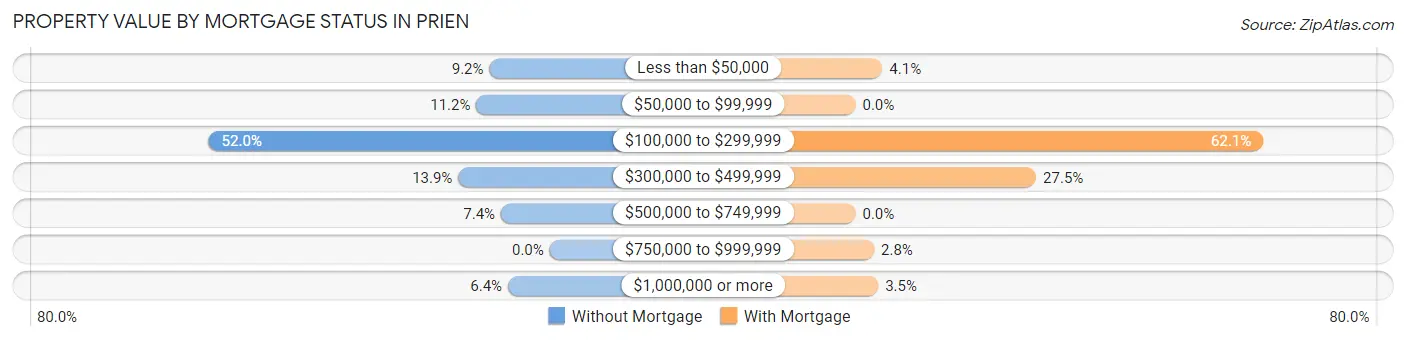
| Property Value | Without Mortgage | With Mortgage |
| Less than $50,000 | 120 (9.2%) | 52 (4.1%) |
| $50,000 to $99,999 | 146 (11.2%) | 0 (0.0%) |
| $100,000 to $299,999 | 679 (51.9%) | 790 (62.1%) |
| $300,000 to $499,999 | 182 (13.9%) | 350 (27.5%) |
| $500,000 to $749,999 | 97 (7.4%) | 0 (0.0%) |
| $750,000 to $999,999 | 0 (0.0%) | 36 (2.8%) |
| $1,000,000 or more | 83 (6.4%) | 44 (3.5%) |
| Total | 1,307 (100.0%) | 1,272 (100.0%) |
Household Income by Mortgage Status in Prien
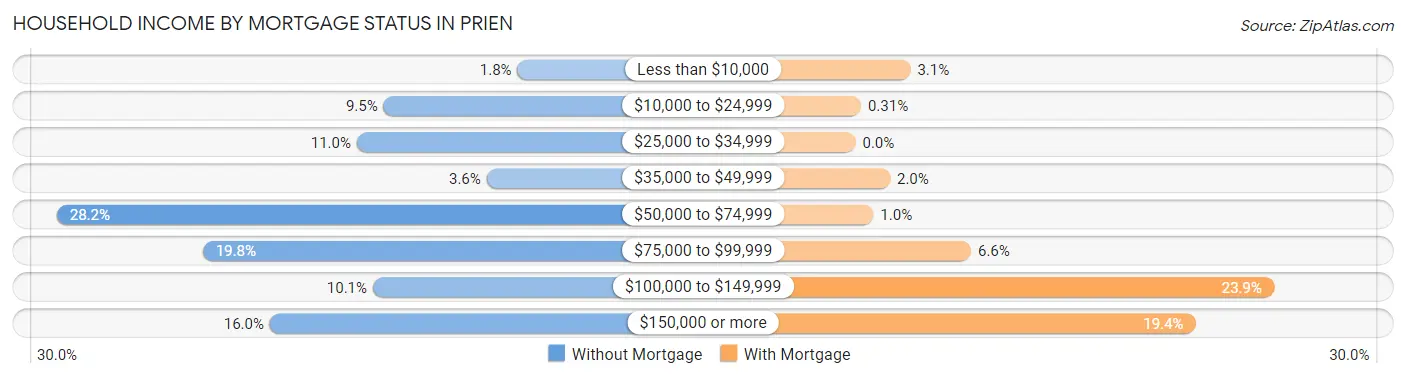
| Household Income | Without Mortgage | With Mortgage |
| Less than $10,000 | 24 (1.8%) | 40 (3.1%) |
| $10,000 to $24,999 | 124 (9.5%) | 4 (0.3%) |
| $25,000 to $34,999 | 144 (11.0%) | 0 (0.0%) |
| $35,000 to $49,999 | 47 (3.6%) | 25 (2.0%) |
| $50,000 to $74,999 | 368 (28.2%) | 13 (1.0%) |
| $75,000 to $99,999 | 259 (19.8%) | 84 (6.6%) |
| $100,000 to $149,999 | 132 (10.1%) | 304 (23.9%) |
| $150,000 or more | 209 (16.0%) | 247 (19.4%) |
| Total | 1,307 (100.0%) | 1,272 (100.0%) |
Property Value to Household Income Ratio in Prien
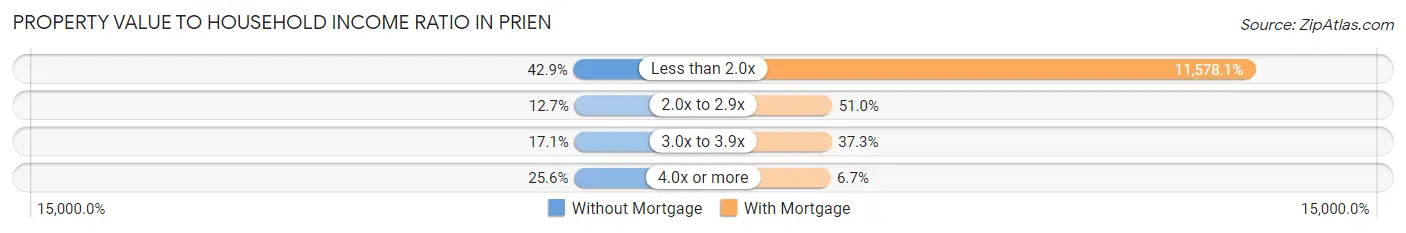
| Value-to-Income Ratio | Without Mortgage | With Mortgage |
| Less than 2.0x | 560 (42.8%) | 147,273 (11,578.1%) |
| 2.0x to 2.9x | 166 (12.7%) | 649 (51.0%) |
| 3.0x to 3.9x | 223 (17.1%) | 475 (37.3%) |
| 4.0x or more | 334 (25.6%) | 85 (6.7%) |
| Total | 1,307 (100.0%) | 1,272 (100.0%) |
Real Estate Taxes by Mortgage Status in Prien
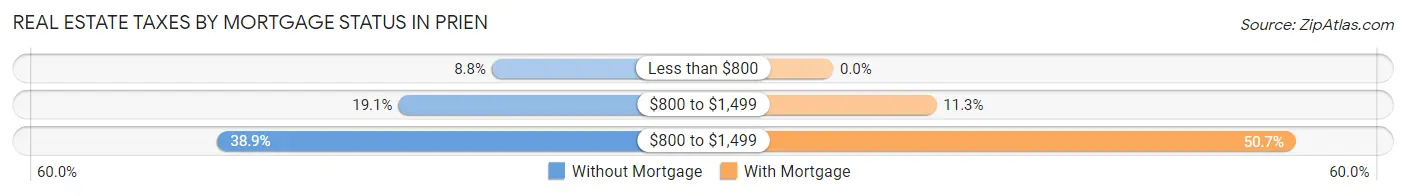
| Property Taxes | Without Mortgage | With Mortgage |
| Less than $800 | 115 (8.8%) | 0 (0.0%) |
| $800 to $1,499 | 249 (19.1%) | 144 (11.3%) |
| $800 to $1,499 | 508 (38.9%) | 645 (50.7%) |
| Total | 1,307 (100.0%) | 1,272 (100.0%) |
Health & Disability in Prien
Health Insurance Coverage by Age in Prien
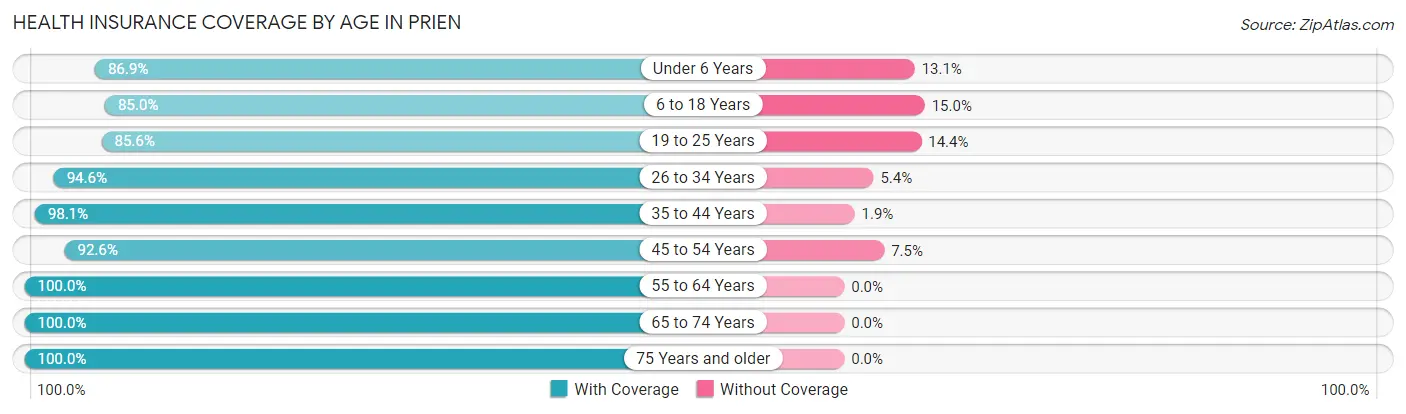
| Age Bracket | With Coverage | Without Coverage |
| Under 6 Years | 986 (86.9%) | 149 (13.1%) |
| 6 to 18 Years | 1,303 (85.0%) | 230 (15.0%) |
| 19 to 25 Years | 513 (85.6%) | 86 (14.4%) |
| 26 to 34 Years | 521 (94.6%) | 30 (5.4%) |
| 35 to 44 Years | 1,023 (98.1%) | 20 (1.9%) |
| 45 to 54 Years | 857 (92.5%) | 69 (7.4%) |
| 55 to 64 Years | 1,629 (100.0%) | 0 (0.0%) |
| 65 to 74 Years | 601 (100.0%) | 0 (0.0%) |
| 75 Years and older | 309 (100.0%) | 0 (0.0%) |
| Total | 7,742 (93.0%) | 584 (7.0%) |
Health Insurance Coverage by Citizenship Status in Prien
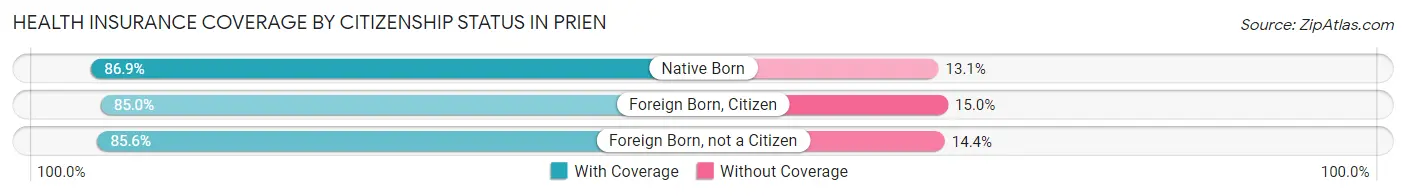
| Citizenship Status | With Coverage | Without Coverage |
| Native Born | 986 (86.9%) | 149 (13.1%) |
| Foreign Born, Citizen | 1,303 (85.0%) | 230 (15.0%) |
| Foreign Born, not a Citizen | 513 (85.6%) | 86 (14.4%) |
Health Insurance Coverage by Household Income in Prien
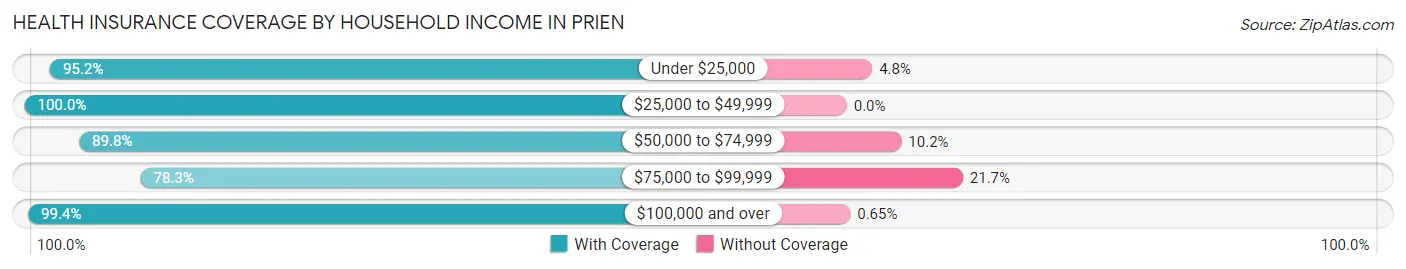
| Household Income | With Coverage | Without Coverage |
| Under $25,000 | 300 (95.2%) | 15 (4.8%) |
| $25,000 to $49,999 | 495 (100.0%) | 0 (0.0%) |
| $50,000 to $74,999 | 1,229 (89.8%) | 140 (10.2%) |
| $75,000 to $99,999 | 1,436 (78.3%) | 399 (21.7%) |
| $100,000 and over | 4,279 (99.4%) | 28 (0.6%) |
Public vs Private Health Insurance Coverage by Age in Prien
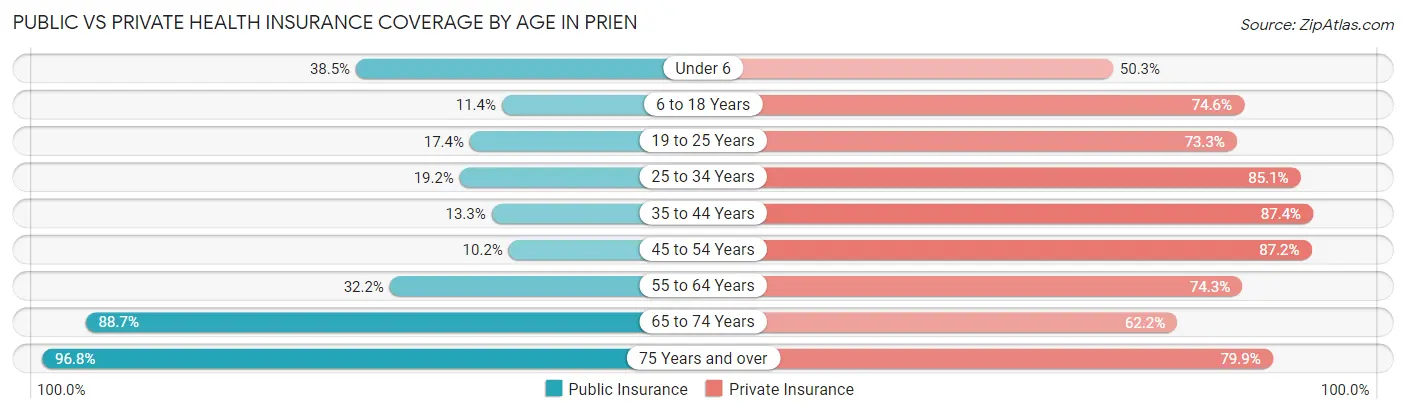
| Age Bracket | Public Insurance | Private Insurance |
| Under 6 | 437 (38.5%) | 571 (50.3%) |
| 6 to 18 Years | 175 (11.4%) | 1,144 (74.6%) |
| 19 to 25 Years | 104 (17.4%) | 439 (73.3%) |
| 25 to 34 Years | 106 (19.2%) | 469 (85.1%) |
| 35 to 44 Years | 139 (13.3%) | 912 (87.4%) |
| 45 to 54 Years | 94 (10.2%) | 807 (87.2%) |
| 55 to 64 Years | 525 (32.2%) | 1,210 (74.3%) |
| 65 to 74 Years | 533 (88.7%) | 374 (62.2%) |
| 75 Years and over | 299 (96.8%) | 247 (79.9%) |
| Total | 2,412 (29.0%) | 6,173 (74.1%) |
Disability Status by Sex by Age in Prien
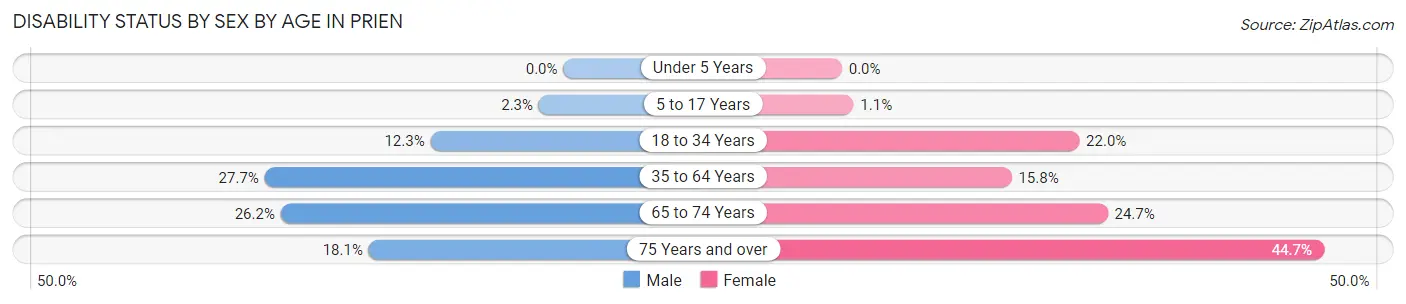
| Age Bracket | Male | Female |
| Under 5 Years | 0 (0.0%) | 0 (0.0%) |
| 5 to 17 Years | 20 (2.3%) | 9 (1.1%) |
| 18 to 34 Years | 74 (12.3%) | 130 (22.0%) |
| 35 to 64 Years | 464 (27.7%) | 303 (15.8%) |
| 65 to 74 Years | 80 (26.2%) | 73 (24.7%) |
| 75 Years and over | 13 (18.1%) | 106 (44.7%) |
Disability Class by Sex by Age in Prien
Disability Class: Hearing Difficulty
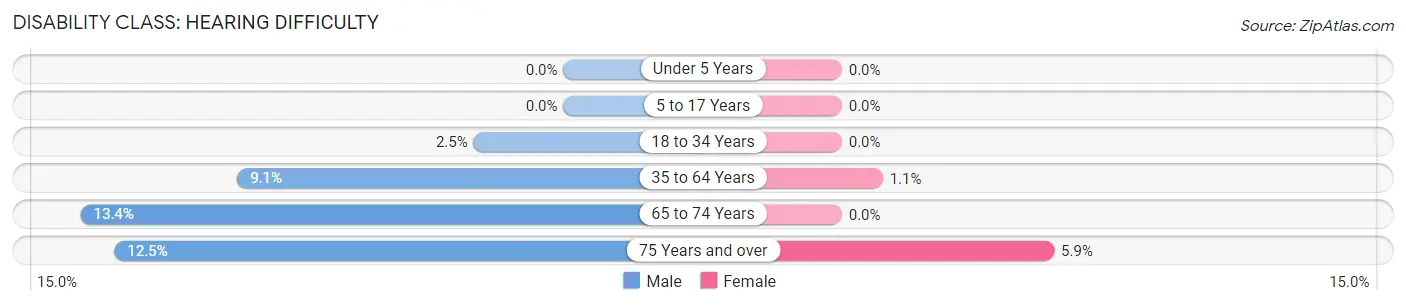
| Age Bracket | Male | Female |
| Under 5 Years | 0 (0.0%) | 0 (0.0%) |
| 5 to 17 Years | 0 (0.0%) | 0 (0.0%) |
| 18 to 34 Years | 15 (2.5%) | 0 (0.0%) |
| 35 to 64 Years | 152 (9.1%) | 22 (1.1%) |
| 65 to 74 Years | 41 (13.4%) | 0 (0.0%) |
| 75 Years and over | 9 (12.5%) | 14 (5.9%) |
Disability Class: Vision Difficulty
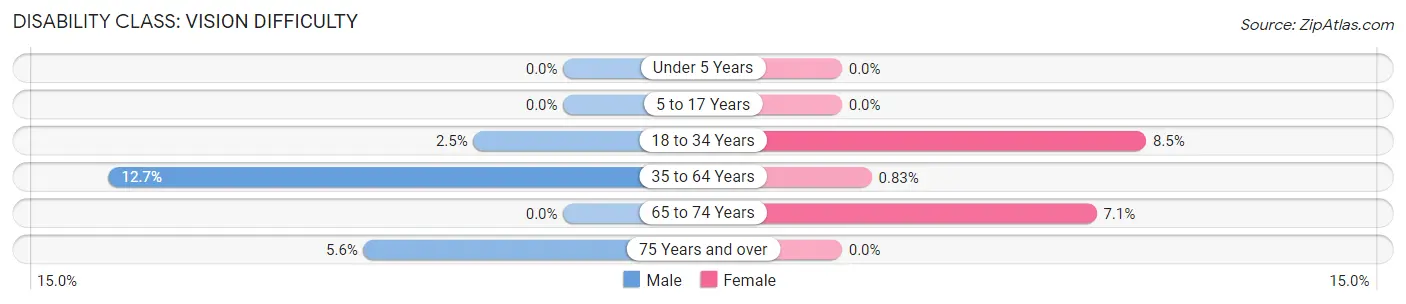
| Age Bracket | Male | Female |
| Under 5 Years | 0 (0.0%) | 0 (0.0%) |
| 5 to 17 Years | 0 (0.0%) | 0 (0.0%) |
| 18 to 34 Years | 15 (2.5%) | 50 (8.5%) |
| 35 to 64 Years | 212 (12.7%) | 16 (0.8%) |
| 65 to 74 Years | 0 (0.0%) | 21 (7.1%) |
| 75 Years and over | 4 (5.6%) | 0 (0.0%) |
Disability Class: Cognitive Difficulty
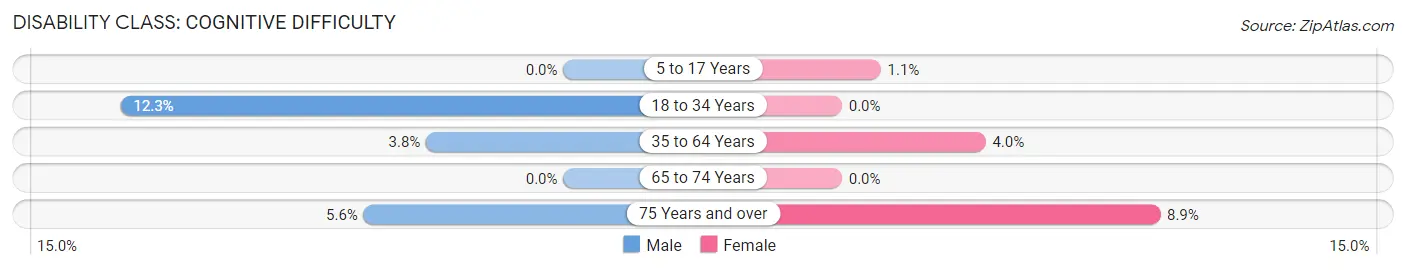
| Age Bracket | Male | Female |
| 5 to 17 Years | 0 (0.0%) | 9 (1.1%) |
| 18 to 34 Years | 74 (12.3%) | 0 (0.0%) |
| 35 to 64 Years | 64 (3.8%) | 77 (4.0%) |
| 65 to 74 Years | 0 (0.0%) | 0 (0.0%) |
| 75 Years and over | 4 (5.6%) | 21 (8.9%) |
Disability Class: Ambulatory Difficulty
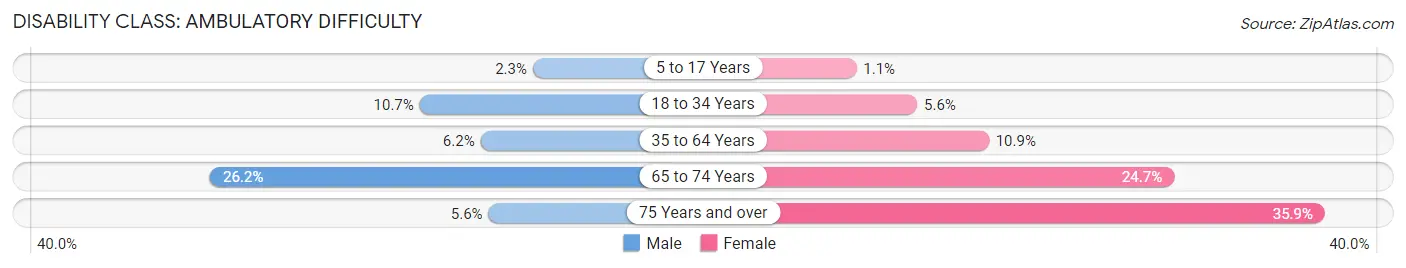
| Age Bracket | Male | Female |
| 5 to 17 Years | 20 (2.3%) | 9 (1.1%) |
| 18 to 34 Years | 64 (10.7%) | 33 (5.6%) |
| 35 to 64 Years | 103 (6.1%) | 210 (10.9%) |
| 65 to 74 Years | 80 (26.2%) | 73 (24.7%) |
| 75 Years and over | 4 (5.6%) | 85 (35.9%) |
Disability Class: Self-Care Difficulty
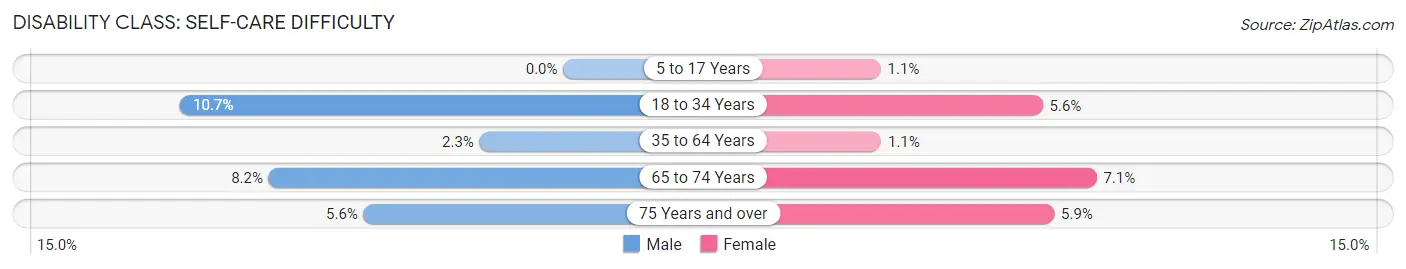
| Age Bracket | Male | Female |
| 5 to 17 Years | 0 (0.0%) | 9 (1.1%) |
| 18 to 34 Years | 64 (10.7%) | 33 (5.6%) |
| 35 to 64 Years | 39 (2.3%) | 21 (1.1%) |
| 65 to 74 Years | 25 (8.2%) | 21 (7.1%) |
| 75 Years and over | 4 (5.6%) | 14 (5.9%) |
Technology Access in Prien
Computing Device Access in Prien
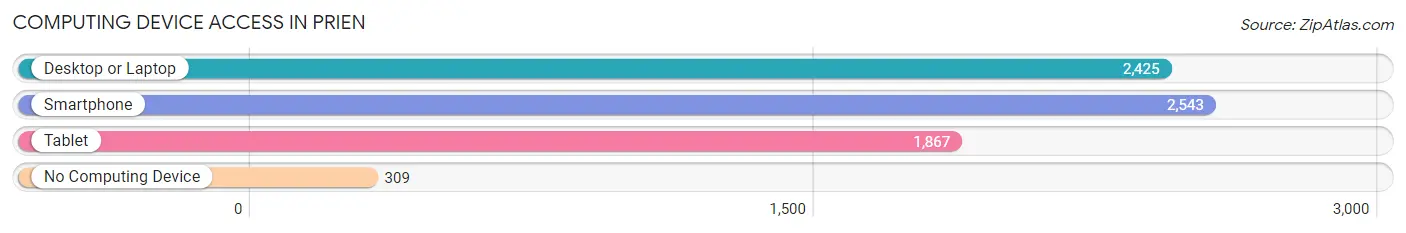
| Device Type | # Households | % Households |
| Desktop or Laptop | 2,425 | 82.0% |
| Smartphone | 2,543 | 86.0% |
| Tablet | 1,867 | 63.1% |
| No Computing Device | 309 | 10.4% |
| Total | 2,957 | 100.0% |
Internet Access in Prien
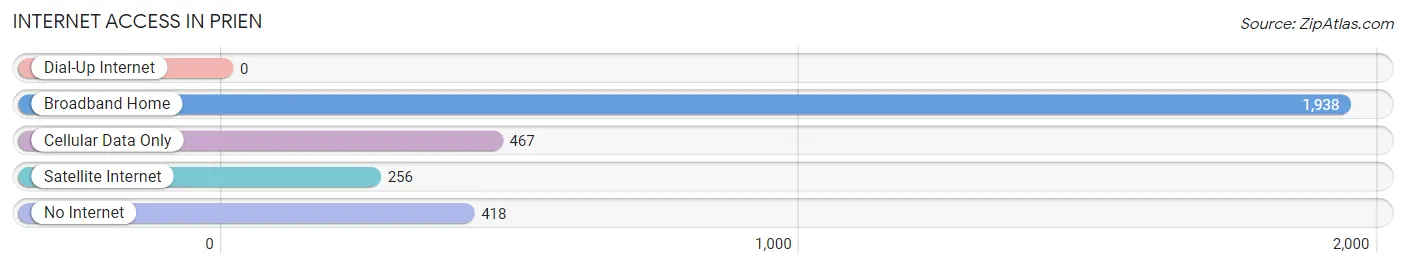
| Internet Type | # Households | % Households |
| Dial-Up Internet | 0 | 0.0% |
| Broadband Home | 1,938 | 65.5% |
| Cellular Data Only | 467 | 15.8% |
| Satellite Internet | 256 | 8.7% |
| No Internet | 418 | 14.1% |
| Total | 2,957 | 100.0% |
Prien Summary
Prien is a small unincorporated community located in Calcasieu Parish, Louisiana. It is situated on the western shore of Lake Charles, approximately 10 miles south of the city of Lake Charles. The population of Prien was estimated to be 1,845 in the year 2000.
Geography
Prien is located in the southwestern corner of Calcasieu Parish, Louisiana. It is situated on the western shore of Lake Charles, approximately 10 miles south of the city of Lake Charles. The community is bordered by the cities of Sulphur and Westlake to the north, and the towns of Carlyss and Grand Lake to the south. The terrain of the area is generally flat, with some rolling hills in the northern part of the community. The climate is humid subtropical, with hot, humid summers and mild winters.
Economy
The economy of Prien is largely based on the oil and gas industry. The area is home to several oil and gas production facilities, as well as a number of related businesses. The community is also home to a number of small businesses, including restaurants, retail stores, and service providers.
Demographics
As of the 2000 census, the population of Prien was 1,845. The racial makeup of the community was 79.2% White, 17.3% African American, 0.7% Native American, 0.4% Asian, 0.1% Pacific Islander, 0.7% from other races, and 1.6% from two or more races. Hispanic or Latino of any race were 2.2% of the population.
The median income for a household in Prien was $37,917, and the median income for a family was $45,000. The per capita income for the community was $18,945. About 11.2% of families and 13.2% of the population were below the poverty line, including 17.2% of those under age 18 and 8.2% of those age 65 or over.
Education
Prien is served by the Calcasieu Parish School District. The community is home to Prien Lake Elementary School, which serves students in grades K-5. The nearest middle school and high school are located in the nearby city of Sulphur.
Conclusion
Prien is a small unincorporated community located in Calcasieu Parish, Louisiana. It is situated on the western shore of Lake Charles, approximately 10 miles south of the city of Lake Charles. The population of Prien was estimated to be 1,845 in the year 2000. The economy of Prien is largely based on the oil and gas industry, and the community is also home to a number of small businesses. The racial makeup of the community was 79.2% White, 17.3% African American, 0.7% Native American, 0.4% Asian, 0.1% Pacific Islander, 0.7% from other races, and 1.6% from two or more races. The median income for a household in Prien was $37,917, and the median income for a family was $45,000. Prien is served by the Calcasieu Parish School District, and is home to Prien Lake Elementary School.
Common Questions
What is Per Capita Income in Prien?
Per Capita income in Prien is $42,591.
What is the Median Family Income in Prien?
Median Family Income in Prien is $102,436.
What is the Median Household income in Prien?
Median Household Income in Prien is $93,011.
What is Income or Wage Gap in Prien?
Income or Wage Gap in Prien is 42.7%.
Women in Prien earn 57.3 cents for every dollar earned by a man.
What is Inequality or Gini Index in Prien?
Inequality or Gini Index in Prien is 0.40.
What is the Total Population of Prien?
Total Population of Prien is 8,326.
What is the Total Male Population of Prien?
Total Male Population of Prien is 4,004.
What is the Total Female Population of Prien?
Total Female Population of Prien is 4,322.
What is the Ratio of Males per 100 Females in Prien?
There are 92.64 Males per 100 Females in Prien.
What is the Ratio of Females per 100 Males in Prien?
There are 107.94 Females per 100 Males in Prien.
What is the Median Population Age in Prien?
Median Population Age in Prien is 37.0 Years.
What is the Average Family Size in Prien
Average Family Size in Prien is 3.3 People.
What is the Average Household Size in Prien
Average Household Size in Prien is 2.8 People.
How Large is the Labor Force in Prien?
There are 4,222 People in the Labor Forcein in Prien.
What is the Percentage of People in the Labor Force in Prien?
71.2% of People are in the Labor Force in Prien.
What is the Unemployment Rate in Prien?
Unemployment Rate in Prien is 6.5%.