Progress Village, FL Map & Demographics
Progress Village Map
Progress Village Overview
$37,685
PER CAPITA INCOME
$79,978
AVG FAMILY INCOME
$77,677
AVG HOUSEHOLD INCOME
14.3%
WAGE / INCOME GAP [ % ]
85.7¢/ $1
WAGE / INCOME GAP [ $ ]
0.38
INEQUALITY / GINI INDEX
10,096
TOTAL POPULATION
4,230
MALE POPULATION
5,866
FEMALE POPULATION
72.11
MALES / 100 FEMALES
138.68
FEMALES / 100 MALES
33.9
MEDIAN AGE
3.0
AVG FAMILY SIZE
2.3
AVG HOUSEHOLD SIZE
6,239
LABOR FORCE [ PEOPLE ]
76.2%
PERCENT IN LABOR FORCE
1.5%
UNEMPLOYMENT RATE
Income in Progress Village
Income Overview in Progress Village
Per Capita Income in Progress Village is $37,685, while median incomes of families and households are $79,978 and $77,677 respectively.
| Characteristic | Number | Measure |
| Per Capita Income | 10,096 | $37,685 |
| Median Family Income | 2,509 | $79,978 |
| Mean Family Income | 2,509 | $92,079 |
| Median Household Income | 4,326 | $77,677 |
| Mean Household Income | 4,326 | $84,486 |
| Income Deficit | 2,509 | $0 |
| Wage / Income Gap (%) | 10,096 | 14.27% |
| Wage / Income Gap ($) | 10,096 | 85.73¢ per $1 |
| Gini / Inequality Index | 10,096 | 0.38 |
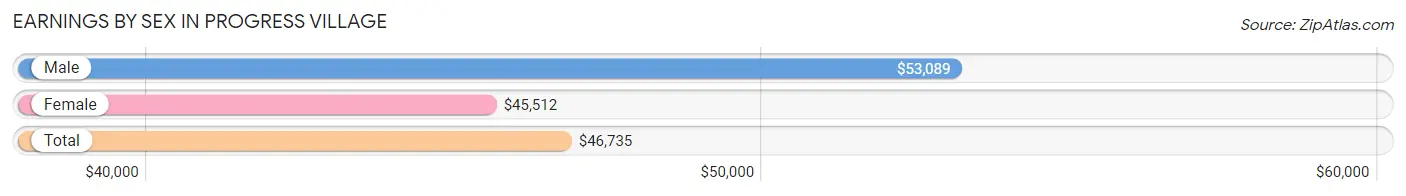
Earnings by Sex in Progress Village
Average Earnings in Progress Village are $46,735, $53,089 for men and $45,512 for women, a difference of 14.3%.
| Sex | Number | Average Earnings |
| Male | 2,701 (42.0%) | $53,089 |
| Female | 3,728 (58.0%) | $45,512 |
| Total | 6,429 (100.0%) | $46,735 |
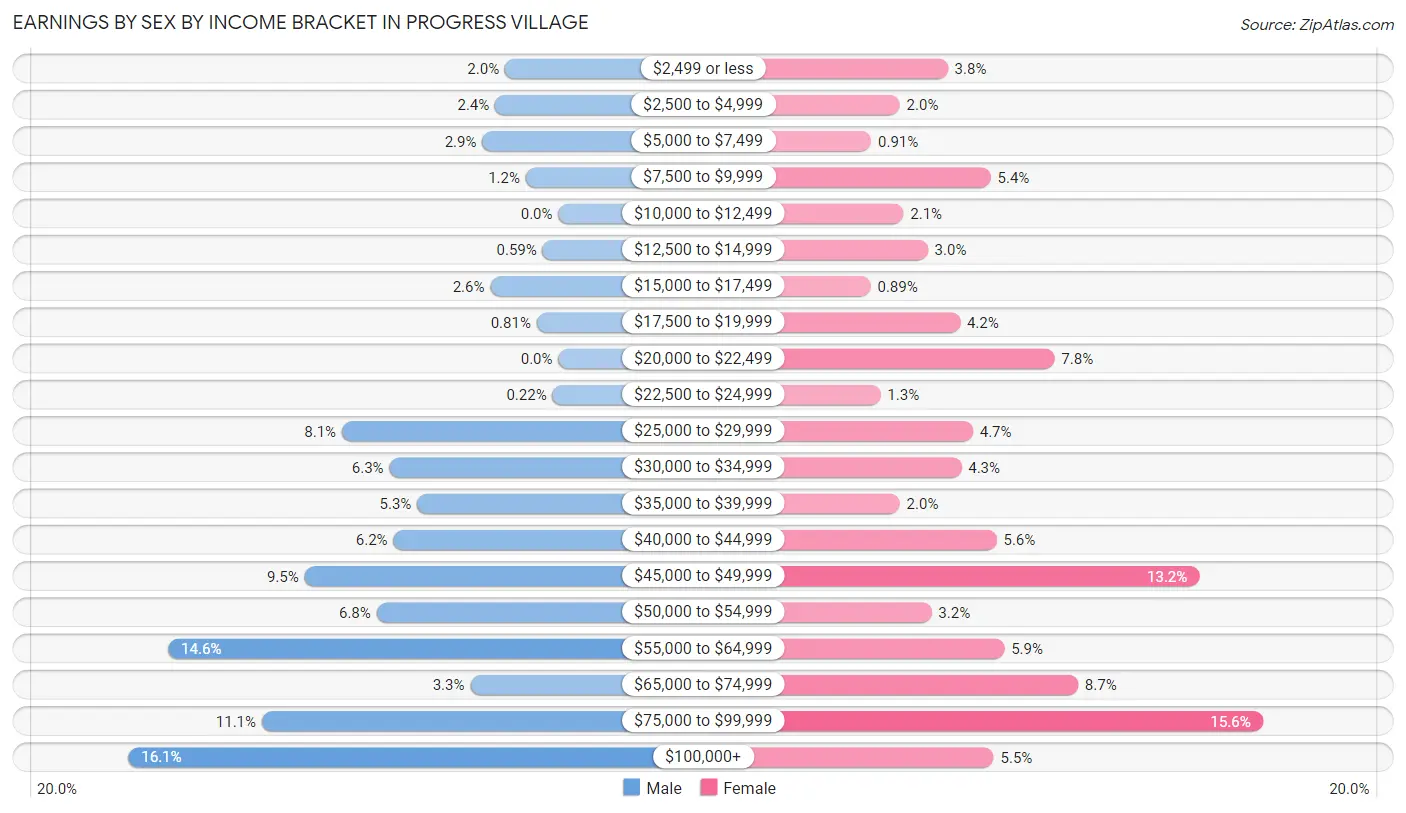
Earnings by Sex by Income Bracket in Progress Village
The most common earnings brackets in Progress Village are $100,000+ for men (435 | 16.1%) and $75,000 to $99,999 for women (581 | 15.6%).
| Income | Male | Female |
| $2,499 or less | 54 (2.0%) | 141 (3.8%) |
| $2,500 to $4,999 | 64 (2.4%) | 74 (2.0%) |
| $5,000 to $7,499 | 77 (2.9%) | 34 (0.9%) |
| $7,500 to $9,999 | 33 (1.2%) | 201 (5.4%) |
| $10,000 to $12,499 | 0 (0.0%) | 79 (2.1%) |
| $12,500 to $14,999 | 16 (0.6%) | 113 (3.0%) |
| $15,000 to $17,499 | 69 (2.5%) | 33 (0.9%) |
| $17,500 to $19,999 | 22 (0.8%) | 158 (4.2%) |
| $20,000 to $22,499 | 0 (0.0%) | 290 (7.8%) |
| $22,500 to $24,999 | 6 (0.2%) | 47 (1.3%) |
| $25,000 to $29,999 | 219 (8.1%) | 176 (4.7%) |
| $30,000 to $34,999 | 171 (6.3%) | 160 (4.3%) |
| $35,000 to $39,999 | 143 (5.3%) | 74 (2.0%) |
| $40,000 to $44,999 | 167 (6.2%) | 209 (5.6%) |
| $45,000 to $49,999 | 257 (9.5%) | 492 (13.2%) |
| $50,000 to $54,999 | 184 (6.8%) | 118 (3.2%) |
| $55,000 to $64,999 | 395 (14.6%) | 220 (5.9%) |
| $65,000 to $74,999 | 89 (3.3%) | 323 (8.7%) |
| $75,000 to $99,999 | 300 (11.1%) | 581 (15.6%) |
| $100,000+ | 435 (16.1%) | 205 (5.5%) |
| Total | 2,701 (100.0%) | 3,728 (100.0%) |
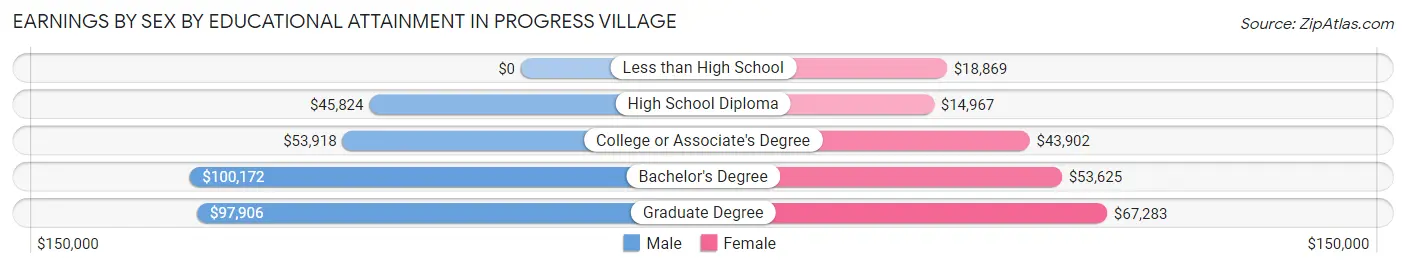
Earnings by Sex by Educational Attainment in Progress Village
Average earnings in Progress Village are $55,266 for men and $46,380 for women, a difference of 16.1%. Men with an educational attainment of bachelor's degree enjoy the highest average annual earnings of $100,172, while those with high school diploma education earn the least with $45,824. Women with an educational attainment of graduate degree earn the most with the average annual earnings of $67,283, while those with high school diploma education have the smallest earnings of $14,967.
| Educational Attainment | Male Income | Female Income |
| Less than High School | - | - |
| High School Diploma | $45,824 | $14,967 |
| College or Associate's Degree | $53,918 | $43,902 |
| Bachelor's Degree | $100,172 | $53,625 |
| Graduate Degree | $97,906 | $67,283 |
| Total | $55,266 | $46,380 |
Family Income in Progress Village
Family Income Brackets in Progress Village
According to the Progress Village family income data, there are 575 families falling into the $100,000 to $149,999 income range, which is the most common income bracket and makes up 22.9% of all families. Conversely, the $10,000 to $14,999 income bracket is the least frequent group with only 18 families (0.7%) belonging to this category.
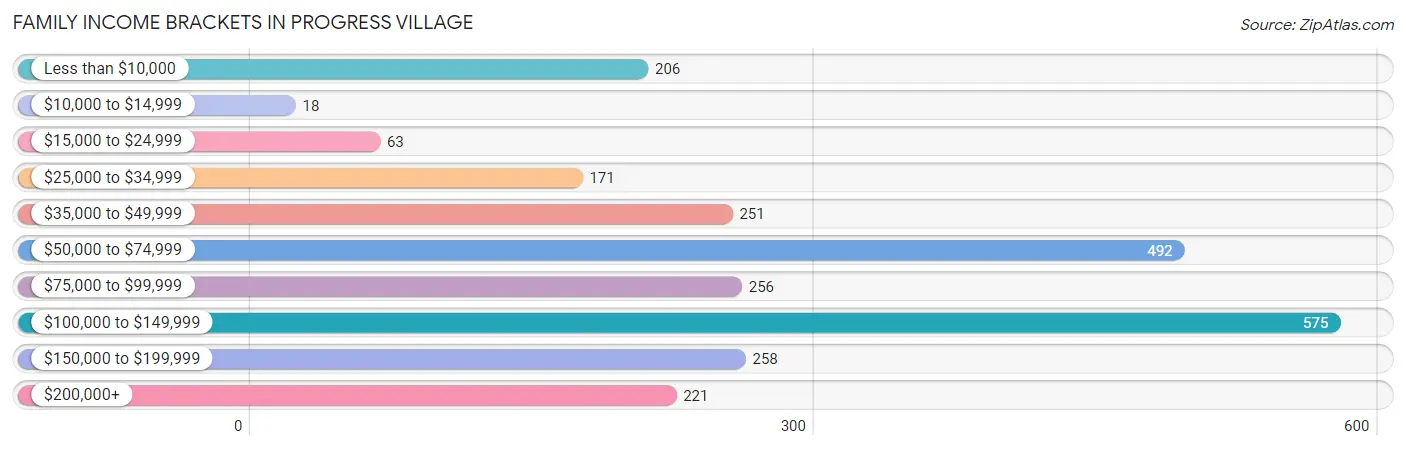
| Income Bracket | # Families | % Families |
| Less than $10,000 | 206 | 8.2% |
| $10,000 to $14,999 | 18 | 0.7% |
| $15,000 to $24,999 | 63 | 2.5% |
| $25,000 to $34,999 | 171 | 6.8% |
| $35,000 to $49,999 | 251 | 10.0% |
| $50,000 to $74,999 | 492 | 19.6% |
| $75,000 to $99,999 | 256 | 10.2% |
| $100,000 to $149,999 | 575 | 22.9% |
| $150,000 to $199,999 | 258 | 10.3% |
| $200,000+ | 221 | 8.8% |
Family Income by Famaliy Size in Progress Village
4-person families (365 | 14.5%) account for the highest median family income in Progress Village with $104,792 per family, while 2-person families (1,275 | 50.8%) have the highest median income of $34,125 per family member.
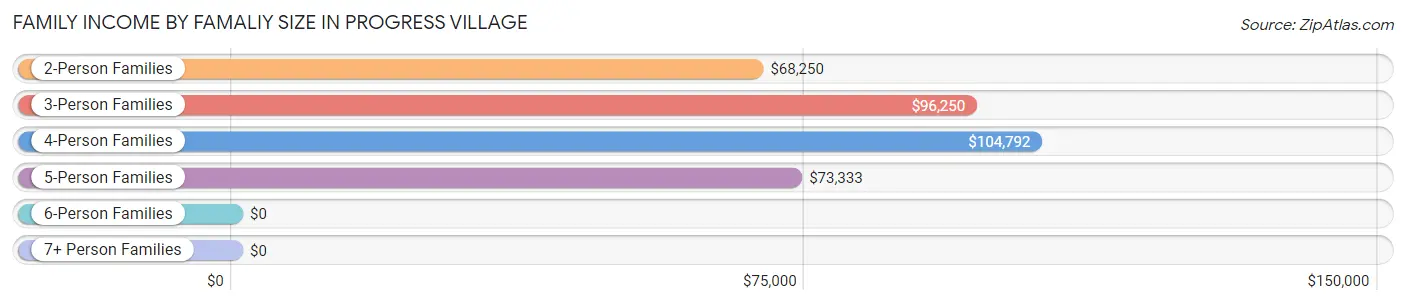
| Income Bracket | # Families | Median Income |
| 2-Person Families | 1,275 (50.8%) | $68,250 |
| 3-Person Families | 708 (28.2%) | $96,250 |
| 4-Person Families | 365 (14.5%) | $104,792 |
| 5-Person Families | 76 (3.0%) | $73,333 |
| 6-Person Families | 71 (2.8%) | $0 |
| 7+ Person Families | 14 (0.6%) | $0 |
| Total | 2,509 (100.0%) | $79,978 |
Family Income by Number of Earners in Progress Village
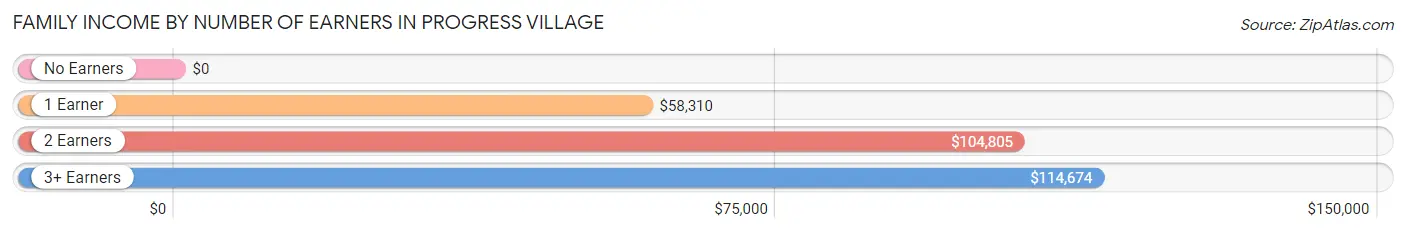
| Number of Earners | # Families | Median Income |
| No Earners | 165 (6.6%) | $0 |
| 1 Earner | 925 (36.9%) | $58,310 |
| 2 Earners | 1,225 (48.8%) | $104,805 |
| 3+ Earners | 194 (7.7%) | $114,674 |
| Total | 2,509 (100.0%) | $79,978 |
Household Income in Progress Village
Household Income Brackets in Progress Village
With 908 households falling in the category, the $100,000 to $149,999 income range is the most frequent in Progress Village, accounting for 21.0% of all households. In contrast, only 35 households (0.8%) fall into the $10,000 to $14,999 income bracket, making it the least populous group.
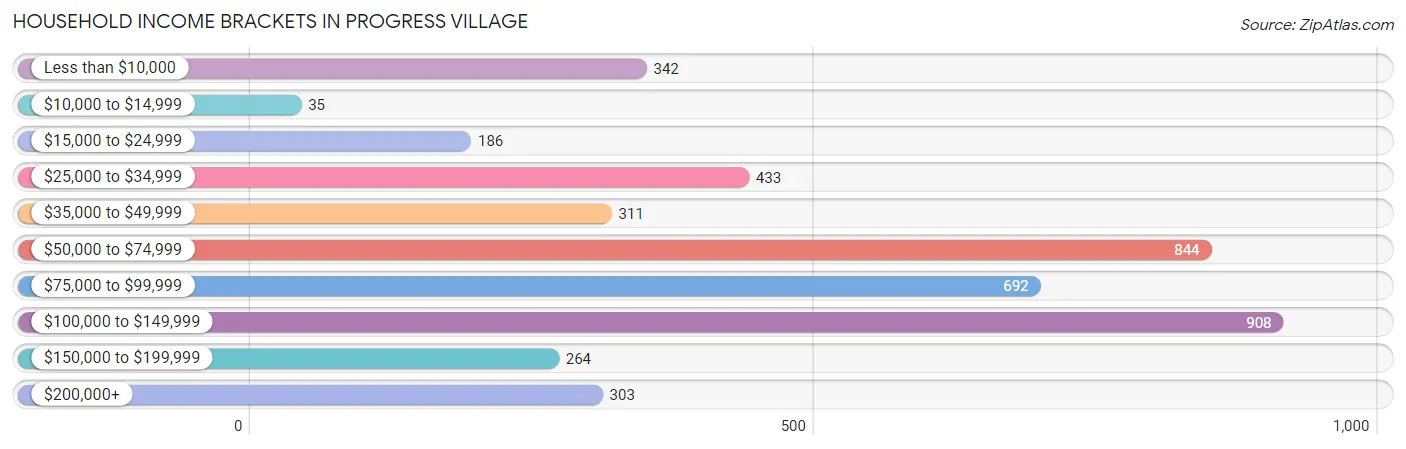
| Income Bracket | # Households | % Households |
| Less than $10,000 | 342 | 7.9% |
| $10,000 to $14,999 | 35 | 0.8% |
| $15,000 to $24,999 | 186 | 4.3% |
| $25,000 to $34,999 | 433 | 10.0% |
| $35,000 to $49,999 | 311 | 7.2% |
| $50,000 to $74,999 | 844 | 19.5% |
| $75,000 to $99,999 | 692 | 16.0% |
| $100,000 to $149,999 | 908 | 21.0% |
| $150,000 to $199,999 | 264 | 6.1% |
| $200,000+ | 303 | 7.0% |
Household Income by Householder Age in Progress Village
The median household income in Progress Village is $77,677, with the highest median household income of $104,360 found in the 25 to 44 years age bracket for the primary householder. A total of 1,956 households (45.2%) fall into this category. Meanwhile, the 65+ years age bracket for the primary householder has the lowest median household income of $31,933, with 578 households (13.4%) in this group.
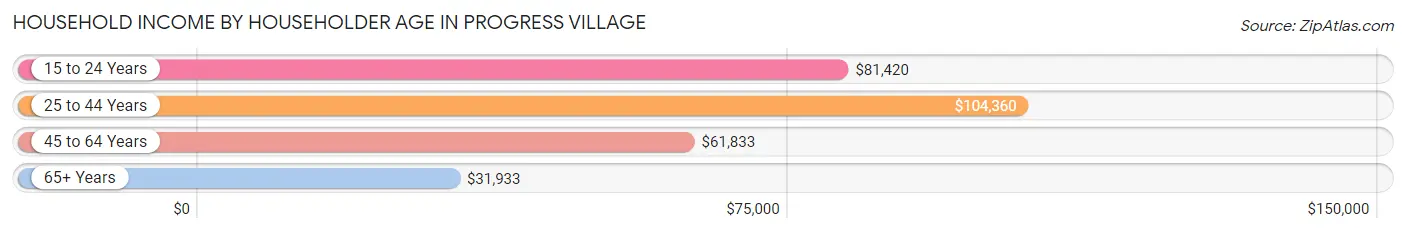
| Income Bracket | # Households | Median Income |
| 15 to 24 Years | 176 (4.1%) | $81,420 |
| 25 to 44 Years | 1,956 (45.2%) | $104,360 |
| 45 to 64 Years | 1,616 (37.4%) | $61,833 |
| 65+ Years | 578 (13.4%) | $31,933 |
| Total | 4,326 (100.0%) | $77,677 |
Poverty in Progress Village
Income Below Poverty by Sex and Age in Progress Village
With 8.0% poverty level for males and 17.7% for females among the residents of Progress Village, 6 to 11 year old males and 15 year old females are the most vulnerable to poverty, with 173 males (44.3%) and 17 females (100.0%) in their respective age groups living below the poverty level.
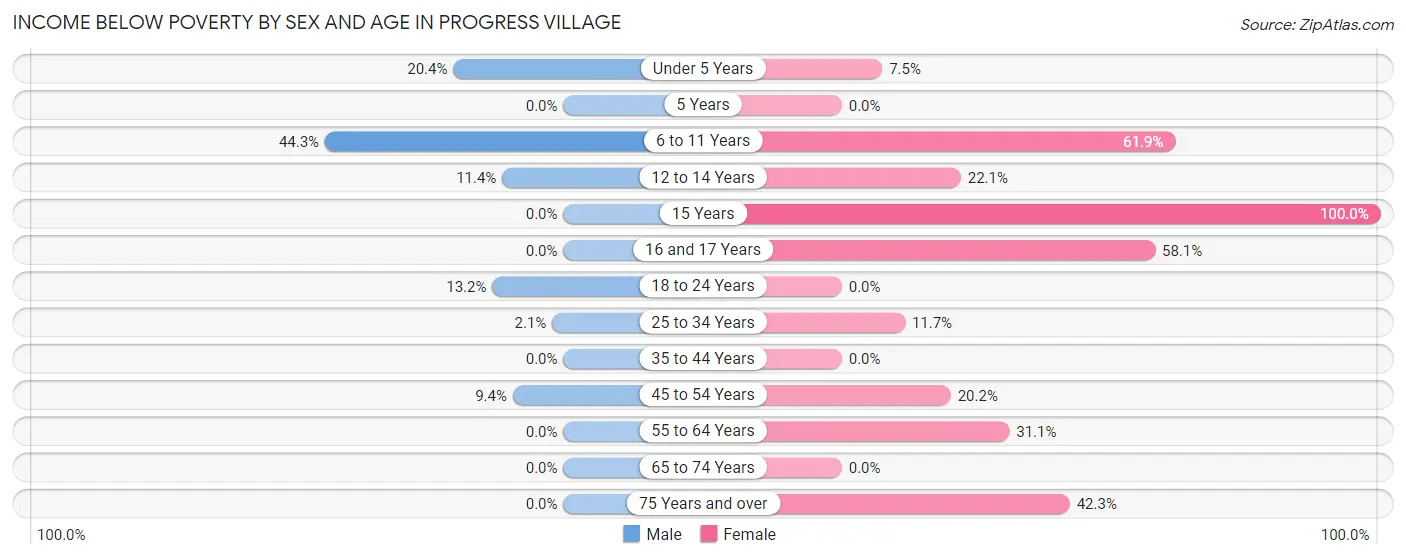
| Age Bracket | Male | Female |
| Under 5 Years | 38 (20.4%) | 44 (7.5%) |
| 5 Years | 0 (0.0%) | 0 (0.0%) |
| 6 to 11 Years | 173 (44.3%) | 203 (61.9%) |
| 12 to 14 Years | 16 (11.4%) | 36 (22.1%) |
| 15 Years | 0 (0.0%) | 17 (100.0%) |
| 16 and 17 Years | 0 (0.0%) | 75 (58.1%) |
| 18 to 24 Years | 36 (13.2%) | 0 (0.0%) |
| 25 to 34 Years | 20 (2.1%) | 183 (11.7%) |
| 35 to 44 Years | 0 (0.0%) | 0 (0.0%) |
| 45 to 54 Years | 57 (9.4%) | 182 (20.2%) |
| 55 to 64 Years | 0 (0.0%) | 208 (31.1%) |
| 65 to 74 Years | 0 (0.0%) | 0 (0.0%) |
| 75 Years and over | 0 (0.0%) | 88 (42.3%) |
| Total | 340 (8.0%) | 1,036 (17.7%) |
Income Above Poverty by Sex and Age in Progress Village
According to the poverty statistics in Progress Village, males aged 5 years and females aged 5 years are the age groups that are most secure financially, with 100.0% of males and 100.0% of females in these age groups living above the poverty line.
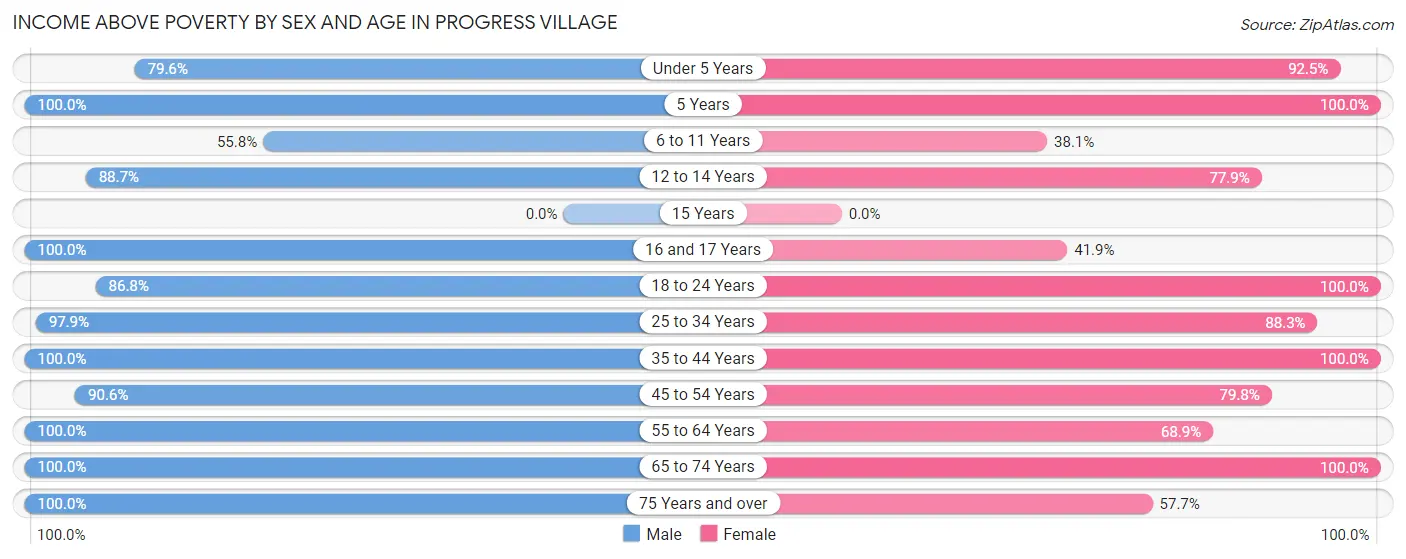
| Age Bracket | Male | Female |
| Under 5 Years | 148 (79.6%) | 543 (92.5%) |
| 5 Years | 56 (100.0%) | 39 (100.0%) |
| 6 to 11 Years | 218 (55.7%) | 125 (38.1%) |
| 12 to 14 Years | 125 (88.6%) | 127 (77.9%) |
| 15 Years | 0 (0.0%) | 0 (0.0%) |
| 16 and 17 Years | 168 (100.0%) | 54 (41.9%) |
| 18 to 24 Years | 237 (86.8%) | 282 (100.0%) |
| 25 to 34 Years | 940 (97.9%) | 1,379 (88.3%) |
| 35 to 44 Years | 476 (100.0%) | 713 (100.0%) |
| 45 to 54 Years | 551 (90.6%) | 718 (79.8%) |
| 55 to 64 Years | 590 (100.0%) | 461 (68.9%) |
| 65 to 74 Years | 278 (100.0%) | 269 (100.0%) |
| 75 Years and over | 103 (100.0%) | 120 (57.7%) |
| Total | 3,890 (92.0%) | 4,830 (82.3%) |
Income Below Poverty Among Married-Couple Families in Progress Village
The poverty statistics for married-couple families in Progress Village show that 1.3% or 18 of the total 1,422 families live below the poverty line. Families with no children have the highest poverty rate of 2.6%, comprising of 18 families. On the other hand, families with 1 or 2 children have the lowest poverty rate of 0.0%, which includes 0 families.
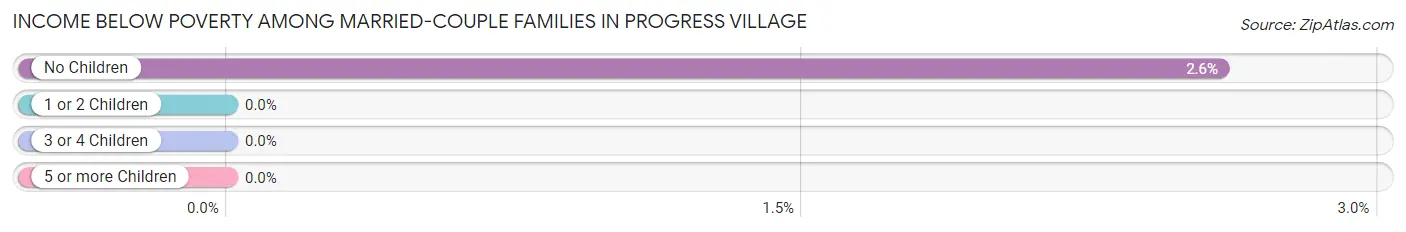
| Children | Above Poverty | Below Poverty |
| No Children | 677 (97.4%) | 18 (2.6%) |
| 1 or 2 Children | 668 (100.0%) | 0 (0.0%) |
| 3 or 4 Children | 59 (100.0%) | 0 (0.0%) |
| 5 or more Children | 0 (0.0%) | 0 (0.0%) |
| Total | 1,404 (98.7%) | 18 (1.3%) |
Income Below Poverty Among Single-Parent Households in Progress Village
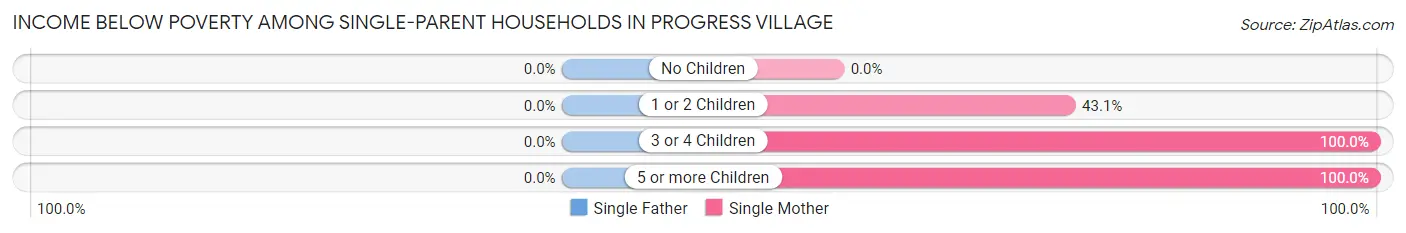
| Children | Single Father | Single Mother |
| No Children | 0 (0.0%) | 0 (0.0%) |
| 1 or 2 Children | 0 (0.0%) | 188 (43.1%) |
| 3 or 4 Children | 0 (0.0%) | 51 (100.0%) |
| 5 or more Children | 0 (0.0%) | 14 (100.0%) |
| Total | 0 (0.0%) | 253 (27.6%) |
Income Below Poverty Among Married-Couple vs Single-Parent Households in Progress Village
The poverty data for Progress Village shows that 18 of the married-couple family households (1.3%) and 253 of the single-parent households (23.3%) are living below the poverty level. Within the married-couple family households, those with no children have the highest poverty rate, with 18 households (2.6%) falling below the poverty line. Among the single-parent households, those with 3 or 4 children have the highest poverty rate, with 51 household (100.0%) living below poverty.
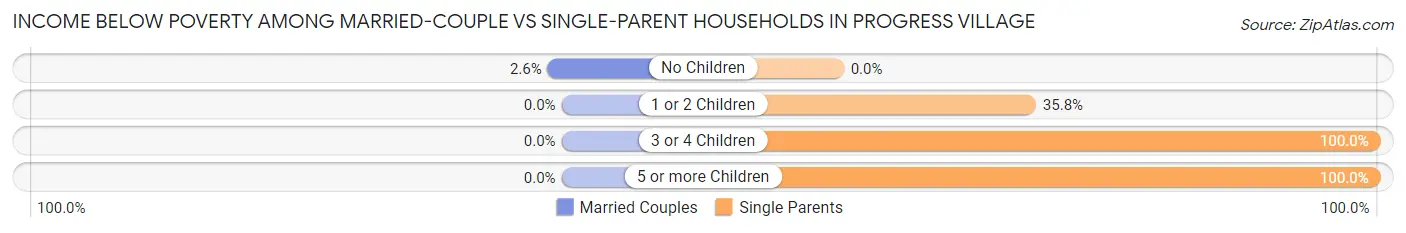
| Children | Married-Couple Families | Single-Parent Households |
| No Children | 18 (2.6%) | 0 (0.0%) |
| 1 or 2 Children | 0 (0.0%) | 188 (35.8%) |
| 3 or 4 Children | 0 (0.0%) | 51 (100.0%) |
| 5 or more Children | 0 (0.0%) | 14 (100.0%) |
| Total | 18 (1.3%) | 253 (23.3%) |
Race in Progress Village
The most populous races in Progress Village are Black / African American (4,071 | 40.3%), White / Caucasian (4,021 | 39.8%), and Hispanic or Latino (2,653 | 26.3%).
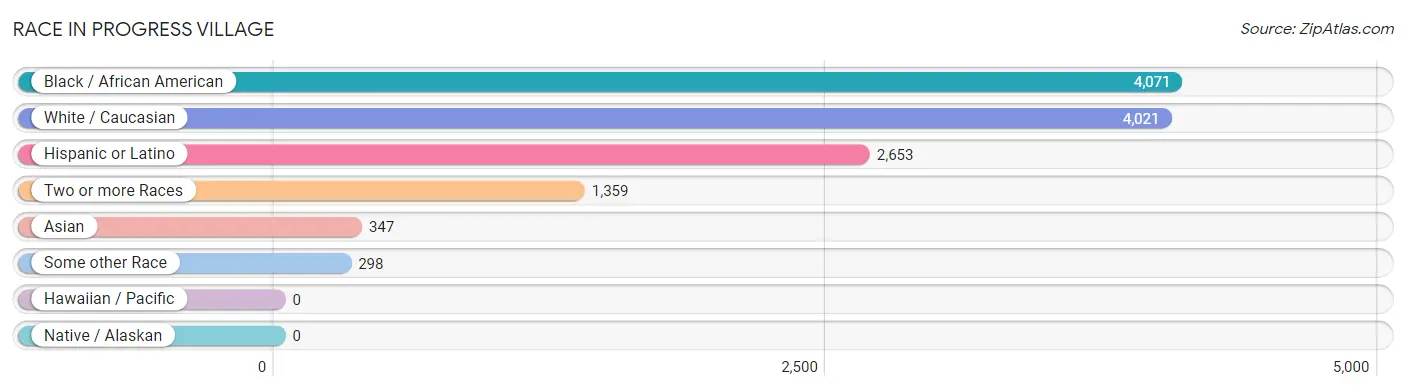
| Race | # Population | % Population |
| Asian | 347 | 3.4% |
| Black / African American | 4,071 | 40.3% |
| Hawaiian / Pacific | 0 | 0.0% |
| Hispanic or Latino | 2,653 | 26.3% |
| Native / Alaskan | 0 | 0.0% |
| White / Caucasian | 4,021 | 39.8% |
| Two or more Races | 1,359 | 13.5% |
| Some other Race | 298 | 2.9% |
| Total | 10,096 | 100.0% |
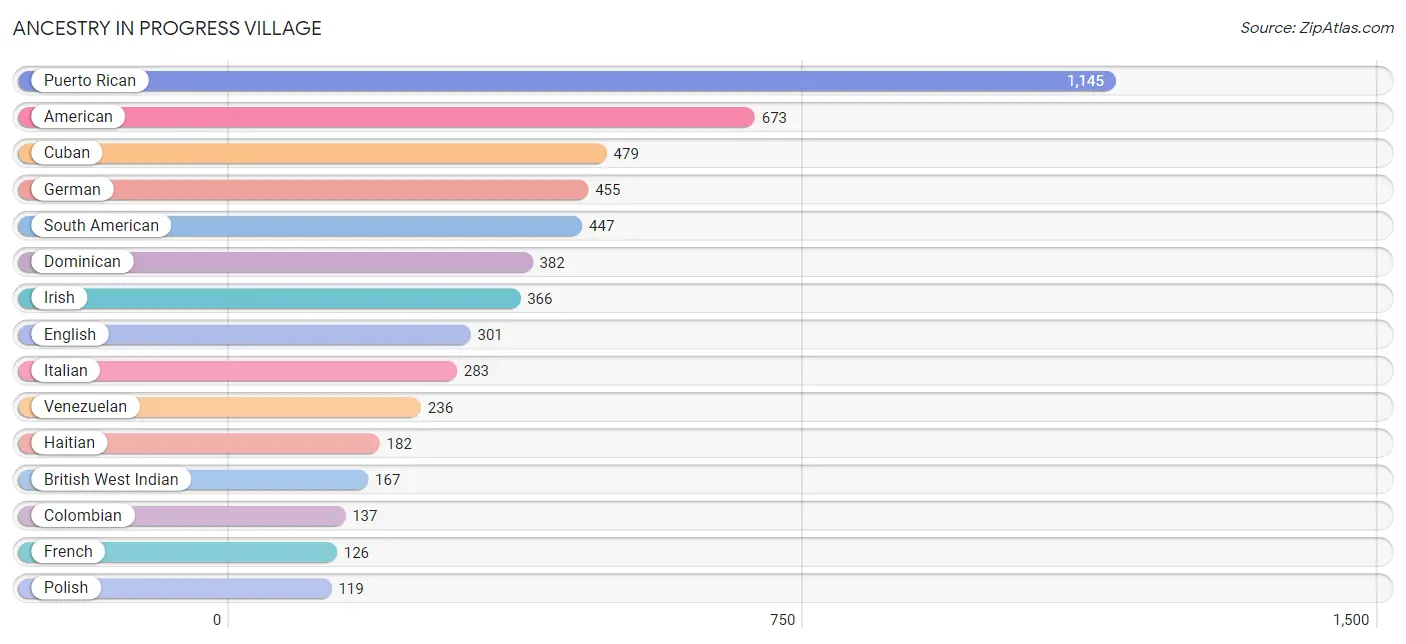
Ancestry in Progress Village
The most populous ancestries reported in Progress Village are Puerto Rican (1,145 | 11.3%), American (673 | 6.7%), Cuban (479 | 4.7%), German (455 | 4.5%), and South American (447 | 4.4%), together accounting for 31.7% of all Progress Village residents.
| Ancestry | # Population | % Population |
| African | 85 | 0.8% |
| American | 673 | 6.7% |
| Arab | 32 | 0.3% |
| Austrian | 15 | 0.2% |
| British | 90 | 0.9% |
| British West Indian | 167 | 1.7% |
| Bulgarian | 92 | 0.9% |
| Burmese | 29 | 0.3% |
| Canadian | 14 | 0.1% |
| Central American | 108 | 1.1% |
| Colombian | 137 | 1.4% |
| Cuban | 479 | 4.7% |
| Danish | 35 | 0.4% |
| Dominican | 382 | 3.8% |
| Ecuadorian | 37 | 0.4% |
| Egyptian | 12 | 0.1% |
| English | 301 | 3.0% |
| European | 49 | 0.5% |
| Filipino | 38 | 0.4% |
| French | 126 | 1.3% |
| French Canadian | 36 | 0.4% |
| German | 455 | 4.5% |
| Guyanese | 31 | 0.3% |
| Haitian | 182 | 1.8% |
| Honduran | 84 | 0.8% |
| Hungarian | 17 | 0.2% |
| Indian (Asian) | 23 | 0.2% |
| Irish | 366 | 3.6% |
| Iroquois | 17 | 0.2% |
| Israeli | 36 | 0.4% |
| Italian | 283 | 2.8% |
| Jamaican | 110 | 1.1% |
| Korean | 111 | 1.1% |
| Lebanese | 20 | 0.2% |
| Mexican | 59 | 0.6% |
| Norwegian | 14 | 0.1% |
| Peruvian | 37 | 0.4% |
| Polish | 119 | 1.2% |
| Puerto Rican | 1,145 | 11.3% |
| Russian | 27 | 0.3% |
| Salvadoran | 24 | 0.2% |
| Scandinavian | 34 | 0.3% |
| Scottish | 56 | 0.5% |
| Seminole | 48 | 0.5% |
| South American | 447 | 4.4% |
| Spaniard | 33 | 0.3% |
| Sri Lankan | 58 | 0.6% |
| Subsaharan African | 85 | 0.8% |
| Swedish | 47 | 0.5% |
| Thai | 98 | 1.0% |
| Trinidadian and Tobagonian | 25 | 0.3% |
| Venezuelan | 236 | 2.3% |
| West Indian | 20 | 0.2% |
| Yugoslavian | 18 | 0.2% | View All 54 Rows |
Immigrants in Progress Village
The most numerous immigrant groups reported in Progress Village came from Latin America (1,465 | 14.5%), Caribbean (833 | 8.3%), South America (477 | 4.7%), Dominican Republic (272 | 2.7%), and Asia (224 | 2.2%), together accounting for 32.4% of all Progress Village residents.
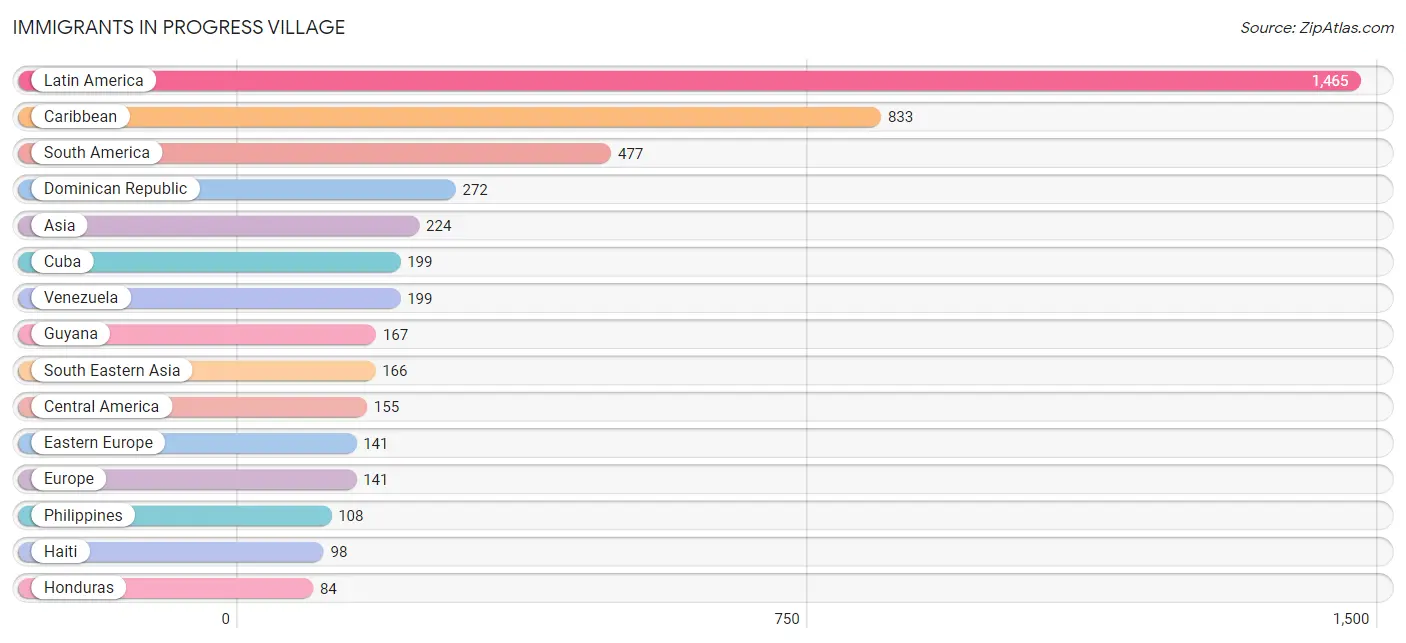
| Immigration Origin | # Population | % Population |
| Africa | 24 | 0.2% |
| Asia | 224 | 2.2% |
| Bosnia and Herzegovina | 18 | 0.2% |
| Bulgaria | 65 | 0.6% |
| Canada | 39 | 0.4% |
| Caribbean | 833 | 8.3% |
| Central America | 155 | 1.5% |
| China | 35 | 0.4% |
| Colombia | 40 | 0.4% |
| Cuba | 199 | 2.0% |
| Dominican Republic | 272 | 2.7% |
| Eastern Africa | 24 | 0.2% |
| Eastern Asia | 35 | 0.4% |
| Eastern Europe | 141 | 1.4% |
| El Salvador | 24 | 0.2% |
| Ethiopia | 24 | 0.2% |
| Europe | 141 | 1.4% |
| Guyana | 167 | 1.7% |
| Haiti | 98 | 1.0% |
| Honduras | 84 | 0.8% |
| Jamaica | 72 | 0.7% |
| Latin America | 1,465 | 14.5% |
| Mexico | 47 | 0.5% |
| Peru | 37 | 0.4% |
| Philippines | 108 | 1.1% |
| South America | 477 | 4.7% |
| South Eastern Asia | 166 | 1.6% |
| Taiwan | 12 | 0.1% |
| Trinidad and Tobago | 25 | 0.3% |
| Ukraine | 58 | 0.6% |
| Venezuela | 199 | 2.0% |
| Vietnam | 58 | 0.6% |
| Western Asia | 23 | 0.2% |
| Yemen | 23 | 0.2% | View All 34 Rows |
Sex and Age in Progress Village
Sex and Age in Progress Village
The most populous age groups in Progress Village are 25 to 29 Years (555 | 13.1%) for men and 30 to 34 Years (927 | 15.8%) for women.
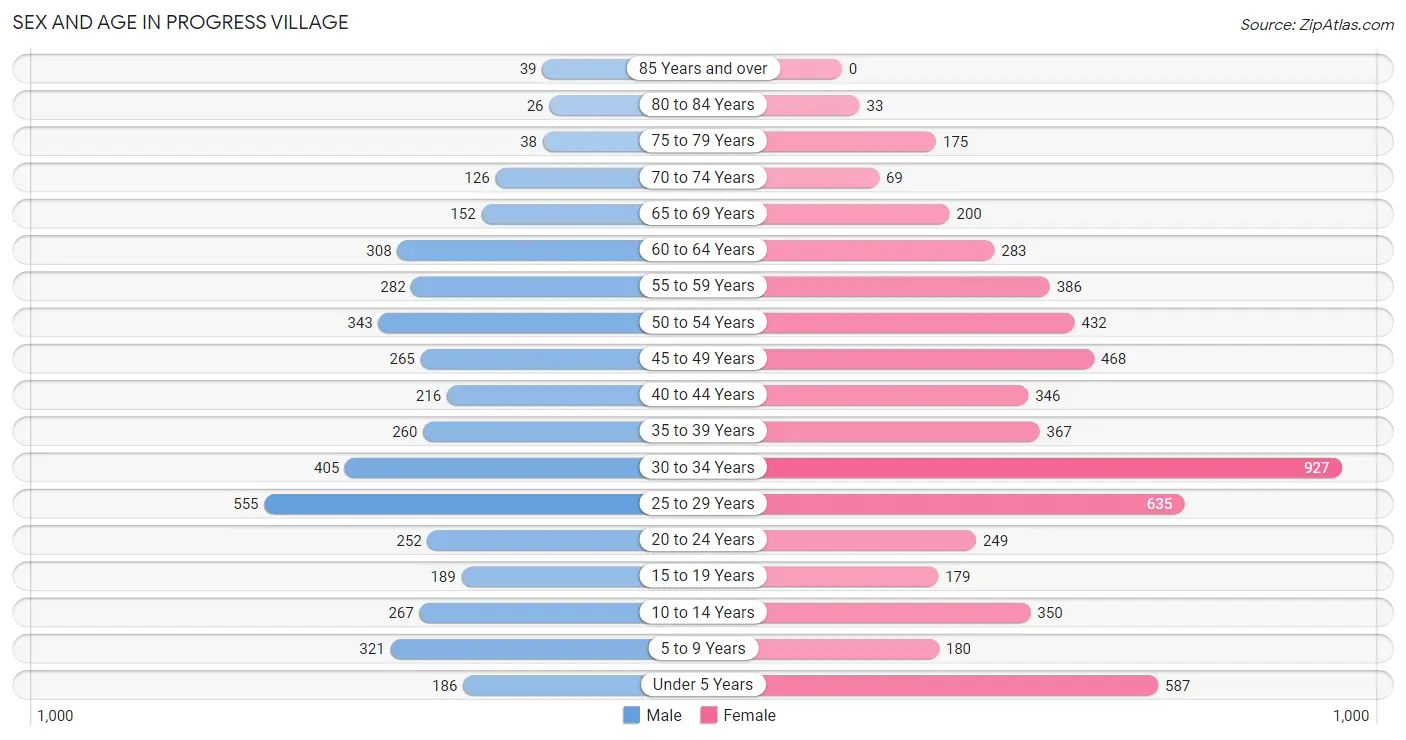
| Age Bracket | Male | Female |
| Under 5 Years | 186 (4.4%) | 587 (10.0%) |
| 5 to 9 Years | 321 (7.6%) | 180 (3.1%) |
| 10 to 14 Years | 267 (6.3%) | 350 (6.0%) |
| 15 to 19 Years | 189 (4.5%) | 179 (3.0%) |
| 20 to 24 Years | 252 (6.0%) | 249 (4.2%) |
| 25 to 29 Years | 555 (13.1%) | 635 (10.8%) |
| 30 to 34 Years | 405 (9.6%) | 927 (15.8%) |
| 35 to 39 Years | 260 (6.1%) | 367 (6.3%) |
| 40 to 44 Years | 216 (5.1%) | 346 (5.9%) |
| 45 to 49 Years | 265 (6.3%) | 468 (8.0%) |
| 50 to 54 Years | 343 (8.1%) | 432 (7.4%) |
| 55 to 59 Years | 282 (6.7%) | 386 (6.6%) |
| 60 to 64 Years | 308 (7.3%) | 283 (4.8%) |
| 65 to 69 Years | 152 (3.6%) | 200 (3.4%) |
| 70 to 74 Years | 126 (3.0%) | 69 (1.2%) |
| 75 to 79 Years | 38 (0.9%) | 175 (3.0%) |
| 80 to 84 Years | 26 (0.6%) | 33 (0.6%) |
| 85 Years and over | 39 (0.9%) | 0 (0.0%) |
| Total | 4,230 (100.0%) | 5,866 (100.0%) |
Families and Households in Progress Village
Median Family Size in Progress Village
The median family size in Progress Village is 3.02 persons per family, with married-couple families (1,422 | 56.7%) accounting for the largest median family size of 3.1 persons per family. On the other hand, single male/father families (169 | 6.7%) represent the smallest median family size with 2.37 persons per family.
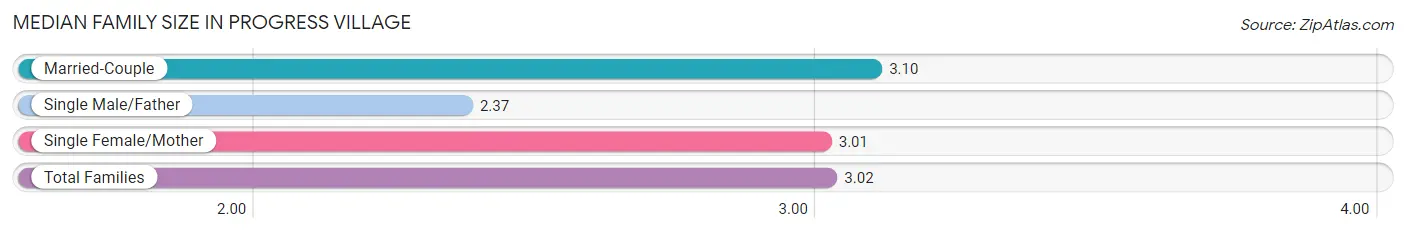
| Family Type | # Families | Family Size |
| Married-Couple | 1,422 (56.7%) | 3.10 |
| Single Male/Father | 169 (6.7%) | 2.37 |
| Single Female/Mother | 918 (36.6%) | 3.01 |
| Total Families | 2,509 (100.0%) | 3.02 |
Median Household Size in Progress Village
The median household size in Progress Village is 2.33 persons per household, with single female/mother households (918 | 21.2%) accounting for the largest median household size of 3.16 persons per household. non-family households (1,817 | 42.0%) represent the smallest median household size with 1.27 persons per household.
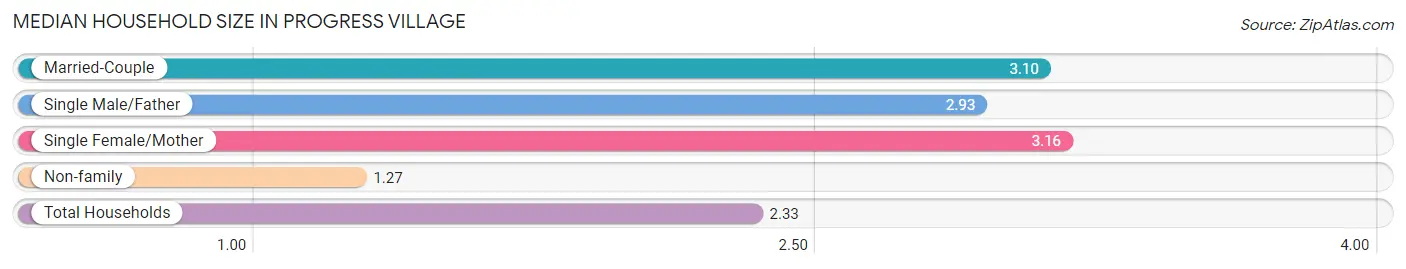
| Household Type | # Households | Household Size |
| Married-Couple | 1,422 (32.9%) | 3.10 |
| Single Male/Father | 169 (3.9%) | 2.93 |
| Single Female/Mother | 918 (21.2%) | 3.16 |
| Non-family | 1,817 (42.0%) | 1.27 |
| Total Households | 4,326 (100.0%) | 2.33 |
Household Size by Marriage Status in Progress Village
Out of a total of 4,326 households in Progress Village, 2,509 (58.0%) are family households, while 1,817 (42.0%) are nonfamily households. The most numerous type of family households are 2-person households, comprising 1,133, and the most common type of nonfamily households are 1-person households, comprising 1,451.
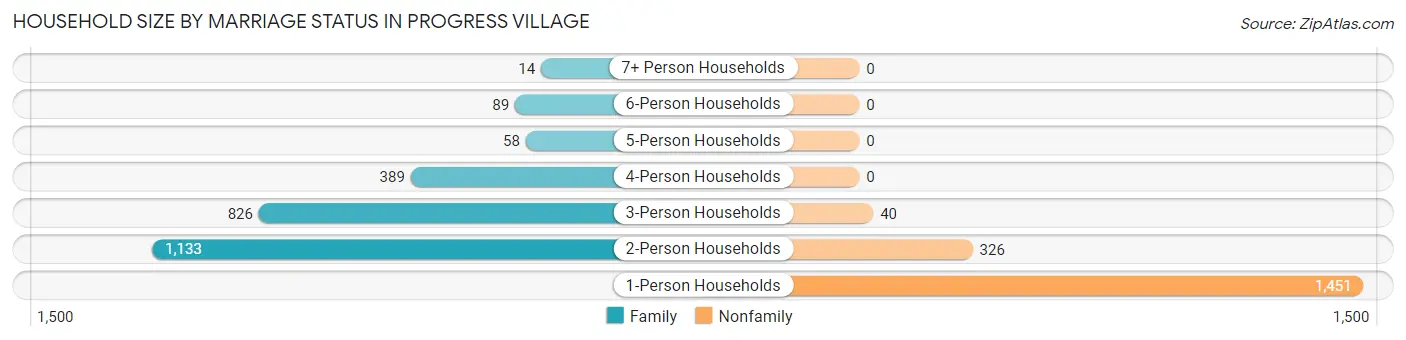
| Household Size | Family Households | Nonfamily Households |
| 1-Person Households | - | 1,451 (33.5%) |
| 2-Person Households | 1,133 (26.2%) | 326 (7.5%) |
| 3-Person Households | 826 (19.1%) | 40 (0.9%) |
| 4-Person Households | 389 (9.0%) | 0 (0.0%) |
| 5-Person Households | 58 (1.3%) | 0 (0.0%) |
| 6-Person Households | 89 (2.1%) | 0 (0.0%) |
| 7+ Person Households | 14 (0.3%) | 0 (0.0%) |
| Total | 2,509 (58.0%) | 1,817 (42.0%) |
Female Fertility in Progress Village
Fertility by Age in Progress Village
Average fertility rate in Progress Village is 80.0 births per 1,000 women. Women in the age bracket of 20 to 34 years have the highest fertility rate with 127.0 births per 1,000 women. Women in the age bracket of 20 to 34 years acount for 88.5% of all women with births.
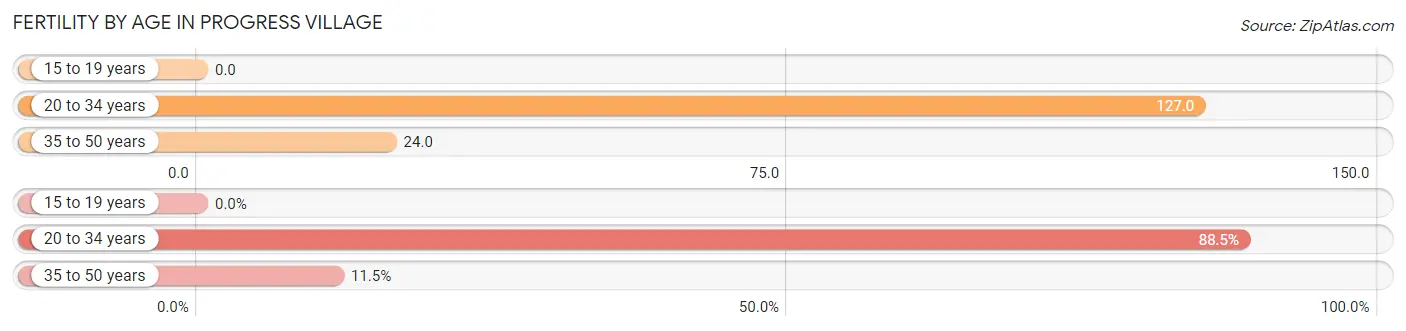
| Age Bracket | Women with Births | Births / 1,000 Women |
| 15 to 19 years | 0 (0.0%) | 0.0 |
| 20 to 34 years | 230 (88.5%) | 127.0 |
| 35 to 50 years | 30 (11.5%) | 24.0 |
| Total | 260 (100.0%) | 80.0 |
Fertility by Age by Marriage Status in Progress Village
74.6% of women with births (260) in Progress Village are married. The highest percentage of unmarried women with births falls into 20 to 34 years age bracket with 28.7% of them unmarried at the time of birth, while the lowest percentage of unmarried women with births belong to 35 to 50 years age bracket with 0.0% of them unmarried.
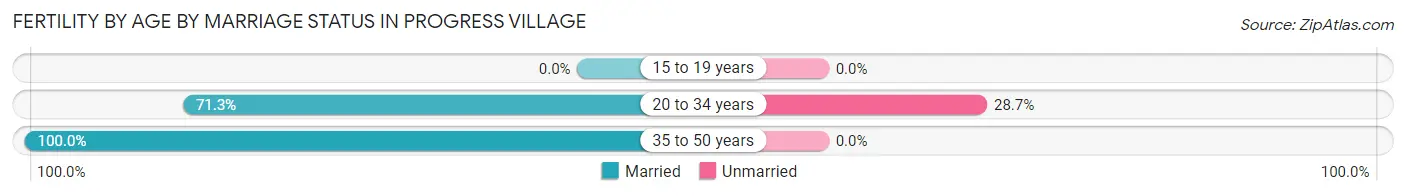
| Age Bracket | Married | Unmarried |
| 15 to 19 years | 0 (0.0%) | 0 (0.0%) |
| 20 to 34 years | 164 (71.3%) | 66 (28.7%) |
| 35 to 50 years | 30 (100.0%) | 0 (0.0%) |
| Total | 194 (74.6%) | 66 (25.4%) |
Fertility by Education in Progress Village
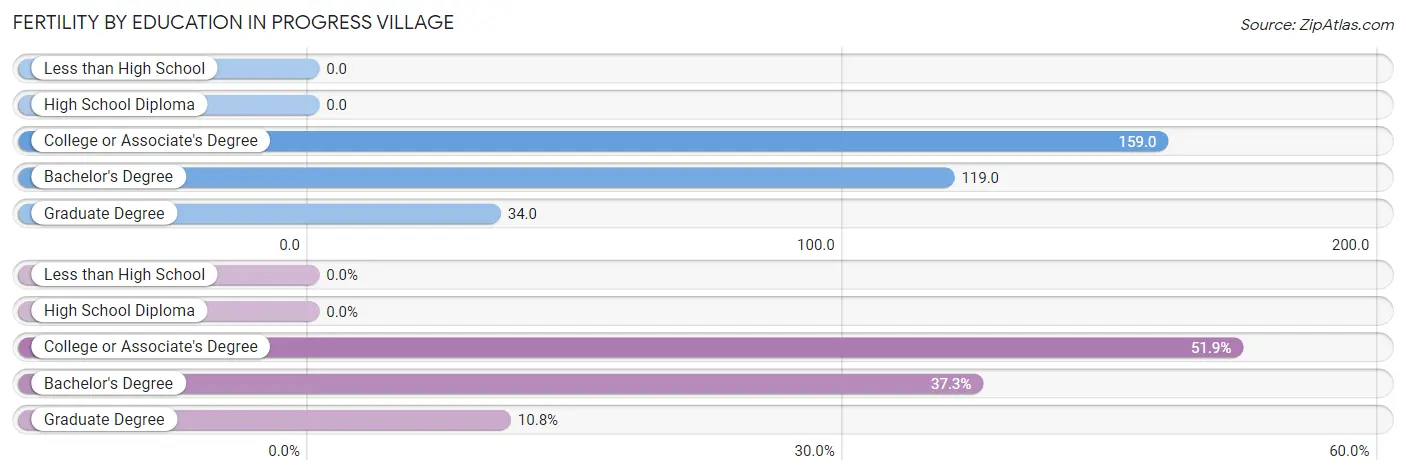
| Educational Attainment | Women with Births | Births / 1,000 Women |
| Less than High School | 0 (0.0%) | 0.0 |
| High School Diploma | 0 (0.0%) | 0.0 |
| College or Associate's Degree | 135 (51.9%) | 159.0 |
| Bachelor's Degree | 97 (37.3%) | 119.0 |
| Graduate Degree | 28 (10.8%) | 34.0 |
| Total | 260 (100.0%) | 80.0 |
Fertility by Education by Marriage Status in Progress Village
25.4% of women with births in Progress Village are unmarried. Women with the educational attainment of college or associate's degree are most likely to be married with 100.0% of them married at childbirth, while women with the educational attainment of bachelor's degree are least likely to be married with 68.0% of them unmarried at childbirth.
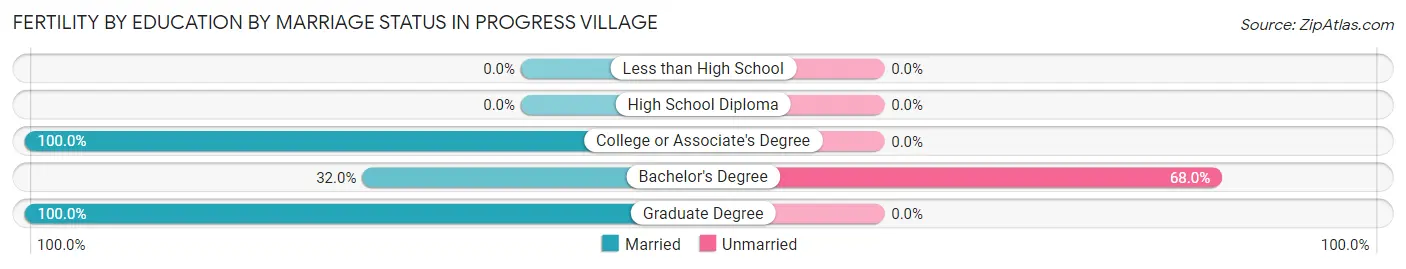
| Educational Attainment | Married | Unmarried |
| Less than High School | 0 (0.0%) | 0 (0.0%) |
| High School Diploma | 0 (0.0%) | 0 (0.0%) |
| College or Associate's Degree | 135 (100.0%) | 0 (0.0%) |
| Bachelor's Degree | 31 (32.0%) | 66 (68.0%) |
| Graduate Degree | 28 (100.0%) | 0 (0.0%) |
| Total | 194 (74.6%) | 66 (25.4%) |
Employment Characteristics in Progress Village
Employment by Class of Employer in Progress Village
Among the 6,152 employed individuals in Progress Village, private company employees (4,420 | 71.9%), not-for-profit organizations (529 | 8.6%), and federal government employees (438 | 7.1%) make up the most common classes of employment.
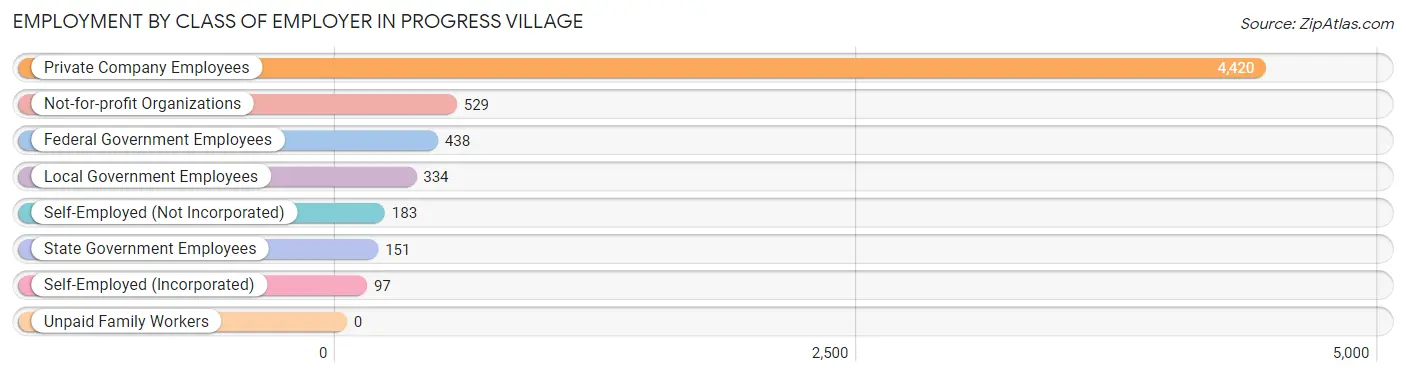
| Employer Class | # Employees | % Employees |
| Private Company Employees | 4,420 | 71.9% |
| Self-Employed (Incorporated) | 97 | 1.6% |
| Self-Employed (Not Incorporated) | 183 | 3.0% |
| Not-for-profit Organizations | 529 | 8.6% |
| Local Government Employees | 334 | 5.4% |
| State Government Employees | 151 | 2.5% |
| Federal Government Employees | 438 | 7.1% |
| Unpaid Family Workers | 0 | 0.0% |
| Total | 6,152 | 100.0% |
Employment Status by Age in Progress Village
According to the labor force statistics for Progress Village, out of the total population over 16 years of age (8,188), 76.2% or 6,239 individuals are in the labor force, with 1.5% or 94 of them unemployed. The age group with the highest labor force participation rate is 35 to 44 years, with 96.9% or 1,152 individuals in the labor force. Within the labor force, the 20 to 24 years age range has the highest percentage of unemployed individuals, with 6.6% or 30 of them being unemployed.
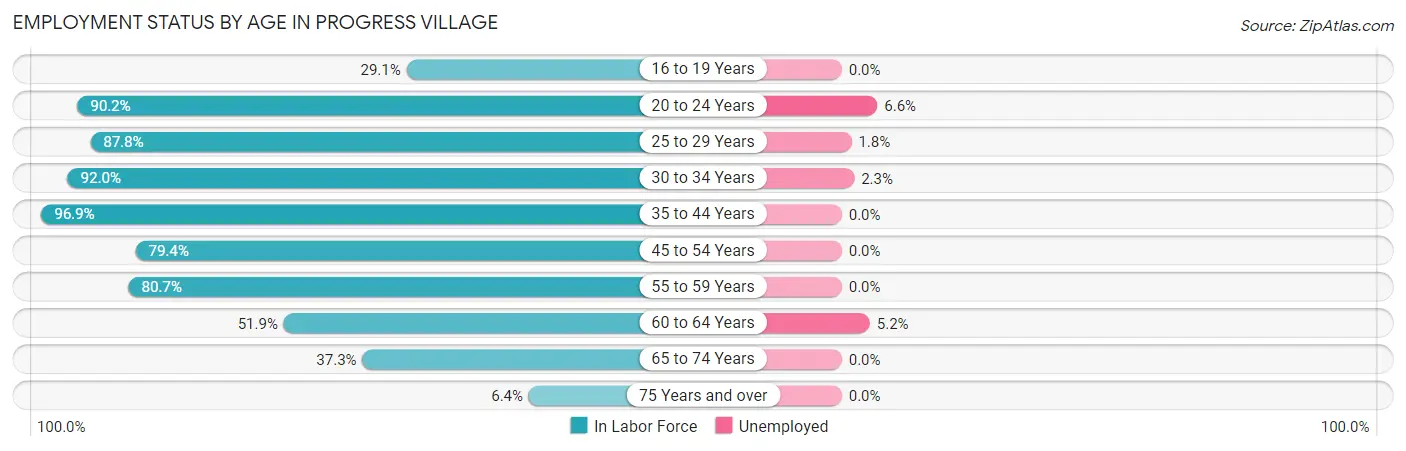
| Age Bracket | In Labor Force | Unemployed |
| 16 to 19 Years | 102 (29.1%) | 0 (0.0%) |
| 20 to 24 Years | 452 (90.2%) | 30 (6.6%) |
| 25 to 29 Years | 1,045 (87.8%) | 19 (1.8%) |
| 30 to 34 Years | 1,225 (92.0%) | 28 (2.3%) |
| 35 to 44 Years | 1,152 (96.9%) | 0 (0.0%) |
| 45 to 54 Years | 1,197 (79.4%) | 0 (0.0%) |
| 55 to 59 Years | 539 (80.7%) | 0 (0.0%) |
| 60 to 64 Years | 307 (51.9%) | 16 (5.2%) |
| 65 to 74 Years | 204 (37.3%) | 0 (0.0%) |
| 75 Years and over | 20 (6.4%) | 0 (0.0%) |
| Total | 6,239 (76.2%) | 94 (1.5%) |
Employment Status by Educational Attainment in Progress Village
According to labor force statistics for Progress Village, 84.4% of individuals (5,467) out of the total population between 25 and 64 years of age (6,478) are in the labor force, with 1.2% or 66 of them being unemployed. The group with the highest labor force participation rate are those with the educational attainment of bachelor's degree or higher, with 93.3% or 2,514 individuals in the labor force. Within the labor force, individuals with college / associate degree education have the highest percentage of unemployment, with 3.4% or 48 of them being unemployed.
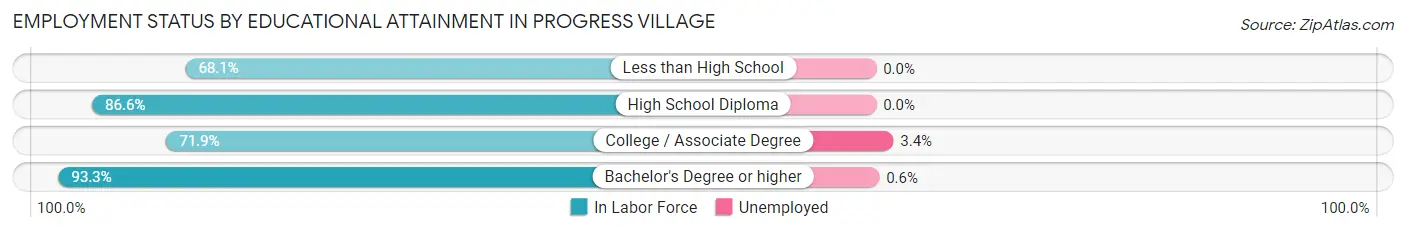
| Educational Attainment | In Labor Force | Unemployed |
| Less than High School | 141 (68.1%) | 0 (0.0%) |
| High School Diploma | 1,397 (86.6%) | 0 (0.0%) |
| College / Associate Degree | 1,412 (71.9%) | 67 (3.4%) |
| Bachelor's Degree or higher | 2,514 (93.3%) | 16 (0.6%) |
| Total | 5,467 (84.4%) | 78 (1.2%) |
Employment Occupations by Sex in Progress Village
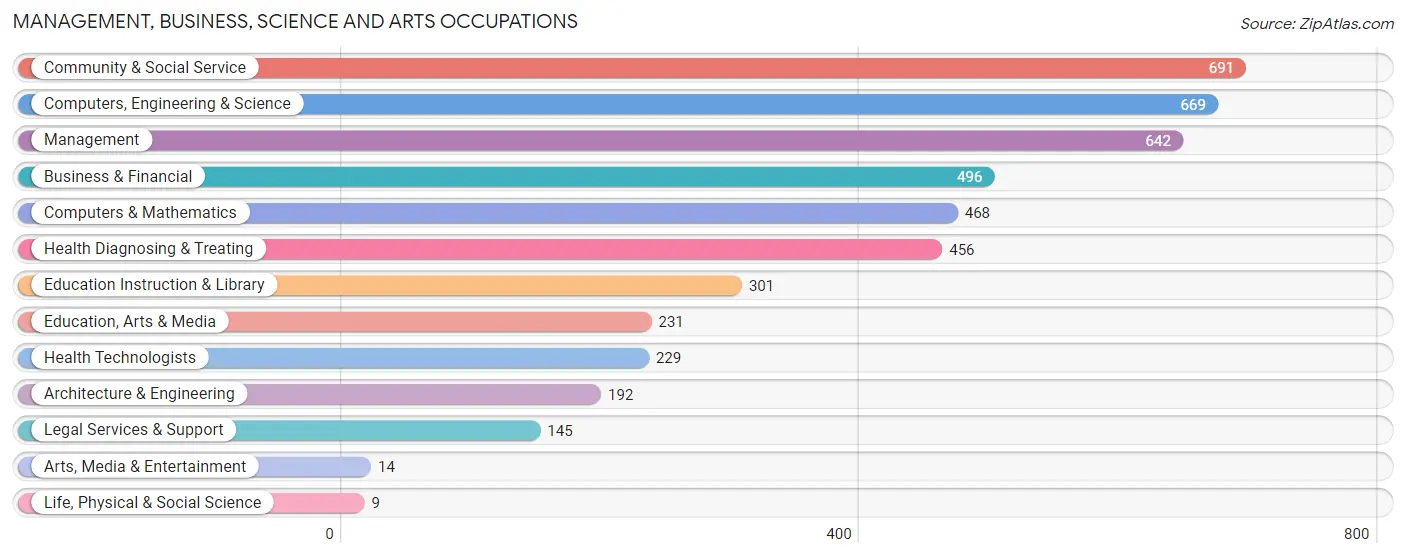
Management, Business, Science and Arts Occupations
The most common Management, Business, Science and Arts occupations in Progress Village are Community & Social Service (691 | 11.4%), Computers, Engineering & Science (669 | 11.0%), Management (642 | 10.6%), Business & Financial (496 | 8.2%), and Computers & Mathematics (468 | 7.7%).
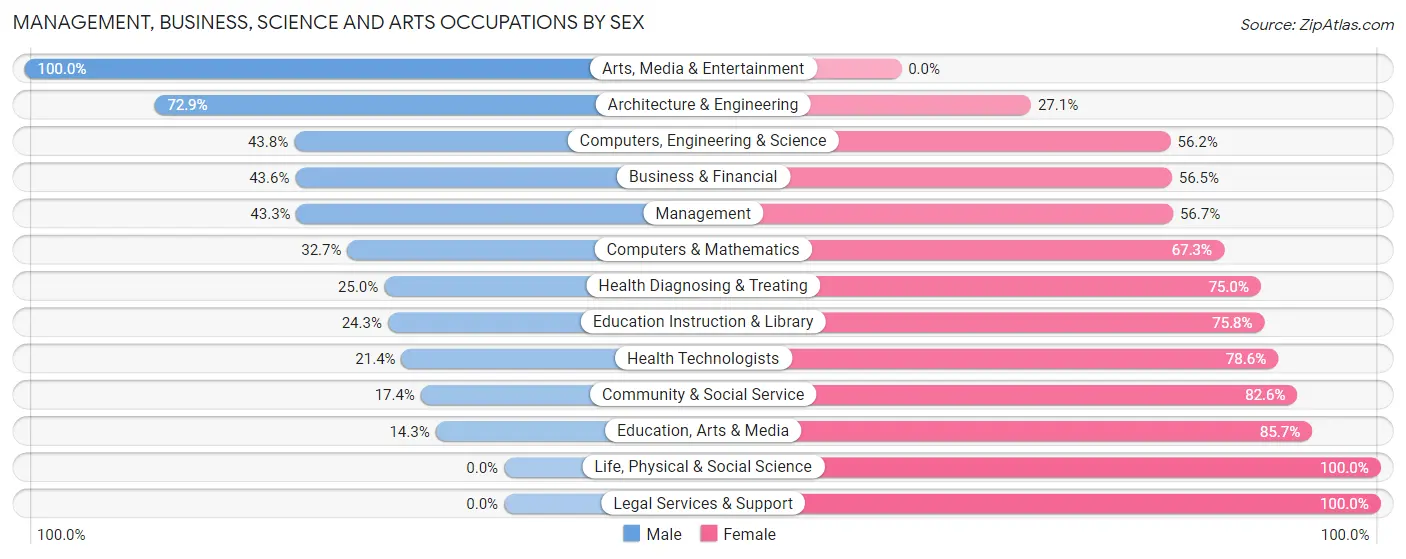
Management, Business, Science and Arts Occupations by Sex
Within the Management, Business, Science and Arts occupations in Progress Village, the most male-oriented occupations are Arts, Media & Entertainment (100.0%), Architecture & Engineering (72.9%), and Computers, Engineering & Science (43.8%), while the most female-oriented occupations are Life, Physical & Social Science (100.0%), Legal Services & Support (100.0%), and Education, Arts & Media (85.7%).
| Occupation | Male | Female |
| Management | 278 (43.3%) | 364 (56.7%) |
| Business & Financial | 216 (43.5%) | 280 (56.5%) |
| Computers, Engineering & Science | 293 (43.8%) | 376 (56.2%) |
| Computers & Mathematics | 153 (32.7%) | 315 (67.3%) |
| Architecture & Engineering | 140 (72.9%) | 52 (27.1%) |
| Life, Physical & Social Science | 0 (0.0%) | 9 (100.0%) |
| Community & Social Service | 120 (17.4%) | 571 (82.6%) |
| Education, Arts & Media | 33 (14.3%) | 198 (85.7%) |
| Legal Services & Support | 0 (0.0%) | 145 (100.0%) |
| Education Instruction & Library | 73 (24.2%) | 228 (75.7%) |
| Arts, Media & Entertainment | 14 (100.0%) | 0 (0.0%) |
| Health Diagnosing & Treating | 114 (25.0%) | 342 (75.0%) |
| Health Technologists | 49 (21.4%) | 180 (78.6%) |
| Total (Category) | 1,021 (34.6%) | 1,933 (65.4%) |
| Total (Overall) | 2,446 (40.4%) | 3,615 (59.6%) |
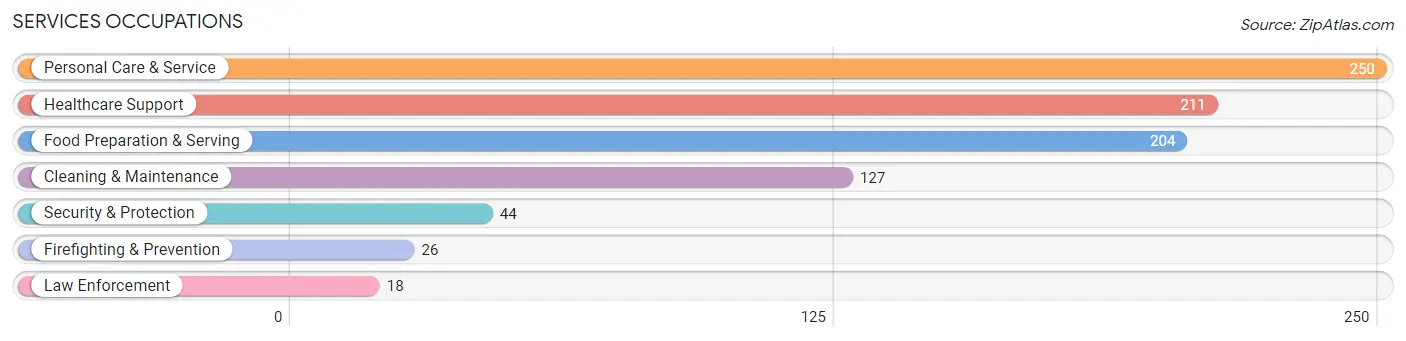
Services Occupations
The most common Services occupations in Progress Village are Personal Care & Service (250 | 4.1%), Healthcare Support (211 | 3.5%), Food Preparation & Serving (204 | 3.4%), Cleaning & Maintenance (127 | 2.1%), and Security & Protection (44 | 0.7%).
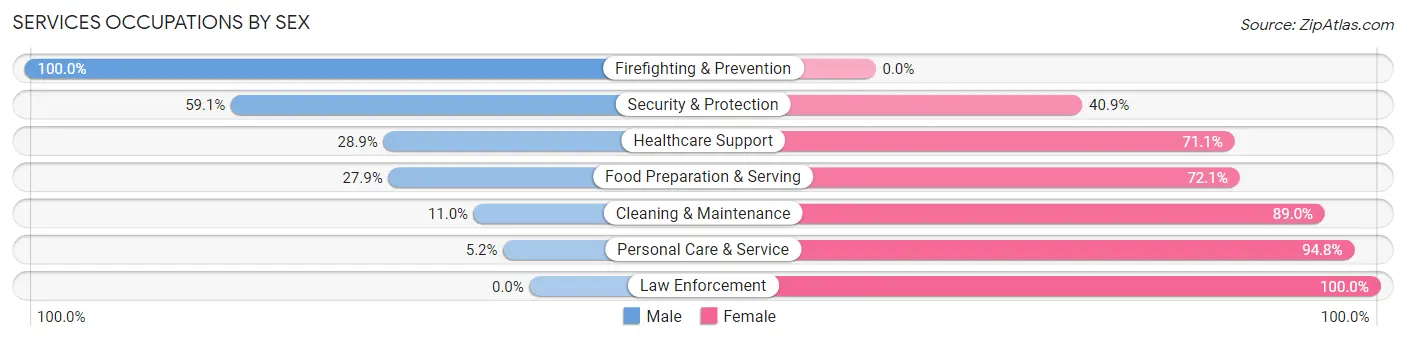
Services Occupations by Sex
Within the Services occupations in Progress Village, the most male-oriented occupations are Firefighting & Prevention (100.0%), Security & Protection (59.1%), and Healthcare Support (28.9%), while the most female-oriented occupations are Law Enforcement (100.0%), Personal Care & Service (94.8%), and Cleaning & Maintenance (89.0%).
| Occupation | Male | Female |
| Healthcare Support | 61 (28.9%) | 150 (71.1%) |
| Security & Protection | 26 (59.1%) | 18 (40.9%) |
| Firefighting & Prevention | 26 (100.0%) | 0 (0.0%) |
| Law Enforcement | 0 (0.0%) | 18 (100.0%) |
| Food Preparation & Serving | 57 (27.9%) | 147 (72.1%) |
| Cleaning & Maintenance | 14 (11.0%) | 113 (89.0%) |
| Personal Care & Service | 13 (5.2%) | 237 (94.8%) |
| Total (Category) | 171 (20.4%) | 665 (79.5%) |
| Total (Overall) | 2,446 (40.4%) | 3,615 (59.6%) |
Sales and Office Occupations
The most common Sales and Office occupations in Progress Village are Office & Administration (913 | 15.1%), and Sales & Related (357 | 5.9%).
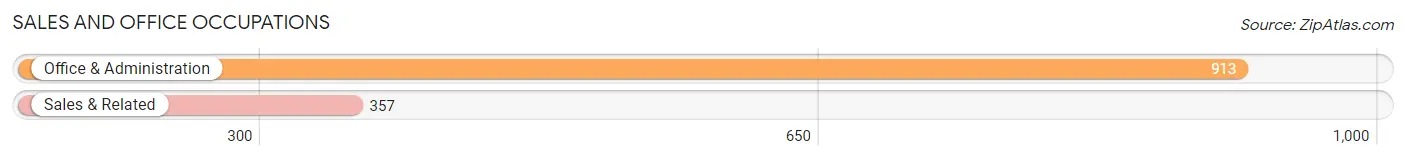
Sales and Office Occupations by Sex
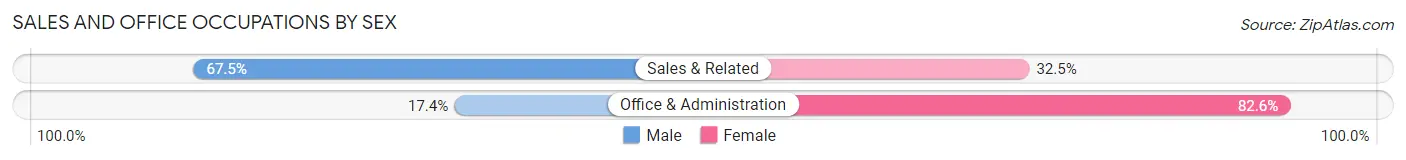
| Occupation | Male | Female |
| Sales & Related | 241 (67.5%) | 116 (32.5%) |
| Office & Administration | 159 (17.4%) | 754 (82.6%) |
| Total (Category) | 400 (31.5%) | 870 (68.5%) |
| Total (Overall) | 2,446 (40.4%) | 3,615 (59.6%) |
Natural Resources, Construction and Maintenance Occupations
The most common Natural Resources, Construction and Maintenance occupations in Progress Village are Installation, Maintenance & Repair (184 | 3.0%), and Construction & Extraction (107 | 1.8%).
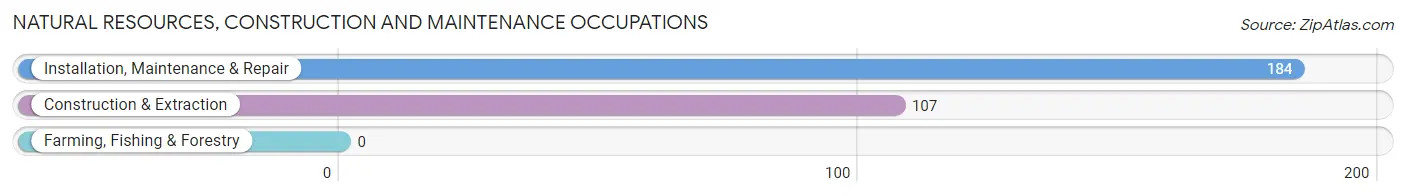
Natural Resources, Construction and Maintenance Occupations by Sex
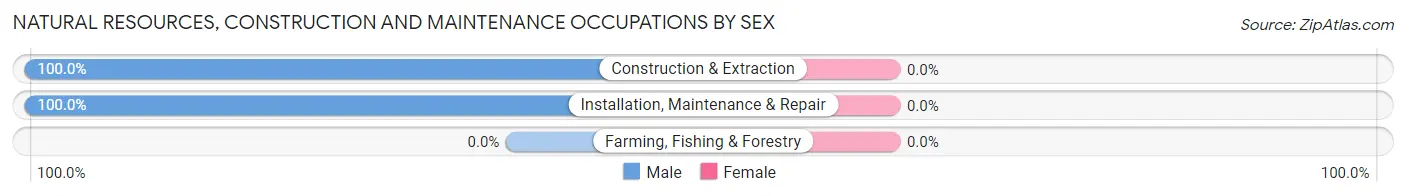
| Occupation | Male | Female |
| Farming, Fishing & Forestry | 0 (0.0%) | 0 (0.0%) |
| Construction & Extraction | 107 (100.0%) | 0 (0.0%) |
| Installation, Maintenance & Repair | 184 (100.0%) | 0 (0.0%) |
| Total (Category) | 291 (100.0%) | 0 (0.0%) |
| Total (Overall) | 2,446 (40.4%) | 3,615 (59.6%) |
Production, Transportation and Moving Occupations
The most common Production, Transportation and Moving occupations in Progress Village are Material Moving (356 | 5.9%), Transportation (258 | 4.3%), and Production (96 | 1.6%).
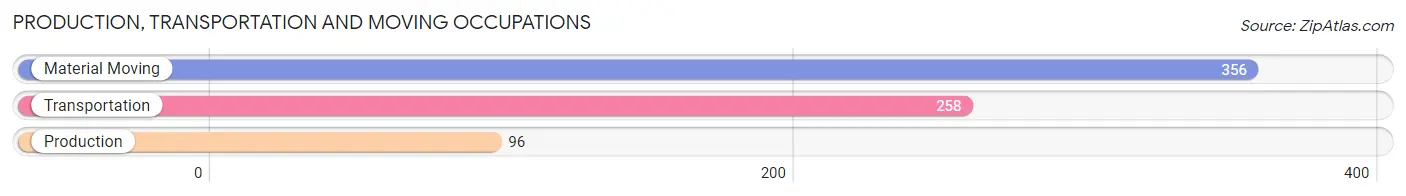
Production, Transportation and Moving Occupations by Sex
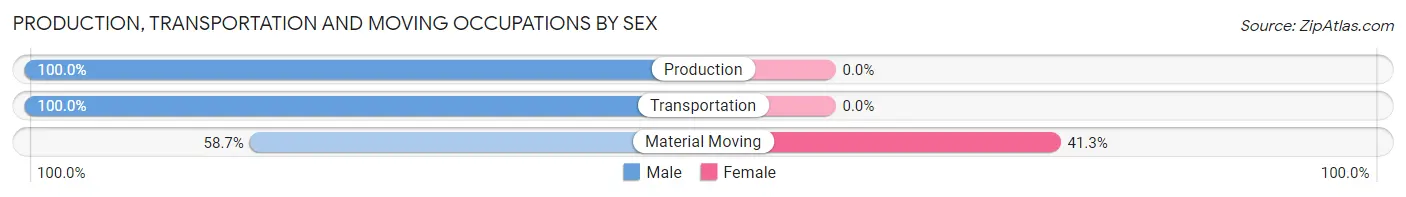
| Occupation | Male | Female |
| Production | 96 (100.0%) | 0 (0.0%) |
| Transportation | 258 (100.0%) | 0 (0.0%) |
| Material Moving | 209 (58.7%) | 147 (41.3%) |
| Total (Category) | 563 (79.3%) | 147 (20.7%) |
| Total (Overall) | 2,446 (40.4%) | 3,615 (59.6%) |
Employment Industries by Sex in Progress Village
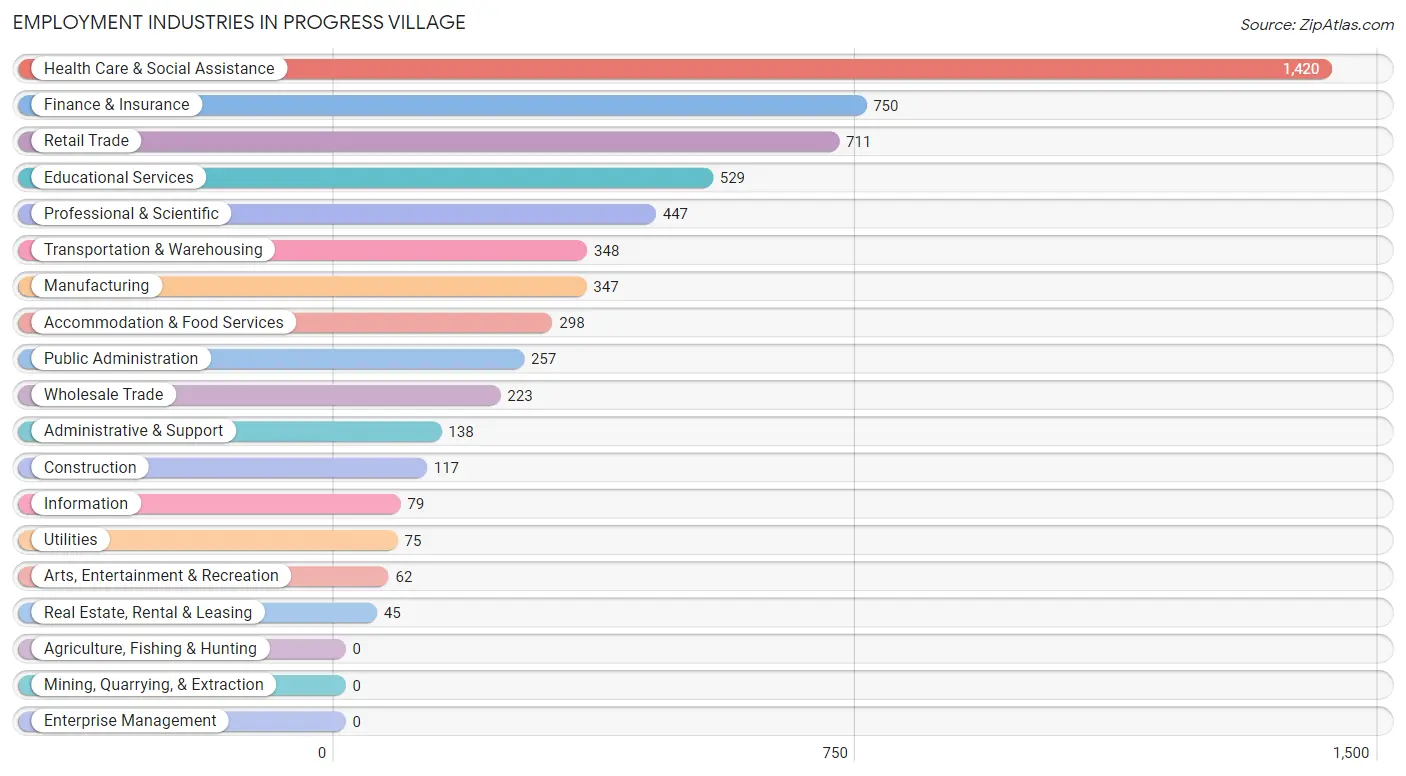
Employment Industries in Progress Village
The major employment industries in Progress Village include Health Care & Social Assistance (1,420 | 23.4%), Finance & Insurance (750 | 12.4%), Retail Trade (711 | 11.7%), Educational Services (529 | 8.7%), and Professional & Scientific (447 | 7.4%).
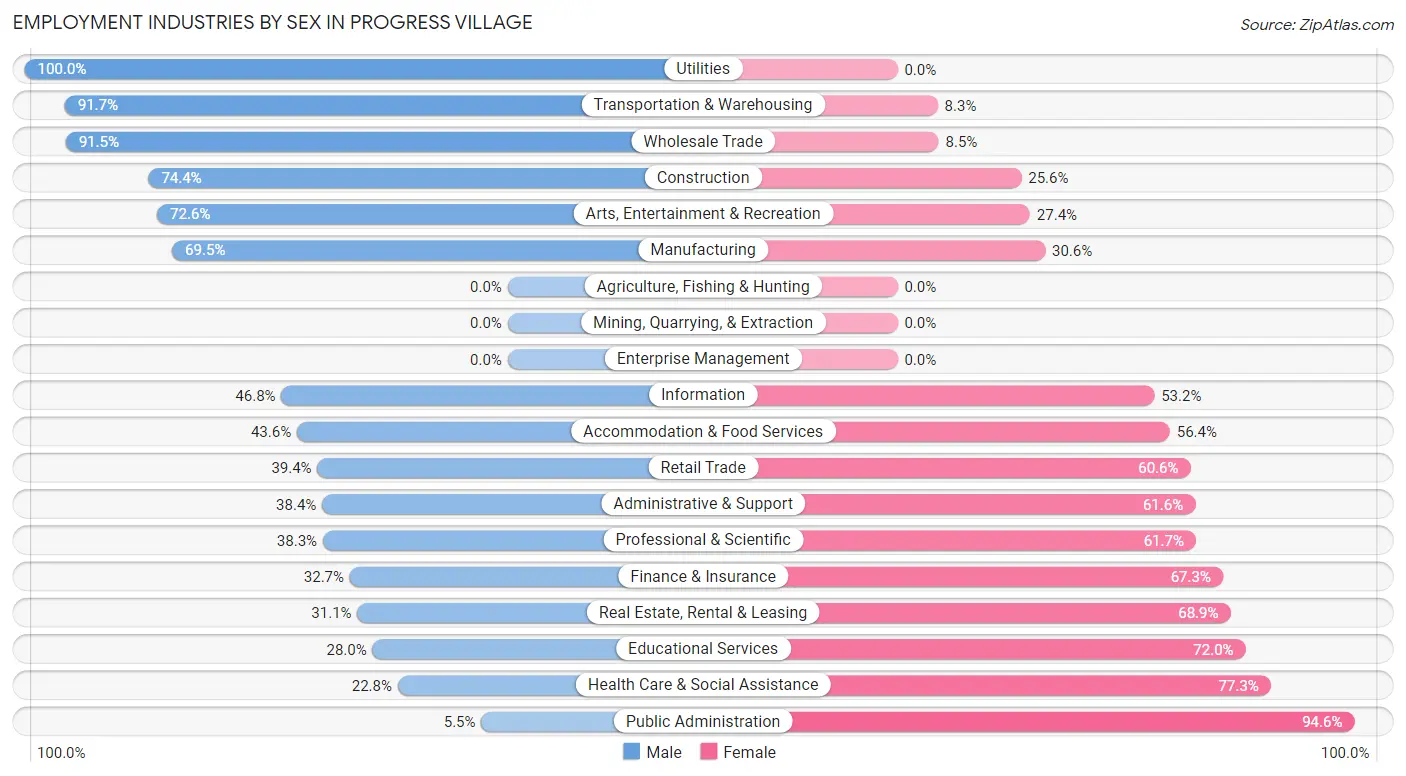
Employment Industries by Sex in Progress Village
The Progress Village industries that see more men than women are Utilities (100.0%), Transportation & Warehousing (91.7%), and Wholesale Trade (91.5%), whereas the industries that tend to have a higher number of women are Public Administration (94.6%), Health Care & Social Assistance (77.2%), and Educational Services (72.0%).
| Industry | Male | Female |
| Agriculture, Fishing & Hunting | 0 (0.0%) | 0 (0.0%) |
| Mining, Quarrying, & Extraction | 0 (0.0%) | 0 (0.0%) |
| Construction | 87 (74.4%) | 30 (25.6%) |
| Manufacturing | 241 (69.5%) | 106 (30.5%) |
| Wholesale Trade | 204 (91.5%) | 19 (8.5%) |
| Retail Trade | 280 (39.4%) | 431 (60.6%) |
| Transportation & Warehousing | 319 (91.7%) | 29 (8.3%) |
| Utilities | 75 (100.0%) | 0 (0.0%) |
| Information | 37 (46.8%) | 42 (53.2%) |
| Finance & Insurance | 245 (32.7%) | 505 (67.3%) |
| Real Estate, Rental & Leasing | 14 (31.1%) | 31 (68.9%) |
| Professional & Scientific | 171 (38.3%) | 276 (61.7%) |
| Enterprise Management | 0 (0.0%) | 0 (0.0%) |
| Administrative & Support | 53 (38.4%) | 85 (61.6%) |
| Educational Services | 148 (28.0%) | 381 (72.0%) |
| Health Care & Social Assistance | 323 (22.8%) | 1,097 (77.2%) |
| Arts, Entertainment & Recreation | 45 (72.6%) | 17 (27.4%) |
| Accommodation & Food Services | 130 (43.6%) | 168 (56.4%) |
| Public Administration | 14 (5.4%) | 243 (94.6%) |
| Total | 2,446 (40.4%) | 3,615 (59.6%) |
Education in Progress Village
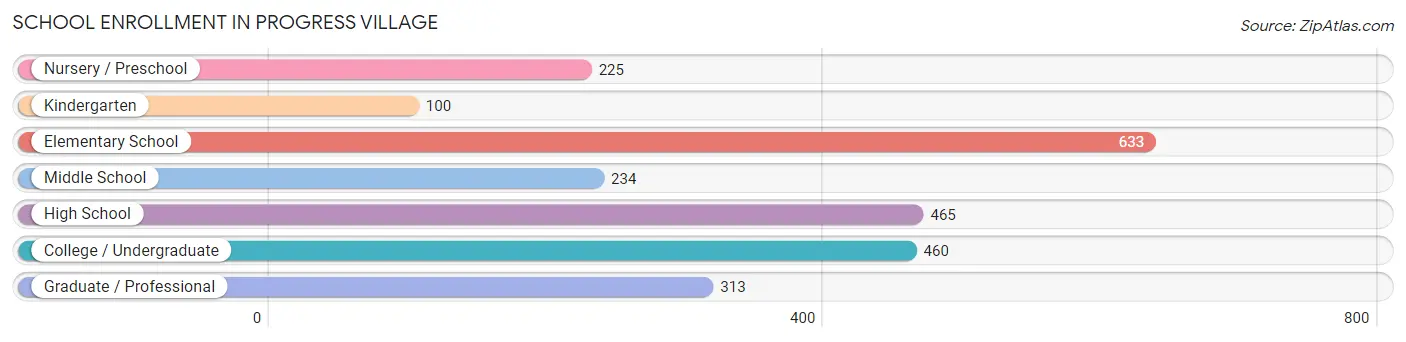
School Enrollment in Progress Village
The most common levels of schooling among the 2,430 students in Progress Village are elementary school (633 | 26.1%), high school (465 | 19.1%), and college / undergraduate (460 | 18.9%).
| School Level | # Students | % Students |
| Nursery / Preschool | 225 | 9.3% |
| Kindergarten | 100 | 4.1% |
| Elementary School | 633 | 26.1% |
| Middle School | 234 | 9.6% |
| High School | 465 | 19.1% |
| College / Undergraduate | 460 | 18.9% |
| Graduate / Professional | 313 | 12.9% |
| Total | 2,430 | 100.0% |
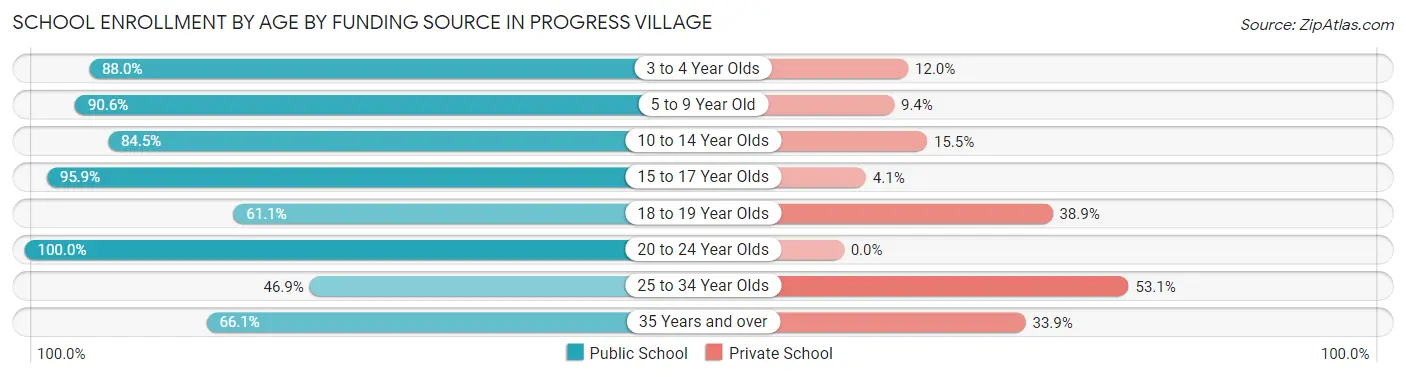
School Enrollment by Age by Funding Source in Progress Village
Out of a total of 2,430 students who are enrolled in schools in Progress Village, 501 (20.6%) attend a private institution, while the remaining 1,929 (79.4%) are enrolled in public schools. The age group of 25 to 34 year olds has the highest likelihood of being enrolled in private schools, with 259 (53.1% in the age bracket) enrolled. Conversely, the age group of 20 to 24 year olds has the lowest likelihood of being enrolled in a private school, with 128 (100.0% in the age bracket) attending a public institution.
| Age Bracket | Public School | Private School |
| 3 to 4 Year Olds | 198 (88.0%) | 27 (12.0%) |
| 5 to 9 Year Old | 454 (90.6%) | 47 (9.4%) |
| 10 to 14 Year Olds | 506 (84.5%) | 93 (15.5%) |
| 15 to 17 Year Olds | 301 (95.9%) | 13 (4.1%) |
| 18 to 19 Year Olds | 33 (61.1%) | 21 (38.9%) |
| 20 to 24 Year Olds | 128 (100.0%) | 0 (0.0%) |
| 25 to 34 Year Olds | 229 (46.9%) | 259 (53.1%) |
| 35 Years and over | 80 (66.1%) | 41 (33.9%) |
| Total | 1,929 (79.4%) | 501 (20.6%) |
Educational Attainment by Field of Study in Progress Village
Business (682 | 21.9%), psychology (401 | 12.9%), science & technology (388 | 12.5%), education (363 | 11.7%), and engineering (355 | 11.4%) are the most common fields of study among 3,112 individuals in Progress Village who have obtained a bachelor's degree or higher.
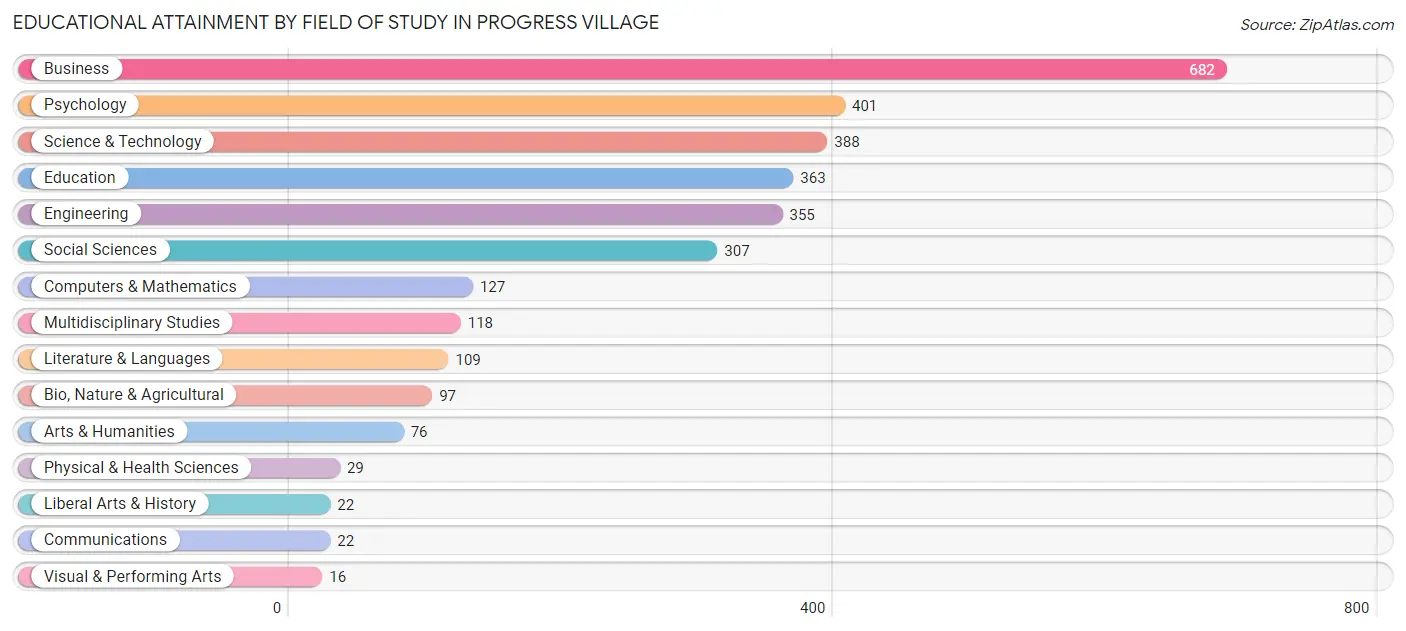
| Field of Study | # Graduates | % Graduates |
| Computers & Mathematics | 127 | 4.1% |
| Bio, Nature & Agricultural | 97 | 3.1% |
| Physical & Health Sciences | 29 | 0.9% |
| Psychology | 401 | 12.9% |
| Social Sciences | 307 | 9.9% |
| Engineering | 355 | 11.4% |
| Multidisciplinary Studies | 118 | 3.8% |
| Science & Technology | 388 | 12.5% |
| Business | 682 | 21.9% |
| Education | 363 | 11.7% |
| Literature & Languages | 109 | 3.5% |
| Liberal Arts & History | 22 | 0.7% |
| Visual & Performing Arts | 16 | 0.5% |
| Communications | 22 | 0.7% |
| Arts & Humanities | 76 | 2.4% |
| Total | 3,112 | 100.0% |
Transportation & Commute in Progress Village
Vehicle Availability by Sex in Progress Village
The most prevalent vehicle ownership categories in Progress Village are males with 2 vehicles (1,247, accounting for 49.1%) and females with 2 vehicles (1,634, making up 34.5%).
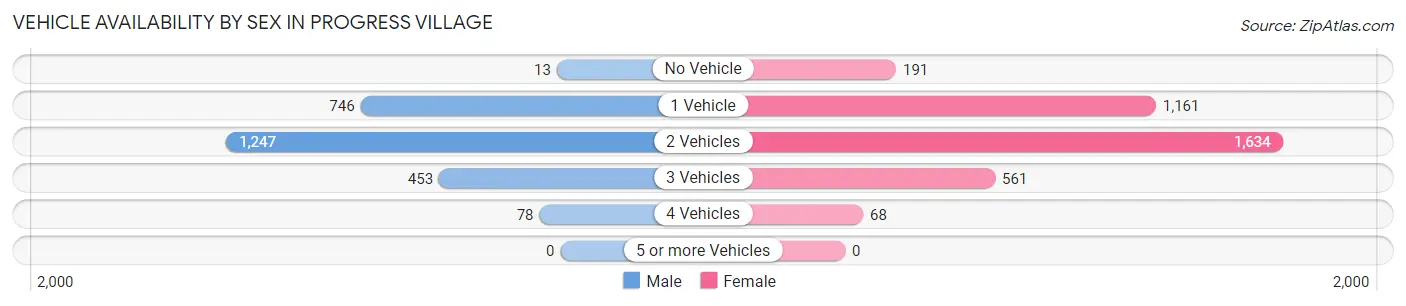
| Vehicles Available | Male | Female |
| No Vehicle | 13 (0.5%) | 191 (5.3%) |
| 1 Vehicle | 746 (29.4%) | 1,161 (32.1%) |
| 2 Vehicles | 1,247 (49.1%) | 1,634 (45.2%) |
| 3 Vehicles | 453 (17.9%) | 561 (15.5%) |
| 4 Vehicles | 78 (3.1%) | 68 (1.9%) |
| 5 or more Vehicles | 0 (0.0%) | 0 (0.0%) |
| Total | 2,537 (100.0%) | 3,615 (100.0%) |
Commute Time in Progress Village
The most frequently occuring commute durations in Progress Village are 30 to 34 minutes (994 commuters, 19.3%), 45 to 59 minutes (831 commuters, 16.1%), and 20 to 24 minutes (696 commuters, 13.5%).
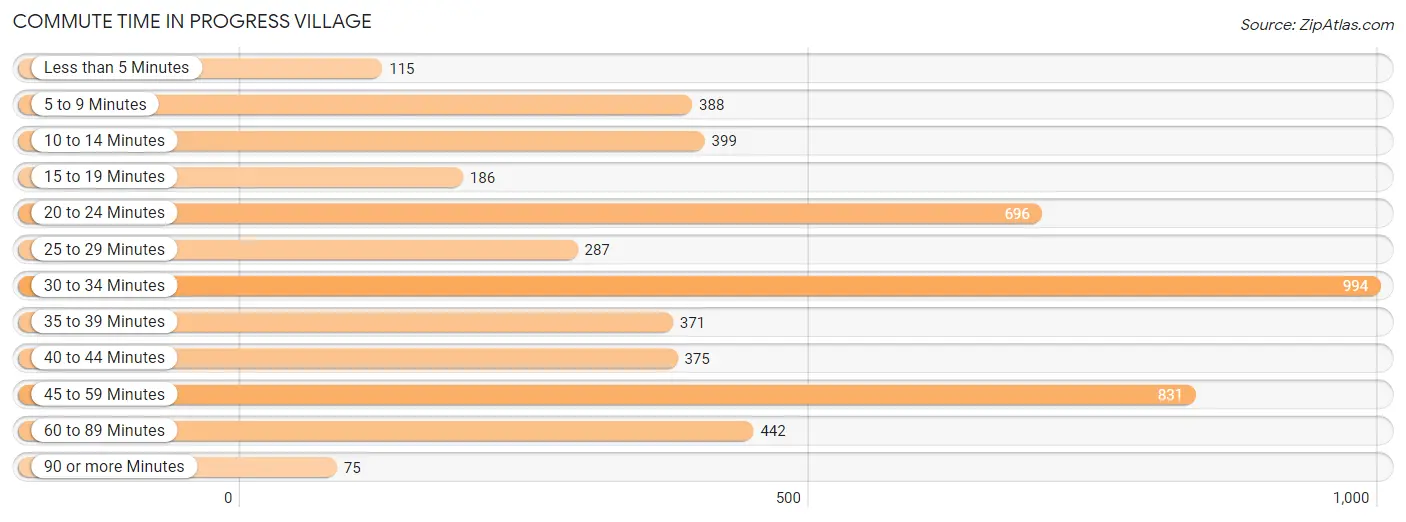
| Commute Time | # Commuters | % Commuters |
| Less than 5 Minutes | 115 | 2.2% |
| 5 to 9 Minutes | 388 | 7.5% |
| 10 to 14 Minutes | 399 | 7.7% |
| 15 to 19 Minutes | 186 | 3.6% |
| 20 to 24 Minutes | 696 | 13.5% |
| 25 to 29 Minutes | 287 | 5.6% |
| 30 to 34 Minutes | 994 | 19.3% |
| 35 to 39 Minutes | 371 | 7.2% |
| 40 to 44 Minutes | 375 | 7.3% |
| 45 to 59 Minutes | 831 | 16.1% |
| 60 to 89 Minutes | 442 | 8.6% |
| 90 or more Minutes | 75 | 1.5% |
Commute Time by Sex in Progress Village
The most common commute times in Progress Village are 45 to 59 minutes (512 commuters, 23.4%) for males and 30 to 34 minutes (561 commuters, 18.9%) for females.
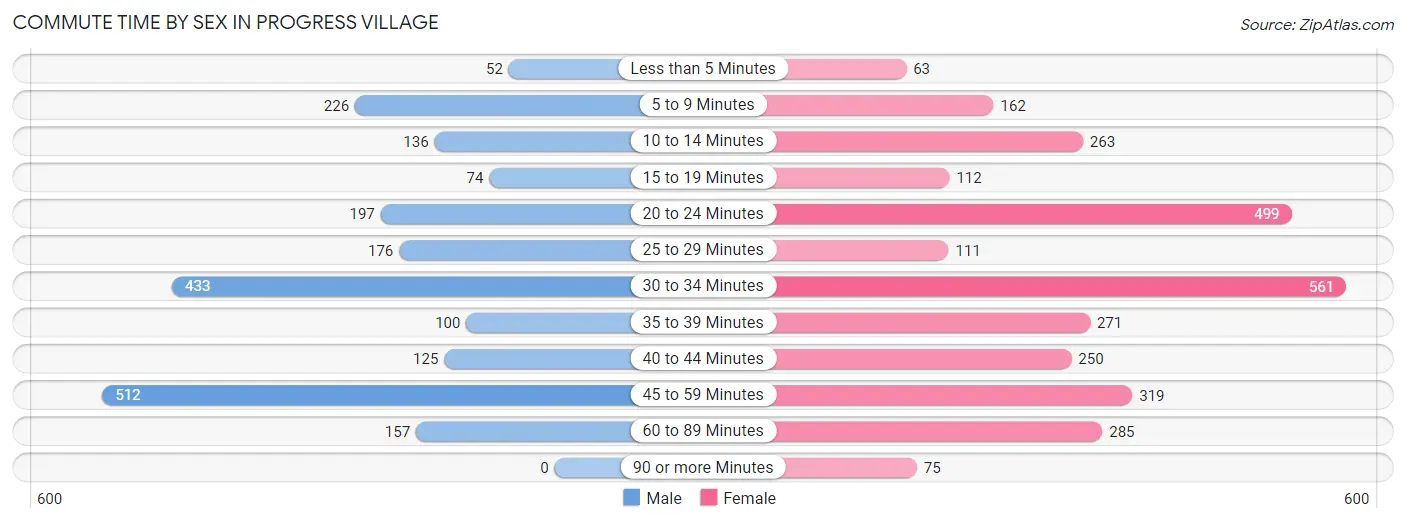
| Commute Time | Male | Female |
| Less than 5 Minutes | 52 (2.4%) | 63 (2.1%) |
| 5 to 9 Minutes | 226 (10.3%) | 162 (5.4%) |
| 10 to 14 Minutes | 136 (6.2%) | 263 (8.8%) |
| 15 to 19 Minutes | 74 (3.4%) | 112 (3.8%) |
| 20 to 24 Minutes | 197 (9.0%) | 499 (16.8%) |
| 25 to 29 Minutes | 176 (8.0%) | 111 (3.7%) |
| 30 to 34 Minutes | 433 (19.8%) | 561 (18.9%) |
| 35 to 39 Minutes | 100 (4.6%) | 271 (9.1%) |
| 40 to 44 Minutes | 125 (5.7%) | 250 (8.4%) |
| 45 to 59 Minutes | 512 (23.4%) | 319 (10.7%) |
| 60 to 89 Minutes | 157 (7.2%) | 285 (9.6%) |
| 90 or more Minutes | 0 (0.0%) | 75 (2.5%) |
Time of Departure to Work by Sex in Progress Village
The most frequent times of departure to work in Progress Village are 8:00 AM to 8:29 AM (453, 20.7%) for males and 7:00 AM to 7:29 AM (750, 25.2%) for females.
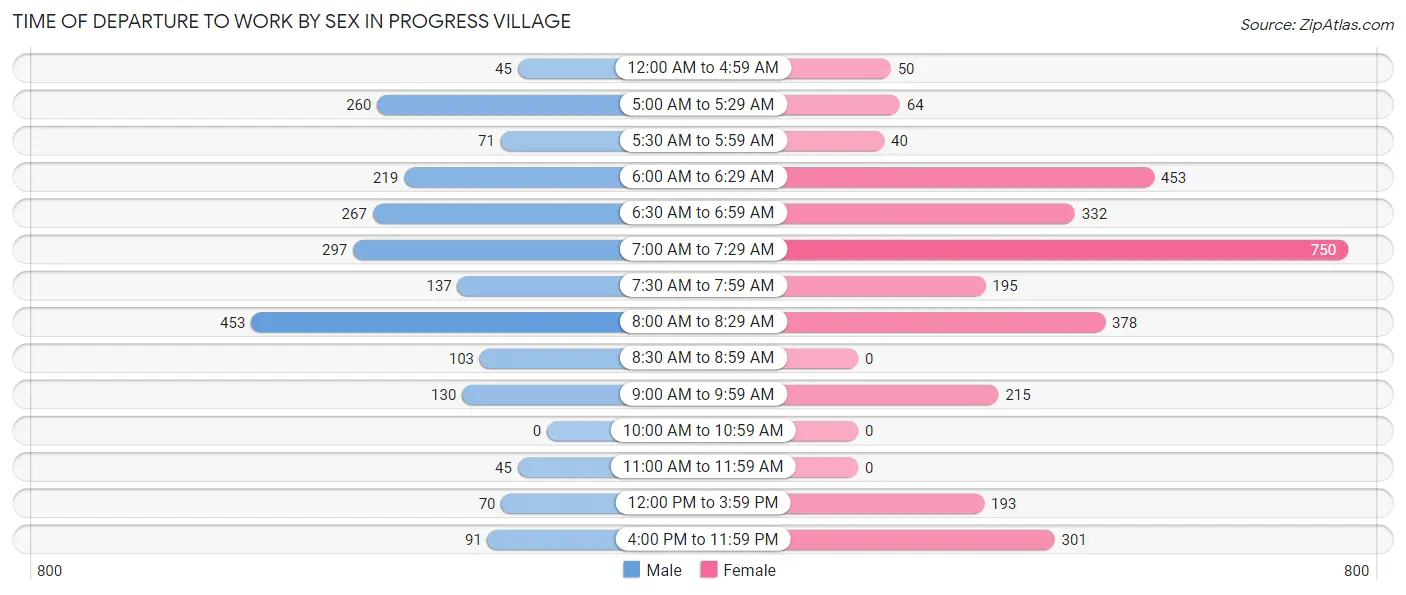
| Time of Departure | Male | Female |
| 12:00 AM to 4:59 AM | 45 (2.1%) | 50 (1.7%) |
| 5:00 AM to 5:29 AM | 260 (11.9%) | 64 (2.1%) |
| 5:30 AM to 5:59 AM | 71 (3.2%) | 40 (1.3%) |
| 6:00 AM to 6:29 AM | 219 (10.0%) | 453 (15.2%) |
| 6:30 AM to 6:59 AM | 267 (12.2%) | 332 (11.2%) |
| 7:00 AM to 7:29 AM | 297 (13.6%) | 750 (25.2%) |
| 7:30 AM to 7:59 AM | 137 (6.3%) | 195 (6.6%) |
| 8:00 AM to 8:29 AM | 453 (20.7%) | 378 (12.7%) |
| 8:30 AM to 8:59 AM | 103 (4.7%) | 0 (0.0%) |
| 9:00 AM to 9:59 AM | 130 (5.9%) | 215 (7.2%) |
| 10:00 AM to 10:59 AM | 0 (0.0%) | 0 (0.0%) |
| 11:00 AM to 11:59 AM | 45 (2.1%) | 0 (0.0%) |
| 12:00 PM to 3:59 PM | 70 (3.2%) | 193 (6.5%) |
| 4:00 PM to 11:59 PM | 91 (4.2%) | 301 (10.1%) |
| Total | 2,188 (100.0%) | 2,971 (100.0%) |
Housing Occupancy in Progress Village
Occupancy by Ownership in Progress Village
Of the total 4,326 dwellings in Progress Village, owner-occupied units account for 2,974 (68.8%), while renter-occupied units make up 1,352 (31.2%).
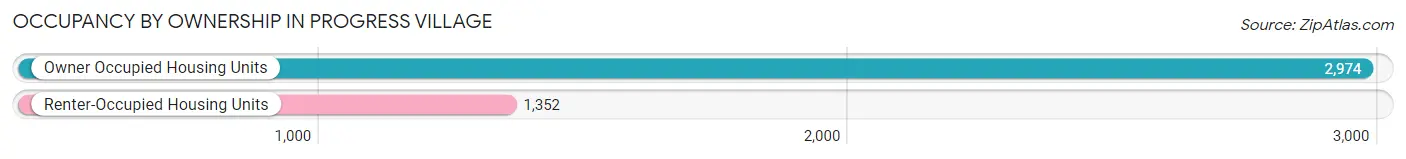
| Occupancy | # Housing Units | % Housing Units |
| Owner Occupied Housing Units | 2,974 | 68.8% |
| Renter-Occupied Housing Units | 1,352 | 31.2% |
| Total Occupied Housing Units | 4,326 | 100.0% |
Occupancy by Household Size in Progress Village
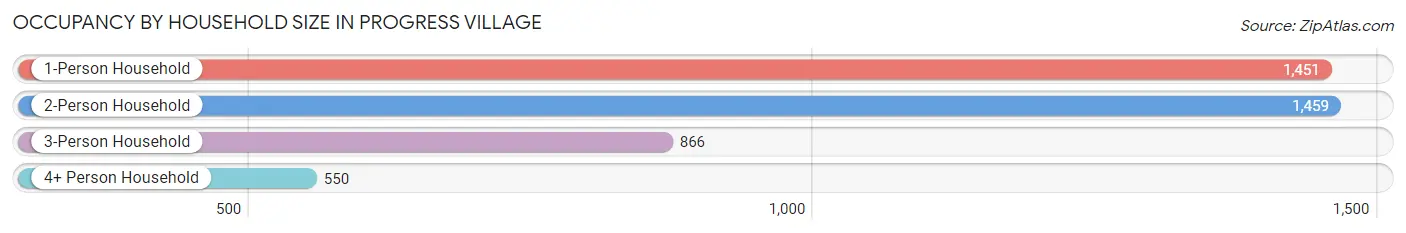
| Household Size | # Housing Units | % Housing Units |
| 1-Person Household | 1,451 | 33.5% |
| 2-Person Household | 1,459 | 33.7% |
| 3-Person Household | 866 | 20.0% |
| 4+ Person Household | 550 | 12.7% |
| Total Housing Units | 4,326 | 100.0% |
Occupancy by Ownership by Household Size in Progress Village
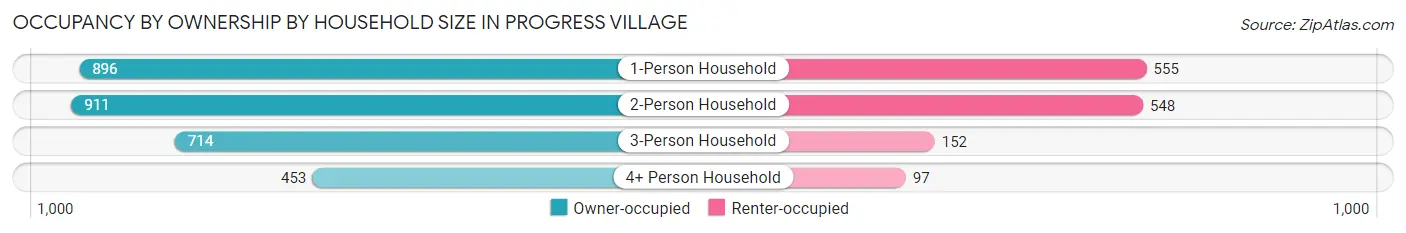
| Household Size | Owner-occupied | Renter-occupied |
| 1-Person Household | 896 (61.8%) | 555 (38.3%) |
| 2-Person Household | 911 (62.4%) | 548 (37.6%) |
| 3-Person Household | 714 (82.5%) | 152 (17.5%) |
| 4+ Person Household | 453 (82.4%) | 97 (17.6%) |
| Total Housing Units | 2,974 (68.8%) | 1,352 (31.2%) |
Occupancy by Educational Attainment in Progress Village
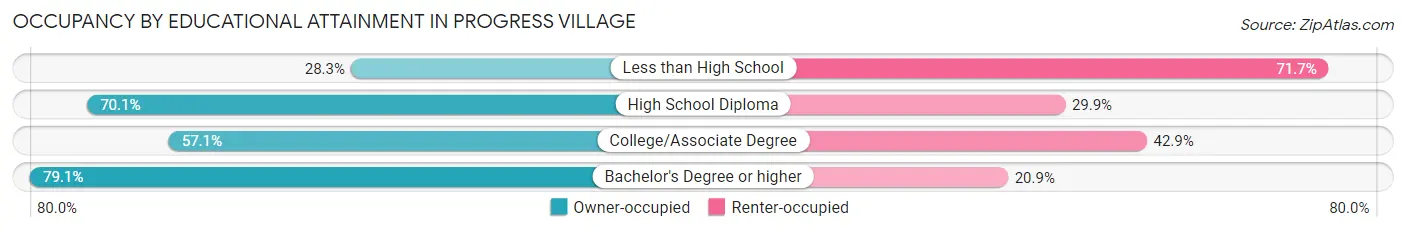
| Household Size | Owner-occupied | Renter-occupied |
| Less than High School | 13 (28.3%) | 33 (71.7%) |
| High School Diploma | 784 (70.1%) | 335 (29.9%) |
| College/Associate Degree | 842 (57.1%) | 632 (42.9%) |
| Bachelor's Degree or higher | 1,335 (79.1%) | 352 (20.9%) |
Occupancy by Age of Householder in Progress Village
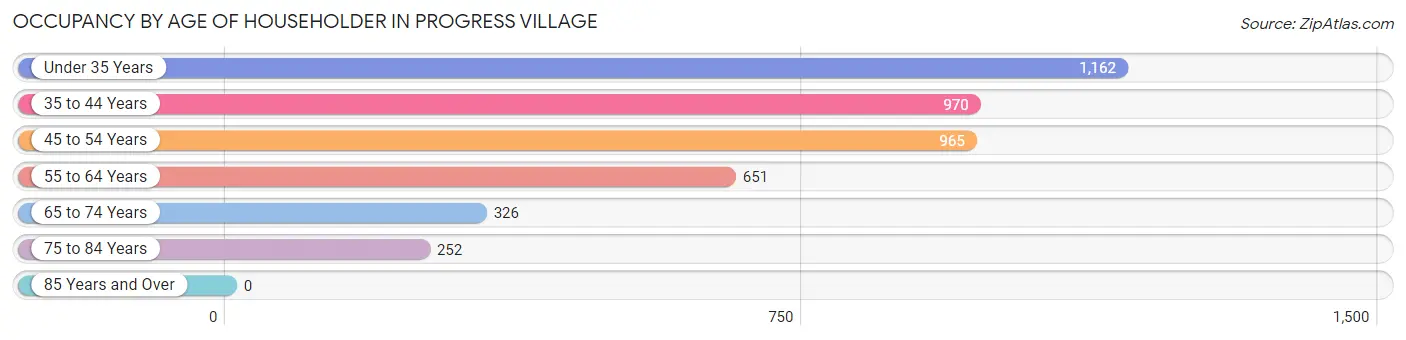
| Age Bracket | # Households | % Households |
| Under 35 Years | 1,162 | 26.9% |
| 35 to 44 Years | 970 | 22.4% |
| 45 to 54 Years | 965 | 22.3% |
| 55 to 64 Years | 651 | 15.0% |
| 65 to 74 Years | 326 | 7.5% |
| 75 to 84 Years | 252 | 5.8% |
| 85 Years and Over | 0 | 0.0% |
| Total | 4,326 | 100.0% |
Housing Finances in Progress Village
Median Income by Occupancy in Progress Village
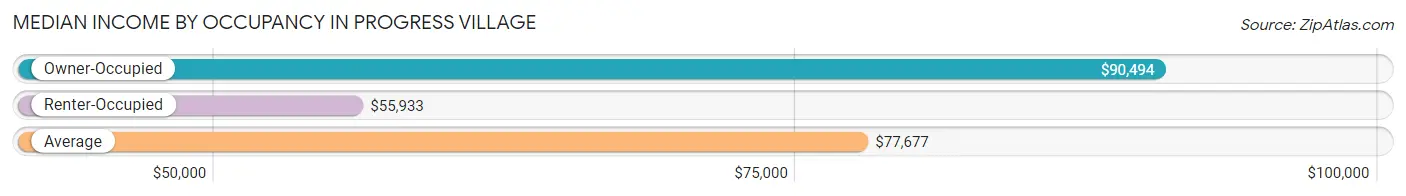
| Occupancy Type | # Households | Median Income |
| Owner-Occupied | 2,974 (68.8%) | $90,494 |
| Renter-Occupied | 1,352 (31.2%) | $55,933 |
| Average | 4,326 (100.0%) | $77,677 |
Occupancy by Householder Income Bracket in Progress Village
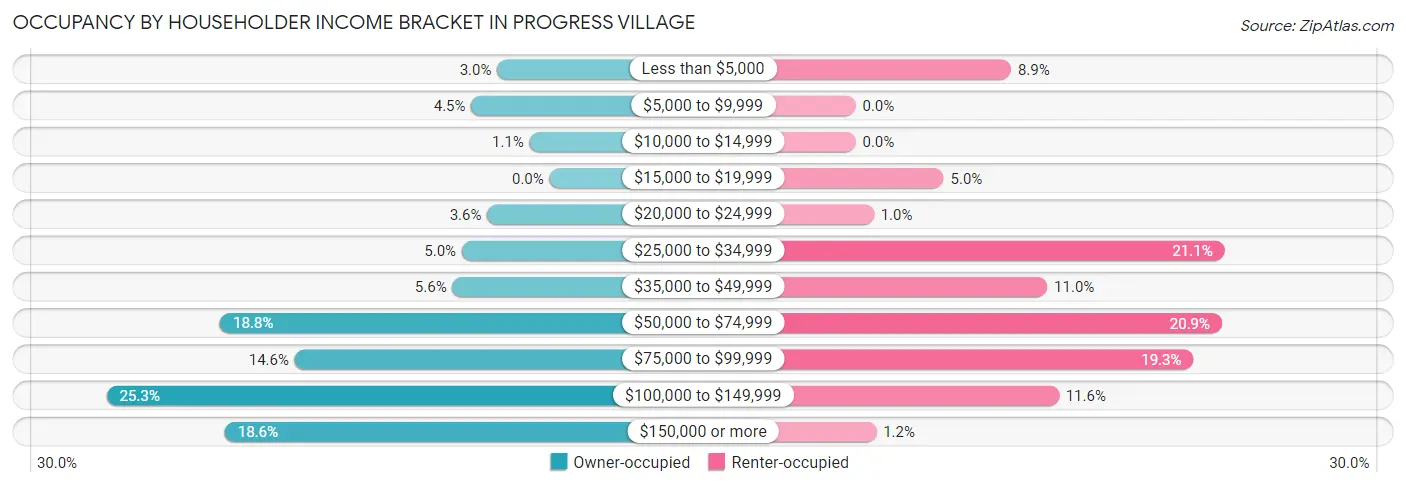
| Income Bracket | Owner-occupied | Renter-occupied |
| Less than $5,000 | 89 (3.0%) | 120 (8.9%) |
| $5,000 to $9,999 | 133 (4.5%) | 0 (0.0%) |
| $10,000 to $14,999 | 34 (1.1%) | 0 (0.0%) |
| $15,000 to $19,999 | 0 (0.0%) | 68 (5.0%) |
| $20,000 to $24,999 | 106 (3.6%) | 14 (1.0%) |
| $25,000 to $34,999 | 149 (5.0%) | 285 (21.1%) |
| $35,000 to $49,999 | 165 (5.6%) | 148 (11.0%) |
| $50,000 to $74,999 | 560 (18.8%) | 283 (20.9%) |
| $75,000 to $99,999 | 433 (14.6%) | 261 (19.3%) |
| $100,000 to $149,999 | 753 (25.3%) | 157 (11.6%) |
| $150,000 or more | 552 (18.6%) | 16 (1.2%) |
| Total | 2,974 (100.0%) | 1,352 (100.0%) |
Monthly Housing Cost Tiers in Progress Village
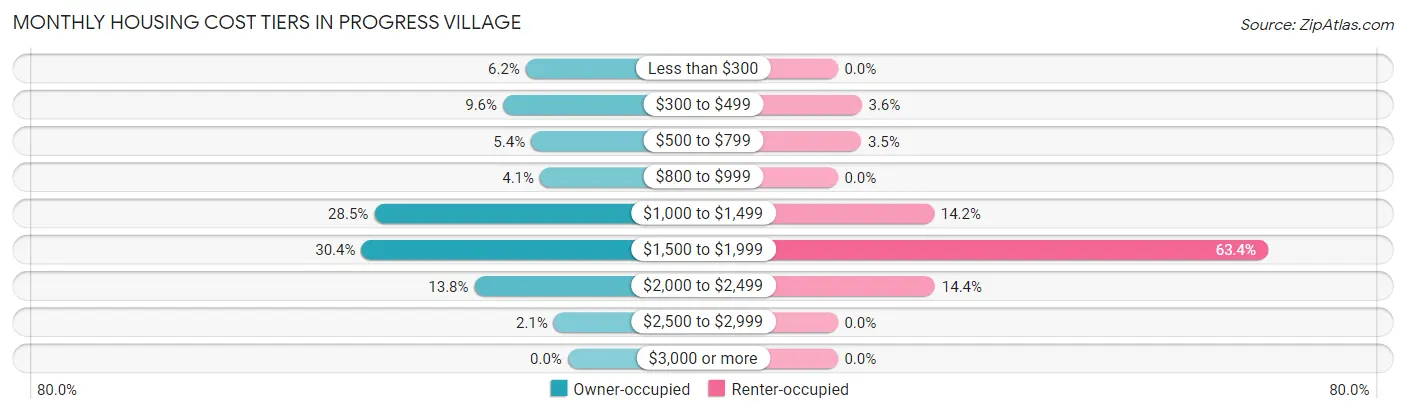
| Monthly Cost | Owner-occupied | Renter-occupied |
| Less than $300 | 184 (6.2%) | 0 (0.0%) |
| $300 to $499 | 284 (9.6%) | 48 (3.5%) |
| $500 to $799 | 161 (5.4%) | 47 (3.5%) |
| $800 to $999 | 122 (4.1%) | 0 (0.0%) |
| $1,000 to $1,499 | 848 (28.5%) | 192 (14.2%) |
| $1,500 to $1,999 | 904 (30.4%) | 857 (63.4%) |
| $2,000 to $2,499 | 409 (13.8%) | 194 (14.3%) |
| $2,500 to $2,999 | 62 (2.1%) | 0 (0.0%) |
| $3,000 or more | 0 (0.0%) | 0 (0.0%) |
| Total | 2,974 (100.0%) | 1,352 (100.0%) |
Physical Housing Characteristics in Progress Village
Housing Structures in Progress Village
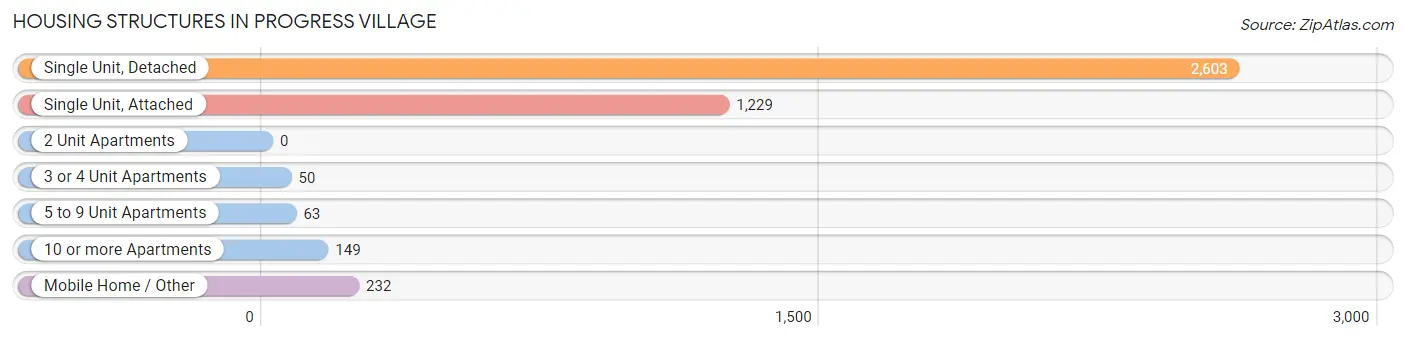
| Structure Type | # Housing Units | % Housing Units |
| Single Unit, Detached | 2,603 | 60.2% |
| Single Unit, Attached | 1,229 | 28.4% |
| 2 Unit Apartments | 0 | 0.0% |
| 3 or 4 Unit Apartments | 50 | 1.2% |
| 5 to 9 Unit Apartments | 63 | 1.5% |
| 10 or more Apartments | 149 | 3.4% |
| Mobile Home / Other | 232 | 5.4% |
| Total | 4,326 | 100.0% |
Housing Structures by Occupancy in Progress Village
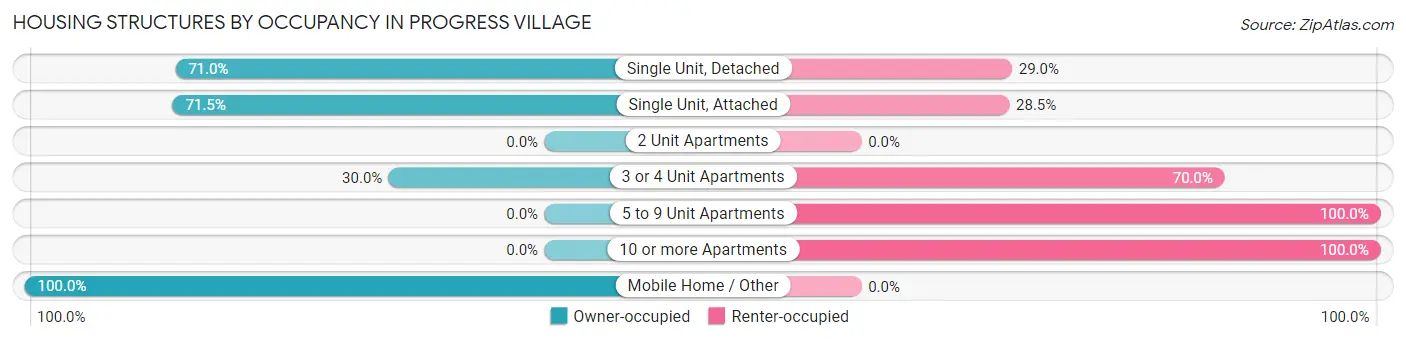
| Structure Type | Owner-occupied | Renter-occupied |
| Single Unit, Detached | 1,848 (71.0%) | 755 (29.0%) |
| Single Unit, Attached | 879 (71.5%) | 350 (28.5%) |
| 2 Unit Apartments | 0 (0.0%) | 0 (0.0%) |
| 3 or 4 Unit Apartments | 15 (30.0%) | 35 (70.0%) |
| 5 to 9 Unit Apartments | 0 (0.0%) | 63 (100.0%) |
| 10 or more Apartments | 0 (0.0%) | 149 (100.0%) |
| Mobile Home / Other | 232 (100.0%) | 0 (0.0%) |
| Total | 2,974 (68.8%) | 1,352 (31.2%) |
Housing Structures by Number of Rooms in Progress Village
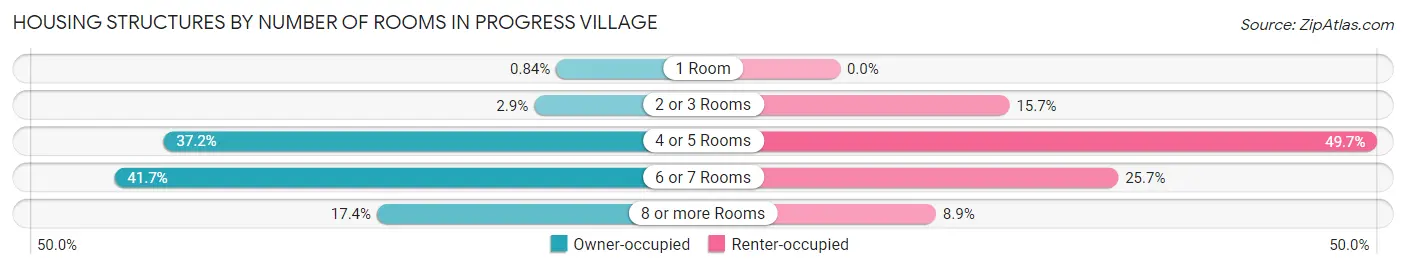
| Number of Rooms | Owner-occupied | Renter-occupied |
| 1 Room | 25 (0.8%) | 0 (0.0%) |
| 2 or 3 Rooms | 86 (2.9%) | 212 (15.7%) |
| 4 or 5 Rooms | 1,105 (37.2%) | 672 (49.7%) |
| 6 or 7 Rooms | 1,240 (41.7%) | 348 (25.7%) |
| 8 or more Rooms | 518 (17.4%) | 120 (8.9%) |
| Total | 2,974 (100.0%) | 1,352 (100.0%) |
Housing Structure by Heating Type in Progress Village
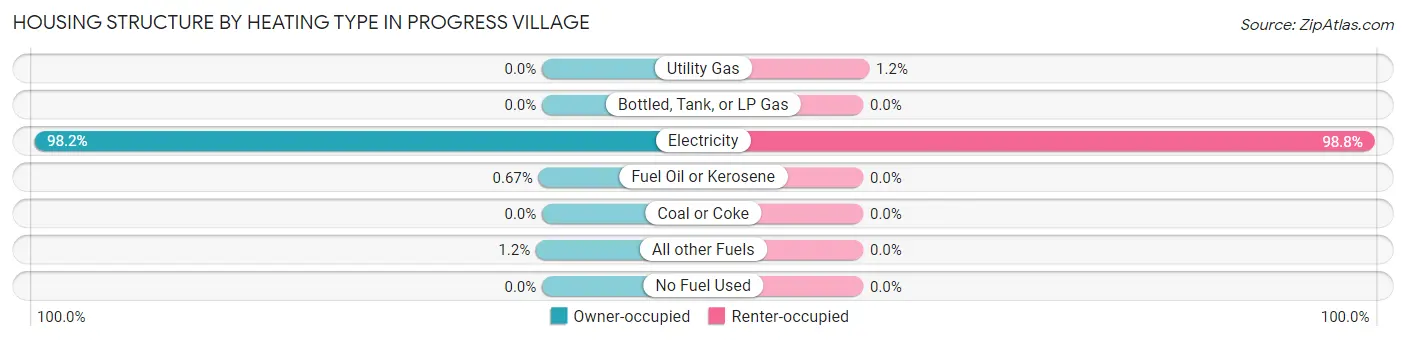
| Heating Type | Owner-occupied | Renter-occupied |
| Utility Gas | 0 (0.0%) | 16 (1.2%) |
| Bottled, Tank, or LP Gas | 0 (0.0%) | 0 (0.0%) |
| Electricity | 2,919 (98.2%) | 1,336 (98.8%) |
| Fuel Oil or Kerosene | 20 (0.7%) | 0 (0.0%) |
| Coal or Coke | 0 (0.0%) | 0 (0.0%) |
| All other Fuels | 35 (1.2%) | 0 (0.0%) |
| No Fuel Used | 0 (0.0%) | 0 (0.0%) |
| Total | 2,974 (100.0%) | 1,352 (100.0%) |
Household Vehicle Usage in Progress Village
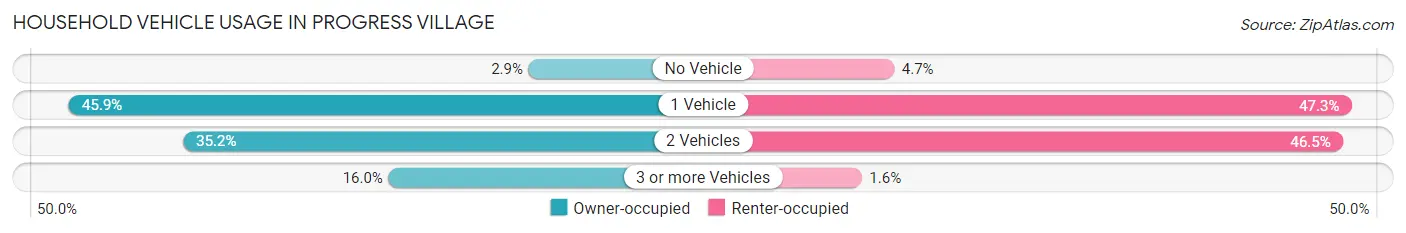
| Vehicles per Household | Owner-occupied | Renter-occupied |
| No Vehicle | 87 (2.9%) | 63 (4.7%) |
| 1 Vehicle | 1,364 (45.9%) | 639 (47.3%) |
| 2 Vehicles | 1,047 (35.2%) | 628 (46.5%) |
| 3 or more Vehicles | 476 (16.0%) | 22 (1.6%) |
| Total | 2,974 (100.0%) | 1,352 (100.0%) |
Real Estate & Mortgages in Progress Village
Real Estate and Mortgage Overview in Progress Village
| Characteristic | Without Mortgage | With Mortgage |
| Housing Units | 593 | 2,381 |
| Median Property Value | $171,400 | $250,400 |
| Median Household Income | - | - |
| Monthly Housing Costs | $345 | $0 |
| Real Estate Taxes | $674 | $40 |
Property Value by Mortgage Status in Progress Village
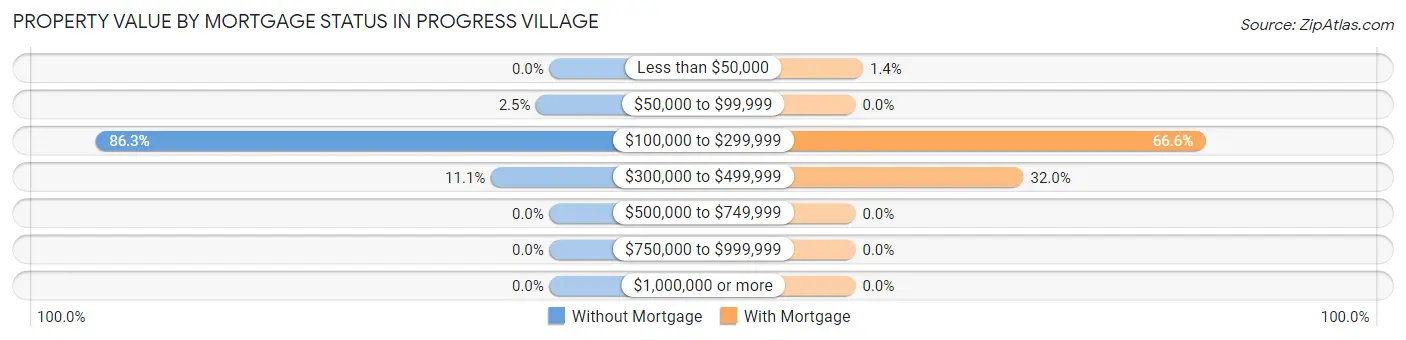
| Property Value | Without Mortgage | With Mortgage |
| Less than $50,000 | 0 (0.0%) | 34 (1.4%) |
| $50,000 to $99,999 | 15 (2.5%) | 0 (0.0%) |
| $100,000 to $299,999 | 512 (86.3%) | 1,585 (66.6%) |
| $300,000 to $499,999 | 66 (11.1%) | 762 (32.0%) |
| $500,000 to $749,999 | 0 (0.0%) | 0 (0.0%) |
| $750,000 to $999,999 | 0 (0.0%) | 0 (0.0%) |
| $1,000,000 or more | 0 (0.0%) | 0 (0.0%) |
| Total | 593 (100.0%) | 2,381 (100.0%) |
Household Income by Mortgage Status in Progress Village
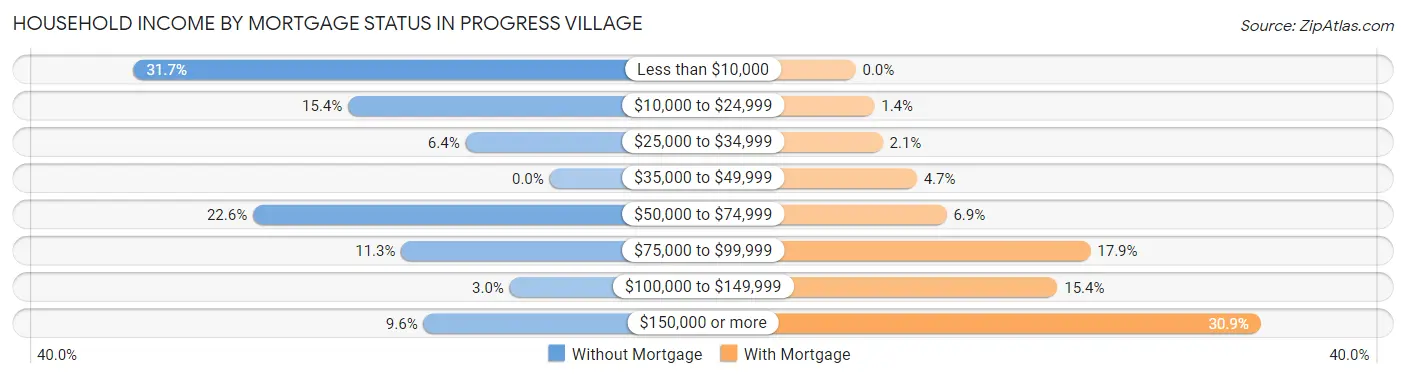
| Household Income | Without Mortgage | With Mortgage |
| Less than $10,000 | 188 (31.7%) | 0 (0.0%) |
| $10,000 to $24,999 | 91 (15.3%) | 34 (1.4%) |
| $25,000 to $34,999 | 38 (6.4%) | 49 (2.1%) |
| $35,000 to $49,999 | 0 (0.0%) | 111 (4.7%) |
| $50,000 to $74,999 | 134 (22.6%) | 165 (6.9%) |
| $75,000 to $99,999 | 67 (11.3%) | 426 (17.9%) |
| $100,000 to $149,999 | 18 (3.0%) | 366 (15.4%) |
| $150,000 or more | 57 (9.6%) | 735 (30.9%) |
| Total | 593 (100.0%) | 2,381 (100.0%) |
Property Value to Household Income Ratio in Progress Village
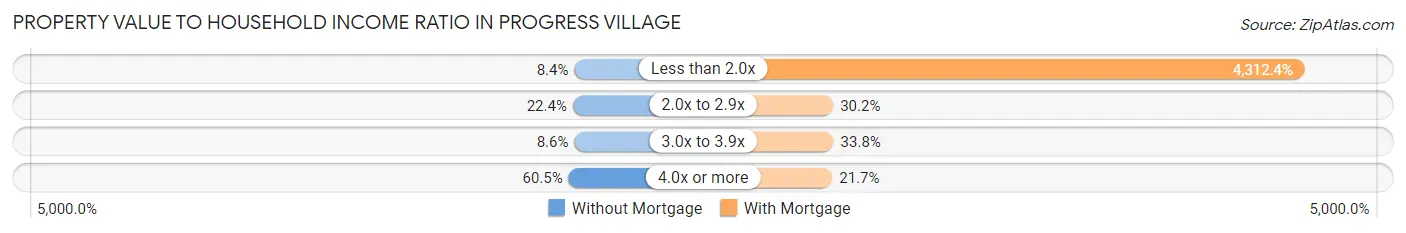
| Value-to-Income Ratio | Without Mortgage | With Mortgage |
| Less than 2.0x | 50 (8.4%) | 102,679 (4,312.4%) |
| 2.0x to 2.9x | 133 (22.4%) | 719 (30.2%) |
| 3.0x to 3.9x | 51 (8.6%) | 804 (33.8%) |
| 4.0x or more | 359 (60.5%) | 516 (21.7%) |
| Total | 593 (100.0%) | 2,381 (100.0%) |
Real Estate Taxes by Mortgage Status in Progress Village
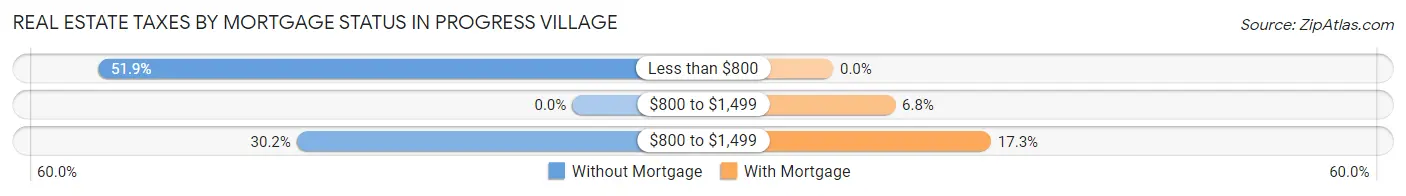
| Property Taxes | Without Mortgage | With Mortgage |
| Less than $800 | 308 (51.9%) | 0 (0.0%) |
| $800 to $1,499 | 0 (0.0%) | 162 (6.8%) |
| $800 to $1,499 | 179 (30.2%) | 412 (17.3%) |
| Total | 593 (100.0%) | 2,381 (100.0%) |
Health & Disability in Progress Village
Health Insurance Coverage by Age in Progress Village
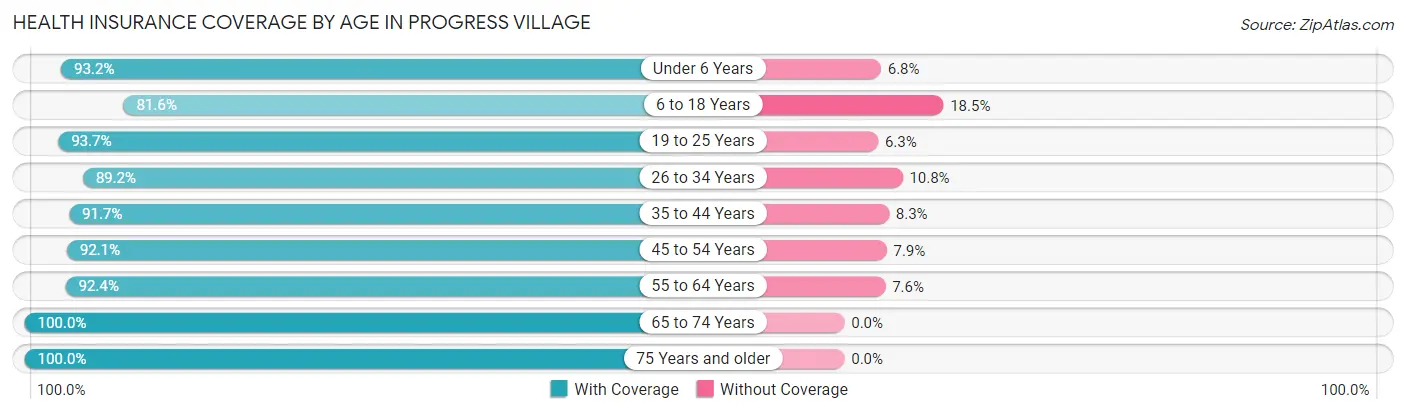
| Age Bracket | With Coverage | Without Coverage |
| Under 6 Years | 809 (93.2%) | 59 (6.8%) |
| 6 to 18 Years | 1,105 (81.6%) | 250 (18.4%) |
| 19 to 25 Years | 612 (93.7%) | 41 (6.3%) |
| 26 to 34 Years | 2,082 (89.2%) | 253 (10.8%) |
| 35 to 44 Years | 1,082 (91.7%) | 98 (8.3%) |
| 45 to 54 Years | 1,379 (92.1%) | 118 (7.9%) |
| 55 to 64 Years | 1,163 (92.4%) | 96 (7.6%) |
| 65 to 74 Years | 547 (100.0%) | 0 (0.0%) |
| 75 Years and older | 311 (100.0%) | 0 (0.0%) |
| Total | 9,090 (90.8%) | 915 (9.1%) |
Health Insurance Coverage by Citizenship Status in Progress Village
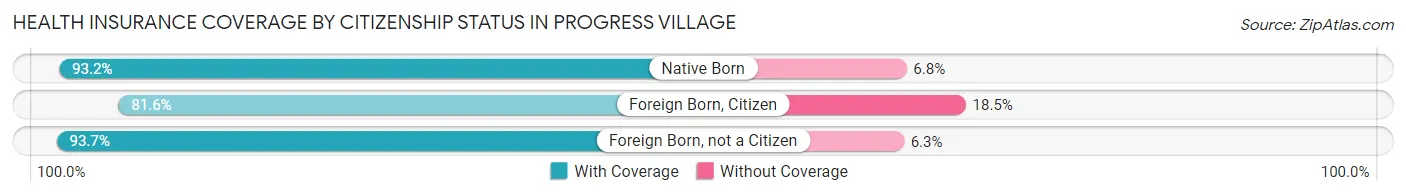
| Citizenship Status | With Coverage | Without Coverage |
| Native Born | 809 (93.2%) | 59 (6.8%) |
| Foreign Born, Citizen | 1,105 (81.6%) | 250 (18.4%) |
| Foreign Born, not a Citizen | 612 (93.7%) | 41 (6.3%) |
Health Insurance Coverage by Household Income in Progress Village
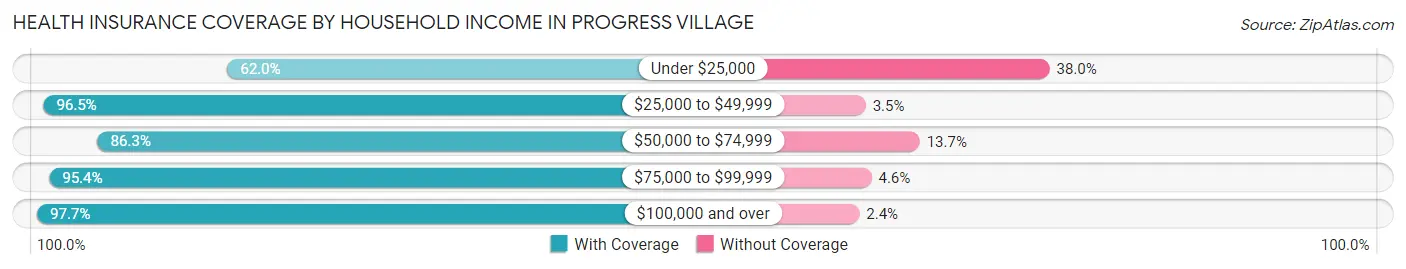
| Household Income | With Coverage | Without Coverage |
| Under $25,000 | 741 (62.0%) | 454 (38.0%) |
| $25,000 to $49,999 | 1,473 (96.5%) | 54 (3.5%) |
| $50,000 to $74,999 | 1,548 (86.3%) | 245 (13.7%) |
| $75,000 to $99,999 | 1,379 (95.4%) | 67 (4.6%) |
| $100,000 and over | 3,949 (97.7%) | 95 (2.4%) |
Public vs Private Health Insurance Coverage by Age in Progress Village
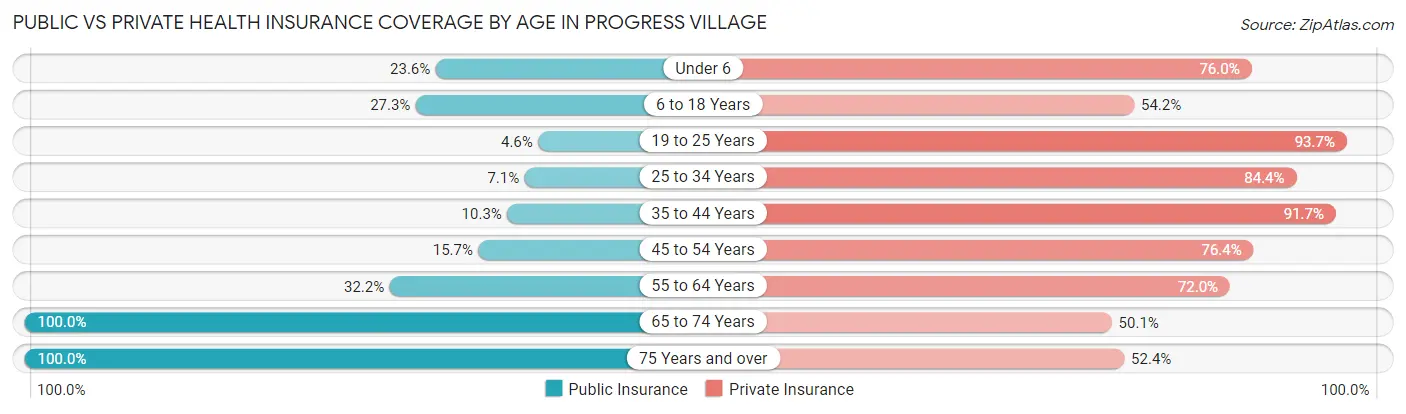
| Age Bracket | Public Insurance | Private Insurance |
| Under 6 | 205 (23.6%) | 660 (76.0%) |
| 6 to 18 Years | 370 (27.3%) | 735 (54.2%) |
| 19 to 25 Years | 30 (4.6%) | 612 (93.7%) |
| 25 to 34 Years | 166 (7.1%) | 1,970 (84.4%) |
| 35 to 44 Years | 122 (10.3%) | 1,082 (91.7%) |
| 45 to 54 Years | 235 (15.7%) | 1,144 (76.4%) |
| 55 to 64 Years | 405 (32.2%) | 907 (72.0%) |
| 65 to 74 Years | 547 (100.0%) | 274 (50.1%) |
| 75 Years and over | 311 (100.0%) | 163 (52.4%) |
| Total | 2,391 (23.9%) | 7,547 (75.4%) |
Disability Status by Sex by Age in Progress Village
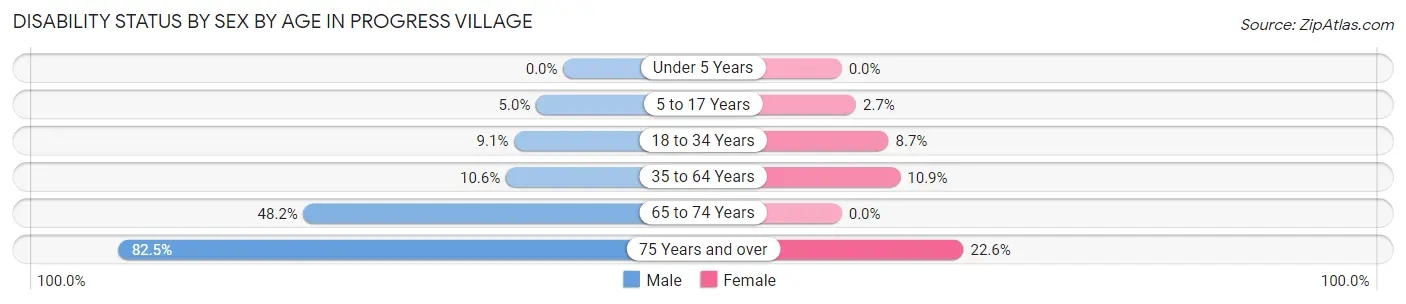
| Age Bracket | Male | Female |
| Under 5 Years | 0 (0.0%) | 0 (0.0%) |
| 5 to 17 Years | 38 (5.0%) | 18 (2.7%) |
| 18 to 34 Years | 106 (9.1%) | 160 (8.7%) |
| 35 to 64 Years | 176 (10.6%) | 248 (10.9%) |
| 65 to 74 Years | 134 (48.2%) | 0 (0.0%) |
| 75 Years and over | 85 (82.5%) | 47 (22.6%) |
Disability Class by Sex by Age in Progress Village
Disability Class: Hearing Difficulty
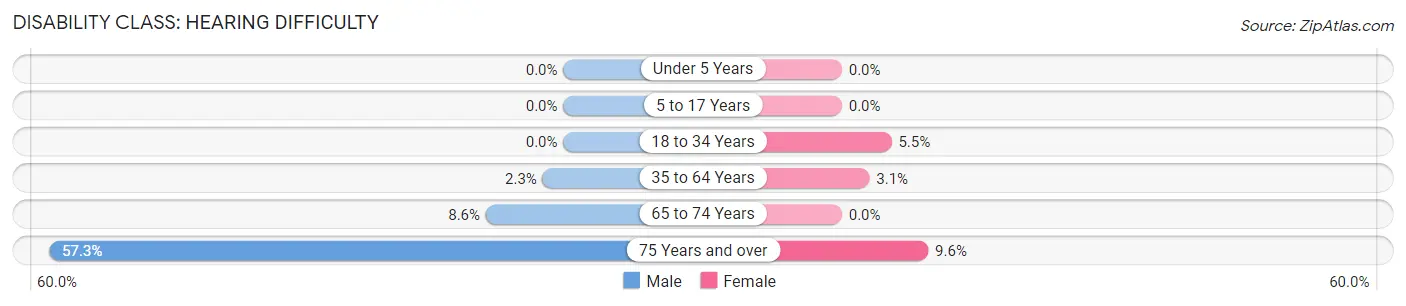
| Age Bracket | Male | Female |
| Under 5 Years | 0 (0.0%) | 0 (0.0%) |
| 5 to 17 Years | 0 (0.0%) | 0 (0.0%) |
| 18 to 34 Years | 0 (0.0%) | 102 (5.5%) |
| 35 to 64 Years | 38 (2.3%) | 70 (3.1%) |
| 65 to 74 Years | 24 (8.6%) | 0 (0.0%) |
| 75 Years and over | 59 (57.3%) | 20 (9.6%) |
Disability Class: Vision Difficulty
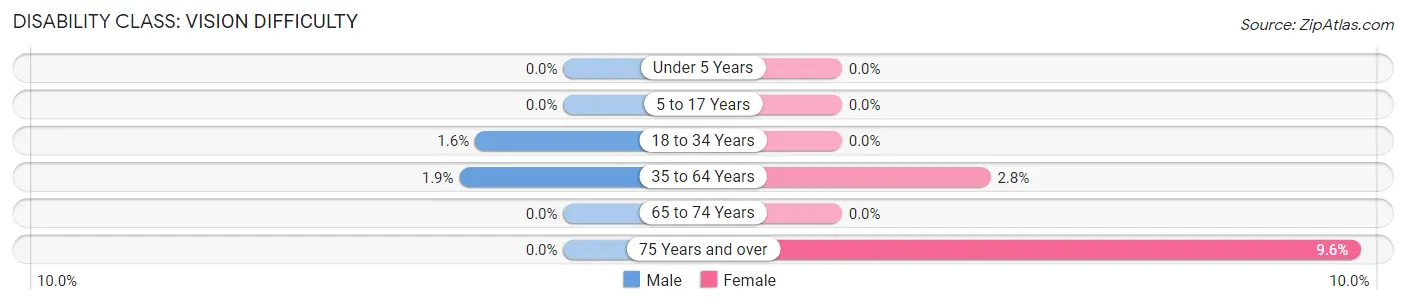
| Age Bracket | Male | Female |
| Under 5 Years | 0 (0.0%) | 0 (0.0%) |
| 5 to 17 Years | 0 (0.0%) | 0 (0.0%) |
| 18 to 34 Years | 19 (1.6%) | 0 (0.0%) |
| 35 to 64 Years | 32 (1.9%) | 63 (2.8%) |
| 65 to 74 Years | 0 (0.0%) | 0 (0.0%) |
| 75 Years and over | 0 (0.0%) | 20 (9.6%) |
Disability Class: Cognitive Difficulty
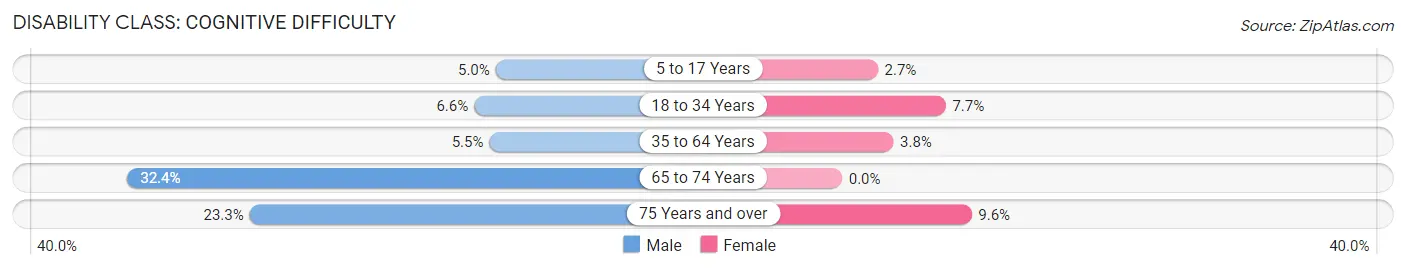
| Age Bracket | Male | Female |
| 5 to 17 Years | 38 (5.0%) | 18 (2.7%) |
| 18 to 34 Years | 77 (6.6%) | 142 (7.7%) |
| 35 to 64 Years | 91 (5.5%) | 87 (3.8%) |
| 65 to 74 Years | 90 (32.4%) | 0 (0.0%) |
| 75 Years and over | 24 (23.3%) | 20 (9.6%) |
Disability Class: Ambulatory Difficulty
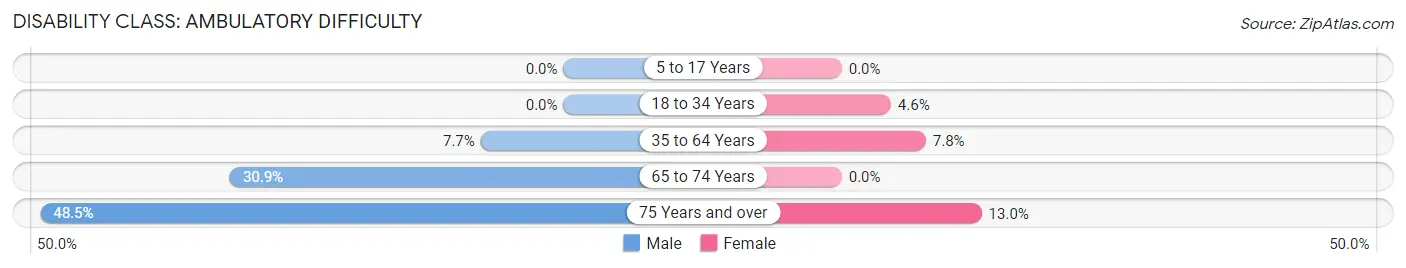
| Age Bracket | Male | Female |
| 5 to 17 Years | 0 (0.0%) | 0 (0.0%) |
| 18 to 34 Years | 0 (0.0%) | 84 (4.6%) |
| 35 to 64 Years | 127 (7.7%) | 178 (7.8%) |
| 65 to 74 Years | 86 (30.9%) | 0 (0.0%) |
| 75 Years and over | 50 (48.5%) | 27 (13.0%) |
Disability Class: Self-Care Difficulty
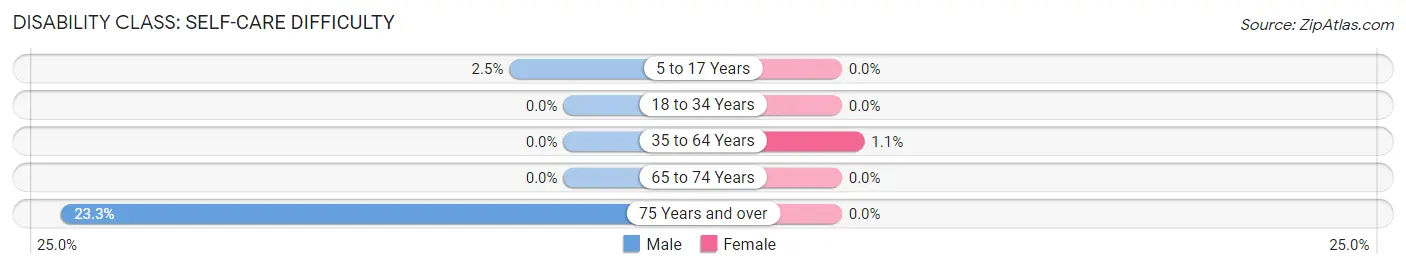
| Age Bracket | Male | Female |
| 5 to 17 Years | 19 (2.5%) | 0 (0.0%) |
| 18 to 34 Years | 0 (0.0%) | 0 (0.0%) |
| 35 to 64 Years | 0 (0.0%) | 24 (1.1%) |
| 65 to 74 Years | 0 (0.0%) | 0 (0.0%) |
| 75 Years and over | 24 (23.3%) | 0 (0.0%) |
Technology Access in Progress Village
Computing Device Access in Progress Village
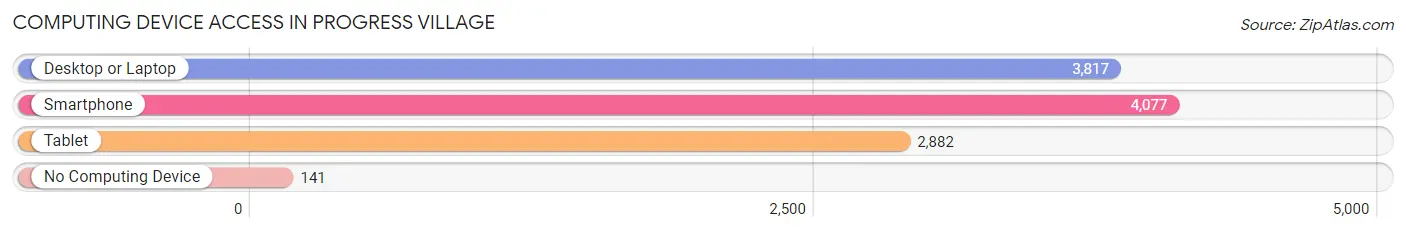
| Device Type | # Households | % Households |
| Desktop or Laptop | 3,817 | 88.2% |
| Smartphone | 4,077 | 94.2% |
| Tablet | 2,882 | 66.6% |
| No Computing Device | 141 | 3.3% |
| Total | 4,326 | 100.0% |
Internet Access in Progress Village
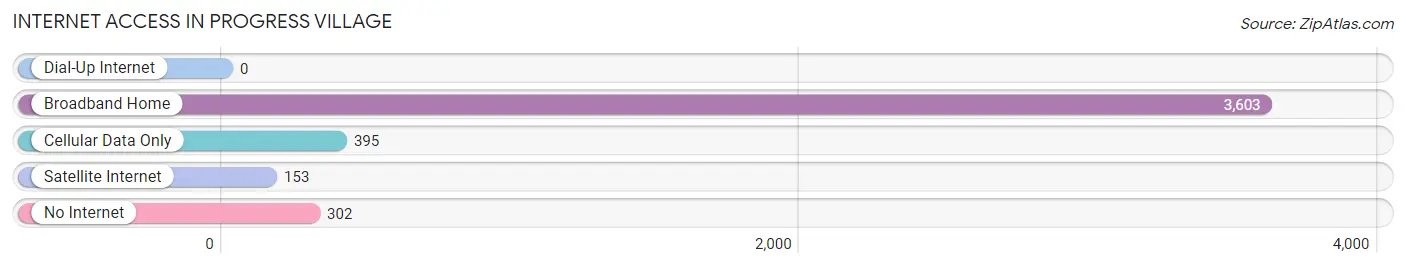
| Internet Type | # Households | % Households |
| Dial-Up Internet | 0 | 0.0% |
| Broadband Home | 3,603 | 83.3% |
| Cellular Data Only | 395 | 9.1% |
| Satellite Internet | 153 | 3.5% |
| No Internet | 302 | 7.0% |
| Total | 4,326 | 100.0% |
Progress Village Summary
Introduction
Progress Village is a census-designated place (CDP) located in Hillsborough County, Florida. It is located just east of Tampa and is part of the Tampa-St. Petersburg-Clearwater Metropolitan Statistical Area. The population of Progress Village was 8,845 at the 2010 census.
History
Progress Village was founded in the 1950s as a planned community for African-American families. The community was developed by the Progress Village Corporation, which was founded by local African-American business leaders. The corporation purchased land from the Hillsborough County School Board and developed the community with the help of the federal government. The community was designed to provide affordable housing for African-American families and to provide a safe and secure environment for them to live in.
The community was named after the Progress Village Corporation and was intended to be a symbol of progress for African-American families. The community was designed to be a self-contained neighborhood with its own schools, churches, stores, and other amenities.
Geography
Progress Village is located at 27°56'45" North, 82°20'45" West (27.94583, -82.34583). It is bordered by the city of Tampa to the west, the city of Brandon to the east, and the city of Riverview to the south. The community is located in the Tampa Bay area and is part of the Tampa-St. Petersburg-Clearwater Metropolitan Statistical Area.
The total area of Progress Village is 4.2 square miles, of which 4.1 square miles is land and 0.1 square miles is water. The terrain is mostly flat and the elevation is approximately 25 feet above sea level.
Economy
The economy of Progress Village is largely based on the service industry. The community is home to a variety of businesses, including restaurants, retail stores, and professional services. The community is also home to a number of small businesses, including auto repair shops, beauty salons, and barber shops.
The median household income in Progress Village is $30,945, which is lower than the national average of $50,046. The unemployment rate in Progress Village is 8.2%, which is higher than the national average of 5.2%.
Demographics
As of the 2010 census, there were 8,845 people, 2,945 households, and 2,092 families residing in Progress Village. The population density was 2,133.3 people per square mile. The racial makeup of the community was 57.3% African American, 33.2% White, 4.2% Hispanic or Latino, 2.2% Asian, 0.7% Native American, 0.1% Pacific Islander, and 2.5% from other races.
The median age in Progress Village was 33.7 years. 24.3% of residents were under the age of 18, 10.2% were between the ages of 18 and 24, 28.2% were between the ages of 25 and 44, 22.7% were between the ages of 45 and 64, and 14.6% were 65 years of age or older. The gender makeup of the community was 48.3% male and 51.7% female.
Conclusion
Progress Village is a census-designated place located in Hillsborough County, Florida. It is located just east of Tampa and is part of the Tampa-St. Petersburg-Clearwater Metropolitan Statistical Area. The population of Progress Village was 8,845 at the 2010 census. The community was founded in the 1950s as a planned community for African-American families and was designed to provide affordable housing and a safe and secure environment for them to live in. The economy of Progress Village is largely based on the service industry and the median household income is $30,945. The racial makeup of the community is 57.3% African American, 33.2% White, 4.2% Hispanic or Latino, 2.2% Asian, 0.7% Native American, 0.1% Pacific Islander, and 2.5% from other races.
Common Questions
What is Per Capita Income in Progress Village?
Per Capita income in Progress Village is $37,685.
What is the Median Family Income in Progress Village?
Median Family Income in Progress Village is $79,978.
What is the Median Household income in Progress Village?
Median Household Income in Progress Village is $77,677.
What is Income or Wage Gap in Progress Village?
Income or Wage Gap in Progress Village is 14.3%.
Women in Progress Village earn 85.7 cents for every dollar earned by a man.
What is Inequality or Gini Index in Progress Village?
Inequality or Gini Index in Progress Village is 0.38.
What is the Total Population of Progress Village?
Total Population of Progress Village is 10,096.
What is the Total Male Population of Progress Village?
Total Male Population of Progress Village is 4,230.
What is the Total Female Population of Progress Village?
Total Female Population of Progress Village is 5,866.
What is the Ratio of Males per 100 Females in Progress Village?
There are 72.11 Males per 100 Females in Progress Village.
What is the Ratio of Females per 100 Males in Progress Village?
There are 138.68 Females per 100 Males in Progress Village.
What is the Median Population Age in Progress Village?
Median Population Age in Progress Village is 33.9 Years.
What is the Average Family Size in Progress Village
Average Family Size in Progress Village is 3.0 People.
What is the Average Household Size in Progress Village
Average Household Size in Progress Village is 2.3 People.
How Large is the Labor Force in Progress Village?
There are 6,239 People in the Labor Forcein in Progress Village.
What is the Percentage of People in the Labor Force in Progress Village?
76.2% of People are in the Labor Force in Progress Village.
What is the Unemployment Rate in Progress Village?
Unemployment Rate in Progress Village is 1.5%.