La Porte, TX Map & Demographics
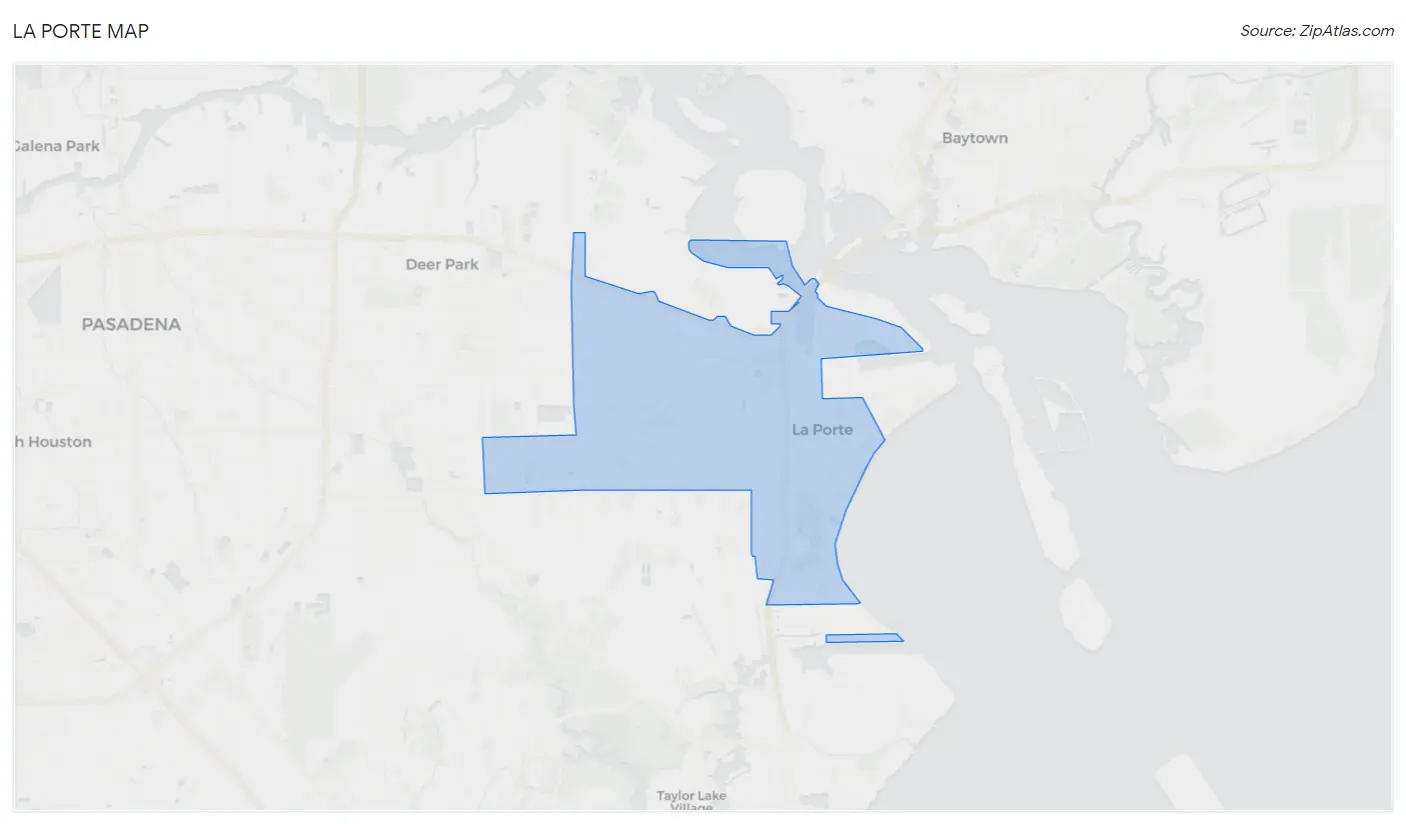
La Porte Map
La Porte Overview
$42,835
PER CAPITA INCOME
$91,170
AVG FAMILY INCOME
$79,193
AVG HOUSEHOLD INCOME
32.5%
WAGE / INCOME GAP [ % ]
67.5¢/ $1
WAGE / INCOME GAP [ $ ]
0.51
INEQUALITY / GINI INDEX
35,782
TOTAL POPULATION
17,748
MALE POPULATION
18,034
FEMALE POPULATION
98.41
MALES / 100 FEMALES
101.61
FEMALES / 100 MALES
35.9
MEDIAN AGE
3.3
AVG FAMILY SIZE
2.8
AVG HOUSEHOLD SIZE
17,571
LABOR FORCE [ PEOPLE ]
63.8%
PERCENT IN LABOR FORCE
5.3%
UNEMPLOYMENT RATE
La Porte Zip Codes
Income in La Porte
Income Overview in La Porte
Per Capita Income in La Porte is $42,835, while median incomes of families and households are $91,170 and $79,193 respectively.
| Characteristic | Number | Measure |
| Per Capita Income | 35,782 | $42,835 |
| Median Family Income | 9,167 | $91,170 |
| Mean Family Income | 9,167 | $133,013 |
| Median Household Income | 12,849 | $79,193 |
| Mean Household Income | 12,849 | $115,176 |
| Income Deficit | 9,167 | $0 |
| Wage / Income Gap (%) | 35,782 | 32.49% |
| Wage / Income Gap ($) | 35,782 | 67.51¢ per $1 |
| Gini / Inequality Index | 35,782 | 0.51 |
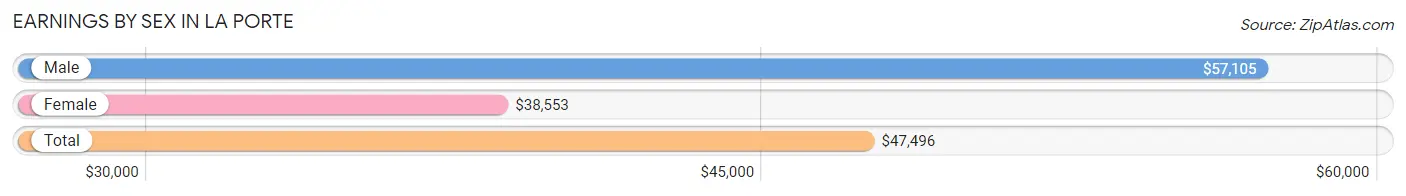
Earnings by Sex in La Porte
Average Earnings in La Porte are $47,496, $57,105 for men and $38,553 for women, a difference of 32.5%.
| Sex | Number | Average Earnings |
| Male | 9,520 (52.6%) | $57,105 |
| Female | 8,592 (47.4%) | $38,553 |
| Total | 18,112 (100.0%) | $47,496 |
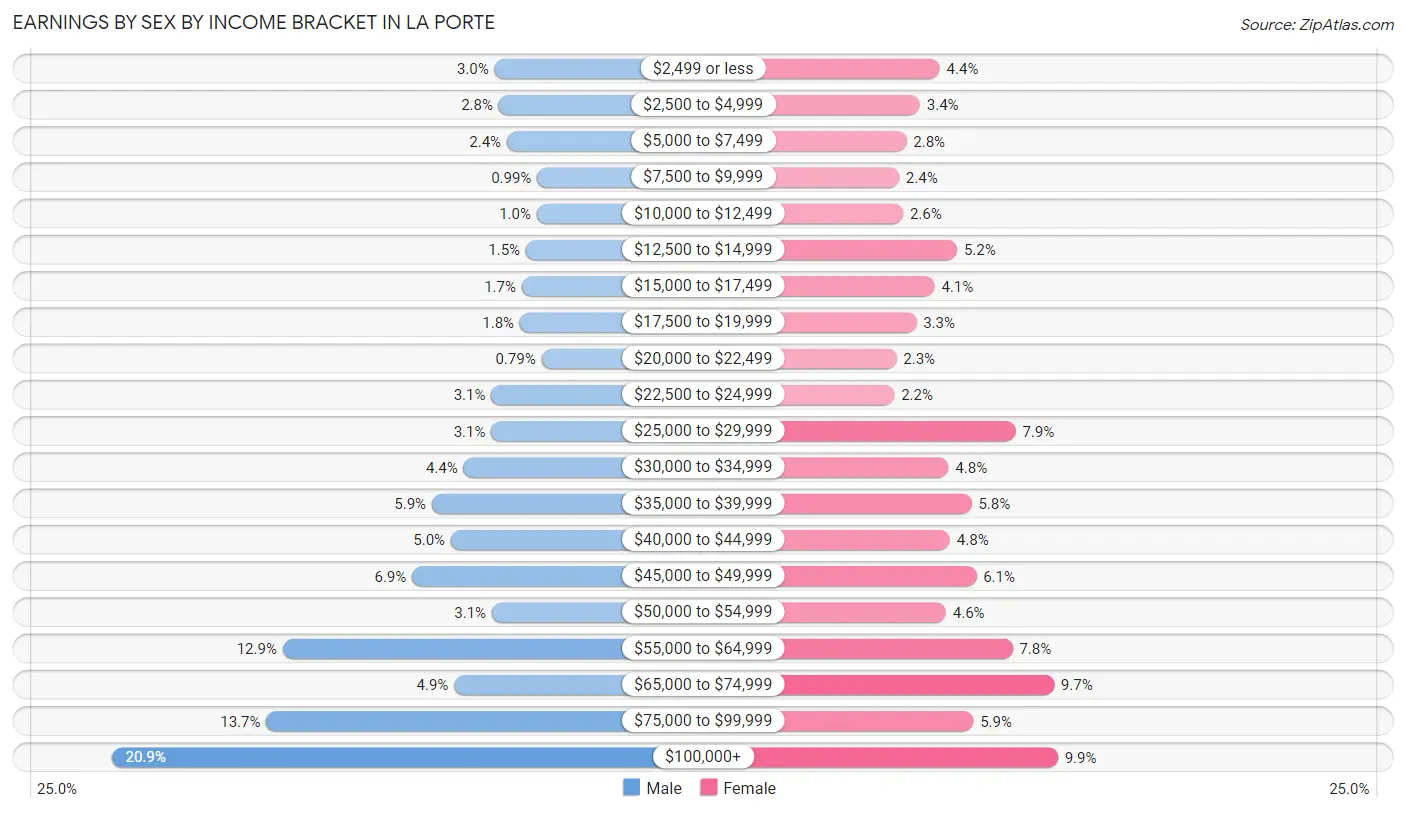
Earnings by Sex by Income Bracket in La Porte
The most common earnings brackets in La Porte are $100,000+ for men (1,988 | 20.9%) and $100,000+ for women (849 | 9.9%).
| Income | Male | Female |
| $2,499 or less | 285 (3.0%) | 374 (4.3%) |
| $2,500 to $4,999 | 266 (2.8%) | 294 (3.4%) |
| $5,000 to $7,499 | 229 (2.4%) | 240 (2.8%) |
| $7,500 to $9,999 | 94 (1.0%) | 210 (2.4%) |
| $10,000 to $12,499 | 96 (1.0%) | 226 (2.6%) |
| $12,500 to $14,999 | 145 (1.5%) | 443 (5.2%) |
| $15,000 to $17,499 | 163 (1.7%) | 353 (4.1%) |
| $17,500 to $19,999 | 171 (1.8%) | 279 (3.3%) |
| $20,000 to $22,499 | 75 (0.8%) | 199 (2.3%) |
| $22,500 to $24,999 | 299 (3.1%) | 191 (2.2%) |
| $25,000 to $29,999 | 299 (3.1%) | 679 (7.9%) |
| $30,000 to $34,999 | 423 (4.4%) | 409 (4.8%) |
| $35,000 to $39,999 | 564 (5.9%) | 502 (5.8%) |
| $40,000 to $44,999 | 479 (5.0%) | 415 (4.8%) |
| $45,000 to $49,999 | 652 (6.9%) | 521 (6.1%) |
| $50,000 to $54,999 | 296 (3.1%) | 399 (4.6%) |
| $55,000 to $64,999 | 1,229 (12.9%) | 667 (7.8%) |
| $65,000 to $74,999 | 465 (4.9%) | 833 (9.7%) |
| $75,000 to $99,999 | 1,302 (13.7%) | 509 (5.9%) |
| $100,000+ | 1,988 (20.9%) | 849 (9.9%) |
| Total | 9,520 (100.0%) | 8,592 (100.0%) |
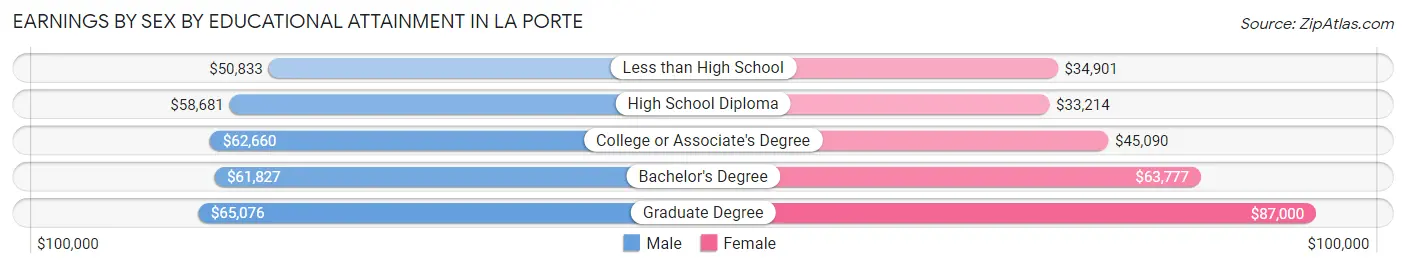
Earnings by Sex by Educational Attainment in La Porte
Average earnings in La Porte are $59,454 for men and $45,274 for women, a difference of 23.8%. Men with an educational attainment of graduate degree enjoy the highest average annual earnings of $65,076, while those with less than high school education earn the least with $50,833. Women with an educational attainment of graduate degree earn the most with the average annual earnings of $87,000, while those with high school diploma education have the smallest earnings of $33,214.
| Educational Attainment | Male Income | Female Income |
| Less than High School | $50,833 | $34,901 |
| High School Diploma | $58,681 | $33,214 |
| College or Associate's Degree | $62,660 | $45,090 |
| Bachelor's Degree | $61,827 | $63,777 |
| Graduate Degree | $65,076 | $87,000 |
| Total | $59,454 | $45,274 |
Family Income in La Porte
Family Income Brackets in La Porte
According to the La Porte family income data, there are 2,237 families falling into the $100,000 to $149,999 income range, which is the most common income bracket and makes up 24.4% of all families. Conversely, the $10,000 to $14,999 income bracket is the least frequent group with only 183 families (2.0%) belonging to this category.
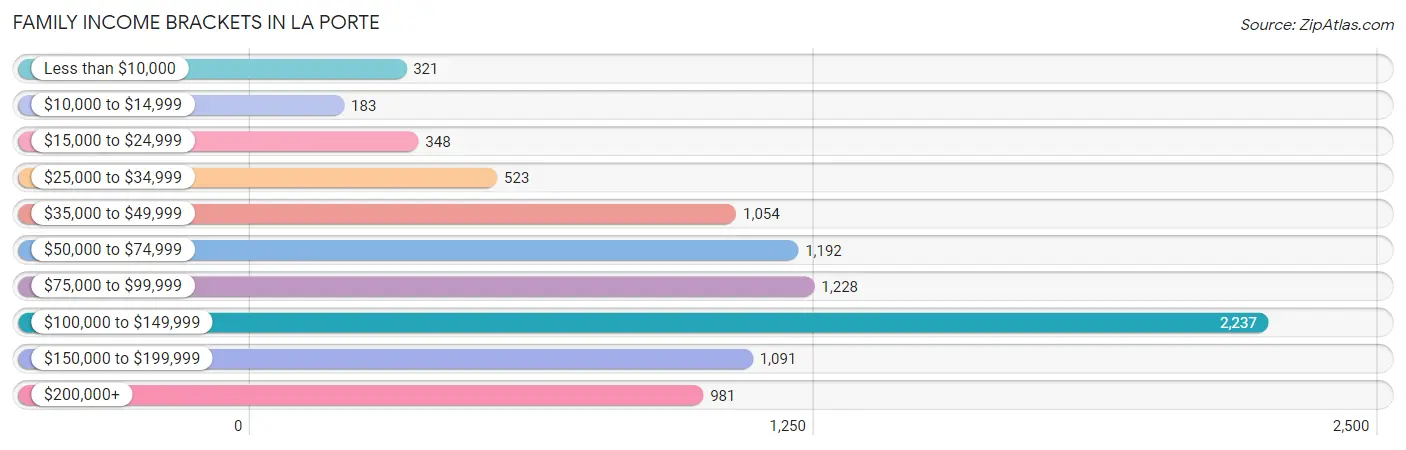
| Income Bracket | # Families | % Families |
| Less than $10,000 | 321 | 3.5% |
| $10,000 to $14,999 | 183 | 2.0% |
| $15,000 to $24,999 | 348 | 3.8% |
| $25,000 to $34,999 | 523 | 5.7% |
| $35,000 to $49,999 | 1,054 | 11.5% |
| $50,000 to $74,999 | 1,192 | 13.0% |
| $75,000 to $99,999 | 1,228 | 13.4% |
| $100,000 to $149,999 | 2,237 | 24.4% |
| $150,000 to $199,999 | 1,091 | 11.9% |
| $200,000+ | 981 | 10.7% |
Family Income by Famaliy Size in La Porte
6-person families (229 | 2.5%) account for the highest median family income in La Porte with $124,107 per family, while 2-person families (4,050 | 44.2%) have the highest median income of $42,304 per family member.
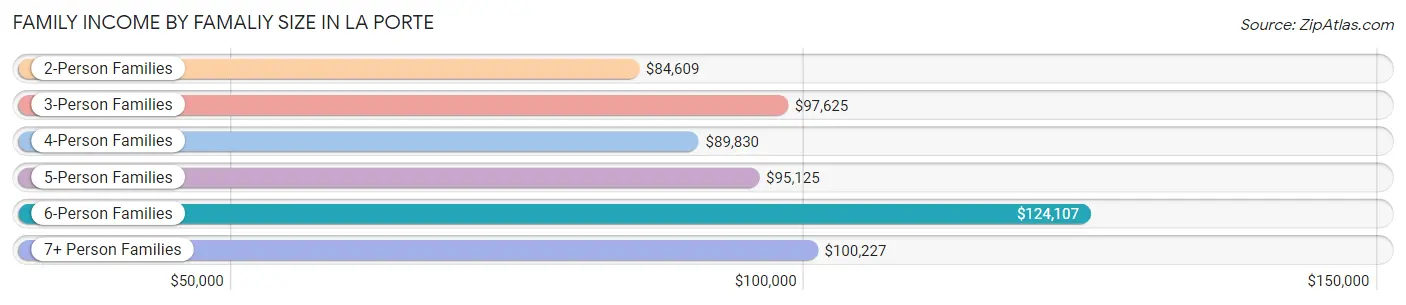
| Income Bracket | # Families | Median Income |
| 2-Person Families | 4,050 (44.2%) | $84,609 |
| 3-Person Families | 2,021 (22.1%) | $97,625 |
| 4-Person Families | 1,786 (19.5%) | $89,830 |
| 5-Person Families | 933 (10.2%) | $95,125 |
| 6-Person Families | 229 (2.5%) | $124,107 |
| 7+ Person Families | 148 (1.6%) | $100,227 |
| Total | 9,167 (100.0%) | $91,170 |
Family Income by Number of Earners in La Porte
The median family income in La Porte is $91,170, with families comprising 3+ earners (1,395) having the highest median family income of $140,893, while families with no earners (1,279) have the lowest median family income of $48,531, accounting for 15.2% and 14.0% of families, respectively.
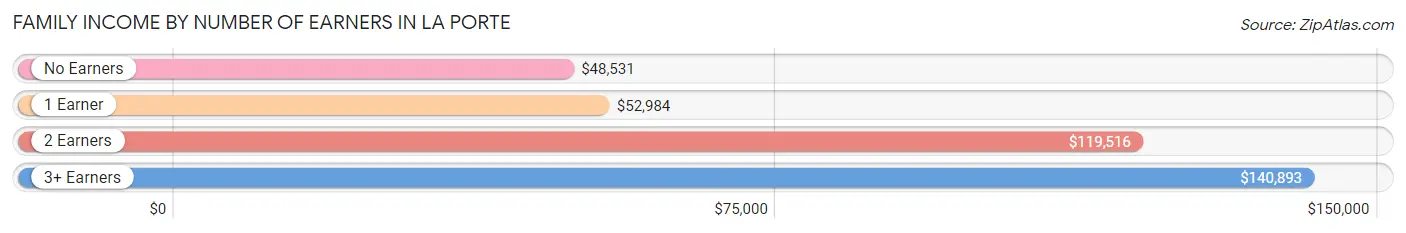
| Number of Earners | # Families | Median Income |
| No Earners | 1,279 (14.0%) | $48,531 |
| 1 Earner | 3,114 (34.0%) | $52,984 |
| 2 Earners | 3,379 (36.9%) | $119,516 |
| 3+ Earners | 1,395 (15.2%) | $140,893 |
| Total | 9,167 (100.0%) | $91,170 |
Household Income in La Porte
Household Income Brackets in La Porte
With 2,660 households falling in the category, the $100,000 to $149,999 income range is the most frequent in La Porte, accounting for 20.7% of all households. In contrast, only 463 households (3.6%) fall into the less than $10,000 income bracket, making it the least populous group.
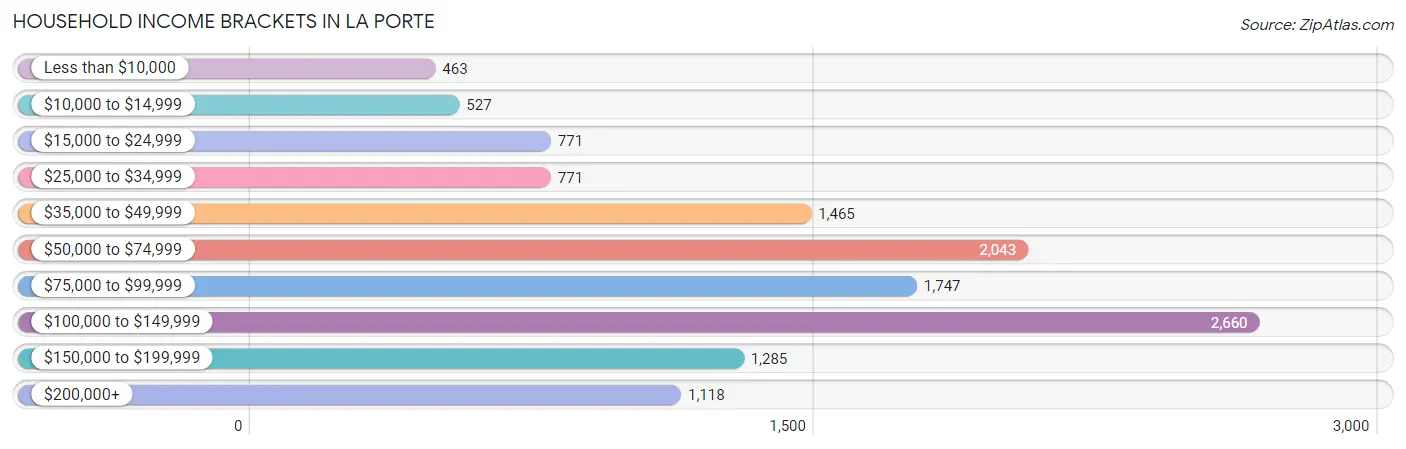
| Income Bracket | # Households | % Households |
| Less than $10,000 | 463 | 3.6% |
| $10,000 to $14,999 | 527 | 4.1% |
| $15,000 to $24,999 | 771 | 6.0% |
| $25,000 to $34,999 | 771 | 6.0% |
| $35,000 to $49,999 | 1,465 | 11.4% |
| $50,000 to $74,999 | 2,043 | 15.9% |
| $75,000 to $99,999 | 1,747 | 13.6% |
| $100,000 to $149,999 | 2,660 | 20.7% |
| $150,000 to $199,999 | 1,285 | 10.0% |
| $200,000+ | 1,118 | 8.7% |
Household Income by Householder Age in La Porte
The median household income in La Porte is $79,193, with the highest median household income of $96,316 found in the 45 to 64 years age bracket for the primary householder. A total of 5,160 households (40.2%) fall into this category. Meanwhile, the 15 to 24 years age bracket for the primary householder has the lowest median household income of $38,792, with 237 households (1.8%) in this group.
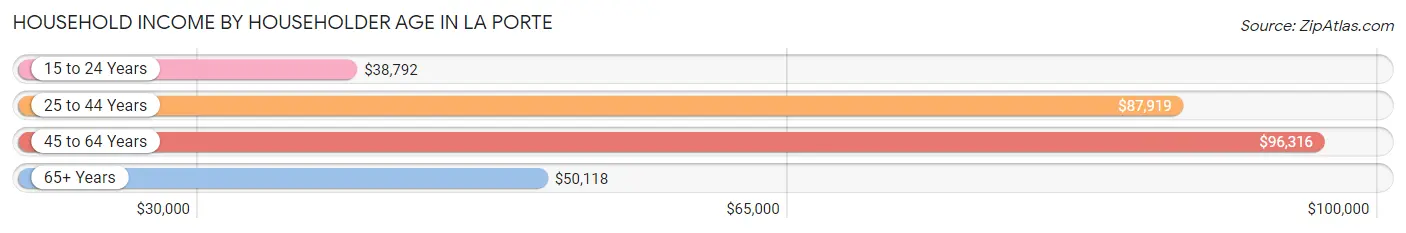
| Income Bracket | # Households | Median Income |
| 15 to 24 Years | 237 (1.8%) | $38,792 |
| 25 to 44 Years | 4,186 (32.6%) | $87,919 |
| 45 to 64 Years | 5,160 (40.2%) | $96,316 |
| 65+ Years | 3,266 (25.4%) | $50,118 |
| Total | 12,849 (100.0%) | $79,193 |
Poverty in La Porte
Income Below Poverty by Sex and Age in La Porte
With 10.5% poverty level for males and 13.5% for females among the residents of La Porte, under 5 year old males and 5 year old females are the most vulnerable to poverty, with 271 males (20.1%) and 89 females (36.2%) in their respective age groups living below the poverty level.
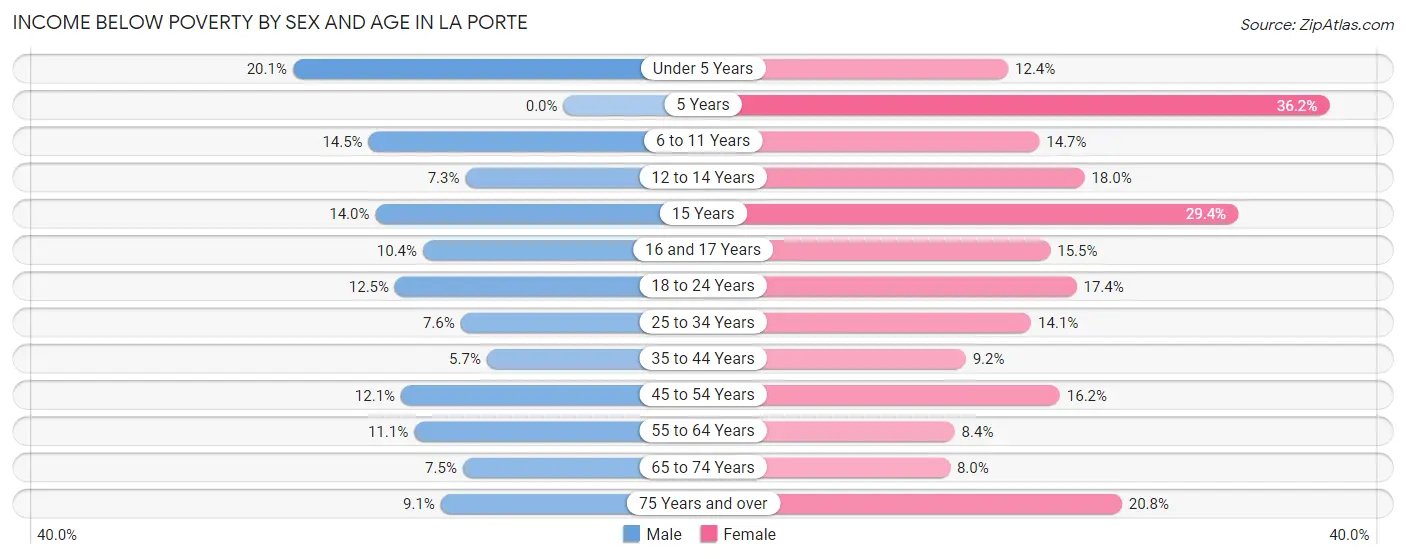
| Age Bracket | Male | Female |
| Under 5 Years | 271 (20.1%) | 144 (12.3%) |
| 5 Years | 0 (0.0%) | 89 (36.2%) |
| 6 to 11 Years | 313 (14.5%) | 192 (14.7%) |
| 12 to 14 Years | 44 (7.3%) | 104 (18.0%) |
| 15 Years | 37 (14.0%) | 55 (29.4%) |
| 16 and 17 Years | 39 (10.4%) | 87 (15.5%) |
| 18 to 24 Years | 173 (12.5%) | 255 (17.4%) |
| 25 to 34 Years | 216 (7.6%) | 344 (14.1%) |
| 35 to 44 Years | 131 (5.7%) | 223 (9.2%) |
| 45 to 54 Years | 210 (12.1%) | 354 (16.2%) |
| 55 to 64 Years | 258 (11.1%) | 222 (8.4%) |
| 65 to 74 Years | 100 (7.5%) | 130 (8.0%) |
| 75 Years and over | 69 (9.1%) | 232 (20.8%) |
| Total | 1,861 (10.5%) | 2,431 (13.5%) |
Income Above Poverty by Sex and Age in La Porte
According to the poverty statistics in La Porte, males aged 5 years and females aged 65 to 74 years are the age groups that are most secure financially, with 100.0% of males and 92.0% of females in these age groups living above the poverty line.
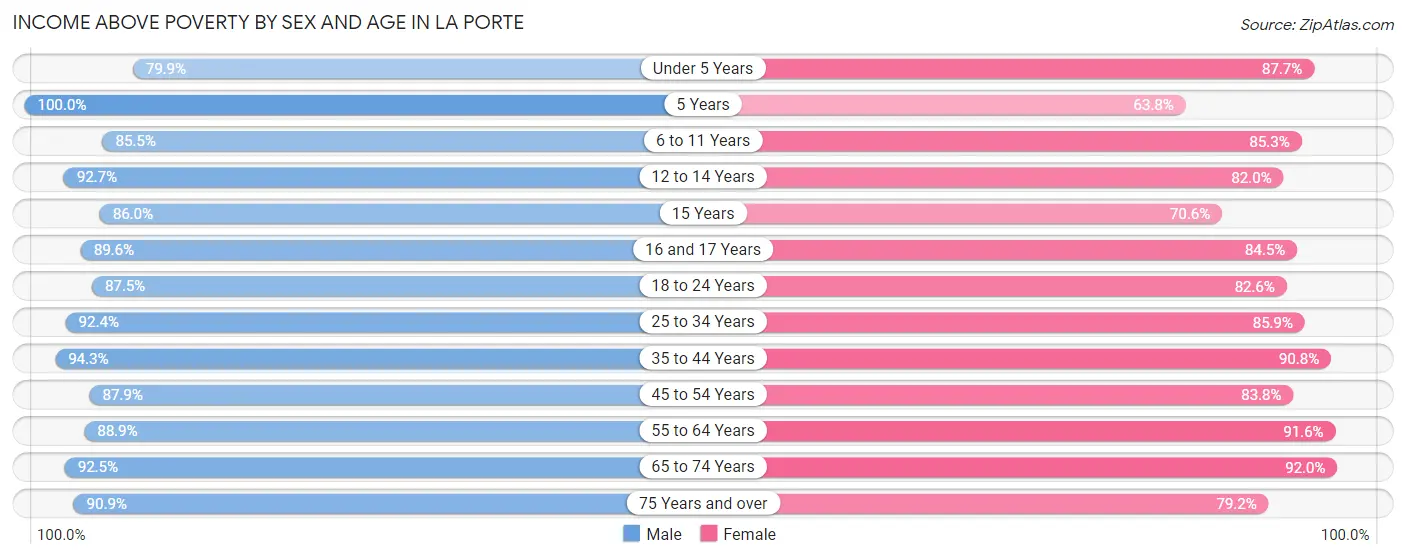
| Age Bracket | Male | Female |
| Under 5 Years | 1,078 (79.9%) | 1,022 (87.6%) |
| 5 Years | 252 (100.0%) | 157 (63.8%) |
| 6 to 11 Years | 1,850 (85.5%) | 1,117 (85.3%) |
| 12 to 14 Years | 560 (92.7%) | 473 (82.0%) |
| 15 Years | 228 (86.0%) | 132 (70.6%) |
| 16 and 17 Years | 335 (89.6%) | 475 (84.5%) |
| 18 to 24 Years | 1,210 (87.5%) | 1,208 (82.6%) |
| 25 to 34 Years | 2,616 (92.4%) | 2,103 (85.9%) |
| 35 to 44 Years | 2,170 (94.3%) | 2,202 (90.8%) |
| 45 to 54 Years | 1,532 (87.9%) | 1,832 (83.8%) |
| 55 to 64 Years | 2,069 (88.9%) | 2,427 (91.6%) |
| 65 to 74 Years | 1,238 (92.5%) | 1,489 (92.0%) |
| 75 Years and over | 688 (90.9%) | 884 (79.2%) |
| Total | 15,826 (89.5%) | 15,521 (86.5%) |
Income Below Poverty Among Married-Couple Families in La Porte
The poverty statistics for married-couple families in La Porte show that 7.6% or 507 of the total 6,698 families live below the poverty line. Families with 3 or 4 children have the highest poverty rate of 14.3%, comprising of 80 families. On the other hand, families with 5 or more children have the lowest poverty rate of 0.0%, which includes 0 families.
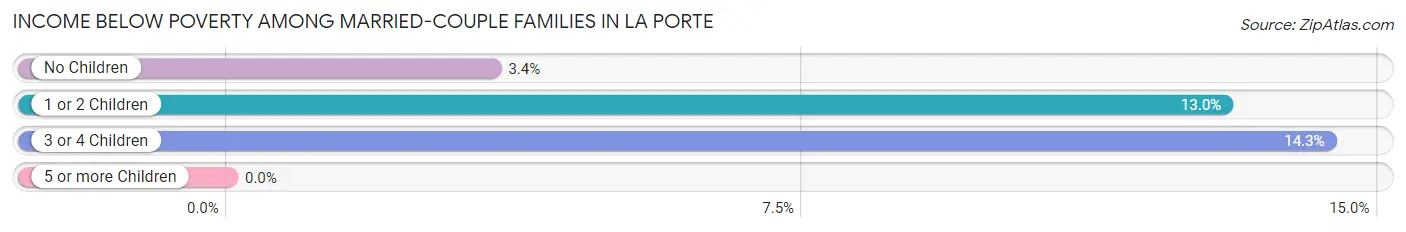
| Children | Above Poverty | Below Poverty |
| No Children | 3,706 (96.6%) | 132 (3.4%) |
| 1 or 2 Children | 1,976 (87.0%) | 295 (13.0%) |
| 3 or 4 Children | 478 (85.7%) | 80 (14.3%) |
| 5 or more Children | 31 (100.0%) | 0 (0.0%) |
| Total | 6,191 (92.4%) | 507 (7.6%) |
Income Below Poverty Among Single-Parent Households in La Porte
According to the poverty data in La Porte, 4.9% or 26 single-father households and 19.8% or 384 single-mother households are living below the poverty line. Among single-father households, those with 1 or 2 children have the highest poverty rate, with 26 households (8.8%) experiencing poverty. Likewise, among single-mother households, those with 3 or 4 children have the highest poverty rate, with 60 households (27.5%) falling below the poverty line.
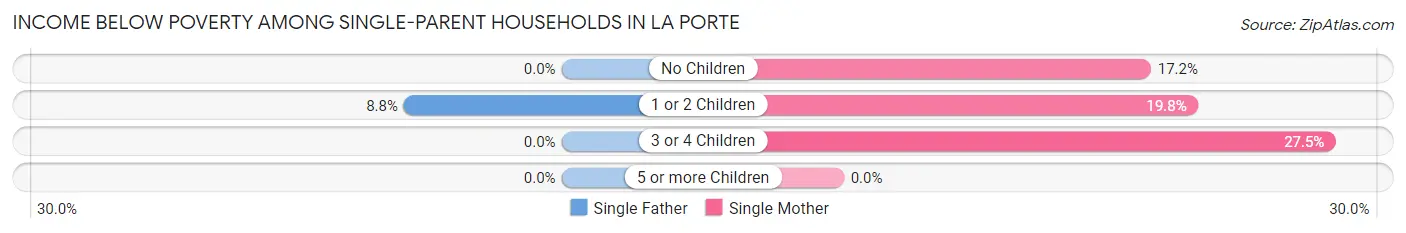
| Children | Single Father | Single Mother |
| No Children | 0 (0.0%) | 115 (17.2%) |
| 1 or 2 Children | 26 (8.8%) | 209 (19.8%) |
| 3 or 4 Children | 0 (0.0%) | 60 (27.5%) |
| 5 or more Children | 0 (0.0%) | 0 (0.0%) |
| Total | 26 (4.9%) | 384 (19.8%) |
Income Below Poverty Among Married-Couple vs Single-Parent Households in La Porte
The poverty data for La Porte shows that 507 of the married-couple family households (7.6%) and 410 of the single-parent households (16.6%) are living below the poverty level. Within the married-couple family households, those with 3 or 4 children have the highest poverty rate, with 80 households (14.3%) falling below the poverty line. Among the single-parent households, those with 3 or 4 children have the highest poverty rate, with 60 household (24.9%) living below poverty.
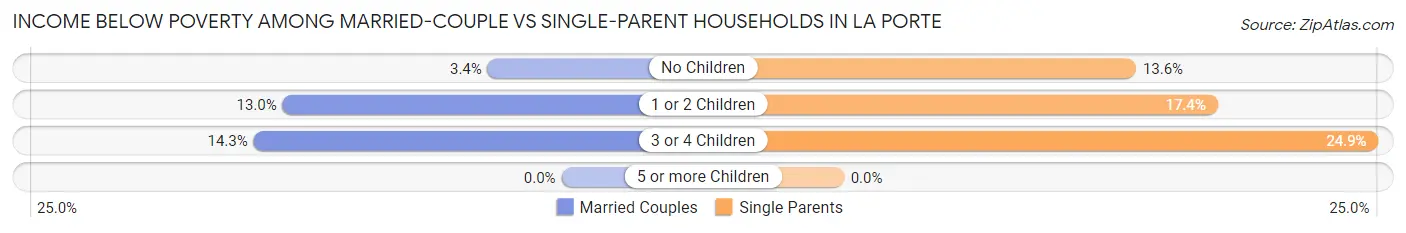
| Children | Married-Couple Families | Single-Parent Households |
| No Children | 132 (3.4%) | 115 (13.6%) |
| 1 or 2 Children | 295 (13.0%) | 235 (17.4%) |
| 3 or 4 Children | 80 (14.3%) | 60 (24.9%) |
| 5 or more Children | 0 (0.0%) | 0 (0.0%) |
| Total | 507 (7.6%) | 410 (16.6%) |
Race in La Porte
The most populous races in La Porte are White / Caucasian (23,821 | 66.6%), Hispanic or Latino (14,297 | 40.0%), and Two or more Races (6,016 | 16.8%).
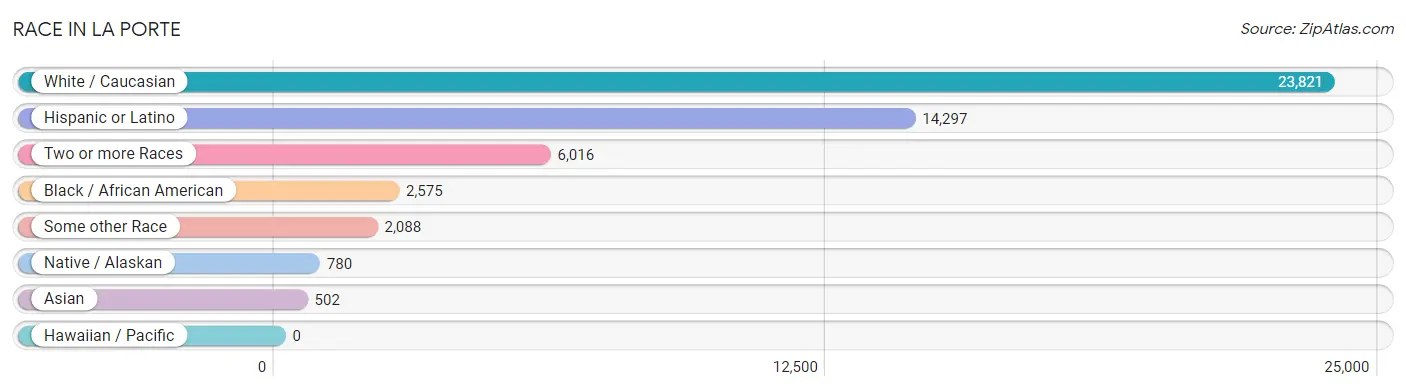
| Race | # Population | % Population |
| Asian | 502 | 1.4% |
| Black / African American | 2,575 | 7.2% |
| Hawaiian / Pacific | 0 | 0.0% |
| Hispanic or Latino | 14,297 | 40.0% |
| Native / Alaskan | 780 | 2.2% |
| White / Caucasian | 23,821 | 66.6% |
| Two or more Races | 6,016 | 16.8% |
| Some other Race | 2,088 | 5.8% |
| Total | 35,782 | 100.0% |
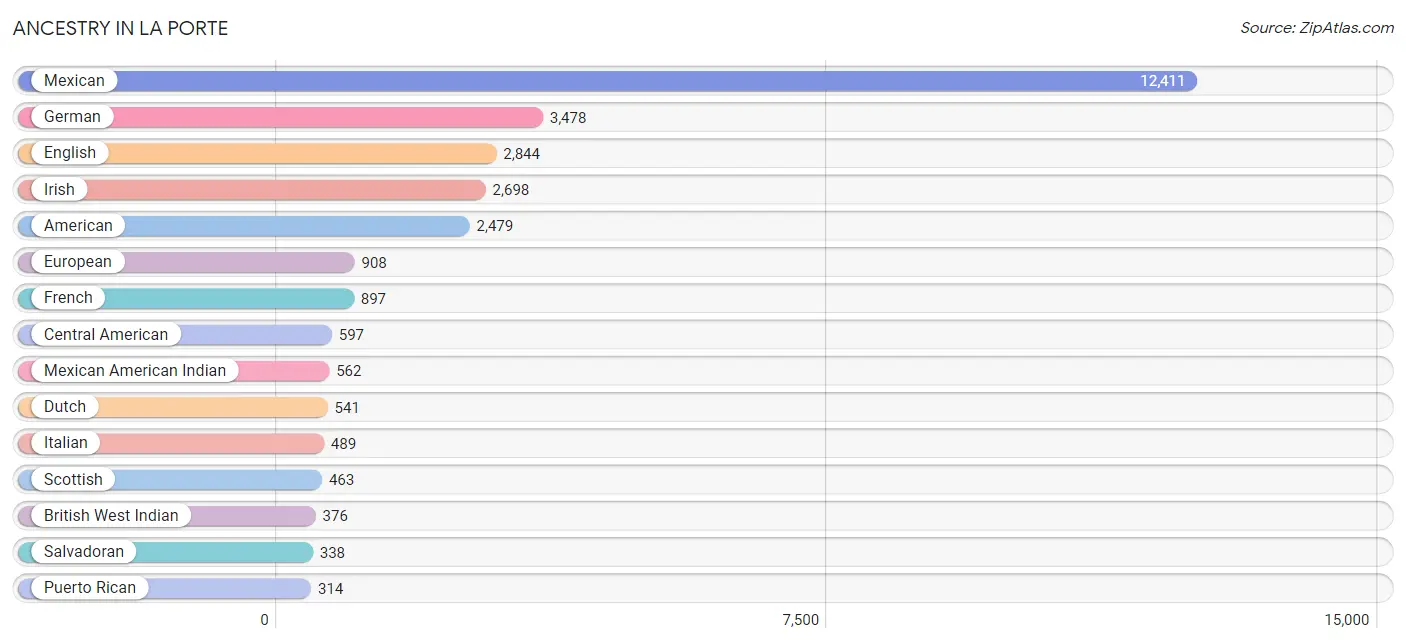
Ancestry in La Porte
The most populous ancestries reported in La Porte are Mexican (12,411 | 34.7%), German (3,478 | 9.7%), English (2,844 | 8.0%), Irish (2,698 | 7.5%), and American (2,479 | 6.9%), together accounting for 66.8% of all La Porte residents.
| Ancestry | # Population | % Population |
| African | 266 | 0.7% |
| American | 2,479 | 6.9% |
| Arab | 113 | 0.3% |
| Armenian | 20 | 0.1% |
| Austrian | 6 | 0.0% |
| Blackfeet | 33 | 0.1% |
| British | 134 | 0.4% |
| British West Indian | 376 | 1.1% |
| Burmese | 15 | 0.0% |
| Cajun | 151 | 0.4% |
| Central American | 597 | 1.7% |
| Central American Indian | 7 | 0.0% |
| Cherokee | 254 | 0.7% |
| Chilean | 71 | 0.2% |
| Chippewa | 11 | 0.0% |
| Choctaw | 49 | 0.1% |
| Colombian | 21 | 0.1% |
| Comanche | 7 | 0.0% |
| Croatian | 12 | 0.0% |
| Cuban | 53 | 0.2% |
| Czech | 267 | 0.7% |
| Czechoslovakian | 31 | 0.1% |
| Danish | 7 | 0.0% |
| Dutch | 541 | 1.5% |
| Eastern European | 7 | 0.0% |
| English | 2,844 | 8.0% |
| European | 908 | 2.5% |
| Finnish | 20 | 0.1% |
| French | 897 | 2.5% |
| French Canadian | 38 | 0.1% |
| German | 3,478 | 9.7% |
| Greek | 24 | 0.1% |
| Guatemalan | 83 | 0.2% |
| Honduran | 176 | 0.5% |
| Hungarian | 15 | 0.0% |
| Indian (Asian) | 269 | 0.7% |
| Iranian | 15 | 0.0% |
| Irish | 2,698 | 7.5% |
| Italian | 489 | 1.4% |
| Jamaican | 7 | 0.0% |
| Jordanian | 9 | 0.0% |
| Korean | 100 | 0.3% |
| Lebanese | 76 | 0.2% |
| Lithuanian | 17 | 0.1% |
| Luxembourger | 8 | 0.0% |
| Mexican | 12,411 | 34.7% |
| Mexican American Indian | 562 | 1.6% |
| Native Hawaiian | 23 | 0.1% |
| Nigerian | 14 | 0.0% |
| Northern European | 7 | 0.0% |
| Norwegian | 288 | 0.8% |
| Osage | 159 | 0.4% |
| Pakistani | 7 | 0.0% |
| Peruvian | 16 | 0.0% |
| Polish | 185 | 0.5% |
| Portuguese | 42 | 0.1% |
| Potawatomi | 4 | 0.0% |
| Puerto Rican | 314 | 0.9% |
| Romanian | 21 | 0.1% |
| Russian | 30 | 0.1% |
| Salvadoran | 338 | 0.9% |
| Samoan | 13 | 0.0% |
| Scandinavian | 91 | 0.3% |
| Scotch-Irish | 258 | 0.7% |
| Scottish | 463 | 1.3% |
| Serbian | 21 | 0.1% |
| Slovak | 10 | 0.0% |
| Slovene | 17 | 0.1% |
| South African | 6 | 0.0% |
| South American | 131 | 0.4% |
| Spaniard | 261 | 0.7% |
| Spanish | 14 | 0.0% |
| Sri Lankan | 227 | 0.6% |
| Subsaharan African | 286 | 0.8% |
| Swedish | 78 | 0.2% |
| Swiss | 26 | 0.1% |
| Thai | 166 | 0.5% |
| Trinidadian and Tobagonian | 9 | 0.0% |
| Venezuelan | 23 | 0.1% |
| Welsh | 98 | 0.3% |
| Yugoslavian | 40 | 0.1% | View All 81 Rows |
Immigrants in La Porte
The most numerous immigrant groups reported in La Porte came from Latin America (2,755 | 7.7%), Central America (2,417 | 6.8%), Mexico (2,254 | 6.3%), Asia (501 | 1.4%), and Caribbean (258 | 0.7%), together accounting for 22.9% of all La Porte residents.
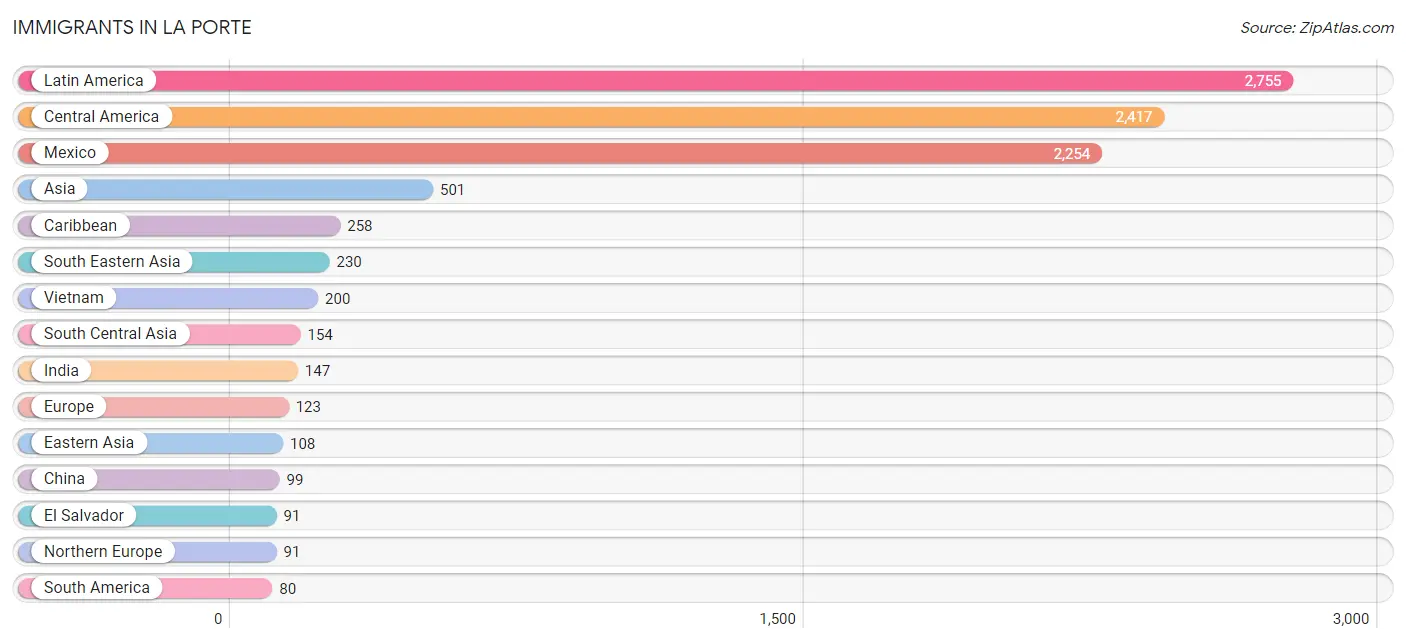
| Immigration Origin | # Population | % Population |
| Africa | 35 | 0.1% |
| Asia | 501 | 1.4% |
| Canada | 10 | 0.0% |
| Caribbean | 258 | 0.7% |
| Central America | 2,417 | 6.8% |
| Chile | 17 | 0.1% |
| China | 99 | 0.3% |
| Cuba | 53 | 0.2% |
| Dominica | 29 | 0.1% |
| Eastern Asia | 108 | 0.3% |
| Eastern Europe | 32 | 0.1% |
| El Salvador | 91 | 0.3% |
| England | 64 | 0.2% |
| Europe | 123 | 0.3% |
| Guatemala | 37 | 0.1% |
| Honduras | 35 | 0.1% |
| India | 147 | 0.4% |
| Iran | 7 | 0.0% |
| Jamaica | 7 | 0.0% |
| Jordan | 9 | 0.0% |
| Korea | 9 | 0.0% |
| Laos | 10 | 0.0% |
| Latin America | 2,755 | 7.7% |
| Mexico | 2,254 | 6.3% |
| Nigeria | 7 | 0.0% |
| Northern Africa | 28 | 0.1% |
| Northern Europe | 91 | 0.3% |
| Norway | 9 | 0.0% |
| Peru | 27 | 0.1% |
| Philippines | 4 | 0.0% |
| Poland | 22 | 0.1% |
| Russia | 10 | 0.0% |
| South America | 80 | 0.2% |
| South Central Asia | 154 | 0.4% |
| South Eastern Asia | 230 | 0.6% |
| Thailand | 16 | 0.0% |
| Trinidad and Tobago | 17 | 0.1% |
| Venezuela | 36 | 0.1% |
| Vietnam | 200 | 0.6% |
| Western Africa | 7 | 0.0% |
| Western Asia | 9 | 0.0% | View All 41 Rows |
Sex and Age in La Porte
Sex and Age in La Porte
The most populous age groups in La Porte are 30 to 34 Years (1,610 | 9.1%) for men and 30 to 34 Years (1,358 | 7.5%) for women.
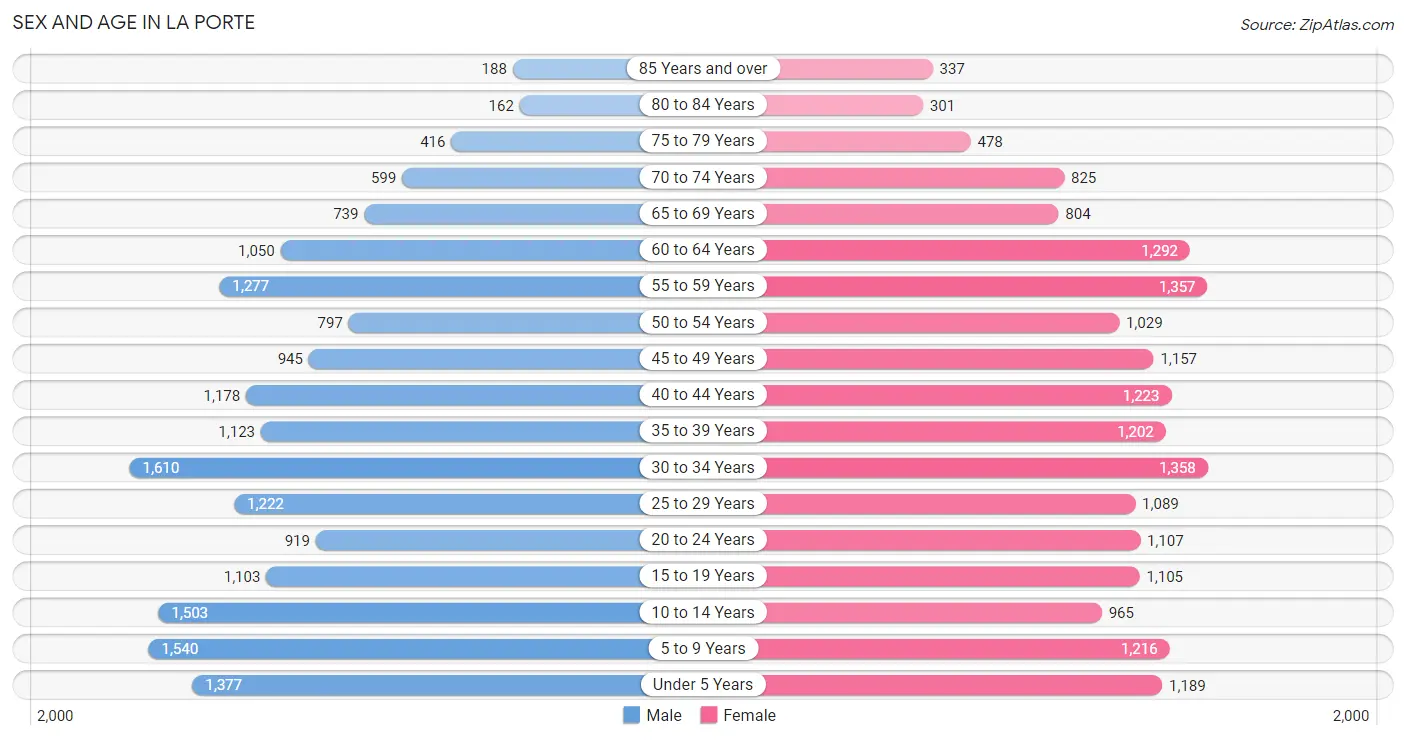
| Age Bracket | Male | Female |
| Under 5 Years | 1,377 (7.8%) | 1,189 (6.6%) |
| 5 to 9 Years | 1,540 (8.7%) | 1,216 (6.7%) |
| 10 to 14 Years | 1,503 (8.5%) | 965 (5.3%) |
| 15 to 19 Years | 1,103 (6.2%) | 1,105 (6.1%) |
| 20 to 24 Years | 919 (5.2%) | 1,107 (6.1%) |
| 25 to 29 Years | 1,222 (6.9%) | 1,089 (6.0%) |
| 30 to 34 Years | 1,610 (9.1%) | 1,358 (7.5%) |
| 35 to 39 Years | 1,123 (6.3%) | 1,202 (6.7%) |
| 40 to 44 Years | 1,178 (6.6%) | 1,223 (6.8%) |
| 45 to 49 Years | 945 (5.3%) | 1,157 (6.4%) |
| 50 to 54 Years | 797 (4.5%) | 1,029 (5.7%) |
| 55 to 59 Years | 1,277 (7.2%) | 1,357 (7.5%) |
| 60 to 64 Years | 1,050 (5.9%) | 1,292 (7.2%) |
| 65 to 69 Years | 739 (4.2%) | 804 (4.5%) |
| 70 to 74 Years | 599 (3.4%) | 825 (4.6%) |
| 75 to 79 Years | 416 (2.3%) | 478 (2.6%) |
| 80 to 84 Years | 162 (0.9%) | 301 (1.7%) |
| 85 Years and over | 188 (1.1%) | 337 (1.9%) |
| Total | 17,748 (100.0%) | 18,034 (100.0%) |
Families and Households in La Porte
Median Family Size in La Porte
The median family size in La Porte is 3.30 persons per family, with single male/father families (527 | 5.8%) accounting for the largest median family size of 3.67 persons per family. On the other hand, single female/mother families (1,942 | 21.2%) represent the smallest median family size with 3.11 persons per family.
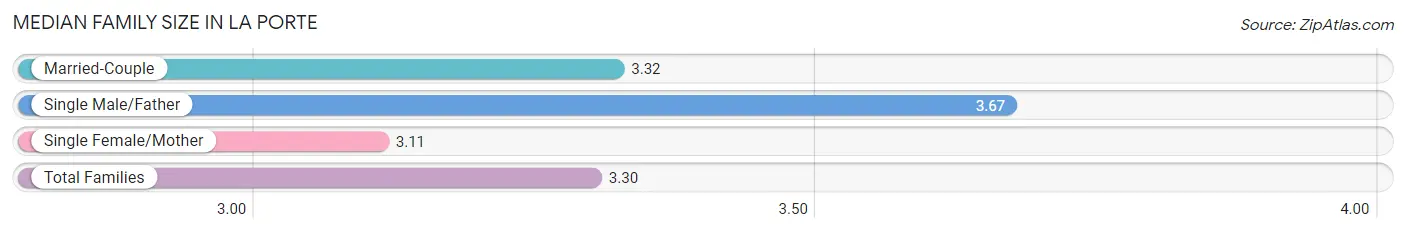
| Family Type | # Families | Family Size |
| Married-Couple | 6,698 (73.1%) | 3.32 |
| Single Male/Father | 527 (5.8%) | 3.67 |
| Single Female/Mother | 1,942 (21.2%) | 3.11 |
| Total Families | 9,167 (100.0%) | 3.30 |
Median Household Size in La Porte
The median household size in La Porte is 2.78 persons per household, with single male/father households (527 | 4.1%) accounting for the largest median household size of 4.1 persons per household. non-family households (3,682 | 28.7%) represent the smallest median household size with 1.23 persons per household.
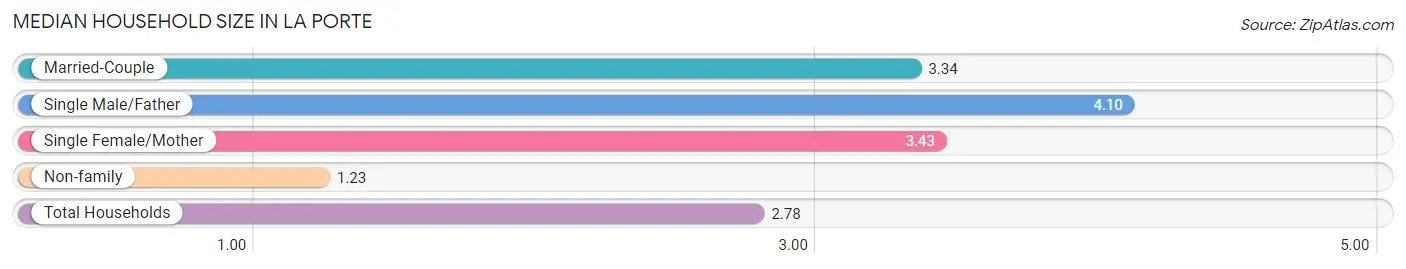
| Household Type | # Households | Household Size |
| Married-Couple | 6,698 (52.1%) | 3.34 |
| Single Male/Father | 527 (4.1%) | 4.10 |
| Single Female/Mother | 1,942 (15.1%) | 3.43 |
| Non-family | 3,682 (28.7%) | 1.23 |
| Total Households | 12,849 (100.0%) | 2.78 |
Household Size by Marriage Status in La Porte
Out of a total of 12,849 households in La Porte, 9,167 (71.3%) are family households, while 3,682 (28.7%) are nonfamily households. The most numerous type of family households are 2-person households, comprising 3,725, and the most common type of nonfamily households are 1-person households, comprising 3,068.
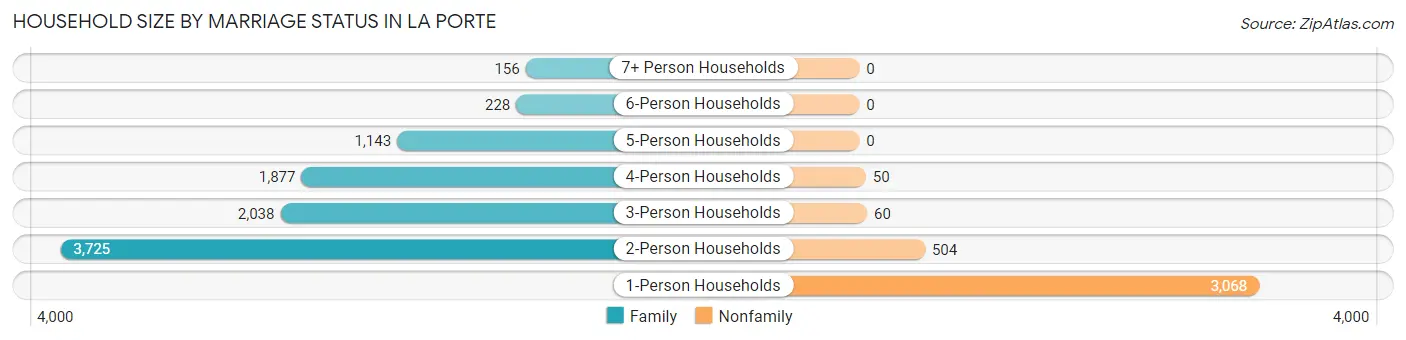
| Household Size | Family Households | Nonfamily Households |
| 1-Person Households | - | 3,068 (23.9%) |
| 2-Person Households | 3,725 (29.0%) | 504 (3.9%) |
| 3-Person Households | 2,038 (15.9%) | 60 (0.5%) |
| 4-Person Households | 1,877 (14.6%) | 50 (0.4%) |
| 5-Person Households | 1,143 (8.9%) | 0 (0.0%) |
| 6-Person Households | 228 (1.8%) | 0 (0.0%) |
| 7+ Person Households | 156 (1.2%) | 0 (0.0%) |
| Total | 9,167 (71.3%) | 3,682 (28.7%) |
Female Fertility in La Porte
Fertility by Age in La Porte
Average fertility rate in La Porte is 56.0 births per 1,000 women. Women in the age bracket of 20 to 34 years have the highest fertility rate with 96.0 births per 1,000 women. Women in the age bracket of 20 to 34 years acount for 72.1% of all women with births.
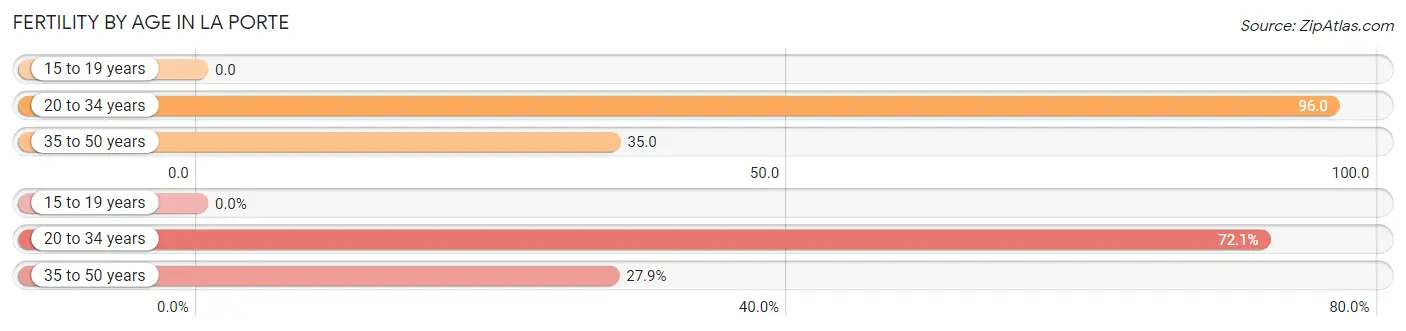
| Age Bracket | Women with Births | Births / 1,000 Women |
| 15 to 19 years | 0 (0.0%) | 0.0 |
| 20 to 34 years | 341 (72.1%) | 96.0 |
| 35 to 50 years | 132 (27.9%) | 35.0 |
| Total | 473 (100.0%) | 56.0 |
Fertility by Age by Marriage Status in La Porte
67.7% of women with births (473) in La Porte are married. The highest percentage of unmarried women with births falls into 35 to 50 years age bracket with 41.7% of them unmarried at the time of birth, while the lowest percentage of unmarried women with births belong to 20 to 34 years age bracket with 28.7% of them unmarried.
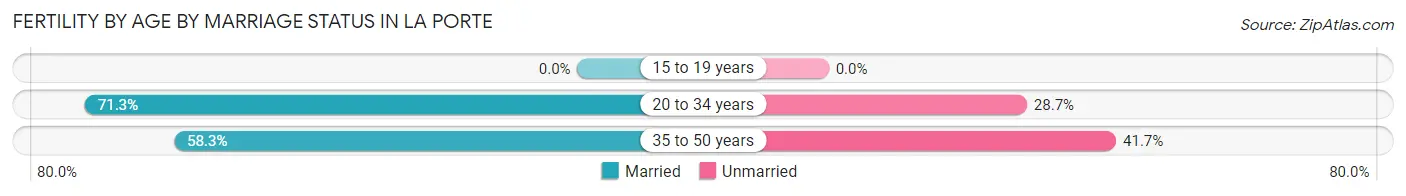
| Age Bracket | Married | Unmarried |
| 15 to 19 years | 0 (0.0%) | 0 (0.0%) |
| 20 to 34 years | 243 (71.3%) | 98 (28.7%) |
| 35 to 50 years | 77 (58.3%) | 55 (41.7%) |
| Total | 320 (67.6%) | 153 (32.4%) |
Fertility by Education in La Porte
Average fertility rate in La Porte is 56.0 births per 1,000 women. Women with the education attainment of bachelor's degree have the highest fertility rate of 67.0 births per 1,000 women, while women with the education attainment of graduate degree have the lowest fertility at 23.0 births per 1,000 women. Women with the education attainment of college or associate's degree represent 40.8% of all women with births.
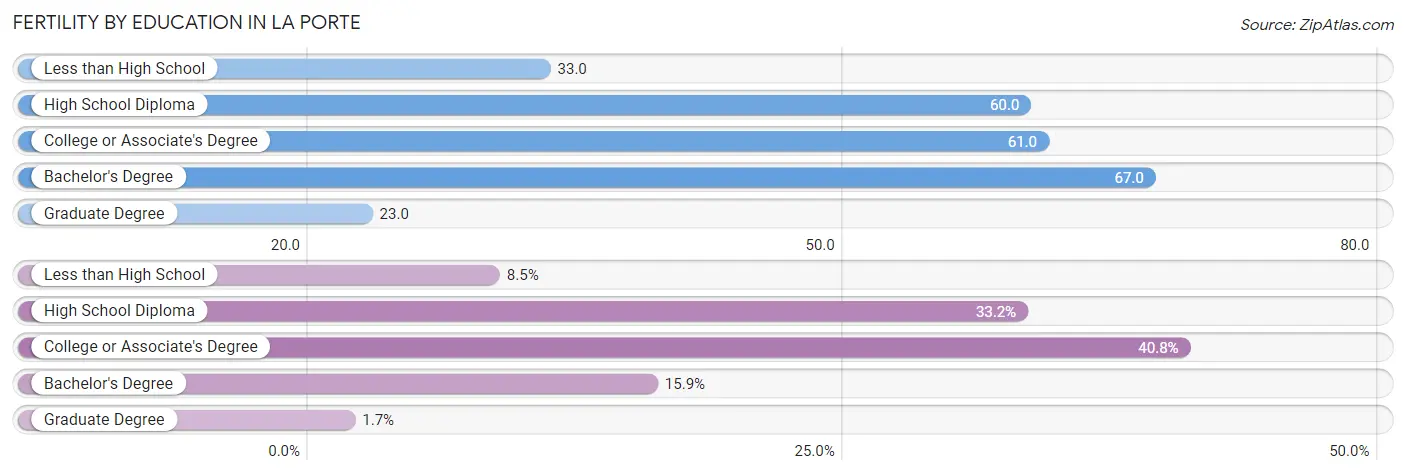
| Educational Attainment | Women with Births | Births / 1,000 Women |
| Less than High School | 40 (8.5%) | 33.0 |
| High School Diploma | 157 (33.2%) | 60.0 |
| College or Associate's Degree | 193 (40.8%) | 61.0 |
| Bachelor's Degree | 75 (15.9%) | 67.0 |
| Graduate Degree | 8 (1.7%) | 23.0 |
| Total | 473 (100.0%) | 56.0 |
Fertility by Education by Marriage Status in La Porte
32.4% of women with births in La Porte are unmarried. Women with the educational attainment of graduate degree are most likely to be married with 100.0% of them married at childbirth, while women with the educational attainment of high school diploma are least likely to be married with 52.2% of them unmarried at childbirth.
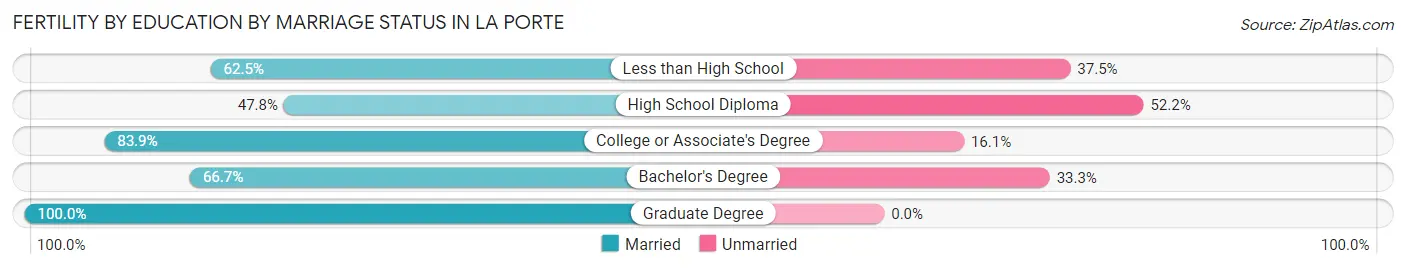
| Educational Attainment | Married | Unmarried |
| Less than High School | 25 (62.5%) | 15 (37.5%) |
| High School Diploma | 75 (47.8%) | 82 (52.2%) |
| College or Associate's Degree | 162 (83.9%) | 31 (16.1%) |
| Bachelor's Degree | 50 (66.7%) | 25 (33.3%) |
| Graduate Degree | 8 (100.0%) | 0 (0.0%) |
| Total | 320 (67.6%) | 153 (32.4%) |
Employment Characteristics in La Porte
Employment by Class of Employer in La Porte
Among the 16,290 employed individuals in La Porte, private company employees (12,336 | 75.7%), local government employees (1,239 | 7.6%), and not-for-profit organizations (787 | 4.8%) make up the most common classes of employment.
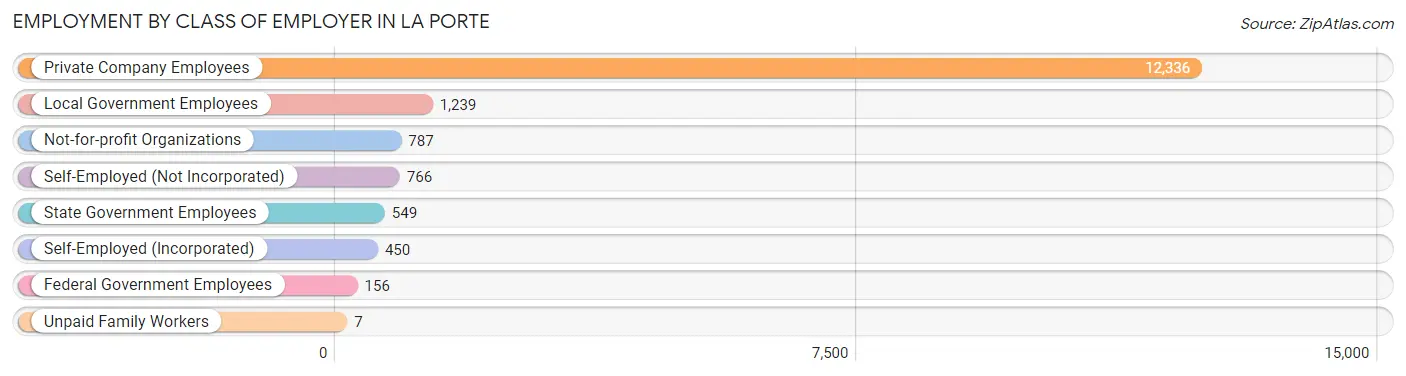
| Employer Class | # Employees | % Employees |
| Private Company Employees | 12,336 | 75.7% |
| Self-Employed (Incorporated) | 450 | 2.8% |
| Self-Employed (Not Incorporated) | 766 | 4.7% |
| Not-for-profit Organizations | 787 | 4.8% |
| Local Government Employees | 1,239 | 7.6% |
| State Government Employees | 549 | 3.4% |
| Federal Government Employees | 156 | 1.0% |
| Unpaid Family Workers | 7 | 0.0% |
| Total | 16,290 | 100.0% |
Employment Status by Age in La Porte
According to the labor force statistics for La Porte, out of the total population over 16 years of age (27,540), 63.8% or 17,571 individuals are in the labor force, with 5.3% or 931 of them unemployed. The age group with the highest labor force participation rate is 45 to 54 years, with 84.1% or 3,303 individuals in the labor force. Within the labor force, the 16 to 19 years age range has the highest percentage of unemployed individuals, with 29.8% or 197 of them being unemployed.
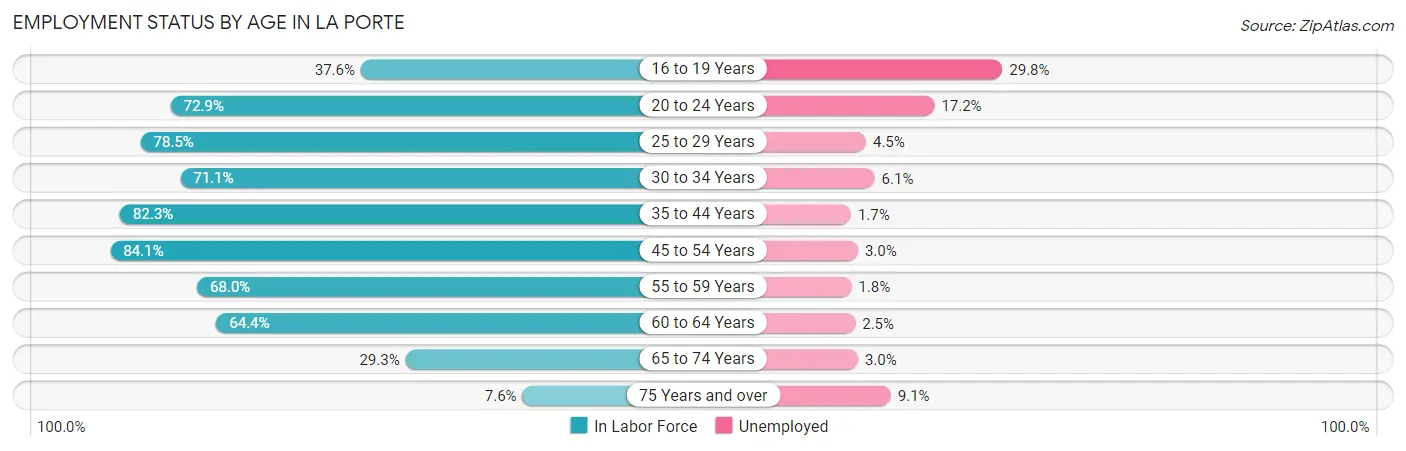
| Age Bracket | In Labor Force | Unemployed |
| 16 to 19 Years | 660 (37.6%) | 197 (29.8%) |
| 20 to 24 Years | 1,477 (72.9%) | 254 (17.2%) |
| 25 to 29 Years | 1,814 (78.5%) | 82 (4.5%) |
| 30 to 34 Years | 2,110 (71.1%) | 129 (6.1%) |
| 35 to 44 Years | 3,889 (82.3%) | 66 (1.7%) |
| 45 to 54 Years | 3,303 (84.1%) | 99 (3.0%) |
| 55 to 59 Years | 1,791 (68.0%) | 32 (1.8%) |
| 60 to 64 Years | 1,508 (64.4%) | 38 (2.5%) |
| 65 to 74 Years | 869 (29.3%) | 26 (3.0%) |
| 75 Years and over | 143 (7.6%) | 13 (9.1%) |
| Total | 17,571 (63.8%) | 931 (5.3%) |
Employment Status by Educational Attainment in La Porte
According to labor force statistics for La Porte, 76.2% of individuals (14,409) out of the total population between 25 and 64 years of age (18,909) are in the labor force, with 3.1% or 447 of them being unemployed. The group with the highest labor force participation rate are those with the educational attainment of bachelor's degree or higher, with 86.8% or 2,542 individuals in the labor force. Within the labor force, individuals with college / associate degree education have the highest percentage of unemployment, with 4.1% or 242 of them being unemployed.

| Educational Attainment | In Labor Force | Unemployed |
| Less than High School | 1,607 (74.4%) | 24 (1.1%) |
| High School Diploma | 4,358 (69.2%) | 195 (3.1%) |
| College / Associate Degree | 5,913 (78.6%) | 308 (4.1%) |
| Bachelor's Degree or higher | 2,542 (86.8%) | 59 (2.0%) |
| Total | 14,409 (76.2%) | 586 (3.1%) |
Employment Occupations by Sex in La Porte
Management, Business, Science and Arts Occupations
The most common Management, Business, Science and Arts occupations in La Porte are Community & Social Service (1,691 | 10.2%), Management (1,598 | 9.6%), Computers, Engineering & Science (1,087 | 6.5%), Education Instruction & Library (1,059 | 6.4%), and Health Diagnosing & Treating (706 | 4.3%).
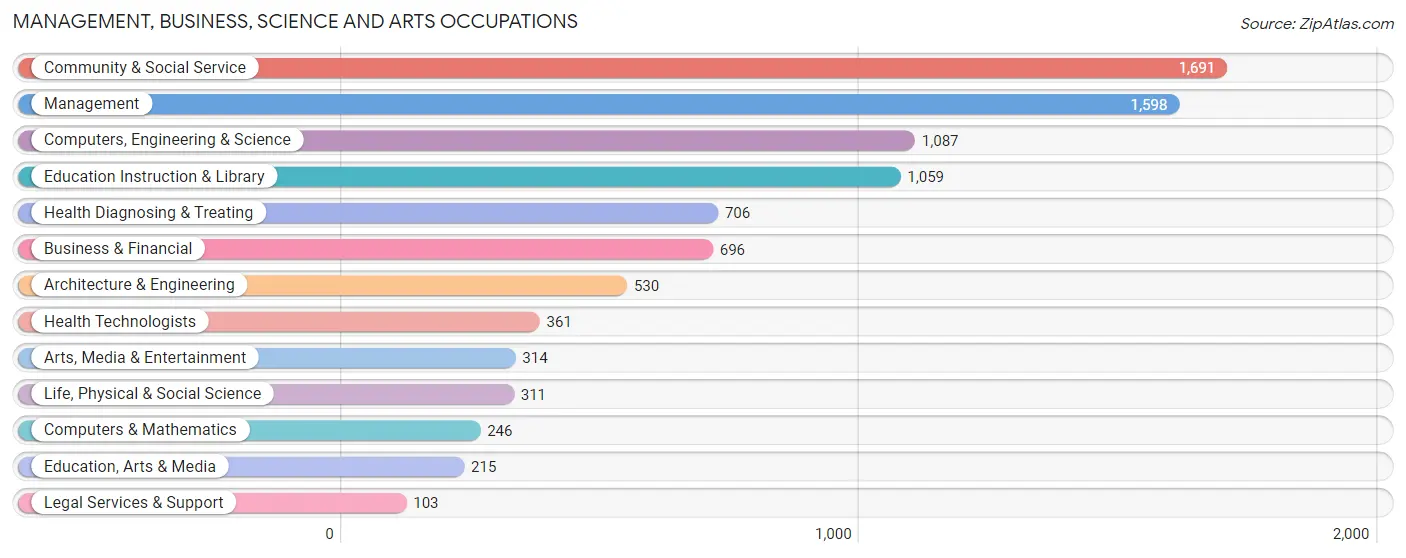
Management, Business, Science and Arts Occupations by Sex
Within the Management, Business, Science and Arts occupations in La Porte, the most male-oriented occupations are Life, Physical & Social Science (96.1%), Computers & Mathematics (70.3%), and Arts, Media & Entertainment (70.1%), while the most female-oriented occupations are Education, Arts & Media (96.7%), Health Diagnosing & Treating (85.1%), and Health Technologists (79.8%).
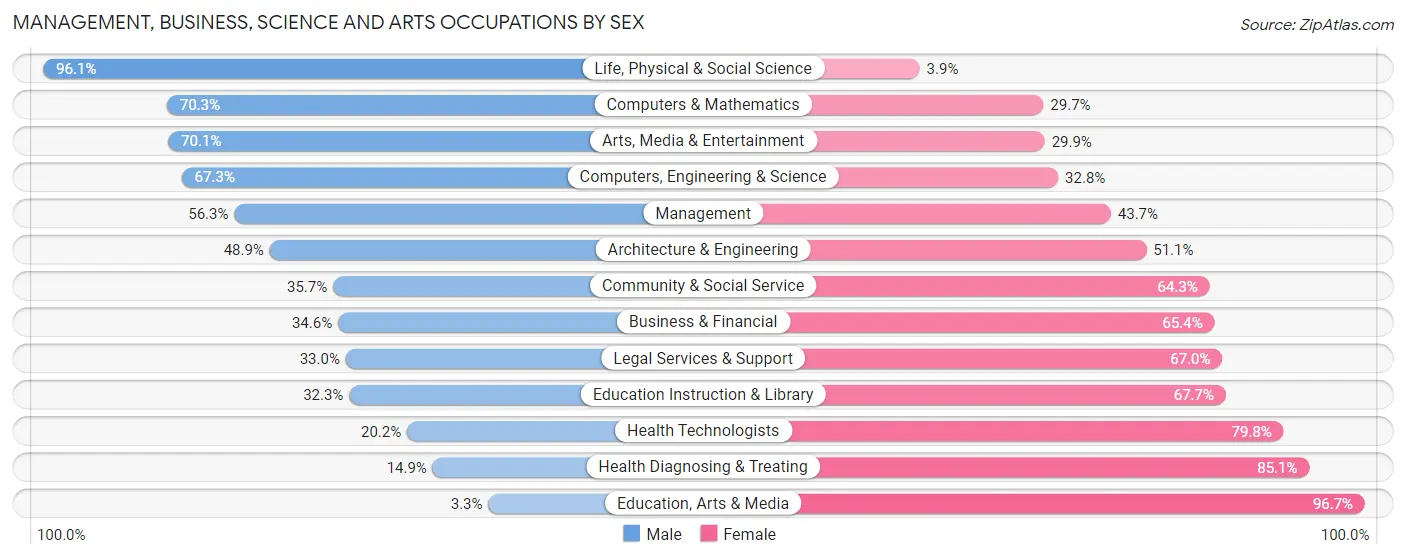
| Occupation | Male | Female |
| Management | 899 (56.3%) | 699 (43.7%) |
| Business & Financial | 241 (34.6%) | 455 (65.4%) |
| Computers, Engineering & Science | 731 (67.2%) | 356 (32.8%) |
| Computers & Mathematics | 173 (70.3%) | 73 (29.7%) |
| Architecture & Engineering | 259 (48.9%) | 271 (51.1%) |
| Life, Physical & Social Science | 299 (96.1%) | 12 (3.9%) |
| Community & Social Service | 603 (35.7%) | 1,088 (64.3%) |
| Education, Arts & Media | 7 (3.3%) | 208 (96.7%) |
| Legal Services & Support | 34 (33.0%) | 69 (67.0%) |
| Education Instruction & Library | 342 (32.3%) | 717 (67.7%) |
| Arts, Media & Entertainment | 220 (70.1%) | 94 (29.9%) |
| Health Diagnosing & Treating | 105 (14.9%) | 601 (85.1%) |
| Health Technologists | 73 (20.2%) | 288 (79.8%) |
| Total (Category) | 2,579 (44.6%) | 3,199 (55.4%) |
| Total (Overall) | 8,898 (53.5%) | 7,732 (46.5%) |
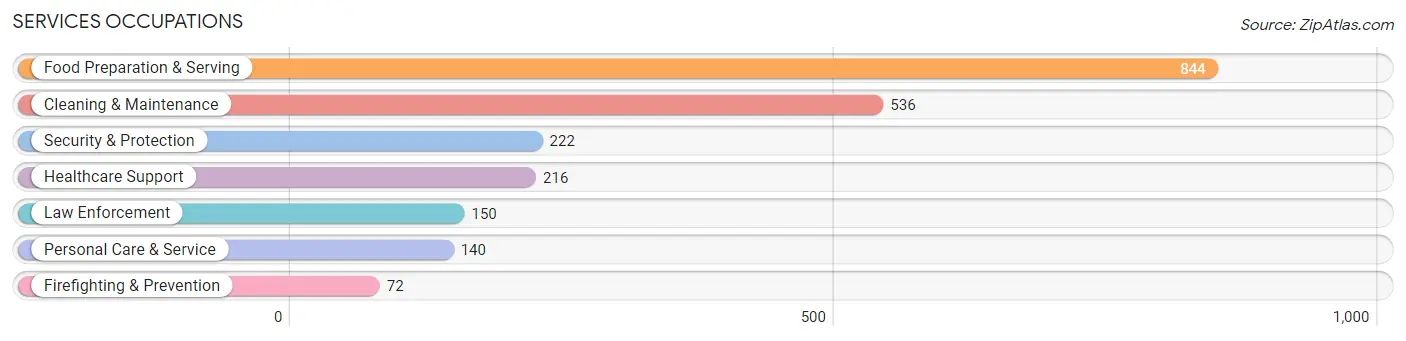
Services Occupations
The most common Services occupations in La Porte are Food Preparation & Serving (844 | 5.1%), Cleaning & Maintenance (536 | 3.2%), Security & Protection (222 | 1.3%), Healthcare Support (216 | 1.3%), and Law Enforcement (150 | 0.9%).
Services Occupations by Sex
Within the Services occupations in La Porte, the most male-oriented occupations are Law Enforcement (87.3%), Security & Protection (79.3%), and Cleaning & Maintenance (72.8%), while the most female-oriented occupations are Healthcare Support (100.0%), Personal Care & Service (80.7%), and Food Preparation & Serving (44.8%).
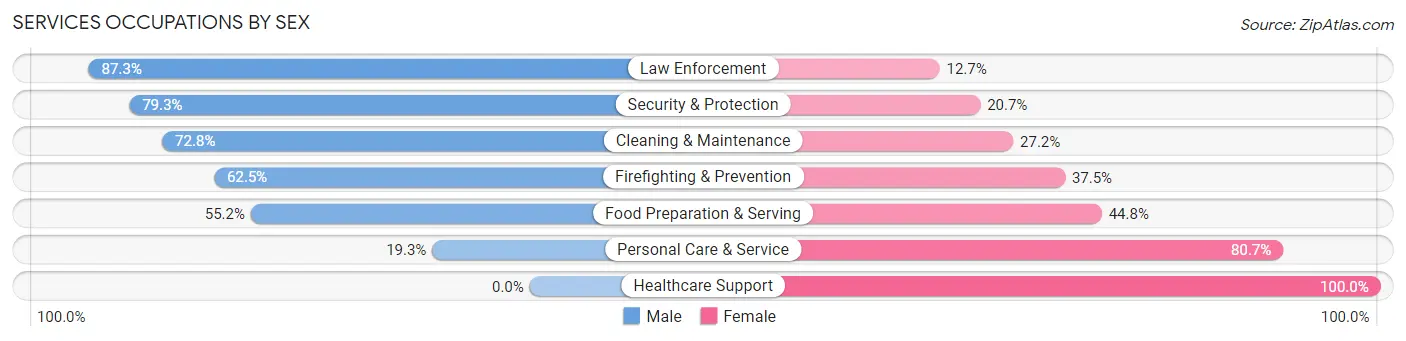
| Occupation | Male | Female |
| Healthcare Support | 0 (0.0%) | 216 (100.0%) |
| Security & Protection | 176 (79.3%) | 46 (20.7%) |
| Firefighting & Prevention | 45 (62.5%) | 27 (37.5%) |
| Law Enforcement | 131 (87.3%) | 19 (12.7%) |
| Food Preparation & Serving | 466 (55.2%) | 378 (44.8%) |
| Cleaning & Maintenance | 390 (72.8%) | 146 (27.2%) |
| Personal Care & Service | 27 (19.3%) | 113 (80.7%) |
| Total (Category) | 1,059 (54.1%) | 899 (45.9%) |
| Total (Overall) | 8,898 (53.5%) | 7,732 (46.5%) |
Sales and Office Occupations
The most common Sales and Office occupations in La Porte are Office & Administration (2,754 | 16.6%), and Sales & Related (1,325 | 8.0%).

Sales and Office Occupations by Sex

| Occupation | Male | Female |
| Sales & Related | 523 (39.5%) | 802 (60.5%) |
| Office & Administration | 523 (19.0%) | 2,231 (81.0%) |
| Total (Category) | 1,046 (25.6%) | 3,033 (74.4%) |
| Total (Overall) | 8,898 (53.5%) | 7,732 (46.5%) |
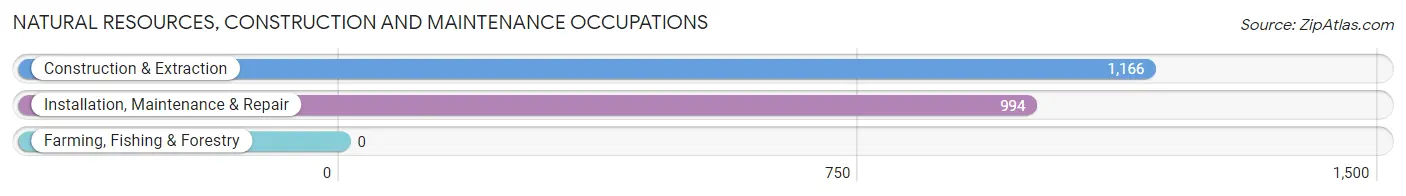
Natural Resources, Construction and Maintenance Occupations
The most common Natural Resources, Construction and Maintenance occupations in La Porte are Construction & Extraction (1,166 | 7.0%), and Installation, Maintenance & Repair (994 | 6.0%).
Natural Resources, Construction and Maintenance Occupations by Sex

| Occupation | Male | Female |
| Farming, Fishing & Forestry | 0 (0.0%) | 0 (0.0%) |
| Construction & Extraction | 1,117 (95.8%) | 49 (4.2%) |
| Installation, Maintenance & Repair | 946 (95.2%) | 48 (4.8%) |
| Total (Category) | 2,063 (95.5%) | 97 (4.5%) |
| Total (Overall) | 8,898 (53.5%) | 7,732 (46.5%) |
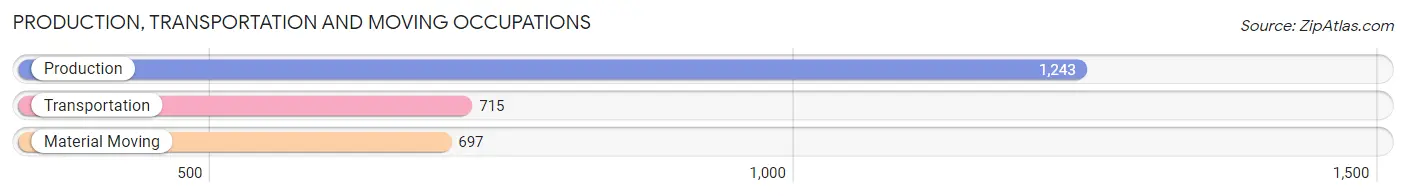
Production, Transportation and Moving Occupations
The most common Production, Transportation and Moving occupations in La Porte are Production (1,243 | 7.5%), Transportation (715 | 4.3%), and Material Moving (697 | 4.2%).
Production, Transportation and Moving Occupations by Sex
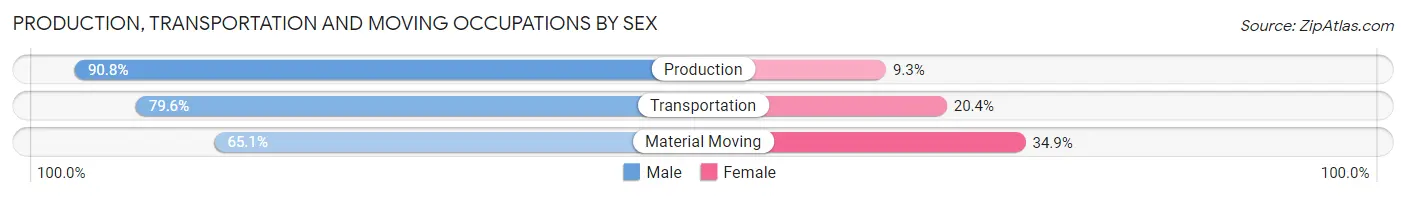
| Occupation | Male | Female |
| Production | 1,128 (90.7%) | 115 (9.2%) |
| Transportation | 569 (79.6%) | 146 (20.4%) |
| Material Moving | 454 (65.1%) | 243 (34.9%) |
| Total (Category) | 2,151 (81.0%) | 504 (19.0%) |
| Total (Overall) | 8,898 (53.5%) | 7,732 (46.5%) |
Employment Industries by Sex in La Porte
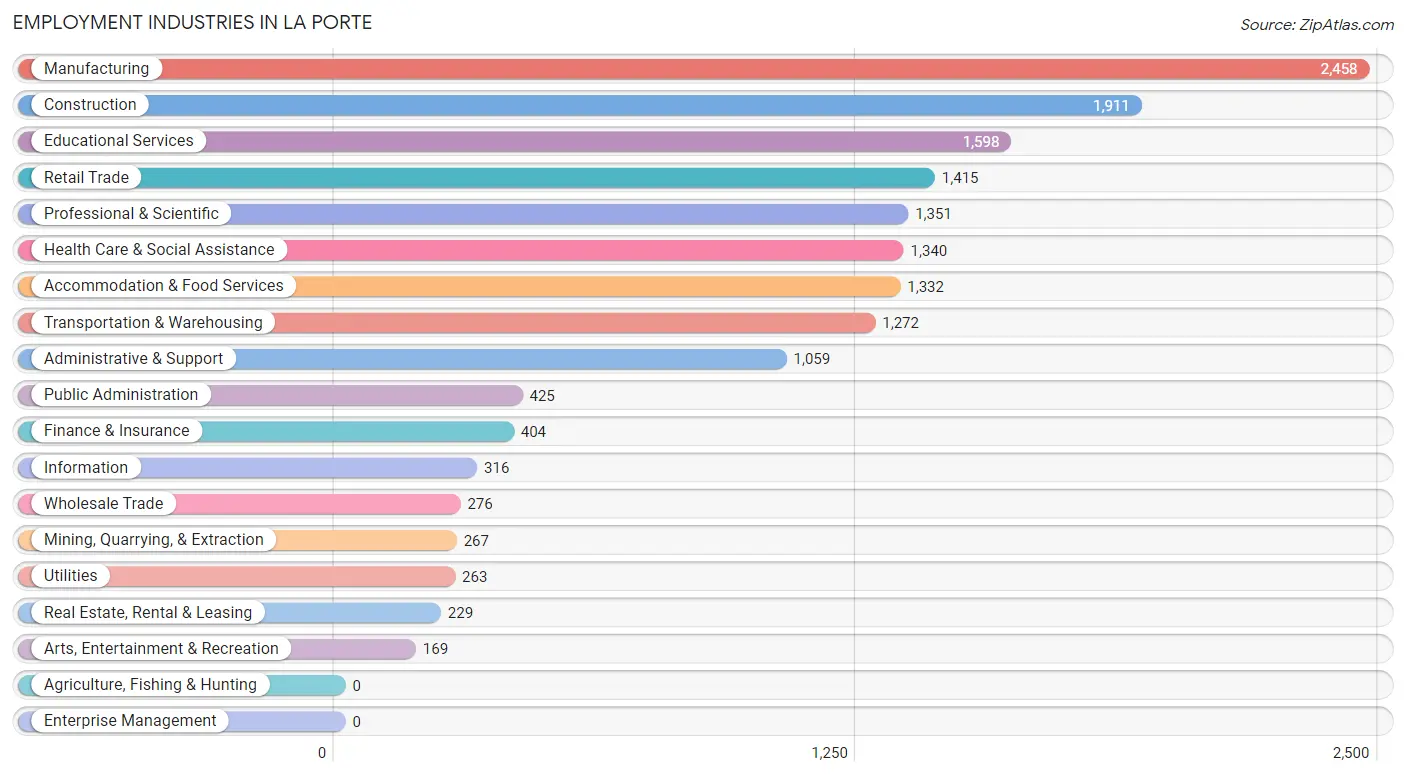
Employment Industries in La Porte
The major employment industries in La Porte include Manufacturing (2,458 | 14.8%), Construction (1,911 | 11.5%), Educational Services (1,598 | 9.6%), Retail Trade (1,415 | 8.5%), and Professional & Scientific (1,351 | 8.1%).
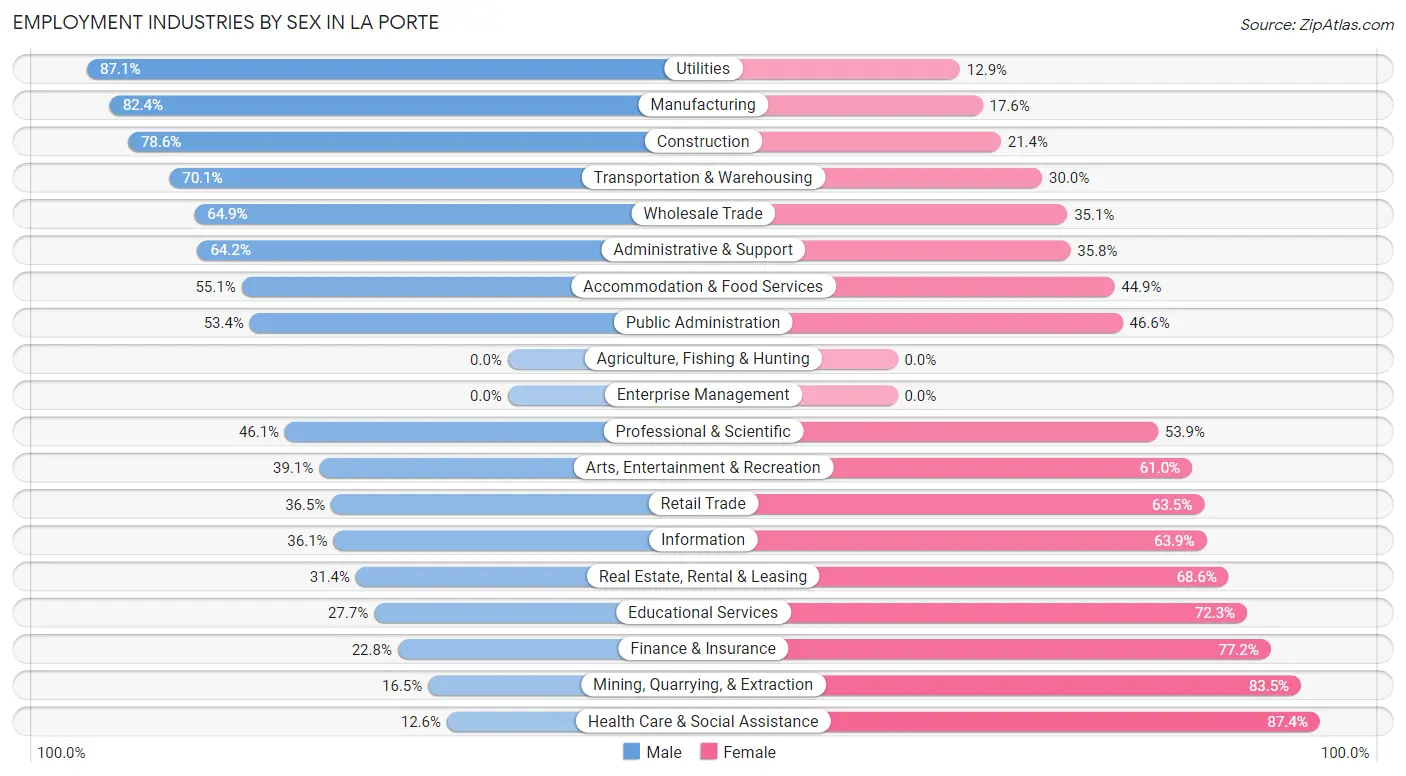
Employment Industries by Sex in La Porte
The La Porte industries that see more men than women are Utilities (87.1%), Manufacturing (82.4%), and Construction (78.6%), whereas the industries that tend to have a higher number of women are Health Care & Social Assistance (87.4%), Mining, Quarrying, & Extraction (83.5%), and Finance & Insurance (77.2%).
| Industry | Male | Female |
| Agriculture, Fishing & Hunting | 0 (0.0%) | 0 (0.0%) |
| Mining, Quarrying, & Extraction | 44 (16.5%) | 223 (83.5%) |
| Construction | 1,502 (78.6%) | 409 (21.4%) |
| Manufacturing | 2,025 (82.4%) | 433 (17.6%) |
| Wholesale Trade | 179 (64.9%) | 97 (35.1%) |
| Retail Trade | 517 (36.5%) | 898 (63.5%) |
| Transportation & Warehousing | 891 (70.1%) | 381 (29.9%) |
| Utilities | 229 (87.1%) | 34 (12.9%) |
| Information | 114 (36.1%) | 202 (63.9%) |
| Finance & Insurance | 92 (22.8%) | 312 (77.2%) |
| Real Estate, Rental & Leasing | 72 (31.4%) | 157 (68.6%) |
| Professional & Scientific | 623 (46.1%) | 728 (53.9%) |
| Enterprise Management | 0 (0.0%) | 0 (0.0%) |
| Administrative & Support | 680 (64.2%) | 379 (35.8%) |
| Educational Services | 442 (27.7%) | 1,156 (72.3%) |
| Health Care & Social Assistance | 169 (12.6%) | 1,171 (87.4%) |
| Arts, Entertainment & Recreation | 66 (39.1%) | 103 (61.0%) |
| Accommodation & Food Services | 734 (55.1%) | 598 (44.9%) |
| Public Administration | 227 (53.4%) | 198 (46.6%) |
| Total | 8,898 (53.5%) | 7,732 (46.5%) |
Education in La Porte
School Enrollment in La Porte
The most common levels of schooling among the 8,936 students in La Porte are elementary school (2,315 | 25.9%), college / undergraduate (1,863 | 20.8%), and middle school (1,835 | 20.5%).
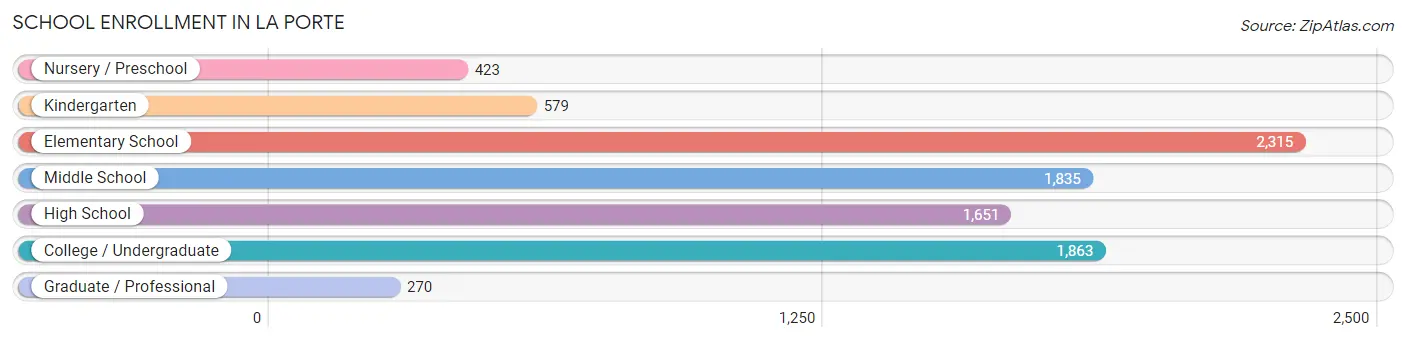
| School Level | # Students | % Students |
| Nursery / Preschool | 423 | 4.7% |
| Kindergarten | 579 | 6.5% |
| Elementary School | 2,315 | 25.9% |
| Middle School | 1,835 | 20.5% |
| High School | 1,651 | 18.5% |
| College / Undergraduate | 1,863 | 20.8% |
| Graduate / Professional | 270 | 3.0% |
| Total | 8,936 | 100.0% |
School Enrollment by Age by Funding Source in La Porte
Out of a total of 8,936 students who are enrolled in schools in La Porte, 920 (10.3%) attend a private institution, while the remaining 8,016 (89.7%) are enrolled in public schools. The age group of 3 to 4 year olds has the highest likelihood of being enrolled in private schools, with 134 (37.1% in the age bracket) enrolled. Conversely, the age group of 15 to 17 year olds has the lowest likelihood of being enrolled in a private school, with 1,269 (97.5% in the age bracket) attending a public institution.
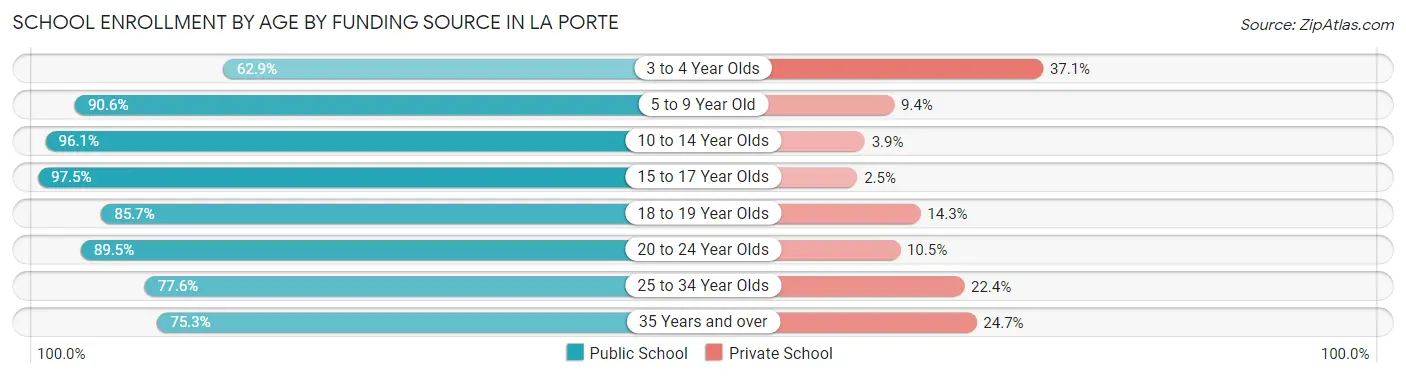
| Age Bracket | Public School | Private School |
| 3 to 4 Year Olds | 227 (62.9%) | 134 (37.1%) |
| 5 to 9 Year Old | 2,344 (90.6%) | 243 (9.4%) |
| 10 to 14 Year Olds | 2,252 (96.1%) | 92 (3.9%) |
| 15 to 17 Year Olds | 1,269 (97.5%) | 33 (2.5%) |
| 18 to 19 Year Olds | 438 (85.7%) | 73 (14.3%) |
| 20 to 24 Year Olds | 606 (89.5%) | 71 (10.5%) |
| 25 to 34 Year Olds | 481 (77.6%) | 139 (22.4%) |
| 35 Years and over | 402 (75.3%) | 132 (24.7%) |
| Total | 8,016 (89.7%) | 920 (10.3%) |
Educational Attainment by Field of Study in La Porte
Education (817 | 19.8%), business (701 | 17.0%), science & technology (507 | 12.3%), arts & humanities (373 | 9.1%), and computers & mathematics (323 | 7.8%) are the most common fields of study among 4,118 individuals in La Porte who have obtained a bachelor's degree or higher.
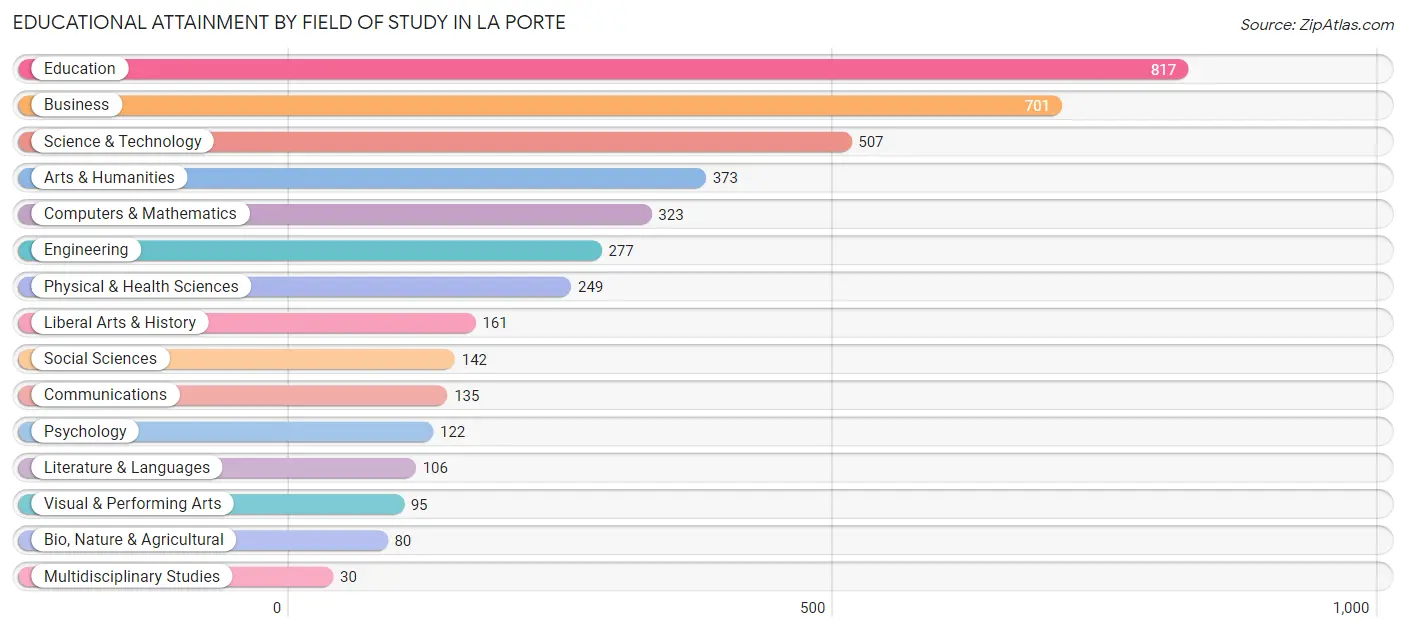
| Field of Study | # Graduates | % Graduates |
| Computers & Mathematics | 323 | 7.8% |
| Bio, Nature & Agricultural | 80 | 1.9% |
| Physical & Health Sciences | 249 | 6.0% |
| Psychology | 122 | 3.0% |
| Social Sciences | 142 | 3.5% |
| Engineering | 277 | 6.7% |
| Multidisciplinary Studies | 30 | 0.7% |
| Science & Technology | 507 | 12.3% |
| Business | 701 | 17.0% |
| Education | 817 | 19.8% |
| Literature & Languages | 106 | 2.6% |
| Liberal Arts & History | 161 | 3.9% |
| Visual & Performing Arts | 95 | 2.3% |
| Communications | 135 | 3.3% |
| Arts & Humanities | 373 | 9.1% |
| Total | 4,118 | 100.0% |
Transportation & Commute in La Porte
Vehicle Availability by Sex in La Porte
The most prevalent vehicle ownership categories in La Porte are males with 2 vehicles (3,412, accounting for 39.3%) and females with 2 vehicles (2,779, making up 45.2%).
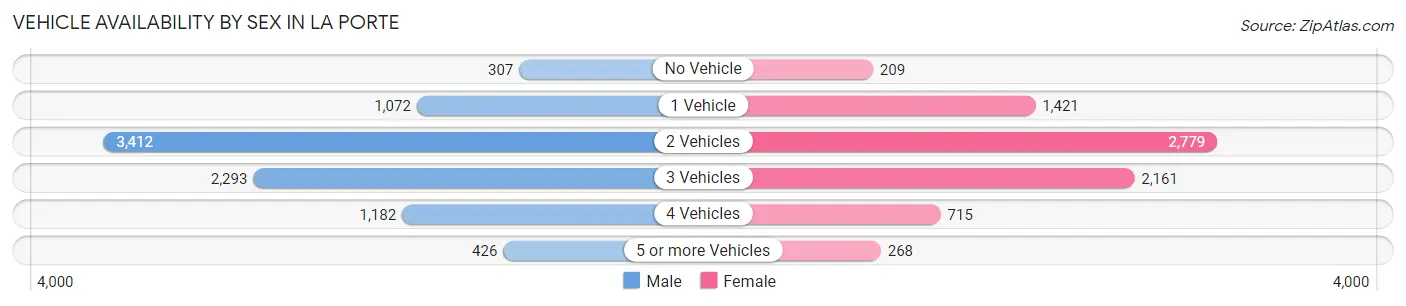
| Vehicles Available | Male | Female |
| No Vehicle | 307 (3.5%) | 209 (2.8%) |
| 1 Vehicle | 1,072 (12.3%) | 1,421 (18.8%) |
| 2 Vehicles | 3,412 (39.3%) | 2,779 (36.8%) |
| 3 Vehicles | 2,293 (26.4%) | 2,161 (28.6%) |
| 4 Vehicles | 1,182 (13.6%) | 715 (9.5%) |
| 5 or more Vehicles | 426 (4.9%) | 268 (3.5%) |
| Total | 8,692 (100.0%) | 7,553 (100.0%) |
Commute Time in La Porte
The most frequently occuring commute durations in La Porte are 20 to 24 minutes (2,559 commuters, 16.9%), 15 to 19 minutes (2,405 commuters, 15.9%), and 30 to 34 minutes (2,009 commuters, 13.2%).
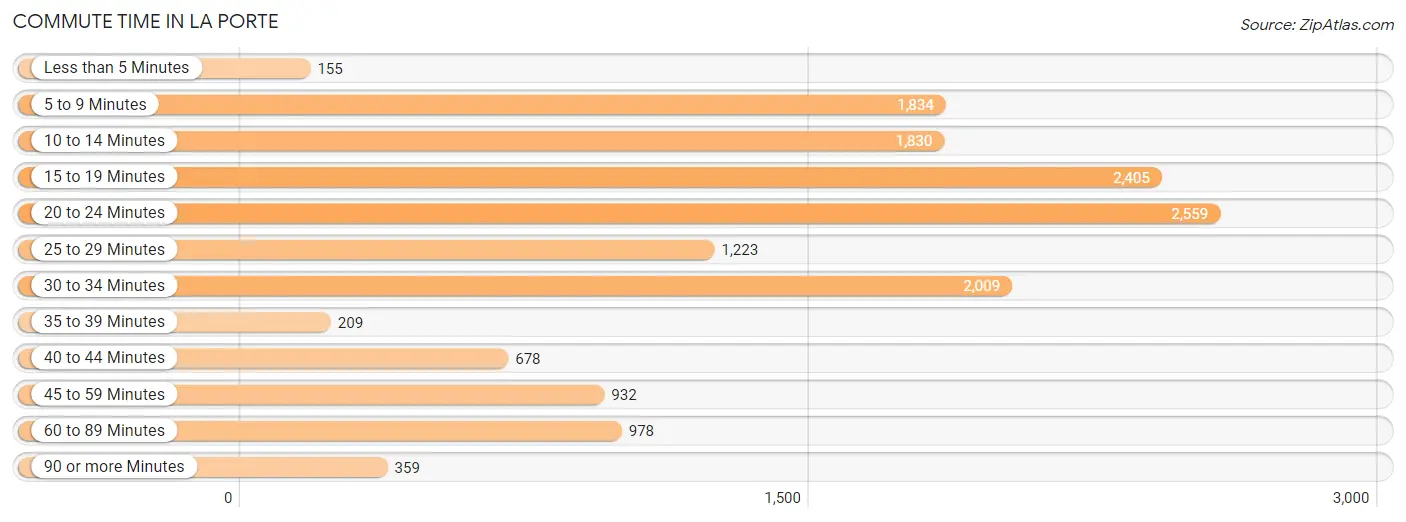
| Commute Time | # Commuters | % Commuters |
| Less than 5 Minutes | 155 | 1.0% |
| 5 to 9 Minutes | 1,834 | 12.1% |
| 10 to 14 Minutes | 1,830 | 12.1% |
| 15 to 19 Minutes | 2,405 | 15.9% |
| 20 to 24 Minutes | 2,559 | 16.9% |
| 25 to 29 Minutes | 1,223 | 8.1% |
| 30 to 34 Minutes | 2,009 | 13.2% |
| 35 to 39 Minutes | 209 | 1.4% |
| 40 to 44 Minutes | 678 | 4.5% |
| 45 to 59 Minutes | 932 | 6.1% |
| 60 to 89 Minutes | 978 | 6.5% |
| 90 or more Minutes | 359 | 2.4% |
Commute Time by Sex in La Porte
The most common commute times in La Porte are 15 to 19 minutes (1,384 commuters, 17.1%) for males and 20 to 24 minutes (1,343 commuters, 19.0%) for females.
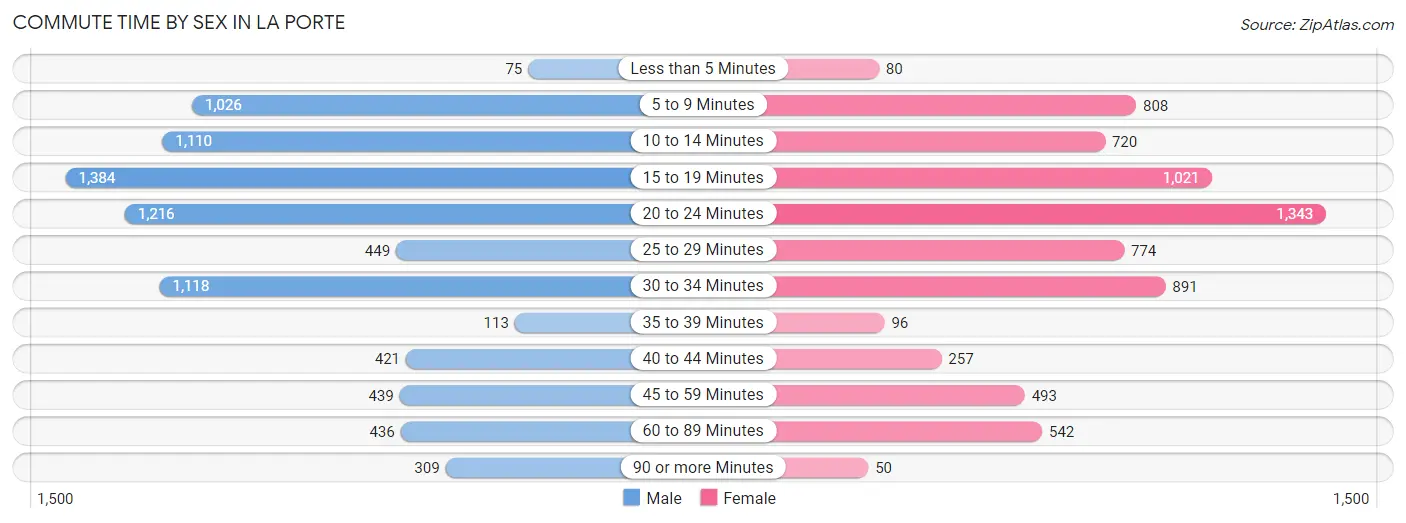
| Commute Time | Male | Female |
| Less than 5 Minutes | 75 (0.9%) | 80 (1.1%) |
| 5 to 9 Minutes | 1,026 (12.7%) | 808 (11.4%) |
| 10 to 14 Minutes | 1,110 (13.7%) | 720 (10.2%) |
| 15 to 19 Minutes | 1,384 (17.1%) | 1,021 (14.4%) |
| 20 to 24 Minutes | 1,216 (15.0%) | 1,343 (19.0%) |
| 25 to 29 Minutes | 449 (5.6%) | 774 (10.9%) |
| 30 to 34 Minutes | 1,118 (13.8%) | 891 (12.6%) |
| 35 to 39 Minutes | 113 (1.4%) | 96 (1.4%) |
| 40 to 44 Minutes | 421 (5.2%) | 257 (3.6%) |
| 45 to 59 Minutes | 439 (5.4%) | 493 (7.0%) |
| 60 to 89 Minutes | 436 (5.4%) | 542 (7.7%) |
| 90 or more Minutes | 309 (3.8%) | 50 (0.7%) |
Time of Departure to Work by Sex in La Porte
The most frequent times of departure to work in La Porte are 5:00 AM to 5:29 AM (1,164, 14.4%) for males and 7:00 AM to 7:29 AM (1,230, 17.4%) for females.
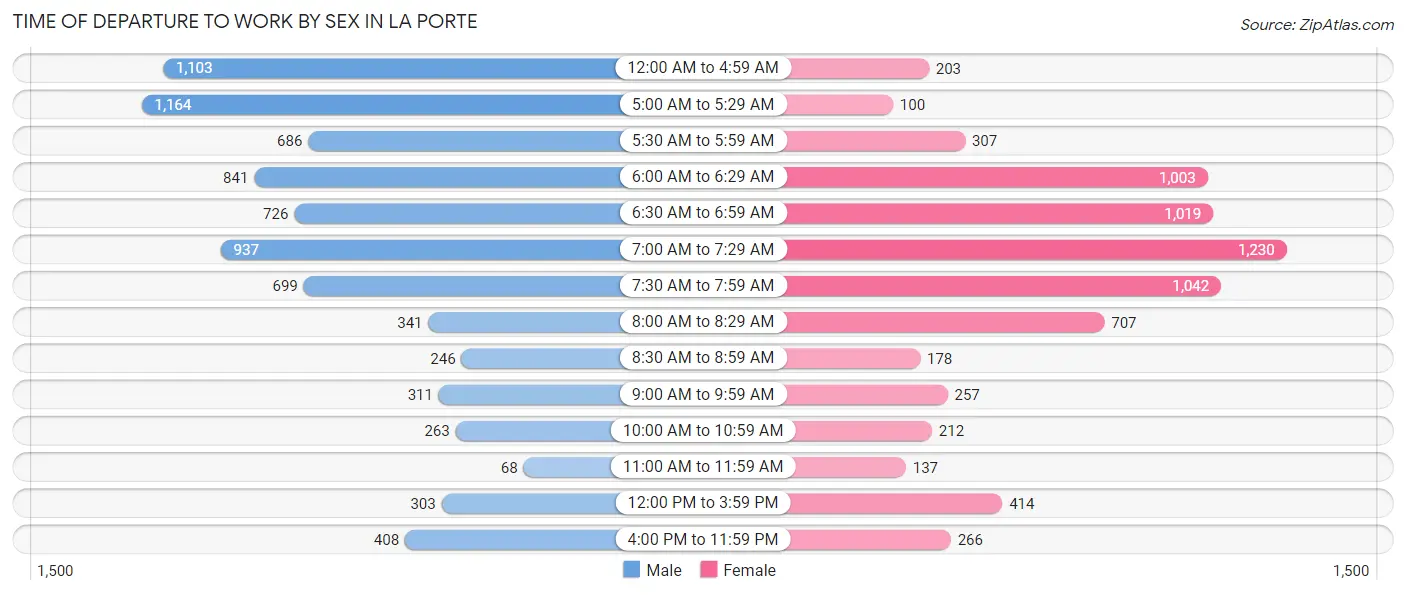
| Time of Departure | Male | Female |
| 12:00 AM to 4:59 AM | 1,103 (13.6%) | 203 (2.9%) |
| 5:00 AM to 5:29 AM | 1,164 (14.4%) | 100 (1.4%) |
| 5:30 AM to 5:59 AM | 686 (8.5%) | 307 (4.3%) |
| 6:00 AM to 6:29 AM | 841 (10.4%) | 1,003 (14.2%) |
| 6:30 AM to 6:59 AM | 726 (9.0%) | 1,019 (14.4%) |
| 7:00 AM to 7:29 AM | 937 (11.6%) | 1,230 (17.4%) |
| 7:30 AM to 7:59 AM | 699 (8.6%) | 1,042 (14.7%) |
| 8:00 AM to 8:29 AM | 341 (4.2%) | 707 (10.0%) |
| 8:30 AM to 8:59 AM | 246 (3.0%) | 178 (2.5%) |
| 9:00 AM to 9:59 AM | 311 (3.8%) | 257 (3.6%) |
| 10:00 AM to 10:59 AM | 263 (3.3%) | 212 (3.0%) |
| 11:00 AM to 11:59 AM | 68 (0.8%) | 137 (1.9%) |
| 12:00 PM to 3:59 PM | 303 (3.7%) | 414 (5.9%) |
| 4:00 PM to 11:59 PM | 408 (5.0%) | 266 (3.8%) |
| Total | 8,096 (100.0%) | 7,075 (100.0%) |
Housing Occupancy in La Porte
Occupancy by Ownership in La Porte
Of the total 12,849 dwellings in La Porte, owner-occupied units account for 9,234 (71.9%), while renter-occupied units make up 3,615 (28.1%).
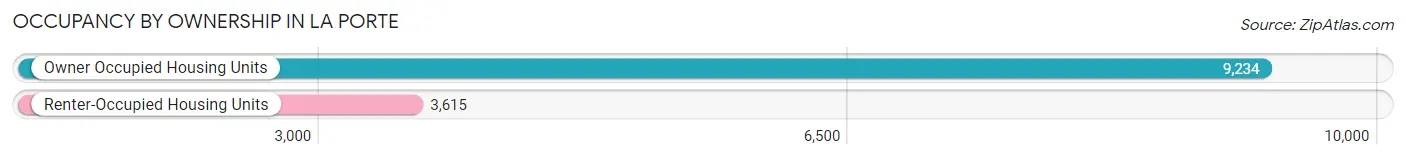
| Occupancy | # Housing Units | % Housing Units |
| Owner Occupied Housing Units | 9,234 | 71.9% |
| Renter-Occupied Housing Units | 3,615 | 28.1% |
| Total Occupied Housing Units | 12,849 | 100.0% |
Occupancy by Household Size in La Porte
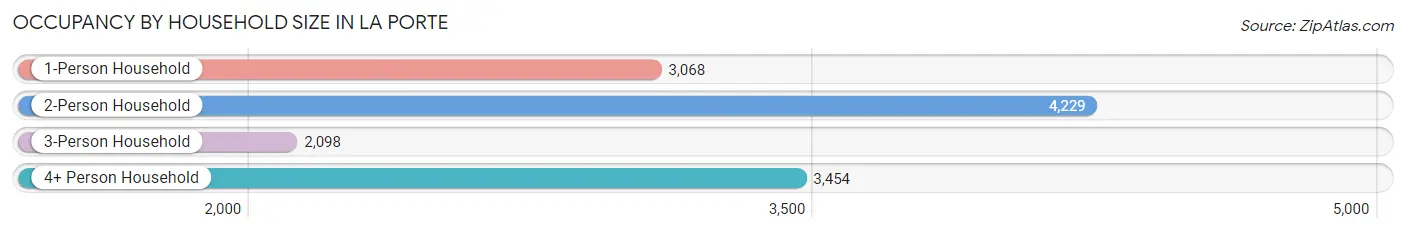
| Household Size | # Housing Units | % Housing Units |
| 1-Person Household | 3,068 | 23.9% |
| 2-Person Household | 4,229 | 32.9% |
| 3-Person Household | 2,098 | 16.3% |
| 4+ Person Household | 3,454 | 26.9% |
| Total Housing Units | 12,849 | 100.0% |
Occupancy by Ownership by Household Size in La Porte
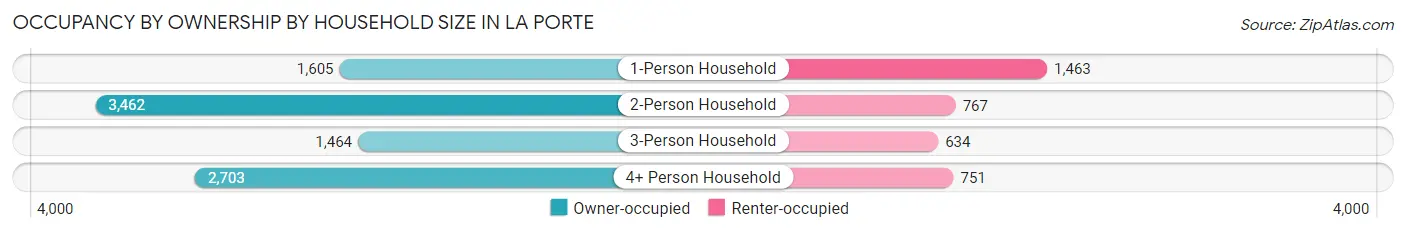
| Household Size | Owner-occupied | Renter-occupied |
| 1-Person Household | 1,605 (52.3%) | 1,463 (47.7%) |
| 2-Person Household | 3,462 (81.9%) | 767 (18.1%) |
| 3-Person Household | 1,464 (69.8%) | 634 (30.2%) |
| 4+ Person Household | 2,703 (78.3%) | 751 (21.7%) |
| Total Housing Units | 9,234 (71.9%) | 3,615 (28.1%) |
Occupancy by Educational Attainment in La Porte
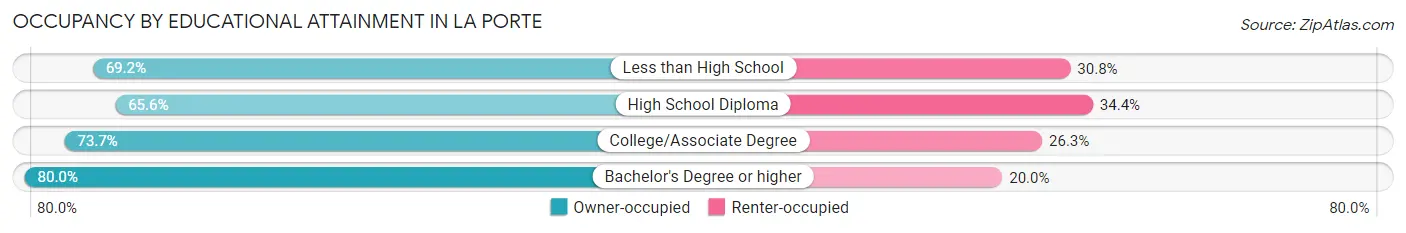
| Household Size | Owner-occupied | Renter-occupied |
| Less than High School | 867 (69.2%) | 386 (30.8%) |
| High School Diploma | 2,663 (65.6%) | 1,395 (34.4%) |
| College/Associate Degree | 3,805 (73.7%) | 1,359 (26.3%) |
| Bachelor's Degree or higher | 1,899 (80.0%) | 475 (20.0%) |
Occupancy by Age of Householder in La Porte
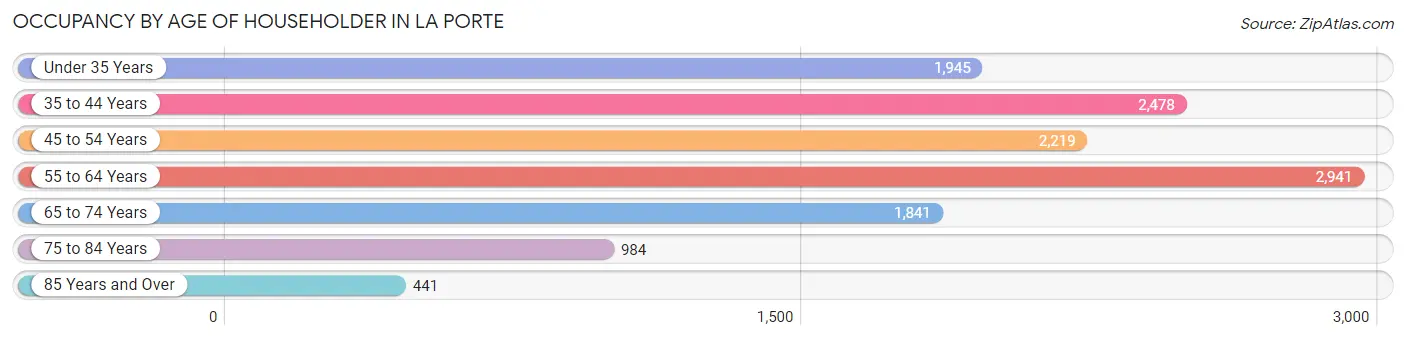
| Age Bracket | # Households | % Households |
| Under 35 Years | 1,945 | 15.1% |
| 35 to 44 Years | 2,478 | 19.3% |
| 45 to 54 Years | 2,219 | 17.3% |
| 55 to 64 Years | 2,941 | 22.9% |
| 65 to 74 Years | 1,841 | 14.3% |
| 75 to 84 Years | 984 | 7.7% |
| 85 Years and Over | 441 | 3.4% |
| Total | 12,849 | 100.0% |
Housing Finances in La Porte
Median Income by Occupancy in La Porte
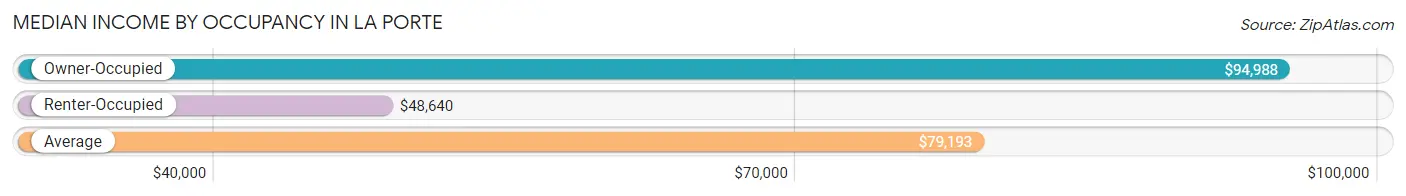
| Occupancy Type | # Households | Median Income |
| Owner-Occupied | 9,234 (71.9%) | $94,988 |
| Renter-Occupied | 3,615 (28.1%) | $48,640 |
| Average | 12,849 (100.0%) | $79,193 |
Occupancy by Householder Income Bracket in La Porte
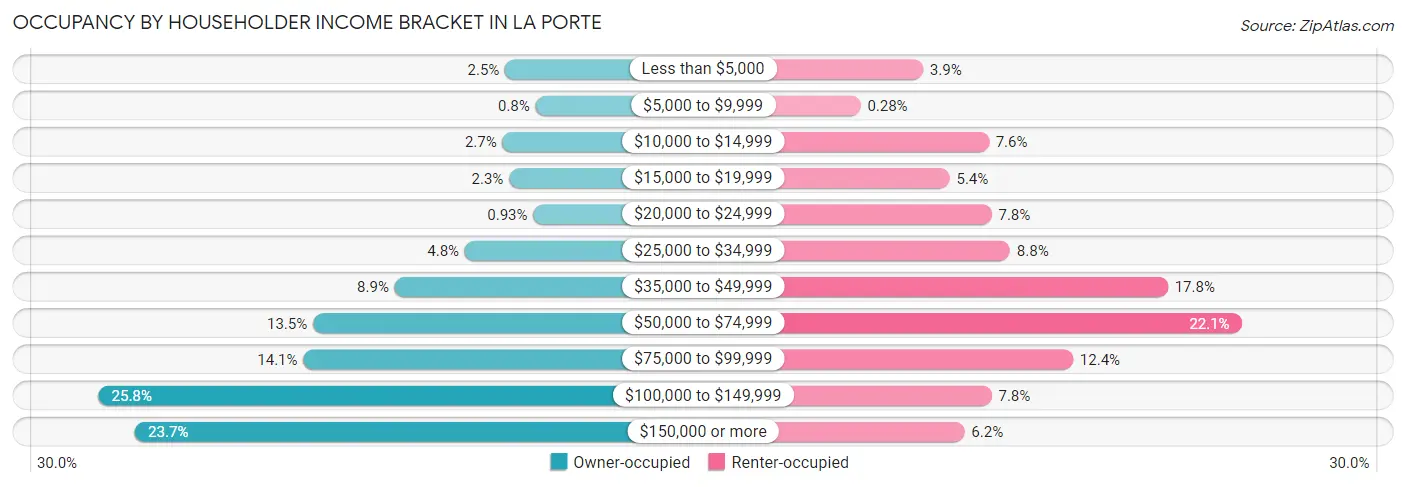
| Income Bracket | Owner-occupied | Renter-occupied |
| Less than $5,000 | 235 (2.5%) | 139 (3.8%) |
| $5,000 to $9,999 | 74 (0.8%) | 10 (0.3%) |
| $10,000 to $14,999 | 248 (2.7%) | 275 (7.6%) |
| $15,000 to $19,999 | 213 (2.3%) | 194 (5.4%) |
| $20,000 to $24,999 | 86 (0.9%) | 281 (7.8%) |
| $25,000 to $34,999 | 447 (4.8%) | 319 (8.8%) |
| $35,000 to $49,999 | 817 (8.8%) | 645 (17.8%) |
| $50,000 to $74,999 | 1,248 (13.5%) | 797 (22.1%) |
| $75,000 to $99,999 | 1,299 (14.1%) | 449 (12.4%) |
| $100,000 to $149,999 | 2,380 (25.8%) | 281 (7.8%) |
| $150,000 or more | 2,187 (23.7%) | 225 (6.2%) |
| Total | 9,234 (100.0%) | 3,615 (100.0%) |
Monthly Housing Cost Tiers in La Porte
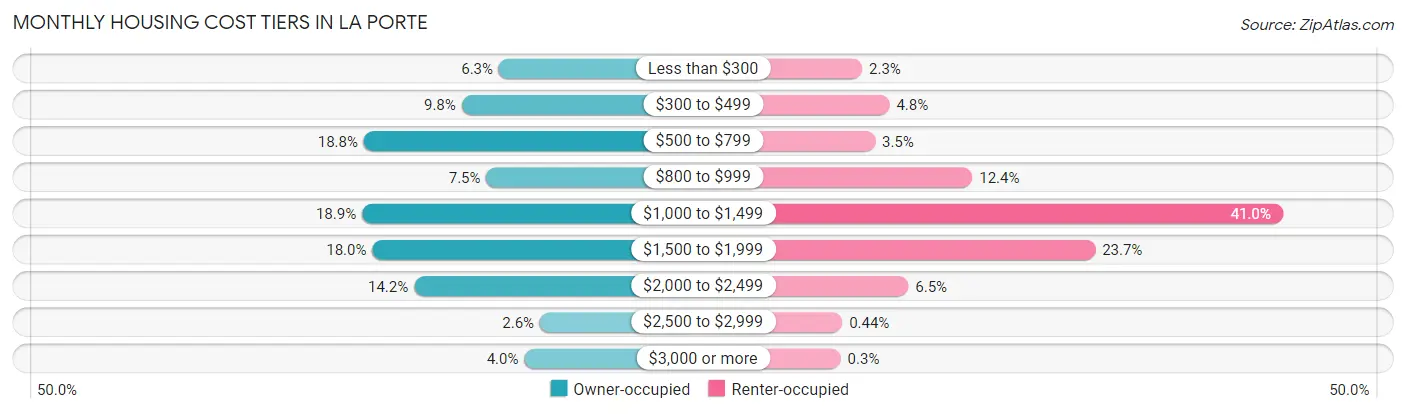
| Monthly Cost | Owner-occupied | Renter-occupied |
| Less than $300 | 585 (6.3%) | 82 (2.3%) |
| $300 to $499 | 902 (9.8%) | 173 (4.8%) |
| $500 to $799 | 1,733 (18.8%) | 125 (3.5%) |
| $800 to $999 | 692 (7.5%) | 449 (12.4%) |
| $1,000 to $1,499 | 1,749 (18.9%) | 1,482 (41.0%) |
| $1,500 to $1,999 | 1,661 (18.0%) | 858 (23.7%) |
| $2,000 to $2,499 | 1,307 (14.1%) | 236 (6.5%) |
| $2,500 to $2,999 | 236 (2.6%) | 16 (0.4%) |
| $3,000 or more | 369 (4.0%) | 11 (0.3%) |
| Total | 9,234 (100.0%) | 3,615 (100.0%) |
Physical Housing Characteristics in La Porte
Housing Structures in La Porte
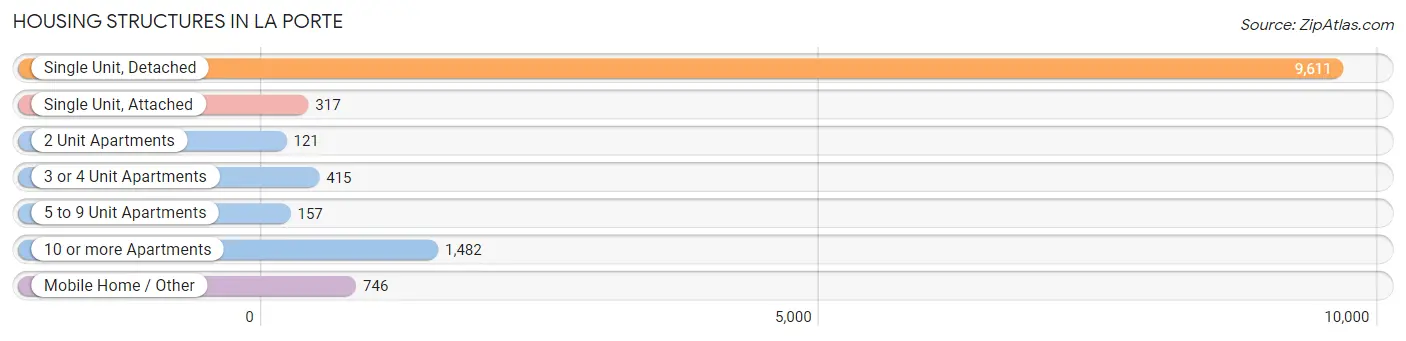
| Structure Type | # Housing Units | % Housing Units |
| Single Unit, Detached | 9,611 | 74.8% |
| Single Unit, Attached | 317 | 2.5% |
| 2 Unit Apartments | 121 | 0.9% |
| 3 or 4 Unit Apartments | 415 | 3.2% |
| 5 to 9 Unit Apartments | 157 | 1.2% |
| 10 or more Apartments | 1,482 | 11.5% |
| Mobile Home / Other | 746 | 5.8% |
| Total | 12,849 | 100.0% |
Housing Structures by Occupancy in La Porte
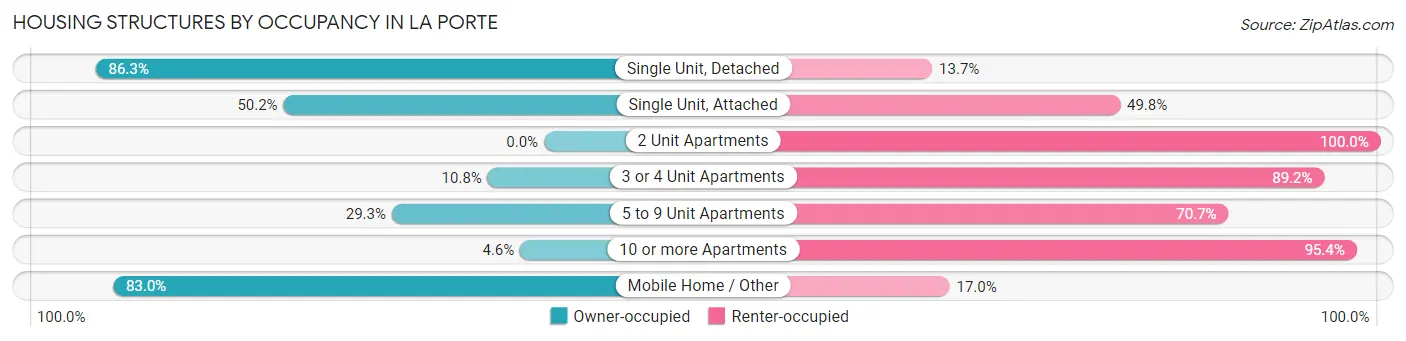
| Structure Type | Owner-occupied | Renter-occupied |
| Single Unit, Detached | 8,297 (86.3%) | 1,314 (13.7%) |
| Single Unit, Attached | 159 (50.2%) | 158 (49.8%) |
| 2 Unit Apartments | 0 (0.0%) | 121 (100.0%) |
| 3 or 4 Unit Apartments | 45 (10.8%) | 370 (89.2%) |
| 5 to 9 Unit Apartments | 46 (29.3%) | 111 (70.7%) |
| 10 or more Apartments | 68 (4.6%) | 1,414 (95.4%) |
| Mobile Home / Other | 619 (83.0%) | 127 (17.0%) |
| Total | 9,234 (71.9%) | 3,615 (28.1%) |
Housing Structures by Number of Rooms in La Porte
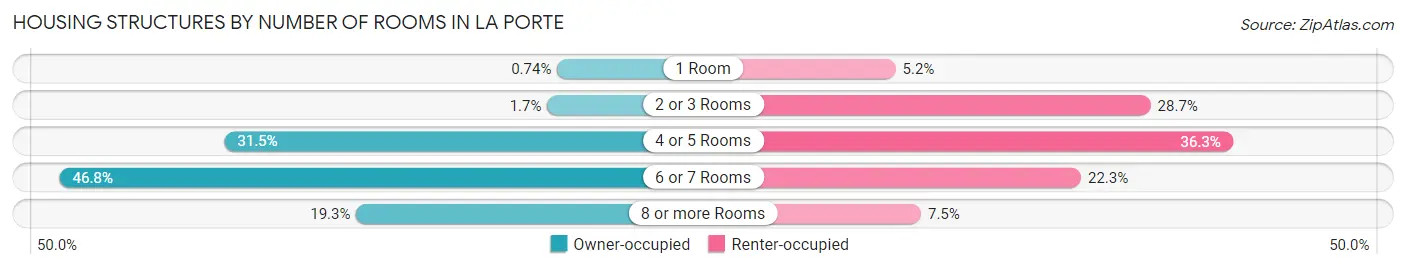
| Number of Rooms | Owner-occupied | Renter-occupied |
| 1 Room | 68 (0.7%) | 186 (5.1%) |
| 2 or 3 Rooms | 153 (1.7%) | 1,039 (28.7%) |
| 4 or 5 Rooms | 2,911 (31.5%) | 1,313 (36.3%) |
| 6 or 7 Rooms | 4,318 (46.8%) | 806 (22.3%) |
| 8 or more Rooms | 1,784 (19.3%) | 271 (7.5%) |
| Total | 9,234 (100.0%) | 3,615 (100.0%) |
Housing Structure by Heating Type in La Porte
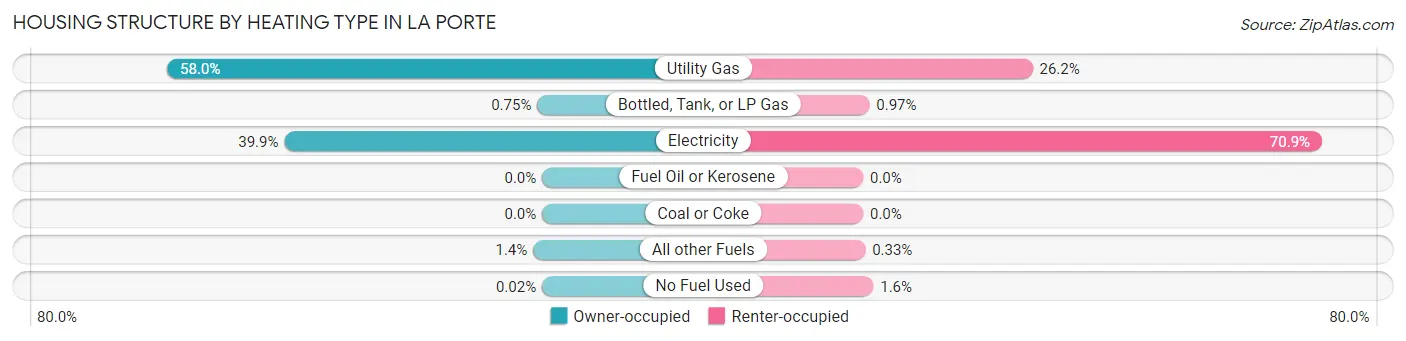
| Heating Type | Owner-occupied | Renter-occupied |
| Utility Gas | 5,354 (58.0%) | 947 (26.2%) |
| Bottled, Tank, or LP Gas | 69 (0.7%) | 35 (1.0%) |
| Electricity | 3,681 (39.9%) | 2,564 (70.9%) |
| Fuel Oil or Kerosene | 0 (0.0%) | 0 (0.0%) |
| Coal or Coke | 0 (0.0%) | 0 (0.0%) |
| All other Fuels | 128 (1.4%) | 12 (0.3%) |
| No Fuel Used | 2 (0.0%) | 57 (1.6%) |
| Total | 9,234 (100.0%) | 3,615 (100.0%) |
Household Vehicle Usage in La Porte
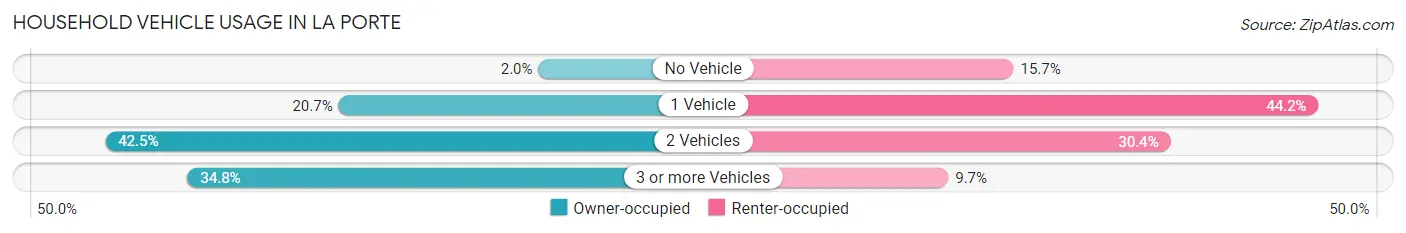
| Vehicles per Household | Owner-occupied | Renter-occupied |
| No Vehicle | 188 (2.0%) | 569 (15.7%) |
| 1 Vehicle | 1,911 (20.7%) | 1,598 (44.2%) |
| 2 Vehicles | 3,922 (42.5%) | 1,099 (30.4%) |
| 3 or more Vehicles | 3,213 (34.8%) | 349 (9.7%) |
| Total | 9,234 (100.0%) | 3,615 (100.0%) |
Real Estate & Mortgages in La Porte
Real Estate and Mortgage Overview in La Porte
| Characteristic | Without Mortgage | With Mortgage |
| Housing Units | 4,273 | 4,961 |
| Median Property Value | $178,800 | $209,300 |
| Median Household Income | $74,803 | $1,373 |
| Monthly Housing Costs | $619 | $249 |
| Real Estate Taxes | $2,805 | $194 |
Property Value by Mortgage Status in La Porte
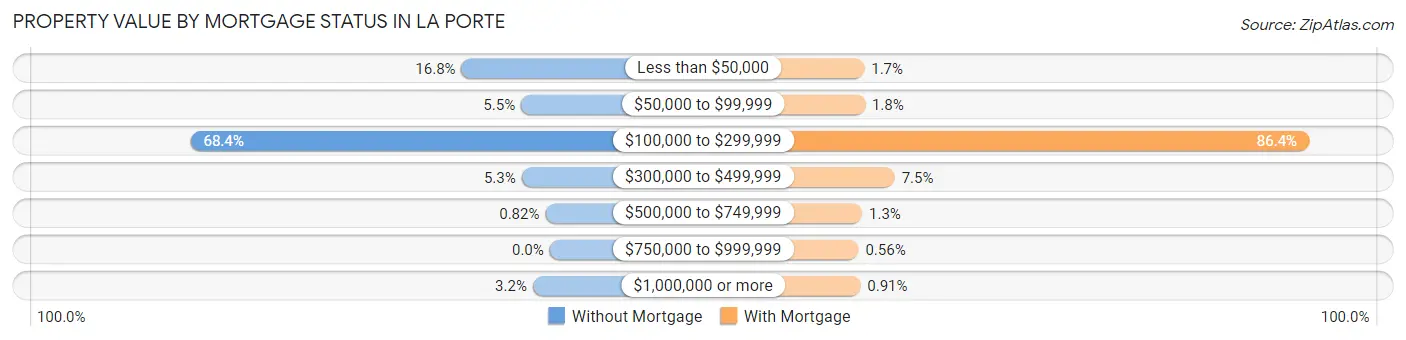
| Property Value | Without Mortgage | With Mortgage |
| Less than $50,000 | 718 (16.8%) | 83 (1.7%) |
| $50,000 to $99,999 | 233 (5.4%) | 89 (1.8%) |
| $100,000 to $299,999 | 2,922 (68.4%) | 4,284 (86.4%) |
| $300,000 to $499,999 | 228 (5.3%) | 370 (7.5%) |
| $500,000 to $749,999 | 35 (0.8%) | 62 (1.3%) |
| $750,000 to $999,999 | 0 (0.0%) | 28 (0.6%) |
| $1,000,000 or more | 137 (3.2%) | 45 (0.9%) |
| Total | 4,273 (100.0%) | 4,961 (100.0%) |
Household Income by Mortgage Status in La Porte
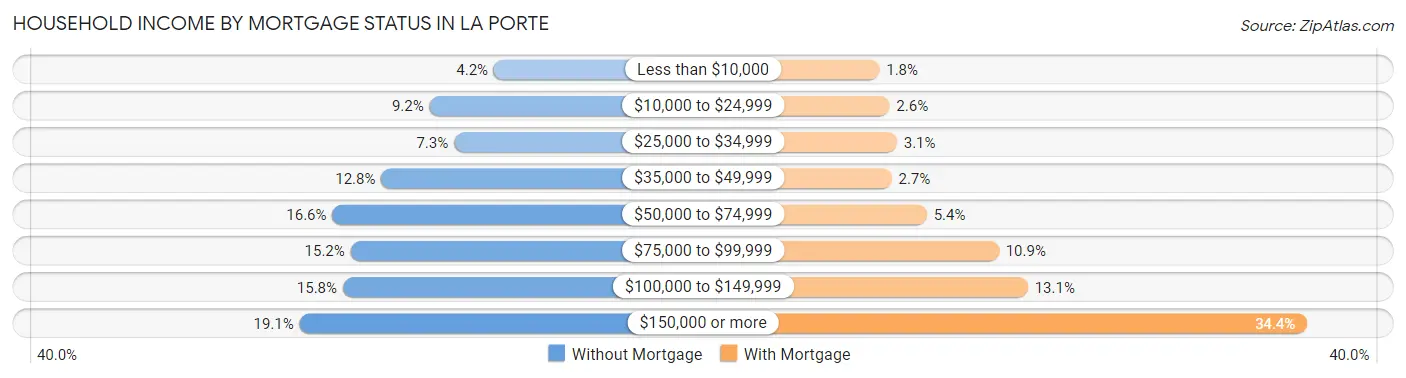
| Household Income | Without Mortgage | With Mortgage |
| Less than $10,000 | 181 (4.2%) | 90 (1.8%) |
| $10,000 to $24,999 | 391 (9.1%) | 128 (2.6%) |
| $25,000 to $34,999 | 311 (7.3%) | 156 (3.1%) |
| $35,000 to $49,999 | 548 (12.8%) | 136 (2.7%) |
| $50,000 to $74,999 | 707 (16.6%) | 269 (5.4%) |
| $75,000 to $99,999 | 648 (15.2%) | 541 (10.9%) |
| $100,000 to $149,999 | 673 (15.8%) | 651 (13.1%) |
| $150,000 or more | 814 (19.1%) | 1,707 (34.4%) |
| Total | 4,273 (100.0%) | 4,961 (100.0%) |
Property Value to Household Income Ratio in La Porte
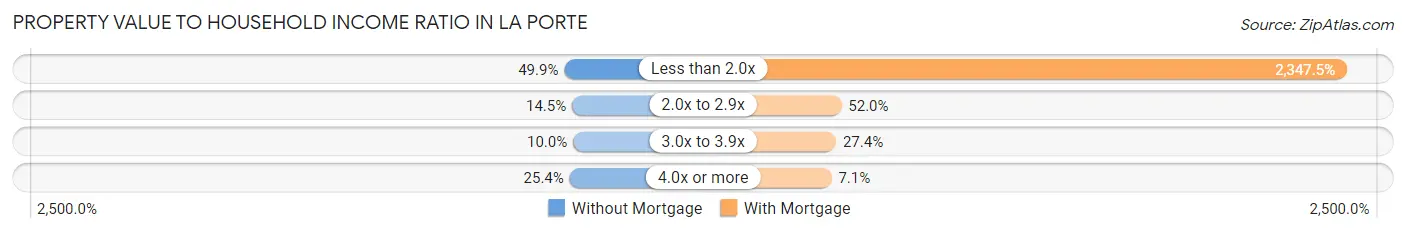
| Value-to-Income Ratio | Without Mortgage | With Mortgage |
| Less than 2.0x | 2,132 (49.9%) | 116,458 (2,347.5%) |
| 2.0x to 2.9x | 619 (14.5%) | 2,581 (52.0%) |
| 3.0x to 3.9x | 427 (10.0%) | 1,361 (27.4%) |
| 4.0x or more | 1,085 (25.4%) | 351 (7.1%) |
| Total | 4,273 (100.0%) | 4,961 (100.0%) |
Real Estate Taxes by Mortgage Status in La Porte
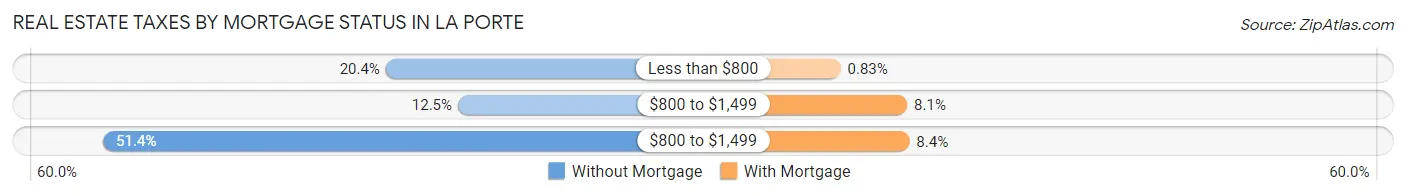
| Property Taxes | Without Mortgage | With Mortgage |
| Less than $800 | 873 (20.4%) | 41 (0.8%) |
| $800 to $1,499 | 535 (12.5%) | 403 (8.1%) |
| $800 to $1,499 | 2,196 (51.4%) | 415 (8.4%) |
| Total | 4,273 (100.0%) | 4,961 (100.0%) |
Health & Disability in La Porte
Health Insurance Coverage by Age in La Porte
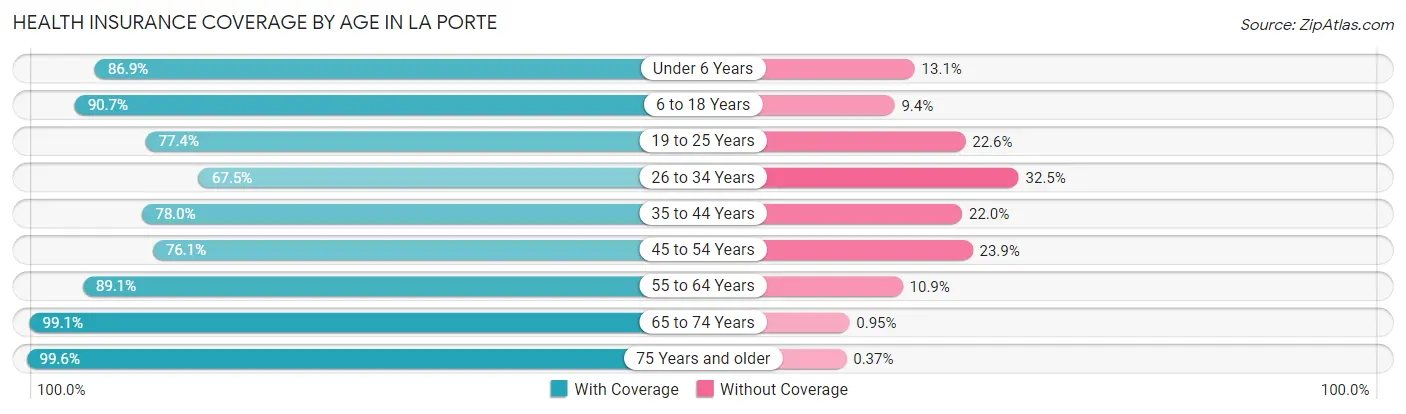
| Age Bracket | With Coverage | Without Coverage |
| Under 6 Years | 2,662 (86.9%) | 402 (13.1%) |
| 6 to 18 Years | 5,778 (90.6%) | 596 (9.3%) |
| 19 to 25 Years | 2,429 (77.4%) | 708 (22.6%) |
| 26 to 34 Years | 3,191 (67.5%) | 1,537 (32.5%) |
| 35 to 44 Years | 3,688 (78.0%) | 1,038 (22.0%) |
| 45 to 54 Years | 2,989 (76.1%) | 939 (23.9%) |
| 55 to 64 Years | 4,435 (89.1%) | 541 (10.9%) |
| 65 to 74 Years | 2,929 (99.1%) | 28 (0.9%) |
| 75 Years and older | 1,866 (99.6%) | 7 (0.4%) |
| Total | 29,967 (83.8%) | 5,796 (16.2%) |
Health Insurance Coverage by Citizenship Status in La Porte

| Citizenship Status | With Coverage | Without Coverage |
| Native Born | 2,662 (86.9%) | 402 (13.1%) |
| Foreign Born, Citizen | 5,778 (90.6%) | 596 (9.3%) |
| Foreign Born, not a Citizen | 2,429 (77.4%) | 708 (22.6%) |
Health Insurance Coverage by Household Income in La Porte
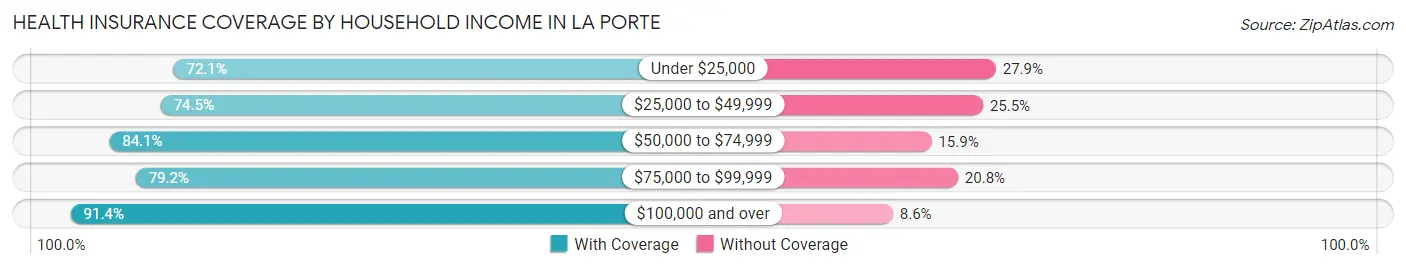
| Household Income | With Coverage | Without Coverage |
| Under $25,000 | 2,409 (72.1%) | 933 (27.9%) |
| $25,000 to $49,999 | 4,522 (74.5%) | 1,549 (25.5%) |
| $50,000 to $74,999 | 3,588 (84.1%) | 677 (15.9%) |
| $75,000 to $99,999 | 4,477 (79.2%) | 1,177 (20.8%) |
| $100,000 and over | 14,938 (91.4%) | 1,411 (8.6%) |
Public vs Private Health Insurance Coverage by Age in La Porte
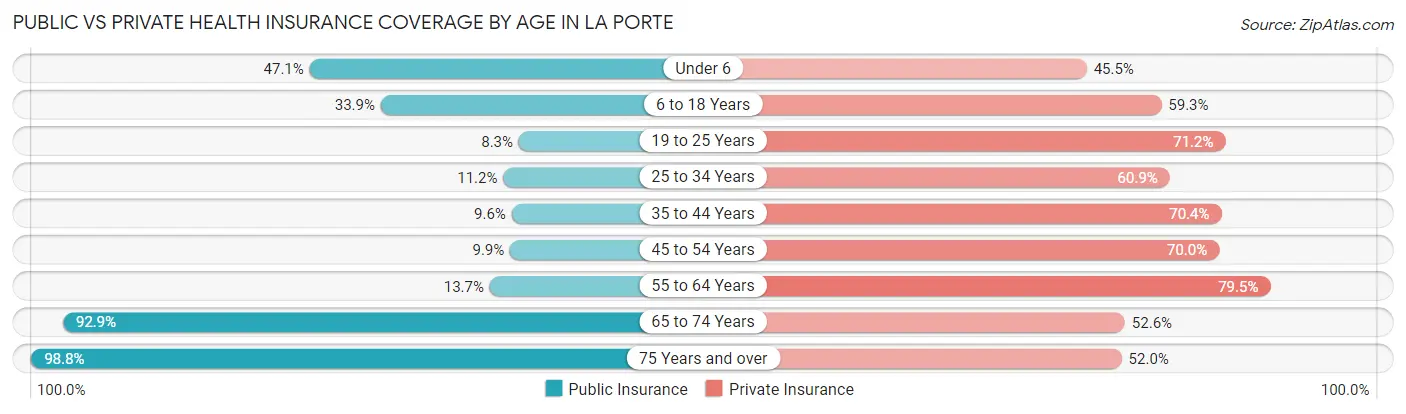
| Age Bracket | Public Insurance | Private Insurance |
| Under 6 | 1,443 (47.1%) | 1,393 (45.5%) |
| 6 to 18 Years | 2,160 (33.9%) | 3,781 (59.3%) |
| 19 to 25 Years | 259 (8.3%) | 2,233 (71.2%) |
| 25 to 34 Years | 527 (11.2%) | 2,877 (60.9%) |
| 35 to 44 Years | 453 (9.6%) | 3,329 (70.4%) |
| 45 to 54 Years | 388 (9.9%) | 2,750 (70.0%) |
| 55 to 64 Years | 679 (13.7%) | 3,957 (79.5%) |
| 65 to 74 Years | 2,747 (92.9%) | 1,554 (52.5%) |
| 75 Years and over | 1,850 (98.8%) | 973 (51.9%) |
| Total | 10,506 (29.4%) | 22,847 (63.9%) |
Disability Status by Sex by Age in La Porte
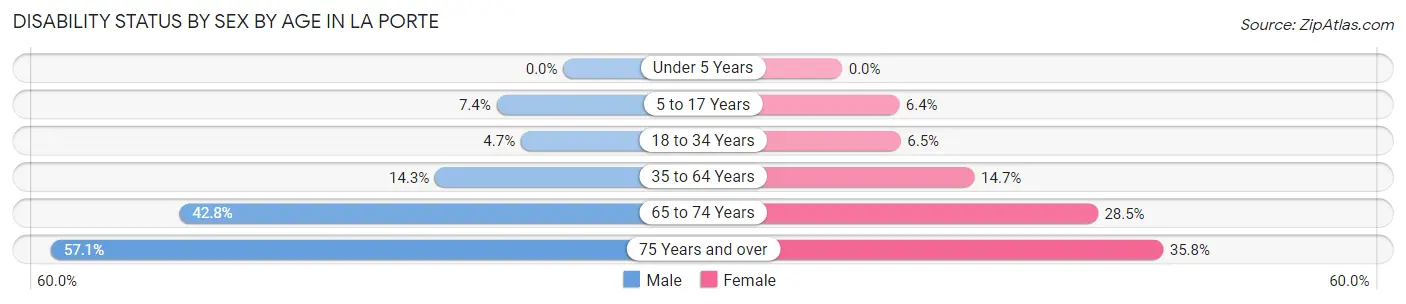
| Age Bracket | Male | Female |
| Under 5 Years | 0 (0.0%) | 0 (0.0%) |
| 5 to 17 Years | 274 (7.4%) | 186 (6.4%) |
| 18 to 34 Years | 199 (4.7%) | 255 (6.5%) |
| 35 to 64 Years | 910 (14.3%) | 1,070 (14.7%) |
| 65 to 74 Years | 572 (42.7%) | 461 (28.5%) |
| 75 Years and over | 432 (57.1%) | 399 (35.7%) |
Disability Class by Sex by Age in La Porte
Disability Class: Hearing Difficulty
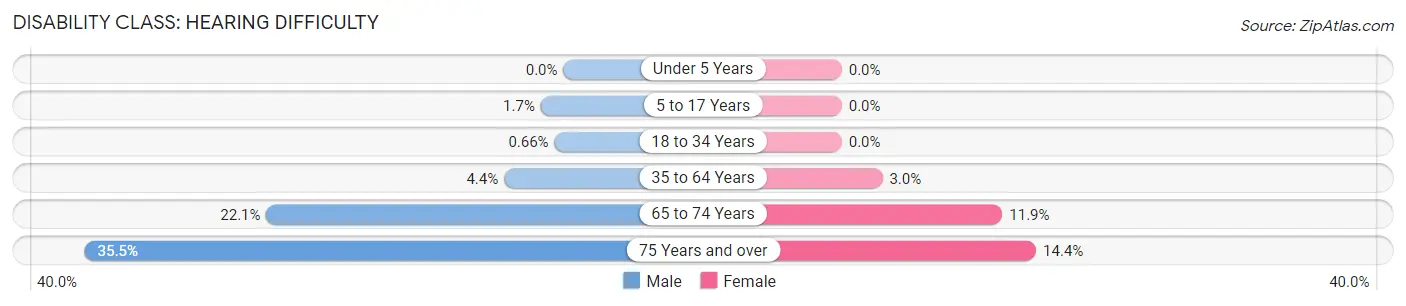
| Age Bracket | Male | Female |
| Under 5 Years | 0 (0.0%) | 0 (0.0%) |
| 5 to 17 Years | 62 (1.7%) | 0 (0.0%) |
| 18 to 34 Years | 28 (0.7%) | 0 (0.0%) |
| 35 to 64 Years | 280 (4.4%) | 219 (3.0%) |
| 65 to 74 Years | 295 (22.1%) | 193 (11.9%) |
| 75 Years and over | 269 (35.5%) | 161 (14.4%) |
Disability Class: Vision Difficulty
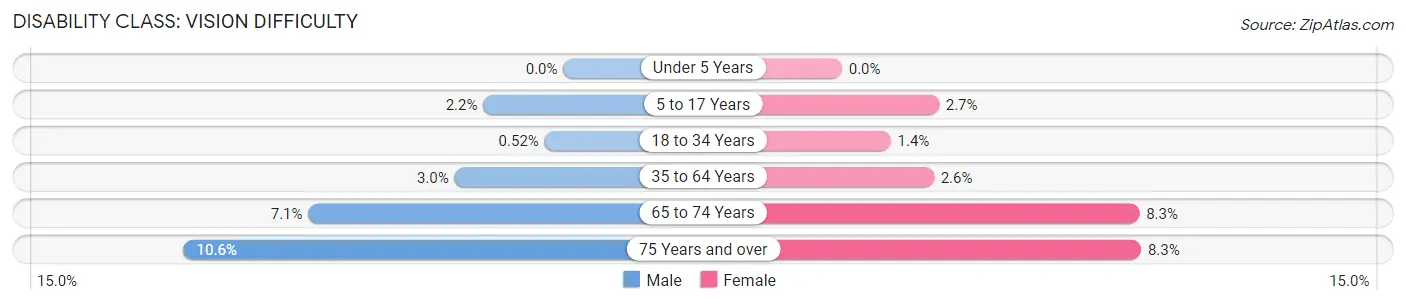
| Age Bracket | Male | Female |
| Under 5 Years | 0 (0.0%) | 0 (0.0%) |
| 5 to 17 Years | 82 (2.2%) | 79 (2.7%) |
| 18 to 34 Years | 22 (0.5%) | 53 (1.4%) |
| 35 to 64 Years | 193 (3.0%) | 186 (2.6%) |
| 65 to 74 Years | 95 (7.1%) | 134 (8.3%) |
| 75 Years and over | 80 (10.6%) | 93 (8.3%) |
Disability Class: Cognitive Difficulty
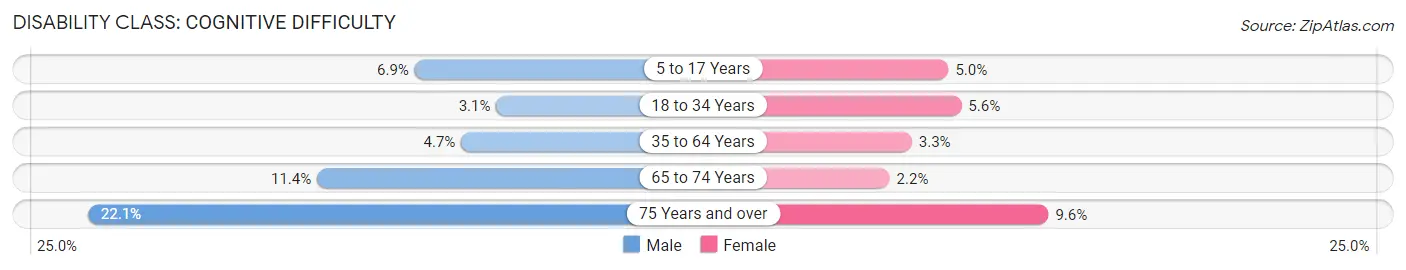
| Age Bracket | Male | Female |
| 5 to 17 Years | 254 (6.9%) | 145 (5.0%) |
| 18 to 34 Years | 131 (3.1%) | 217 (5.6%) |
| 35 to 64 Years | 302 (4.7%) | 236 (3.3%) |
| 65 to 74 Years | 153 (11.4%) | 36 (2.2%) |
| 75 Years and over | 167 (22.1%) | 107 (9.6%) |
Disability Class: Ambulatory Difficulty
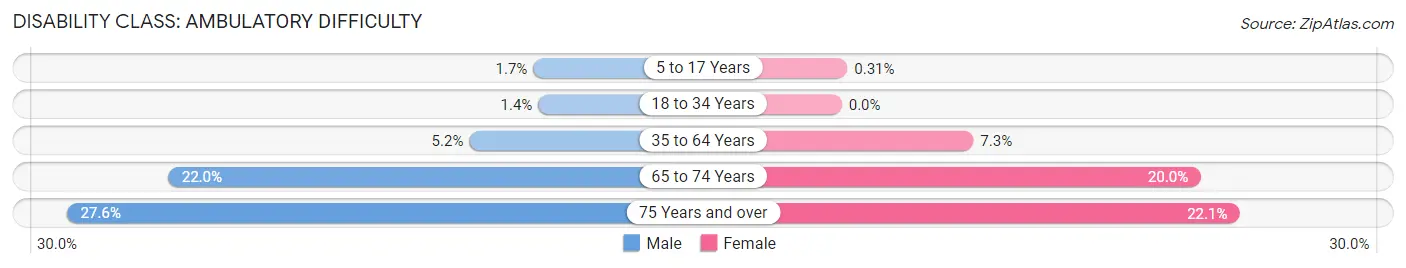
| Age Bracket | Male | Female |
| 5 to 17 Years | 62 (1.7%) | 9 (0.3%) |
| 18 to 34 Years | 59 (1.4%) | 0 (0.0%) |
| 35 to 64 Years | 334 (5.2%) | 532 (7.3%) |
| 65 to 74 Years | 294 (22.0%) | 323 (20.0%) |
| 75 Years and over | 209 (27.6%) | 247 (22.1%) |
Disability Class: Self-Care Difficulty

| Age Bracket | Male | Female |
| 5 to 17 Years | 62 (1.7%) | 0 (0.0%) |
| 18 to 34 Years | 59 (1.4%) | 0 (0.0%) |
| 35 to 64 Years | 55 (0.9%) | 135 (1.9%) |
| 65 to 74 Years | 48 (3.6%) | 46 (2.8%) |
| 75 Years and over | 83 (11.0%) | 56 (5.0%) |
Technology Access in La Porte
Computing Device Access in La Porte
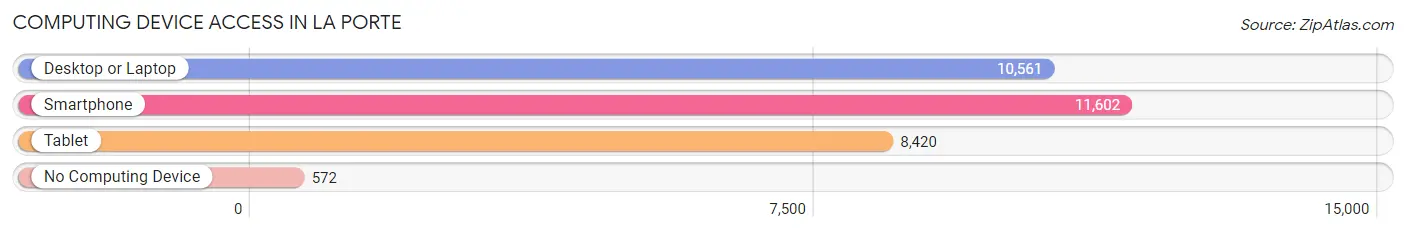
| Device Type | # Households | % Households |
| Desktop or Laptop | 10,561 | 82.2% |
| Smartphone | 11,602 | 90.3% |
| Tablet | 8,420 | 65.5% |
| No Computing Device | 572 | 4.4% |
| Total | 12,849 | 100.0% |
Internet Access in La Porte
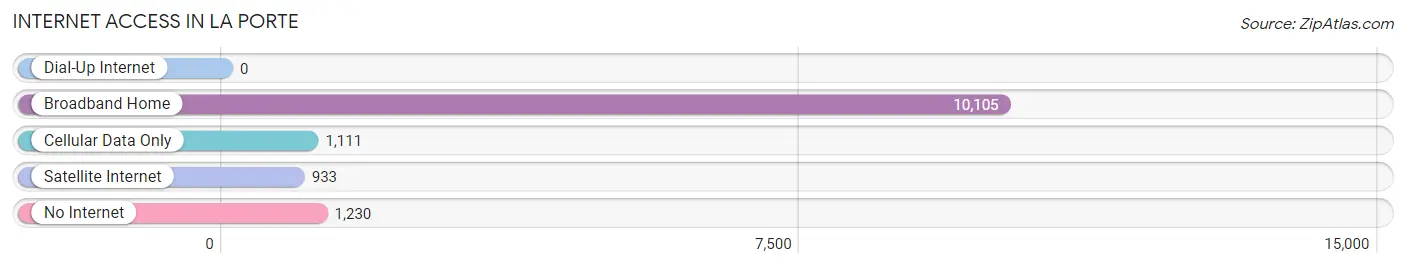
| Internet Type | # Households | % Households |
| Dial-Up Internet | 0 | 0.0% |
| Broadband Home | 10,105 | 78.6% |
| Cellular Data Only | 1,111 | 8.6% |
| Satellite Internet | 933 | 7.3% |
| No Internet | 1,230 | 9.6% |
| Total | 12,849 | 100.0% |
La Porte Summary
La Porte, Texas is a city located in Harris County, Texas, United States. It is part of the Houston–The Woodlands–Sugar Land metropolitan area. The city is located on the north side of Galveston Bay, just east of the Houston Ship Channel. The population was 33,800 at the 2010 census.
History
La Porte was founded in 1892 by the La Porte Land Company. The city was named after the French phrase for "the door," referring to the narrow entrance to the bay. The city was incorporated in 1897.
In the early 1900s, La Porte was a popular tourist destination, with many visitors coming to enjoy the beaches and the nearby San Jacinto Battleground. The city was also home to a number of resorts, including the La Porte Hotel, which was built in 1902.
In the 1920s, La Porte began to experience a period of growth and development. The city was home to a number of industries, including a shipbuilding company, a paper mill, and a chemical plant. The city also became a popular destination for oil workers, who came to work in the nearby oil fields.
In the 1950s, La Porte experienced a period of decline. The city's population decreased, and many of the businesses and industries that had been located in the city closed.
In the 1970s, La Porte began to experience a period of revitalization. The city was home to a number of new businesses, including a shopping mall and a movie theater. The city also began to attract new residents, and the population began to increase.
Geography
La Porte is located at 29°41'N 95°02'W (29.68, -95.03). The city is situated on the north side of Galveston Bay, just east of the Houston Ship Channel. The city is bordered by the cities of Pasadena to the west, Baytown to the east, and Deer Park to the south.
The city has a total area of 16.2 square miles, of which 15.7 square miles is land and 0.5 square miles is water.
Economy
La Porte is home to a number of businesses and industries. The city is home to a number of chemical plants, including the La Porte Chemical Plant, which is owned by the Dow Chemical Company. The city is also home to a number of oil and gas companies, including the La Porte Refinery, which is owned by Valero Energy Corporation.
The city is also home to a number of retail businesses, including a shopping mall and a number of restaurants. The city is also home to a number of hotels and motels.
Demographics
As of the 2010 census, there were 33,800 people, 11,945 households, and 8,845 families residing in the city. The population density was 2,097.3 people per square mile. The racial makeup of the city was 73.3% White, 11.3% African American, 0.7% Native American, 1.2% Asian, 0.1% Pacific Islander, 10.3% from other races, and 3.2% from two or more races. Hispanic or Latino of any race were 24.2% of the population.
The median income for a household in the city was $50,945, and the median income for a family was $60,945. The per capita income for the city was $23,945. About 8.3% of families and 10.7% of the population were below the poverty line, including 15.2% of those under age 18 and 8.2% of those age 65 or over.
Common Questions
What is Per Capita Income in La Porte?
Per Capita income in La Porte is $42,835.
What is the Median Family Income in La Porte?
Median Family Income in La Porte is $91,170.
What is the Median Household income in La Porte?
Median Household Income in La Porte is $79,193.
What is Income or Wage Gap in La Porte?
Income or Wage Gap in La Porte is 32.5%.
Women in La Porte earn 67.5 cents for every dollar earned by a man.
What is Inequality or Gini Index in La Porte?
Inequality or Gini Index in La Porte is 0.51.
What is the Total Population of La Porte?
Total Population of La Porte is 35,782.
What is the Total Male Population of La Porte?
Total Male Population of La Porte is 17,748.
What is the Total Female Population of La Porte?
Total Female Population of La Porte is 18,034.
What is the Ratio of Males per 100 Females in La Porte?
There are 98.41 Males per 100 Females in La Porte.
What is the Ratio of Females per 100 Males in La Porte?
There are 101.61 Females per 100 Males in La Porte.
What is the Median Population Age in La Porte?
Median Population Age in La Porte is 35.9 Years.
What is the Average Family Size in La Porte
Average Family Size in La Porte is 3.3 People.
What is the Average Household Size in La Porte
Average Household Size in La Porte is 2.8 People.
How Large is the Labor Force in La Porte?
There are 17,571 People in the Labor Forcein in La Porte.
What is the Percentage of People in the Labor Force in La Porte?
63.8% of People are in the Labor Force in La Porte.
What is the Unemployment Rate in La Porte?
Unemployment Rate in La Porte is 5.3%.