Richmond Heights, FL Map & Demographics
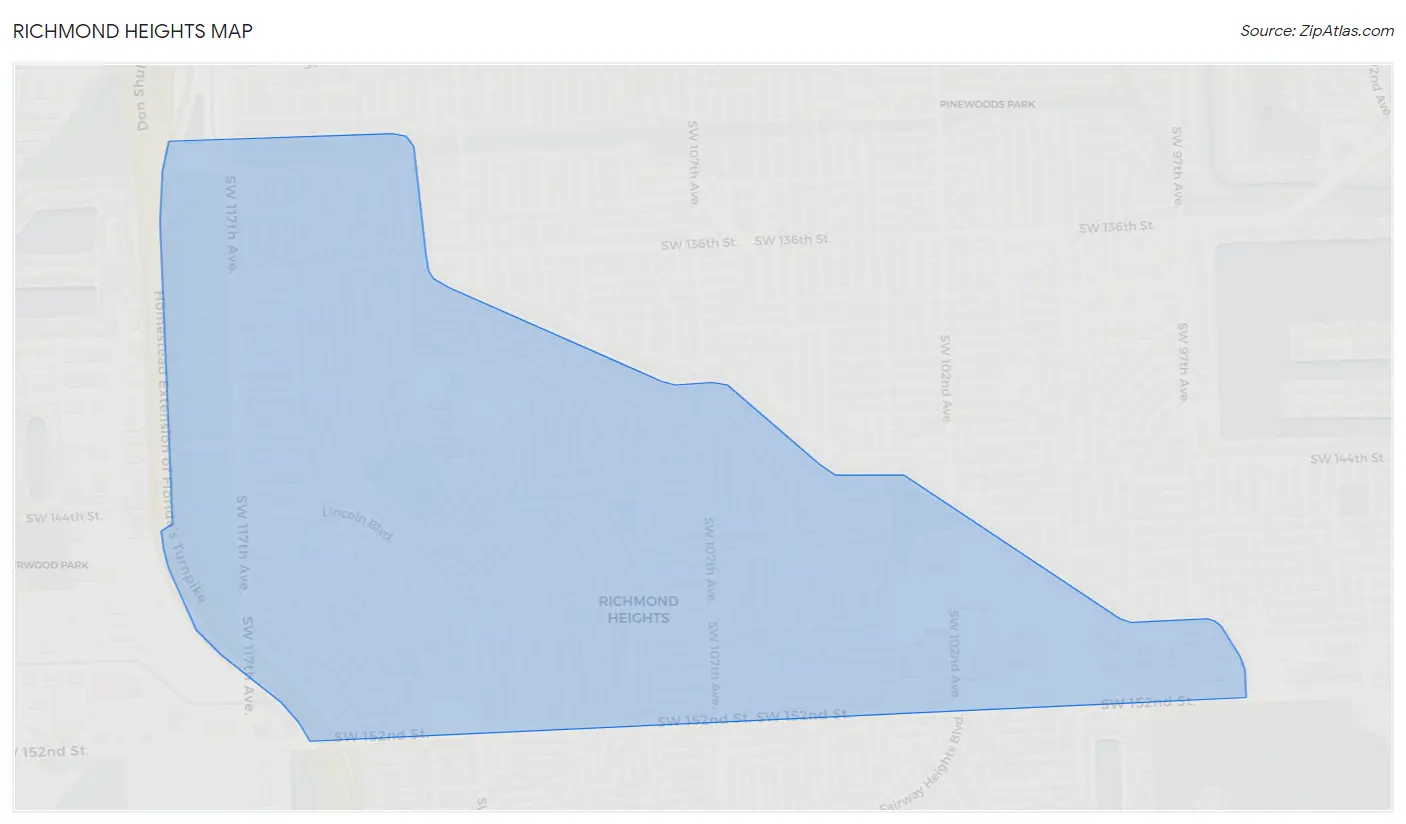
Richmond Heights Map
Richmond Heights Overview
$28,559
PER CAPITA INCOME
$62,009
AVG FAMILY INCOME
$60,365
AVG HOUSEHOLD INCOME
32.7%
WAGE / INCOME GAP [ % ]
67.3¢/ $1
WAGE / INCOME GAP [ $ ]
0.50
INEQUALITY / GINI INDEX
9,863
TOTAL POPULATION
4,448
MALE POPULATION
5,415
FEMALE POPULATION
82.14
MALES / 100 FEMALES
121.74
FEMALES / 100 MALES
39.4
MEDIAN AGE
3.9
AVG FAMILY SIZE
3.5
AVG HOUSEHOLD SIZE
4,764
LABOR FORCE [ PEOPLE ]
58.1%
PERCENT IN LABOR FORCE
5.6%
UNEMPLOYMENT RATE
Income in Richmond Heights
Income Overview in Richmond Heights
Per Capita Income in Richmond Heights is $28,559, while median incomes of families and households are $62,009 and $60,365 respectively.
| Characteristic | Number | Measure |
| Per Capita Income | 9,863 | $28,559 |
| Median Family Income | 2,131 | $62,009 |
| Mean Family Income | 2,131 | $100,527 |
| Median Household Income | 2,766 | $60,365 |
| Mean Household Income | 2,766 | $89,781 |
| Income Deficit | 2,131 | $0 |
| Wage / Income Gap (%) | 9,863 | 32.69% |
| Wage / Income Gap ($) | 9,863 | 67.31¢ per $1 |
| Gini / Inequality Index | 9,863 | 0.50 |
Earnings by Sex in Richmond Heights
Average Earnings in Richmond Heights are $29,747, $38,730 for men and $26,069 for women, a difference of 32.7%.
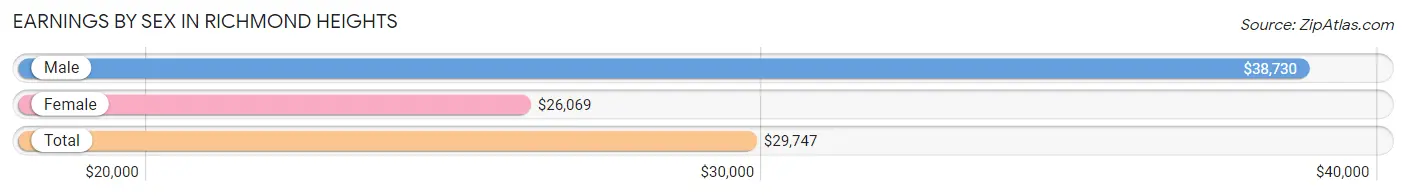
| Sex | Number | Average Earnings |
| Male | 2,134 (43.3%) | $38,730 |
| Female | 2,789 (56.7%) | $26,069 |
| Total | 4,923 (100.0%) | $29,747 |
Earnings by Sex by Income Bracket in Richmond Heights
The most common earnings brackets in Richmond Heights are $22,500 to $24,999 for men (226 | 10.6%) and $20,000 to $22,499 for women (322 | 11.6%).
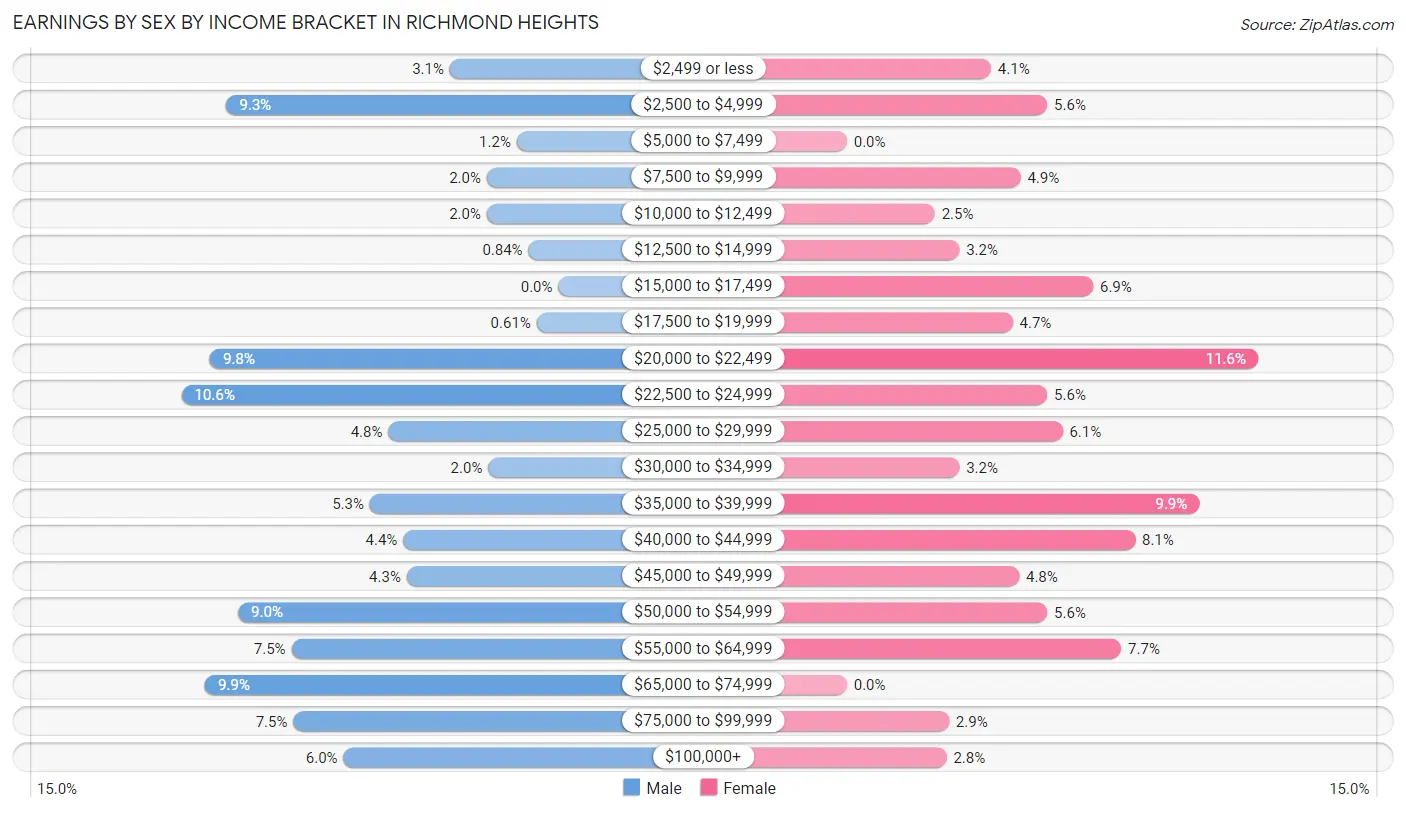
| Income | Male | Female |
| $2,499 or less | 65 (3.0%) | 113 (4.1%) |
| $2,500 to $4,999 | 199 (9.3%) | 157 (5.6%) |
| $5,000 to $7,499 | 25 (1.2%) | 0 (0.0%) |
| $7,500 to $9,999 | 43 (2.0%) | 136 (4.9%) |
| $10,000 to $12,499 | 43 (2.0%) | 69 (2.5%) |
| $12,500 to $14,999 | 18 (0.8%) | 88 (3.2%) |
| $15,000 to $17,499 | 0 (0.0%) | 193 (6.9%) |
| $17,500 to $19,999 | 13 (0.6%) | 130 (4.7%) |
| $20,000 to $22,499 | 209 (9.8%) | 322 (11.6%) |
| $22,500 to $24,999 | 226 (10.6%) | 157 (5.6%) |
| $25,000 to $29,999 | 102 (4.8%) | 169 (6.1%) |
| $30,000 to $34,999 | 42 (2.0%) | 88 (3.2%) |
| $35,000 to $39,999 | 113 (5.3%) | 276 (9.9%) |
| $40,000 to $44,999 | 93 (4.4%) | 226 (8.1%) |
| $45,000 to $49,999 | 91 (4.3%) | 135 (4.8%) |
| $50,000 to $54,999 | 192 (9.0%) | 157 (5.6%) |
| $55,000 to $64,999 | 160 (7.5%) | 215 (7.7%) |
| $65,000 to $74,999 | 212 (9.9%) | 0 (0.0%) |
| $75,000 to $99,999 | 159 (7.4%) | 80 (2.9%) |
| $100,000+ | 129 (6.0%) | 78 (2.8%) |
| Total | 2,134 (100.0%) | 2,789 (100.0%) |
Earnings by Sex by Educational Attainment in Richmond Heights
Average earnings in Richmond Heights are $39,385 for men and $33,274 for women, a difference of 15.5%. Men with an educational attainment of bachelor's degree enjoy the highest average annual earnings of $65,128, while those with high school diploma education earn the least with $30,588. Women with an educational attainment of bachelor's degree earn the most with the average annual earnings of $51,366, while those with less than high school education have the smallest earnings of $21,032.
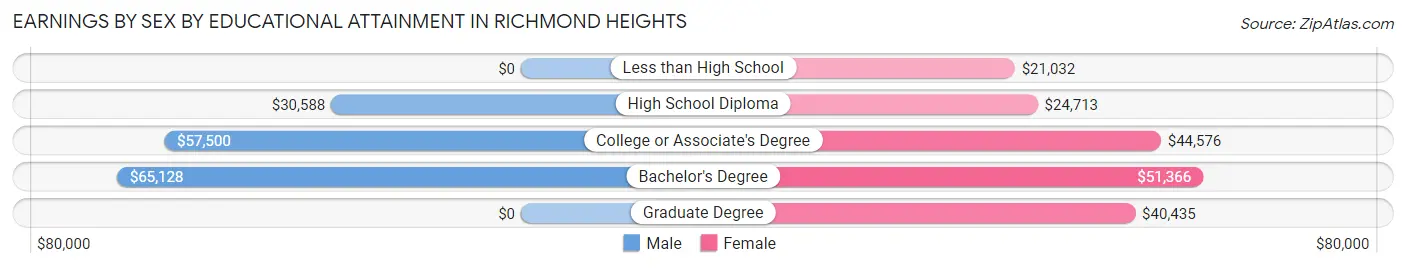
| Educational Attainment | Male Income | Female Income |
| Less than High School | - | - |
| High School Diploma | $30,588 | $24,713 |
| College or Associate's Degree | $57,500 | $44,576 |
| Bachelor's Degree | $65,128 | $51,366 |
| Graduate Degree | - | - |
| Total | $39,385 | $33,274 |
Family Income in Richmond Heights
Family Income Brackets in Richmond Heights
According to the Richmond Heights family income data, there are 714 families falling into the $50,000 to $74,999 income range, which is the most common income bracket and makes up 33.5% of all families. Conversely, the $10,000 to $14,999 income bracket is the least frequent group with only 9 families (0.4%) belonging to this category.
| Income Bracket | # Families | % Families |
| Less than $10,000 | 98 | 4.6% |
| $10,000 to $14,999 | 9 | 0.4% |
| $15,000 to $24,999 | 102 | 4.8% |
| $25,000 to $34,999 | 160 | 7.5% |
| $35,000 to $49,999 | 222 | 10.4% |
| $50,000 to $74,999 | 714 | 33.5% |
| $75,000 to $99,999 | 283 | 13.3% |
| $100,000 to $149,999 | 307 | 14.4% |
| $150,000 to $199,999 | 98 | 4.6% |
| $200,000+ | 139 | 6.5% |
Family Income by Famaliy Size in Richmond Heights
3-person families (539 | 25.3%) account for the highest median family income in Richmond Heights with $78,309 per family, while 3-person families (539 | 25.3%) have the highest median income of $26,103 per family member.
| Income Bracket | # Families | Median Income |
| 2-Person Families | 531 (24.9%) | $50,609 |
| 3-Person Families | 539 (25.3%) | $78,309 |
| 4-Person Families | 608 (28.5%) | $62,874 |
| 5-Person Families | 207 (9.7%) | $0 |
| 6-Person Families | 157 (7.4%) | $52,423 |
| 7+ Person Families | 89 (4.2%) | $0 |
| Total | 2,131 (100.0%) | $62,009 |
Family Income by Number of Earners in Richmond Heights
| Number of Earners | # Families | Median Income |
| No Earners | 265 (12.4%) | $0 |
| 1 Earner | 614 (28.8%) | $52,778 |
| 2 Earners | 737 (34.6%) | $62,899 |
| 3+ Earners | 515 (24.2%) | $113,450 |
| Total | 2,131 (100.0%) | $62,009 |
Household Income in Richmond Heights
Household Income Brackets in Richmond Heights
With 830 households falling in the category, the $50,000 to $74,999 income range is the most frequent in Richmond Heights, accounting for 30.0% of all households. In contrast, only 58 households (2.1%) fall into the $10,000 to $14,999 income bracket, making it the least populous group.
| Income Bracket | # Households | % Households |
| Less than $10,000 | 232 | 8.4% |
| $10,000 to $14,999 | 58 | 2.1% |
| $15,000 to $24,999 | 166 | 6.0% |
| $25,000 to $34,999 | 144 | 5.2% |
| $35,000 to $49,999 | 346 | 12.5% |
| $50,000 to $74,999 | 830 | 30.0% |
| $75,000 to $99,999 | 288 | 10.4% |
| $100,000 to $149,999 | 443 | 16.0% |
| $150,000 to $199,999 | 119 | 4.3% |
| $200,000+ | 144 | 5.2% |
Household Income by Householder Age in Richmond Heights
The median household income in Richmond Heights is $60,365, with the highest median household income of $72,765 found in the 45 to 64 years age bracket for the primary householder. A total of 1,033 households (37.3%) fall into this category.
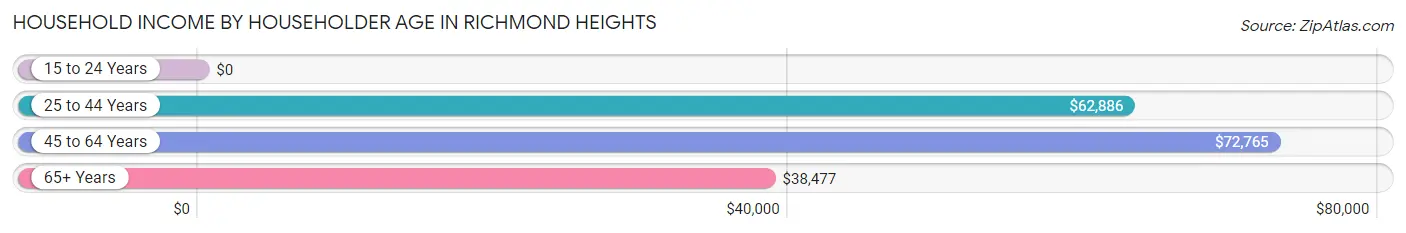
| Income Bracket | # Households | Median Income |
| 15 to 24 Years | 0 (0.0%) | $0 |
| 25 to 44 Years | 817 (29.5%) | $62,886 |
| 45 to 64 Years | 1,033 (37.3%) | $72,765 |
| 65+ Years | 916 (33.1%) | $38,477 |
| Total | 2,766 (100.0%) | $60,365 |
Poverty in Richmond Heights
Income Below Poverty by Sex and Age in Richmond Heights
With 13.9% poverty level for males and 13.0% for females among the residents of Richmond Heights, 65 to 74 year old males and under 5 year old females are the most vulnerable to poverty, with 188 males (48.4%) and 145 females (42.0%) in their respective age groups living below the poverty level.
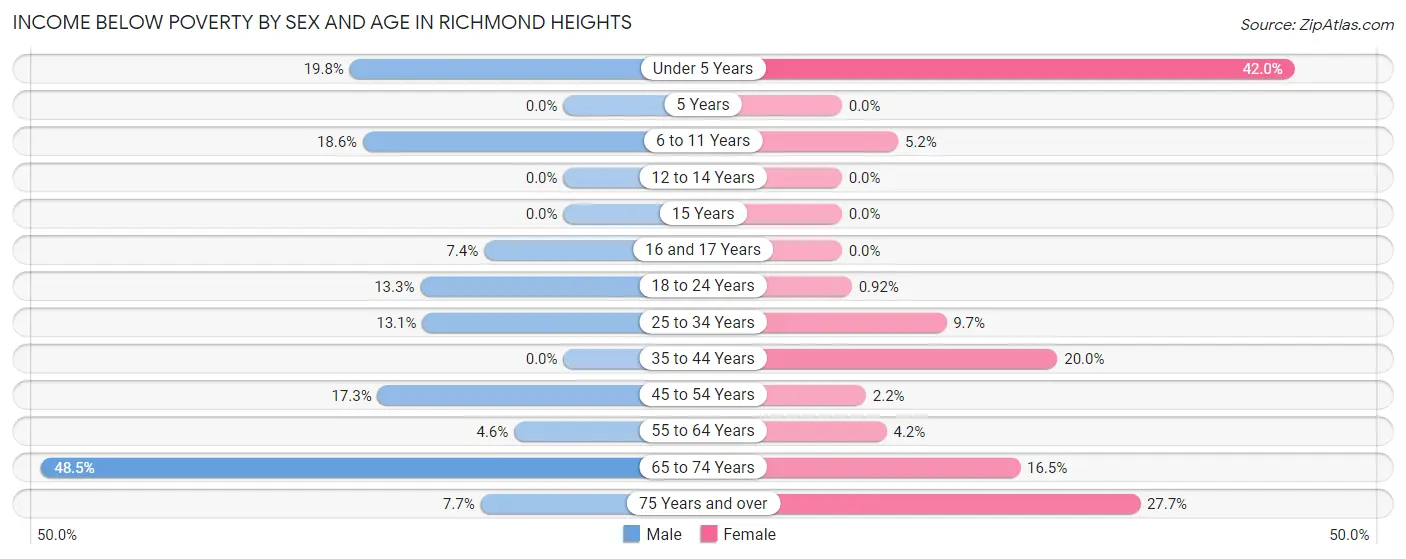
| Age Bracket | Male | Female |
| Under 5 Years | 48 (19.8%) | 145 (42.0%) |
| 5 Years | 0 (0.0%) | 0 (0.0%) |
| 6 to 11 Years | 85 (18.6%) | 13 (5.2%) |
| 12 to 14 Years | 0 (0.0%) | 0 (0.0%) |
| 15 Years | 0 (0.0%) | 0 (0.0%) |
| 16 and 17 Years | 12 (7.4%) | 0 (0.0%) |
| 18 to 24 Years | 47 (13.3%) | 5 (0.9%) |
| 25 to 34 Years | 78 (13.1%) | 71 (9.7%) |
| 35 to 44 Years | 0 (0.0%) | 180 (20.0%) |
| 45 to 54 Years | 114 (17.2%) | 14 (2.2%) |
| 55 to 64 Years | 20 (4.6%) | 24 (4.2%) |
| 65 to 74 Years | 188 (48.4%) | 67 (16.5%) |
| 75 Years and over | 15 (7.7%) | 158 (27.7%) |
| Total | 607 (13.9%) | 677 (13.0%) |
Income Above Poverty by Sex and Age in Richmond Heights
According to the poverty statistics in Richmond Heights, males aged 5 years and females aged 5 years are the age groups that are most secure financially, with 100.0% of males and 100.0% of females in these age groups living above the poverty line.
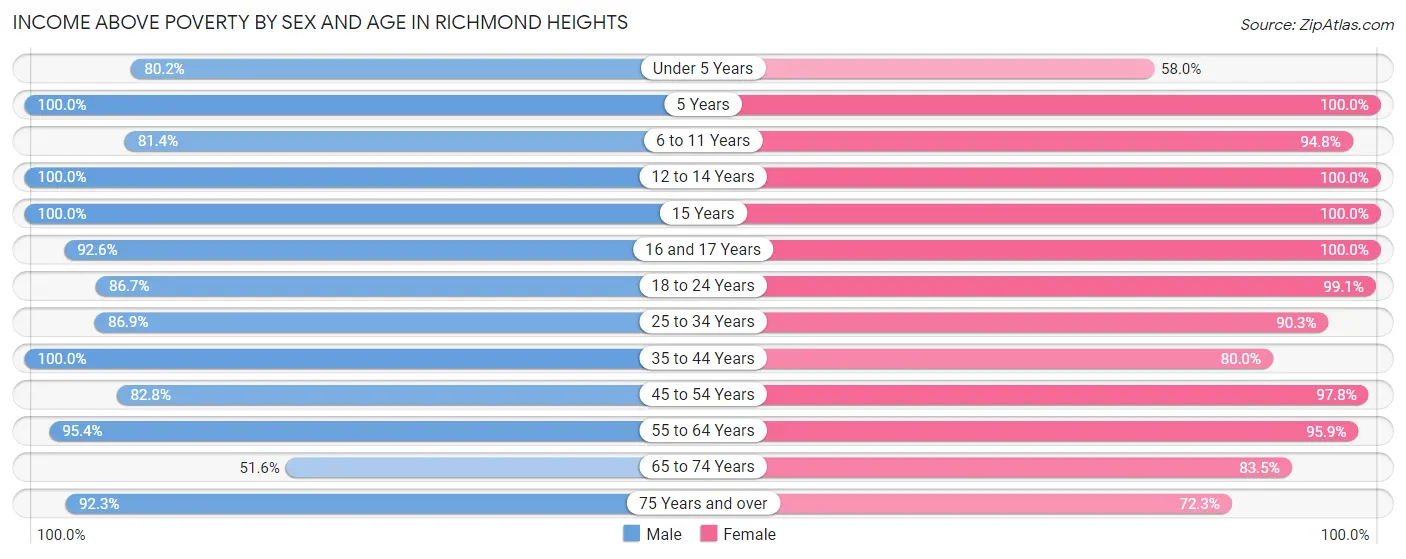
| Age Bracket | Male | Female |
| Under 5 Years | 194 (80.2%) | 200 (58.0%) |
| 5 Years | 28 (100.0%) | 57 (100.0%) |
| 6 to 11 Years | 372 (81.4%) | 236 (94.8%) |
| 12 to 14 Years | 107 (100.0%) | 38 (100.0%) |
| 15 Years | 28 (100.0%) | 31 (100.0%) |
| 16 and 17 Years | 151 (92.6%) | 116 (100.0%) |
| 18 to 24 Years | 307 (86.7%) | 539 (99.1%) |
| 25 to 34 Years | 518 (86.9%) | 662 (90.3%) |
| 35 to 44 Years | 725 (100.0%) | 720 (80.0%) |
| 45 to 54 Years | 547 (82.8%) | 615 (97.8%) |
| 55 to 64 Years | 418 (95.4%) | 554 (95.9%) |
| 65 to 74 Years | 200 (51.5%) | 338 (83.5%) |
| 75 Years and over | 180 (92.3%) | 413 (72.3%) |
| Total | 3,775 (86.2%) | 4,519 (87.0%) |
Income Below Poverty Among Married-Couple Families in Richmond Heights
The poverty statistics for married-couple families in Richmond Heights show that 6.5% or 77 of the total 1,193 families live below the poverty line. Families with 1 or 2 children have the highest poverty rate of 11.0%, comprising of 63 families. On the other hand, families with 3 or 4 children have the lowest poverty rate of 0.0%, which includes 0 families.
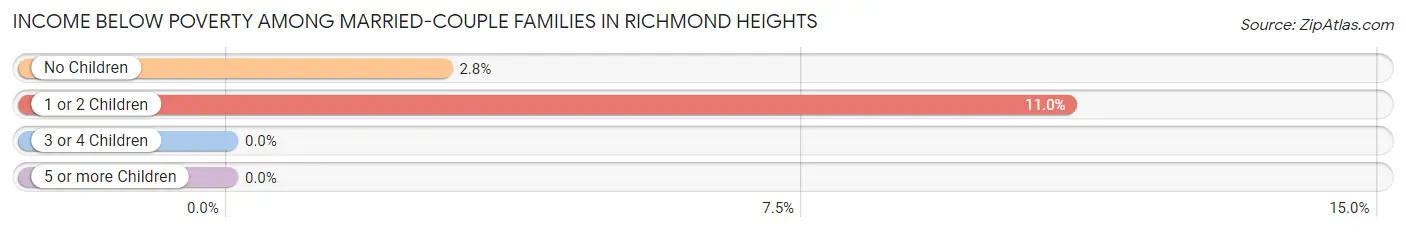
| Children | Above Poverty | Below Poverty |
| No Children | 486 (97.2%) | 14 (2.8%) |
| 1 or 2 Children | 512 (89.0%) | 63 (11.0%) |
| 3 or 4 Children | 118 (100.0%) | 0 (0.0%) |
| 5 or more Children | 0 (0.0%) | 0 (0.0%) |
| Total | 1,116 (93.5%) | 77 (6.5%) |
Income Below Poverty Among Single-Parent Households in Richmond Heights
According to the poverty data in Richmond Heights, 25.3% or 83 single-father households and 9.5% or 58 single-mother households are living below the poverty line. Among single-father households, those with no children have the highest poverty rate, with 83 households (43.7%) experiencing poverty. Likewise, among single-mother households, those with 3 or 4 children have the highest poverty rate, with 38 households (100.0%) falling below the poverty line.
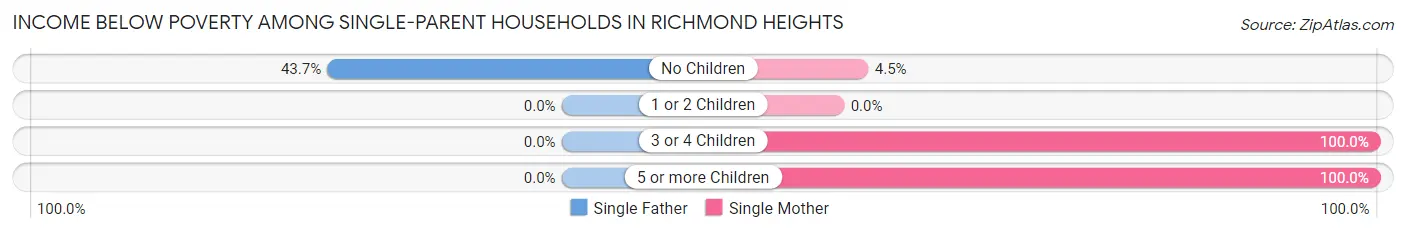
| Children | Single Father | Single Mother |
| No Children | 83 (43.7%) | 12 (4.5%) |
| 1 or 2 Children | 0 (0.0%) | 0 (0.0%) |
| 3 or 4 Children | 0 (0.0%) | 38 (100.0%) |
| 5 or more Children | 0 (0.0%) | 8 (100.0%) |
| Total | 83 (25.3%) | 58 (9.5%) |
Income Below Poverty Among Married-Couple vs Single-Parent Households in Richmond Heights
The poverty data for Richmond Heights shows that 77 of the married-couple family households (6.5%) and 141 of the single-parent households (15.0%) are living below the poverty level. Within the married-couple family households, those with 1 or 2 children have the highest poverty rate, with 63 households (11.0%) falling below the poverty line. Among the single-parent households, those with 3 or 4 children have the highest poverty rate, with 38 household (100.0%) living below poverty.
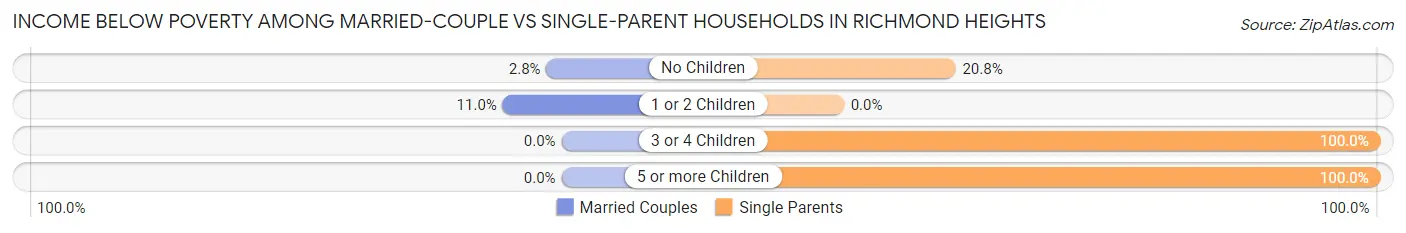
| Children | Married-Couple Families | Single-Parent Households |
| No Children | 14 (2.8%) | 95 (20.8%) |
| 1 or 2 Children | 63 (11.0%) | 0 (0.0%) |
| 3 or 4 Children | 0 (0.0%) | 38 (100.0%) |
| 5 or more Children | 0 (0.0%) | 8 (100.0%) |
| Total | 77 (6.5%) | 141 (15.0%) |
Race in Richmond Heights
The most populous races in Richmond Heights are Black / African American (4,993 | 50.6%), Hispanic or Latino (4,488 | 45.5%), and Two or more Races (2,780 | 28.2%).
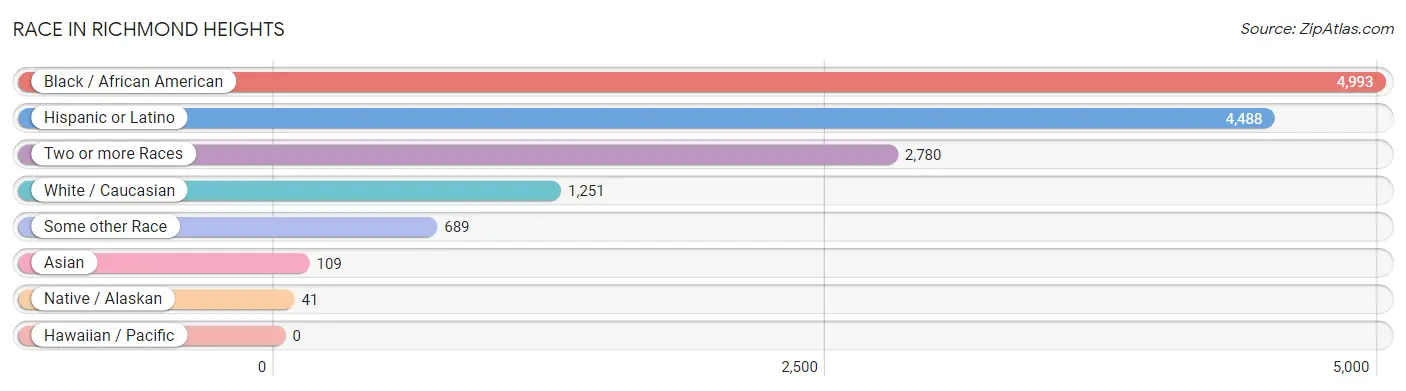
| Race | # Population | % Population |
| Asian | 109 | 1.1% |
| Black / African American | 4,993 | 50.6% |
| Hawaiian / Pacific | 0 | 0.0% |
| Hispanic or Latino | 4,488 | 45.5% |
| Native / Alaskan | 41 | 0.4% |
| White / Caucasian | 1,251 | 12.7% |
| Two or more Races | 2,780 | 28.2% |
| Some other Race | 689 | 7.0% |
| Total | 9,863 | 100.0% |
Ancestry in Richmond Heights
The most populous ancestries reported in Richmond Heights are Cuban (2,175 | 22.1%), South American (889 | 9.0%), Central American (765 | 7.8%), Peruvian (702 | 7.1%), and Nicaraguan (618 | 6.3%), together accounting for 52.2% of all Richmond Heights residents.
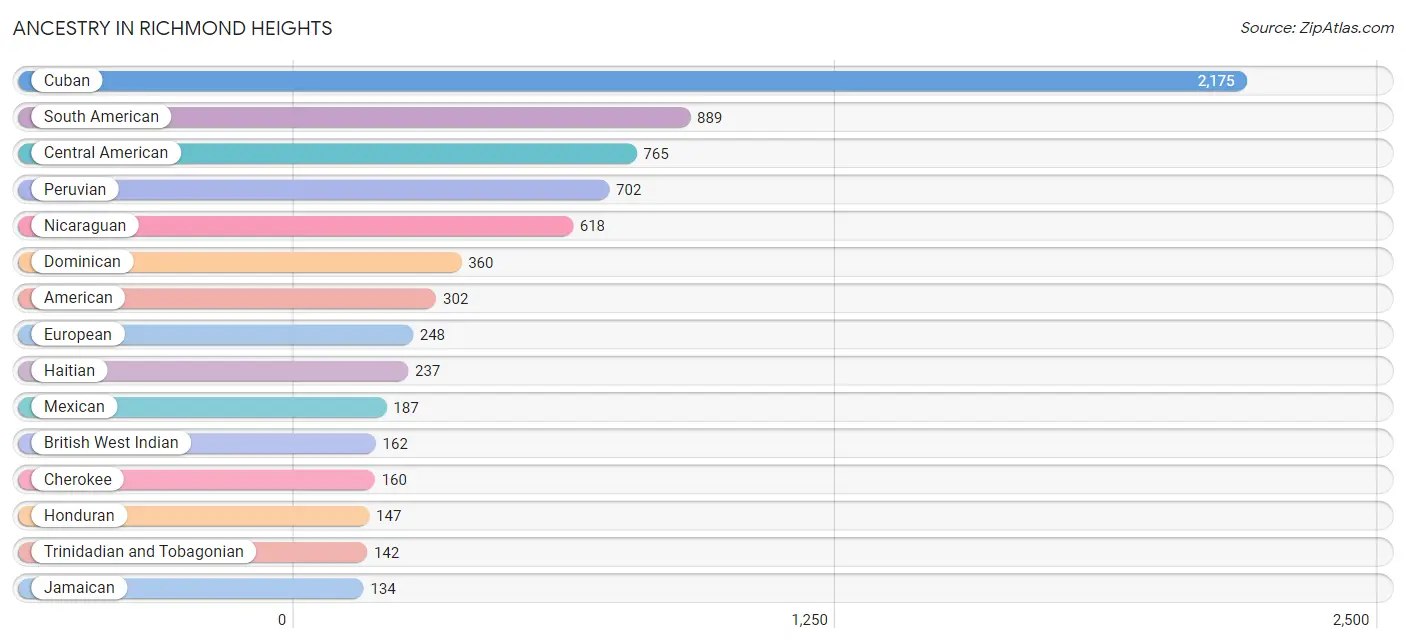
| Ancestry | # Population | % Population |
| American | 302 | 3.1% |
| Arab | 2 | 0.0% |
| Bahamian | 54 | 0.5% |
| Bhutanese | 9 | 0.1% |
| British West Indian | 162 | 1.6% |
| Burmese | 22 | 0.2% |
| Central American | 765 | 7.8% |
| Cherokee | 160 | 1.6% |
| Chilean | 26 | 0.3% |
| Colombian | 127 | 1.3% |
| Cuban | 2,175 | 22.1% |
| Dominican | 360 | 3.6% |
| English | 10 | 0.1% |
| European | 248 | 2.5% |
| French | 78 | 0.8% |
| Guyanese | 10 | 0.1% |
| Haitian | 237 | 2.4% |
| Honduran | 147 | 1.5% |
| Indian (Asian) | 2 | 0.0% |
| Irish | 19 | 0.2% |
| Italian | 67 | 0.7% |
| Jamaican | 134 | 1.4% |
| Korean | 21 | 0.2% |
| Mexican | 187 | 1.9% |
| Nicaraguan | 618 | 6.3% |
| Peruvian | 702 | 7.1% |
| Polish | 19 | 0.2% |
| Puerto Rican | 14 | 0.1% |
| Russian | 1 | 0.0% |
| Scottish | 32 | 0.3% |
| South American | 889 | 9.0% |
| Spanish | 8 | 0.1% |
| Sri Lankan | 9 | 0.1% |
| Subsaharan African | 9 | 0.1% |
| Syrian | 2 | 0.0% |
| Thai | 46 | 0.5% |
| Trinidadian and Tobagonian | 142 | 1.4% |
| Venezuelan | 34 | 0.3% |
| West Indian | 55 | 0.6% | View All 39 Rows |
Immigrants in Richmond Heights
The most numerous immigrant groups reported in Richmond Heights came from Latin America (3,505 | 35.5%), Caribbean (2,485 | 25.2%), Cuba (1,790 | 18.1%), Central America (552 | 5.6%), and South America (468 | 4.8%), together accounting for 89.2% of all Richmond Heights residents.
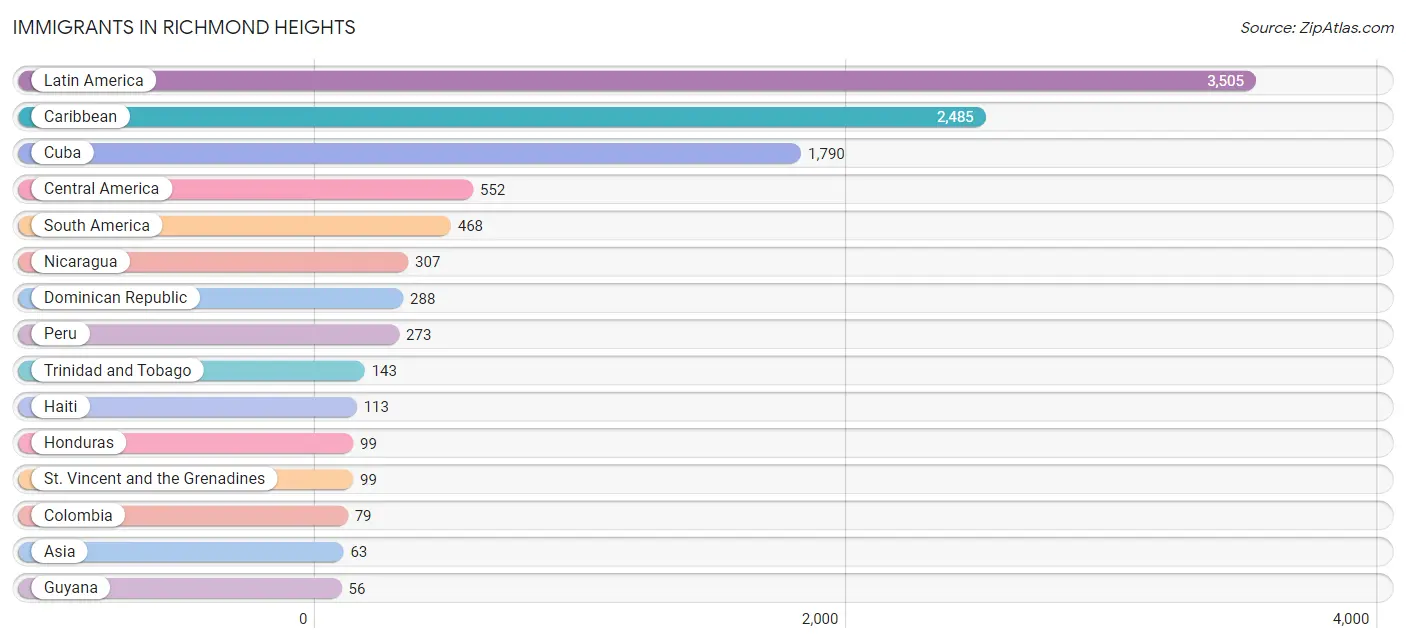
| Immigration Origin | # Population | % Population |
| Africa | 9 | 0.1% |
| Asia | 63 | 0.6% |
| Bahamas | 12 | 0.1% |
| Caribbean | 2,485 | 25.2% |
| Central America | 552 | 5.6% |
| Chile | 26 | 0.3% |
| China | 2 | 0.0% |
| Colombia | 79 | 0.8% |
| Cuba | 1,790 | 18.1% |
| Dominican Republic | 288 | 2.9% |
| Eastern Africa | 9 | 0.1% |
| Eastern Asia | 33 | 0.3% |
| El Salvador | 13 | 0.1% |
| Europe | 44 | 0.4% |
| Guatemala | 24 | 0.2% |
| Guyana | 56 | 0.6% |
| Haiti | 113 | 1.1% |
| Honduras | 99 | 1.0% |
| Jamaica | 40 | 0.4% |
| Japan | 9 | 0.1% |
| Korea | 22 | 0.2% |
| Latin America | 3,505 | 35.5% |
| Mexico | 54 | 0.5% |
| Nicaragua | 307 | 3.1% |
| Panama | 55 | 0.6% |
| Peru | 273 | 2.8% |
| Philippines | 21 | 0.2% |
| South America | 468 | 4.8% |
| South Eastern Asia | 30 | 0.3% |
| Southern Europe | 44 | 0.4% |
| Spain | 44 | 0.4% |
| St. Vincent and the Grenadines | 99 | 1.0% |
| Trinidad and Tobago | 143 | 1.5% |
| Venezuela | 34 | 0.3% |
| Vietnam | 9 | 0.1% | View All 35 Rows |
Sex and Age in Richmond Heights
Sex and Age in Richmond Heights
The most populous age groups in Richmond Heights are 35 to 39 Years (473 | 10.6%) for men and 40 to 44 Years (542 | 10.0%) for women.
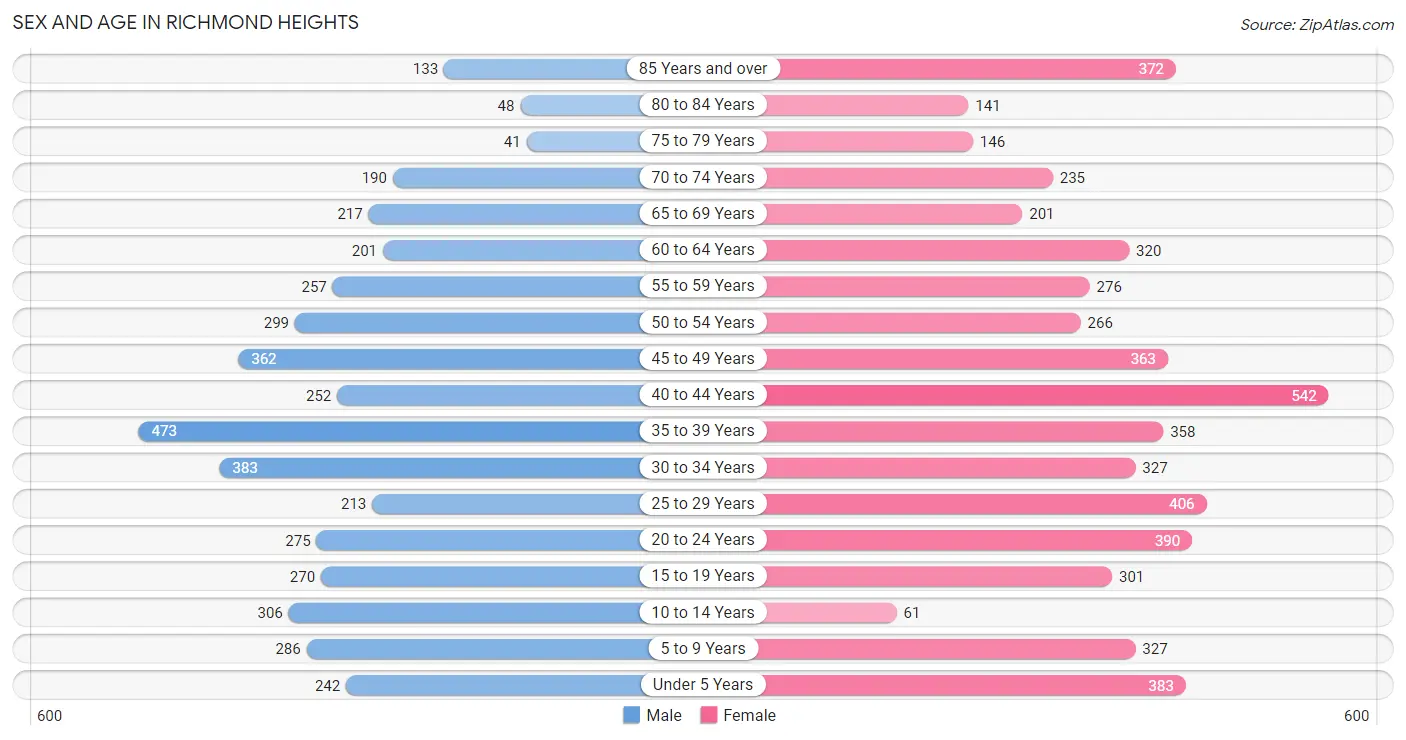
| Age Bracket | Male | Female |
| Under 5 Years | 242 (5.4%) | 383 (7.1%) |
| 5 to 9 Years | 286 (6.4%) | 327 (6.0%) |
| 10 to 14 Years | 306 (6.9%) | 61 (1.1%) |
| 15 to 19 Years | 270 (6.1%) | 301 (5.6%) |
| 20 to 24 Years | 275 (6.2%) | 390 (7.2%) |
| 25 to 29 Years | 213 (4.8%) | 406 (7.5%) |
| 30 to 34 Years | 383 (8.6%) | 327 (6.0%) |
| 35 to 39 Years | 473 (10.6%) | 358 (6.6%) |
| 40 to 44 Years | 252 (5.7%) | 542 (10.0%) |
| 45 to 49 Years | 362 (8.1%) | 363 (6.7%) |
| 50 to 54 Years | 299 (6.7%) | 266 (4.9%) |
| 55 to 59 Years | 257 (5.8%) | 276 (5.1%) |
| 60 to 64 Years | 201 (4.5%) | 320 (5.9%) |
| 65 to 69 Years | 217 (4.9%) | 201 (3.7%) |
| 70 to 74 Years | 190 (4.3%) | 235 (4.3%) |
| 75 to 79 Years | 41 (0.9%) | 146 (2.7%) |
| 80 to 84 Years | 48 (1.1%) | 141 (2.6%) |
| 85 Years and over | 133 (3.0%) | 372 (6.9%) |
| Total | 4,448 (100.0%) | 5,415 (100.0%) |
Families and Households in Richmond Heights
Median Family Size in Richmond Heights
The median family size in Richmond Heights is 3.93 persons per family, with single male/father families (328 | 15.4%) accounting for the largest median family size of 4.12 persons per family. On the other hand, single female/mother families (610 | 28.6%) represent the smallest median family size with 3.70 persons per family.
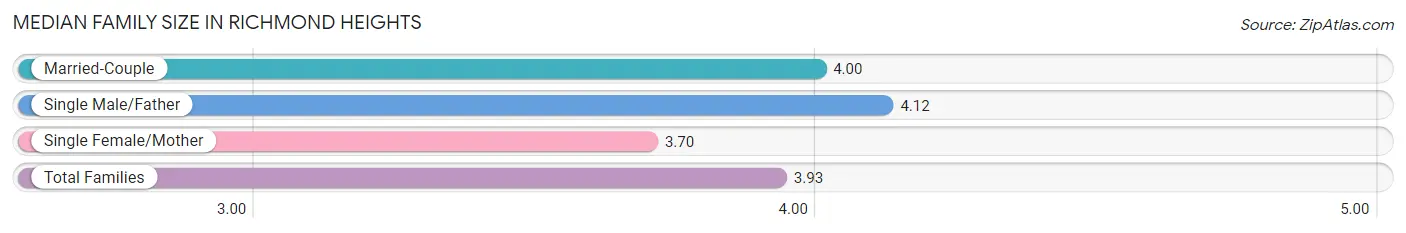
| Family Type | # Families | Family Size |
| Married-Couple | 1,193 (56.0%) | 4.00 |
| Single Male/Father | 328 (15.4%) | 4.12 |
| Single Female/Mother | 610 (28.6%) | 3.70 |
| Total Families | 2,131 (100.0%) | 3.93 |
Median Household Size in Richmond Heights
The median household size in Richmond Heights is 3.49 persons per household, with single male/father households (328 | 11.9%) accounting for the largest median household size of 4.35 persons per household. non-family households (635 | 23.0%) represent the smallest median household size with 1.49 persons per household.
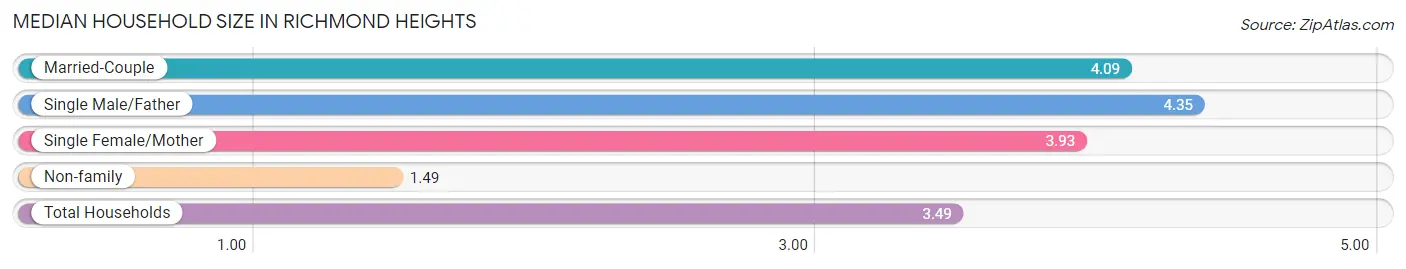
| Household Type | # Households | Household Size |
| Married-Couple | 1,193 (43.1%) | 4.09 |
| Single Male/Father | 328 (11.9%) | 4.35 |
| Single Female/Mother | 610 (22.1%) | 3.93 |
| Non-family | 635 (23.0%) | 1.49 |
| Total Households | 2,766 (100.0%) | 3.49 |
Household Size by Marriage Status in Richmond Heights
Out of a total of 2,766 households in Richmond Heights, 2,131 (77.0%) are family households, while 635 (23.0%) are nonfamily households. The most numerous type of family households are 4-person households, comprising 626, and the most common type of nonfamily households are 1-person households, comprising 446.
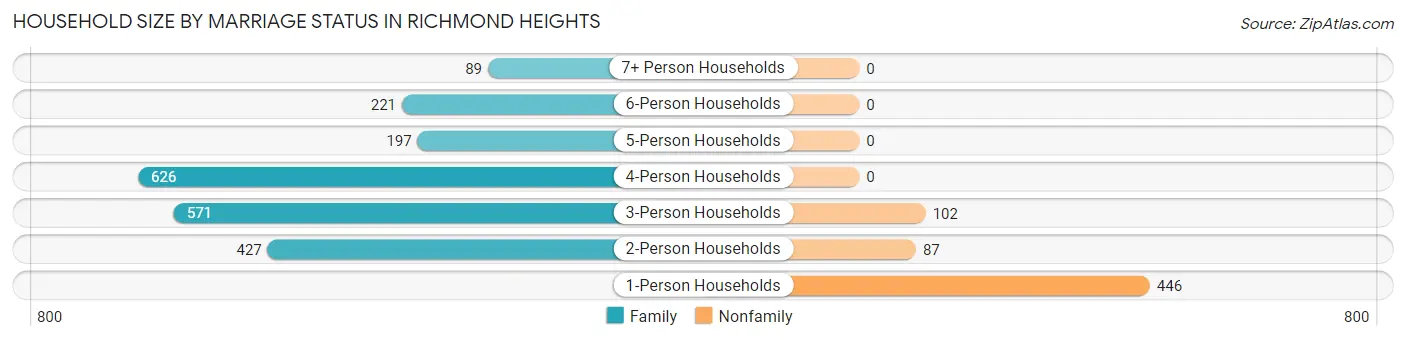
| Household Size | Family Households | Nonfamily Households |
| 1-Person Households | - | 446 (16.1%) |
| 2-Person Households | 427 (15.4%) | 87 (3.2%) |
| 3-Person Households | 571 (20.6%) | 102 (3.7%) |
| 4-Person Households | 626 (22.6%) | 0 (0.0%) |
| 5-Person Households | 197 (7.1%) | 0 (0.0%) |
| 6-Person Households | 221 (8.0%) | 0 (0.0%) |
| 7+ Person Households | 89 (3.2%) | 0 (0.0%) |
| Total | 2,131 (77.0%) | 635 (23.0%) |
Female Fertility in Richmond Heights
Fertility by Age in Richmond Heights
Average fertility rate in Richmond Heights is 63.0 births per 1,000 women. Women in the age bracket of 35 to 50 years have the highest fertility rate with 77.0 births per 1,000 women. Women in the age bracket of 35 to 50 years acount for 58.5% of all women with births.
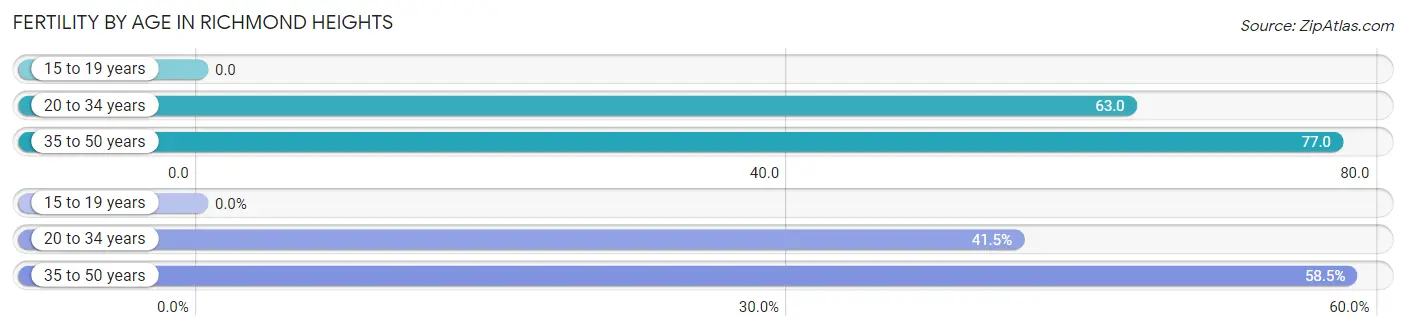
| Age Bracket | Women with Births | Births / 1,000 Women |
| 15 to 19 years | 0 (0.0%) | 0.0 |
| 20 to 34 years | 71 (41.5%) | 63.0 |
| 35 to 50 years | 100 (58.5%) | 77.0 |
| Total | 171 (100.0%) | 63.0 |
Fertility by Age by Marriage Status in Richmond Heights
58.5% of women with births (171) in Richmond Heights are married. The highest percentage of unmarried women with births falls into 20 to 34 years age bracket with 100.0% of them unmarried at the time of birth, while the lowest percentage of unmarried women with births belong to 35 to 50 years age bracket with 0.0% of them unmarried.
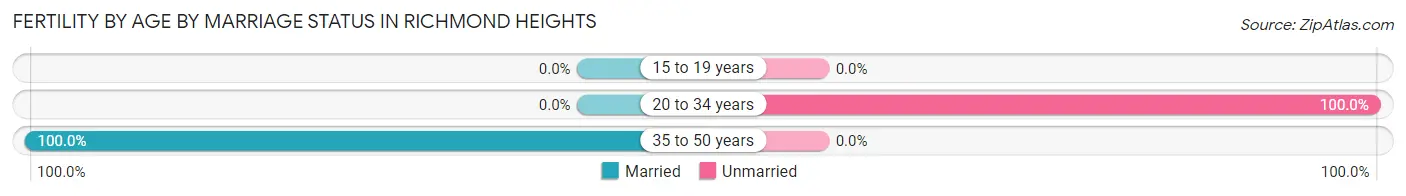
| Age Bracket | Married | Unmarried |
| 15 to 19 years | 0 (0.0%) | 0 (0.0%) |
| 20 to 34 years | 0 (0.0%) | 71 (100.0%) |
| 35 to 50 years | 100 (100.0%) | 0 (0.0%) |
| Total | 100 (58.5%) | 71 (41.5%) |
Fertility by Education in Richmond Heights
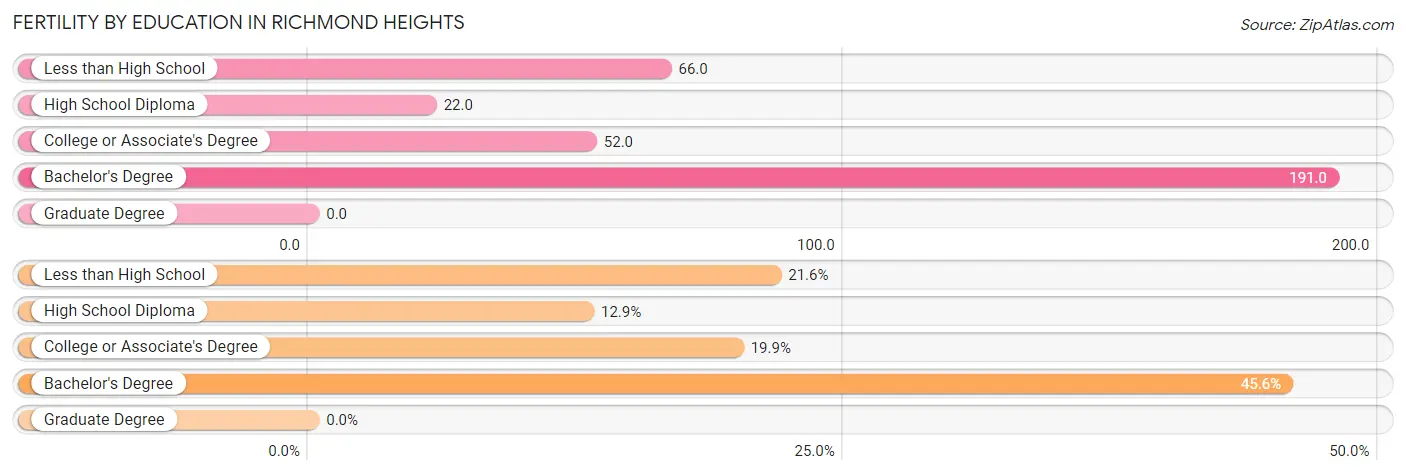
| Educational Attainment | Women with Births | Births / 1,000 Women |
| Less than High School | 37 (21.6%) | 66.0 |
| High School Diploma | 22 (12.9%) | 22.0 |
| College or Associate's Degree | 34 (19.9%) | 52.0 |
| Bachelor's Degree | 78 (45.6%) | 191.0 |
| Graduate Degree | 0 (0.0%) | 0.0 |
| Total | 171 (100.0%) | 63.0 |
Fertility by Education by Marriage Status in Richmond Heights
41.5% of women with births in Richmond Heights are unmarried. Women with the educational attainment of less than high school are most likely to be married with 100.0% of them married at childbirth, while women with the educational attainment of high school diploma are least likely to be married with 100.0% of them unmarried at childbirth.
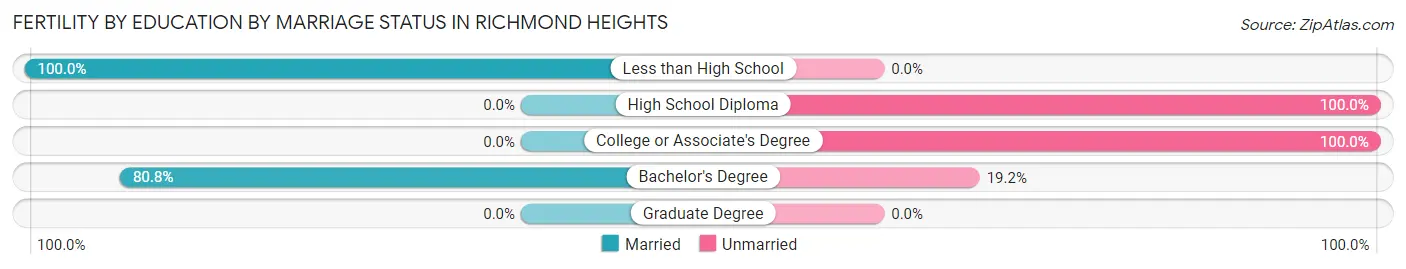
| Educational Attainment | Married | Unmarried |
| Less than High School | 37 (100.0%) | 0 (0.0%) |
| High School Diploma | 0 (0.0%) | 22 (100.0%) |
| College or Associate's Degree | 0 (0.0%) | 34 (100.0%) |
| Bachelor's Degree | 63 (80.8%) | 15 (19.2%) |
| Graduate Degree | 0 (0.0%) | 0 (0.0%) |
| Total | 100 (58.5%) | 71 (41.5%) |
Employment Characteristics in Richmond Heights
Employment by Class of Employer in Richmond Heights
Among the 4,462 employed individuals in Richmond Heights, private company employees (2,871 | 64.3%), local government employees (411 | 9.2%), and self-employed (not incorporated) (395 | 8.8%) make up the most common classes of employment.
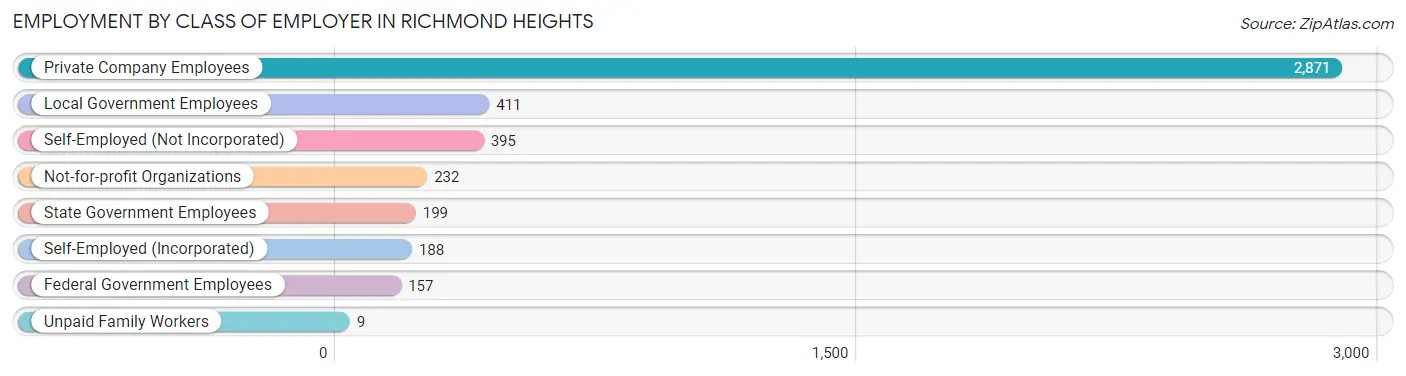
| Employer Class | # Employees | % Employees |
| Private Company Employees | 2,871 | 64.3% |
| Self-Employed (Incorporated) | 188 | 4.2% |
| Self-Employed (Not Incorporated) | 395 | 8.8% |
| Not-for-profit Organizations | 232 | 5.2% |
| Local Government Employees | 411 | 9.2% |
| State Government Employees | 199 | 4.5% |
| Federal Government Employees | 157 | 3.5% |
| Unpaid Family Workers | 9 | 0.2% |
| Total | 4,462 | 100.0% |
Employment Status by Age in Richmond Heights
According to the labor force statistics for Richmond Heights, out of the total population over 16 years of age (8,199), 58.1% or 4,764 individuals are in the labor force, with 5.6% or 267 of them unemployed. The age group with the highest labor force participation rate is 55 to 59 years, with 85.4% or 455 individuals in the labor force. Within the labor force, the 25 to 29 years age range has the highest percentage of unemployed individuals, with 15.7% or 68 of them being unemployed.
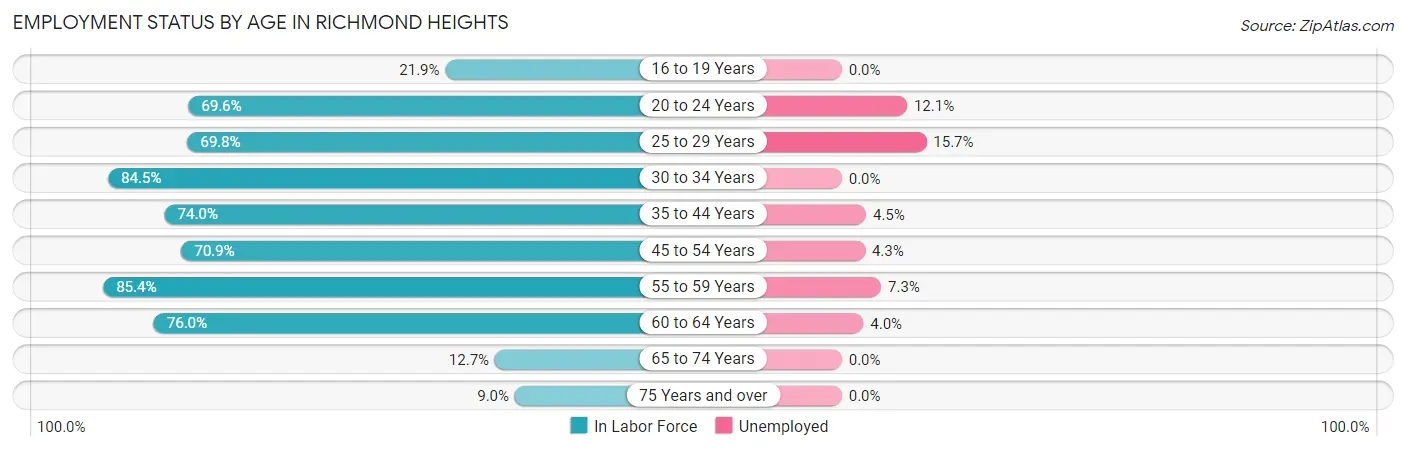
| Age Bracket | In Labor Force | Unemployed |
| 16 to 19 Years | 112 (21.9%) | 0 (0.0%) |
| 20 to 24 Years | 463 (69.6%) | 56 (12.1%) |
| 25 to 29 Years | 432 (69.8%) | 68 (15.7%) |
| 30 to 34 Years | 600 (84.5%) | 0 (0.0%) |
| 35 to 44 Years | 1,202 (74.0%) | 54 (4.5%) |
| 45 to 54 Years | 915 (70.9%) | 39 (4.3%) |
| 55 to 59 Years | 455 (85.4%) | 33 (7.3%) |
| 60 to 64 Years | 396 (76.0%) | 16 (4.0%) |
| 65 to 74 Years | 107 (12.7%) | 0 (0.0%) |
| 75 Years and over | 79 (9.0%) | 0 (0.0%) |
| Total | 4,764 (58.1%) | 267 (5.6%) |
Employment Status by Educational Attainment in Richmond Heights
According to labor force statistics for Richmond Heights, 75.5% of individuals (4,000) out of the total population between 25 and 64 years of age (5,298) are in the labor force, with 5.3% or 212 of them being unemployed. The group with the highest labor force participation rate are those with the educational attainment of high school diploma, with 82.2% or 1,733 individuals in the labor force. Within the labor force, individuals with bachelor's degree or higher education have the highest percentage of unemployment, with 11.8% or 88 of them being unemployed.
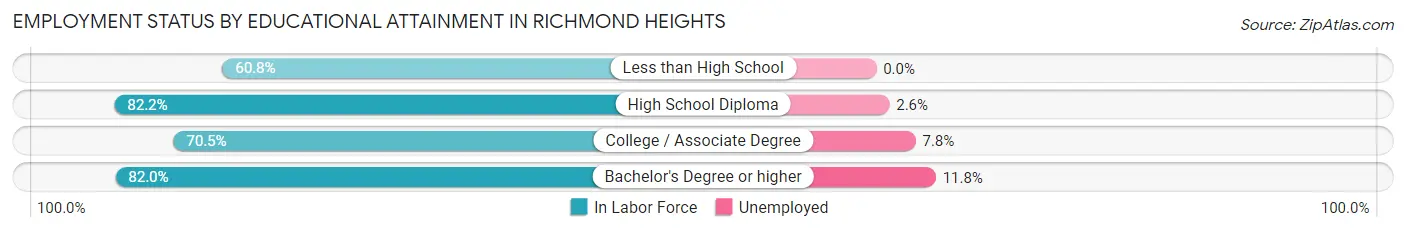
| Educational Attainment | In Labor Force | Unemployed |
| Less than High School | 536 (60.8%) | 0 (0.0%) |
| High School Diploma | 1,733 (82.2%) | 55 (2.6%) |
| College / Associate Degree | 986 (70.5%) | 109 (7.8%) |
| Bachelor's Degree or higher | 746 (82.0%) | 107 (11.8%) |
| Total | 4,000 (75.5%) | 281 (5.3%) |
Employment Occupations by Sex in Richmond Heights
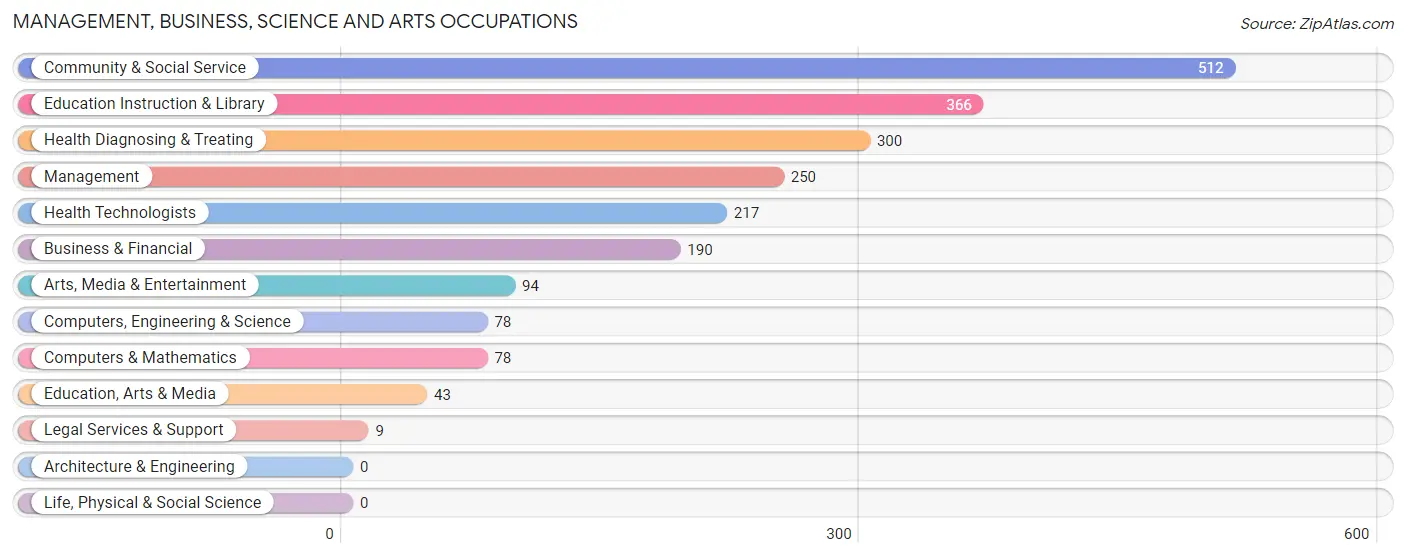
Management, Business, Science and Arts Occupations
The most common Management, Business, Science and Arts occupations in Richmond Heights are Community & Social Service (512 | 11.4%), Education Instruction & Library (366 | 8.1%), Health Diagnosing & Treating (300 | 6.7%), Management (250 | 5.6%), and Health Technologists (217 | 4.8%).
Management, Business, Science and Arts Occupations by Sex
Within the Management, Business, Science and Arts occupations in Richmond Heights, the most male-oriented occupations are Computers, Engineering & Science (79.5%), Computers & Mathematics (79.5%), and Management (65.2%), while the most female-oriented occupations are Legal Services & Support (100.0%), Health Diagnosing & Treating (100.0%), and Health Technologists (100.0%).
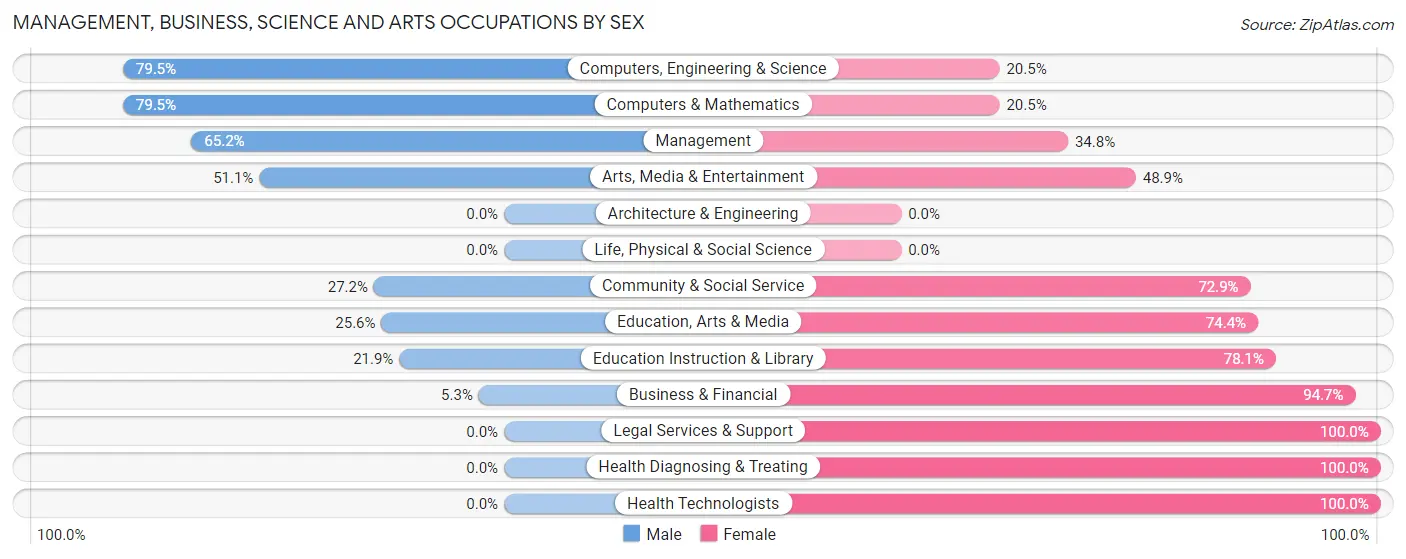
| Occupation | Male | Female |
| Management | 163 (65.2%) | 87 (34.8%) |
| Business & Financial | 10 (5.3%) | 180 (94.7%) |
| Computers, Engineering & Science | 62 (79.5%) | 16 (20.5%) |
| Computers & Mathematics | 62 (79.5%) | 16 (20.5%) |
| Architecture & Engineering | 0 (0.0%) | 0 (0.0%) |
| Life, Physical & Social Science | 0 (0.0%) | 0 (0.0%) |
| Community & Social Service | 139 (27.2%) | 373 (72.9%) |
| Education, Arts & Media | 11 (25.6%) | 32 (74.4%) |
| Legal Services & Support | 0 (0.0%) | 9 (100.0%) |
| Education Instruction & Library | 80 (21.9%) | 286 (78.1%) |
| Arts, Media & Entertainment | 48 (51.1%) | 46 (48.9%) |
| Health Diagnosing & Treating | 0 (0.0%) | 300 (100.0%) |
| Health Technologists | 0 (0.0%) | 217 (100.0%) |
| Total (Category) | 374 (28.1%) | 956 (71.9%) |
| Total (Overall) | 2,025 (45.1%) | 2,470 (54.9%) |
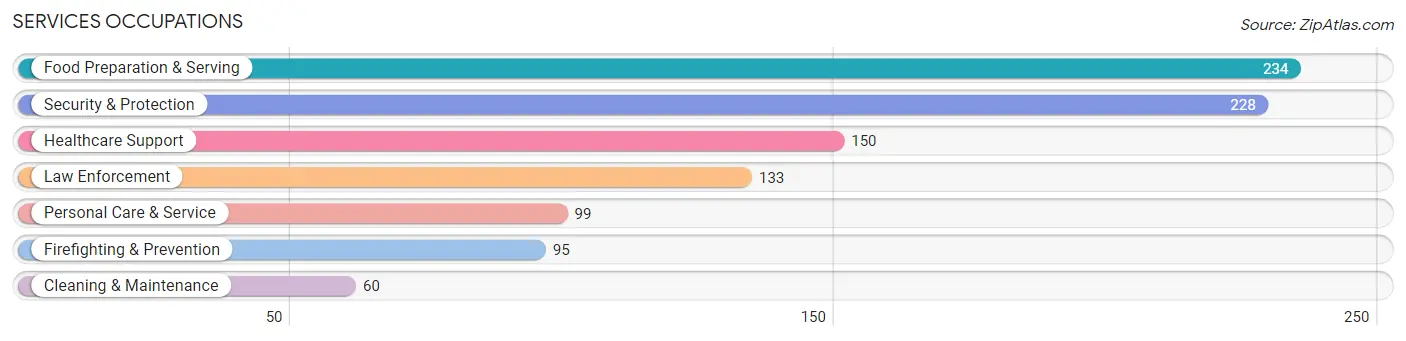
Services Occupations
The most common Services occupations in Richmond Heights are Food Preparation & Serving (234 | 5.2%), Security & Protection (228 | 5.1%), Healthcare Support (150 | 3.3%), Law Enforcement (133 | 3.0%), and Personal Care & Service (99 | 2.2%).
Services Occupations by Sex
Within the Services occupations in Richmond Heights, the most male-oriented occupations are Firefighting & Prevention (100.0%), Food Preparation & Serving (69.7%), and Cleaning & Maintenance (56.7%), while the most female-oriented occupations are Healthcare Support (95.3%), Law Enforcement (75.9%), and Personal Care & Service (74.8%).
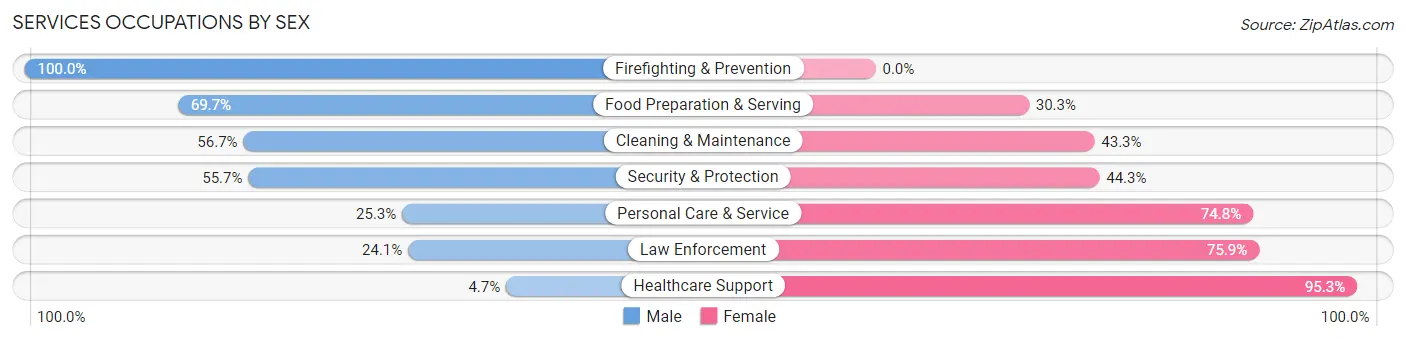
| Occupation | Male | Female |
| Healthcare Support | 7 (4.7%) | 143 (95.3%) |
| Security & Protection | 127 (55.7%) | 101 (44.3%) |
| Firefighting & Prevention | 95 (100.0%) | 0 (0.0%) |
| Law Enforcement | 32 (24.1%) | 101 (75.9%) |
| Food Preparation & Serving | 163 (69.7%) | 71 (30.3%) |
| Cleaning & Maintenance | 34 (56.7%) | 26 (43.3%) |
| Personal Care & Service | 25 (25.3%) | 74 (74.8%) |
| Total (Category) | 356 (46.2%) | 415 (53.8%) |
| Total (Overall) | 2,025 (45.1%) | 2,470 (54.9%) |
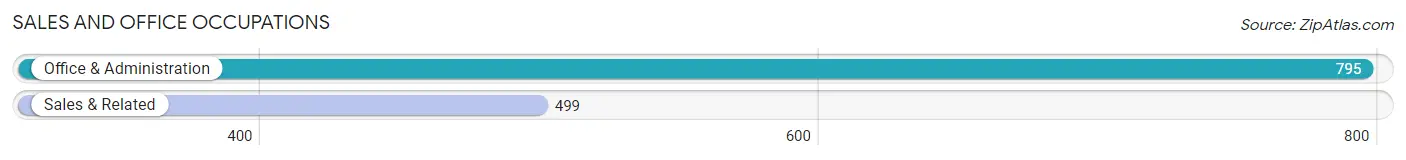
Sales and Office Occupations
The most common Sales and Office occupations in Richmond Heights are Office & Administration (795 | 17.7%), and Sales & Related (499 | 11.1%).
Sales and Office Occupations by Sex
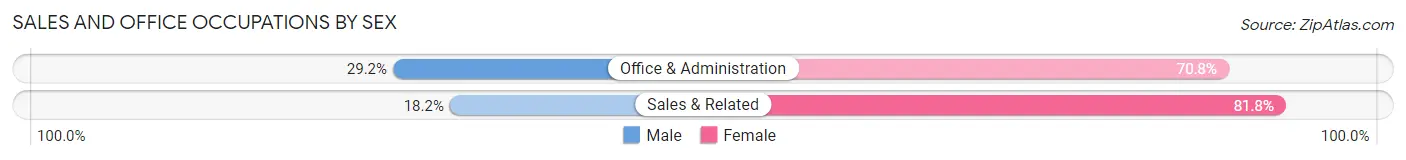
| Occupation | Male | Female |
| Sales & Related | 91 (18.2%) | 408 (81.8%) |
| Office & Administration | 232 (29.2%) | 563 (70.8%) |
| Total (Category) | 323 (25.0%) | 971 (75.0%) |
| Total (Overall) | 2,025 (45.1%) | 2,470 (54.9%) |
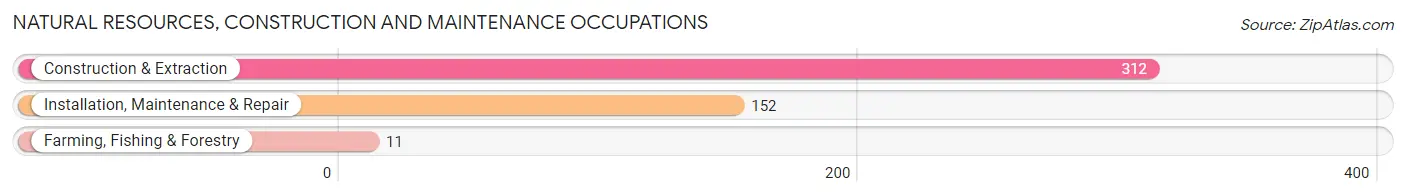
Natural Resources, Construction and Maintenance Occupations
The most common Natural Resources, Construction and Maintenance occupations in Richmond Heights are Construction & Extraction (312 | 6.9%), Installation, Maintenance & Repair (152 | 3.4%), and Farming, Fishing & Forestry (11 | 0.2%).
Natural Resources, Construction and Maintenance Occupations by Sex
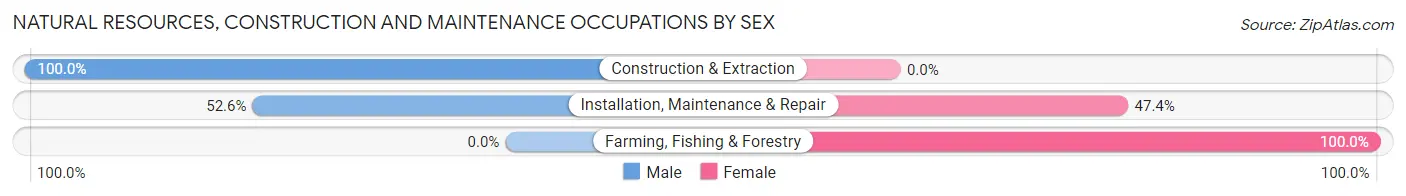
| Occupation | Male | Female |
| Farming, Fishing & Forestry | 0 (0.0%) | 11 (100.0%) |
| Construction & Extraction | 312 (100.0%) | 0 (0.0%) |
| Installation, Maintenance & Repair | 80 (52.6%) | 72 (47.4%) |
| Total (Category) | 392 (82.5%) | 83 (17.5%) |
| Total (Overall) | 2,025 (45.1%) | 2,470 (54.9%) |
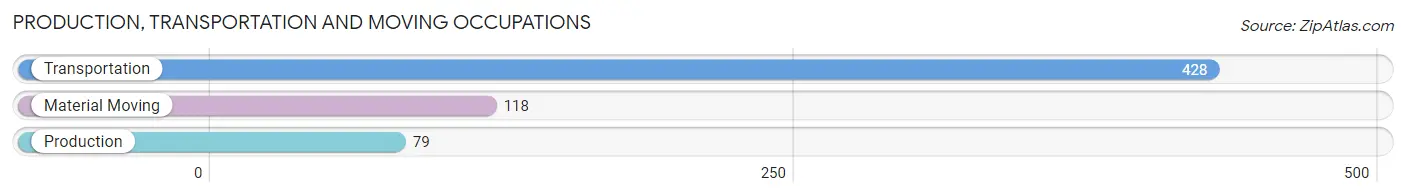
Production, Transportation and Moving Occupations
The most common Production, Transportation and Moving occupations in Richmond Heights are Transportation (428 | 9.5%), Material Moving (118 | 2.6%), and Production (79 | 1.8%).
Production, Transportation and Moving Occupations by Sex
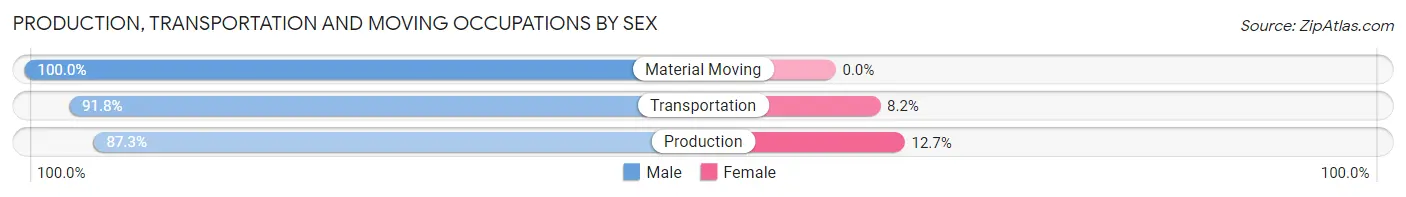
| Occupation | Male | Female |
| Production | 69 (87.3%) | 10 (12.7%) |
| Transportation | 393 (91.8%) | 35 (8.2%) |
| Material Moving | 118 (100.0%) | 0 (0.0%) |
| Total (Category) | 580 (92.8%) | 45 (7.2%) |
| Total (Overall) | 2,025 (45.1%) | 2,470 (54.9%) |
Employment Industries by Sex in Richmond Heights
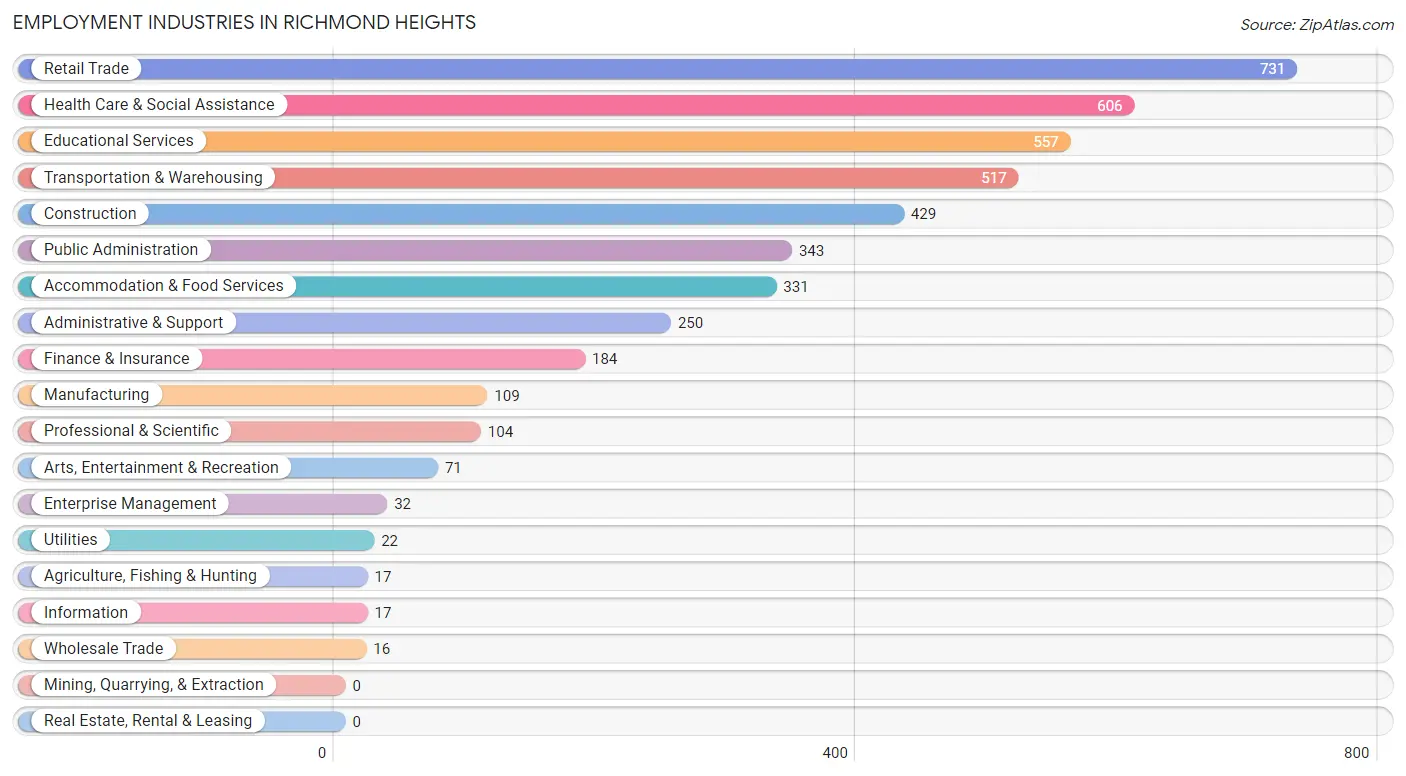
Employment Industries in Richmond Heights
The major employment industries in Richmond Heights include Retail Trade (731 | 16.3%), Health Care & Social Assistance (606 | 13.5%), Educational Services (557 | 12.4%), Transportation & Warehousing (517 | 11.5%), and Construction (429 | 9.5%).
Employment Industries by Sex in Richmond Heights
The Richmond Heights industries that see more men than women are Utilities (100.0%), Information (100.0%), and Enterprise Management (100.0%), whereas the industries that tend to have a higher number of women are Wholesale Trade (100.0%), Professional & Scientific (100.0%), and Health Care & Social Assistance (88.8%).
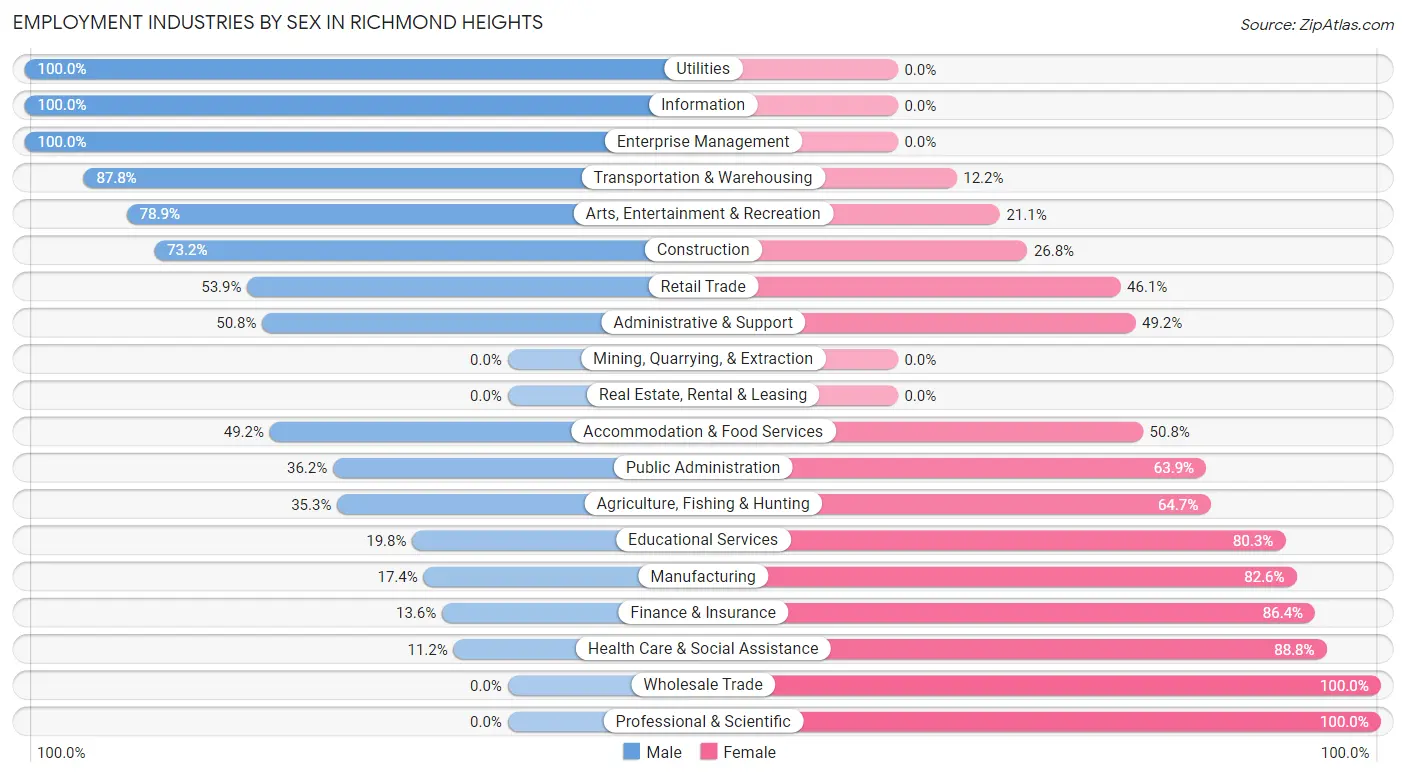
| Industry | Male | Female |
| Agriculture, Fishing & Hunting | 6 (35.3%) | 11 (64.7%) |
| Mining, Quarrying, & Extraction | 0 (0.0%) | 0 (0.0%) |
| Construction | 314 (73.2%) | 115 (26.8%) |
| Manufacturing | 19 (17.4%) | 90 (82.6%) |
| Wholesale Trade | 0 (0.0%) | 16 (100.0%) |
| Retail Trade | 394 (53.9%) | 337 (46.1%) |
| Transportation & Warehousing | 454 (87.8%) | 63 (12.2%) |
| Utilities | 22 (100.0%) | 0 (0.0%) |
| Information | 17 (100.0%) | 0 (0.0%) |
| Finance & Insurance | 25 (13.6%) | 159 (86.4%) |
| Real Estate, Rental & Leasing | 0 (0.0%) | 0 (0.0%) |
| Professional & Scientific | 0 (0.0%) | 104 (100.0%) |
| Enterprise Management | 32 (100.0%) | 0 (0.0%) |
| Administrative & Support | 127 (50.8%) | 123 (49.2%) |
| Educational Services | 110 (19.8%) | 447 (80.2%) |
| Health Care & Social Assistance | 68 (11.2%) | 538 (88.8%) |
| Arts, Entertainment & Recreation | 56 (78.9%) | 15 (21.1%) |
| Accommodation & Food Services | 163 (49.2%) | 168 (50.8%) |
| Public Administration | 124 (36.1%) | 219 (63.8%) |
| Total | 2,025 (45.1%) | 2,470 (54.9%) |
Education in Richmond Heights
School Enrollment in Richmond Heights
The most common levels of schooling among the 2,045 students in Richmond Heights are high school (496 | 24.2%), elementary school (477 | 23.3%), and college / undergraduate (399 | 19.5%).
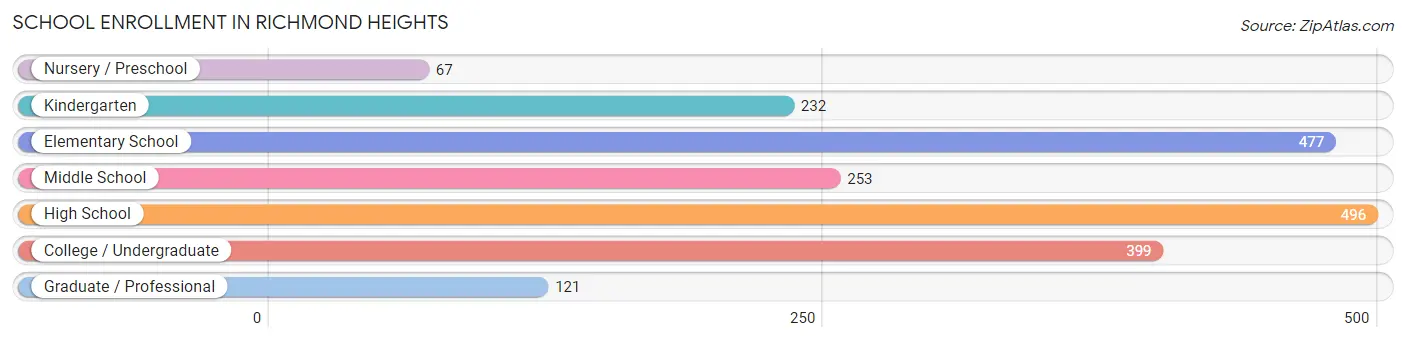
| School Level | # Students | % Students |
| Nursery / Preschool | 67 | 3.3% |
| Kindergarten | 232 | 11.3% |
| Elementary School | 477 | 23.3% |
| Middle School | 253 | 12.4% |
| High School | 496 | 24.2% |
| College / Undergraduate | 399 | 19.5% |
| Graduate / Professional | 121 | 5.9% |
| Total | 2,045 | 100.0% |
School Enrollment by Age by Funding Source in Richmond Heights
Out of a total of 2,045 students who are enrolled in schools in Richmond Heights, 305 (14.9%) attend a private institution, while the remaining 1,740 (85.1%) are enrolled in public schools. The age group of 25 to 34 year olds has the highest likelihood of being enrolled in private schools, with 71 (31.7% in the age bracket) enrolled. Conversely, the age group of 3 to 4 year olds has the lowest likelihood of being enrolled in a private school, with 82 (100.0% in the age bracket) attending a public institution.
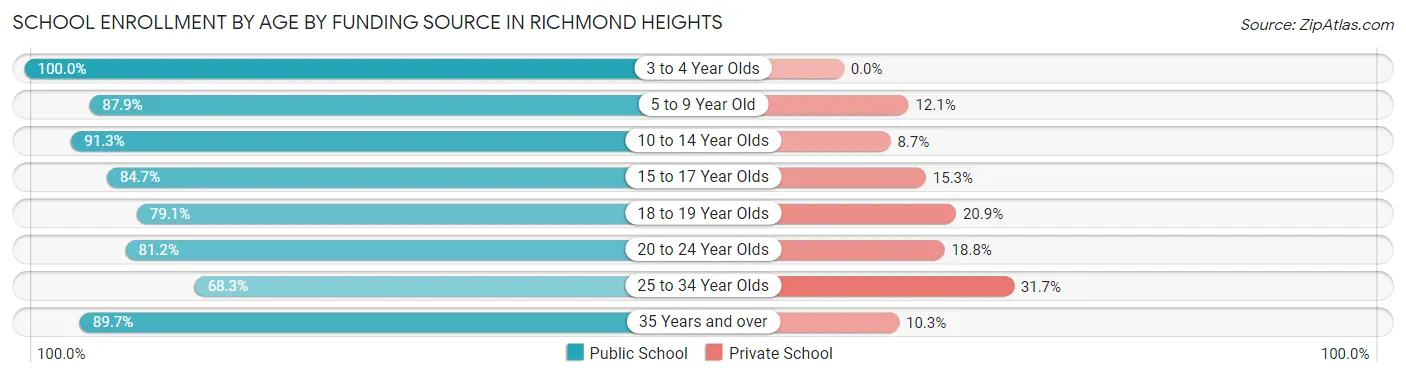
| Age Bracket | Public School | Private School |
| 3 to 4 Year Olds | 82 (100.0%) | 0 (0.0%) |
| 5 to 9 Year Old | 539 (87.9%) | 74 (12.1%) |
| 10 to 14 Year Olds | 335 (91.3%) | 32 (8.7%) |
| 15 to 17 Year Olds | 260 (84.7%) | 47 (15.3%) |
| 18 to 19 Year Olds | 121 (79.1%) | 32 (20.9%) |
| 20 to 24 Year Olds | 164 (81.2%) | 38 (18.8%) |
| 25 to 34 Year Olds | 153 (68.3%) | 71 (31.7%) |
| 35 Years and over | 87 (89.7%) | 10 (10.3%) |
| Total | 1,740 (85.1%) | 305 (14.9%) |
Educational Attainment by Field of Study in Richmond Heights
Business (278 | 20.6%), science & technology (215 | 16.0%), social sciences (167 | 12.4%), education (163 | 12.1%), and arts & humanities (138 | 10.2%) are the most common fields of study among 1,348 individuals in Richmond Heights who have obtained a bachelor's degree or higher.
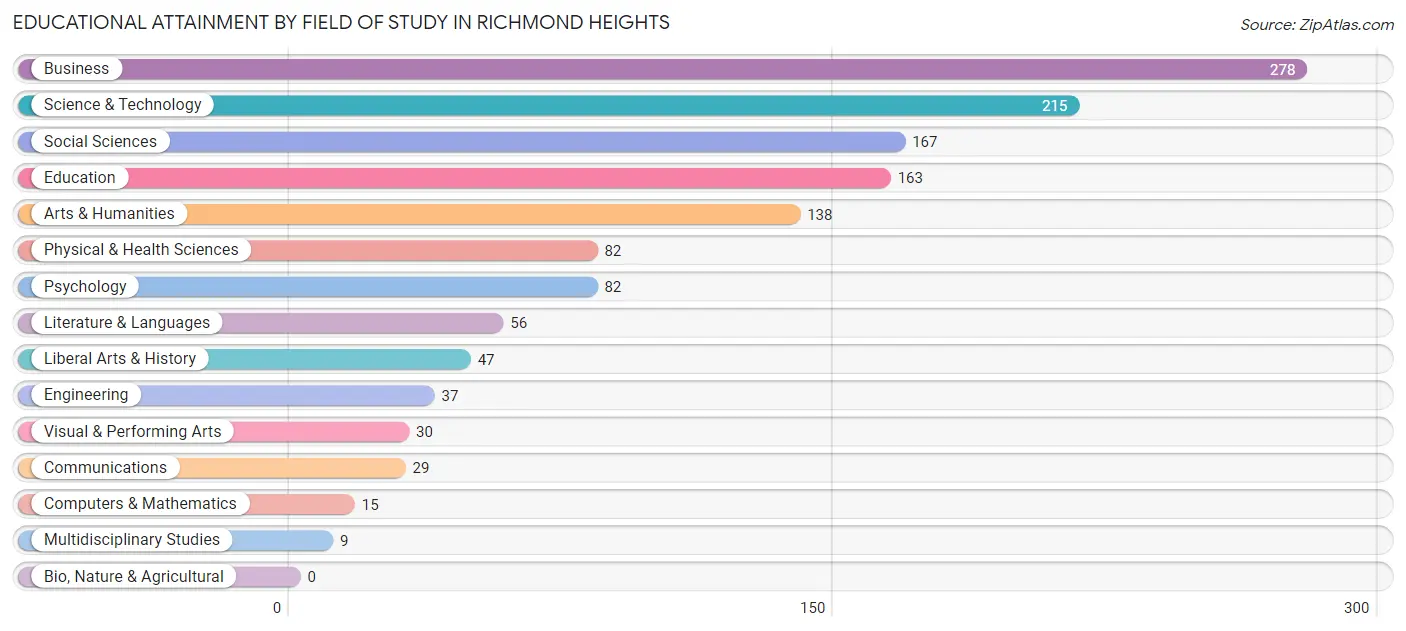
| Field of Study | # Graduates | % Graduates |
| Computers & Mathematics | 15 | 1.1% |
| Bio, Nature & Agricultural | 0 | 0.0% |
| Physical & Health Sciences | 82 | 6.1% |
| Psychology | 82 | 6.1% |
| Social Sciences | 167 | 12.4% |
| Engineering | 37 | 2.7% |
| Multidisciplinary Studies | 9 | 0.7% |
| Science & Technology | 215 | 16.0% |
| Business | 278 | 20.6% |
| Education | 163 | 12.1% |
| Literature & Languages | 56 | 4.2% |
| Liberal Arts & History | 47 | 3.5% |
| Visual & Performing Arts | 30 | 2.2% |
| Communications | 29 | 2.1% |
| Arts & Humanities | 138 | 10.2% |
| Total | 1,348 | 100.0% |
Transportation & Commute in Richmond Heights
Vehicle Availability by Sex in Richmond Heights
The most prevalent vehicle ownership categories in Richmond Heights are males with 2 vehicles (746, accounting for 36.8%) and females with 2 vehicles (692, making up 30.6%).
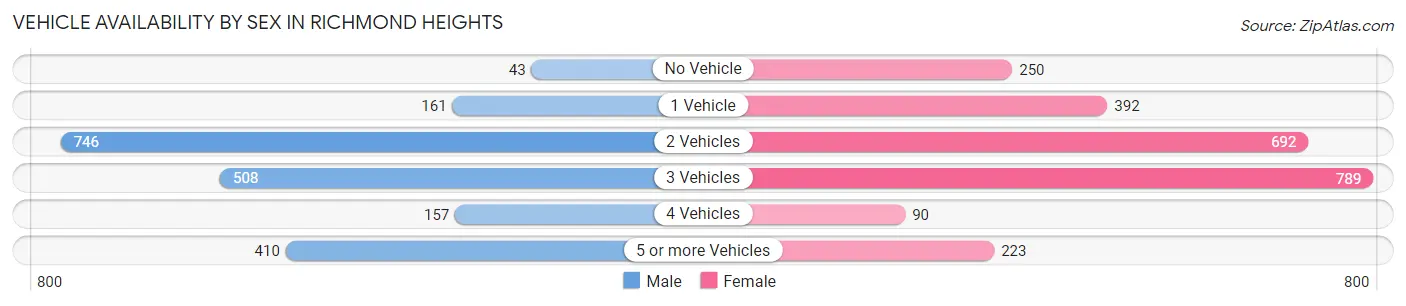
| Vehicles Available | Male | Female |
| No Vehicle | 43 (2.1%) | 250 (10.3%) |
| 1 Vehicle | 161 (8.0%) | 392 (16.1%) |
| 2 Vehicles | 746 (36.8%) | 692 (28.4%) |
| 3 Vehicles | 508 (25.1%) | 789 (32.4%) |
| 4 Vehicles | 157 (7.7%) | 90 (3.7%) |
| 5 or more Vehicles | 410 (20.3%) | 223 (9.1%) |
| Total | 2,025 (100.0%) | 2,436 (100.0%) |
Commute Time in Richmond Heights
The most frequently occuring commute durations in Richmond Heights are 30 to 34 minutes (1,092 commuters, 25.4%), 60 to 89 minutes (814 commuters, 19.0%), and 20 to 24 minutes (492 commuters, 11.5%).
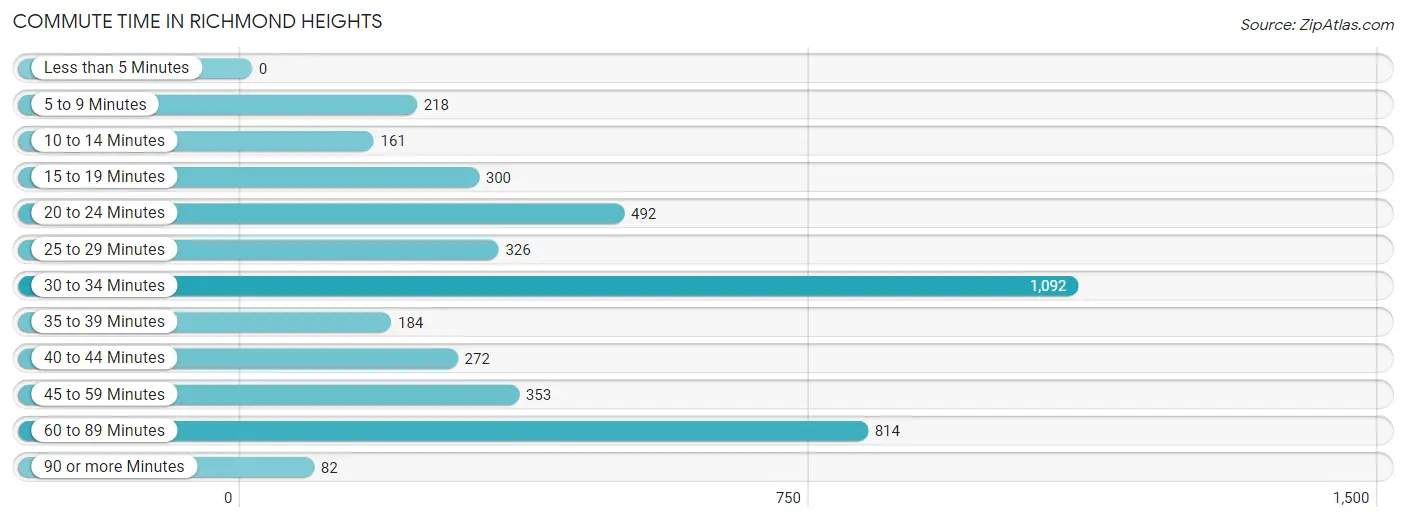
| Commute Time | # Commuters | % Commuters |
| Less than 5 Minutes | 0 | 0.0% |
| 5 to 9 Minutes | 218 | 5.1% |
| 10 to 14 Minutes | 161 | 3.7% |
| 15 to 19 Minutes | 300 | 7.0% |
| 20 to 24 Minutes | 492 | 11.5% |
| 25 to 29 Minutes | 326 | 7.6% |
| 30 to 34 Minutes | 1,092 | 25.4% |
| 35 to 39 Minutes | 184 | 4.3% |
| 40 to 44 Minutes | 272 | 6.3% |
| 45 to 59 Minutes | 353 | 8.2% |
| 60 to 89 Minutes | 814 | 19.0% |
| 90 or more Minutes | 82 | 1.9% |
Commute Time by Sex in Richmond Heights
The most common commute times in Richmond Heights are 30 to 34 minutes (567 commuters, 28.8%) for males and 30 to 34 minutes (525 commuters, 22.6%) for females.
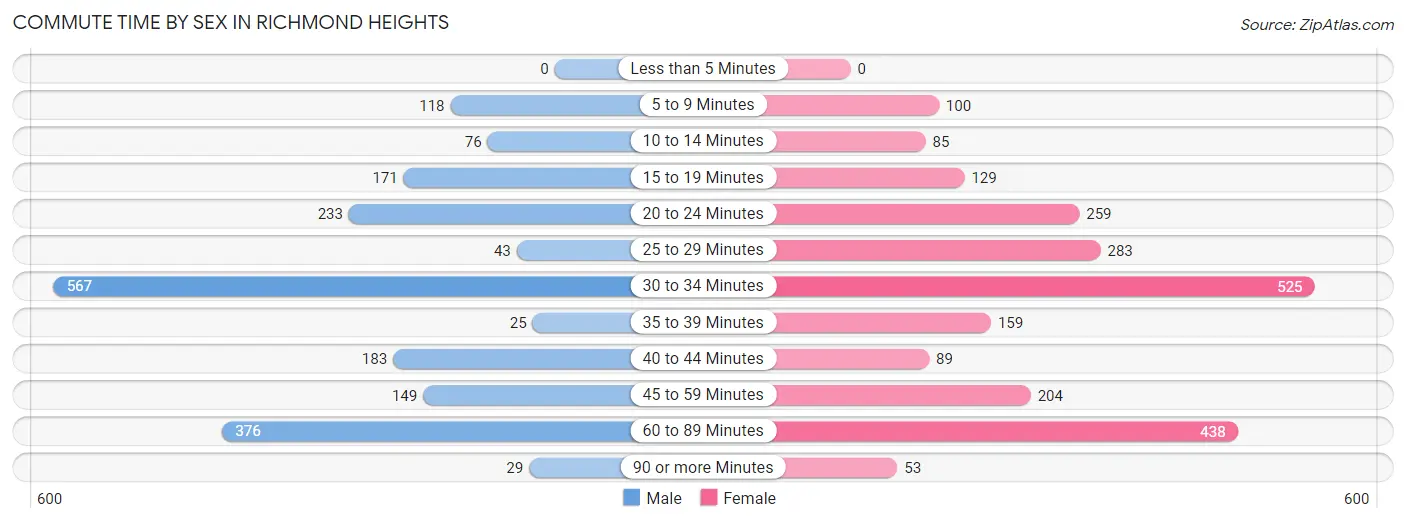
| Commute Time | Male | Female |
| Less than 5 Minutes | 0 (0.0%) | 0 (0.0%) |
| 5 to 9 Minutes | 118 (6.0%) | 100 (4.3%) |
| 10 to 14 Minutes | 76 (3.9%) | 85 (3.7%) |
| 15 to 19 Minutes | 171 (8.7%) | 129 (5.6%) |
| 20 to 24 Minutes | 233 (11.8%) | 259 (11.1%) |
| 25 to 29 Minutes | 43 (2.2%) | 283 (12.2%) |
| 30 to 34 Minutes | 567 (28.8%) | 525 (22.6%) |
| 35 to 39 Minutes | 25 (1.3%) | 159 (6.8%) |
| 40 to 44 Minutes | 183 (9.3%) | 89 (3.8%) |
| 45 to 59 Minutes | 149 (7.6%) | 204 (8.8%) |
| 60 to 89 Minutes | 376 (19.1%) | 438 (18.9%) |
| 90 or more Minutes | 29 (1.5%) | 53 (2.3%) |
Time of Departure to Work by Sex in Richmond Heights
The most frequent times of departure to work in Richmond Heights are 7:00 AM to 7:29 AM (410, 20.8%) for males and 7:00 AM to 7:29 AM (677, 29.1%) for females.
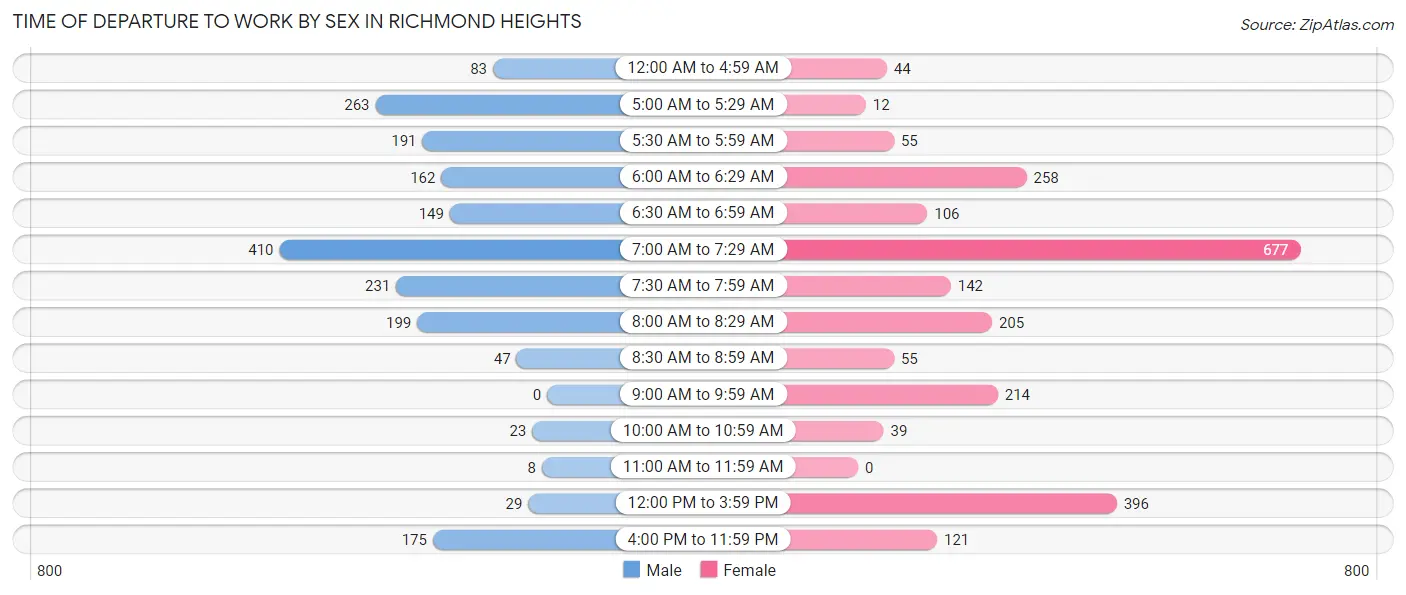
| Time of Departure | Male | Female |
| 12:00 AM to 4:59 AM | 83 (4.2%) | 44 (1.9%) |
| 5:00 AM to 5:29 AM | 263 (13.4%) | 12 (0.5%) |
| 5:30 AM to 5:59 AM | 191 (9.7%) | 55 (2.4%) |
| 6:00 AM to 6:29 AM | 162 (8.2%) | 258 (11.1%) |
| 6:30 AM to 6:59 AM | 149 (7.6%) | 106 (4.6%) |
| 7:00 AM to 7:29 AM | 410 (20.8%) | 677 (29.1%) |
| 7:30 AM to 7:59 AM | 231 (11.7%) | 142 (6.1%) |
| 8:00 AM to 8:29 AM | 199 (10.1%) | 205 (8.8%) |
| 8:30 AM to 8:59 AM | 47 (2.4%) | 55 (2.4%) |
| 9:00 AM to 9:59 AM | 0 (0.0%) | 214 (9.2%) |
| 10:00 AM to 10:59 AM | 23 (1.2%) | 39 (1.7%) |
| 11:00 AM to 11:59 AM | 8 (0.4%) | 0 (0.0%) |
| 12:00 PM to 3:59 PM | 29 (1.5%) | 396 (17.0%) |
| 4:00 PM to 11:59 PM | 175 (8.9%) | 121 (5.2%) |
| Total | 1,970 (100.0%) | 2,324 (100.0%) |
Housing Occupancy in Richmond Heights
Occupancy by Ownership in Richmond Heights
Of the total 2,766 dwellings in Richmond Heights, owner-occupied units account for 1,940 (70.1%), while renter-occupied units make up 826 (29.9%).
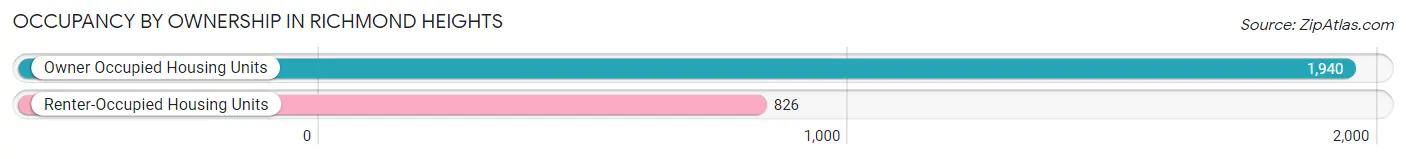
| Occupancy | # Housing Units | % Housing Units |
| Owner Occupied Housing Units | 1,940 | 70.1% |
| Renter-Occupied Housing Units | 826 | 29.9% |
| Total Occupied Housing Units | 2,766 | 100.0% |
Occupancy by Household Size in Richmond Heights
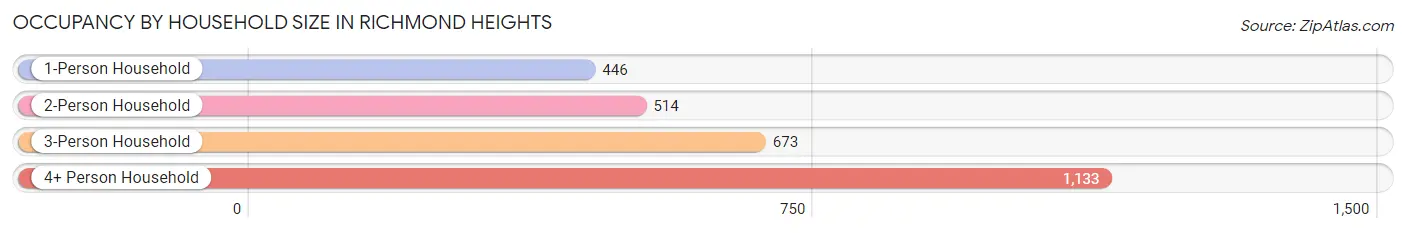
| Household Size | # Housing Units | % Housing Units |
| 1-Person Household | 446 | 16.1% |
| 2-Person Household | 514 | 18.6% |
| 3-Person Household | 673 | 24.3% |
| 4+ Person Household | 1,133 | 41.0% |
| Total Housing Units | 2,766 | 100.0% |
Occupancy by Ownership by Household Size in Richmond Heights
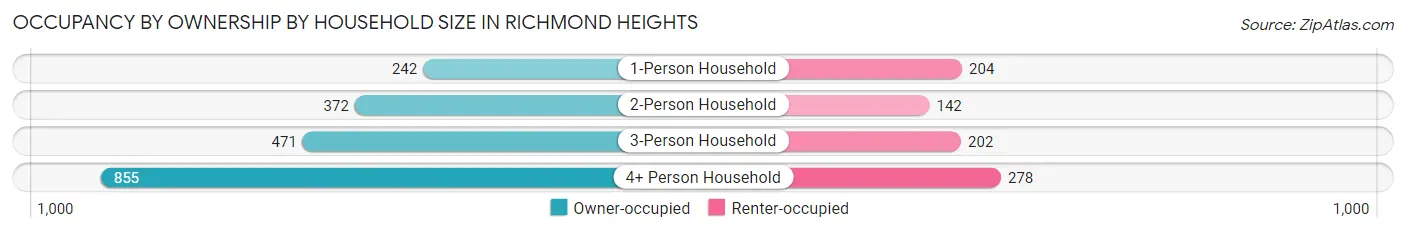
| Household Size | Owner-occupied | Renter-occupied |
| 1-Person Household | 242 (54.3%) | 204 (45.7%) |
| 2-Person Household | 372 (72.4%) | 142 (27.6%) |
| 3-Person Household | 471 (70.0%) | 202 (30.0%) |
| 4+ Person Household | 855 (75.5%) | 278 (24.5%) |
| Total Housing Units | 1,940 (70.1%) | 826 (29.9%) |
Occupancy by Educational Attainment in Richmond Heights
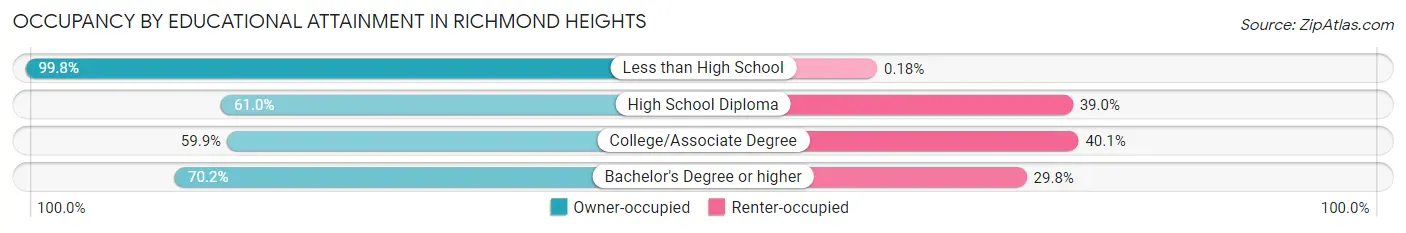
| Household Size | Owner-occupied | Renter-occupied |
| Less than High School | 546 (99.8%) | 1 (0.2%) |
| High School Diploma | 437 (61.0%) | 279 (39.0%) |
| College/Associate Degree | 569 (59.9%) | 381 (40.1%) |
| Bachelor's Degree or higher | 388 (70.2%) | 165 (29.8%) |
Occupancy by Age of Householder in Richmond Heights
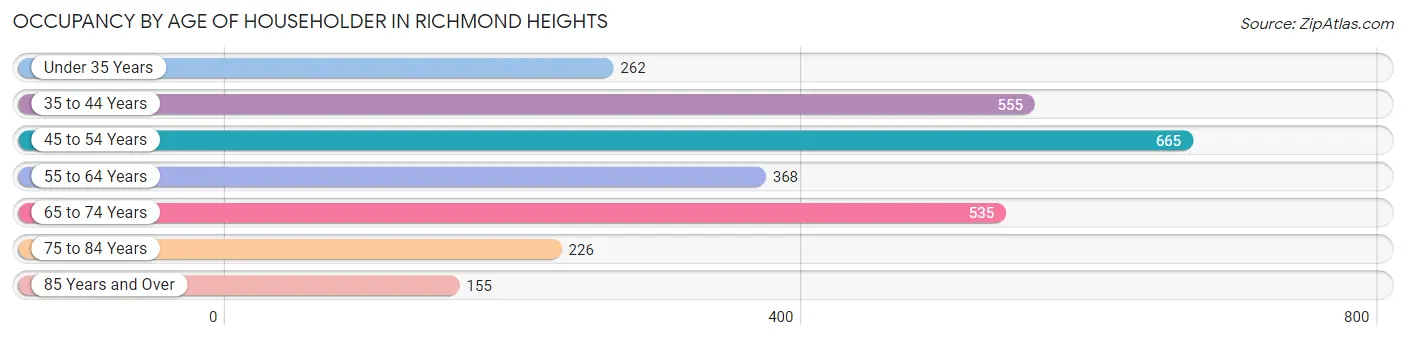
| Age Bracket | # Households | % Households |
| Under 35 Years | 262 | 9.5% |
| 35 to 44 Years | 555 | 20.1% |
| 45 to 54 Years | 665 | 24.0% |
| 55 to 64 Years | 368 | 13.3% |
| 65 to 74 Years | 535 | 19.3% |
| 75 to 84 Years | 226 | 8.2% |
| 85 Years and Over | 155 | 5.6% |
| Total | 2,766 | 100.0% |
Housing Finances in Richmond Heights
Median Income by Occupancy in Richmond Heights
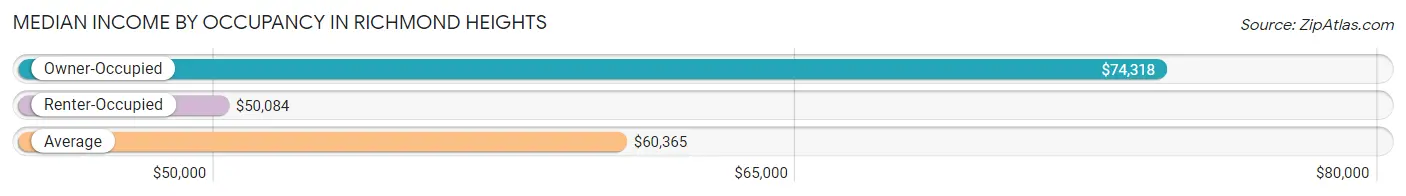
| Occupancy Type | # Households | Median Income |
| Owner-Occupied | 1,940 (70.1%) | $74,318 |
| Renter-Occupied | 826 (29.9%) | $50,084 |
| Average | 2,766 (100.0%) | $60,365 |
Occupancy by Householder Income Bracket in Richmond Heights
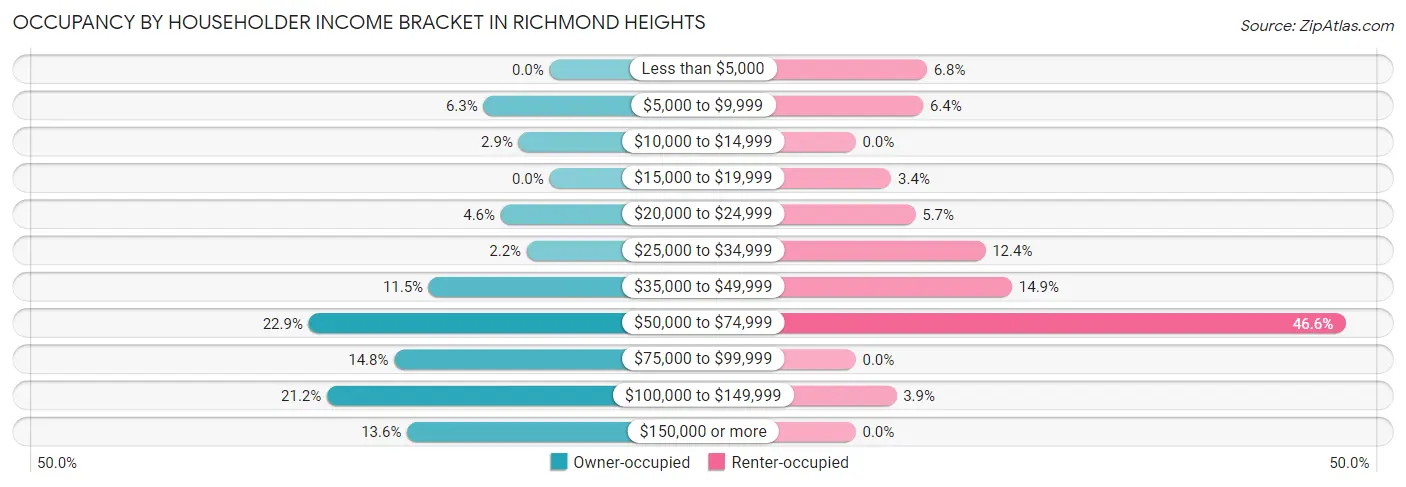
| Income Bracket | Owner-occupied | Renter-occupied |
| Less than $5,000 | 0 (0.0%) | 56 (6.8%) |
| $5,000 to $9,999 | 122 (6.3%) | 53 (6.4%) |
| $10,000 to $14,999 | 57 (2.9%) | 0 (0.0%) |
| $15,000 to $19,999 | 0 (0.0%) | 28 (3.4%) |
| $20,000 to $24,999 | 90 (4.6%) | 47 (5.7%) |
| $25,000 to $34,999 | 42 (2.2%) | 102 (12.3%) |
| $35,000 to $49,999 | 223 (11.5%) | 123 (14.9%) |
| $50,000 to $74,999 | 445 (22.9%) | 385 (46.6%) |
| $75,000 to $99,999 | 287 (14.8%) | 0 (0.0%) |
| $100,000 to $149,999 | 411 (21.2%) | 32 (3.9%) |
| $150,000 or more | 263 (13.6%) | 0 (0.0%) |
| Total | 1,940 (100.0%) | 826 (100.0%) |
Monthly Housing Cost Tiers in Richmond Heights
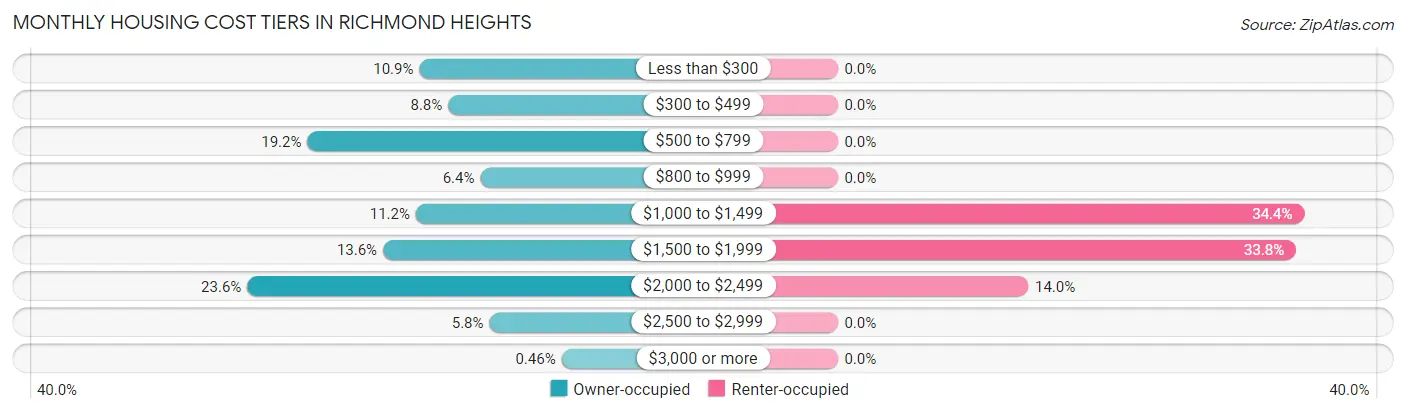
| Monthly Cost | Owner-occupied | Renter-occupied |
| Less than $300 | 212 (10.9%) | 0 (0.0%) |
| $300 to $499 | 171 (8.8%) | 0 (0.0%) |
| $500 to $799 | 372 (19.2%) | 0 (0.0%) |
| $800 to $999 | 125 (6.4%) | 0 (0.0%) |
| $1,000 to $1,499 | 217 (11.2%) | 284 (34.4%) |
| $1,500 to $1,999 | 264 (13.6%) | 279 (33.8%) |
| $2,000 to $2,499 | 458 (23.6%) | 116 (14.0%) |
| $2,500 to $2,999 | 112 (5.8%) | 0 (0.0%) |
| $3,000 or more | 9 (0.5%) | 0 (0.0%) |
| Total | 1,940 (100.0%) | 826 (100.0%) |
Physical Housing Characteristics in Richmond Heights
Housing Structures in Richmond Heights
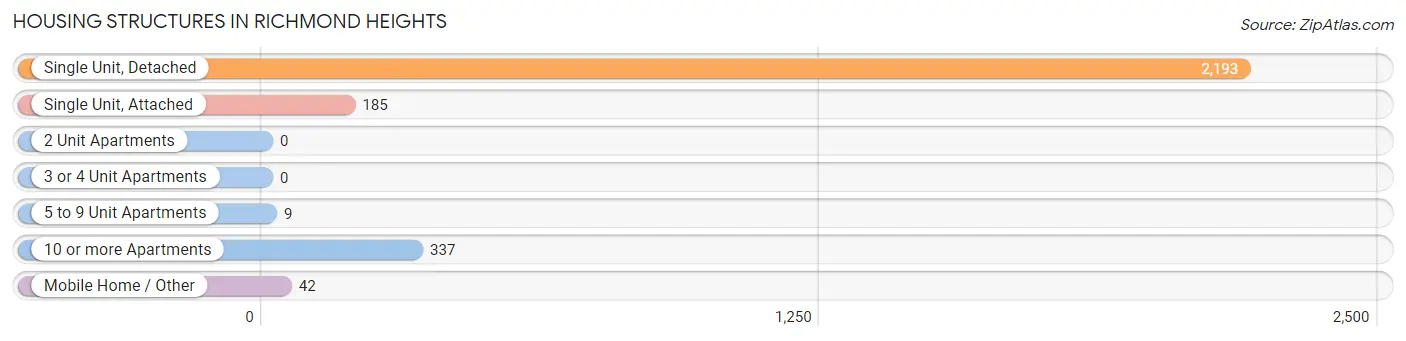
| Structure Type | # Housing Units | % Housing Units |
| Single Unit, Detached | 2,193 | 79.3% |
| Single Unit, Attached | 185 | 6.7% |
| 2 Unit Apartments | 0 | 0.0% |
| 3 or 4 Unit Apartments | 0 | 0.0% |
| 5 to 9 Unit Apartments | 9 | 0.3% |
| 10 or more Apartments | 337 | 12.2% |
| Mobile Home / Other | 42 | 1.5% |
| Total | 2,766 | 100.0% |
Housing Structures by Occupancy in Richmond Heights
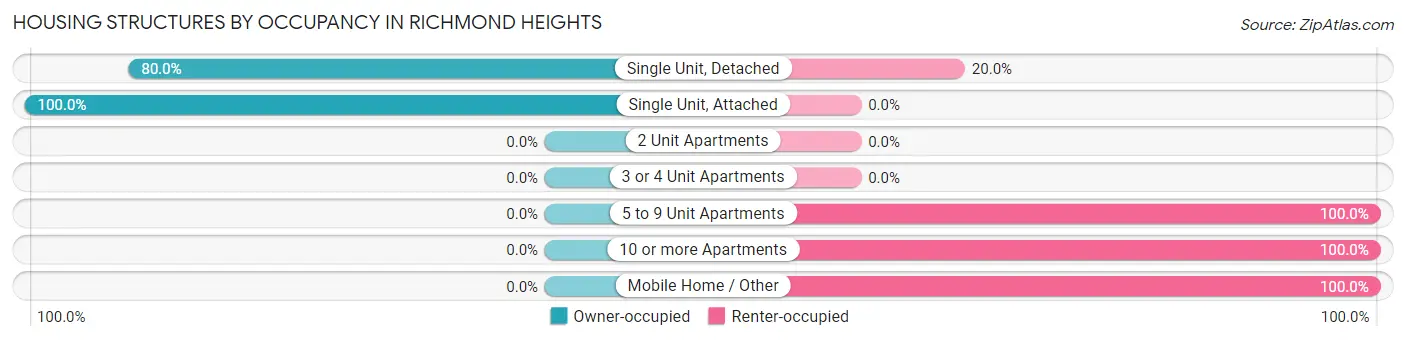
| Structure Type | Owner-occupied | Renter-occupied |
| Single Unit, Detached | 1,755 (80.0%) | 438 (20.0%) |
| Single Unit, Attached | 185 (100.0%) | 0 (0.0%) |
| 2 Unit Apartments | 0 (0.0%) | 0 (0.0%) |
| 3 or 4 Unit Apartments | 0 (0.0%) | 0 (0.0%) |
| 5 to 9 Unit Apartments | 0 (0.0%) | 9 (100.0%) |
| 10 or more Apartments | 0 (0.0%) | 337 (100.0%) |
| Mobile Home / Other | 0 (0.0%) | 42 (100.0%) |
| Total | 1,940 (70.1%) | 826 (29.9%) |
Housing Structures by Number of Rooms in Richmond Heights
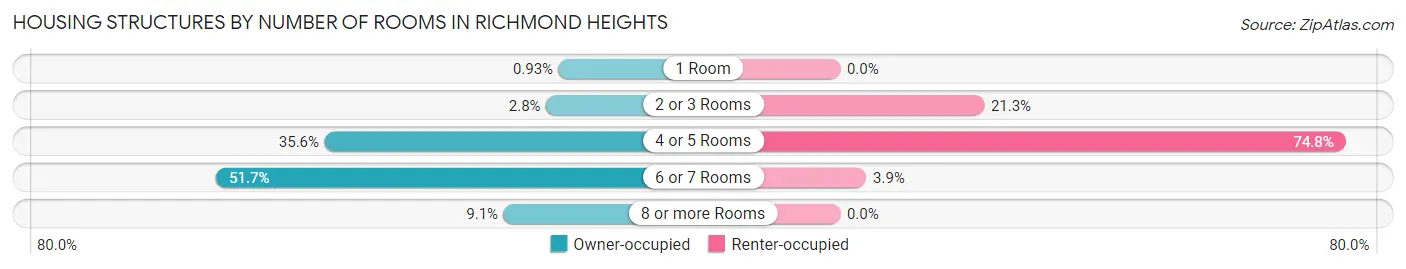
| Number of Rooms | Owner-occupied | Renter-occupied |
| 1 Room | 18 (0.9%) | 0 (0.0%) |
| 2 or 3 Rooms | 54 (2.8%) | 176 (21.3%) |
| 4 or 5 Rooms | 690 (35.6%) | 618 (74.8%) |
| 6 or 7 Rooms | 1,002 (51.6%) | 32 (3.9%) |
| 8 or more Rooms | 176 (9.1%) | 0 (0.0%) |
| Total | 1,940 (100.0%) | 826 (100.0%) |
Housing Structure by Heating Type in Richmond Heights
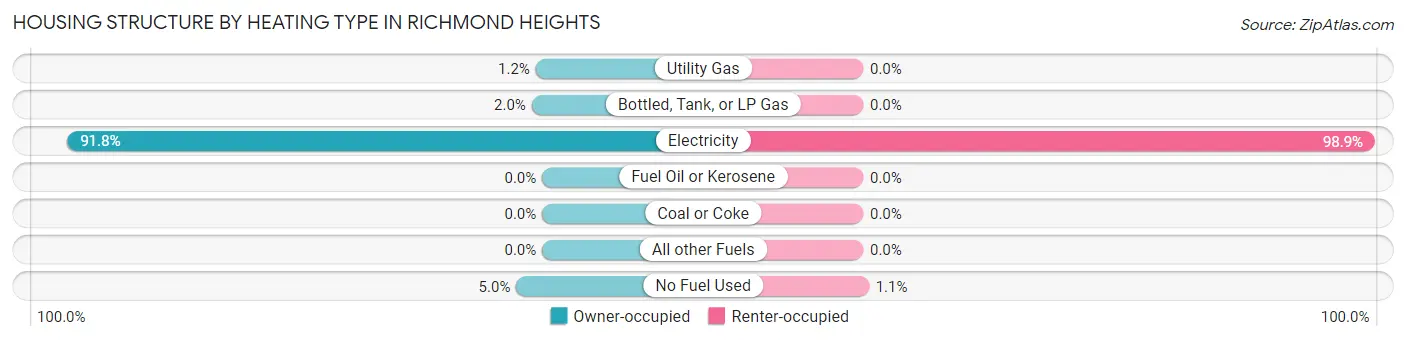
| Heating Type | Owner-occupied | Renter-occupied |
| Utility Gas | 24 (1.2%) | 0 (0.0%) |
| Bottled, Tank, or LP Gas | 39 (2.0%) | 0 (0.0%) |
| Electricity | 1,780 (91.7%) | 817 (98.9%) |
| Fuel Oil or Kerosene | 0 (0.0%) | 0 (0.0%) |
| Coal or Coke | 0 (0.0%) | 0 (0.0%) |
| All other Fuels | 0 (0.0%) | 0 (0.0%) |
| No Fuel Used | 97 (5.0%) | 9 (1.1%) |
| Total | 1,940 (100.0%) | 826 (100.0%) |
Household Vehicle Usage in Richmond Heights
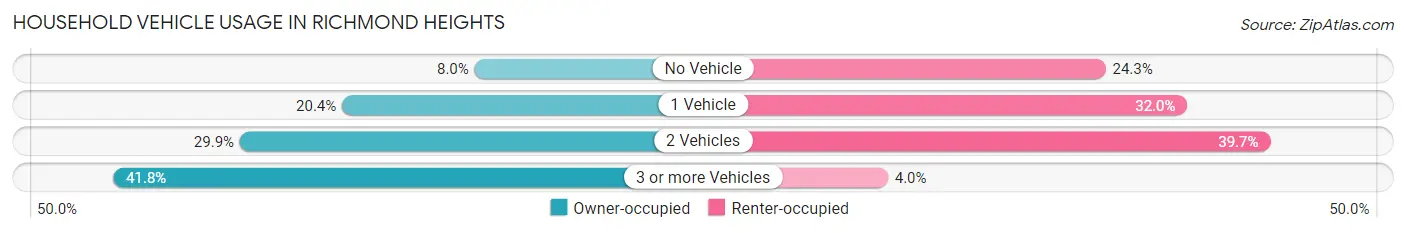
| Vehicles per Household | Owner-occupied | Renter-occupied |
| No Vehicle | 155 (8.0%) | 201 (24.3%) |
| 1 Vehicle | 395 (20.4%) | 264 (32.0%) |
| 2 Vehicles | 580 (29.9%) | 328 (39.7%) |
| 3 or more Vehicles | 810 (41.7%) | 33 (4.0%) |
| Total | 1,940 (100.0%) | 826 (100.0%) |
Real Estate & Mortgages in Richmond Heights
Real Estate and Mortgage Overview in Richmond Heights
| Characteristic | Without Mortgage | With Mortgage |
| Housing Units | 768 | 1,172 |
| Median Property Value | $276,900 | $311,900 |
| Median Household Income | $58,140 | $223 |
| Monthly Housing Costs | $522 | $9 |
| Real Estate Taxes | $1,698 | $52 |
Property Value by Mortgage Status in Richmond Heights
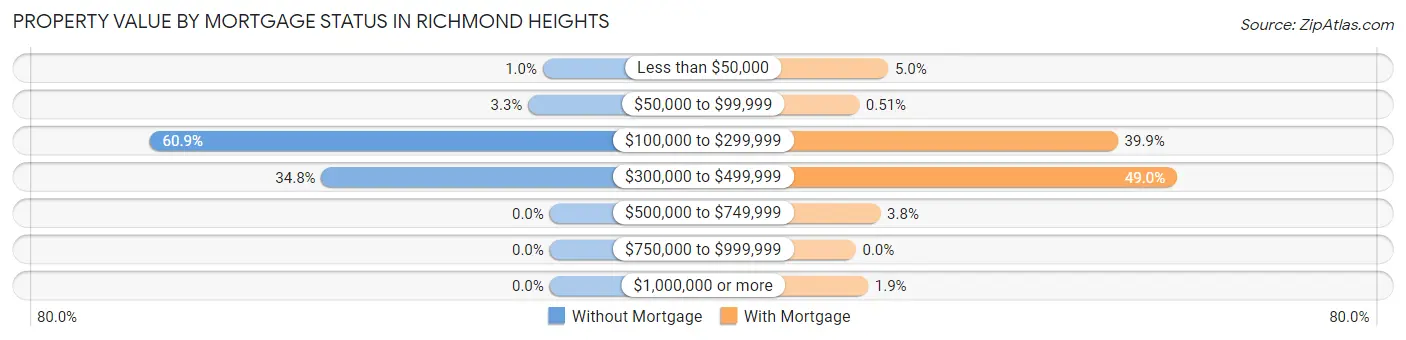
| Property Value | Without Mortgage | With Mortgage |
| Less than $50,000 | 8 (1.0%) | 58 (5.0%) |
| $50,000 to $99,999 | 25 (3.3%) | 6 (0.5%) |
| $100,000 to $299,999 | 468 (60.9%) | 468 (39.9%) |
| $300,000 to $499,999 | 267 (34.8%) | 574 (49.0%) |
| $500,000 to $749,999 | 0 (0.0%) | 44 (3.7%) |
| $750,000 to $999,999 | 0 (0.0%) | 0 (0.0%) |
| $1,000,000 or more | 0 (0.0%) | 22 (1.9%) |
| Total | 768 (100.0%) | 1,172 (100.0%) |
Household Income by Mortgage Status in Richmond Heights
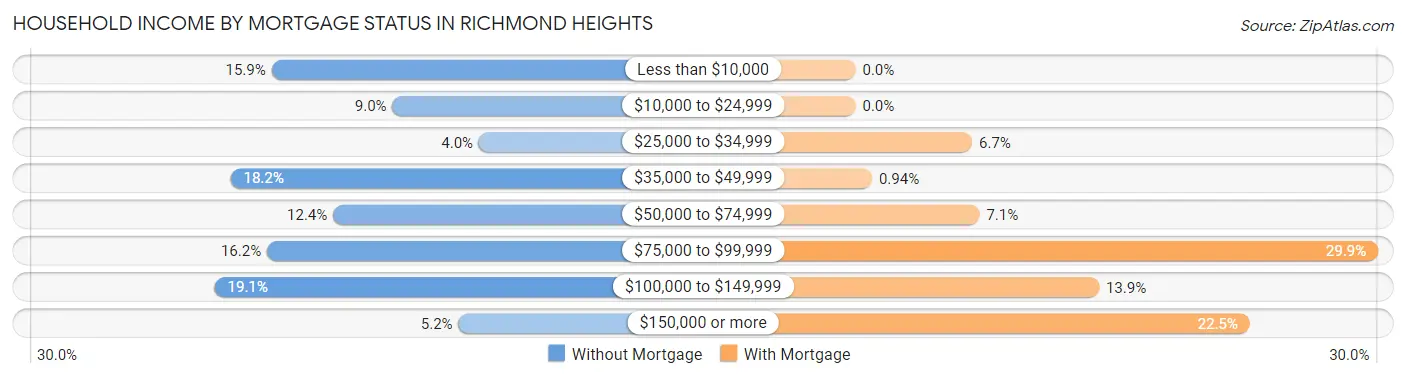
| Household Income | Without Mortgage | With Mortgage |
| Less than $10,000 | 122 (15.9%) | 0 (0.0%) |
| $10,000 to $24,999 | 69 (9.0%) | 0 (0.0%) |
| $25,000 to $34,999 | 31 (4.0%) | 78 (6.7%) |
| $35,000 to $49,999 | 140 (18.2%) | 11 (0.9%) |
| $50,000 to $74,999 | 95 (12.4%) | 83 (7.1%) |
| $75,000 to $99,999 | 124 (16.2%) | 350 (29.9%) |
| $100,000 to $149,999 | 147 (19.1%) | 163 (13.9%) |
| $150,000 or more | 40 (5.2%) | 264 (22.5%) |
| Total | 768 (100.0%) | 1,172 (100.0%) |
Property Value to Household Income Ratio in Richmond Heights
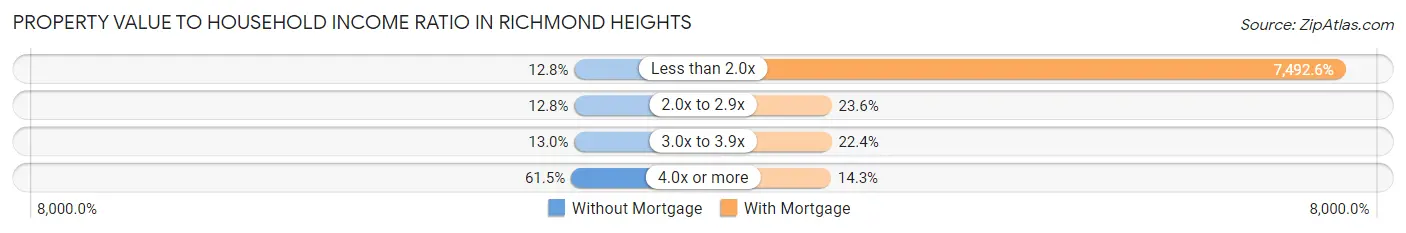
| Value-to-Income Ratio | Without Mortgage | With Mortgage |
| Less than 2.0x | 98 (12.8%) | 87,813 (7,492.6%) |
| 2.0x to 2.9x | 98 (12.8%) | 277 (23.6%) |
| 3.0x to 3.9x | 100 (13.0%) | 263 (22.4%) |
| 4.0x or more | 472 (61.5%) | 168 (14.3%) |
| Total | 768 (100.0%) | 1,172 (100.0%) |
Real Estate Taxes by Mortgage Status in Richmond Heights
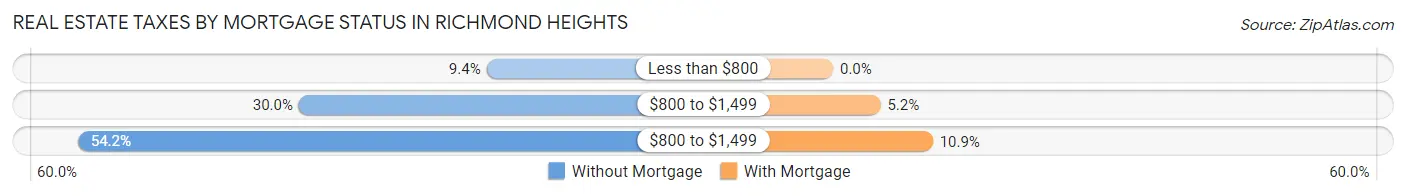
| Property Taxes | Without Mortgage | With Mortgage |
| Less than $800 | 72 (9.4%) | 0 (0.0%) |
| $800 to $1,499 | 230 (29.9%) | 61 (5.2%) |
| $800 to $1,499 | 416 (54.2%) | 128 (10.9%) |
| Total | 768 (100.0%) | 1,172 (100.0%) |
Health & Disability in Richmond Heights
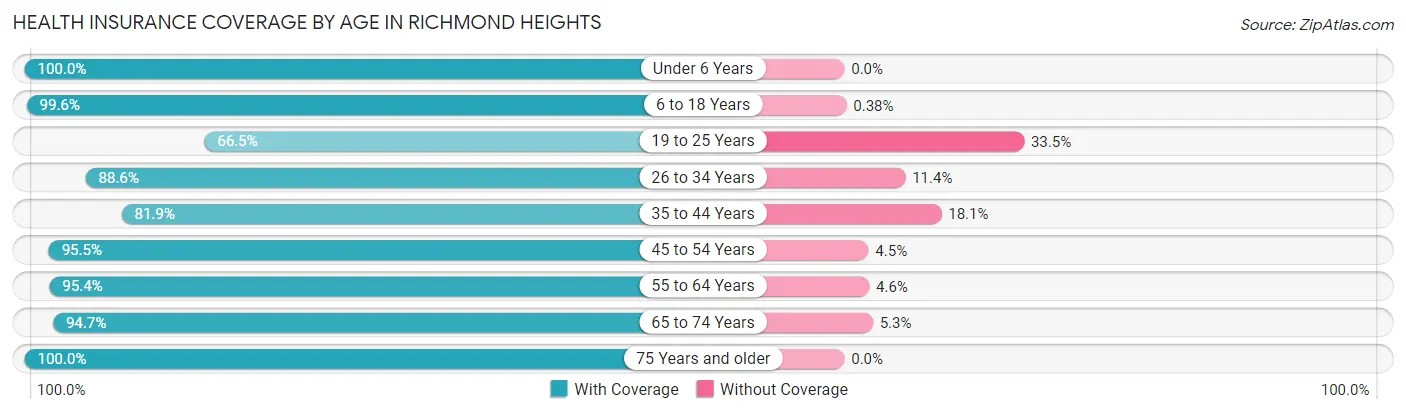
Health Insurance Coverage by Age in Richmond Heights
| Age Bracket | With Coverage | Without Coverage |
| Under 6 Years | 710 (100.0%) | 0 (0.0%) |
| 6 to 18 Years | 1,321 (99.6%) | 5 (0.4%) |
| 19 to 25 Years | 629 (66.5%) | 317 (33.5%) |
| 26 to 34 Years | 1,053 (88.6%) | 135 (11.4%) |
| 35 to 44 Years | 1,331 (81.9%) | 294 (18.1%) |
| 45 to 54 Years | 1,232 (95.5%) | 58 (4.5%) |
| 55 to 64 Years | 969 (95.4%) | 47 (4.6%) |
| 65 to 74 Years | 751 (94.7%) | 42 (5.3%) |
| 75 Years and older | 766 (100.0%) | 0 (0.0%) |
| Total | 8,762 (90.7%) | 898 (9.3%) |
Health Insurance Coverage by Citizenship Status in Richmond Heights
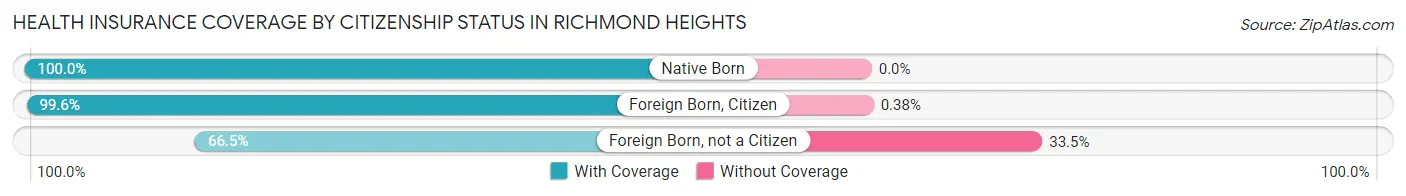
| Citizenship Status | With Coverage | Without Coverage |
| Native Born | 710 (100.0%) | 0 (0.0%) |
| Foreign Born, Citizen | 1,321 (99.6%) | 5 (0.4%) |
| Foreign Born, not a Citizen | 629 (66.5%) | 317 (33.5%) |
Health Insurance Coverage by Household Income in Richmond Heights
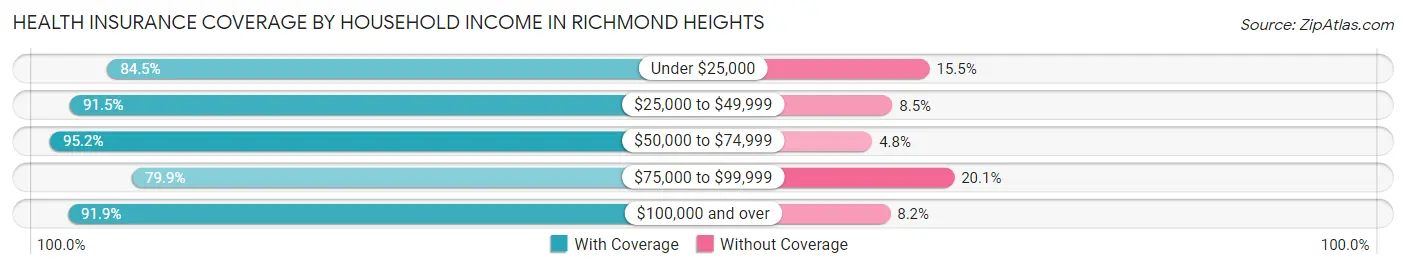
| Household Income | With Coverage | Without Coverage |
| Under $25,000 | 877 (84.5%) | 161 (15.5%) |
| $25,000 to $49,999 | 1,200 (91.5%) | 112 (8.5%) |
| $50,000 to $74,999 | 2,878 (95.2%) | 144 (4.8%) |
| $75,000 to $99,999 | 877 (79.9%) | 221 (20.1%) |
| $100,000 and over | 2,918 (91.8%) | 259 (8.2%) |
Public vs Private Health Insurance Coverage by Age in Richmond Heights
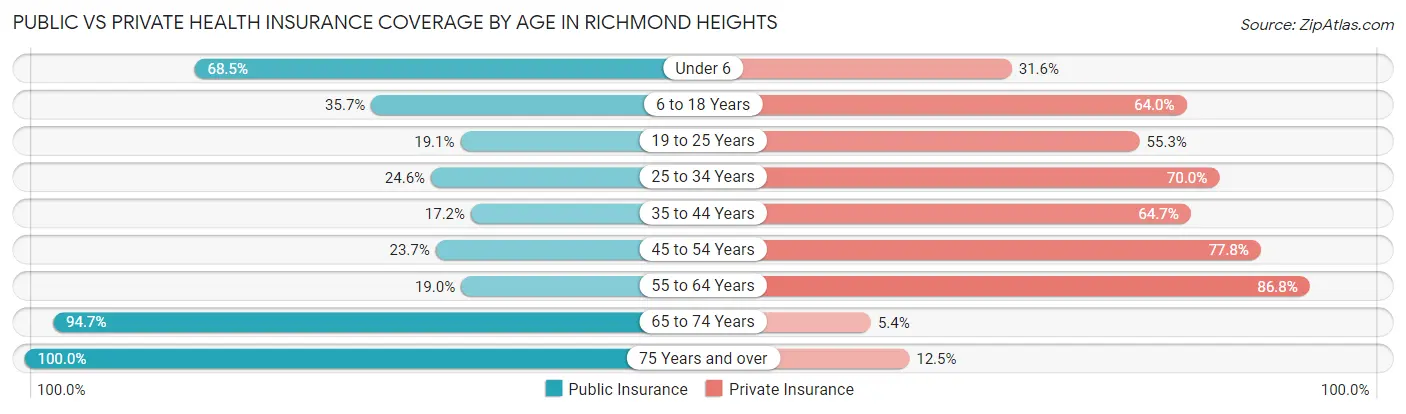
| Age Bracket | Public Insurance | Private Insurance |
| Under 6 | 486 (68.4%) | 224 (31.6%) |
| 6 to 18 Years | 473 (35.7%) | 848 (63.9%) |
| 19 to 25 Years | 181 (19.1%) | 523 (55.3%) |
| 25 to 34 Years | 292 (24.6%) | 832 (70.0%) |
| 35 to 44 Years | 279 (17.2%) | 1,052 (64.7%) |
| 45 to 54 Years | 306 (23.7%) | 1,003 (77.7%) |
| 55 to 64 Years | 193 (19.0%) | 882 (86.8%) |
| 65 to 74 Years | 751 (94.7%) | 43 (5.4%) |
| 75 Years and over | 766 (100.0%) | 96 (12.5%) |
| Total | 3,727 (38.6%) | 5,503 (57.0%) |
Disability Status by Sex by Age in Richmond Heights
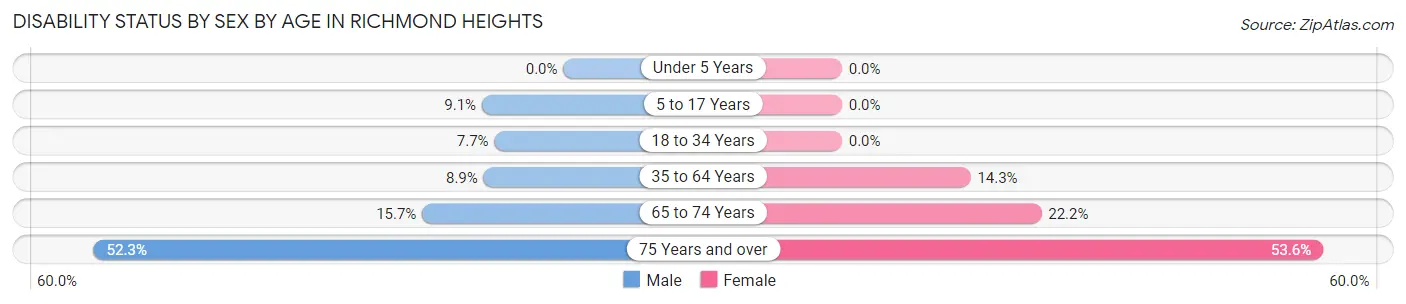
| Age Bracket | Male | Female |
| Under 5 Years | 0 (0.0%) | 0 (0.0%) |
| 5 to 17 Years | 71 (9.1%) | 0 (0.0%) |
| 18 to 34 Years | 73 (7.7%) | 0 (0.0%) |
| 35 to 64 Years | 162 (8.9%) | 302 (14.3%) |
| 65 to 74 Years | 61 (15.7%) | 90 (22.2%) |
| 75 Years and over | 102 (52.3%) | 306 (53.6%) |
Disability Class by Sex by Age in Richmond Heights
Disability Class: Hearing Difficulty
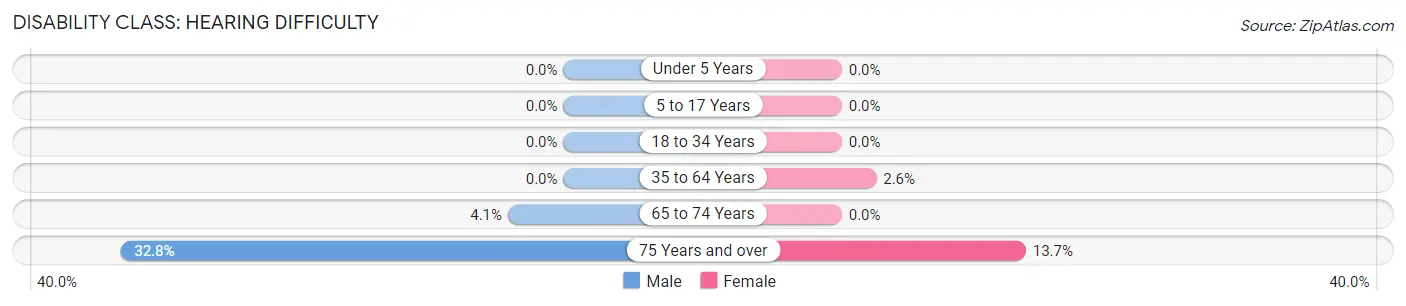
| Age Bracket | Male | Female |
| Under 5 Years | 0 (0.0%) | 0 (0.0%) |
| 5 to 17 Years | 0 (0.0%) | 0 (0.0%) |
| 18 to 34 Years | 0 (0.0%) | 0 (0.0%) |
| 35 to 64 Years | 0 (0.0%) | 54 (2.6%) |
| 65 to 74 Years | 16 (4.1%) | 0 (0.0%) |
| 75 Years and over | 64 (32.8%) | 78 (13.7%) |
Disability Class: Vision Difficulty
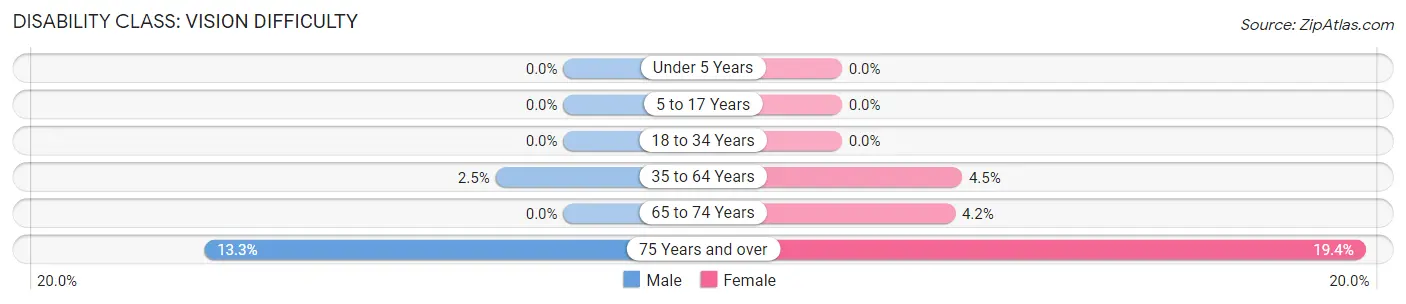
| Age Bracket | Male | Female |
| Under 5 Years | 0 (0.0%) | 0 (0.0%) |
| 5 to 17 Years | 0 (0.0%) | 0 (0.0%) |
| 18 to 34 Years | 0 (0.0%) | 0 (0.0%) |
| 35 to 64 Years | 46 (2.5%) | 94 (4.5%) |
| 65 to 74 Years | 0 (0.0%) | 17 (4.2%) |
| 75 Years and over | 26 (13.3%) | 111 (19.4%) |
Disability Class: Cognitive Difficulty
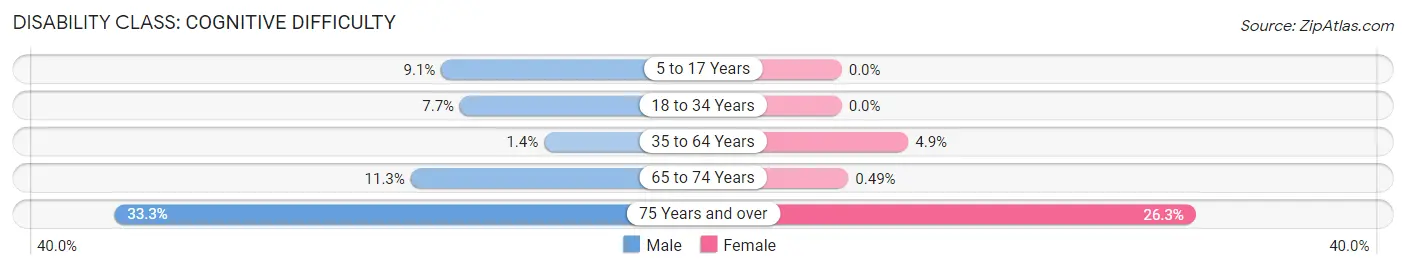
| Age Bracket | Male | Female |
| 5 to 17 Years | 71 (9.1%) | 0 (0.0%) |
| 18 to 34 Years | 73 (7.7%) | 0 (0.0%) |
| 35 to 64 Years | 26 (1.4%) | 104 (4.9%) |
| 65 to 74 Years | 44 (11.3%) | 2 (0.5%) |
| 75 Years and over | 65 (33.3%) | 150 (26.3%) |
Disability Class: Ambulatory Difficulty
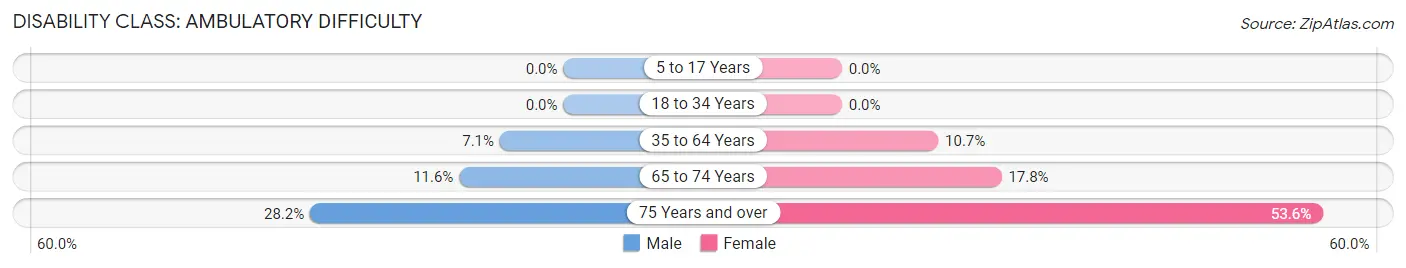
| Age Bracket | Male | Female |
| 5 to 17 Years | 0 (0.0%) | 0 (0.0%) |
| 18 to 34 Years | 0 (0.0%) | 0 (0.0%) |
| 35 to 64 Years | 129 (7.1%) | 226 (10.7%) |
| 65 to 74 Years | 45 (11.6%) | 72 (17.8%) |
| 75 Years and over | 55 (28.2%) | 306 (53.6%) |
Disability Class: Self-Care Difficulty
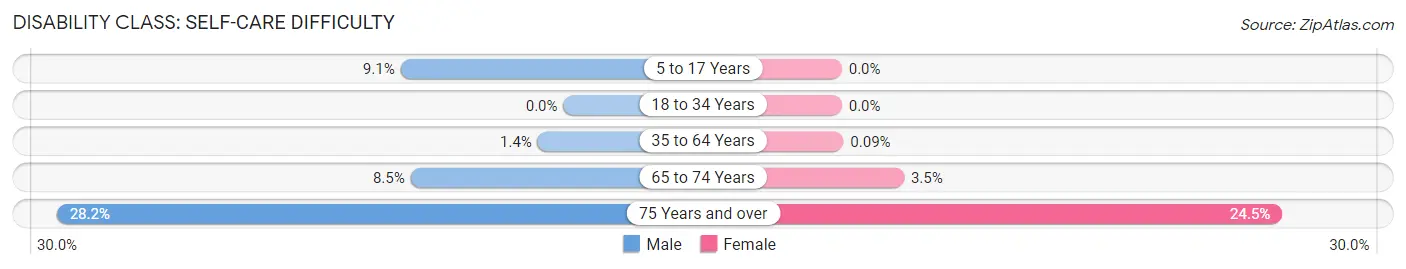
| Age Bracket | Male | Female |
| 5 to 17 Years | 71 (9.1%) | 0 (0.0%) |
| 18 to 34 Years | 0 (0.0%) | 0 (0.0%) |
| 35 to 64 Years | 26 (1.4%) | 2 (0.1%) |
| 65 to 74 Years | 33 (8.5%) | 14 (3.5%) |
| 75 Years and over | 55 (28.2%) | 140 (24.5%) |
Technology Access in Richmond Heights
Computing Device Access in Richmond Heights
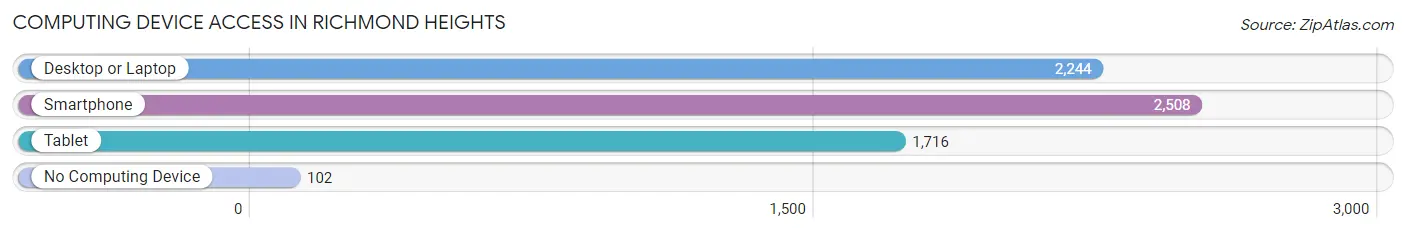
| Device Type | # Households | % Households |
| Desktop or Laptop | 2,244 | 81.1% |
| Smartphone | 2,508 | 90.7% |
| Tablet | 1,716 | 62.0% |
| No Computing Device | 102 | 3.7% |
| Total | 2,766 | 100.0% |
Internet Access in Richmond Heights
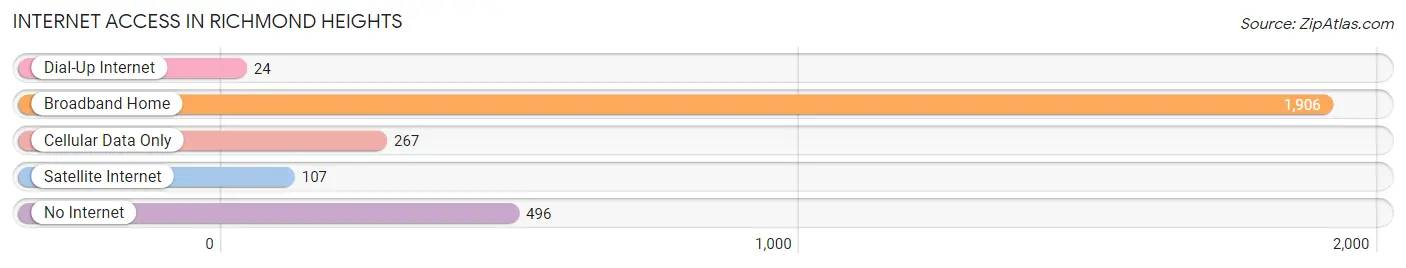
| Internet Type | # Households | % Households |
| Dial-Up Internet | 24 | 0.9% |
| Broadband Home | 1,906 | 68.9% |
| Cellular Data Only | 267 | 9.7% |
| Satellite Internet | 107 | 3.9% |
| No Internet | 496 | 17.9% |
| Total | 2,766 | 100.0% |
Richmond Heights Summary
Richmond Heights is a census-designated place (CDP) located in Miami-Dade County, Florida, United States. The population was 15,717 at the 2010 census. It is part of the Miami metropolitan area, which was home to an estimated 6,012,331 people in 2015.
History
Richmond Heights was originally part of the Richmond district, which was established in the early 1900s. The area was named after the Richmond family, who owned a large tract of land in the area. The Richmond family sold the land to developers in the 1950s, and the area was incorporated as the Town of Richmond Heights in 1957. The town was annexed by the City of Miami in 1961.
Geography
Richmond Heights is located at 25°41'25" North, 80°17'45" West (25.690278, -80.295833). According to the United States Census Bureau, the CDP has a total area of 2.3 square miles (6.0 km2), all land.
Economy
Richmond Heights is home to a variety of businesses, including retail stores, restaurants, and professional services. The area is also home to several industrial parks, which provide employment opportunities for local residents.
Demographics
As of the 2010 census, there were 15,717 people, 5,845 households, and 3,845 families residing in the CDP. The population density was 6,845.3 people per square mile (2,639.2/km2). There were 6,541 housing units at an average density of 2,845.3/sq mi (1,098.7/km2). The racial makeup of the CDP was 57.2% White (non-Hispanic), 28.2% African American, 0.3% Native American, 1.2% Asian, 0.1% Pacific Islander, 10.2% from other races, and 2.9% from two or more races. Hispanic or Latino of any race were 33.2% of the population.
There were 5,845 households, out of which 33.2% had children under the age of 18 living with them, 37.2% were married couples living together, 20.2% had a female householder with no husband present, and 33.7% were non-families. 27.2% of all households were made up of individuals, and 8.3% had someone living alone who was 65 years of age or older. The average household size was 2.68 and the average family size was 3.27.
In the CDP, the population was spread out, with 25.7% under the age of 18, 10.2% from 18 to 24, 30.2% from 25 to 44, 22.3% from 45 to 64, and 11.6% who were 65 years of age or older. The median age was 34 years. For every 100 females, there were 94.2 males. For every 100 females age 18 and over, there were 90.3 males.
The median income for a household in the CDP was $30,945, and the median income for a family was $35,945. Males had a median income of $25,945 versus $21,945 for females. The per capita income for the CDP was $14,945. About 16.2% of families and 19.2% of the population were below the poverty line, including 25.2% of those under age 18 and 16.2% of those age 65 or over.
Common Questions
What is Per Capita Income in Richmond Heights?
Per Capita income in Richmond Heights is $28,559.
What is the Median Family Income in Richmond Heights?
Median Family Income in Richmond Heights is $62,009.
What is the Median Household income in Richmond Heights?
Median Household Income in Richmond Heights is $60,365.
What is Income or Wage Gap in Richmond Heights?
Income or Wage Gap in Richmond Heights is 32.7%.
Women in Richmond Heights earn 67.3 cents for every dollar earned by a man.
What is Inequality or Gini Index in Richmond Heights?
Inequality or Gini Index in Richmond Heights is 0.50.
What is the Total Population of Richmond Heights?
Total Population of Richmond Heights is 9,863.
What is the Total Male Population of Richmond Heights?
Total Male Population of Richmond Heights is 4,448.
What is the Total Female Population of Richmond Heights?
Total Female Population of Richmond Heights is 5,415.
What is the Ratio of Males per 100 Females in Richmond Heights?
There are 82.14 Males per 100 Females in Richmond Heights.
What is the Ratio of Females per 100 Males in Richmond Heights?
There are 121.74 Females per 100 Males in Richmond Heights.
What is the Median Population Age in Richmond Heights?
Median Population Age in Richmond Heights is 39.4 Years.
What is the Average Family Size in Richmond Heights
Average Family Size in Richmond Heights is 3.9 People.
What is the Average Household Size in Richmond Heights
Average Household Size in Richmond Heights is 3.5 People.
How Large is the Labor Force in Richmond Heights?
There are 4,764 People in the Labor Forcein in Richmond Heights.
What is the Percentage of People in the Labor Force in Richmond Heights?
58.1% of People are in the Labor Force in Richmond Heights.
What is the Unemployment Rate in Richmond Heights?
Unemployment Rate in Richmond Heights is 5.6%.