Opa Locka, FL Map & Demographics
Opa Locka Map
Opa Locka Overview
$18,108
PER CAPITA INCOME
$42,308
AVG FAMILY INCOME
$30,101
AVG HOUSEHOLD INCOME
2.8%
WAGE / INCOME GAP [ % ]
97.2¢/ $1
WAGE / INCOME GAP [ $ ]
$11,182
FAMILY INCOME DEFICIT
0.47
INEQUALITY / GINI INDEX
16,230
TOTAL POPULATION
8,388
MALE POPULATION
7,842
FEMALE POPULATION
106.96
MALES / 100 FEMALES
93.49
FEMALES / 100 MALES
35.0
MEDIAN AGE
3.3
AVG FAMILY SIZE
2.6
AVG HOUSEHOLD SIZE
7,363
LABOR FORCE [ PEOPLE ]
57.3%
PERCENT IN LABOR FORCE
5.2%
UNEMPLOYMENT RATE
Income in Opa Locka
Income Overview in Opa Locka
Per Capita Income in Opa Locka is $18,108, while median incomes of families and households are $42,308 and $30,101 respectively.
| Characteristic | Number | Measure |
| Per Capita Income | 16,230 | $18,108 |
| Median Family Income | 3,990 | $42,308 |
| Mean Family Income | 3,990 | $56,067 |
| Median Household Income | 6,231 | $30,101 |
| Mean Household Income | 6,231 | $45,034 |
| Income Deficit | 3,990 | $11,182 |
| Wage / Income Gap (%) | 16,230 | 2.78% |
| Wage / Income Gap ($) | 16,230 | 97.22¢ per $1 |
| Gini / Inequality Index | 16,230 | 0.47 |
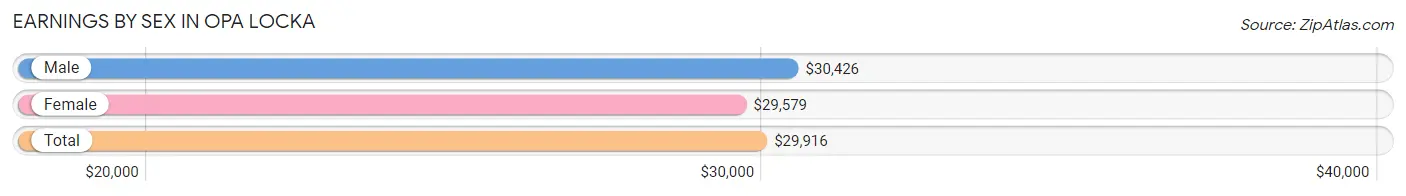
Earnings by Sex in Opa Locka
Average Earnings in Opa Locka are $29,916, $30,426 for men and $29,579 for women, a difference of 2.8%.
| Sex | Number | Average Earnings |
| Male | 4,192 (56.9%) | $30,426 |
| Female | 3,179 (43.1%) | $29,579 |
| Total | 7,371 (100.0%) | $29,916 |
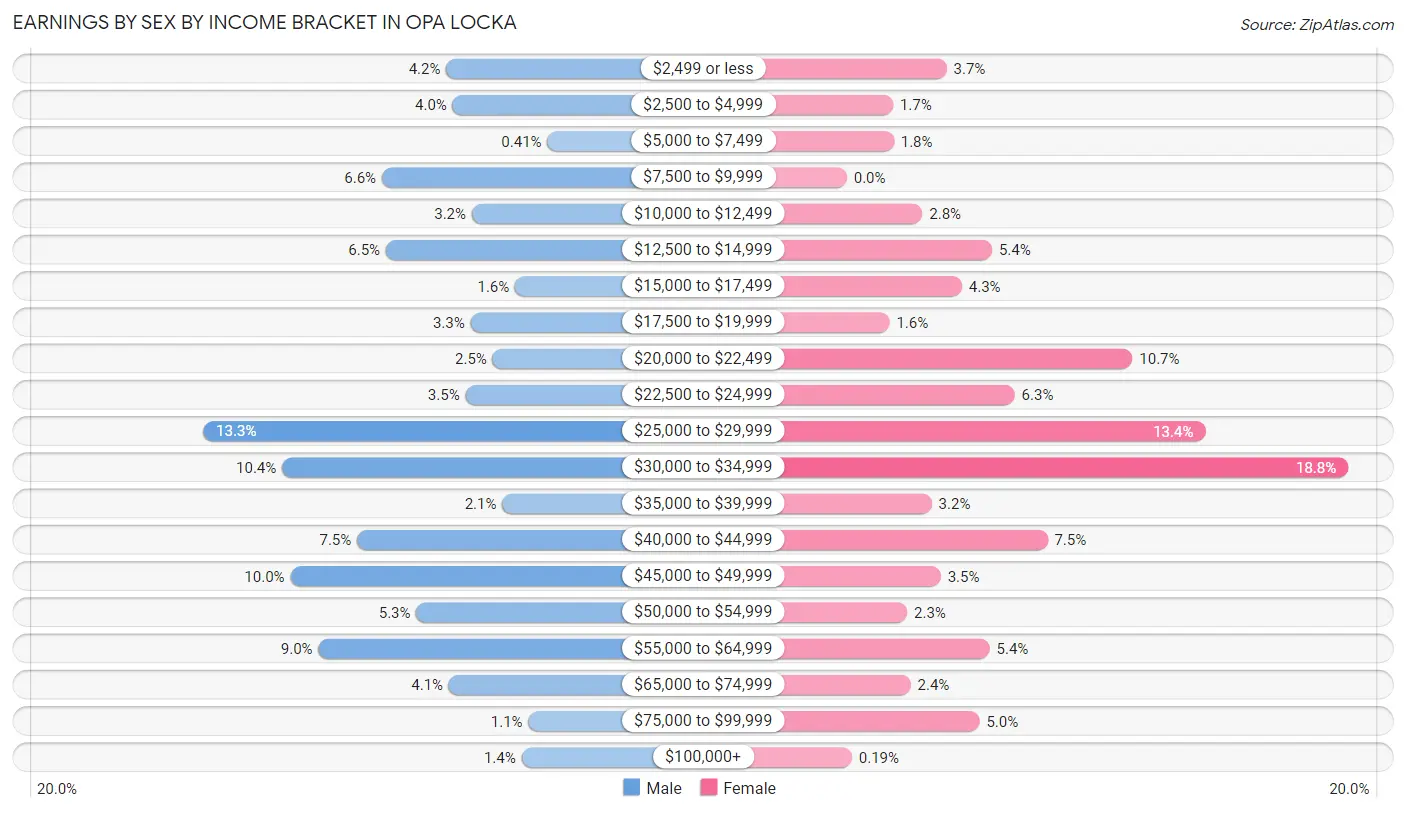
Earnings by Sex by Income Bracket in Opa Locka
The most common earnings brackets in Opa Locka are $25,000 to $29,999 for men (558 | 13.3%) and $30,000 to $34,999 for women (597 | 18.8%).
| Income | Male | Female |
| $2,499 or less | 176 (4.2%) | 119 (3.7%) |
| $2,500 to $4,999 | 166 (4.0%) | 55 (1.7%) |
| $5,000 to $7,499 | 17 (0.4%) | 56 (1.8%) |
| $7,500 to $9,999 | 277 (6.6%) | 0 (0.0%) |
| $10,000 to $12,499 | 136 (3.2%) | 90 (2.8%) |
| $12,500 to $14,999 | 271 (6.5%) | 173 (5.4%) |
| $15,000 to $17,499 | 68 (1.6%) | 137 (4.3%) |
| $17,500 to $19,999 | 138 (3.3%) | 51 (1.6%) |
| $20,000 to $22,499 | 103 (2.5%) | 340 (10.7%) |
| $22,500 to $24,999 | 146 (3.5%) | 200 (6.3%) |
| $25,000 to $29,999 | 558 (13.3%) | 427 (13.4%) |
| $30,000 to $34,999 | 434 (10.3%) | 597 (18.8%) |
| $35,000 to $39,999 | 88 (2.1%) | 101 (3.2%) |
| $40,000 to $44,999 | 316 (7.5%) | 239 (7.5%) |
| $45,000 to $49,999 | 421 (10.0%) | 112 (3.5%) |
| $50,000 to $54,999 | 223 (5.3%) | 72 (2.3%) |
| $55,000 to $64,999 | 377 (9.0%) | 170 (5.3%) |
| $65,000 to $74,999 | 172 (4.1%) | 76 (2.4%) |
| $75,000 to $99,999 | 47 (1.1%) | 158 (5.0%) |
| $100,000+ | 58 (1.4%) | 6 (0.2%) |
| Total | 4,192 (100.0%) | 3,179 (100.0%) |
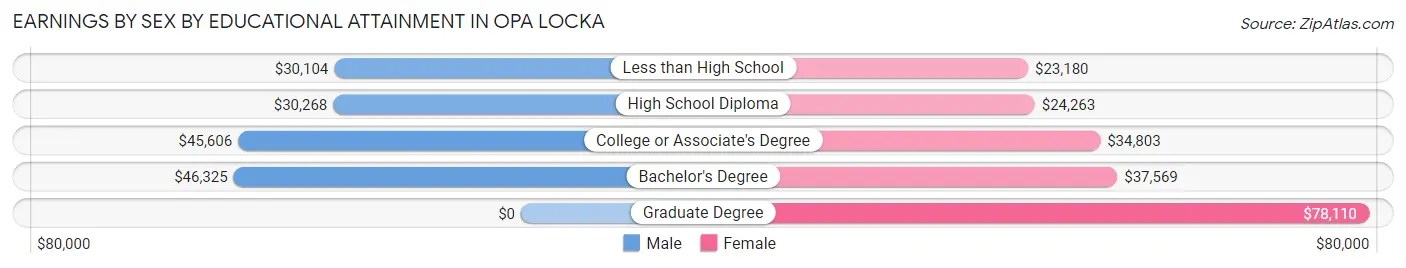
Earnings by Sex by Educational Attainment in Opa Locka
Average earnings in Opa Locka are $32,196 for men and $30,737 for women, a difference of 4.5%. Men with an educational attainment of bachelor's degree enjoy the highest average annual earnings of $46,325, while those with less than high school education earn the least with $30,104. Women with an educational attainment of graduate degree earn the most with the average annual earnings of $78,110, while those with less than high school education have the smallest earnings of $23,180.
| Educational Attainment | Male Income | Female Income |
| Less than High School | $30,104 | $23,180 |
| High School Diploma | $30,268 | $24,263 |
| College or Associate's Degree | $45,606 | $34,803 |
| Bachelor's Degree | $46,325 | $37,569 |
| Graduate Degree | - | - |
| Total | $32,196 | $30,737 |
Family Income in Opa Locka
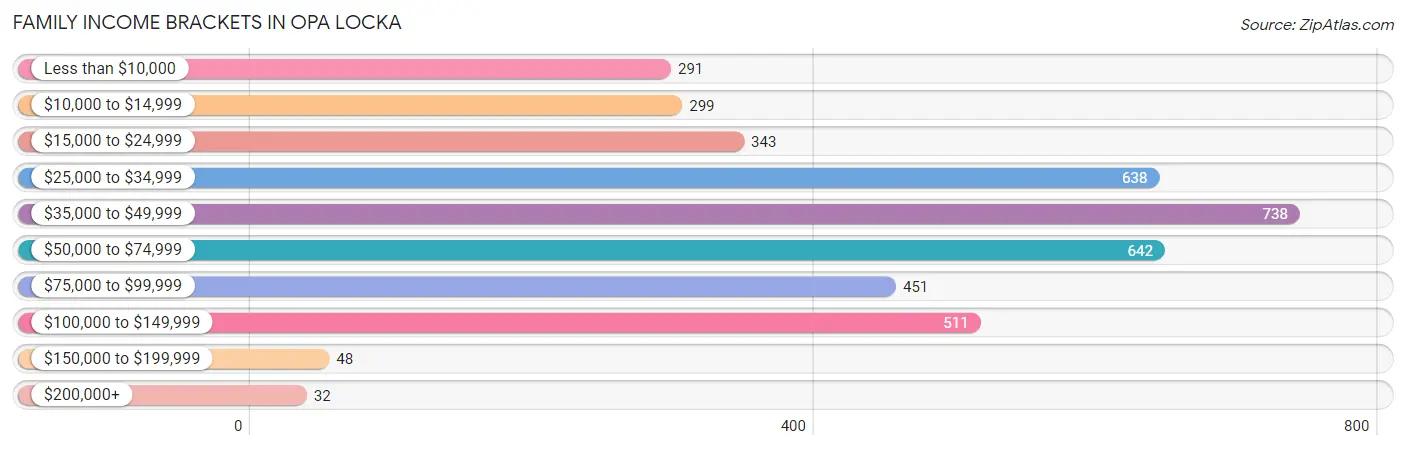
Family Income Brackets in Opa Locka
According to the Opa Locka family income data, there are 738 families falling into the $35,000 to $49,999 income range, which is the most common income bracket and makes up 18.5% of all families. Conversely, the $200,000+ income bracket is the least frequent group with only 32 families (0.8%) belonging to this category.
| Income Bracket | # Families | % Families |
| Less than $10,000 | 291 | 7.3% |
| $10,000 to $14,999 | 299 | 7.5% |
| $15,000 to $24,999 | 343 | 8.6% |
| $25,000 to $34,999 | 638 | 16.0% |
| $35,000 to $49,999 | 738 | 18.5% |
| $50,000 to $74,999 | 642 | 16.1% |
| $75,000 to $99,999 | 451 | 11.3% |
| $100,000 to $149,999 | 511 | 12.8% |
| $150,000 to $199,999 | 48 | 1.2% |
| $200,000+ | 32 | 0.8% |
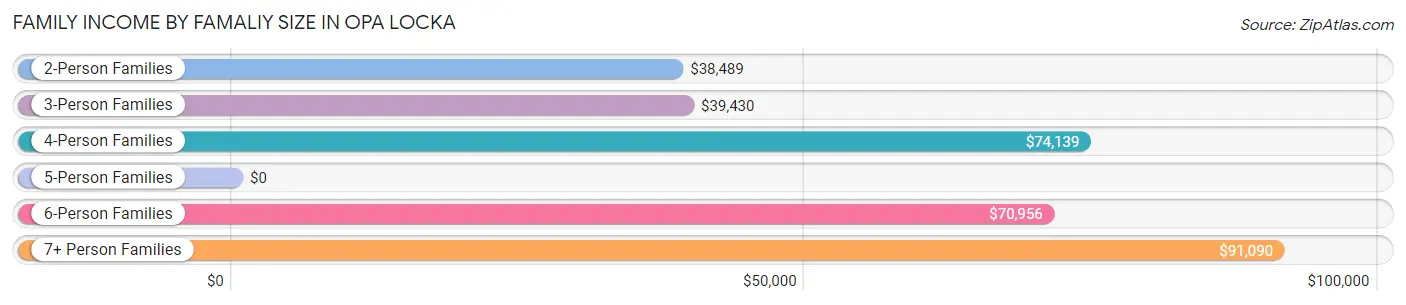
Family Income by Famaliy Size in Opa Locka
7+ person families (140 | 3.5%) account for the highest median family income in Opa Locka with $91,090 per family, while 2-person families (1,830 | 45.9%) have the highest median income of $19,244 per family member.
| Income Bracket | # Families | Median Income |
| 2-Person Families | 1,830 (45.9%) | $38,489 |
| 3-Person Families | 1,018 (25.5%) | $39,430 |
| 4-Person Families | 577 (14.5%) | $74,139 |
| 5-Person Families | 358 (9.0%) | $0 |
| 6-Person Families | 67 (1.7%) | $70,956 |
| 7+ Person Families | 140 (3.5%) | $91,090 |
| Total | 3,990 (100.0%) | $42,308 |
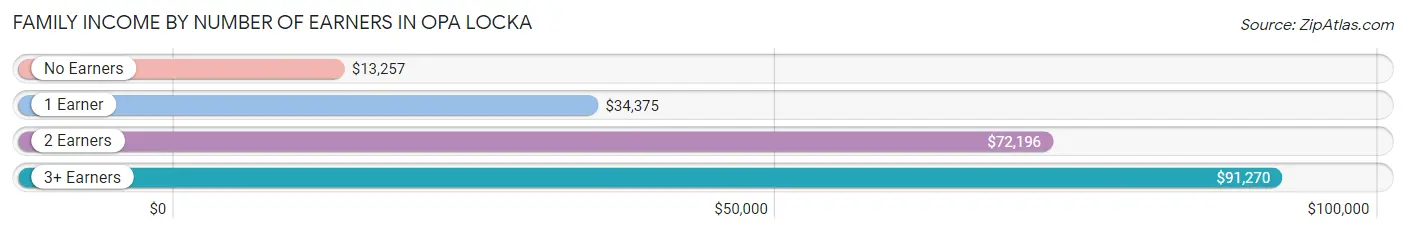
Family Income by Number of Earners in Opa Locka
The median family income in Opa Locka is $42,308, with families comprising 3+ earners (450) having the highest median family income of $91,270, while families with no earners (664) have the lowest median family income of $13,257, accounting for 11.3% and 16.6% of families, respectively.
| Number of Earners | # Families | Median Income |
| No Earners | 664 (16.6%) | $13,257 |
| 1 Earner | 1,607 (40.3%) | $34,375 |
| 2 Earners | 1,269 (31.8%) | $72,196 |
| 3+ Earners | 450 (11.3%) | $91,270 |
| Total | 3,990 (100.0%) | $42,308 |
Household Income in Opa Locka
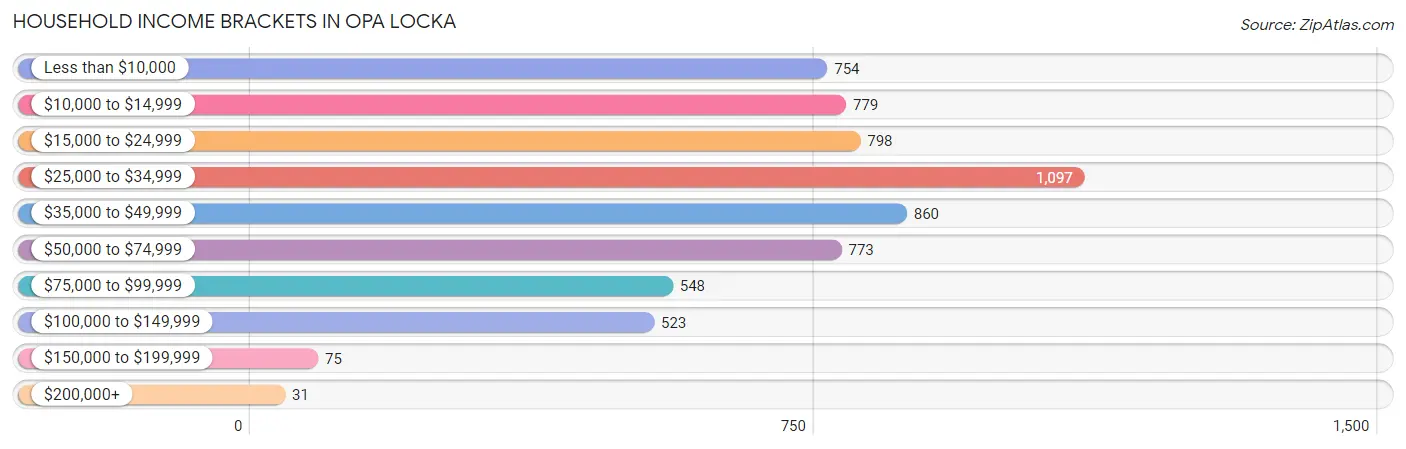
Household Income Brackets in Opa Locka
With 1,097 households falling in the category, the $25,000 to $34,999 income range is the most frequent in Opa Locka, accounting for 17.6% of all households. In contrast, only 31 households (0.5%) fall into the $200,000+ income bracket, making it the least populous group.
| Income Bracket | # Households | % Households |
| Less than $10,000 | 754 | 12.1% |
| $10,000 to $14,999 | 779 | 12.5% |
| $15,000 to $24,999 | 798 | 12.8% |
| $25,000 to $34,999 | 1,097 | 17.6% |
| $35,000 to $49,999 | 860 | 13.8% |
| $50,000 to $74,999 | 773 | 12.4% |
| $75,000 to $99,999 | 548 | 8.8% |
| $100,000 to $149,999 | 523 | 8.4% |
| $150,000 to $199,999 | 75 | 1.2% |
| $200,000+ | 31 | 0.5% |
Household Income by Householder Age in Opa Locka
The median household income in Opa Locka is $30,101, with the highest median household income of $37,796 found in the 45 to 64 years age bracket for the primary householder. A total of 2,764 households (44.4%) fall into this category. Meanwhile, the 15 to 24 years age bracket for the primary householder has the lowest median household income of $0, with 69 households (1.1%) in this group.
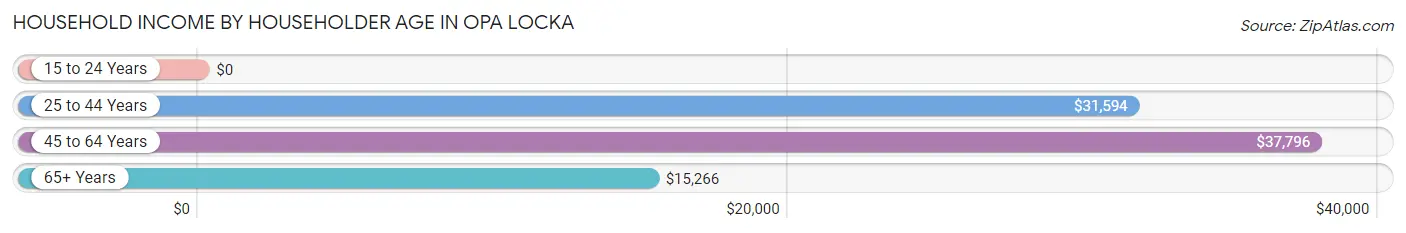
| Income Bracket | # Households | Median Income |
| 15 to 24 Years | 69 (1.1%) | $0 |
| 25 to 44 Years | 2,003 (32.2%) | $31,594 |
| 45 to 64 Years | 2,764 (44.4%) | $37,796 |
| 65+ Years | 1,395 (22.4%) | $15,266 |
| Total | 6,231 (100.0%) | $30,101 |
Poverty in Opa Locka
Income Below Poverty by Sex and Age in Opa Locka
With 24.7% poverty level for males and 31.5% for females among the residents of Opa Locka, 6 to 11 year old males and 5 year old females are the most vulnerable to poverty, with 320 males (52.0%) and 33 females (100.0%) in their respective age groups living below the poverty level.
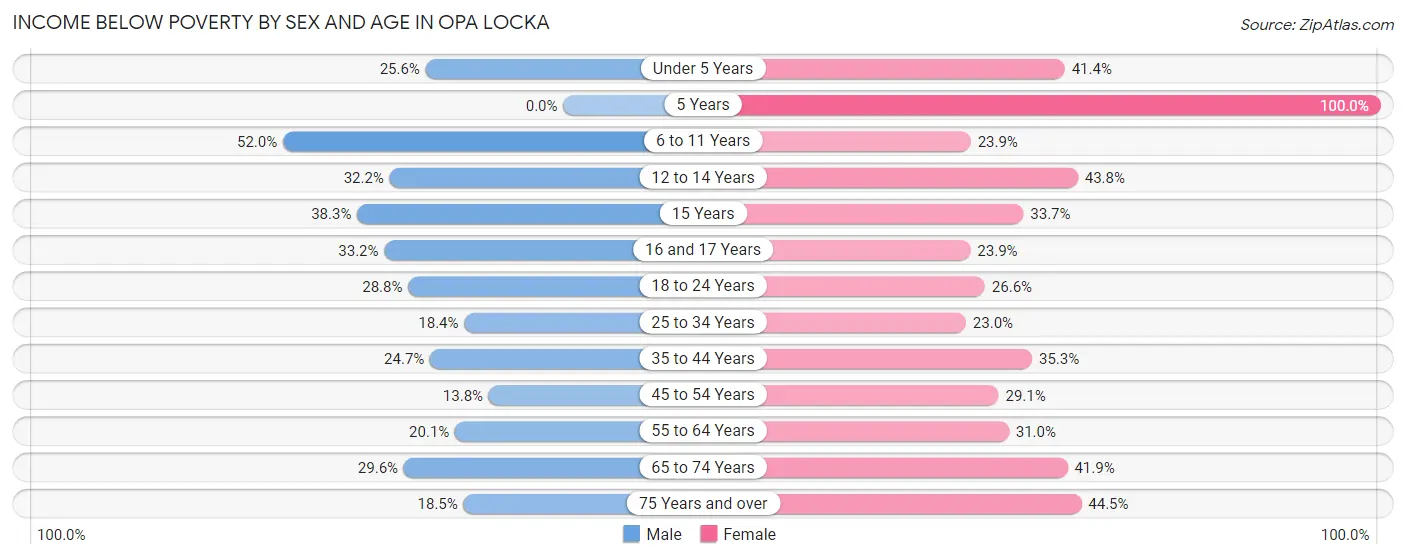
| Age Bracket | Male | Female |
| Under 5 Years | 163 (25.6%) | 132 (41.4%) |
| 5 Years | 0 (0.0%) | 33 (100.0%) |
| 6 to 11 Years | 320 (52.0%) | 156 (23.9%) |
| 12 to 14 Years | 127 (32.2%) | 92 (43.8%) |
| 15 Years | 119 (38.3%) | 31 (33.7%) |
| 16 and 17 Years | 100 (33.2%) | 37 (23.9%) |
| 18 to 24 Years | 179 (28.8%) | 226 (26.6%) |
| 25 to 34 Years | 245 (18.4%) | 341 (23.0%) |
| 35 to 44 Years | 222 (24.7%) | 297 (35.3%) |
| 45 to 54 Years | 200 (13.8%) | 281 (29.1%) |
| 55 to 64 Years | 157 (20.1%) | 300 (31.0%) |
| 65 to 74 Years | 179 (29.6%) | 341 (41.9%) |
| 75 Years and over | 62 (18.5%) | 201 (44.5%) |
| Total | 2,073 (24.7%) | 2,468 (31.5%) |
Income Above Poverty by Sex and Age in Opa Locka
According to the poverty statistics in Opa Locka, males aged 5 years and females aged 25 to 34 years are the age groups that are most secure financially, with 100.0% of males and 77.0% of females in these age groups living above the poverty line.
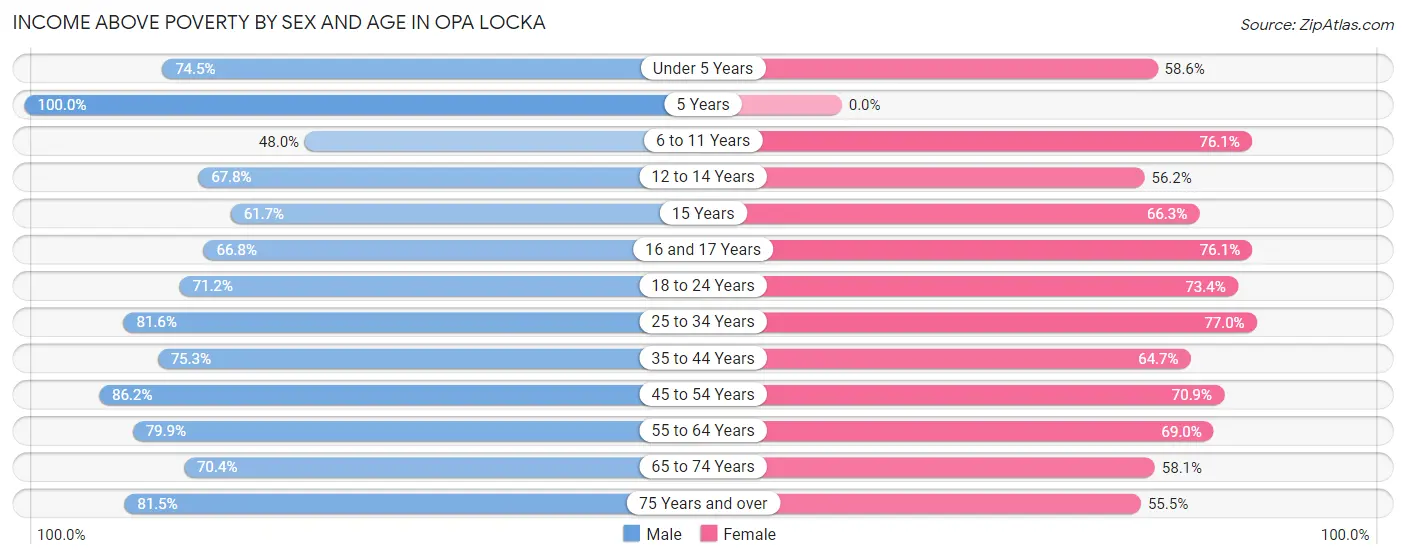
| Age Bracket | Male | Female |
| Under 5 Years | 475 (74.5%) | 187 (58.6%) |
| 5 Years | 107 (100.0%) | 0 (0.0%) |
| 6 to 11 Years | 295 (48.0%) | 496 (76.1%) |
| 12 to 14 Years | 267 (67.8%) | 118 (56.2%) |
| 15 Years | 192 (61.7%) | 61 (66.3%) |
| 16 and 17 Years | 201 (66.8%) | 118 (76.1%) |
| 18 to 24 Years | 443 (71.2%) | 625 (73.4%) |
| 25 to 34 Years | 1,088 (81.6%) | 1,139 (77.0%) |
| 35 to 44 Years | 676 (75.3%) | 544 (64.7%) |
| 45 to 54 Years | 1,247 (86.2%) | 685 (70.9%) |
| 55 to 64 Years | 625 (79.9%) | 668 (69.0%) |
| 65 to 74 Years | 426 (70.4%) | 473 (58.1%) |
| 75 Years and over | 273 (81.5%) | 251 (55.5%) |
| Total | 6,315 (75.3%) | 5,365 (68.5%) |
Income Below Poverty Among Married-Couple Families in Opa Locka
The poverty statistics for married-couple families in Opa Locka show that 12.3% or 184 of the total 1,495 families live below the poverty line. Families with 3 or 4 children have the highest poverty rate of 39.7%, comprising of 31 families. On the other hand, families with no children have the lowest poverty rate of 8.9%, which includes 78 families.
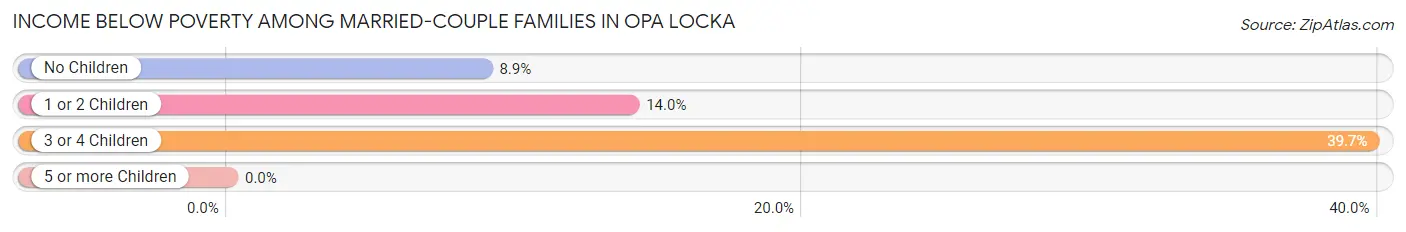
| Children | Above Poverty | Below Poverty |
| No Children | 802 (91.1%) | 78 (8.9%) |
| 1 or 2 Children | 462 (86.0%) | 75 (14.0%) |
| 3 or 4 Children | 47 (60.3%) | 31 (39.7%) |
| 5 or more Children | 0 (0.0%) | 0 (0.0%) |
| Total | 1,311 (87.7%) | 184 (12.3%) |
Income Below Poverty Among Single-Parent Households in Opa Locka
According to the poverty data in Opa Locka, 5.4% or 42 single-father households and 38.3% or 660 single-mother households are living below the poverty line. Among single-father households, those with 1 or 2 children have the highest poverty rate, with 18 households (5.8%) experiencing poverty. Likewise, among single-mother households, those with 3 or 4 children have the highest poverty rate, with 138 households (47.7%) falling below the poverty line.
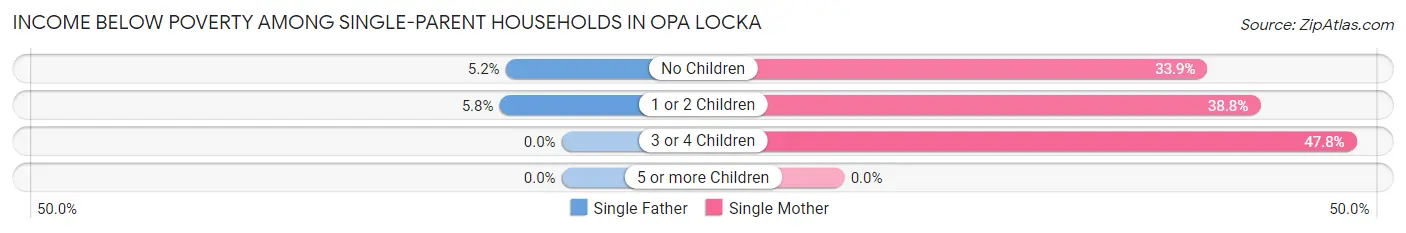
| Children | Single Father | Single Mother |
| No Children | 24 (5.2%) | 237 (33.9%) |
| 1 or 2 Children | 18 (5.8%) | 285 (38.8%) |
| 3 or 4 Children | 0 (0.0%) | 138 (47.7%) |
| 5 or more Children | 0 (0.0%) | 0 (0.0%) |
| Total | 42 (5.4%) | 660 (38.3%) |
Income Below Poverty Among Married-Couple vs Single-Parent Households in Opa Locka
The poverty data for Opa Locka shows that 184 of the married-couple family households (12.3%) and 702 of the single-parent households (28.1%) are living below the poverty level. Within the married-couple family households, those with 3 or 4 children have the highest poverty rate, with 31 households (39.7%) falling below the poverty line. Among the single-parent households, those with 3 or 4 children have the highest poverty rate, with 138 household (47.7%) living below poverty.
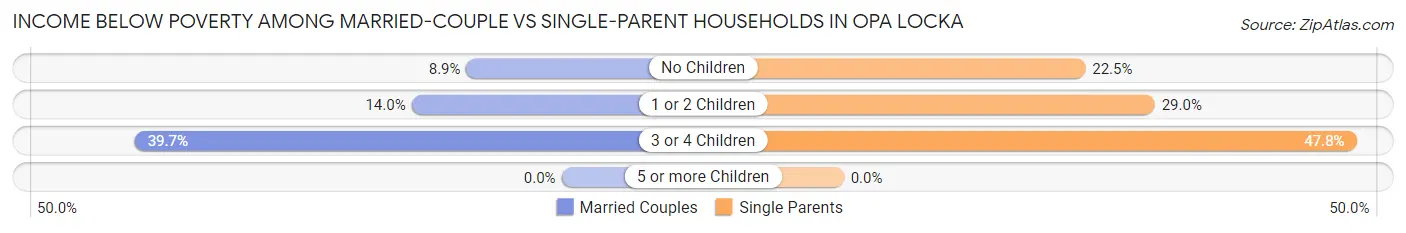
| Children | Married-Couple Families | Single-Parent Households |
| No Children | 78 (8.9%) | 261 (22.5%) |
| 1 or 2 Children | 75 (14.0%) | 303 (29.0%) |
| 3 or 4 Children | 31 (39.7%) | 138 (47.7%) |
| 5 or more Children | 0 (0.0%) | 0 (0.0%) |
| Total | 184 (12.3%) | 702 (28.1%) |
Race in Opa Locka
The most populous races in Opa Locka are Black / African American (8,388 | 51.7%), Hispanic or Latino (7,564 | 46.6%), and Two or more Races (3,817 | 23.5%).
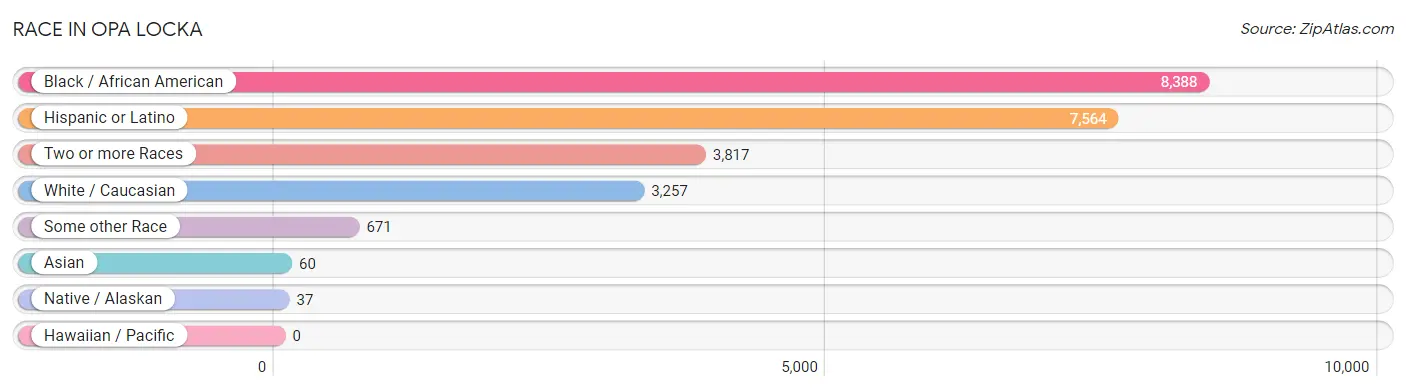
| Race | # Population | % Population |
| Asian | 60 | 0.4% |
| Black / African American | 8,388 | 51.7% |
| Hawaiian / Pacific | 0 | 0.0% |
| Hispanic or Latino | 7,564 | 46.6% |
| Native / Alaskan | 37 | 0.2% |
| White / Caucasian | 3,257 | 20.1% |
| Two or more Races | 3,817 | 23.5% |
| Some other Race | 671 | 4.1% |
| Total | 16,230 | 100.0% |
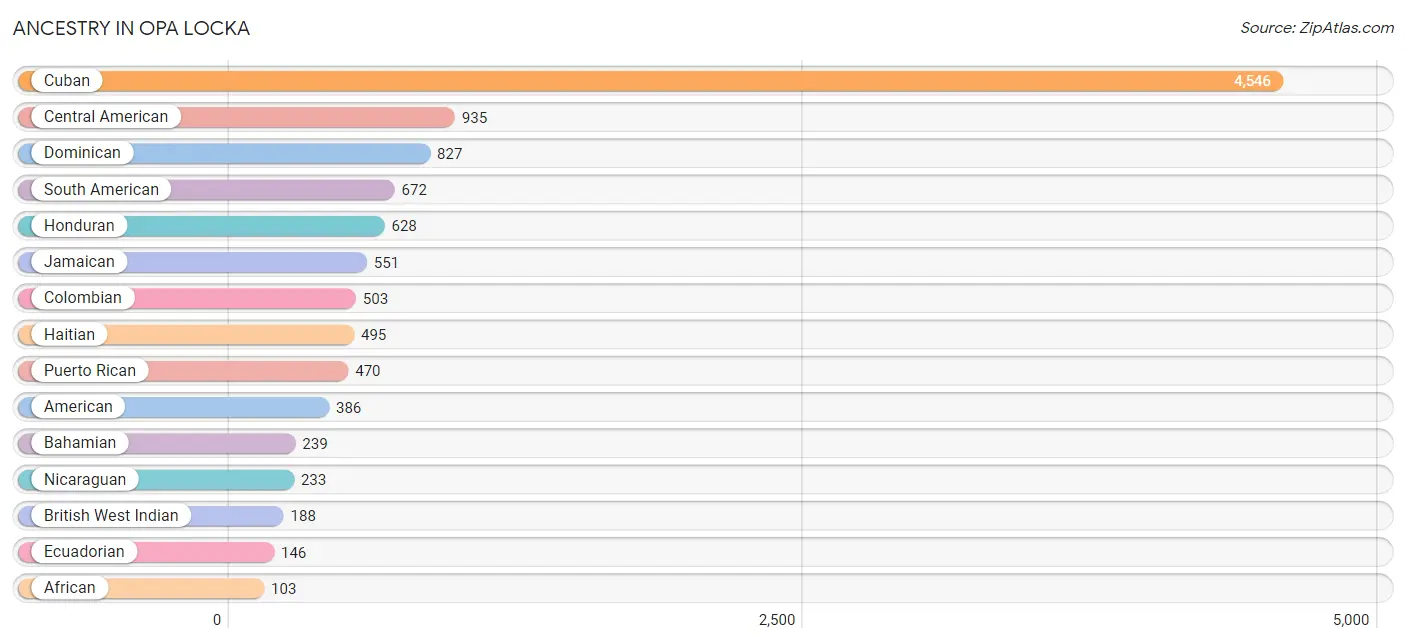
Ancestry in Opa Locka
The most populous ancestries reported in Opa Locka are Cuban (4,546 | 28.0%), Central American (935 | 5.8%), Dominican (827 | 5.1%), South American (672 | 4.1%), and Honduran (628 | 3.9%), together accounting for 46.9% of all Opa Locka residents.
| Ancestry | # Population | % Population |
| African | 103 | 0.6% |
| American | 386 | 2.4% |
| Arab | 77 | 0.5% |
| Bahamian | 239 | 1.5% |
| Brazilian | 14 | 0.1% |
| British West Indian | 188 | 1.2% |
| Central American | 935 | 5.8% |
| Cherokee | 37 | 0.2% |
| Colombian | 503 | 3.1% |
| Cuban | 4,546 | 28.0% |
| Dominican | 827 | 5.1% |
| Ecuadorian | 146 | 0.9% |
| English | 8 | 0.1% |
| German | 2 | 0.0% |
| Guatemalan | 15 | 0.1% |
| Guyanese | 14 | 0.1% |
| Haitian | 495 | 3.0% |
| Honduran | 628 | 3.9% |
| Hungarian | 10 | 0.1% |
| Irish | 27 | 0.2% |
| Jamaican | 551 | 3.4% |
| Lebanese | 18 | 0.1% |
| Moroccan | 59 | 0.4% |
| Nicaraguan | 233 | 1.4% |
| Pakistani | 60 | 0.4% |
| Peruvian | 5 | 0.0% |
| Polish | 30 | 0.2% |
| Puerto Rican | 470 | 2.9% |
| Russian | 2 | 0.0% |
| Salvadoran | 59 | 0.4% |
| Scottish | 8 | 0.1% |
| South American | 672 | 4.1% |
| South American Indian | 2 | 0.0% |
| Spaniard | 18 | 0.1% |
| Spanish American | 20 | 0.1% |
| Subsaharan African | 103 | 0.6% |
| Venezuelan | 18 | 0.1% | View All 37 Rows |
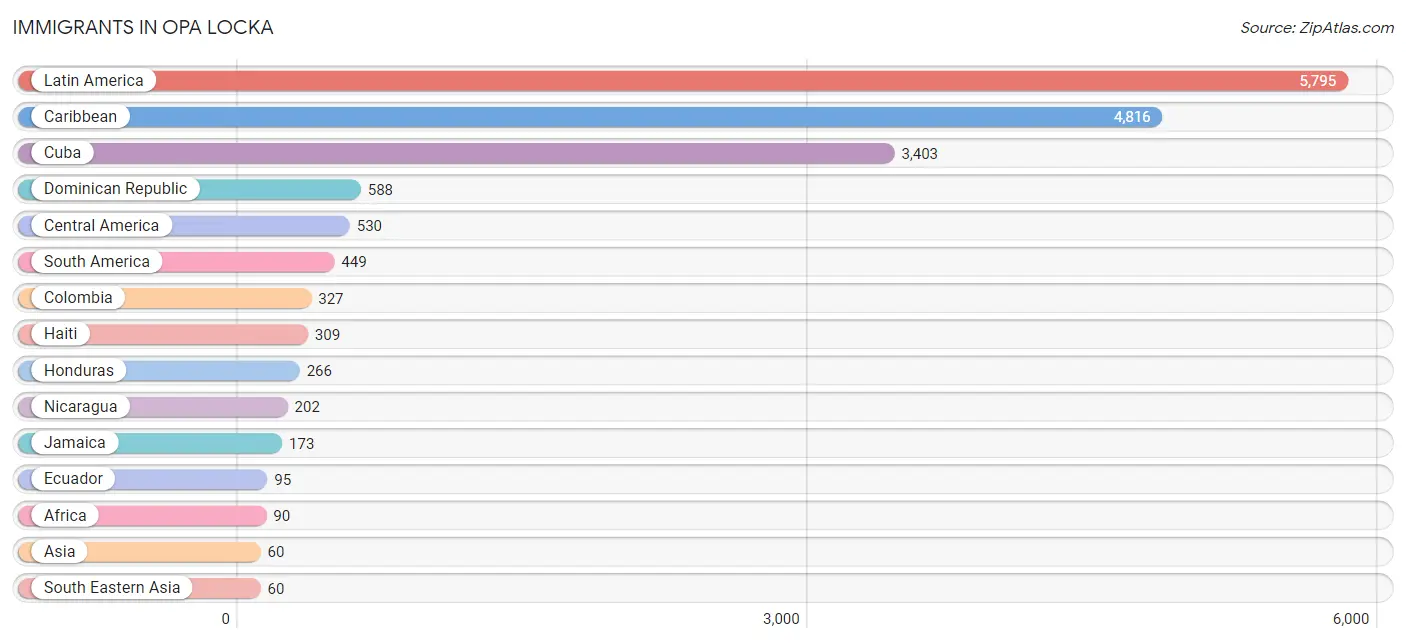
Immigrants in Opa Locka
The most numerous immigrant groups reported in Opa Locka came from Latin America (5,795 | 35.7%), Caribbean (4,816 | 29.7%), Cuba (3,403 | 21.0%), Dominican Republic (588 | 3.6%), and Central America (530 | 3.3%), together accounting for 93.2% of all Opa Locka residents.
| Immigration Origin | # Population | % Population |
| Africa | 90 | 0.5% |
| Asia | 60 | 0.4% |
| Brazil | 4 | 0.0% |
| Caribbean | 4,816 | 29.7% |
| Central America | 530 | 3.3% |
| Colombia | 327 | 2.0% |
| Cuba | 3,403 | 21.0% |
| Dominican Republic | 588 | 3.6% |
| Eastern Europe | 2 | 0.0% |
| Ecuador | 95 | 0.6% |
| El Salvador | 12 | 0.1% |
| Europe | 12 | 0.1% |
| Germany | 10 | 0.1% |
| Ghana | 31 | 0.2% |
| Guatemala | 50 | 0.3% |
| Haiti | 309 | 1.9% |
| Honduras | 266 | 1.6% |
| Jamaica | 173 | 1.1% |
| Latin America | 5,795 | 35.7% |
| Morocco | 59 | 0.4% |
| Nicaragua | 202 | 1.2% |
| Northern Africa | 59 | 0.4% |
| Peru | 5 | 0.0% |
| Russia | 2 | 0.0% |
| South America | 449 | 2.8% |
| South Eastern Asia | 60 | 0.4% |
| Thailand | 60 | 0.4% |
| Venezuela | 18 | 0.1% |
| Western Africa | 31 | 0.2% |
| Western Europe | 10 | 0.1% | View All 30 Rows |
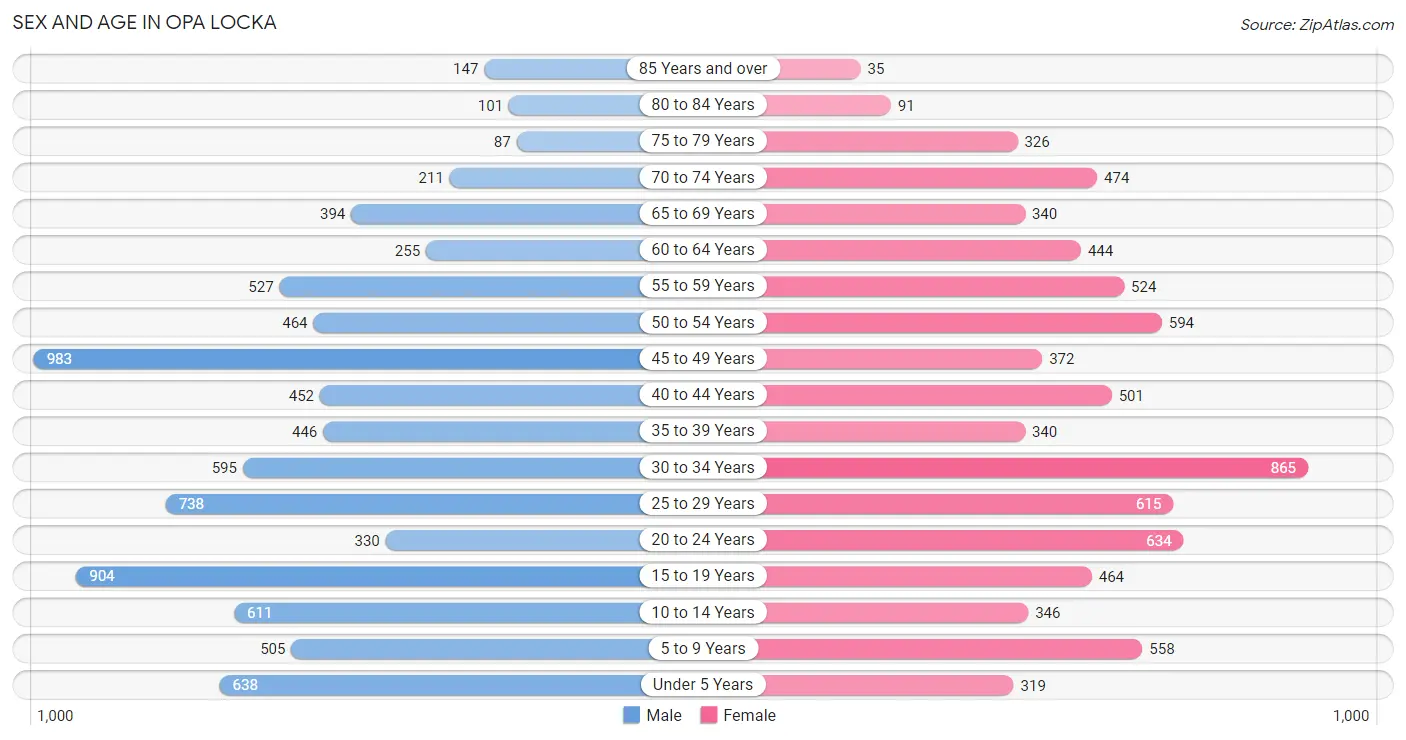
Sex and Age in Opa Locka
Sex and Age in Opa Locka
The most populous age groups in Opa Locka are 45 to 49 Years (983 | 11.7%) for men and 30 to 34 Years (865 | 11.0%) for women.
| Age Bracket | Male | Female |
| Under 5 Years | 638 (7.6%) | 319 (4.1%) |
| 5 to 9 Years | 505 (6.0%) | 558 (7.1%) |
| 10 to 14 Years | 611 (7.3%) | 346 (4.4%) |
| 15 to 19 Years | 904 (10.8%) | 464 (5.9%) |
| 20 to 24 Years | 330 (3.9%) | 634 (8.1%) |
| 25 to 29 Years | 738 (8.8%) | 615 (7.8%) |
| 30 to 34 Years | 595 (7.1%) | 865 (11.0%) |
| 35 to 39 Years | 446 (5.3%) | 340 (4.3%) |
| 40 to 44 Years | 452 (5.4%) | 501 (6.4%) |
| 45 to 49 Years | 983 (11.7%) | 372 (4.7%) |
| 50 to 54 Years | 464 (5.5%) | 594 (7.6%) |
| 55 to 59 Years | 527 (6.3%) | 524 (6.7%) |
| 60 to 64 Years | 255 (3.0%) | 444 (5.7%) |
| 65 to 69 Years | 394 (4.7%) | 340 (4.3%) |
| 70 to 74 Years | 211 (2.5%) | 474 (6.0%) |
| 75 to 79 Years | 87 (1.0%) | 326 (4.2%) |
| 80 to 84 Years | 101 (1.2%) | 91 (1.2%) |
| 85 Years and over | 147 (1.8%) | 35 (0.4%) |
| Total | 8,388 (100.0%) | 7,842 (100.0%) |
Families and Households in Opa Locka
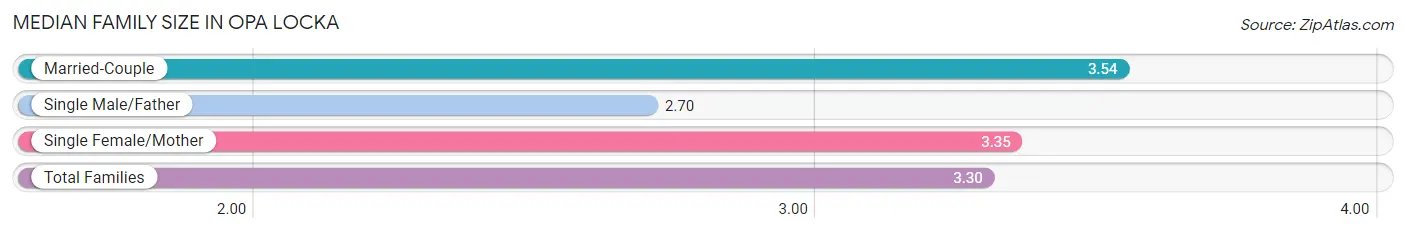
Median Family Size in Opa Locka
The median family size in Opa Locka is 3.30 persons per family, with married-couple families (1,495 | 37.5%) accounting for the largest median family size of 3.54 persons per family. On the other hand, single male/father families (771 | 19.3%) represent the smallest median family size with 2.70 persons per family.
| Family Type | # Families | Family Size |
| Married-Couple | 1,495 (37.5%) | 3.54 |
| Single Male/Father | 771 (19.3%) | 2.70 |
| Single Female/Mother | 1,724 (43.2%) | 3.35 |
| Total Families | 3,990 (100.0%) | 3.30 |
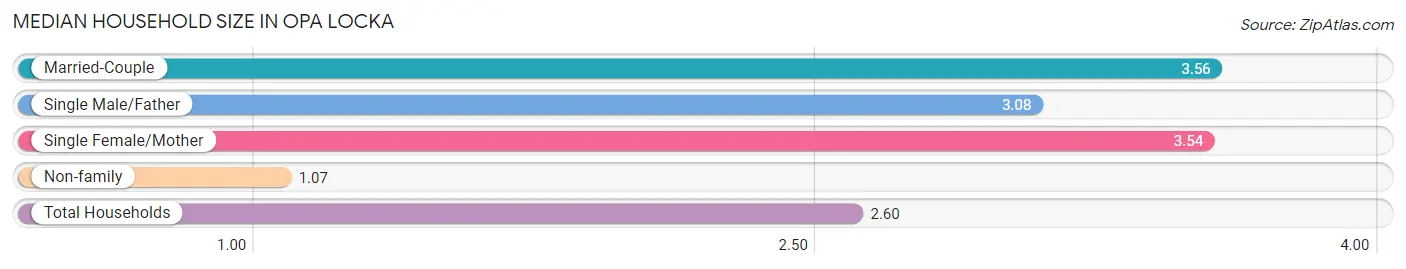
Median Household Size in Opa Locka
The median household size in Opa Locka is 2.60 persons per household, with married-couple households (1,495 | 24.0%) accounting for the largest median household size of 3.56 persons per household. non-family households (2,241 | 36.0%) represent the smallest median household size with 1.07 persons per household.
| Household Type | # Households | Household Size |
| Married-Couple | 1,495 (24.0%) | 3.56 |
| Single Male/Father | 771 (12.4%) | 3.08 |
| Single Female/Mother | 1,724 (27.7%) | 3.54 |
| Non-family | 2,241 (36.0%) | 1.07 |
| Total Households | 6,231 (100.0%) | 2.60 |
Household Size by Marriage Status in Opa Locka
Out of a total of 6,231 households in Opa Locka, 3,990 (64.0%) are family households, while 2,241 (36.0%) are nonfamily households. The most numerous type of family households are 2-person households, comprising 1,557, and the most common type of nonfamily households are 1-person households, comprising 2,115.
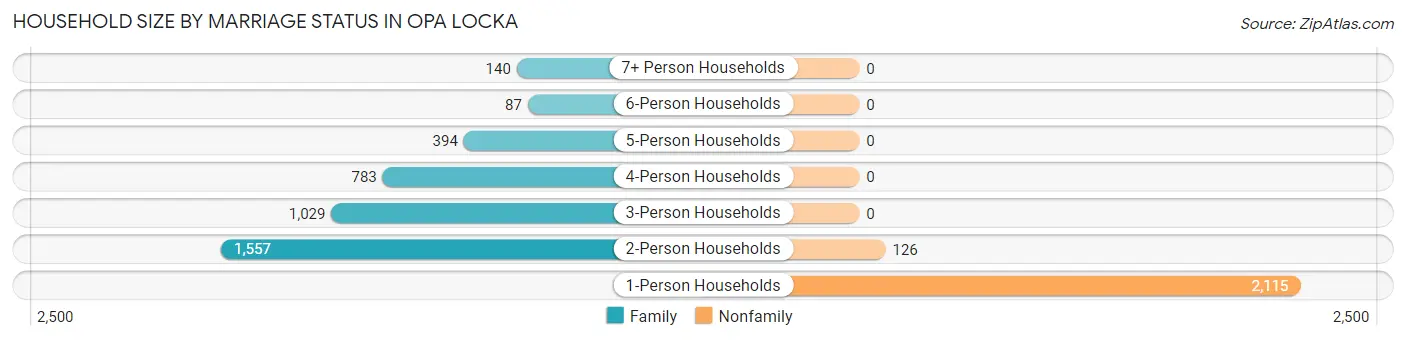
| Household Size | Family Households | Nonfamily Households |
| 1-Person Households | - | 2,115 (33.9%) |
| 2-Person Households | 1,557 (25.0%) | 126 (2.0%) |
| 3-Person Households | 1,029 (16.5%) | 0 (0.0%) |
| 4-Person Households | 783 (12.6%) | 0 (0.0%) |
| 5-Person Households | 394 (6.3%) | 0 (0.0%) |
| 6-Person Households | 87 (1.4%) | 0 (0.0%) |
| 7+ Person Households | 140 (2.2%) | 0 (0.0%) |
| Total | 3,990 (64.0%) | 2,241 (36.0%) |
Female Fertility in Opa Locka
Fertility by Age in Opa Locka
Average fertility rate in Opa Locka is 101.0 births per 1,000 women. Women in the age bracket of 20 to 34 years have the highest fertility rate with 168.0 births per 1,000 women. Women in the age bracket of 20 to 34 years acount for 90.1% of all women with births.
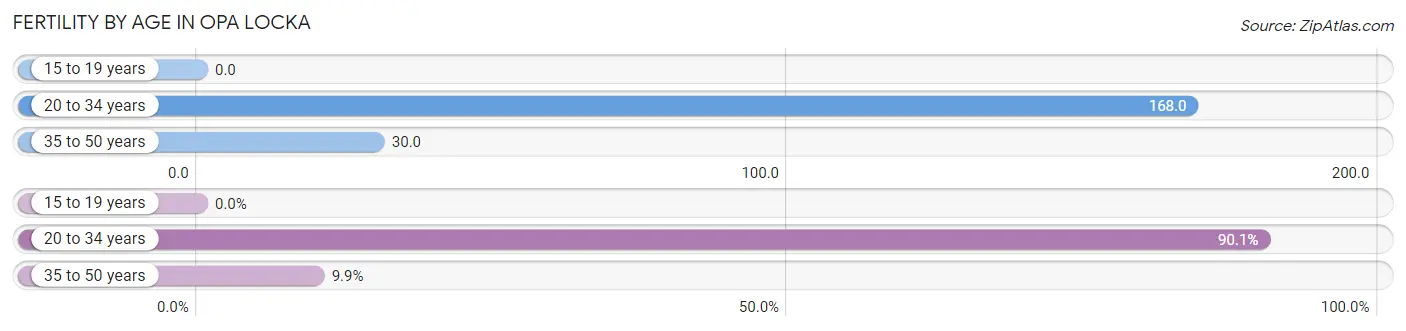
| Age Bracket | Women with Births | Births / 1,000 Women |
| 15 to 19 years | 0 (0.0%) | 0.0 |
| 20 to 34 years | 355 (90.1%) | 168.0 |
| 35 to 50 years | 39 (9.9%) | 30.0 |
| Total | 394 (100.0%) | 101.0 |
Fertility by Age by Marriage Status in Opa Locka
26.6% of women with births (394) in Opa Locka are married. The highest percentage of unmarried women with births falls into 20 to 34 years age bracket with 81.4% of them unmarried at the time of birth, while the lowest percentage of unmarried women with births belong to 35 to 50 years age bracket with 0.0% of them unmarried.
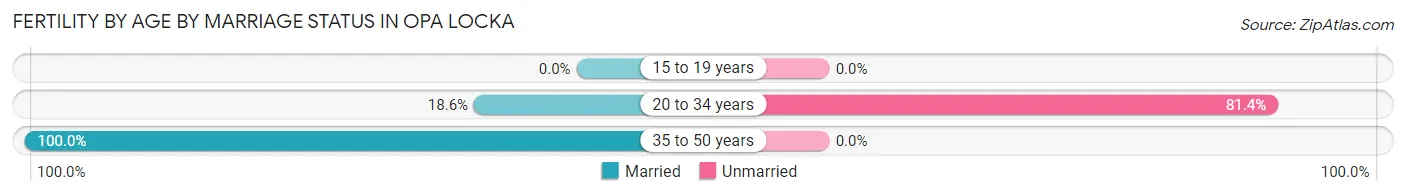
| Age Bracket | Married | Unmarried |
| 15 to 19 years | 0 (0.0%) | 0 (0.0%) |
| 20 to 34 years | 66 (18.6%) | 289 (81.4%) |
| 35 to 50 years | 39 (100.0%) | 0 (0.0%) |
| Total | 105 (26.7%) | 289 (73.4%) |
Fertility by Education in Opa Locka
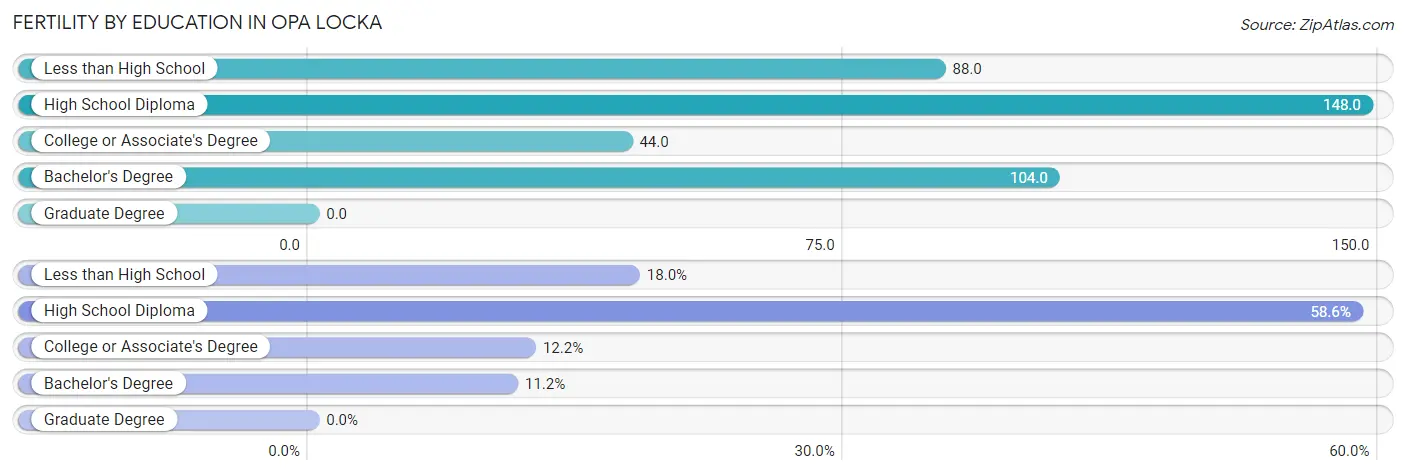
| Educational Attainment | Women with Births | Births / 1,000 Women |
| Less than High School | 71 (18.0%) | 88.0 |
| High School Diploma | 231 (58.6%) | 148.0 |
| College or Associate's Degree | 48 (12.2%) | 44.0 |
| Bachelor's Degree | 44 (11.2%) | 104.0 |
| Graduate Degree | 0 (0.0%) | 0.0 |
| Total | 394 (100.0%) | 101.0 |
Fertility by Education by Marriage Status in Opa Locka
73.4% of women with births in Opa Locka are unmarried. Women with the educational attainment of college or associate's degree are most likely to be married with 95.8% of them married at childbirth, while women with the educational attainment of high school diploma are least likely to be married with 100.0% of them unmarried at childbirth.
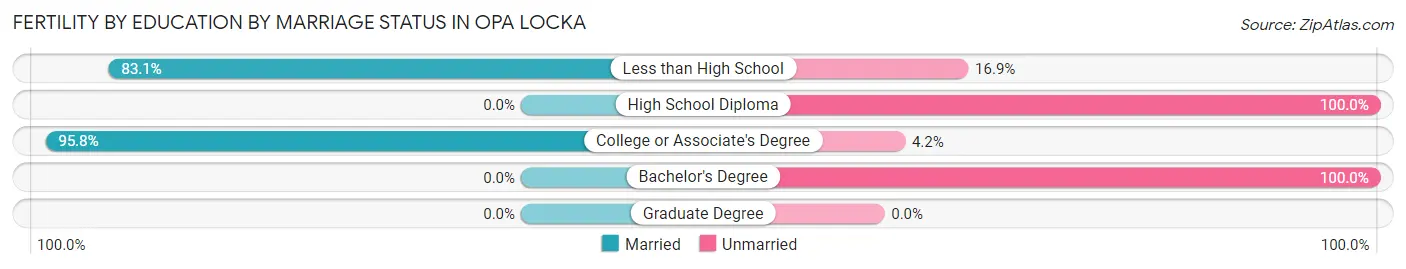
| Educational Attainment | Married | Unmarried |
| Less than High School | 59 (83.1%) | 12 (16.9%) |
| High School Diploma | 0 (0.0%) | 231 (100.0%) |
| College or Associate's Degree | 46 (95.8%) | 2 (4.2%) |
| Bachelor's Degree | 0 (0.0%) | 44 (100.0%) |
| Graduate Degree | 0 (0.0%) | 0 (0.0%) |
| Total | 105 (26.7%) | 289 (73.4%) |
Employment Characteristics in Opa Locka
Employment by Class of Employer in Opa Locka
Among the 6,817 employed individuals in Opa Locka, private company employees (5,248 | 77.0%), self-employed (not incorporated) (521 | 7.6%), and not-for-profit organizations (427 | 6.3%) make up the most common classes of employment.
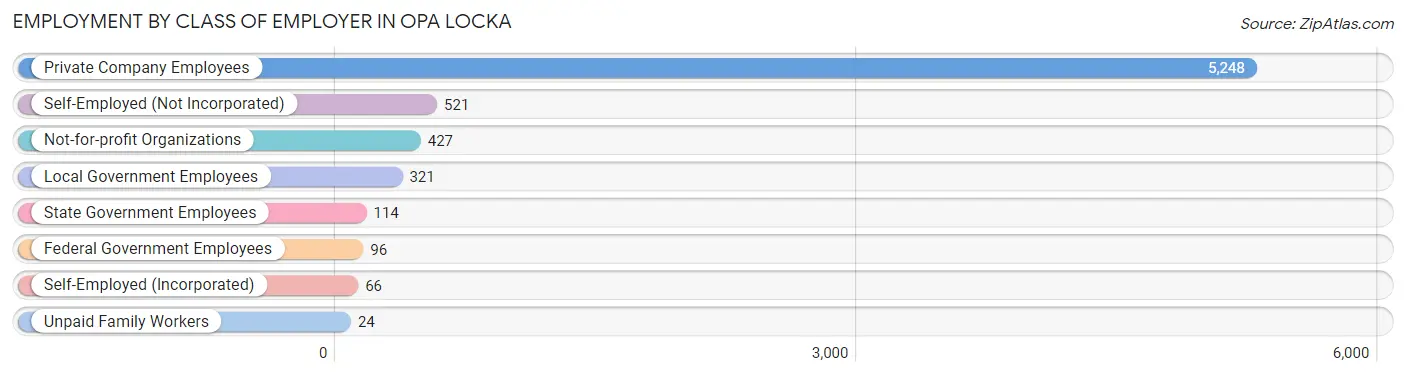
| Employer Class | # Employees | % Employees |
| Private Company Employees | 5,248 | 77.0% |
| Self-Employed (Incorporated) | 66 | 1.0% |
| Self-Employed (Not Incorporated) | 521 | 7.6% |
| Not-for-profit Organizations | 427 | 6.3% |
| Local Government Employees | 321 | 4.7% |
| State Government Employees | 114 | 1.7% |
| Federal Government Employees | 96 | 1.4% |
| Unpaid Family Workers | 24 | 0.4% |
| Total | 6,817 | 100.0% |
Employment Status by Age in Opa Locka
According to the labor force statistics for Opa Locka, out of the total population over 16 years of age (12,850), 57.3% or 7,363 individuals are in the labor force, with 5.2% or 383 of them unemployed. The age group with the highest labor force participation rate is 35 to 44 years, with 73.7% or 1,282 individuals in the labor force. Within the labor force, the 16 to 19 years age range has the highest percentage of unemployed individuals, with 11.0% or 34 of them being unemployed.
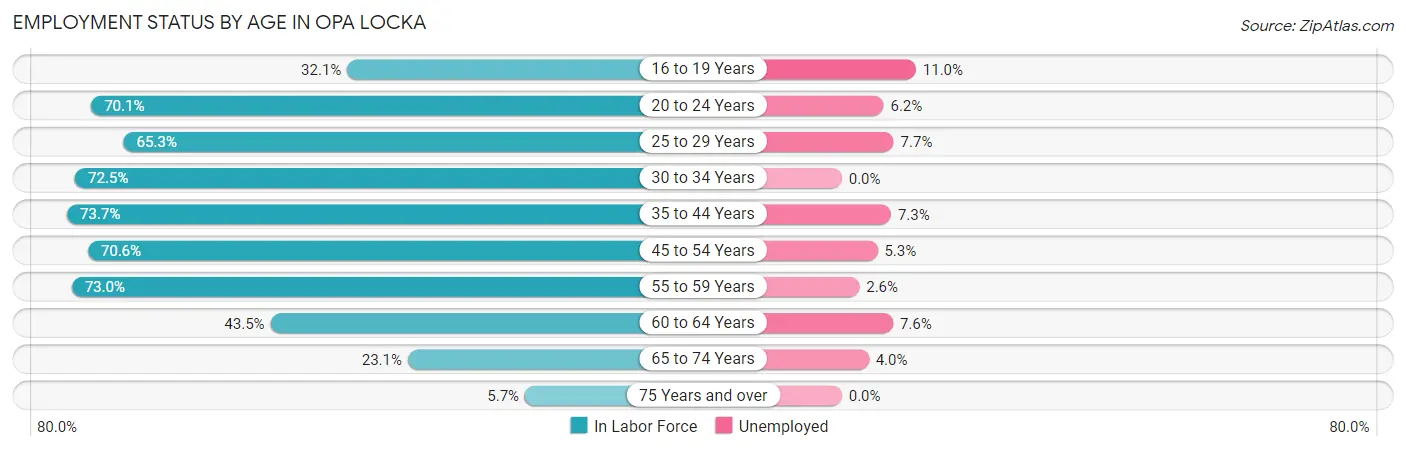
| Age Bracket | In Labor Force | Unemployed |
| 16 to 19 Years | 310 (32.1%) | 34 (11.0%) |
| 20 to 24 Years | 676 (70.1%) | 42 (6.2%) |
| 25 to 29 Years | 884 (65.3%) | 68 (7.7%) |
| 30 to 34 Years | 1,058 (72.5%) | 0 (0.0%) |
| 35 to 44 Years | 1,282 (73.7%) | 94 (7.3%) |
| 45 to 54 Years | 1,704 (70.6%) | 90 (5.3%) |
| 55 to 59 Years | 767 (73.0%) | 20 (2.6%) |
| 60 to 64 Years | 304 (43.5%) | 23 (7.6%) |
| 65 to 74 Years | 328 (23.1%) | 13 (4.0%) |
| 75 Years and over | 45 (5.7%) | 0 (0.0%) |
| Total | 7,363 (57.3%) | 383 (5.2%) |
Employment Status by Educational Attainment in Opa Locka
According to labor force statistics for Opa Locka, 68.8% of individuals (5,996) out of the total population between 25 and 64 years of age (8,715) are in the labor force, with 4.9% or 294 of them being unemployed. The group with the highest labor force participation rate are those with the educational attainment of bachelor's degree or higher, with 92.6% or 604 individuals in the labor force. Within the labor force, individuals with college / associate degree education have the highest percentage of unemployment, with 10.1% or 151 of them being unemployed.
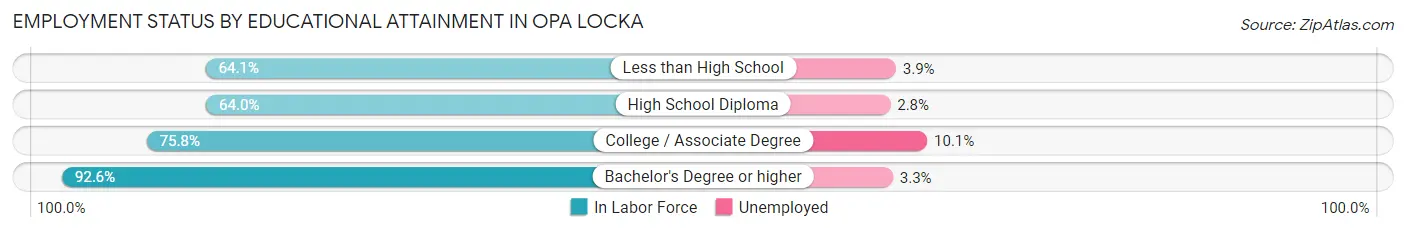
| Educational Attainment | In Labor Force | Unemployed |
| Less than High School | 1,303 (64.1%) | 79 (3.9%) |
| High School Diploma | 2,596 (64.0%) | 114 (2.8%) |
| College / Associate Degree | 1,496 (75.8%) | 199 (10.1%) |
| Bachelor's Degree or higher | 604 (92.6%) | 22 (3.3%) |
| Total | 5,996 (68.8%) | 427 (4.9%) |
Employment Occupations by Sex in Opa Locka
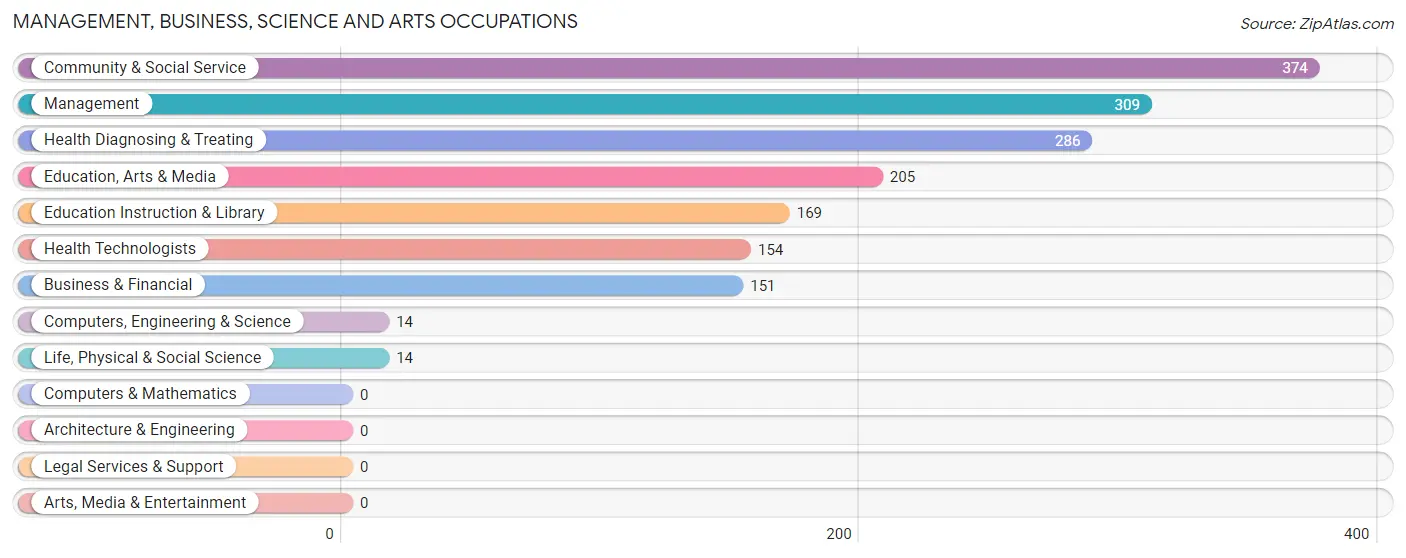
Management, Business, Science and Arts Occupations
The most common Management, Business, Science and Arts occupations in Opa Locka are Community & Social Service (374 | 5.4%), Management (309 | 4.4%), Health Diagnosing & Treating (286 | 4.1%), Education, Arts & Media (205 | 2.9%), and Education Instruction & Library (169 | 2.4%).
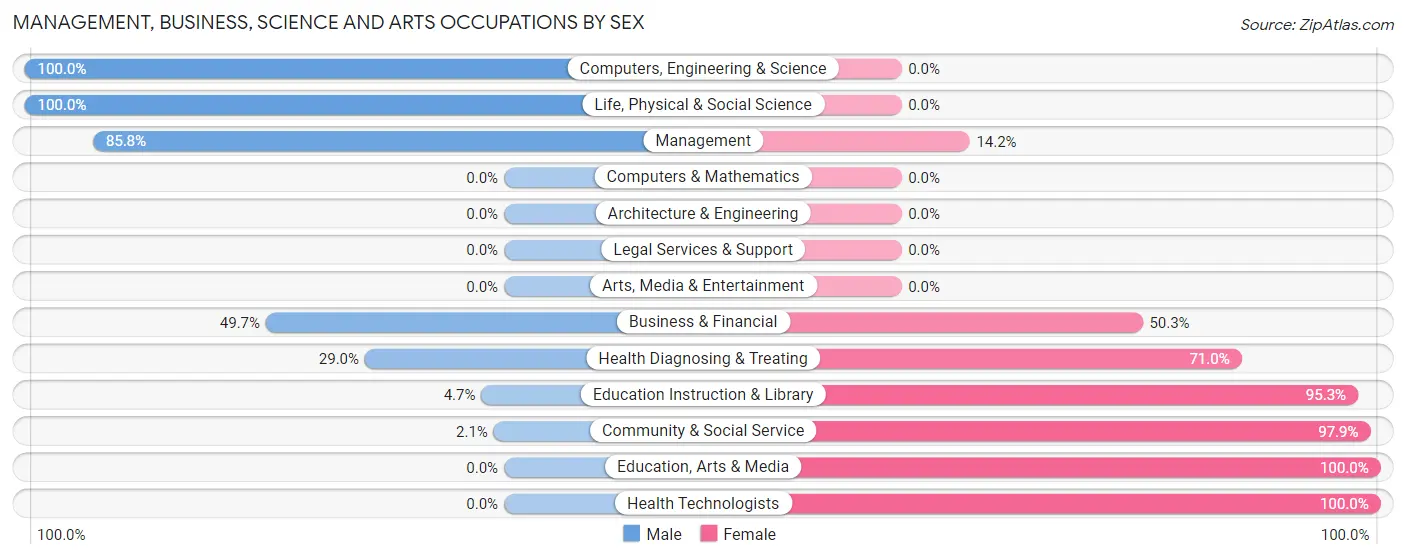
Management, Business, Science and Arts Occupations by Sex
Within the Management, Business, Science and Arts occupations in Opa Locka, the most male-oriented occupations are Computers, Engineering & Science (100.0%), Life, Physical & Social Science (100.0%), and Management (85.8%), while the most female-oriented occupations are Education, Arts & Media (100.0%), Health Technologists (100.0%), and Community & Social Service (97.9%).
| Occupation | Male | Female |
| Management | 265 (85.8%) | 44 (14.2%) |
| Business & Financial | 75 (49.7%) | 76 (50.3%) |
| Computers, Engineering & Science | 14 (100.0%) | 0 (0.0%) |
| Computers & Mathematics | 0 (0.0%) | 0 (0.0%) |
| Architecture & Engineering | 0 (0.0%) | 0 (0.0%) |
| Life, Physical & Social Science | 14 (100.0%) | 0 (0.0%) |
| Community & Social Service | 8 (2.1%) | 366 (97.9%) |
| Education, Arts & Media | 0 (0.0%) | 205 (100.0%) |
| Legal Services & Support | 0 (0.0%) | 0 (0.0%) |
| Education Instruction & Library | 8 (4.7%) | 161 (95.3%) |
| Arts, Media & Entertainment | 0 (0.0%) | 0 (0.0%) |
| Health Diagnosing & Treating | 83 (29.0%) | 203 (71.0%) |
| Health Technologists | 0 (0.0%) | 154 (100.0%) |
| Total (Category) | 445 (39.2%) | 689 (60.8%) |
| Total (Overall) | 3,948 (56.6%) | 3,026 (43.4%) |
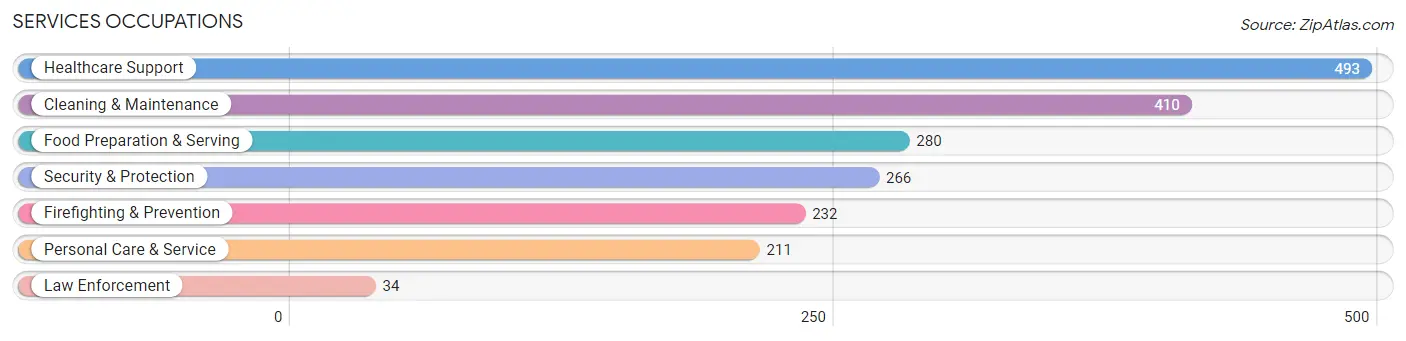
Services Occupations
The most common Services occupations in Opa Locka are Healthcare Support (493 | 7.1%), Cleaning & Maintenance (410 | 5.9%), Food Preparation & Serving (280 | 4.0%), Security & Protection (266 | 3.8%), and Firefighting & Prevention (232 | 3.3%).
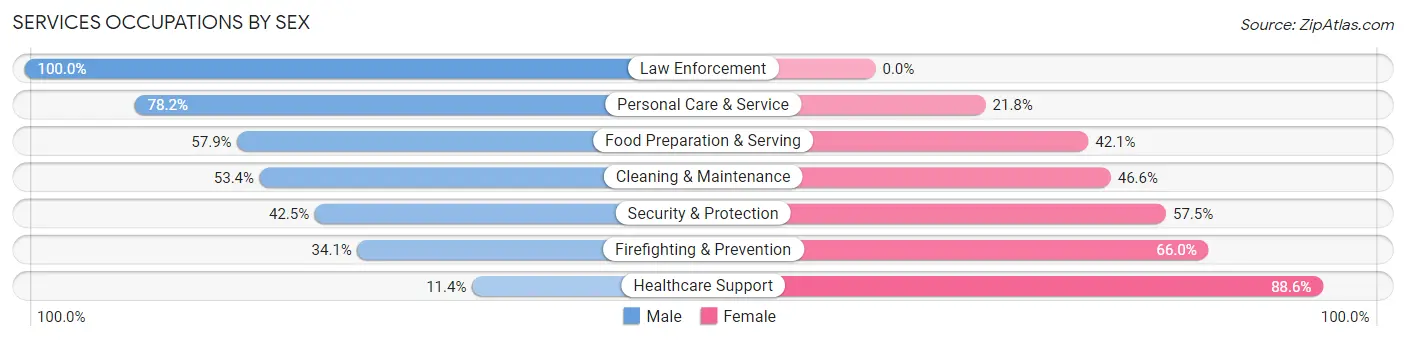
Services Occupations by Sex
Within the Services occupations in Opa Locka, the most male-oriented occupations are Law Enforcement (100.0%), Personal Care & Service (78.2%), and Food Preparation & Serving (57.9%), while the most female-oriented occupations are Healthcare Support (88.6%), Firefighting & Prevention (65.9%), and Security & Protection (57.5%).
| Occupation | Male | Female |
| Healthcare Support | 56 (11.4%) | 437 (88.6%) |
| Security & Protection | 113 (42.5%) | 153 (57.5%) |
| Firefighting & Prevention | 79 (34.1%) | 153 (65.9%) |
| Law Enforcement | 34 (100.0%) | 0 (0.0%) |
| Food Preparation & Serving | 162 (57.9%) | 118 (42.1%) |
| Cleaning & Maintenance | 219 (53.4%) | 191 (46.6%) |
| Personal Care & Service | 165 (78.2%) | 46 (21.8%) |
| Total (Category) | 715 (43.1%) | 945 (56.9%) |
| Total (Overall) | 3,948 (56.6%) | 3,026 (43.4%) |
Sales and Office Occupations
The most common Sales and Office occupations in Opa Locka are Office & Administration (1,093 | 15.7%), and Sales & Related (806 | 11.6%).

Sales and Office Occupations by Sex
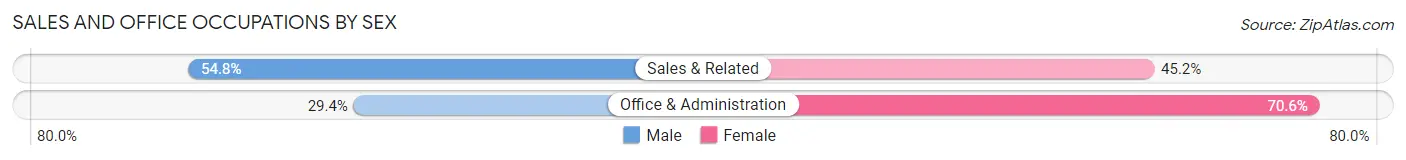
| Occupation | Male | Female |
| Sales & Related | 442 (54.8%) | 364 (45.2%) |
| Office & Administration | 321 (29.4%) | 772 (70.6%) |
| Total (Category) | 763 (40.2%) | 1,136 (59.8%) |
| Total (Overall) | 3,948 (56.6%) | 3,026 (43.4%) |
Natural Resources, Construction and Maintenance Occupations
The most common Natural Resources, Construction and Maintenance occupations in Opa Locka are Construction & Extraction (577 | 8.3%), and Installation, Maintenance & Repair (325 | 4.7%).
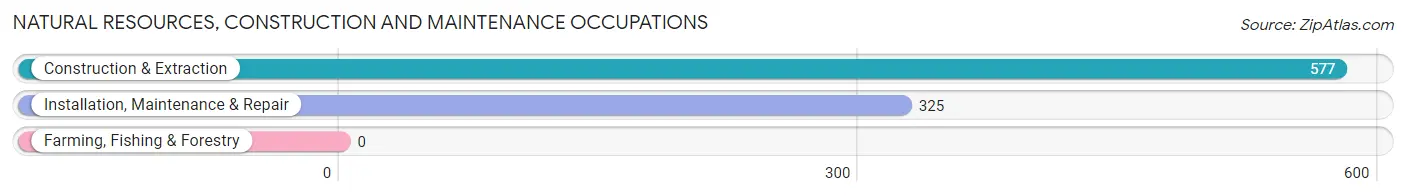
Natural Resources, Construction and Maintenance Occupations by Sex

| Occupation | Male | Female |
| Farming, Fishing & Forestry | 0 (0.0%) | 0 (0.0%) |
| Construction & Extraction | 577 (100.0%) | 0 (0.0%) |
| Installation, Maintenance & Repair | 325 (100.0%) | 0 (0.0%) |
| Total (Category) | 902 (100.0%) | 0 (0.0%) |
| Total (Overall) | 3,948 (56.6%) | 3,026 (43.4%) |
Production, Transportation and Moving Occupations
The most common Production, Transportation and Moving occupations in Opa Locka are Material Moving (600 | 8.6%), Transportation (444 | 6.4%), and Production (335 | 4.8%).
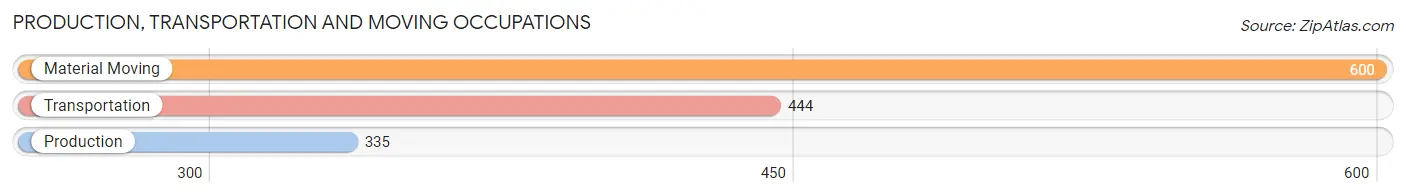
Production, Transportation and Moving Occupations by Sex
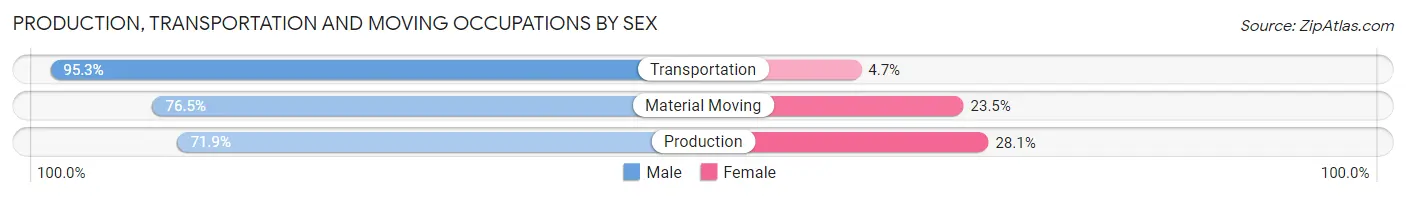
| Occupation | Male | Female |
| Production | 241 (71.9%) | 94 (28.1%) |
| Transportation | 423 (95.3%) | 21 (4.7%) |
| Material Moving | 459 (76.5%) | 141 (23.5%) |
| Total (Category) | 1,123 (81.4%) | 256 (18.6%) |
| Total (Overall) | 3,948 (56.6%) | 3,026 (43.4%) |
Employment Industries by Sex in Opa Locka
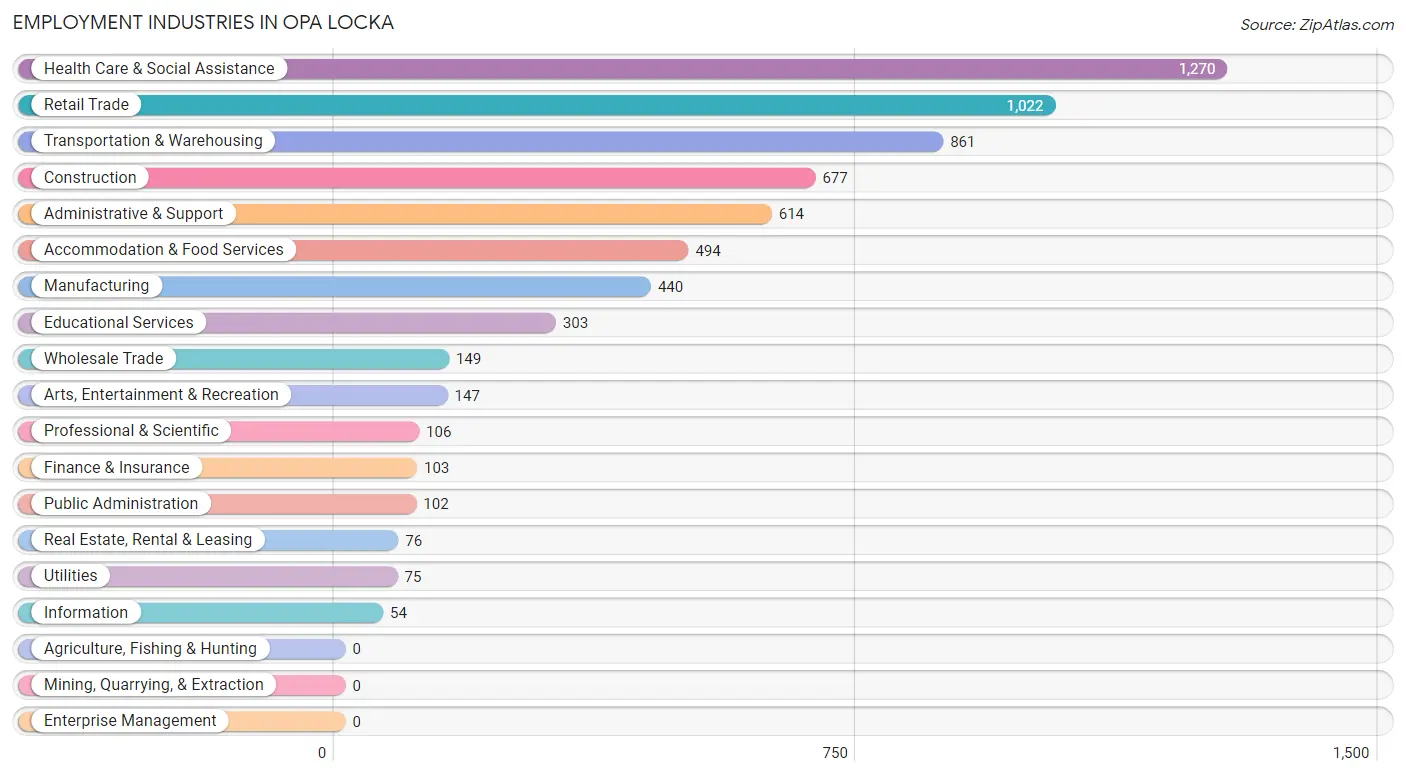
Employment Industries in Opa Locka
The major employment industries in Opa Locka include Health Care & Social Assistance (1,270 | 18.2%), Retail Trade (1,022 | 14.6%), Transportation & Warehousing (861 | 12.3%), Construction (677 | 9.7%), and Administrative & Support (614 | 8.8%).
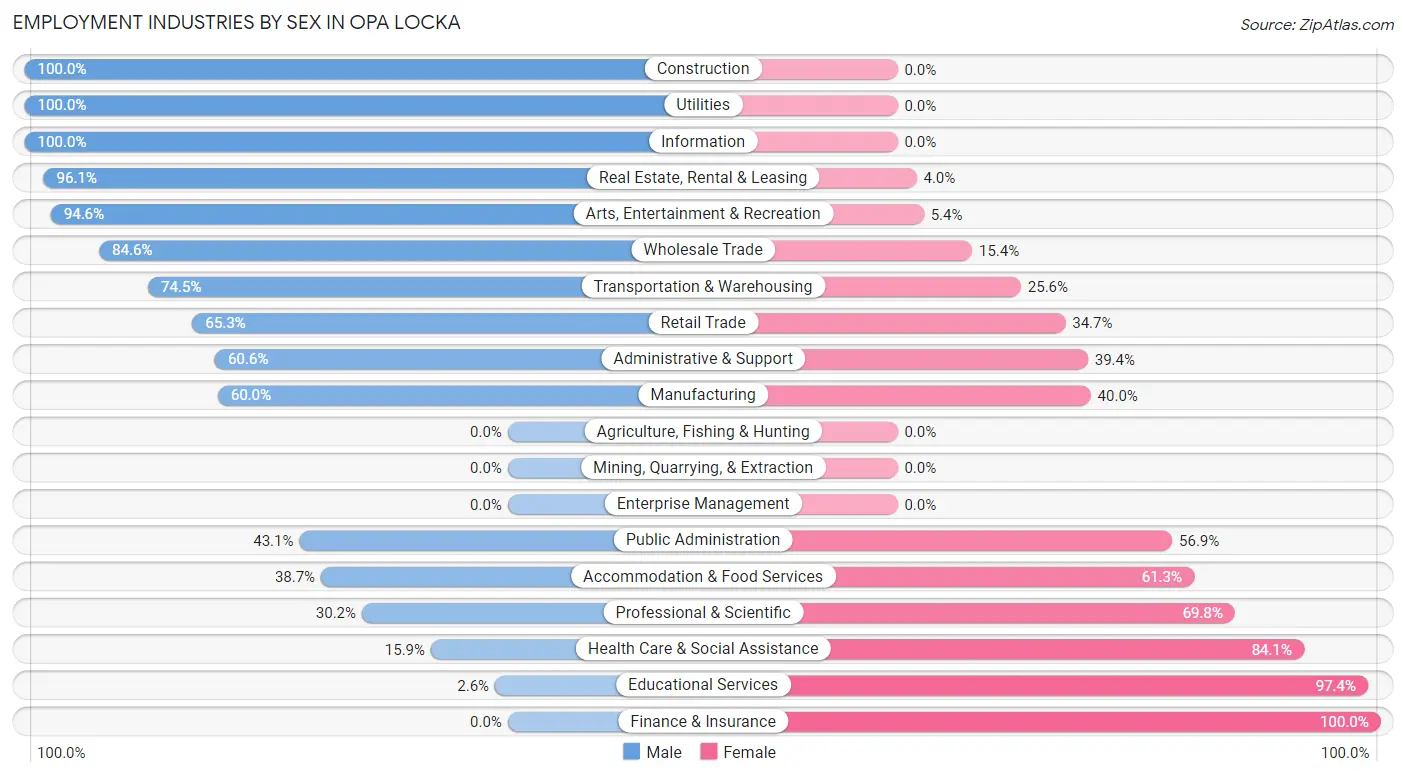
Employment Industries by Sex in Opa Locka
The Opa Locka industries that see more men than women are Construction (100.0%), Utilities (100.0%), and Information (100.0%), whereas the industries that tend to have a higher number of women are Finance & Insurance (100.0%), Educational Services (97.4%), and Health Care & Social Assistance (84.1%).
| Industry | Male | Female |
| Agriculture, Fishing & Hunting | 0 (0.0%) | 0 (0.0%) |
| Mining, Quarrying, & Extraction | 0 (0.0%) | 0 (0.0%) |
| Construction | 677 (100.0%) | 0 (0.0%) |
| Manufacturing | 264 (60.0%) | 176 (40.0%) |
| Wholesale Trade | 126 (84.6%) | 23 (15.4%) |
| Retail Trade | 667 (65.3%) | 355 (34.7%) |
| Transportation & Warehousing | 641 (74.5%) | 220 (25.6%) |
| Utilities | 75 (100.0%) | 0 (0.0%) |
| Information | 54 (100.0%) | 0 (0.0%) |
| Finance & Insurance | 0 (0.0%) | 103 (100.0%) |
| Real Estate, Rental & Leasing | 73 (96.1%) | 3 (4.0%) |
| Professional & Scientific | 32 (30.2%) | 74 (69.8%) |
| Enterprise Management | 0 (0.0%) | 0 (0.0%) |
| Administrative & Support | 372 (60.6%) | 242 (39.4%) |
| Educational Services | 8 (2.6%) | 295 (97.4%) |
| Health Care & Social Assistance | 202 (15.9%) | 1,068 (84.1%) |
| Arts, Entertainment & Recreation | 139 (94.6%) | 8 (5.4%) |
| Accommodation & Food Services | 191 (38.7%) | 303 (61.3%) |
| Public Administration | 44 (43.1%) | 58 (56.9%) |
| Total | 3,948 (56.6%) | 3,026 (43.4%) |
Education in Opa Locka
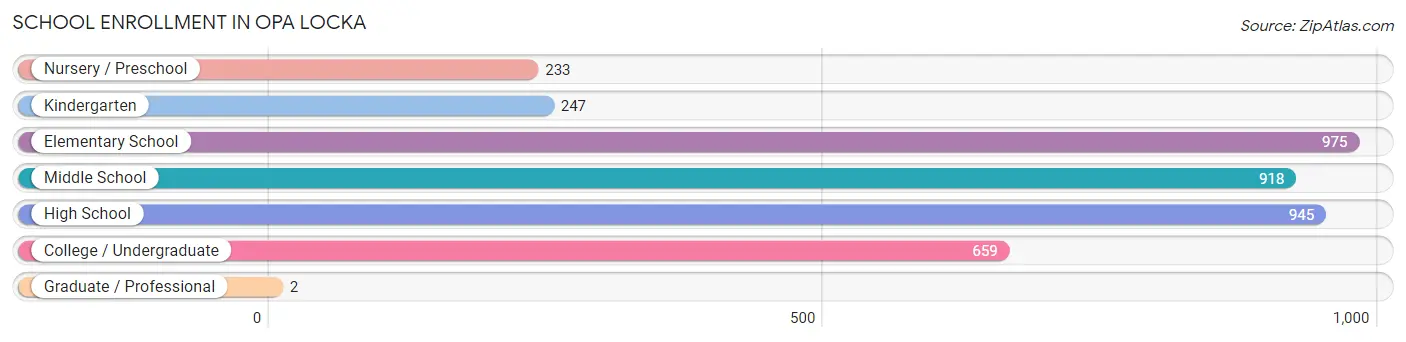
School Enrollment in Opa Locka
The most common levels of schooling among the 3,979 students in Opa Locka are elementary school (975 | 24.5%), high school (945 | 23.7%), and middle school (918 | 23.1%).
| School Level | # Students | % Students |
| Nursery / Preschool | 233 | 5.9% |
| Kindergarten | 247 | 6.2% |
| Elementary School | 975 | 24.5% |
| Middle School | 918 | 23.1% |
| High School | 945 | 23.7% |
| College / Undergraduate | 659 | 16.6% |
| Graduate / Professional | 2 | 0.1% |
| Total | 3,979 | 100.0% |
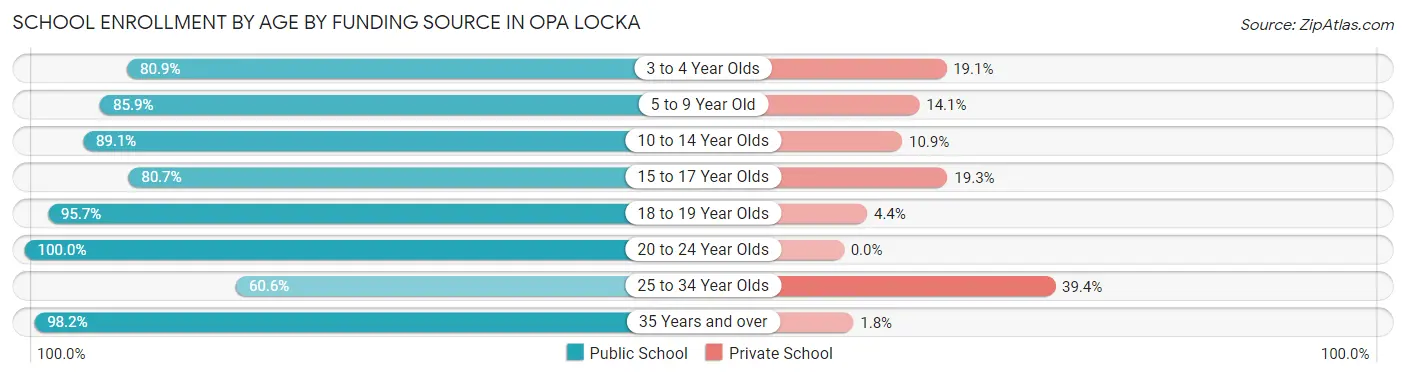
School Enrollment by Age by Funding Source in Opa Locka
Out of a total of 3,979 students who are enrolled in schools in Opa Locka, 597 (15.0%) attend a private institution, while the remaining 3,382 (85.0%) are enrolled in public schools. The age group of 25 to 34 year olds has the highest likelihood of being enrolled in private schools, with 113 (39.4% in the age bracket) enrolled. Conversely, the age group of 20 to 24 year olds has the lowest likelihood of being enrolled in a private school, with 252 (100.0% in the age bracket) attending a public institution.
| Age Bracket | Public School | Private School |
| 3 to 4 Year Olds | 271 (80.9%) | 64 (19.1%) |
| 5 to 9 Year Old | 854 (85.9%) | 140 (14.1%) |
| 10 to 14 Year Olds | 853 (89.1%) | 104 (10.9%) |
| 15 to 17 Year Olds | 693 (80.7%) | 166 (19.3%) |
| 18 to 19 Year Olds | 176 (95.7%) | 8 (4.3%) |
| 20 to 24 Year Olds | 252 (100.0%) | 0 (0.0%) |
| 25 to 34 Year Olds | 174 (60.6%) | 113 (39.4%) |
| 35 Years and over | 109 (98.2%) | 2 (1.8%) |
| Total | 3,382 (85.0%) | 597 (15.0%) |
Educational Attainment by Field of Study in Opa Locka
Business (279 | 33.0%), education (267 | 31.6%), psychology (85 | 10.1%), science & technology (66 | 7.8%), and arts & humanities (58 | 6.9%) are the most common fields of study among 845 individuals in Opa Locka who have obtained a bachelor's degree or higher.
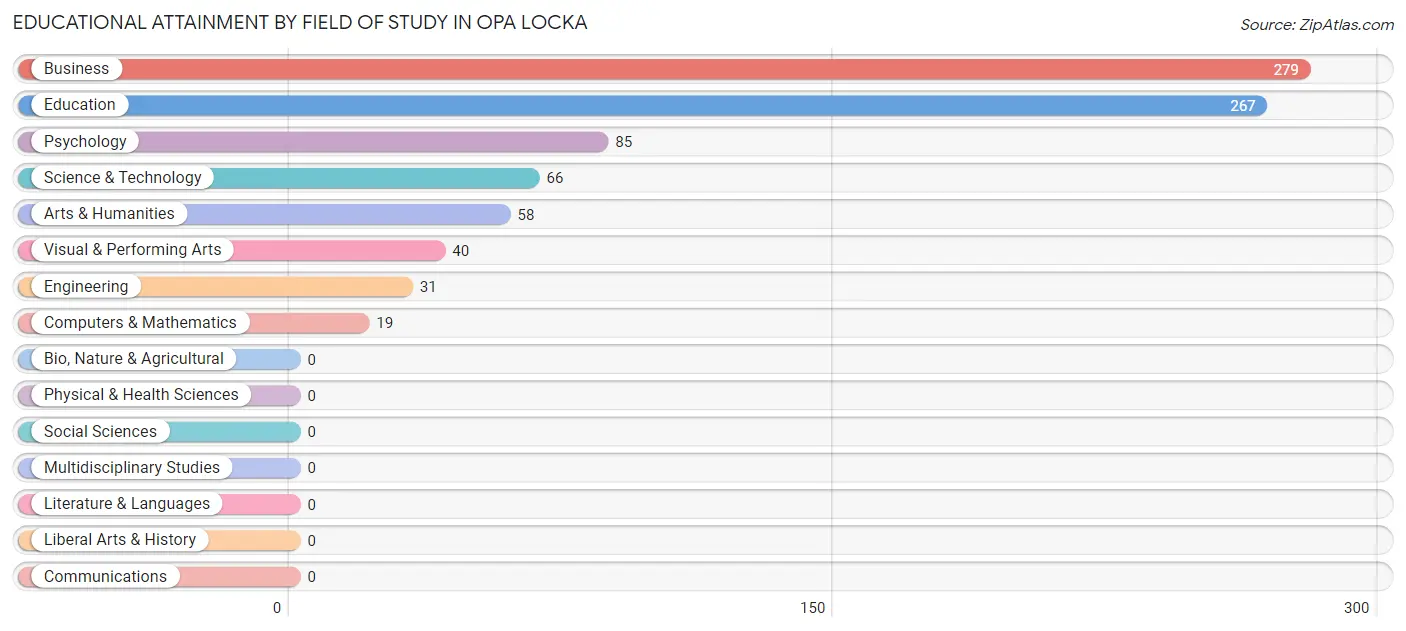
| Field of Study | # Graduates | % Graduates |
| Computers & Mathematics | 19 | 2.2% |
| Bio, Nature & Agricultural | 0 | 0.0% |
| Physical & Health Sciences | 0 | 0.0% |
| Psychology | 85 | 10.1% |
| Social Sciences | 0 | 0.0% |
| Engineering | 31 | 3.7% |
| Multidisciplinary Studies | 0 | 0.0% |
| Science & Technology | 66 | 7.8% |
| Business | 279 | 33.0% |
| Education | 267 | 31.6% |
| Literature & Languages | 0 | 0.0% |
| Liberal Arts & History | 0 | 0.0% |
| Visual & Performing Arts | 40 | 4.7% |
| Communications | 0 | 0.0% |
| Arts & Humanities | 58 | 6.9% |
| Total | 845 | 100.0% |
Transportation & Commute in Opa Locka
Vehicle Availability by Sex in Opa Locka
The most prevalent vehicle ownership categories in Opa Locka are males with 1 vehicle (1,389, accounting for 36.6%) and females with 1 vehicle (1,140, making up 46.2%).
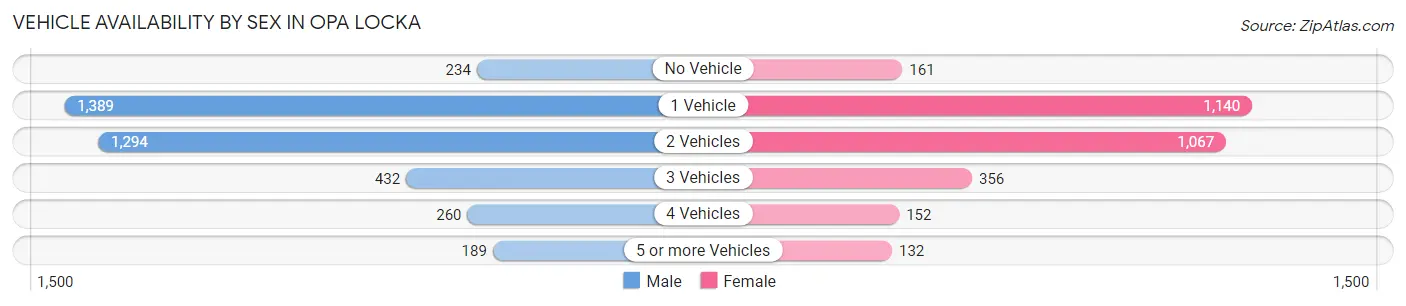
| Vehicles Available | Male | Female |
| No Vehicle | 234 (6.2%) | 161 (5.3%) |
| 1 Vehicle | 1,389 (36.6%) | 1,140 (37.9%) |
| 2 Vehicles | 1,294 (34.1%) | 1,067 (35.5%) |
| 3 Vehicles | 432 (11.4%) | 356 (11.8%) |
| 4 Vehicles | 260 (6.9%) | 152 (5.1%) |
| 5 or more Vehicles | 189 (5.0%) | 132 (4.4%) |
| Total | 3,798 (100.0%) | 3,008 (100.0%) |
Commute Time in Opa Locka
The most frequently occuring commute durations in Opa Locka are 30 to 34 minutes (1,193 commuters, 18.3%), 20 to 24 minutes (994 commuters, 15.2%), and 25 to 29 minutes (944 commuters, 14.4%).
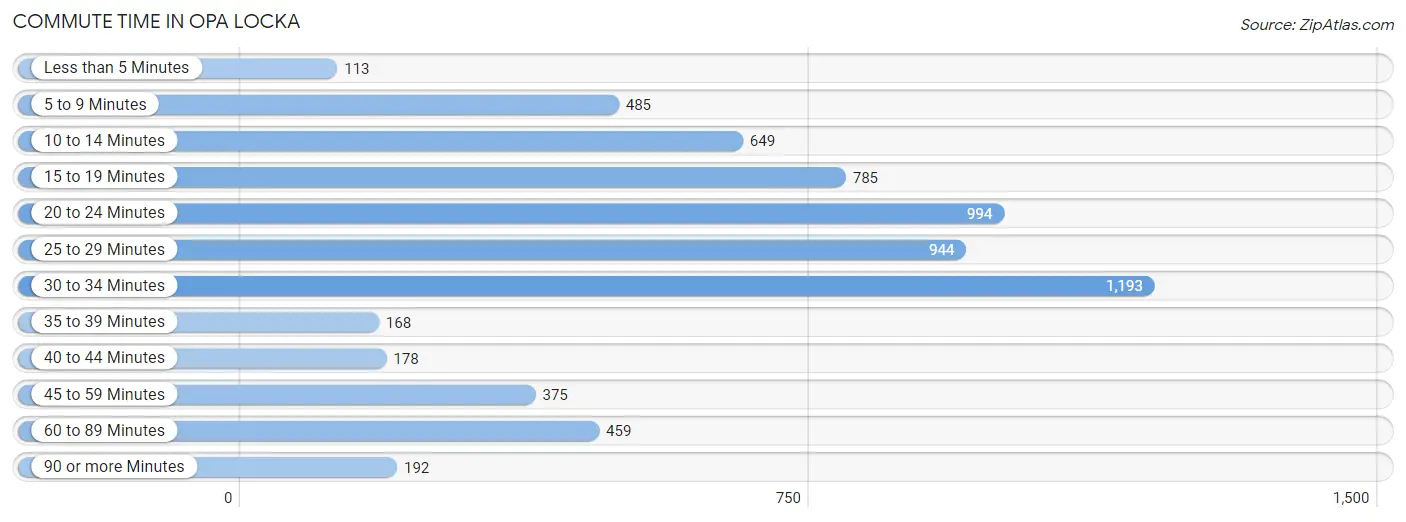
| Commute Time | # Commuters | % Commuters |
| Less than 5 Minutes | 113 | 1.7% |
| 5 to 9 Minutes | 485 | 7.4% |
| 10 to 14 Minutes | 649 | 9.9% |
| 15 to 19 Minutes | 785 | 12.0% |
| 20 to 24 Minutes | 994 | 15.2% |
| 25 to 29 Minutes | 944 | 14.4% |
| 30 to 34 Minutes | 1,193 | 18.3% |
| 35 to 39 Minutes | 168 | 2.6% |
| 40 to 44 Minutes | 178 | 2.7% |
| 45 to 59 Minutes | 375 | 5.7% |
| 60 to 89 Minutes | 459 | 7.0% |
| 90 or more Minutes | 192 | 2.9% |
Commute Time by Sex in Opa Locka
The most common commute times in Opa Locka are 30 to 34 minutes (742 commuters, 20.5%) for males and 25 to 29 minutes (583 commuters, 20.0%) for females.
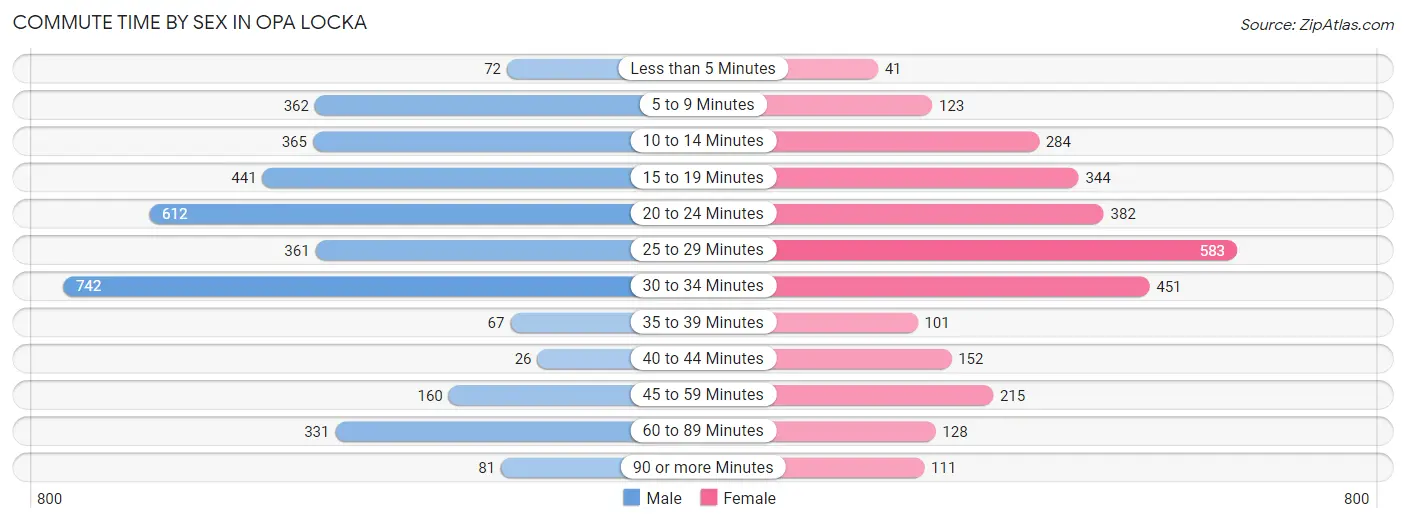
| Commute Time | Male | Female |
| Less than 5 Minutes | 72 (2.0%) | 41 (1.4%) |
| 5 to 9 Minutes | 362 (10.0%) | 123 (4.2%) |
| 10 to 14 Minutes | 365 (10.1%) | 284 (9.7%) |
| 15 to 19 Minutes | 441 (12.2%) | 344 (11.8%) |
| 20 to 24 Minutes | 612 (16.9%) | 382 (13.1%) |
| 25 to 29 Minutes | 361 (10.0%) | 583 (20.0%) |
| 30 to 34 Minutes | 742 (20.5%) | 451 (15.5%) |
| 35 to 39 Minutes | 67 (1.8%) | 101 (3.5%) |
| 40 to 44 Minutes | 26 (0.7%) | 152 (5.2%) |
| 45 to 59 Minutes | 160 (4.4%) | 215 (7.4%) |
| 60 to 89 Minutes | 331 (9.1%) | 128 (4.4%) |
| 90 or more Minutes | 81 (2.2%) | 111 (3.8%) |
Time of Departure to Work by Sex in Opa Locka
The most frequent times of departure to work in Opa Locka are 7:00 AM to 7:29 AM (850, 23.5%) for males and 7:00 AM to 7:29 AM (992, 34.0%) for females.
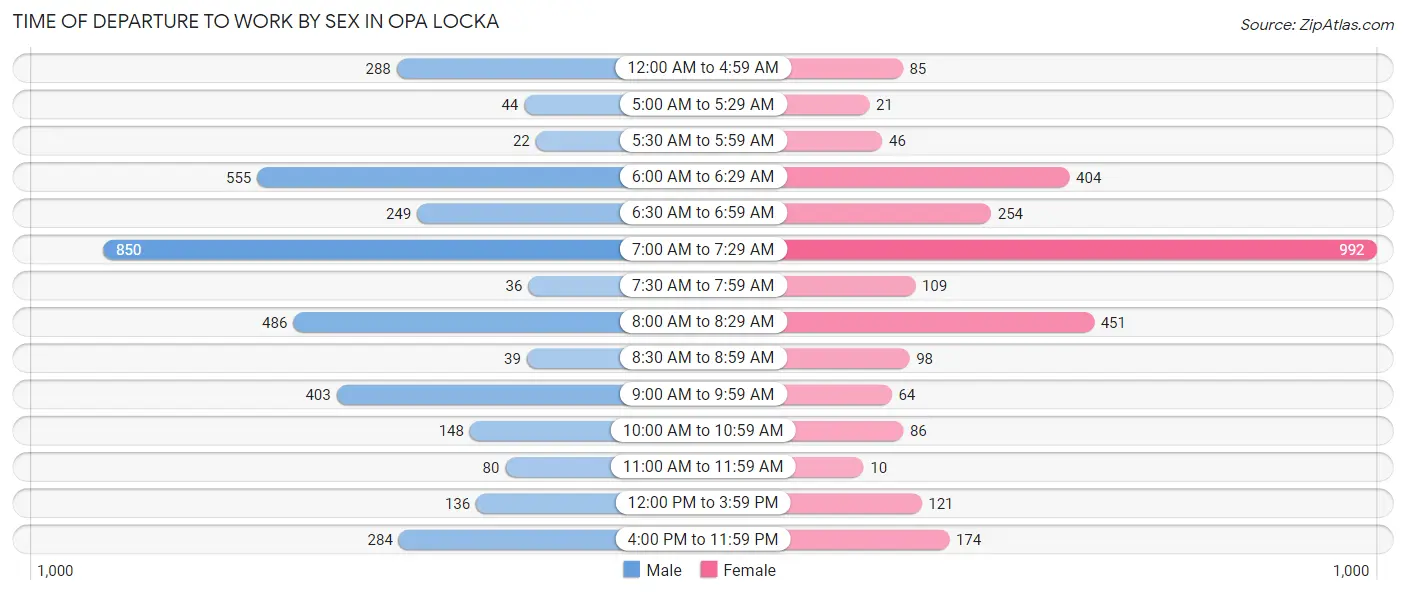
| Time of Departure | Male | Female |
| 12:00 AM to 4:59 AM | 288 (8.0%) | 85 (2.9%) |
| 5:00 AM to 5:29 AM | 44 (1.2%) | 21 (0.7%) |
| 5:30 AM to 5:59 AM | 22 (0.6%) | 46 (1.6%) |
| 6:00 AM to 6:29 AM | 555 (15.3%) | 404 (13.9%) |
| 6:30 AM to 6:59 AM | 249 (6.9%) | 254 (8.7%) |
| 7:00 AM to 7:29 AM | 850 (23.5%) | 992 (34.0%) |
| 7:30 AM to 7:59 AM | 36 (1.0%) | 109 (3.7%) |
| 8:00 AM to 8:29 AM | 486 (13.4%) | 451 (15.5%) |
| 8:30 AM to 8:59 AM | 39 (1.1%) | 98 (3.4%) |
| 9:00 AM to 9:59 AM | 403 (11.1%) | 64 (2.2%) |
| 10:00 AM to 10:59 AM | 148 (4.1%) | 86 (2.9%) |
| 11:00 AM to 11:59 AM | 80 (2.2%) | 10 (0.3%) |
| 12:00 PM to 3:59 PM | 136 (3.8%) | 121 (4.2%) |
| 4:00 PM to 11:59 PM | 284 (7.9%) | 174 (6.0%) |
| Total | 3,620 (100.0%) | 2,915 (100.0%) |
Housing Occupancy in Opa Locka
Occupancy by Ownership in Opa Locka
Of the total 6,231 dwellings in Opa Locka, owner-occupied units account for 1,992 (32.0%), while renter-occupied units make up 4,239 (68.0%).
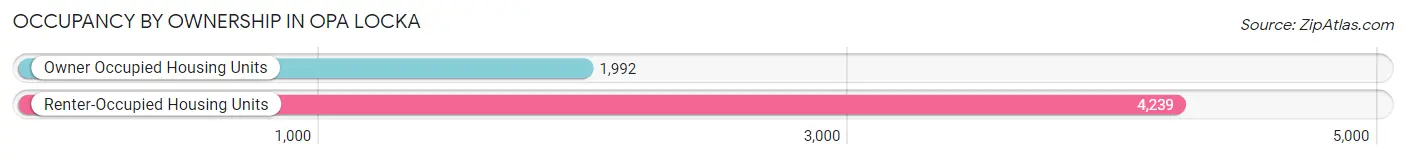
| Occupancy | # Housing Units | % Housing Units |
| Owner Occupied Housing Units | 1,992 | 32.0% |
| Renter-Occupied Housing Units | 4,239 | 68.0% |
| Total Occupied Housing Units | 6,231 | 100.0% |
Occupancy by Household Size in Opa Locka
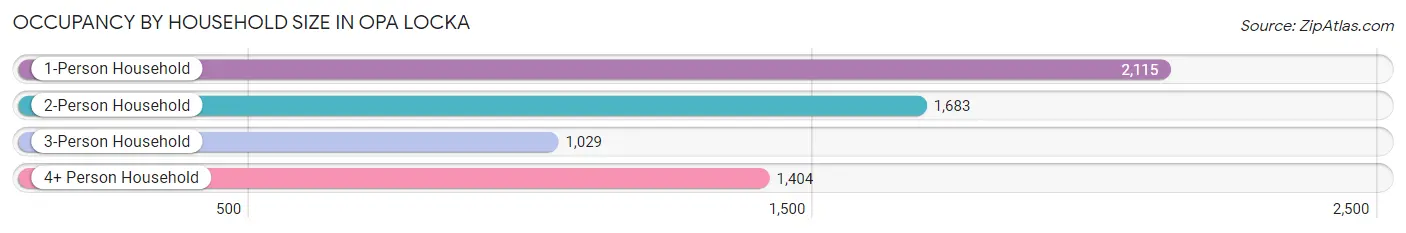
| Household Size | # Housing Units | % Housing Units |
| 1-Person Household | 2,115 | 33.9% |
| 2-Person Household | 1,683 | 27.0% |
| 3-Person Household | 1,029 | 16.5% |
| 4+ Person Household | 1,404 | 22.5% |
| Total Housing Units | 6,231 | 100.0% |
Occupancy by Ownership by Household Size in Opa Locka
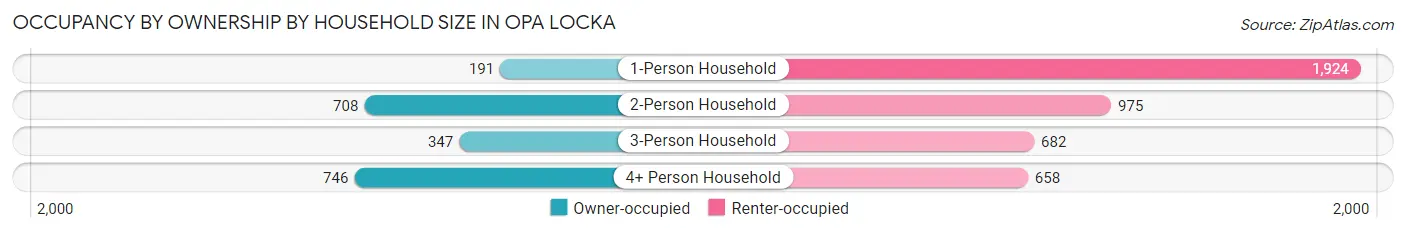
| Household Size | Owner-occupied | Renter-occupied |
| 1-Person Household | 191 (9.0%) | 1,924 (91.0%) |
| 2-Person Household | 708 (42.1%) | 975 (57.9%) |
| 3-Person Household | 347 (33.7%) | 682 (66.3%) |
| 4+ Person Household | 746 (53.1%) | 658 (46.9%) |
| Total Housing Units | 1,992 (32.0%) | 4,239 (68.0%) |
Occupancy by Educational Attainment in Opa Locka
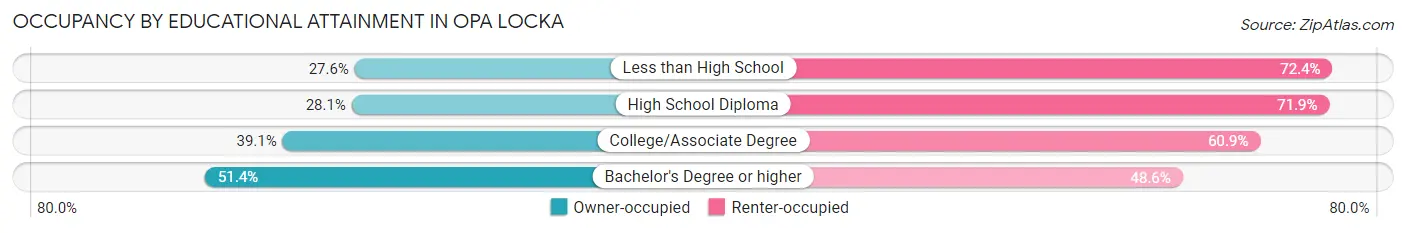
| Household Size | Owner-occupied | Renter-occupied |
| Less than High School | 505 (27.6%) | 1,322 (72.4%) |
| High School Diploma | 748 (28.1%) | 1,912 (71.9%) |
| College/Associate Degree | 500 (39.1%) | 779 (60.9%) |
| Bachelor's Degree or higher | 239 (51.4%) | 226 (48.6%) |
Occupancy by Age of Householder in Opa Locka
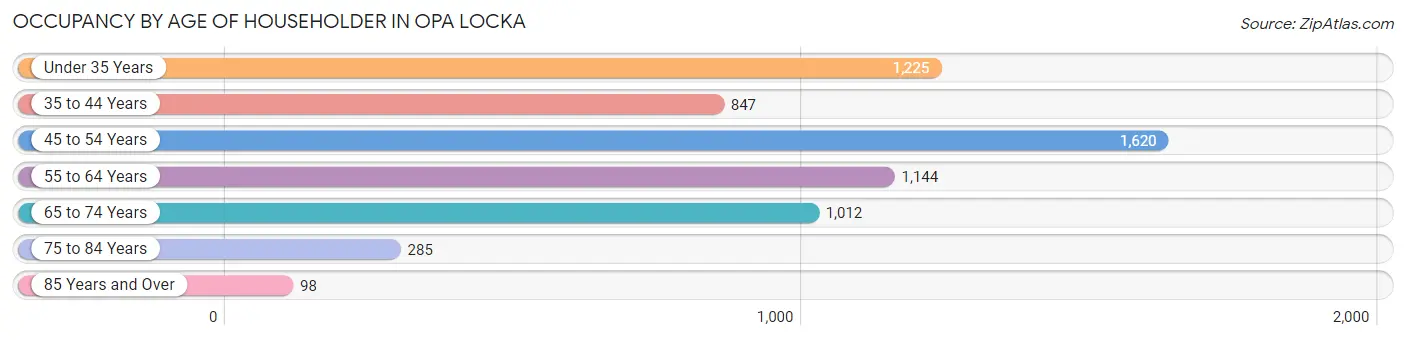
| Age Bracket | # Households | % Households |
| Under 35 Years | 1,225 | 19.7% |
| 35 to 44 Years | 847 | 13.6% |
| 45 to 54 Years | 1,620 | 26.0% |
| 55 to 64 Years | 1,144 | 18.4% |
| 65 to 74 Years | 1,012 | 16.2% |
| 75 to 84 Years | 285 | 4.6% |
| 85 Years and Over | 98 | 1.6% |
| Total | 6,231 | 100.0% |
Housing Finances in Opa Locka
Median Income by Occupancy in Opa Locka
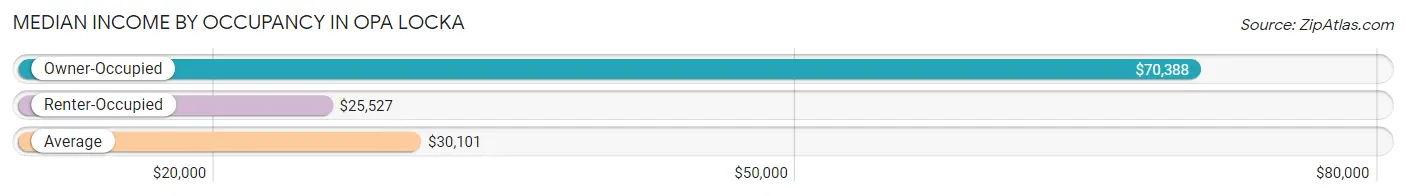
| Occupancy Type | # Households | Median Income |
| Owner-Occupied | 1,992 (32.0%) | $70,388 |
| Renter-Occupied | 4,239 (68.0%) | $25,527 |
| Average | 6,231 (100.0%) | $30,101 |
Occupancy by Householder Income Bracket in Opa Locka
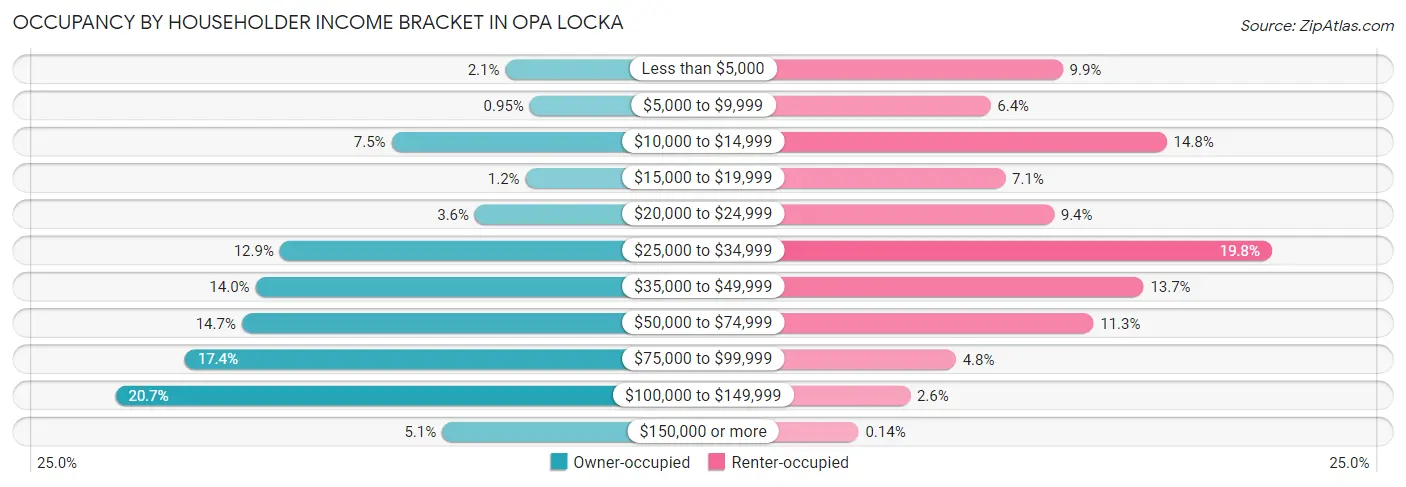
| Income Bracket | Owner-occupied | Renter-occupied |
| Less than $5,000 | 42 (2.1%) | 418 (9.9%) |
| $5,000 to $9,999 | 19 (0.9%) | 272 (6.4%) |
| $10,000 to $14,999 | 150 (7.5%) | 628 (14.8%) |
| $15,000 to $19,999 | 23 (1.1%) | 302 (7.1%) |
| $20,000 to $24,999 | 71 (3.6%) | 400 (9.4%) |
| $25,000 to $34,999 | 256 (12.9%) | 840 (19.8%) |
| $35,000 to $49,999 | 279 (14.0%) | 581 (13.7%) |
| $50,000 to $74,999 | 292 (14.7%) | 480 (11.3%) |
| $75,000 to $99,999 | 346 (17.4%) | 202 (4.8%) |
| $100,000 to $149,999 | 412 (20.7%) | 110 (2.6%) |
| $150,000 or more | 102 (5.1%) | 6 (0.1%) |
| Total | 1,992 (100.0%) | 4,239 (100.0%) |
Monthly Housing Cost Tiers in Opa Locka
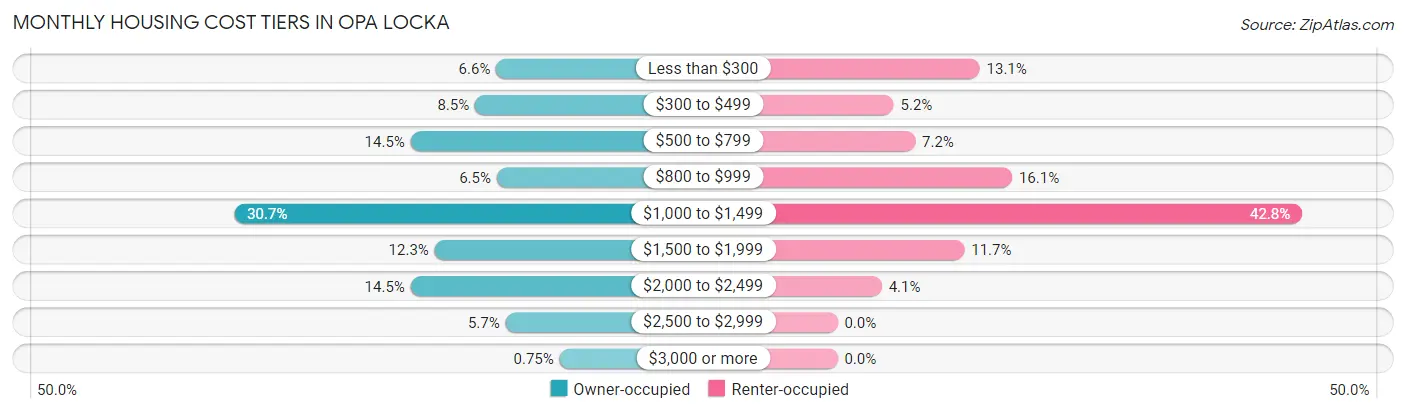
| Monthly Cost | Owner-occupied | Renter-occupied |
| Less than $300 | 131 (6.6%) | 555 (13.1%) |
| $300 to $499 | 170 (8.5%) | 219 (5.2%) |
| $500 to $799 | 288 (14.5%) | 303 (7.1%) |
| $800 to $999 | 130 (6.5%) | 681 (16.1%) |
| $1,000 to $1,499 | 612 (30.7%) | 1,813 (42.8%) |
| $1,500 to $1,999 | 244 (12.2%) | 495 (11.7%) |
| $2,000 to $2,499 | 288 (14.5%) | 173 (4.1%) |
| $2,500 to $2,999 | 114 (5.7%) | 0 (0.0%) |
| $3,000 or more | 15 (0.7%) | 0 (0.0%) |
| Total | 1,992 (100.0%) | 4,239 (100.0%) |
Physical Housing Characteristics in Opa Locka
Housing Structures in Opa Locka
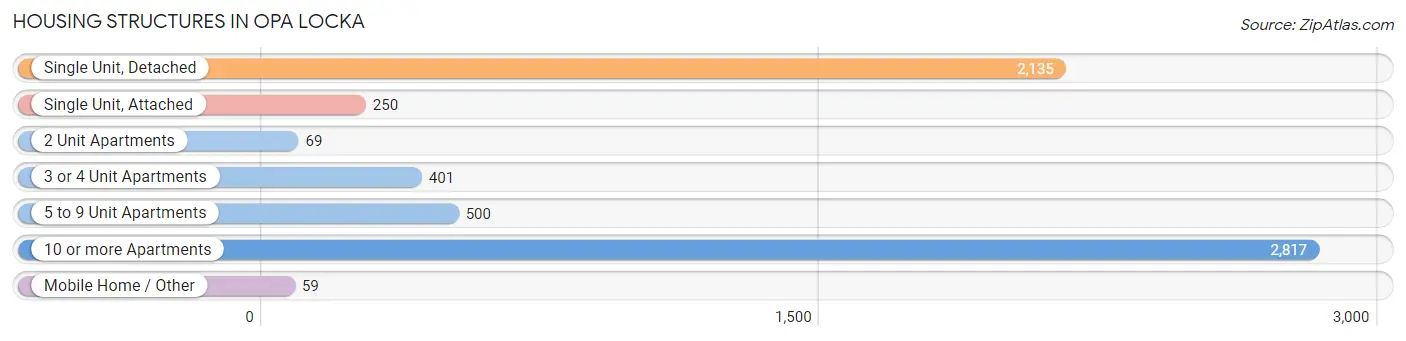
| Structure Type | # Housing Units | % Housing Units |
| Single Unit, Detached | 2,135 | 34.3% |
| Single Unit, Attached | 250 | 4.0% |
| 2 Unit Apartments | 69 | 1.1% |
| 3 or 4 Unit Apartments | 401 | 6.4% |
| 5 to 9 Unit Apartments | 500 | 8.0% |
| 10 or more Apartments | 2,817 | 45.2% |
| Mobile Home / Other | 59 | 0.9% |
| Total | 6,231 | 100.0% |
Housing Structures by Occupancy in Opa Locka
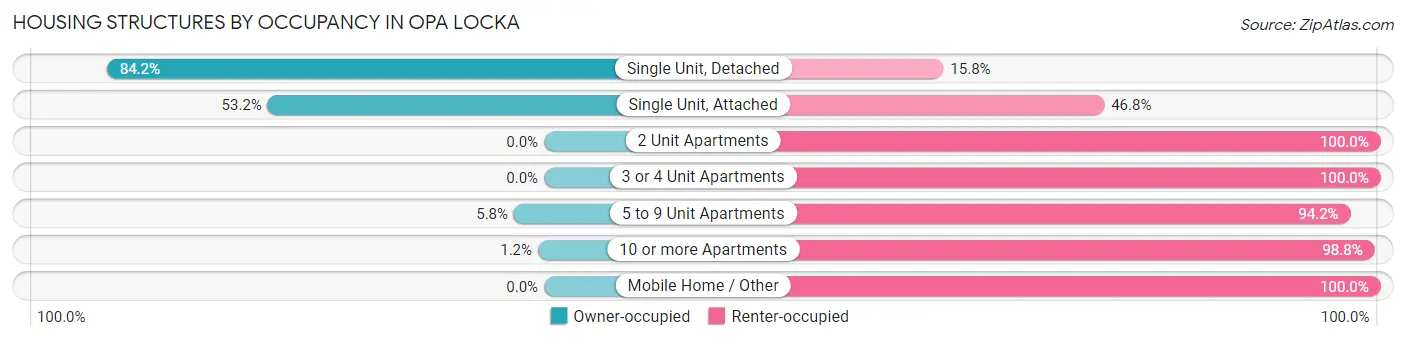
| Structure Type | Owner-occupied | Renter-occupied |
| Single Unit, Detached | 1,797 (84.2%) | 338 (15.8%) |
| Single Unit, Attached | 133 (53.2%) | 117 (46.8%) |
| 2 Unit Apartments | 0 (0.0%) | 69 (100.0%) |
| 3 or 4 Unit Apartments | 0 (0.0%) | 401 (100.0%) |
| 5 to 9 Unit Apartments | 29 (5.8%) | 471 (94.2%) |
| 10 or more Apartments | 33 (1.2%) | 2,784 (98.8%) |
| Mobile Home / Other | 0 (0.0%) | 59 (100.0%) |
| Total | 1,992 (32.0%) | 4,239 (68.0%) |
Housing Structures by Number of Rooms in Opa Locka
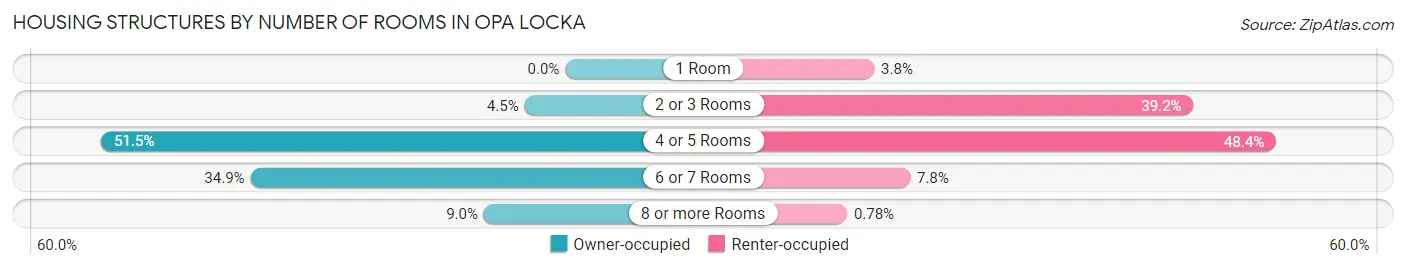
| Number of Rooms | Owner-occupied | Renter-occupied |
| 1 Room | 0 (0.0%) | 161 (3.8%) |
| 2 or 3 Rooms | 90 (4.5%) | 1,663 (39.2%) |
| 4 or 5 Rooms | 1,026 (51.5%) | 2,052 (48.4%) |
| 6 or 7 Rooms | 696 (34.9%) | 330 (7.8%) |
| 8 or more Rooms | 180 (9.0%) | 33 (0.8%) |
| Total | 1,992 (100.0%) | 4,239 (100.0%) |
Housing Structure by Heating Type in Opa Locka
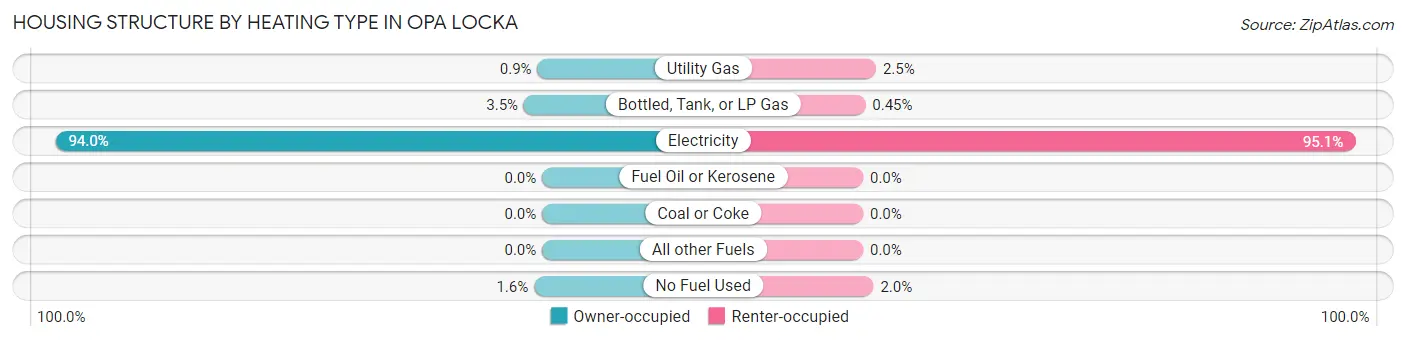
| Heating Type | Owner-occupied | Renter-occupied |
| Utility Gas | 18 (0.9%) | 106 (2.5%) |
| Bottled, Tank, or LP Gas | 70 (3.5%) | 19 (0.4%) |
| Electricity | 1,873 (94.0%) | 4,029 (95.1%) |
| Fuel Oil or Kerosene | 0 (0.0%) | 0 (0.0%) |
| Coal or Coke | 0 (0.0%) | 0 (0.0%) |
| All other Fuels | 0 (0.0%) | 0 (0.0%) |
| No Fuel Used | 31 (1.6%) | 85 (2.0%) |
| Total | 1,992 (100.0%) | 4,239 (100.0%) |
Household Vehicle Usage in Opa Locka
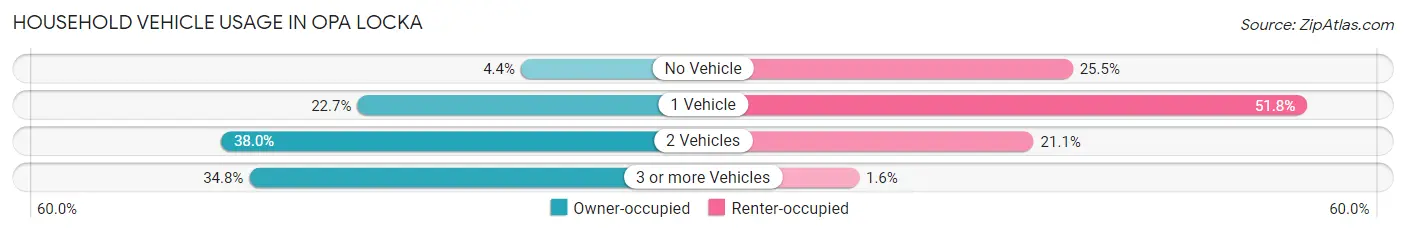
| Vehicles per Household | Owner-occupied | Renter-occupied |
| No Vehicle | 88 (4.4%) | 1,082 (25.5%) |
| 1 Vehicle | 453 (22.7%) | 2,194 (51.8%) |
| 2 Vehicles | 757 (38.0%) | 896 (21.1%) |
| 3 or more Vehicles | 694 (34.8%) | 67 (1.6%) |
| Total | 1,992 (100.0%) | 4,239 (100.0%) |
Real Estate & Mortgages in Opa Locka
Real Estate and Mortgage Overview in Opa Locka
| Characteristic | Without Mortgage | With Mortgage |
| Housing Units | 677 | 1,315 |
| Median Property Value | $224,700 | $267,700 |
| Median Household Income | - | - |
| Monthly Housing Costs | $557 | $15 |
| Real Estate Taxes | $1,885 | $0 |
Property Value by Mortgage Status in Opa Locka
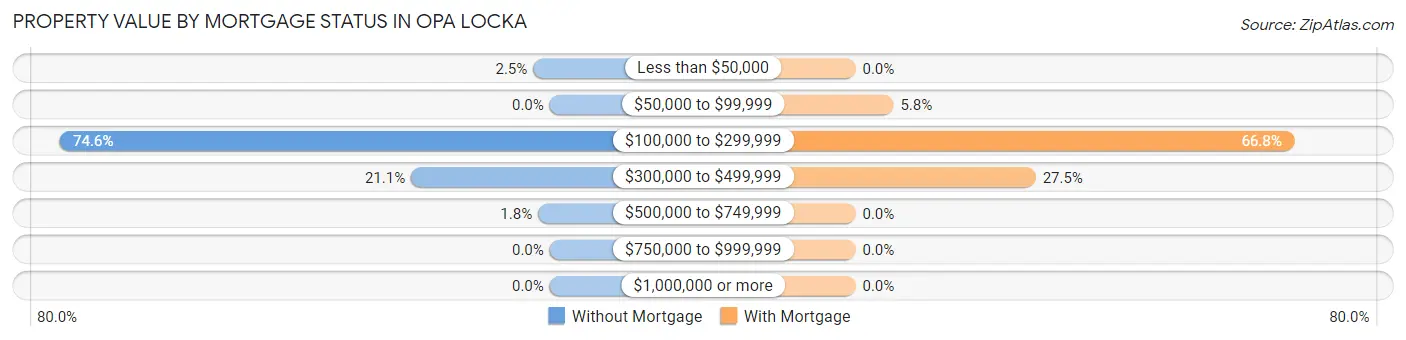
| Property Value | Without Mortgage | With Mortgage |
| Less than $50,000 | 17 (2.5%) | 0 (0.0%) |
| $50,000 to $99,999 | 0 (0.0%) | 76 (5.8%) |
| $100,000 to $299,999 | 505 (74.6%) | 878 (66.8%) |
| $300,000 to $499,999 | 143 (21.1%) | 361 (27.5%) |
| $500,000 to $749,999 | 12 (1.8%) | 0 (0.0%) |
| $750,000 to $999,999 | 0 (0.0%) | 0 (0.0%) |
| $1,000,000 or more | 0 (0.0%) | 0 (0.0%) |
| Total | 677 (100.0%) | 1,315 (100.0%) |
Household Income by Mortgage Status in Opa Locka
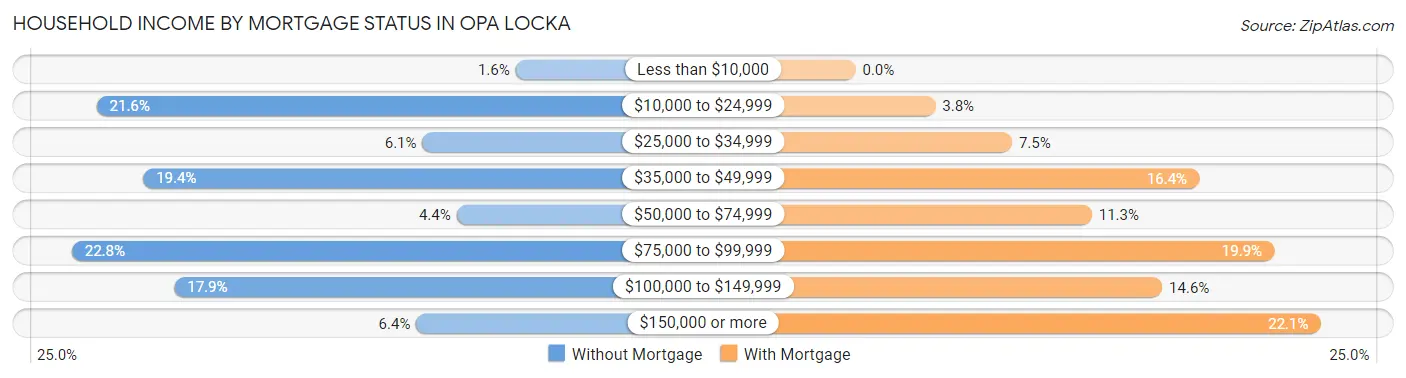
| Household Income | Without Mortgage | With Mortgage |
| Less than $10,000 | 11 (1.6%) | 0 (0.0%) |
| $10,000 to $24,999 | 146 (21.6%) | 50 (3.8%) |
| $25,000 to $34,999 | 41 (6.1%) | 98 (7.4%) |
| $35,000 to $49,999 | 131 (19.4%) | 215 (16.4%) |
| $50,000 to $74,999 | 30 (4.4%) | 148 (11.3%) |
| $75,000 to $99,999 | 154 (22.8%) | 262 (19.9%) |
| $100,000 to $149,999 | 121 (17.9%) | 192 (14.6%) |
| $150,000 or more | 43 (6.4%) | 291 (22.1%) |
| Total | 677 (100.0%) | 1,315 (100.0%) |
Property Value to Household Income Ratio in Opa Locka
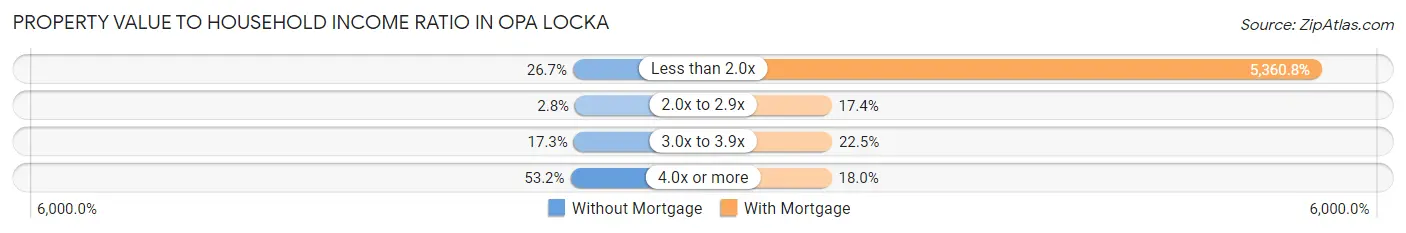
| Value-to-Income Ratio | Without Mortgage | With Mortgage |
| Less than 2.0x | 181 (26.7%) | 70,495 (5,360.8%) |
| 2.0x to 2.9x | 19 (2.8%) | 229 (17.4%) |
| 3.0x to 3.9x | 117 (17.3%) | 296 (22.5%) |
| 4.0x or more | 360 (53.2%) | 236 (17.9%) |
| Total | 677 (100.0%) | 1,315 (100.0%) |
Real Estate Taxes by Mortgage Status in Opa Locka
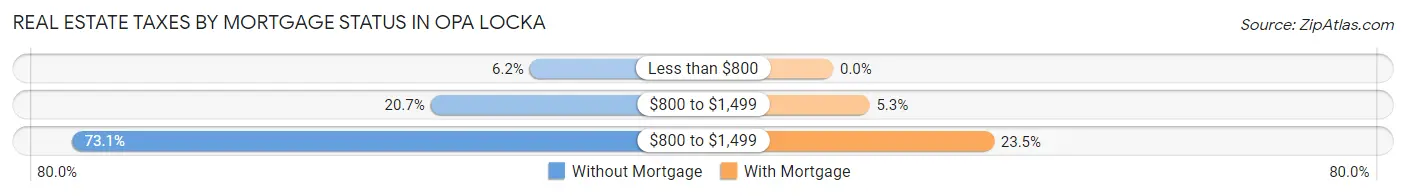
| Property Taxes | Without Mortgage | With Mortgage |
| Less than $800 | 42 (6.2%) | 0 (0.0%) |
| $800 to $1,499 | 140 (20.7%) | 70 (5.3%) |
| $800 to $1,499 | 495 (73.1%) | 309 (23.5%) |
| Total | 677 (100.0%) | 1,315 (100.0%) |
Health & Disability in Opa Locka
Health Insurance Coverage by Age in Opa Locka
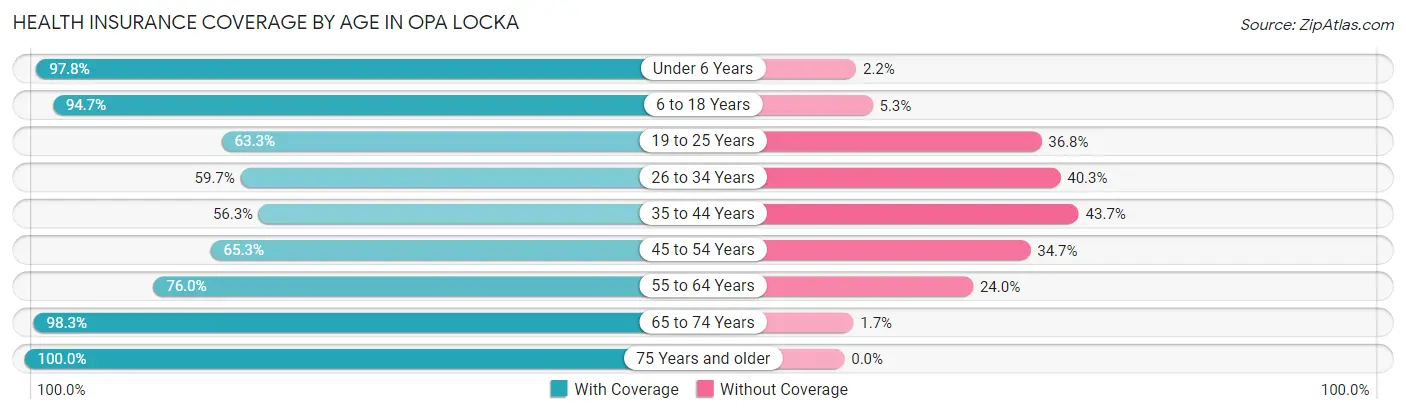
| Age Bracket | With Coverage | Without Coverage |
| Under 6 Years | 1,073 (97.8%) | 24 (2.2%) |
| 6 to 18 Years | 2,864 (94.7%) | 159 (5.3%) |
| 19 to 25 Years | 945 (63.2%) | 549 (36.7%) |
| 26 to 34 Years | 1,496 (59.7%) | 1,009 (40.3%) |
| 35 to 44 Years | 979 (56.3%) | 760 (43.7%) |
| 45 to 54 Years | 1,576 (65.3%) | 837 (34.7%) |
| 55 to 64 Years | 1,330 (76.0%) | 420 (24.0%) |
| 65 to 74 Years | 1,395 (98.3%) | 24 (1.7%) |
| 75 Years and older | 787 (100.0%) | 0 (0.0%) |
| Total | 12,445 (76.7%) | 3,782 (23.3%) |
Health Insurance Coverage by Citizenship Status in Opa Locka

| Citizenship Status | With Coverage | Without Coverage |
| Native Born | 1,073 (97.8%) | 24 (2.2%) |
| Foreign Born, Citizen | 2,864 (94.7%) | 159 (5.3%) |
| Foreign Born, not a Citizen | 945 (63.2%) | 549 (36.7%) |
Health Insurance Coverage by Household Income in Opa Locka
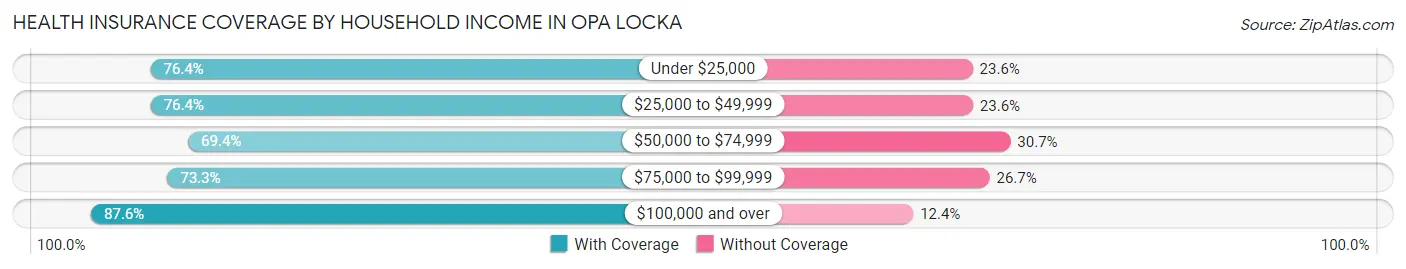
| Household Income | With Coverage | Without Coverage |
| Under $25,000 | 3,263 (76.4%) | 1,007 (23.6%) |
| $25,000 to $49,999 | 3,855 (76.4%) | 1,193 (23.6%) |
| $50,000 to $74,999 | 1,584 (69.4%) | 700 (30.6%) |
| $75,000 to $99,999 | 1,518 (73.3%) | 554 (26.7%) |
| $100,000 and over | 2,204 (87.6%) | 313 (12.4%) |
Public vs Private Health Insurance Coverage by Age in Opa Locka
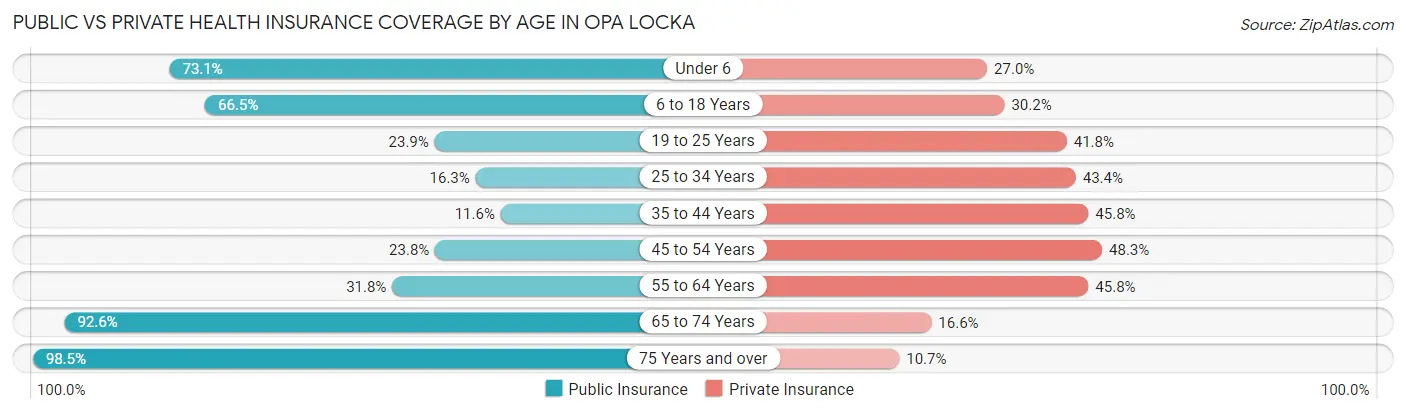
| Age Bracket | Public Insurance | Private Insurance |
| Under 6 | 802 (73.1%) | 296 (27.0%) |
| 6 to 18 Years | 2,010 (66.5%) | 913 (30.2%) |
| 19 to 25 Years | 357 (23.9%) | 624 (41.8%) |
| 25 to 34 Years | 408 (16.3%) | 1,088 (43.4%) |
| 35 to 44 Years | 202 (11.6%) | 796 (45.8%) |
| 45 to 54 Years | 574 (23.8%) | 1,166 (48.3%) |
| 55 to 64 Years | 556 (31.8%) | 801 (45.8%) |
| 65 to 74 Years | 1,314 (92.6%) | 236 (16.6%) |
| 75 Years and over | 775 (98.5%) | 84 (10.7%) |
| Total | 6,998 (43.1%) | 6,004 (37.0%) |
Disability Status by Sex by Age in Opa Locka
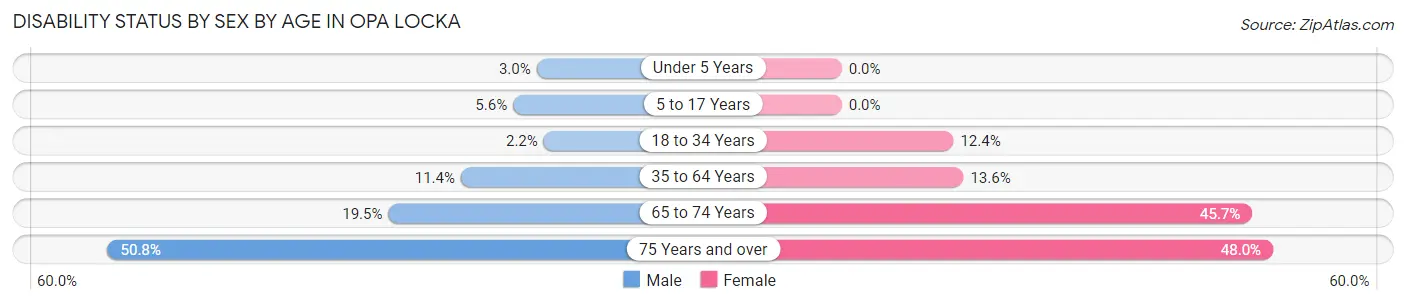
| Age Bracket | Male | Female |
| Under 5 Years | 19 (3.0%) | 0 (0.0%) |
| 5 to 17 Years | 97 (5.6%) | 0 (0.0%) |
| 18 to 34 Years | 43 (2.2%) | 290 (12.4%) |
| 35 to 64 Years | 357 (11.4%) | 376 (13.6%) |
| 65 to 74 Years | 118 (19.5%) | 372 (45.7%) |
| 75 Years and over | 170 (50.7%) | 217 (48.0%) |
Disability Class by Sex by Age in Opa Locka
Disability Class: Hearing Difficulty
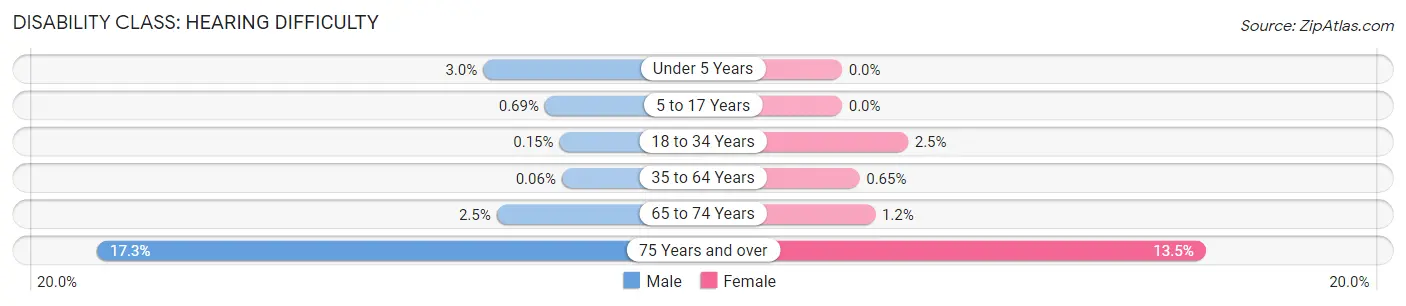
| Age Bracket | Male | Female |
| Under 5 Years | 19 (3.0%) | 0 (0.0%) |
| 5 to 17 Years | 12 (0.7%) | 0 (0.0%) |
| 18 to 34 Years | 3 (0.2%) | 57 (2.5%) |
| 35 to 64 Years | 2 (0.1%) | 18 (0.6%) |
| 65 to 74 Years | 15 (2.5%) | 10 (1.2%) |
| 75 Years and over | 58 (17.3%) | 61 (13.5%) |
Disability Class: Vision Difficulty
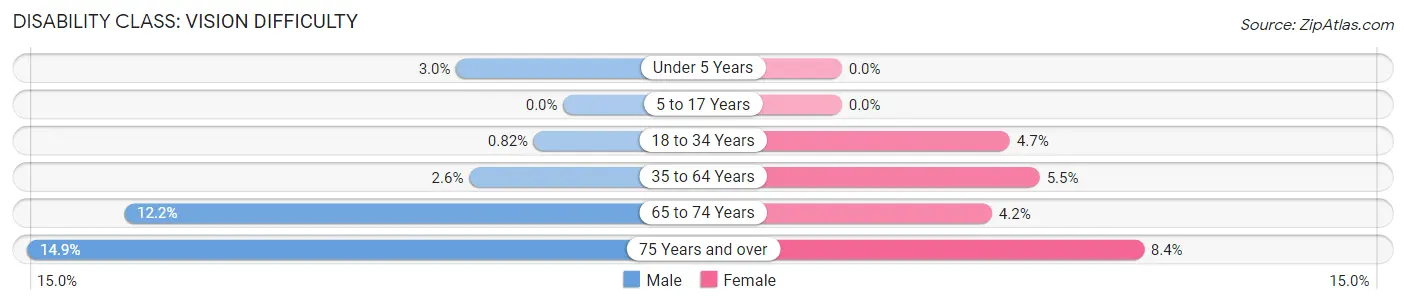
| Age Bracket | Male | Female |
| Under 5 Years | 19 (3.0%) | 0 (0.0%) |
| 5 to 17 Years | 0 (0.0%) | 0 (0.0%) |
| 18 to 34 Years | 16 (0.8%) | 109 (4.7%) |
| 35 to 64 Years | 82 (2.6%) | 153 (5.5%) |
| 65 to 74 Years | 74 (12.2%) | 34 (4.2%) |
| 75 Years and over | 50 (14.9%) | 38 (8.4%) |
Disability Class: Cognitive Difficulty
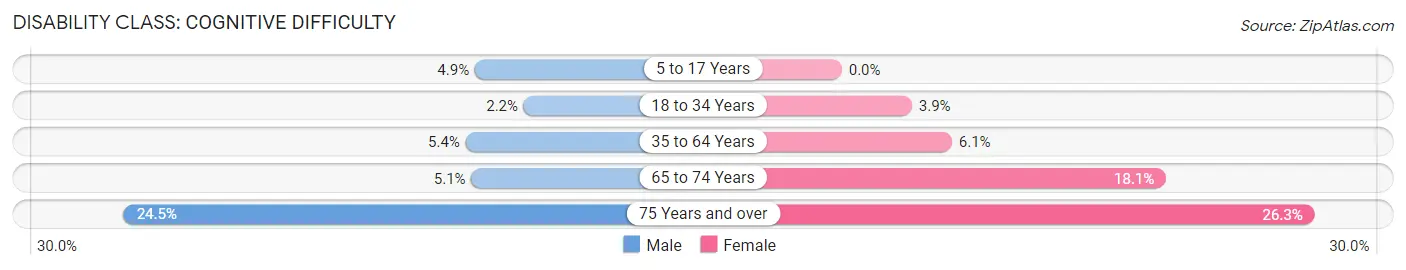
| Age Bracket | Male | Female |
| 5 to 17 Years | 85 (4.9%) | 0 (0.0%) |
| 18 to 34 Years | 43 (2.2%) | 91 (3.9%) |
| 35 to 64 Years | 170 (5.4%) | 170 (6.1%) |
| 65 to 74 Years | 31 (5.1%) | 147 (18.1%) |
| 75 Years and over | 82 (24.5%) | 119 (26.3%) |
Disability Class: Ambulatory Difficulty
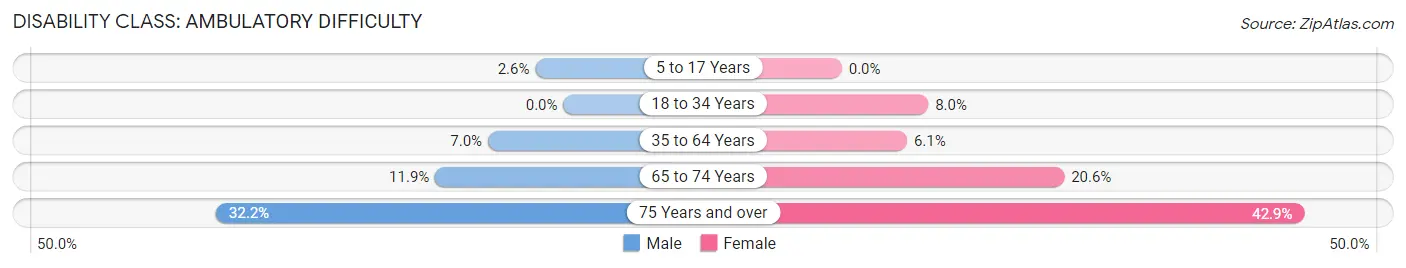
| Age Bracket | Male | Female |
| 5 to 17 Years | 45 (2.6%) | 0 (0.0%) |
| 18 to 34 Years | 0 (0.0%) | 187 (8.0%) |
| 35 to 64 Years | 219 (7.0%) | 168 (6.0%) |
| 65 to 74 Years | 72 (11.9%) | 168 (20.6%) |
| 75 Years and over | 108 (32.2%) | 194 (42.9%) |
Disability Class: Self-Care Difficulty
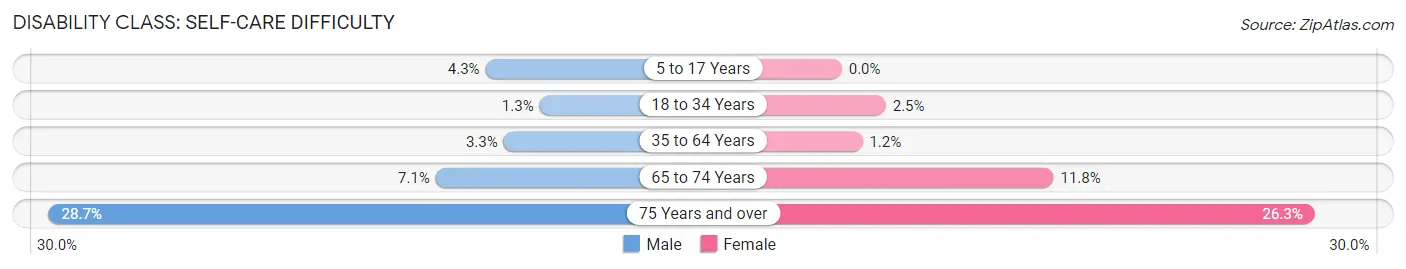
| Age Bracket | Male | Female |
| 5 to 17 Years | 75 (4.3%) | 0 (0.0%) |
| 18 to 34 Years | 26 (1.3%) | 57 (2.5%) |
| 35 to 64 Years | 104 (3.3%) | 32 (1.1%) |
| 65 to 74 Years | 43 (7.1%) | 96 (11.8%) |
| 75 Years and over | 96 (28.7%) | 119 (26.3%) |
Technology Access in Opa Locka
Computing Device Access in Opa Locka
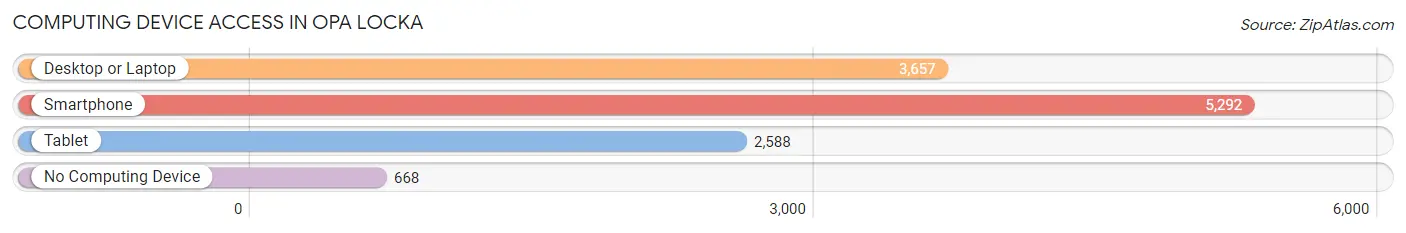
| Device Type | # Households | % Households |
| Desktop or Laptop | 3,657 | 58.7% |
| Smartphone | 5,292 | 84.9% |
| Tablet | 2,588 | 41.5% |
| No Computing Device | 668 | 10.7% |
| Total | 6,231 | 100.0% |
Internet Access in Opa Locka
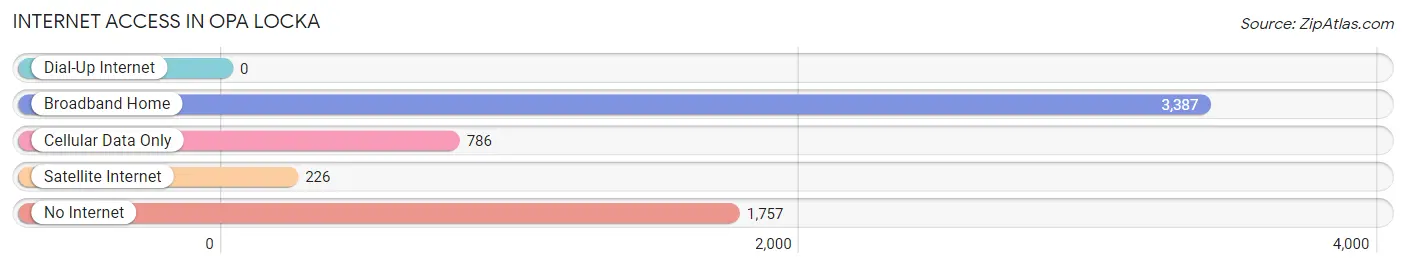
| Internet Type | # Households | % Households |
| Dial-Up Internet | 0 | 0.0% |
| Broadband Home | 3,387 | 54.4% |
| Cellular Data Only | 786 | 12.6% |
| Satellite Internet | 226 | 3.6% |
| No Internet | 1,757 | 28.2% |
| Total | 6,231 | 100.0% |
Opa Locka Summary
Opa Locka, Florida is a city located in Miami-Dade County, Florida, United States. It is located approximately 15 miles northwest of Miami and is part of the Miami metropolitan area. The city was founded in 1926 by aviation pioneer Glenn Curtiss and is known for its unique Moorish Revival architecture. As of the 2010 census, the population of Opa Locka was 15,219.
History
Opa Locka was founded in 1926 by aviation pioneer Glenn Curtiss. Curtiss purchased the land and named it after the city of Opa-Locka, Florida, which was the title of a Seminole Indian folk tale. The city was designed by architect Bernhardt Muller, who was inspired by the Moorish Revival architecture of the Alhambra Palace in Granada, Spain. The city was planned with a series of streets that formed a checkerboard pattern, with each street named after a different country. The city was incorporated in 1926 and was home to a number of aviation-related businesses, including the Curtiss-Wright Corporation and the Opa-Locka Airport.
Geography
Opa Locka is located at 25°54'25" North, 80°17'45" West (25.906833, -80.295833). It is situated in Miami-Dade County, Florida, United States. The city has a total area of 4.2 square miles, of which 4.1 square miles is land and 0.1 square miles is water.
Economy
Opa Locka has a diverse economy, with a mix of industrial, commercial, and residential businesses. The city is home to a number of manufacturing and distribution companies, including the Opa-Locka Airport, which is the largest general aviation airport in the United States. The city is also home to a number of retail stores, restaurants, and other businesses.
Demographics
As of the 2010 census, there were 15,219 people, 4,945 households, and 3,541 families residing in the city. The population density was 3,637.3 people per square mile. The racial makeup of the city was 57.2% African American, 28.3% White, 0.4% Native American, 0.7% Asian, 0.1% Pacific Islander, 10.7% from other races, and 2.6% from two or more races. Hispanic or Latino of any race were 33.2% of the population.
The median income for a household in the city was $25,945, and the median income for a family was $30,945. Males had a median income of $25,945 versus $20,945 for females. The per capita income for the city was $12,945. About 22.2% of families and 25.7% of the population were below the poverty line, including 36.2% of those under age 18 and 16.2% of those age 65 or over.
Common Questions
What is Per Capita Income in Opa Locka?
Per Capita income in Opa Locka is $18,108.
What is the Median Family Income in Opa Locka?
Median Family Income in Opa Locka is $42,308.
What is the Median Household income in Opa Locka?
Median Household Income in Opa Locka is $30,101.
What is Income or Wage Gap in Opa Locka?
Income or Wage Gap in Opa Locka is 2.8%.
Women in Opa Locka earn 97.2 cents for every dollar earned by a man.
What is Family Income Deficit in Opa Locka?
Family Income Deficit in Opa Locka is $11,182.
Families that are below poverty line in Opa Locka earn $11,182 less on average than the poverty threshold level.
What is Inequality or Gini Index in Opa Locka?
Inequality or Gini Index in Opa Locka is 0.47.
What is the Total Population of Opa Locka?
Total Population of Opa Locka is 16,230.
What is the Total Male Population of Opa Locka?
Total Male Population of Opa Locka is 8,388.
What is the Total Female Population of Opa Locka?
Total Female Population of Opa Locka is 7,842.
What is the Ratio of Males per 100 Females in Opa Locka?
There are 106.96 Males per 100 Females in Opa Locka.
What is the Ratio of Females per 100 Males in Opa Locka?
There are 93.49 Females per 100 Males in Opa Locka.
What is the Median Population Age in Opa Locka?
Median Population Age in Opa Locka is 35.0 Years.
What is the Average Family Size in Opa Locka
Average Family Size in Opa Locka is 3.3 People.
What is the Average Household Size in Opa Locka
Average Household Size in Opa Locka is 2.6 People.
How Large is the Labor Force in Opa Locka?
There are 7,363 People in the Labor Forcein in Opa Locka.
What is the Percentage of People in the Labor Force in Opa Locka?
57.3% of People are in the Labor Force in Opa Locka.
What is the Unemployment Rate in Opa Locka?
Unemployment Rate in Opa Locka is 5.2%.