Storm Lake, IA Map & Demographics
Storm Lake Map
Storm Lake Overview
$28,834
PER CAPITA INCOME
$82,716
AVG FAMILY INCOME
$54,615
AVG HOUSEHOLD INCOME
20.6%
WAGE / INCOME GAP [ % ]
79.4¢/ $1
WAGE / INCOME GAP [ $ ]
0.42
INEQUALITY / GINI INDEX
11,194
TOTAL POPULATION
5,585
MALE POPULATION
5,609
FEMALE POPULATION
99.57
MALES / 100 FEMALES
100.43
FEMALES / 100 MALES
31.0
MEDIAN AGE
3.8
AVG FAMILY SIZE
2.6
AVG HOUSEHOLD SIZE
5,857
LABOR FORCE [ PEOPLE ]
68.5%
PERCENT IN LABOR FORCE
4.1%
UNEMPLOYMENT RATE
Storm Lake Zip Codes
Storm Lake Area Codes
Income in Storm Lake
Income Overview in Storm Lake
Per Capita Income in Storm Lake is $28,834, while median incomes of families and households are $82,716 and $54,615 respectively.
| Characteristic | Number | Measure |
| Per Capita Income | 11,194 | $28,834 |
| Median Family Income | 2,099 | $82,716 |
| Mean Family Income | 2,099 | $97,736 |
| Median Household Income | 3,996 | $54,615 |
| Mean Household Income | 3,996 | $79,538 |
| Income Deficit | 2,099 | $0 |
| Wage / Income Gap (%) | 11,194 | 20.65% |
| Wage / Income Gap ($) | 11,194 | 79.35¢ per $1 |
| Gini / Inequality Index | 11,194 | 0.42 |
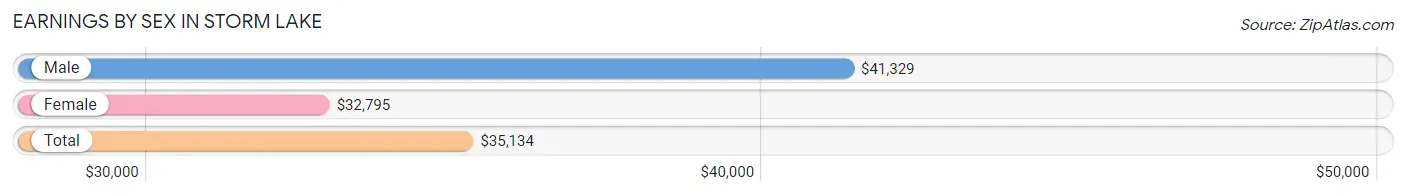
Earnings by Sex in Storm Lake
Average Earnings in Storm Lake are $35,134, $41,329 for men and $32,795 for women, a difference of 20.6%.
| Sex | Number | Average Earnings |
| Male | 3,207 (52.2%) | $41,329 |
| Female | 2,939 (47.8%) | $32,795 |
| Total | 6,146 (100.0%) | $35,134 |
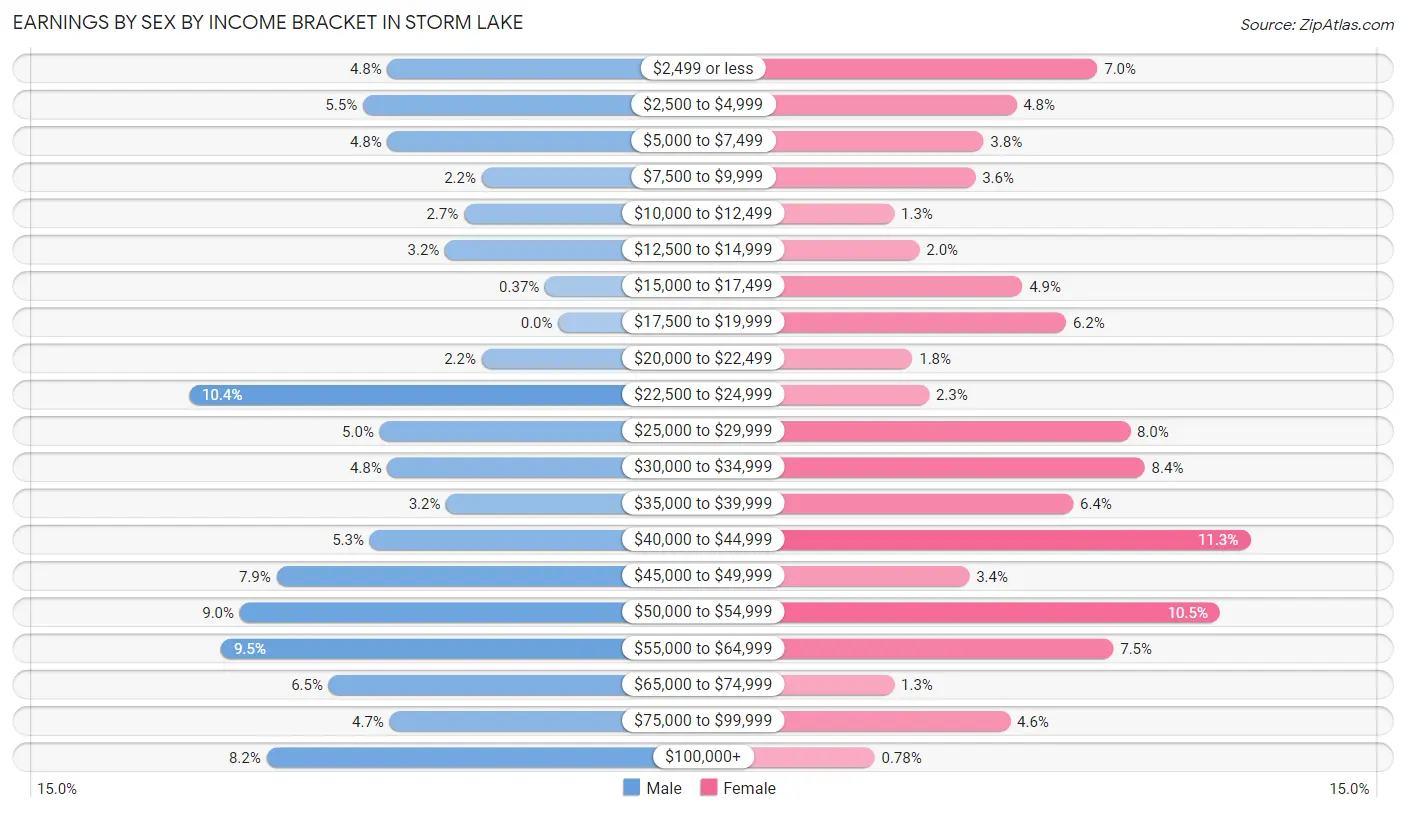
Earnings by Sex by Income Bracket in Storm Lake
The most common earnings brackets in Storm Lake are $22,500 to $24,999 for men (333 | 10.4%) and $40,000 to $44,999 for women (333 | 11.3%).
| Income | Male | Female |
| $2,499 or less | 154 (4.8%) | 207 (7.0%) |
| $2,500 to $4,999 | 176 (5.5%) | 140 (4.8%) |
| $5,000 to $7,499 | 154 (4.8%) | 113 (3.8%) |
| $7,500 to $9,999 | 69 (2.1%) | 106 (3.6%) |
| $10,000 to $12,499 | 85 (2.6%) | 39 (1.3%) |
| $12,500 to $14,999 | 102 (3.2%) | 60 (2.0%) |
| $15,000 to $17,499 | 12 (0.4%) | 145 (4.9%) |
| $17,500 to $19,999 | 0 (0.0%) | 181 (6.2%) |
| $20,000 to $22,499 | 69 (2.1%) | 54 (1.8%) |
| $22,500 to $24,999 | 333 (10.4%) | 68 (2.3%) |
| $25,000 to $29,999 | 161 (5.0%) | 234 (8.0%) |
| $30,000 to $34,999 | 154 (4.8%) | 246 (8.4%) |
| $35,000 to $39,999 | 101 (3.2%) | 187 (6.4%) |
| $40,000 to $44,999 | 170 (5.3%) | 333 (11.3%) |
| $45,000 to $49,999 | 254 (7.9%) | 101 (3.4%) |
| $50,000 to $54,999 | 287 (8.9%) | 308 (10.5%) |
| $55,000 to $64,999 | 304 (9.5%) | 220 (7.5%) |
| $65,000 to $74,999 | 207 (6.5%) | 39 (1.3%) |
| $75,000 to $99,999 | 152 (4.7%) | 135 (4.6%) |
| $100,000+ | 263 (8.2%) | 23 (0.8%) |
| Total | 3,207 (100.0%) | 2,939 (100.0%) |
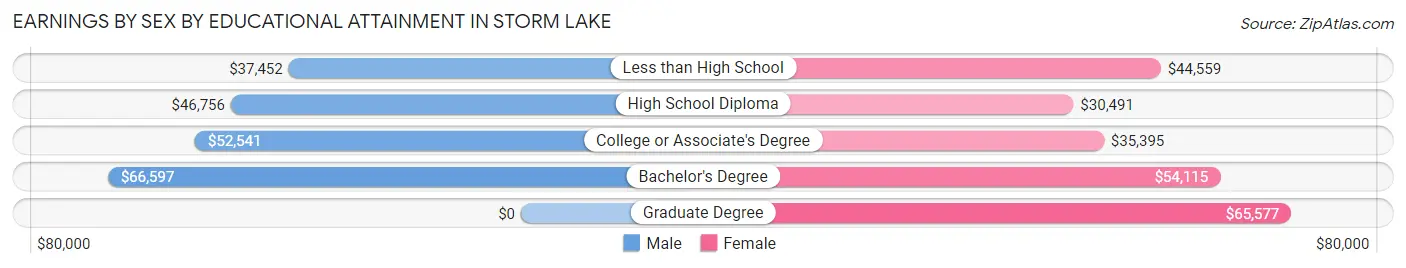
Earnings by Sex by Educational Attainment in Storm Lake
Average earnings in Storm Lake are $46,530 for men and $37,969 for women, a difference of 18.4%. Men with an educational attainment of bachelor's degree enjoy the highest average annual earnings of $66,597, while those with less than high school education earn the least with $37,452. Women with an educational attainment of graduate degree earn the most with the average annual earnings of $65,577, while those with high school diploma education have the smallest earnings of $30,491.
| Educational Attainment | Male Income | Female Income |
| Less than High School | $37,452 | $44,559 |
| High School Diploma | $46,756 | $30,491 |
| College or Associate's Degree | $52,541 | $35,395 |
| Bachelor's Degree | $66,597 | $54,115 |
| Graduate Degree | - | - |
| Total | $46,530 | $37,969 |
Family Income in Storm Lake
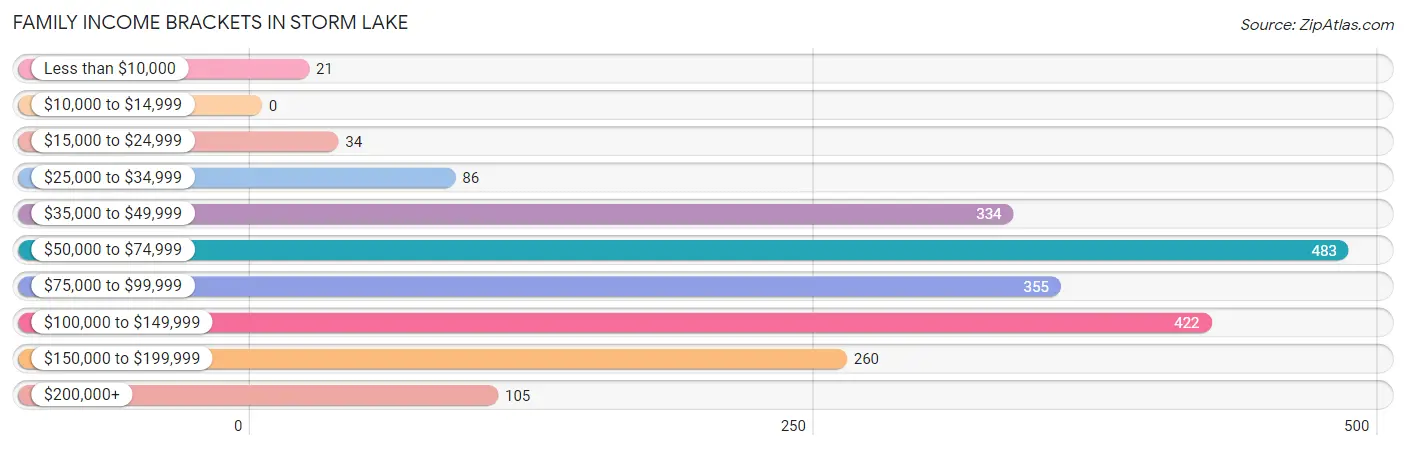
Family Income Brackets in Storm Lake
According to the Storm Lake family income data, there are 483 families falling into the $50,000 to $74,999 income range, which is the most common income bracket and makes up 23.0% of all families.
| Income Bracket | # Families | % Families |
| Less than $10,000 | 21 | 1.0% |
| $10,000 to $14,999 | 0 | 0.0% |
| $15,000 to $24,999 | 34 | 1.6% |
| $25,000 to $34,999 | 86 | 4.1% |
| $35,000 to $49,999 | 334 | 15.9% |
| $50,000 to $74,999 | 483 | 23.0% |
| $75,000 to $99,999 | 355 | 16.9% |
| $100,000 to $149,999 | 422 | 20.1% |
| $150,000 to $199,999 | 260 | 12.4% |
| $200,000+ | 105 | 5.0% |
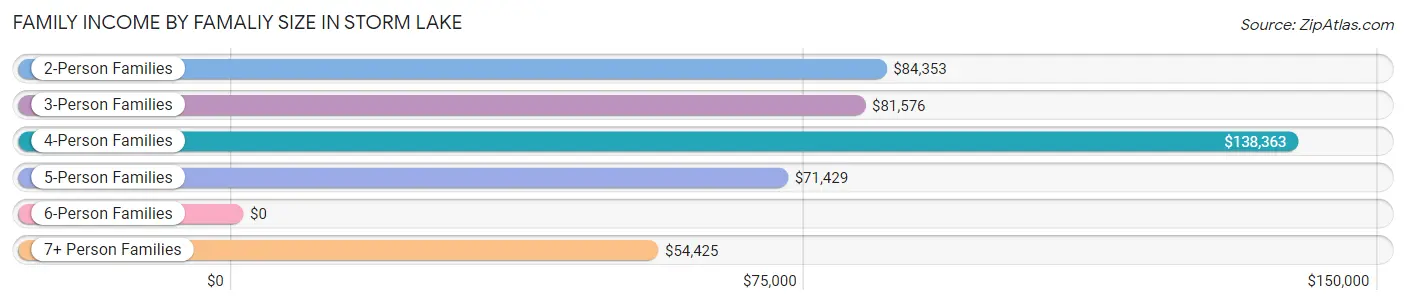
Family Income by Famaliy Size in Storm Lake
4-person families (411 | 19.6%) account for the highest median family income in Storm Lake with $138,363 per family, while 2-person families (705 | 33.6%) have the highest median income of $42,176 per family member.
| Income Bracket | # Families | Median Income |
| 2-Person Families | 705 (33.6%) | $84,353 |
| 3-Person Families | 479 (22.8%) | $81,576 |
| 4-Person Families | 411 (19.6%) | $138,363 |
| 5-Person Families | 314 (15.0%) | $71,429 |
| 6-Person Families | 45 (2.1%) | $0 |
| 7+ Person Families | 145 (6.9%) | $54,425 |
| Total | 2,099 (100.0%) | $82,716 |
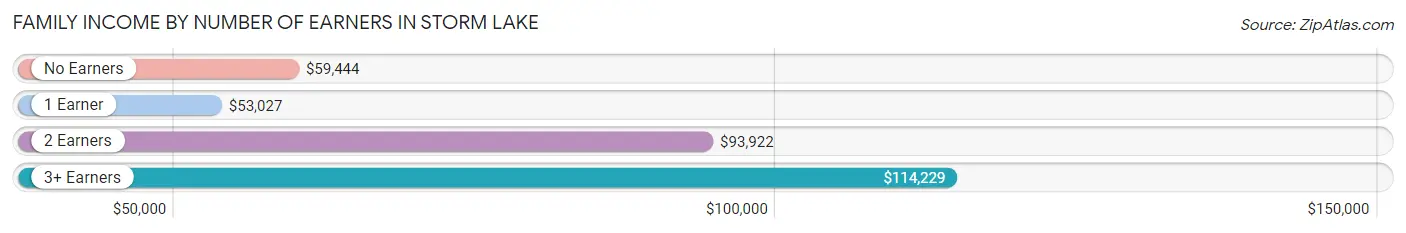
Family Income by Number of Earners in Storm Lake
The median family income in Storm Lake is $82,716, with families comprising 3+ earners (383) having the highest median family income of $114,229, while families with 1 earner (531) have the lowest median family income of $53,027, accounting for 18.2% and 25.3% of families, respectively.
| Number of Earners | # Families | Median Income |
| No Earners | 190 (9.0%) | $59,444 |
| 1 Earner | 531 (25.3%) | $53,027 |
| 2 Earners | 995 (47.4%) | $93,922 |
| 3+ Earners | 383 (18.2%) | $114,229 |
| Total | 2,099 (100.0%) | $82,716 |
Household Income in Storm Lake
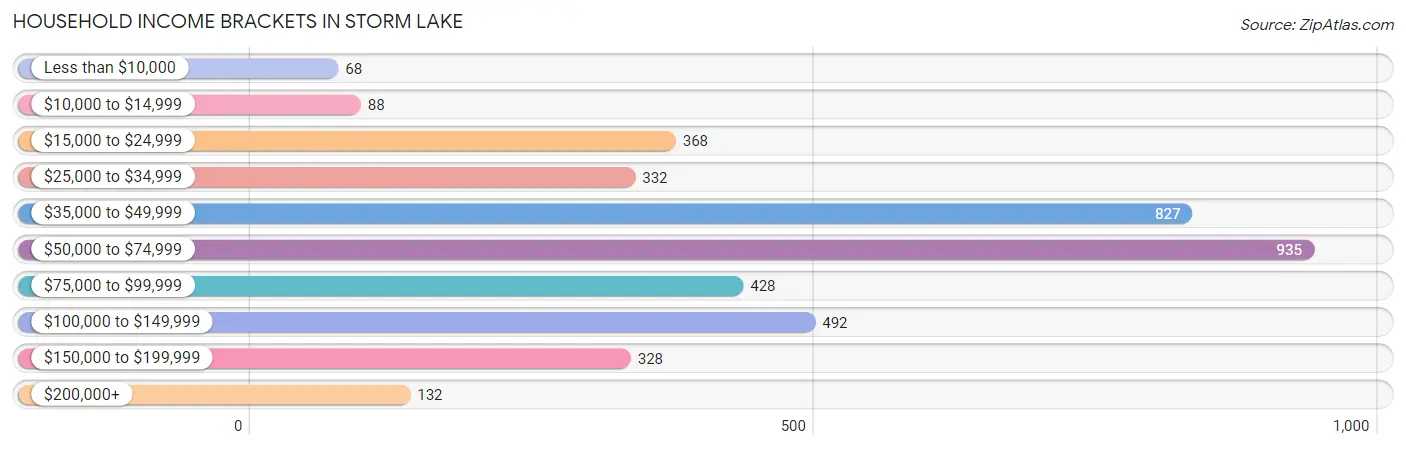
Household Income Brackets in Storm Lake
With 935 households falling in the category, the $50,000 to $74,999 income range is the most frequent in Storm Lake, accounting for 23.4% of all households. In contrast, only 68 households (1.7%) fall into the less than $10,000 income bracket, making it the least populous group.
| Income Bracket | # Households | % Households |
| Less than $10,000 | 68 | 1.7% |
| $10,000 to $14,999 | 88 | 2.2% |
| $15,000 to $24,999 | 368 | 9.2% |
| $25,000 to $34,999 | 332 | 8.3% |
| $35,000 to $49,999 | 827 | 20.7% |
| $50,000 to $74,999 | 935 | 23.4% |
| $75,000 to $99,999 | 428 | 10.7% |
| $100,000 to $149,999 | 492 | 12.3% |
| $150,000 to $199,999 | 328 | 8.2% |
| $200,000+ | 132 | 3.3% |
Household Income by Householder Age in Storm Lake
The median household income in Storm Lake is $54,615, with the highest median household income of $64,099 found in the 45 to 64 years age bracket for the primary householder. A total of 1,251 households (31.3%) fall into this category. Meanwhile, the 65+ years age bracket for the primary householder has the lowest median household income of $32,451, with 927 households (23.2%) in this group.
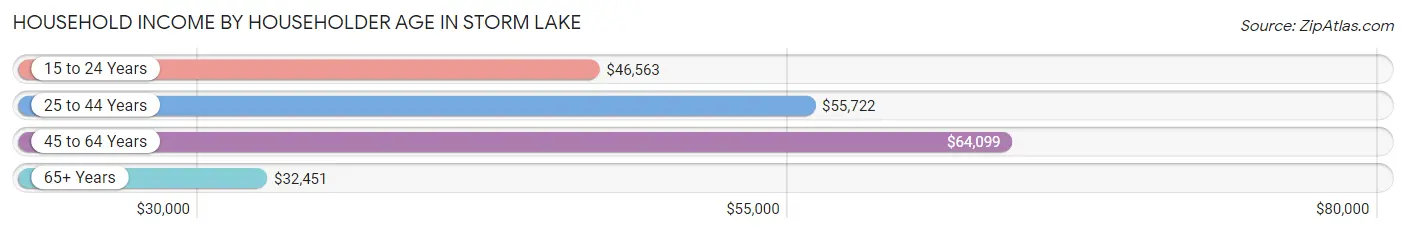
| Income Bracket | # Households | Median Income |
| 15 to 24 Years | 305 (7.6%) | $46,563 |
| 25 to 44 Years | 1,513 (37.9%) | $55,722 |
| 45 to 64 Years | 1,251 (31.3%) | $64,099 |
| 65+ Years | 927 (23.2%) | $32,451 |
| Total | 3,996 (100.0%) | $54,615 |
Poverty in Storm Lake
Income Below Poverty by Sex and Age in Storm Lake
With 6.3% poverty level for males and 6.4% for females among the residents of Storm Lake, 15 year old males and 65 to 74 year old females are the most vulnerable to poverty, with 32 males (42.7%) and 124 females (31.2%) in their respective age groups living below the poverty level.
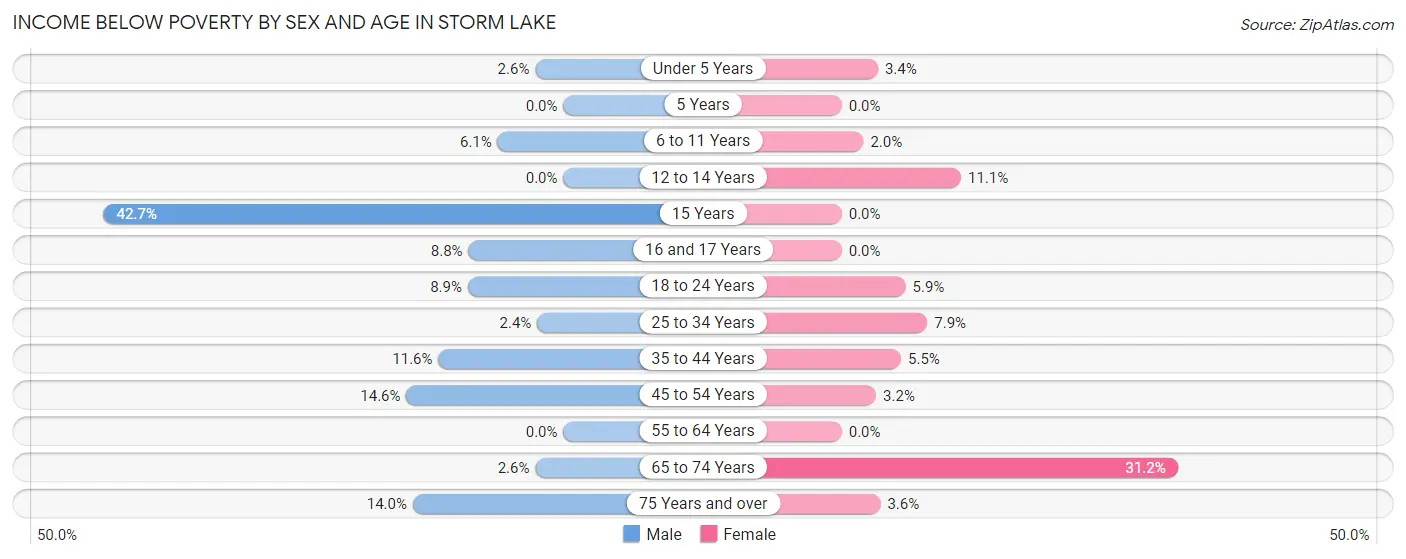
| Age Bracket | Male | Female |
| Under 5 Years | 13 (2.6%) | 10 (3.4%) |
| 5 Years | 0 (0.0%) | 0 (0.0%) |
| 6 to 11 Years | 34 (6.1%) | 11 (2.0%) |
| 12 to 14 Years | 0 (0.0%) | 28 (11.1%) |
| 15 Years | 32 (42.7%) | 0 (0.0%) |
| 16 and 17 Years | 20 (8.8%) | 0 (0.0%) |
| 18 to 24 Years | 40 (8.9%) | 30 (5.9%) |
| 25 to 34 Years | 20 (2.4%) | 52 (7.9%) |
| 35 to 44 Years | 69 (11.6%) | 41 (5.5%) |
| 45 to 54 Years | 65 (14.6%) | 19 (3.2%) |
| 55 to 64 Years | 0 (0.0%) | 0 (0.0%) |
| 65 to 74 Years | 10 (2.6%) | 124 (31.2%) |
| 75 Years and over | 25 (14.0%) | 17 (3.6%) |
| Total | 328 (6.3%) | 332 (6.4%) |
Income Above Poverty by Sex and Age in Storm Lake
According to the poverty statistics in Storm Lake, males aged 5 years and females aged 5 years are the age groups that are most secure financially, with 100.0% of males and 100.0% of females in these age groups living above the poverty line.
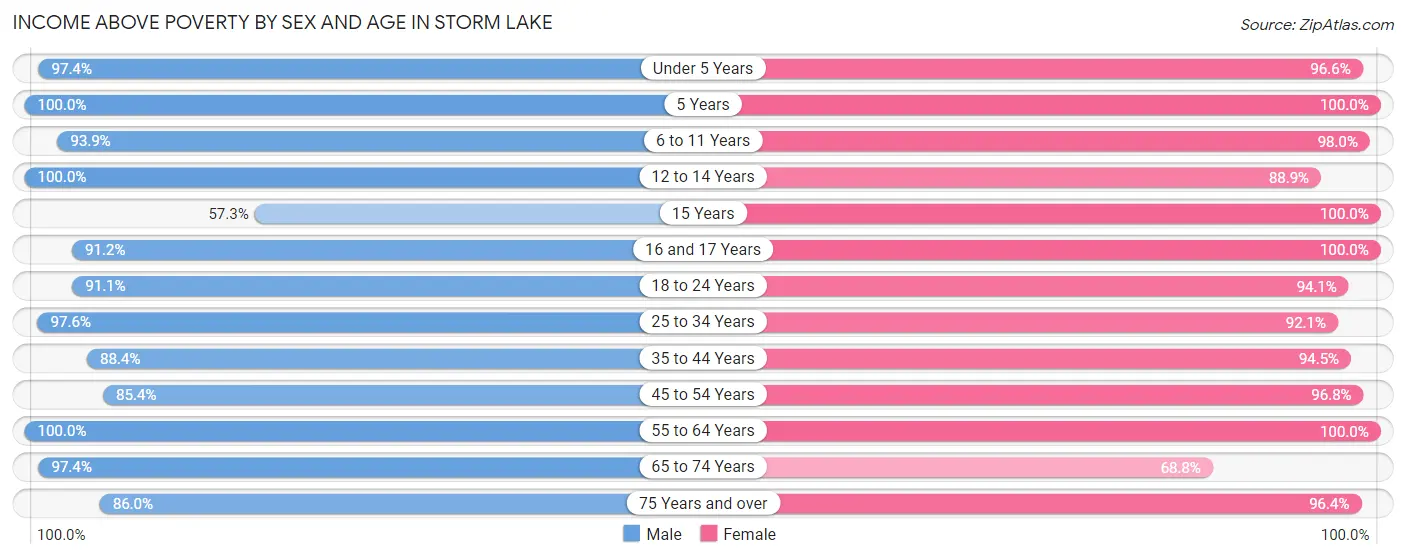
| Age Bracket | Male | Female |
| Under 5 Years | 485 (97.4%) | 288 (96.6%) |
| 5 Years | 36 (100.0%) | 50 (100.0%) |
| 6 to 11 Years | 523 (93.9%) | 537 (98.0%) |
| 12 to 14 Years | 245 (100.0%) | 225 (88.9%) |
| 15 Years | 43 (57.3%) | 79 (100.0%) |
| 16 and 17 Years | 207 (91.2%) | 141 (100.0%) |
| 18 to 24 Years | 411 (91.1%) | 477 (94.1%) |
| 25 to 34 Years | 804 (97.6%) | 603 (92.1%) |
| 35 to 44 Years | 526 (88.4%) | 705 (94.5%) |
| 45 to 54 Years | 381 (85.4%) | 576 (96.8%) |
| 55 to 64 Years | 654 (100.0%) | 448 (100.0%) |
| 65 to 74 Years | 374 (97.4%) | 274 (68.8%) |
| 75 Years and over | 154 (86.0%) | 457 (96.4%) |
| Total | 4,843 (93.7%) | 4,860 (93.6%) |
Income Below Poverty Among Married-Couple Families in Storm Lake
The poverty statistics for married-couple families in Storm Lake show that 3.1% or 49 of the total 1,574 families live below the poverty line. Families with 3 or 4 children have the highest poverty rate of 7.2%, comprising of 17 families. On the other hand, families with 5 or more children have the lowest poverty rate of 0.0%, which includes 0 families.
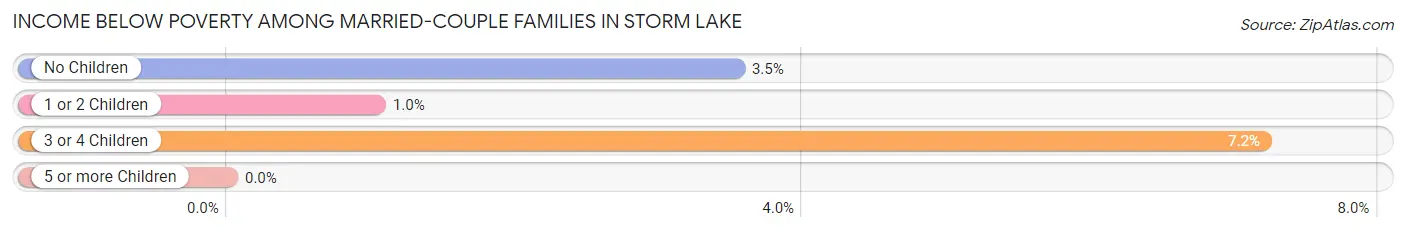
| Children | Above Poverty | Below Poverty |
| No Children | 711 (96.5%) | 26 (3.5%) |
| 1 or 2 Children | 578 (99.0%) | 6 (1.0%) |
| 3 or 4 Children | 219 (92.8%) | 17 (7.2%) |
| 5 or more Children | 17 (100.0%) | 0 (0.0%) |
| Total | 1,525 (96.9%) | 49 (3.1%) |
Income Below Poverty Among Single-Parent Households in Storm Lake
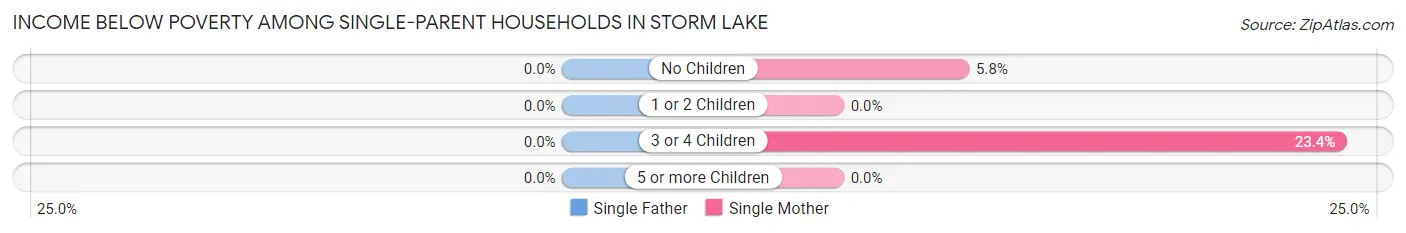
| Children | Single Father | Single Mother |
| No Children | 0 (0.0%) | 8 (5.8%) |
| 1 or 2 Children | 0 (0.0%) | 0 (0.0%) |
| 3 or 4 Children | 0 (0.0%) | 15 (23.4%) |
| 5 or more Children | 0 (0.0%) | 0 (0.0%) |
| Total | 0 (0.0%) | 23 (5.3%) |
Income Below Poverty Among Married-Couple vs Single-Parent Households in Storm Lake
The poverty data for Storm Lake shows that 49 of the married-couple family households (3.1%) and 23 of the single-parent households (4.4%) are living below the poverty level. Within the married-couple family households, those with 3 or 4 children have the highest poverty rate, with 17 households (7.2%) falling below the poverty line. Among the single-parent households, those with 3 or 4 children have the highest poverty rate, with 15 household (23.4%) living below poverty.
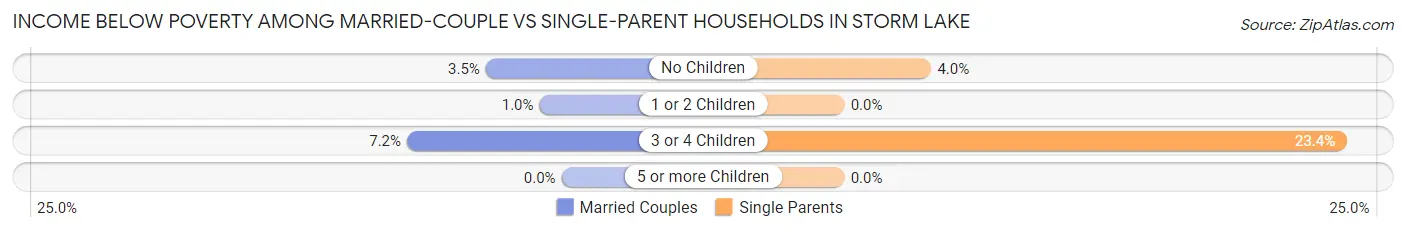
| Children | Married-Couple Families | Single-Parent Households |
| No Children | 26 (3.5%) | 8 (4.0%) |
| 1 or 2 Children | 6 (1.0%) | 0 (0.0%) |
| 3 or 4 Children | 17 (7.2%) | 15 (23.4%) |
| 5 or more Children | 0 (0.0%) | 0 (0.0%) |
| Total | 49 (3.1%) | 23 (4.4%) |
Race in Storm Lake
The most populous races in Storm Lake are White / Caucasian (6,030 | 53.9%), Hispanic or Latino (4,420 | 39.5%), and Asian (1,715 | 15.3%).
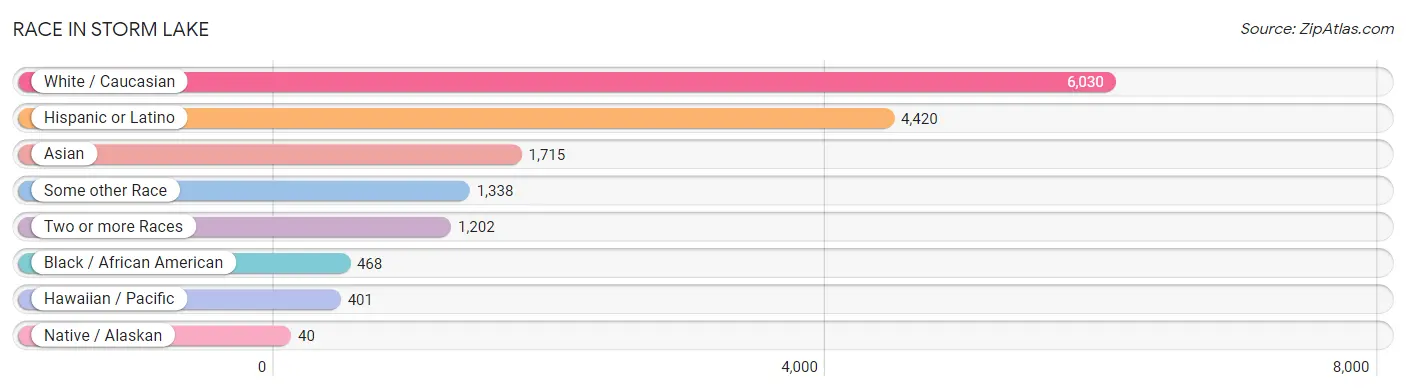
| Race | # Population | % Population |
| Asian | 1,715 | 15.3% |
| Black / African American | 468 | 4.2% |
| Hawaiian / Pacific | 401 | 3.6% |
| Hispanic or Latino | 4,420 | 39.5% |
| Native / Alaskan | 40 | 0.4% |
| White / Caucasian | 6,030 | 53.9% |
| Two or more Races | 1,202 | 10.7% |
| Some other Race | 1,338 | 11.9% |
| Total | 11,194 | 100.0% |
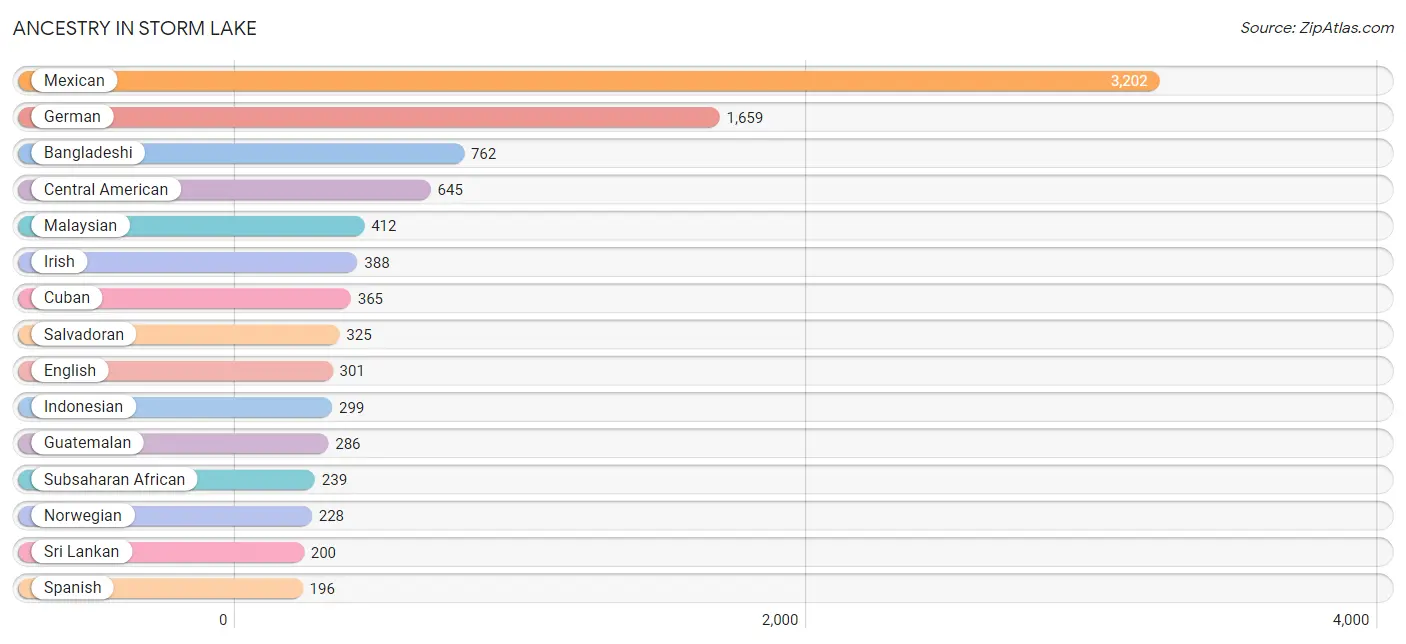
Ancestry in Storm Lake
The most populous ancestries reported in Storm Lake are Mexican (3,202 | 28.6%), German (1,659 | 14.8%), Bangladeshi (762 | 6.8%), Central American (645 | 5.8%), and Malaysian (412 | 3.7%), together accounting for 59.7% of all Storm Lake residents.
| Ancestry | # Population | % Population |
| African | 73 | 0.6% |
| American | 141 | 1.3% |
| Bangladeshi | 762 | 6.8% |
| Bhutanese | 18 | 0.2% |
| Burmese | 40 | 0.4% |
| Canadian | 53 | 0.5% |
| Central American | 645 | 5.8% |
| Cherokee | 7 | 0.1% |
| Chickasaw | 7 | 0.1% |
| Cuban | 365 | 3.3% |
| Czech | 77 | 0.7% |
| Czechoslovakian | 25 | 0.2% |
| Danish | 95 | 0.9% |
| Dutch | 64 | 0.6% |
| Eastern European | 3 | 0.0% |
| English | 301 | 2.7% |
| Ethiopian | 152 | 1.4% |
| European | 101 | 0.9% |
| French | 84 | 0.7% |
| French Canadian | 11 | 0.1% |
| German | 1,659 | 14.8% |
| Guatemalan | 286 | 2.5% |
| Honduran | 26 | 0.2% |
| Hungarian | 11 | 0.1% |
| Indian (Asian) | 9 | 0.1% |
| Indonesian | 299 | 2.7% |
| Irish | 388 | 3.5% |
| Italian | 21 | 0.2% |
| Latvian | 7 | 0.1% |
| Luxembourger | 11 | 0.1% |
| Malaysian | 412 | 3.7% |
| Mexican | 3,202 | 28.6% |
| Mexican American Indian | 25 | 0.2% |
| Norwegian | 228 | 2.0% |
| Pakistani | 37 | 0.3% |
| Panamanian | 8 | 0.1% |
| Polish | 29 | 0.3% |
| Portuguese | 8 | 0.1% |
| Puerto Rican | 9 | 0.1% |
| Russian | 13 | 0.1% |
| Salvadoran | 325 | 2.9% |
| Scandinavian | 55 | 0.5% |
| Scotch-Irish | 13 | 0.1% |
| Scottish | 58 | 0.5% |
| Sioux | 15 | 0.1% |
| Spanish | 196 | 1.8% |
| Sri Lankan | 200 | 1.8% |
| Subsaharan African | 239 | 2.1% |
| Sudanese | 12 | 0.1% |
| Swedish | 155 | 1.4% |
| Swiss | 33 | 0.3% |
| Ukrainian | 36 | 0.3% |
| Welsh | 22 | 0.2% | View All 53 Rows |
Immigrants in Storm Lake
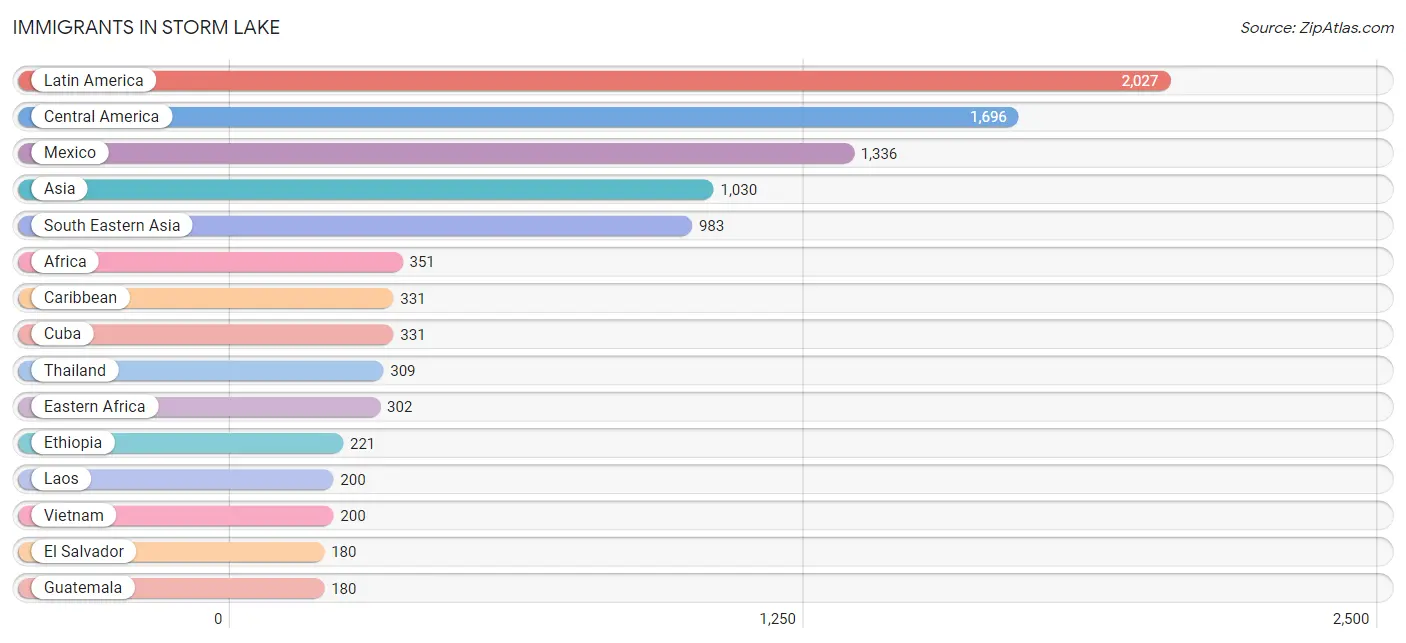
The most numerous immigrant groups reported in Storm Lake came from Latin America (2,027 | 18.1%), Central America (1,696 | 15.1%), Mexico (1,336 | 11.9%), Asia (1,030 | 9.2%), and South Eastern Asia (983 | 8.8%), together accounting for 63.2% of all Storm Lake residents.
| Immigration Origin | # Population | % Population |
| Africa | 351 | 3.1% |
| Asia | 1,030 | 9.2% |
| Cambodia | 55 | 0.5% |
| Canada | 43 | 0.4% |
| Caribbean | 331 | 3.0% |
| Central America | 1,696 | 15.1% |
| Cuba | 331 | 3.0% |
| Eastern Africa | 302 | 2.7% |
| Eastern Asia | 47 | 0.4% |
| Eastern Europe | 24 | 0.2% |
| El Salvador | 180 | 1.6% |
| England | 1 | 0.0% |
| Ethiopia | 221 | 2.0% |
| Europe | 25 | 0.2% |
| Guatemala | 180 | 1.6% |
| Japan | 7 | 0.1% |
| Kenya | 63 | 0.6% |
| Korea | 40 | 0.4% |
| Laos | 200 | 1.8% |
| Latin America | 2,027 | 18.1% |
| Mexico | 1,336 | 11.9% |
| Micronesia | 100 | 0.9% |
| North Macedonia | 11 | 0.1% |
| Northern Africa | 49 | 0.4% |
| Northern Europe | 1 | 0.0% |
| Oceania | 100 | 0.9% |
| Russia | 13 | 0.1% |
| South Eastern Asia | 983 | 8.8% |
| Sudan | 49 | 0.4% |
| Thailand | 309 | 2.8% |
| Vietnam | 200 | 1.8% | View All 31 Rows |
Sex and Age in Storm Lake
Sex and Age in Storm Lake
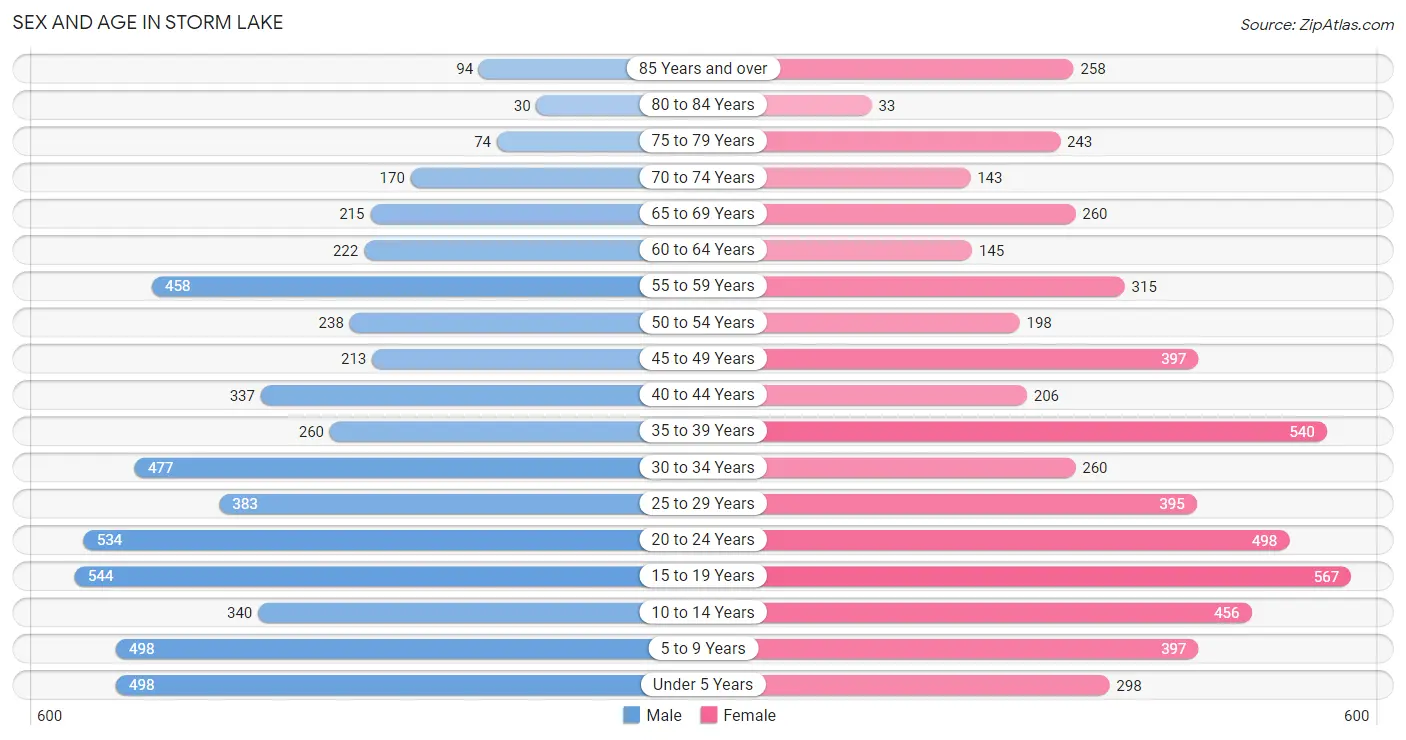
The most populous age groups in Storm Lake are 15 to 19 Years (544 | 9.7%) for men and 15 to 19 Years (567 | 10.1%) for women.
| Age Bracket | Male | Female |
| Under 5 Years | 498 (8.9%) | 298 (5.3%) |
| 5 to 9 Years | 498 (8.9%) | 397 (7.1%) |
| 10 to 14 Years | 340 (6.1%) | 456 (8.1%) |
| 15 to 19 Years | 544 (9.7%) | 567 (10.1%) |
| 20 to 24 Years | 534 (9.6%) | 498 (8.9%) |
| 25 to 29 Years | 383 (6.9%) | 395 (7.0%) |
| 30 to 34 Years | 477 (8.5%) | 260 (4.6%) |
| 35 to 39 Years | 260 (4.7%) | 540 (9.6%) |
| 40 to 44 Years | 337 (6.0%) | 206 (3.7%) |
| 45 to 49 Years | 213 (3.8%) | 397 (7.1%) |
| 50 to 54 Years | 238 (4.3%) | 198 (3.5%) |
| 55 to 59 Years | 458 (8.2%) | 315 (5.6%) |
| 60 to 64 Years | 222 (4.0%) | 145 (2.6%) |
| 65 to 69 Years | 215 (3.8%) | 260 (4.6%) |
| 70 to 74 Years | 170 (3.0%) | 143 (2.5%) |
| 75 to 79 Years | 74 (1.3%) | 243 (4.3%) |
| 80 to 84 Years | 30 (0.5%) | 33 (0.6%) |
| 85 Years and over | 94 (1.7%) | 258 (4.6%) |
| Total | 5,585 (100.0%) | 5,609 (100.0%) |
Families and Households in Storm Lake
Median Family Size in Storm Lake
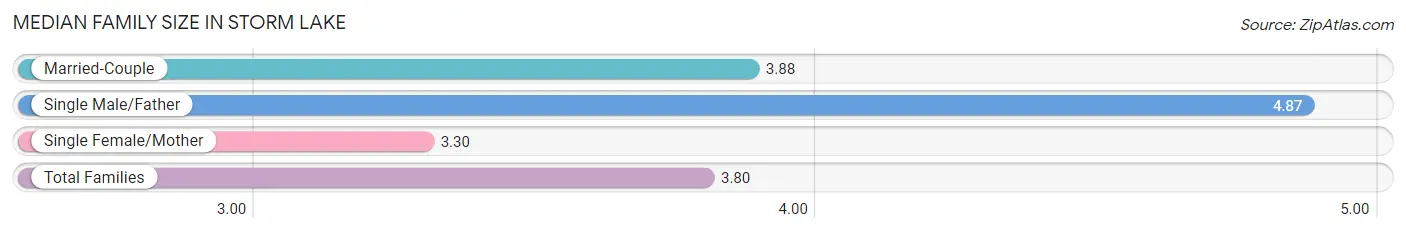
The median family size in Storm Lake is 3.80 persons per family, with single male/father families (90 | 4.3%) accounting for the largest median family size of 4.87 persons per family. On the other hand, single female/mother families (435 | 20.7%) represent the smallest median family size with 3.30 persons per family.
| Family Type | # Families | Family Size |
| Married-Couple | 1,574 (75.0%) | 3.88 |
| Single Male/Father | 90 (4.3%) | 4.87 |
| Single Female/Mother | 435 (20.7%) | 3.30 |
| Total Families | 2,099 (100.0%) | 3.80 |
Median Household Size in Storm Lake
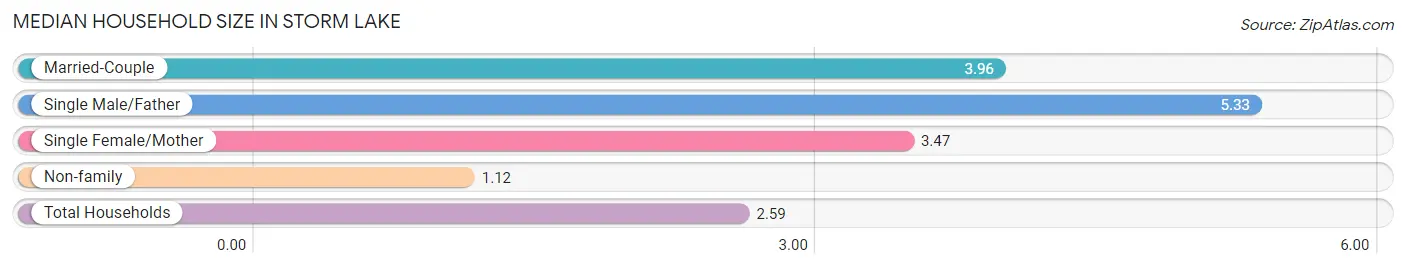
The median household size in Storm Lake is 2.59 persons per household, with single male/father households (90 | 2.2%) accounting for the largest median household size of 5.33 persons per household. non-family households (1,897 | 47.5%) represent the smallest median household size with 1.12 persons per household.
| Household Type | # Households | Household Size |
| Married-Couple | 1,574 (39.4%) | 3.96 |
| Single Male/Father | 90 (2.2%) | 5.33 |
| Single Female/Mother | 435 (10.9%) | 3.47 |
| Non-family | 1,897 (47.5%) | 1.12 |
| Total Households | 3,996 (100.0%) | 2.59 |
Household Size by Marriage Status in Storm Lake
Out of a total of 3,996 households in Storm Lake, 2,099 (52.5%) are family households, while 1,897 (47.5%) are nonfamily households. The most numerous type of family households are 2-person households, comprising 690, and the most common type of nonfamily households are 1-person households, comprising 1,441.
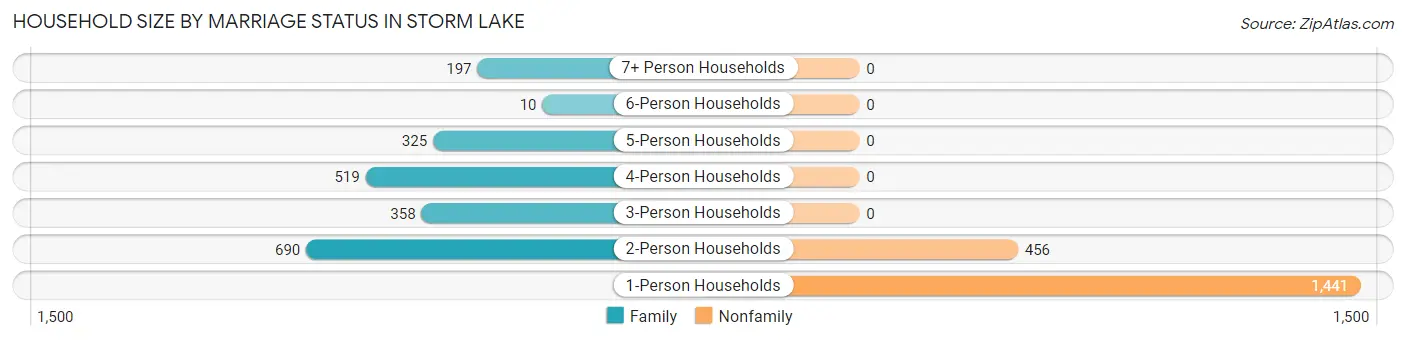
| Household Size | Family Households | Nonfamily Households |
| 1-Person Households | - | 1,441 (36.1%) |
| 2-Person Households | 690 (17.3%) | 456 (11.4%) |
| 3-Person Households | 358 (9.0%) | 0 (0.0%) |
| 4-Person Households | 519 (13.0%) | 0 (0.0%) |
| 5-Person Households | 325 (8.1%) | 0 (0.0%) |
| 6-Person Households | 10 (0.3%) | 0 (0.0%) |
| 7+ Person Households | 197 (4.9%) | 0 (0.0%) |
| Total | 2,099 (52.5%) | 1,897 (47.5%) |
Female Fertility in Storm Lake
Fertility by Age in Storm Lake
Average fertility rate in Storm Lake is 84.0 births per 1,000 women. Women in the age bracket of 20 to 34 years have the highest fertility rate with 160.0 births per 1,000 women. Women in the age bracket of 20 to 34 years acount for 72.7% of all women with births.
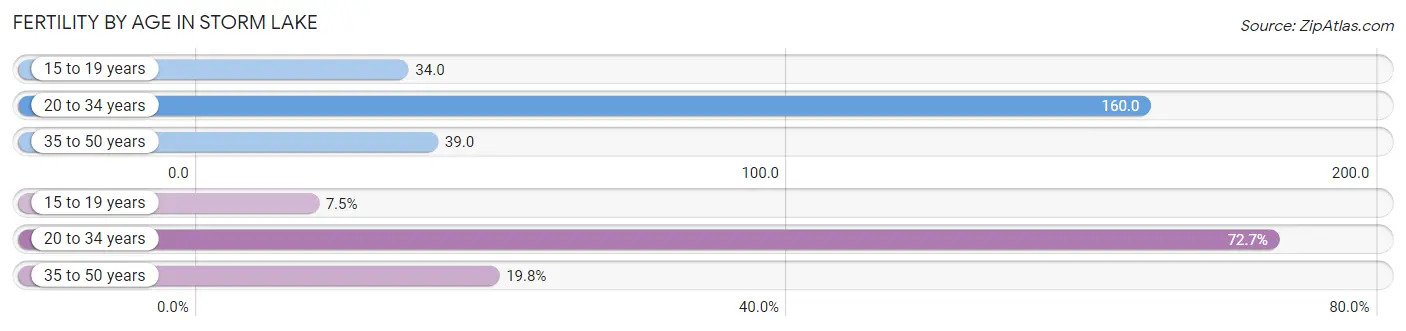
| Age Bracket | Women with Births | Births / 1,000 Women |
| 15 to 19 years | 19 (7.5%) | 34.0 |
| 20 to 34 years | 184 (72.7%) | 160.0 |
| 35 to 50 years | 50 (19.8%) | 39.0 |
| Total | 253 (100.0%) | 84.0 |
Fertility by Age by Marriage Status in Storm Lake
92.5% of women with births (253) in Storm Lake are married. The highest percentage of unmarried women with births falls into 15 to 19 years age bracket with 100.0% of them unmarried at the time of birth, while the lowest percentage of unmarried women with births belong to 20 to 34 years age bracket with 0.0% of them unmarried.
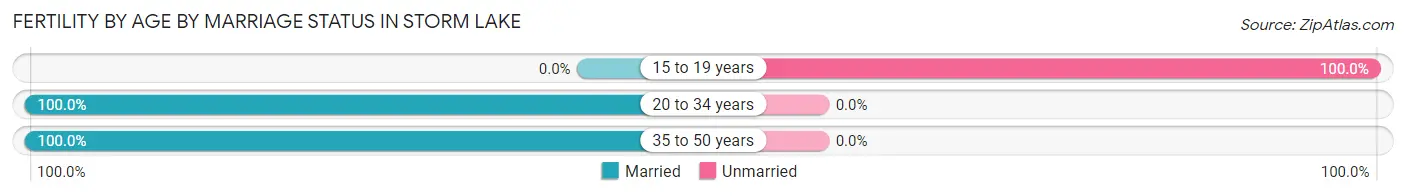
| Age Bracket | Married | Unmarried |
| 15 to 19 years | 0 (0.0%) | 19 (100.0%) |
| 20 to 34 years | 184 (100.0%) | 0 (0.0%) |
| 35 to 50 years | 50 (100.0%) | 0 (0.0%) |
| Total | 234 (92.5%) | 19 (7.5%) |
Fertility by Education in Storm Lake
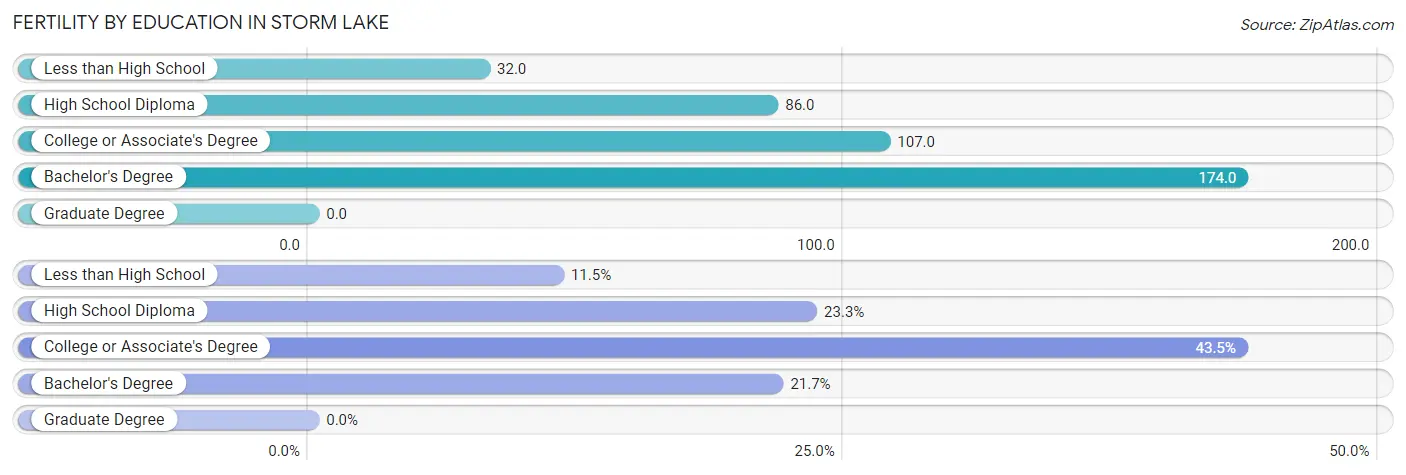
| Educational Attainment | Women with Births | Births / 1,000 Women |
| Less than High School | 29 (11.5%) | 32.0 |
| High School Diploma | 59 (23.3%) | 86.0 |
| College or Associate's Degree | 110 (43.5%) | 107.0 |
| Bachelor's Degree | 55 (21.7%) | 174.0 |
| Graduate Degree | 0 (0.0%) | 0.0 |
| Total | 253 (100.0%) | 84.0 |
Fertility by Education by Marriage Status in Storm Lake
7.5% of women with births in Storm Lake are unmarried. Women with the educational attainment of less than high school are most likely to be married with 100.0% of them married at childbirth, while women with the educational attainment of high school diploma are least likely to be married with 32.2% of them unmarried at childbirth.
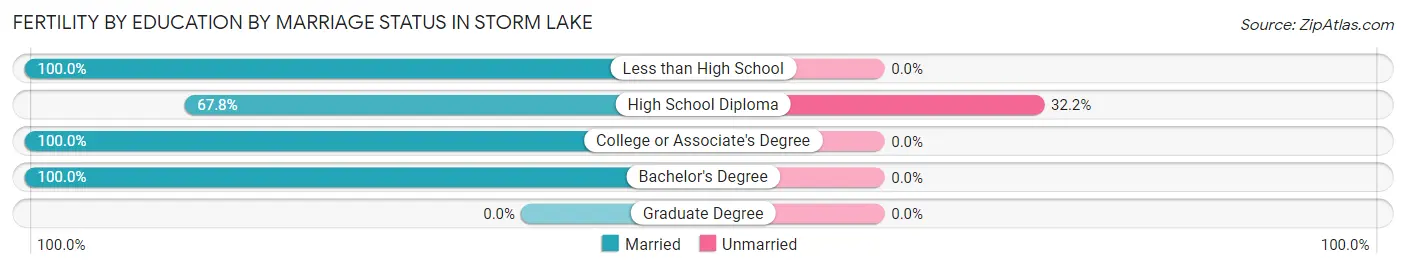
| Educational Attainment | Married | Unmarried |
| Less than High School | 29 (100.0%) | 0 (0.0%) |
| High School Diploma | 40 (67.8%) | 19 (32.2%) |
| College or Associate's Degree | 110 (100.0%) | 0 (0.0%) |
| Bachelor's Degree | 55 (100.0%) | 0 (0.0%) |
| Graduate Degree | 0 (0.0%) | 0 (0.0%) |
| Total | 234 (92.5%) | 19 (7.5%) |
Employment Characteristics in Storm Lake
Employment by Class of Employer in Storm Lake
Among the 5,478 employed individuals in Storm Lake, private company employees (4,343 | 79.3%), local government employees (356 | 6.5%), and not-for-profit organizations (340 | 6.2%) make up the most common classes of employment.
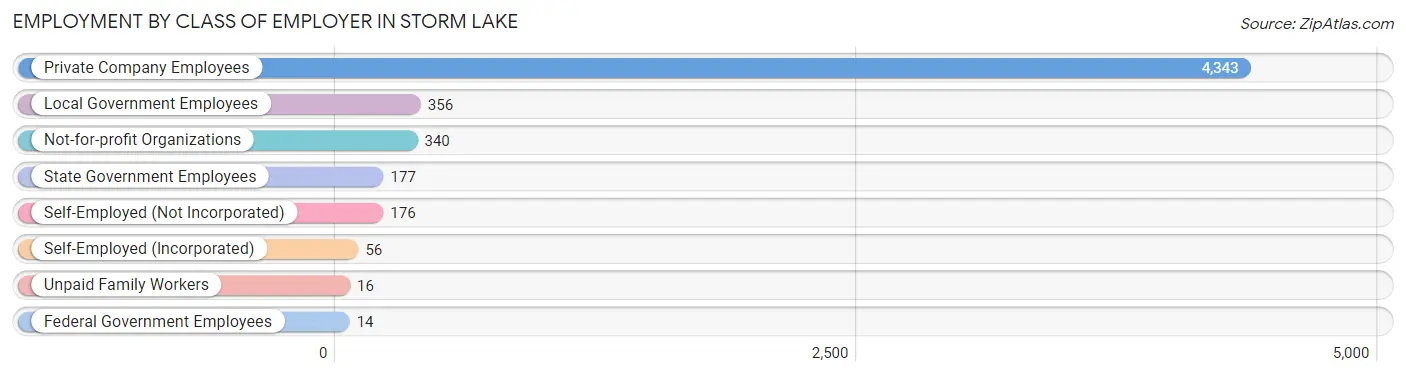
| Employer Class | # Employees | % Employees |
| Private Company Employees | 4,343 | 79.3% |
| Self-Employed (Incorporated) | 56 | 1.0% |
| Self-Employed (Not Incorporated) | 176 | 3.2% |
| Not-for-profit Organizations | 340 | 6.2% |
| Local Government Employees | 356 | 6.5% |
| State Government Employees | 177 | 3.2% |
| Federal Government Employees | 14 | 0.3% |
| Unpaid Family Workers | 16 | 0.3% |
| Total | 5,478 | 100.0% |
Employment Status by Age in Storm Lake
According to the labor force statistics for Storm Lake, out of the total population over 16 years of age (8,551), 68.5% or 5,857 individuals are in the labor force, with 4.1% or 240 of them unemployed. The age group with the highest labor force participation rate is 45 to 54 years, with 93.3% or 976 individuals in the labor force. Within the labor force, the 20 to 24 years age range has the highest percentage of unemployed individuals, with 8.2% or 73 of them being unemployed.
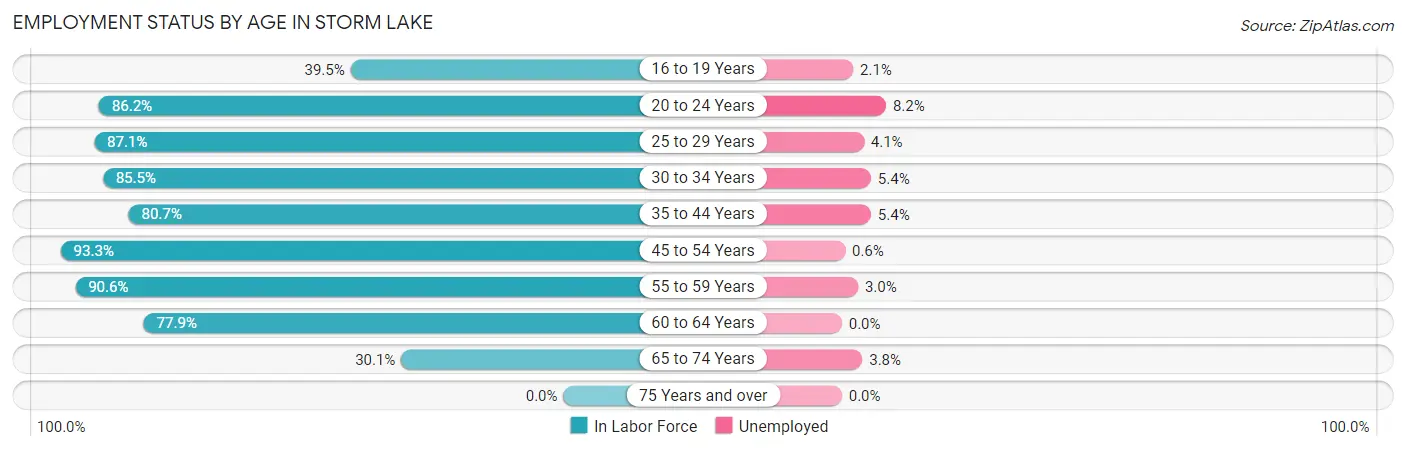
| Age Bracket | In Labor Force | Unemployed |
| 16 to 19 Years | 377 (39.5%) | 8 (2.1%) |
| 20 to 24 Years | 890 (86.2%) | 73 (8.2%) |
| 25 to 29 Years | 678 (87.1%) | 28 (4.1%) |
| 30 to 34 Years | 630 (85.5%) | 34 (5.4%) |
| 35 to 44 Years | 1,084 (80.7%) | 59 (5.4%) |
| 45 to 54 Years | 976 (93.3%) | 6 (0.6%) |
| 55 to 59 Years | 700 (90.6%) | 21 (3.0%) |
| 60 to 64 Years | 286 (77.9%) | 0 (0.0%) |
| 65 to 74 Years | 237 (30.1%) | 9 (3.8%) |
| 75 Years and over | 0 (0.0%) | 0 (0.0%) |
| Total | 5,857 (68.5%) | 240 (4.1%) |
Employment Status by Educational Attainment in Storm Lake
According to labor force statistics for Storm Lake, 86.3% of individuals (4,353) out of the total population between 25 and 64 years of age (5,044) are in the labor force, with 3.4% or 148 of them being unemployed. The group with the highest labor force participation rate are those with the educational attainment of college / associate degree, with 90.5% or 973 individuals in the labor force. Within the labor force, individuals with less than high school education have the highest percentage of unemployment, with 8.5% or 119 of them being unemployed.
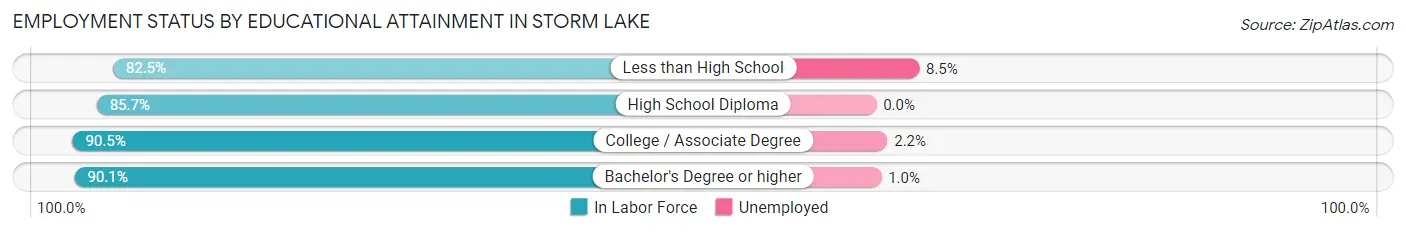
| Educational Attainment | In Labor Force | Unemployed |
| Less than High School | 1,404 (82.5%) | 145 (8.5%) |
| High School Diploma | 1,267 (85.7%) | 0 (0.0%) |
| College / Associate Degree | 973 (90.5%) | 24 (2.2%) |
| Bachelor's Degree or higher | 711 (90.1%) | 8 (1.0%) |
| Total | 4,353 (86.3%) | 171 (3.4%) |
Employment Occupations by Sex in Storm Lake
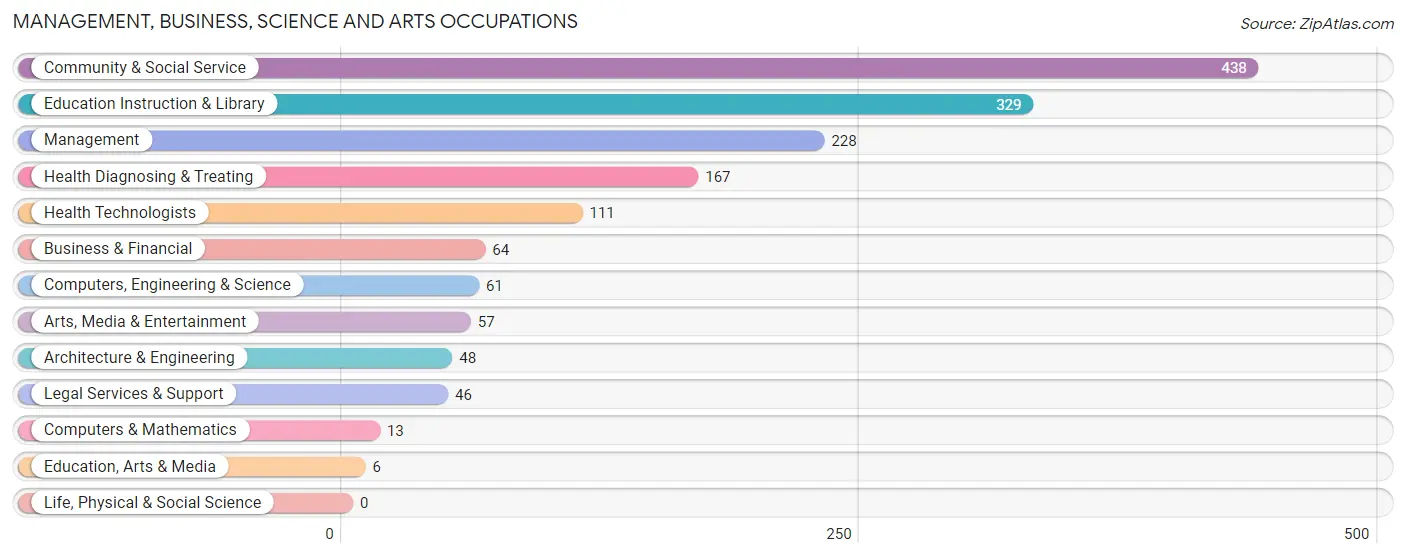
Management, Business, Science and Arts Occupations
The most common Management, Business, Science and Arts occupations in Storm Lake are Community & Social Service (438 | 7.8%), Education Instruction & Library (329 | 5.9%), Management (228 | 4.1%), Health Diagnosing & Treating (167 | 3.0%), and Health Technologists (111 | 2.0%).
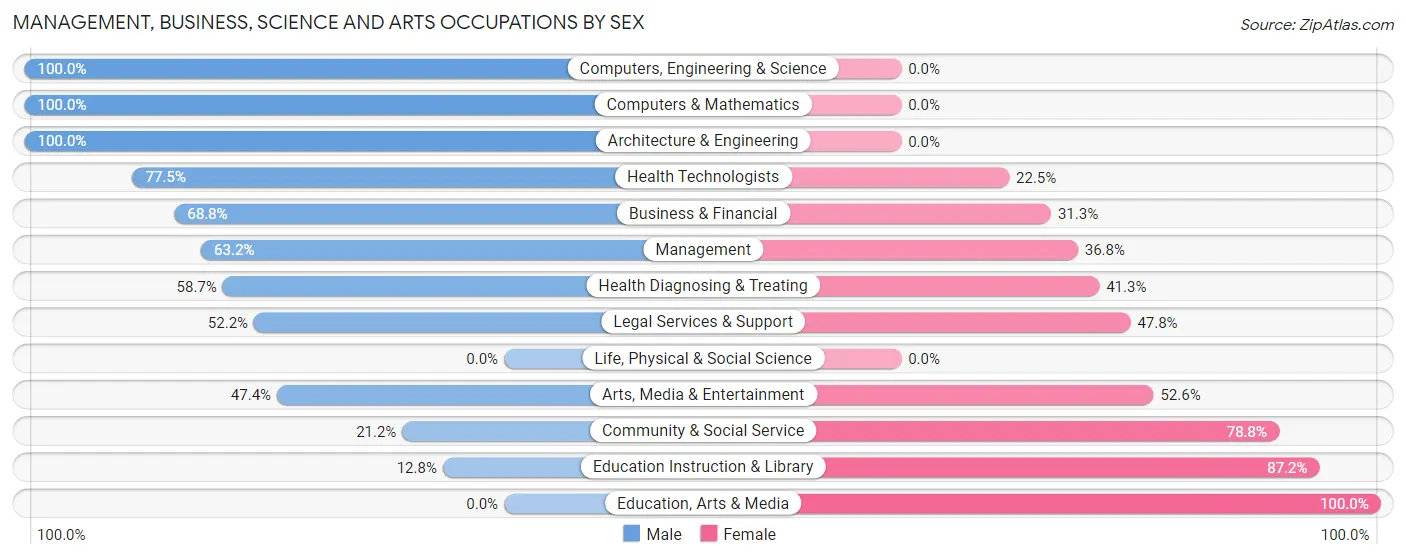
Management, Business, Science and Arts Occupations by Sex
Within the Management, Business, Science and Arts occupations in Storm Lake, the most male-oriented occupations are Computers, Engineering & Science (100.0%), Computers & Mathematics (100.0%), and Architecture & Engineering (100.0%), while the most female-oriented occupations are Education, Arts & Media (100.0%), Education Instruction & Library (87.2%), and Community & Social Service (78.8%).
| Occupation | Male | Female |
| Management | 144 (63.2%) | 84 (36.8%) |
| Business & Financial | 44 (68.8%) | 20 (31.2%) |
| Computers, Engineering & Science | 61 (100.0%) | 0 (0.0%) |
| Computers & Mathematics | 13 (100.0%) | 0 (0.0%) |
| Architecture & Engineering | 48 (100.0%) | 0 (0.0%) |
| Life, Physical & Social Science | 0 (0.0%) | 0 (0.0%) |
| Community & Social Service | 93 (21.2%) | 345 (78.8%) |
| Education, Arts & Media | 0 (0.0%) | 6 (100.0%) |
| Legal Services & Support | 24 (52.2%) | 22 (47.8%) |
| Education Instruction & Library | 42 (12.8%) | 287 (87.2%) |
| Arts, Media & Entertainment | 27 (47.4%) | 30 (52.6%) |
| Health Diagnosing & Treating | 98 (58.7%) | 69 (41.3%) |
| Health Technologists | 86 (77.5%) | 25 (22.5%) |
| Total (Category) | 440 (45.9%) | 518 (54.1%) |
| Total (Overall) | 2,958 (52.6%) | 2,662 (47.4%) |
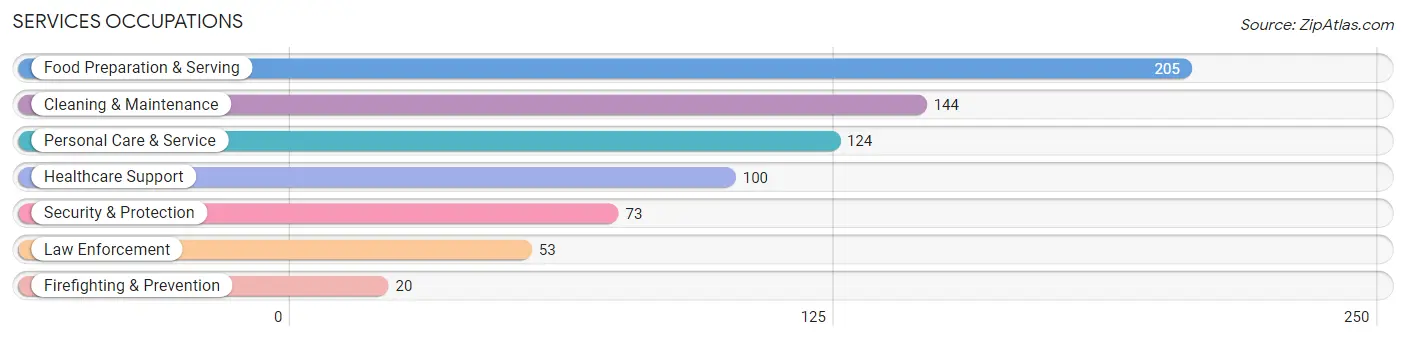
Services Occupations
The most common Services occupations in Storm Lake are Food Preparation & Serving (205 | 3.6%), Cleaning & Maintenance (144 | 2.6%), Personal Care & Service (124 | 2.2%), Healthcare Support (100 | 1.8%), and Security & Protection (73 | 1.3%).
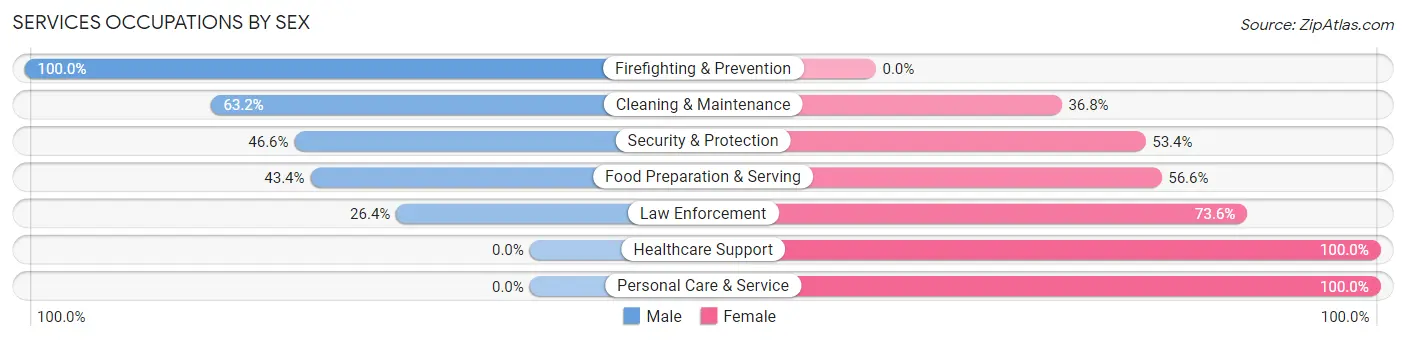
Services Occupations by Sex
Within the Services occupations in Storm Lake, the most male-oriented occupations are Firefighting & Prevention (100.0%), Cleaning & Maintenance (63.2%), and Security & Protection (46.6%), while the most female-oriented occupations are Healthcare Support (100.0%), Personal Care & Service (100.0%), and Law Enforcement (73.6%).
| Occupation | Male | Female |
| Healthcare Support | 0 (0.0%) | 100 (100.0%) |
| Security & Protection | 34 (46.6%) | 39 (53.4%) |
| Firefighting & Prevention | 20 (100.0%) | 0 (0.0%) |
| Law Enforcement | 14 (26.4%) | 39 (73.6%) |
| Food Preparation & Serving | 89 (43.4%) | 116 (56.6%) |
| Cleaning & Maintenance | 91 (63.2%) | 53 (36.8%) |
| Personal Care & Service | 0 (0.0%) | 124 (100.0%) |
| Total (Category) | 214 (33.1%) | 432 (66.9%) |
| Total (Overall) | 2,958 (52.6%) | 2,662 (47.4%) |
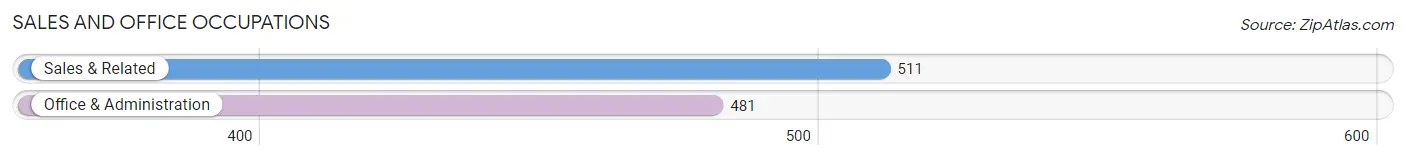
Sales and Office Occupations
The most common Sales and Office occupations in Storm Lake are Sales & Related (511 | 9.1%), and Office & Administration (481 | 8.6%).
Sales and Office Occupations by Sex
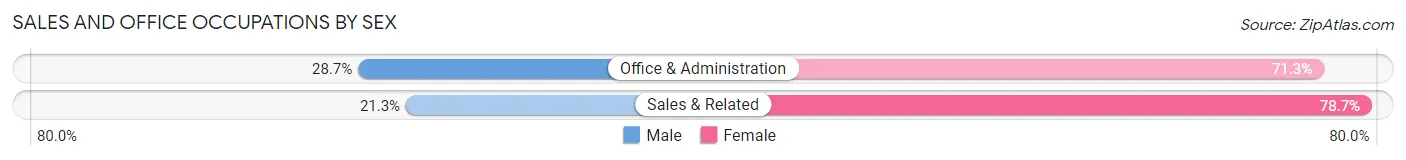
| Occupation | Male | Female |
| Sales & Related | 109 (21.3%) | 402 (78.7%) |
| Office & Administration | 138 (28.7%) | 343 (71.3%) |
| Total (Category) | 247 (24.9%) | 745 (75.1%) |
| Total (Overall) | 2,958 (52.6%) | 2,662 (47.4%) |
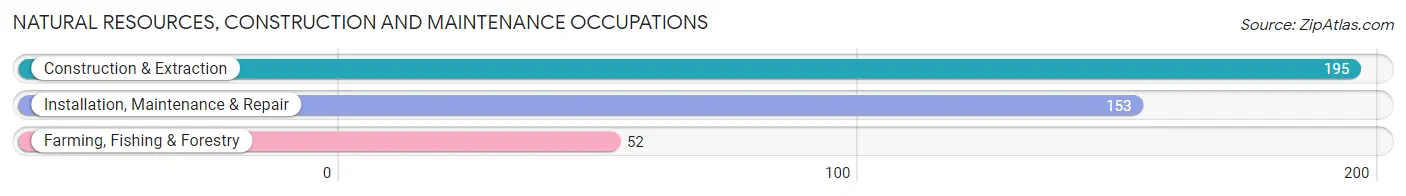
Natural Resources, Construction and Maintenance Occupations
The most common Natural Resources, Construction and Maintenance occupations in Storm Lake are Construction & Extraction (195 | 3.5%), Installation, Maintenance & Repair (153 | 2.7%), and Farming, Fishing & Forestry (52 | 0.9%).
Natural Resources, Construction and Maintenance Occupations by Sex
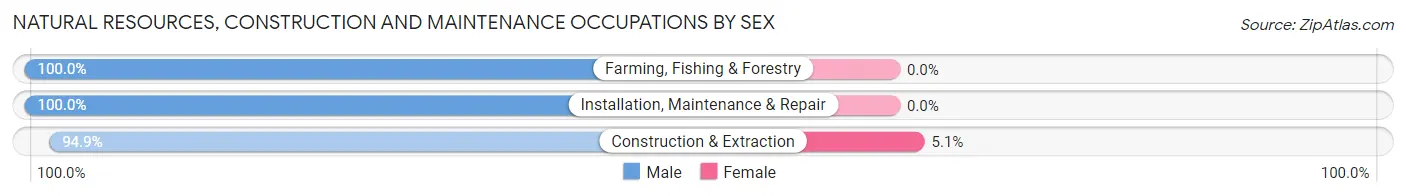
| Occupation | Male | Female |
| Farming, Fishing & Forestry | 52 (100.0%) | 0 (0.0%) |
| Construction & Extraction | 185 (94.9%) | 10 (5.1%) |
| Installation, Maintenance & Repair | 153 (100.0%) | 0 (0.0%) |
| Total (Category) | 390 (97.5%) | 10 (2.5%) |
| Total (Overall) | 2,958 (52.6%) | 2,662 (47.4%) |
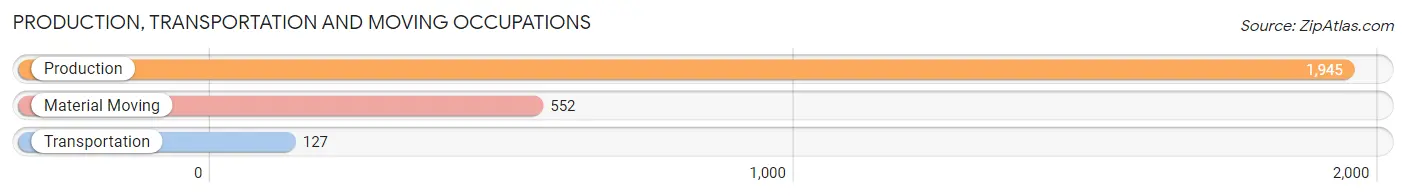
Production, Transportation and Moving Occupations
The most common Production, Transportation and Moving occupations in Storm Lake are Production (1,945 | 34.6%), Material Moving (552 | 9.8%), and Transportation (127 | 2.3%).
Production, Transportation and Moving Occupations by Sex
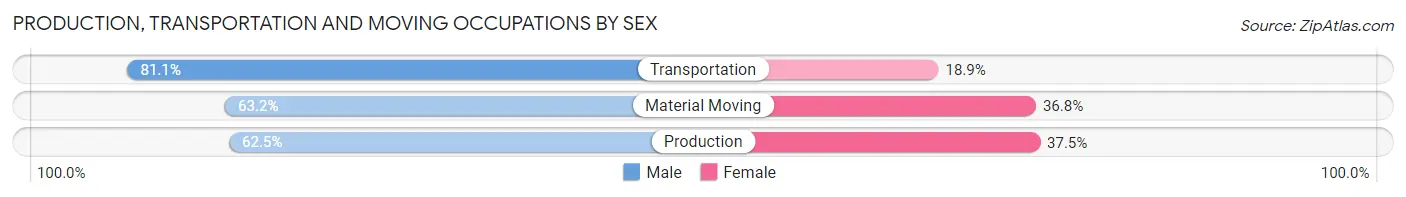
| Occupation | Male | Female |
| Production | 1,215 (62.5%) | 730 (37.5%) |
| Transportation | 103 (81.1%) | 24 (18.9%) |
| Material Moving | 349 (63.2%) | 203 (36.8%) |
| Total (Category) | 1,667 (63.5%) | 957 (36.5%) |
| Total (Overall) | 2,958 (52.6%) | 2,662 (47.4%) |
Employment Industries by Sex in Storm Lake
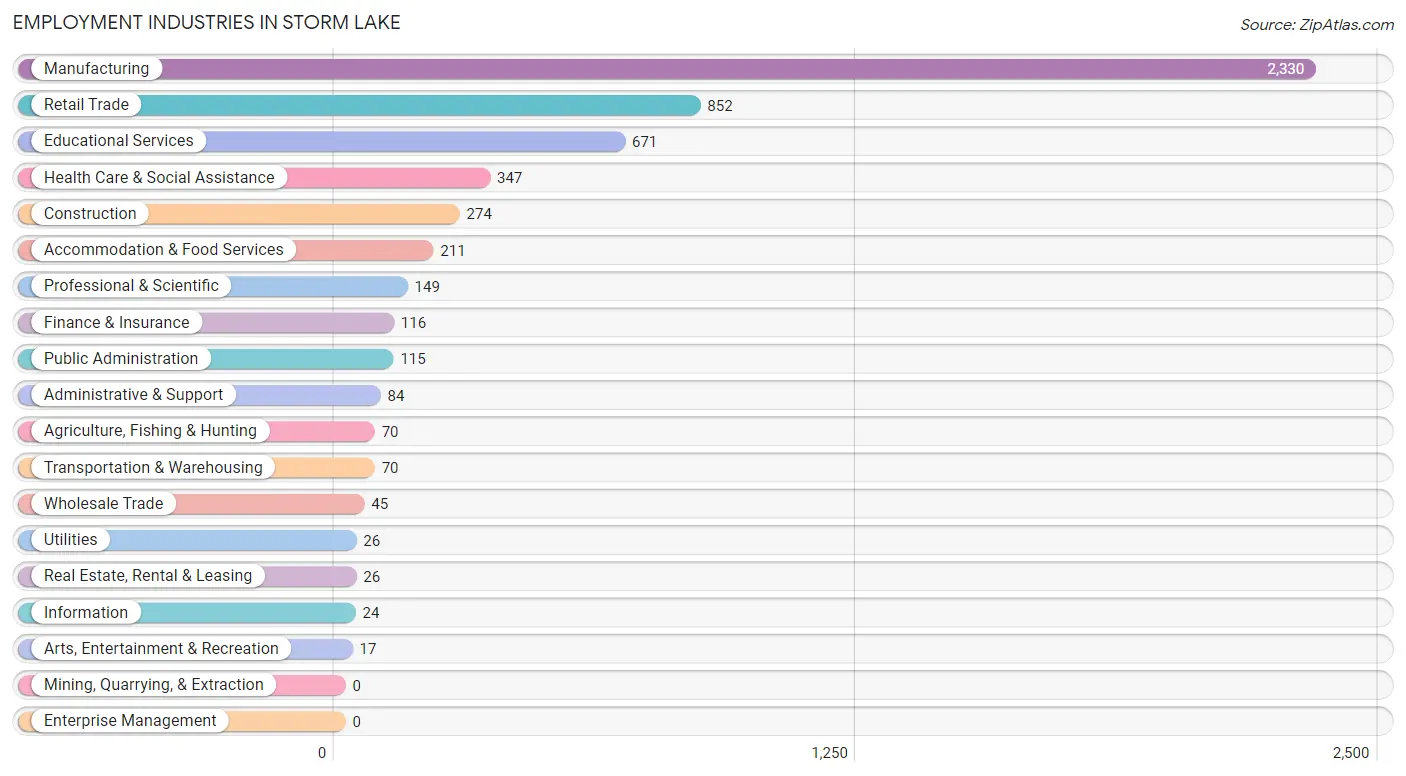
Employment Industries in Storm Lake
The major employment industries in Storm Lake include Manufacturing (2,330 | 41.5%), Retail Trade (852 | 15.2%), Educational Services (671 | 11.9%), Health Care & Social Assistance (347 | 6.2%), and Construction (274 | 4.9%).
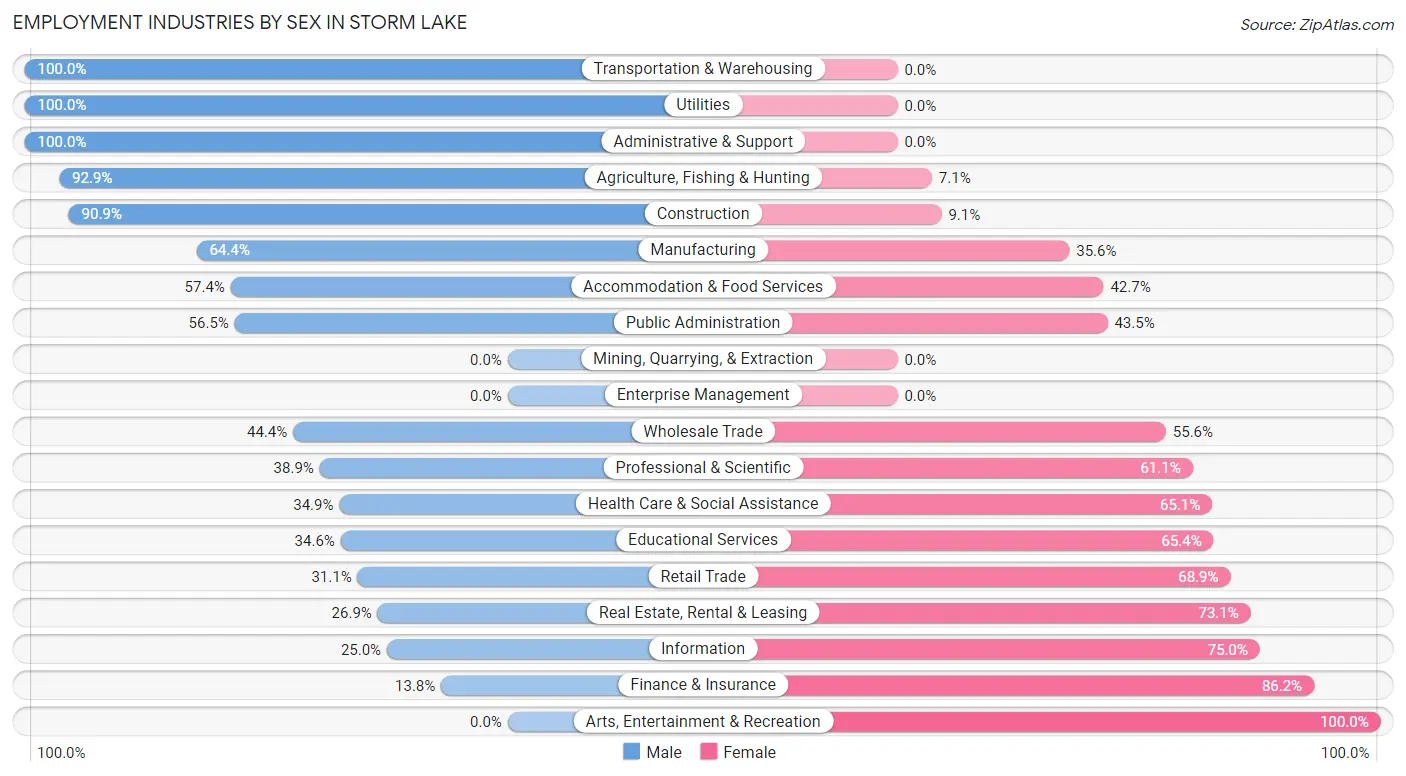
Employment Industries by Sex in Storm Lake
The Storm Lake industries that see more men than women are Transportation & Warehousing (100.0%), Utilities (100.0%), and Administrative & Support (100.0%), whereas the industries that tend to have a higher number of women are Arts, Entertainment & Recreation (100.0%), Finance & Insurance (86.2%), and Information (75.0%).
| Industry | Male | Female |
| Agriculture, Fishing & Hunting | 65 (92.9%) | 5 (7.1%) |
| Mining, Quarrying, & Extraction | 0 (0.0%) | 0 (0.0%) |
| Construction | 249 (90.9%) | 25 (9.1%) |
| Manufacturing | 1,501 (64.4%) | 829 (35.6%) |
| Wholesale Trade | 20 (44.4%) | 25 (55.6%) |
| Retail Trade | 265 (31.1%) | 587 (68.9%) |
| Transportation & Warehousing | 70 (100.0%) | 0 (0.0%) |
| Utilities | 26 (100.0%) | 0 (0.0%) |
| Information | 6 (25.0%) | 18 (75.0%) |
| Finance & Insurance | 16 (13.8%) | 100 (86.2%) |
| Real Estate, Rental & Leasing | 7 (26.9%) | 19 (73.1%) |
| Professional & Scientific | 58 (38.9%) | 91 (61.1%) |
| Enterprise Management | 0 (0.0%) | 0 (0.0%) |
| Administrative & Support | 84 (100.0%) | 0 (0.0%) |
| Educational Services | 232 (34.6%) | 439 (65.4%) |
| Health Care & Social Assistance | 121 (34.9%) | 226 (65.1%) |
| Arts, Entertainment & Recreation | 0 (0.0%) | 17 (100.0%) |
| Accommodation & Food Services | 121 (57.4%) | 90 (42.6%) |
| Public Administration | 65 (56.5%) | 50 (43.5%) |
| Total | 2,958 (52.6%) | 2,662 (47.4%) |
Education in Storm Lake
School Enrollment in Storm Lake
The most common levels of schooling among the 3,300 students in Storm Lake are college / undergraduate (881 | 26.7%), high school (726 | 22.0%), and elementary school (689 | 20.9%).
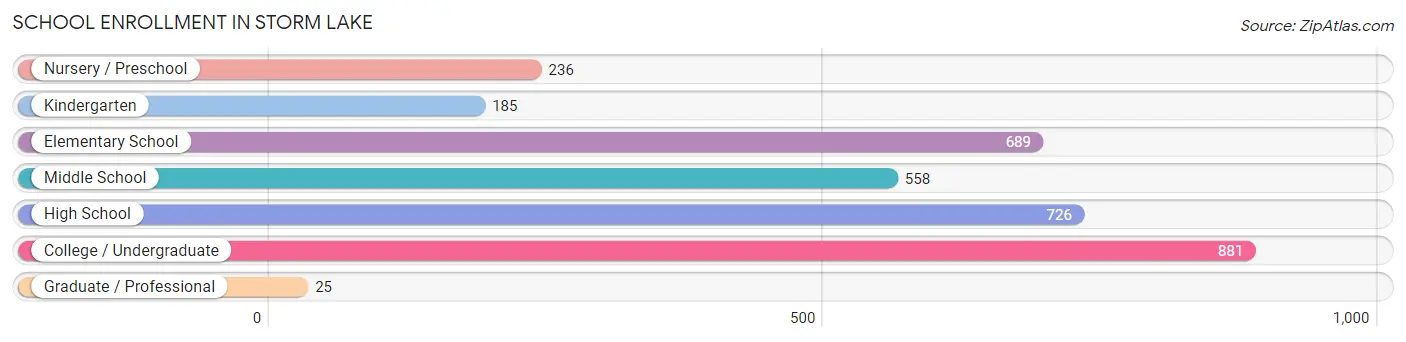
| School Level | # Students | % Students |
| Nursery / Preschool | 236 | 7.1% |
| Kindergarten | 185 | 5.6% |
| Elementary School | 689 | 20.9% |
| Middle School | 558 | 16.9% |
| High School | 726 | 22.0% |
| College / Undergraduate | 881 | 26.7% |
| Graduate / Professional | 25 | 0.8% |
| Total | 3,300 | 100.0% |
School Enrollment by Age by Funding Source in Storm Lake
Out of a total of 3,300 students who are enrolled in schools in Storm Lake, 693 (21.0%) attend a private institution, while the remaining 2,607 (79.0%) are enrolled in public schools. The age group of 20 to 24 year olds has the highest likelihood of being enrolled in private schools, with 322 (66.9% in the age bracket) enrolled. Conversely, the age group of 3 to 4 year olds has the lowest likelihood of being enrolled in a private school, with 201 (100.0% in the age bracket) attending a public institution.
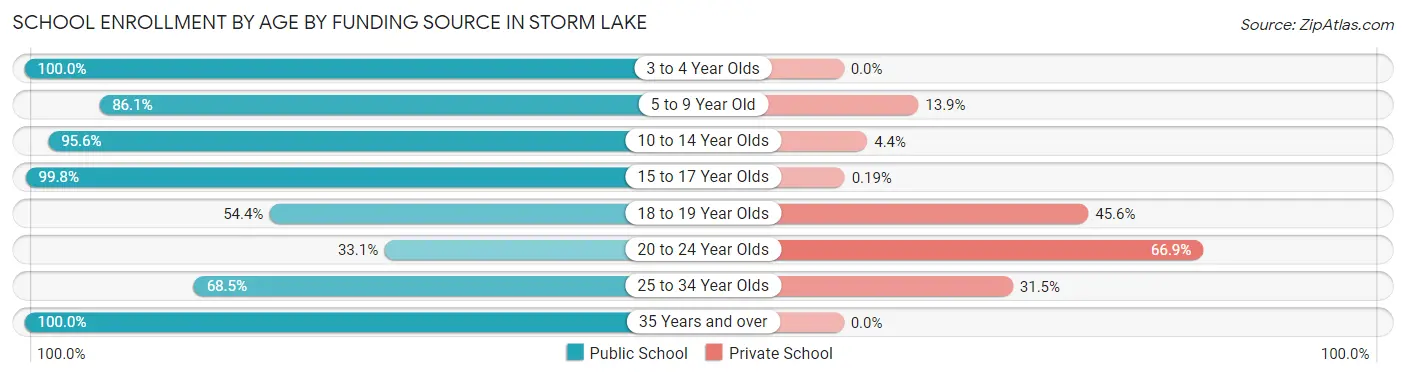
| Age Bracket | Public School | Private School |
| 3 to 4 Year Olds | 201 (100.0%) | 0 (0.0%) |
| 5 to 9 Year Old | 718 (86.1%) | 116 (13.9%) |
| 10 to 14 Year Olds | 696 (95.6%) | 32 (4.4%) |
| 15 to 17 Year Olds | 526 (99.8%) | 1 (0.2%) |
| 18 to 19 Year Olds | 239 (54.4%) | 200 (45.6%) |
| 20 to 24 Year Olds | 159 (33.1%) | 322 (66.9%) |
| 25 to 34 Year Olds | 50 (68.5%) | 23 (31.5%) |
| 35 Years and over | 17 (100.0%) | 0 (0.0%) |
| Total | 2,607 (79.0%) | 693 (21.0%) |
Educational Attainment by Field of Study in Storm Lake
Education (365 | 27.9%), business (214 | 16.4%), bio, nature & agricultural (169 | 12.9%), arts & humanities (113 | 8.6%), and science & technology (88 | 6.7%) are the most common fields of study among 1,307 individuals in Storm Lake who have obtained a bachelor's degree or higher.
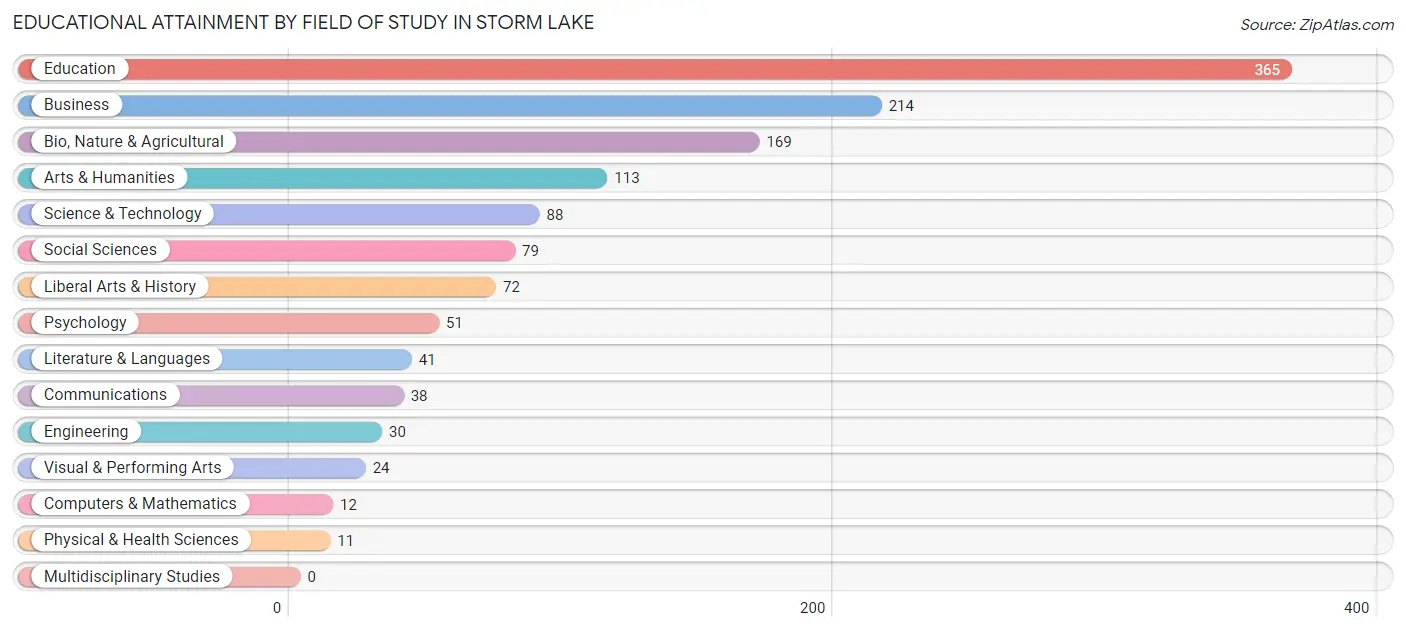
| Field of Study | # Graduates | % Graduates |
| Computers & Mathematics | 12 | 0.9% |
| Bio, Nature & Agricultural | 169 | 12.9% |
| Physical & Health Sciences | 11 | 0.8% |
| Psychology | 51 | 3.9% |
| Social Sciences | 79 | 6.0% |
| Engineering | 30 | 2.3% |
| Multidisciplinary Studies | 0 | 0.0% |
| Science & Technology | 88 | 6.7% |
| Business | 214 | 16.4% |
| Education | 365 | 27.9% |
| Literature & Languages | 41 | 3.1% |
| Liberal Arts & History | 72 | 5.5% |
| Visual & Performing Arts | 24 | 1.8% |
| Communications | 38 | 2.9% |
| Arts & Humanities | 113 | 8.6% |
| Total | 1,307 | 100.0% |
Transportation & Commute in Storm Lake
Vehicle Availability by Sex in Storm Lake
The most prevalent vehicle ownership categories in Storm Lake are males with 2 vehicles (1,037, accounting for 37.3%) and females with 2 vehicles (739, making up 44.0%).
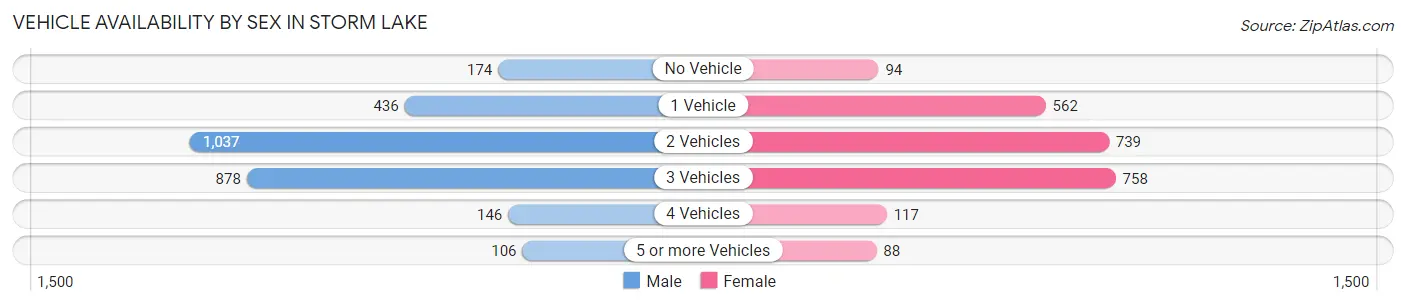
| Vehicles Available | Male | Female |
| No Vehicle | 174 (6.3%) | 94 (4.0%) |
| 1 Vehicle | 436 (15.7%) | 562 (23.8%) |
| 2 Vehicles | 1,037 (37.3%) | 739 (31.3%) |
| 3 Vehicles | 878 (31.6%) | 758 (32.2%) |
| 4 Vehicles | 146 (5.3%) | 117 (5.0%) |
| 5 or more Vehicles | 106 (3.8%) | 88 (3.7%) |
| Total | 2,777 (100.0%) | 2,358 (100.0%) |
Commute Time in Storm Lake
The most frequently occuring commute durations in Storm Lake are 5 to 9 minutes (2,215 commuters, 42.6%), 10 to 14 minutes (1,140 commuters, 21.9%), and less than 5 minutes (848 commuters, 16.3%).
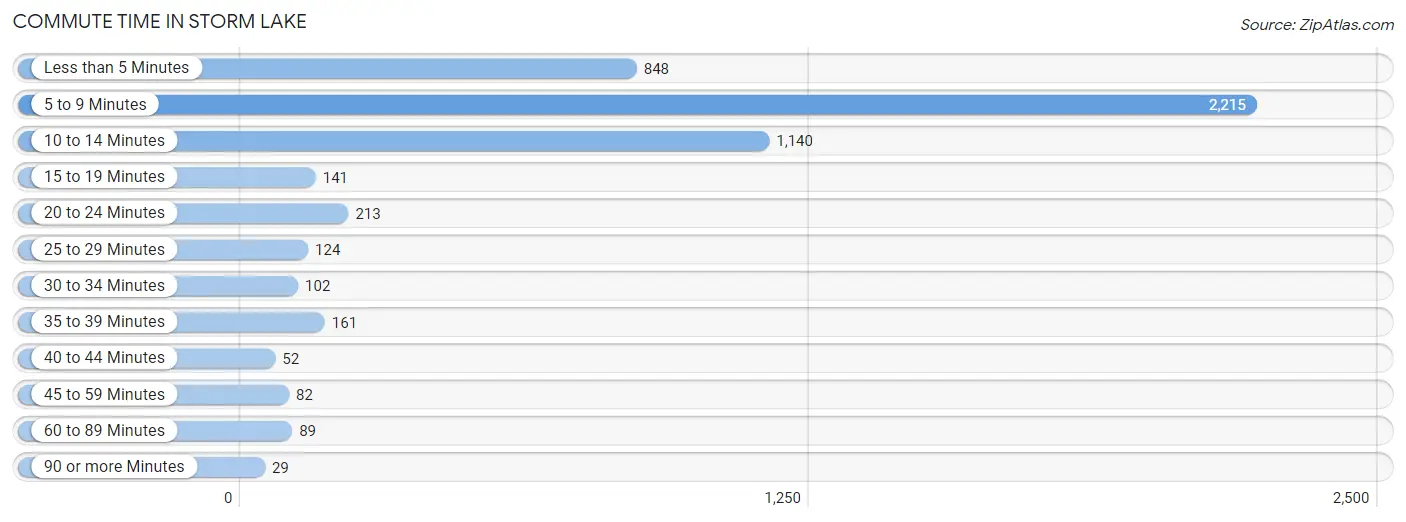
| Commute Time | # Commuters | % Commuters |
| Less than 5 Minutes | 848 | 16.3% |
| 5 to 9 Minutes | 2,215 | 42.6% |
| 10 to 14 Minutes | 1,140 | 21.9% |
| 15 to 19 Minutes | 141 | 2.7% |
| 20 to 24 Minutes | 213 | 4.1% |
| 25 to 29 Minutes | 124 | 2.4% |
| 30 to 34 Minutes | 102 | 2.0% |
| 35 to 39 Minutes | 161 | 3.1% |
| 40 to 44 Minutes | 52 | 1.0% |
| 45 to 59 Minutes | 82 | 1.6% |
| 60 to 89 Minutes | 89 | 1.7% |
| 90 or more Minutes | 29 | 0.6% |
Commute Time by Sex in Storm Lake
The most common commute times in Storm Lake are 5 to 9 minutes (1,179 commuters, 43.1%) for males and 5 to 9 minutes (1,036 commuters, 42.1%) for females.
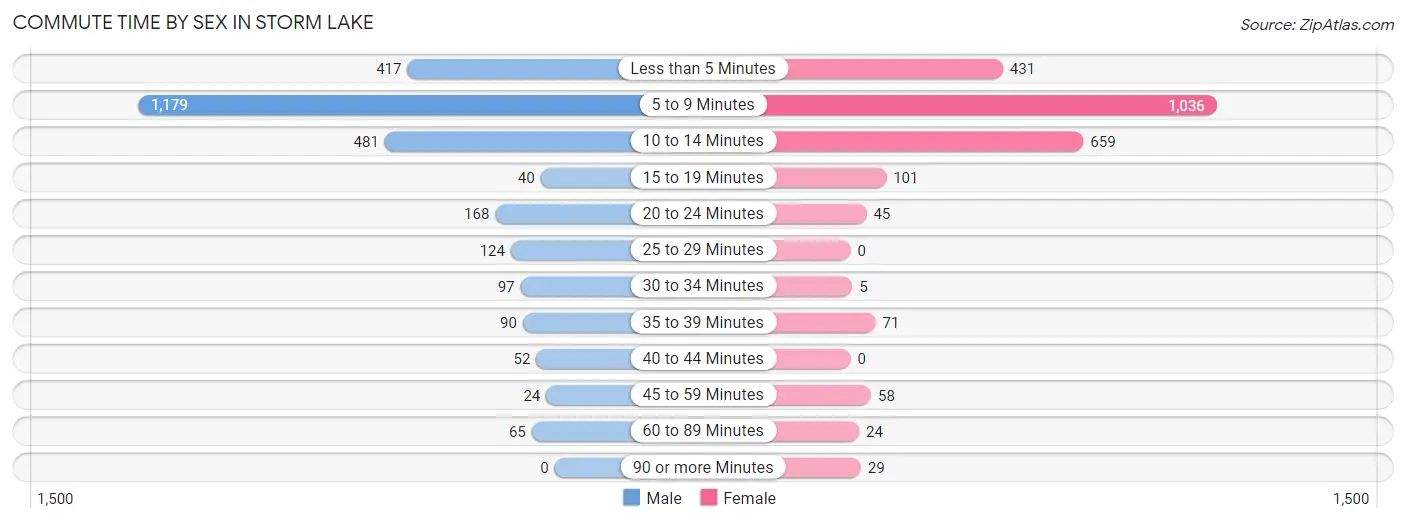
| Commute Time | Male | Female |
| Less than 5 Minutes | 417 (15.2%) | 431 (17.5%) |
| 5 to 9 Minutes | 1,179 (43.1%) | 1,036 (42.1%) |
| 10 to 14 Minutes | 481 (17.6%) | 659 (26.8%) |
| 15 to 19 Minutes | 40 (1.5%) | 101 (4.1%) |
| 20 to 24 Minutes | 168 (6.1%) | 45 (1.8%) |
| 25 to 29 Minutes | 124 (4.5%) | 0 (0.0%) |
| 30 to 34 Minutes | 97 (3.5%) | 5 (0.2%) |
| 35 to 39 Minutes | 90 (3.3%) | 71 (2.9%) |
| 40 to 44 Minutes | 52 (1.9%) | 0 (0.0%) |
| 45 to 59 Minutes | 24 (0.9%) | 58 (2.4%) |
| 60 to 89 Minutes | 65 (2.4%) | 24 (1.0%) |
| 90 or more Minutes | 0 (0.0%) | 29 (1.2%) |
Time of Departure to Work by Sex in Storm Lake
The most frequent times of departure to work in Storm Lake are 12:00 PM to 3:59 PM (578, 21.1%) for males and 7:30 AM to 7:59 AM (356, 14.5%) for females.
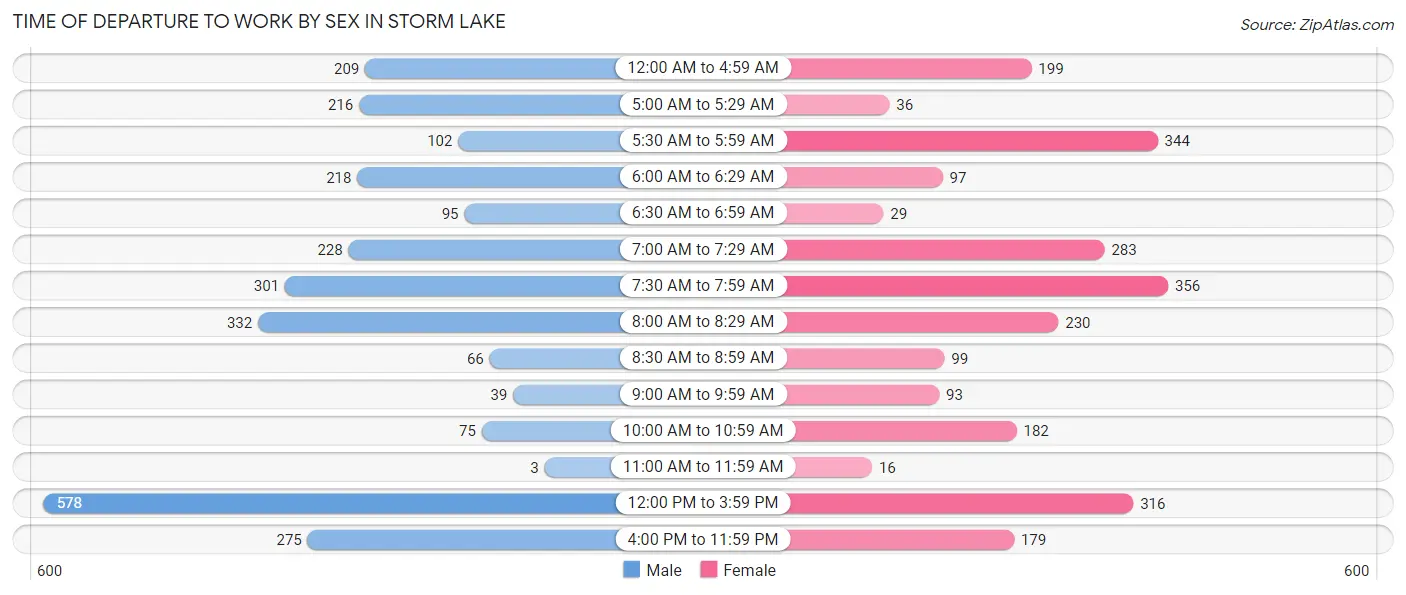
| Time of Departure | Male | Female |
| 12:00 AM to 4:59 AM | 209 (7.6%) | 199 (8.1%) |
| 5:00 AM to 5:29 AM | 216 (7.9%) | 36 (1.5%) |
| 5:30 AM to 5:59 AM | 102 (3.7%) | 344 (14.0%) |
| 6:00 AM to 6:29 AM | 218 (8.0%) | 97 (3.9%) |
| 6:30 AM to 6:59 AM | 95 (3.5%) | 29 (1.2%) |
| 7:00 AM to 7:29 AM | 228 (8.3%) | 283 (11.5%) |
| 7:30 AM to 7:59 AM | 301 (11.0%) | 356 (14.5%) |
| 8:00 AM to 8:29 AM | 332 (12.1%) | 230 (9.3%) |
| 8:30 AM to 8:59 AM | 66 (2.4%) | 99 (4.0%) |
| 9:00 AM to 9:59 AM | 39 (1.4%) | 93 (3.8%) |
| 10:00 AM to 10:59 AM | 75 (2.7%) | 182 (7.4%) |
| 11:00 AM to 11:59 AM | 3 (0.1%) | 16 (0.6%) |
| 12:00 PM to 3:59 PM | 578 (21.1%) | 316 (12.9%) |
| 4:00 PM to 11:59 PM | 275 (10.1%) | 179 (7.3%) |
| Total | 2,737 (100.0%) | 2,459 (100.0%) |
Housing Occupancy in Storm Lake
Occupancy by Ownership in Storm Lake
Of the total 3,996 dwellings in Storm Lake, owner-occupied units account for 2,392 (59.9%), while renter-occupied units make up 1,604 (40.1%).
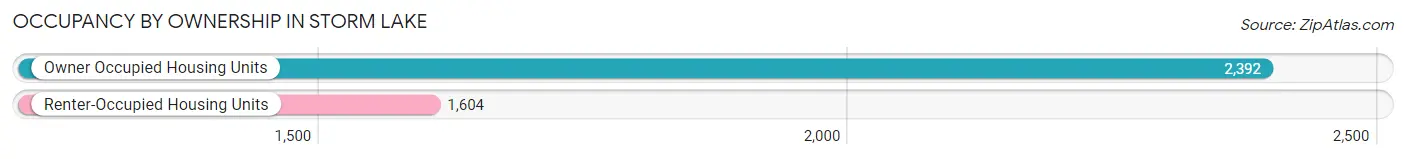
| Occupancy | # Housing Units | % Housing Units |
| Owner Occupied Housing Units | 2,392 | 59.9% |
| Renter-Occupied Housing Units | 1,604 | 40.1% |
| Total Occupied Housing Units | 3,996 | 100.0% |
Occupancy by Household Size in Storm Lake
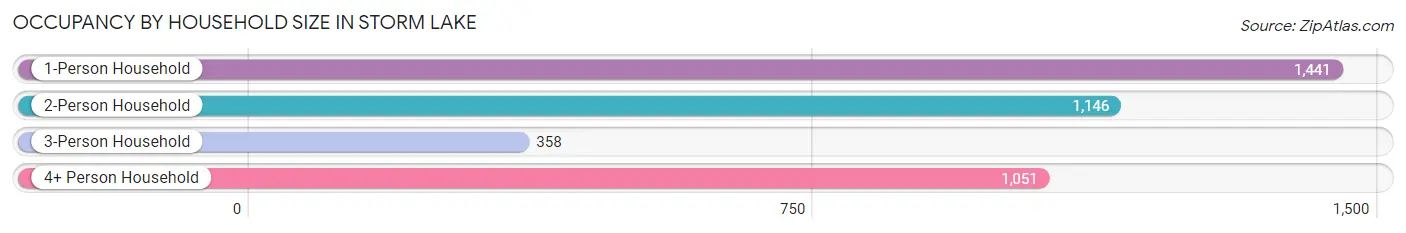
| Household Size | # Housing Units | % Housing Units |
| 1-Person Household | 1,441 | 36.1% |
| 2-Person Household | 1,146 | 28.7% |
| 3-Person Household | 358 | 9.0% |
| 4+ Person Household | 1,051 | 26.3% |
| Total Housing Units | 3,996 | 100.0% |
Occupancy by Ownership by Household Size in Storm Lake
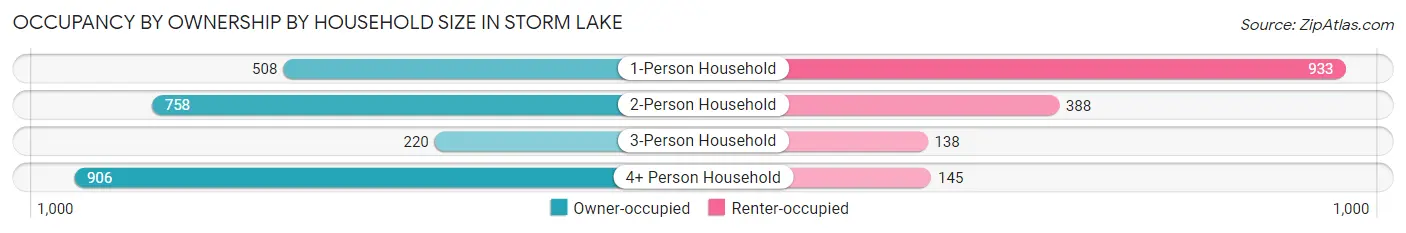
| Household Size | Owner-occupied | Renter-occupied |
| 1-Person Household | 508 (35.2%) | 933 (64.7%) |
| 2-Person Household | 758 (66.1%) | 388 (33.9%) |
| 3-Person Household | 220 (61.5%) | 138 (38.6%) |
| 4+ Person Household | 906 (86.2%) | 145 (13.8%) |
| Total Housing Units | 2,392 (59.9%) | 1,604 (40.1%) |
Occupancy by Educational Attainment in Storm Lake
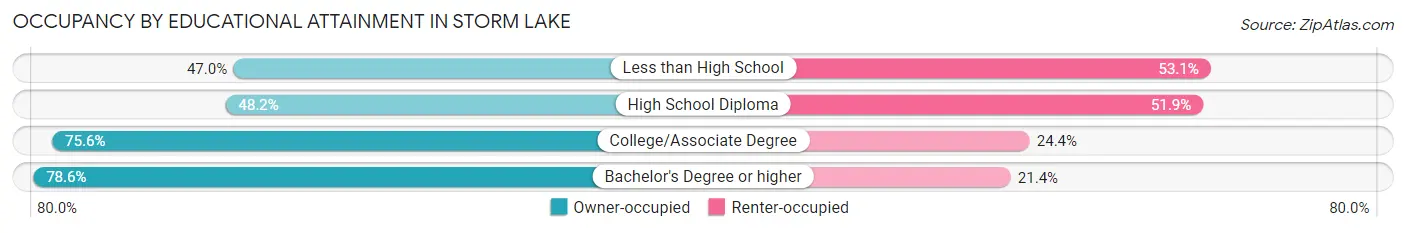
| Household Size | Owner-occupied | Renter-occupied |
| Less than High School | 584 (46.9%) | 660 (53.0%) |
| High School Diploma | 520 (48.1%) | 560 (51.8%) |
| College/Associate Degree | 670 (75.6%) | 216 (24.4%) |
| Bachelor's Degree or higher | 618 (78.6%) | 168 (21.4%) |
Occupancy by Age of Householder in Storm Lake
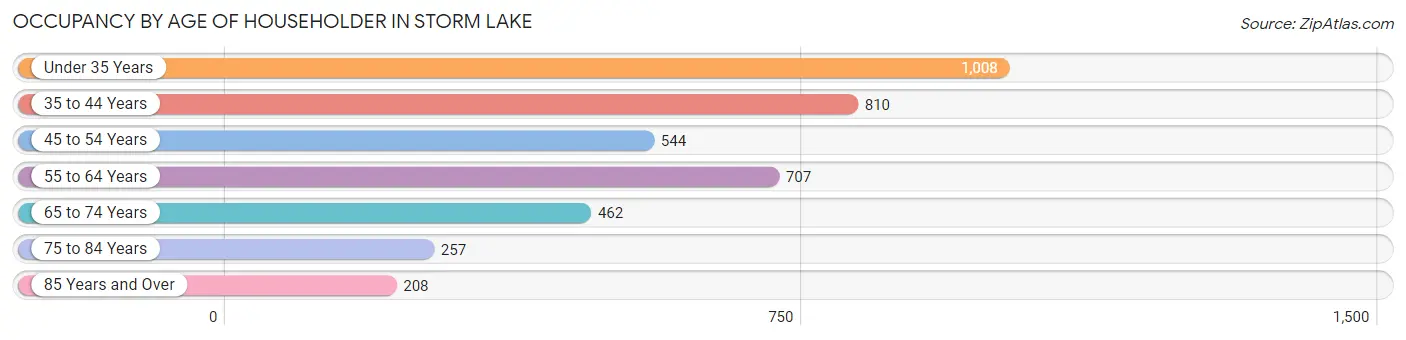
| Age Bracket | # Households | % Households |
| Under 35 Years | 1,008 | 25.2% |
| 35 to 44 Years | 810 | 20.3% |
| 45 to 54 Years | 544 | 13.6% |
| 55 to 64 Years | 707 | 17.7% |
| 65 to 74 Years | 462 | 11.6% |
| 75 to 84 Years | 257 | 6.4% |
| 85 Years and Over | 208 | 5.2% |
| Total | 3,996 | 100.0% |
Housing Finances in Storm Lake
Median Income by Occupancy in Storm Lake
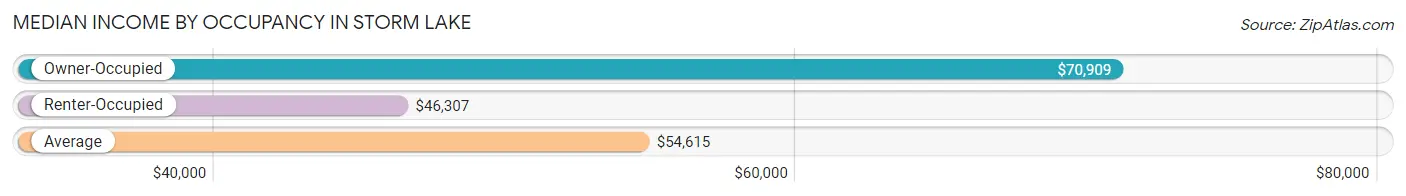
| Occupancy Type | # Households | Median Income |
| Owner-Occupied | 2,392 (59.9%) | $70,909 |
| Renter-Occupied | 1,604 (40.1%) | $46,307 |
| Average | 3,996 (100.0%) | $54,615 |
Occupancy by Householder Income Bracket in Storm Lake
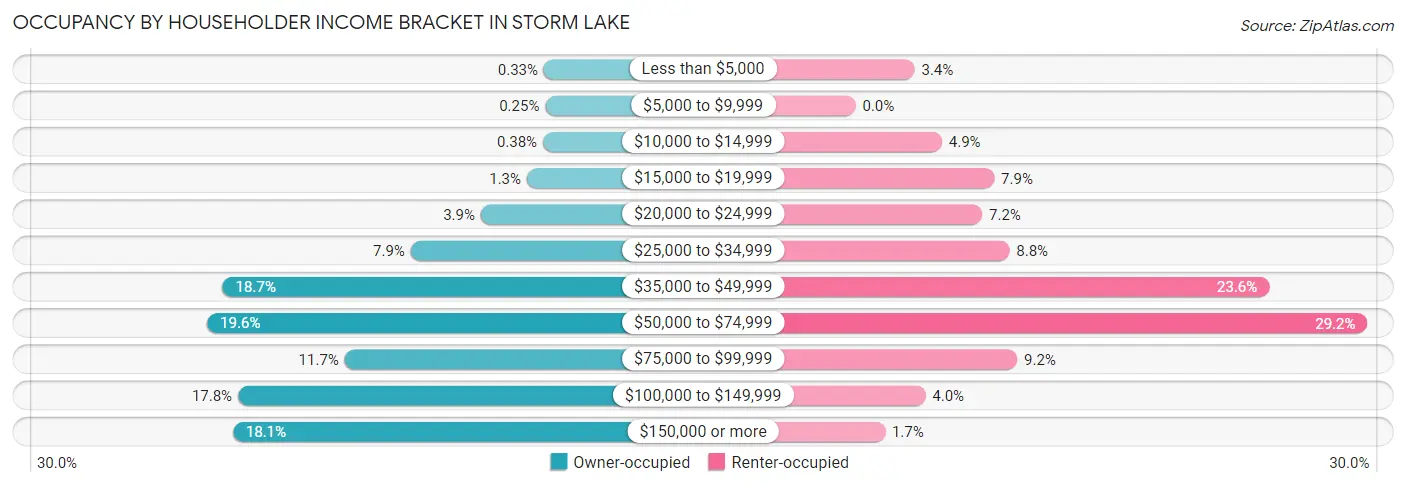
| Income Bracket | Owner-occupied | Renter-occupied |
| Less than $5,000 | 8 (0.3%) | 54 (3.4%) |
| $5,000 to $9,999 | 6 (0.3%) | 0 (0.0%) |
| $10,000 to $14,999 | 9 (0.4%) | 79 (4.9%) |
| $15,000 to $19,999 | 31 (1.3%) | 127 (7.9%) |
| $20,000 to $24,999 | 94 (3.9%) | 116 (7.2%) |
| $25,000 to $34,999 | 190 (7.9%) | 141 (8.8%) |
| $35,000 to $49,999 | 447 (18.7%) | 379 (23.6%) |
| $50,000 to $74,999 | 468 (19.6%) | 469 (29.2%) |
| $75,000 to $99,999 | 280 (11.7%) | 148 (9.2%) |
| $100,000 to $149,999 | 426 (17.8%) | 64 (4.0%) |
| $150,000 or more | 433 (18.1%) | 27 (1.7%) |
| Total | 2,392 (100.0%) | 1,604 (100.0%) |
Monthly Housing Cost Tiers in Storm Lake
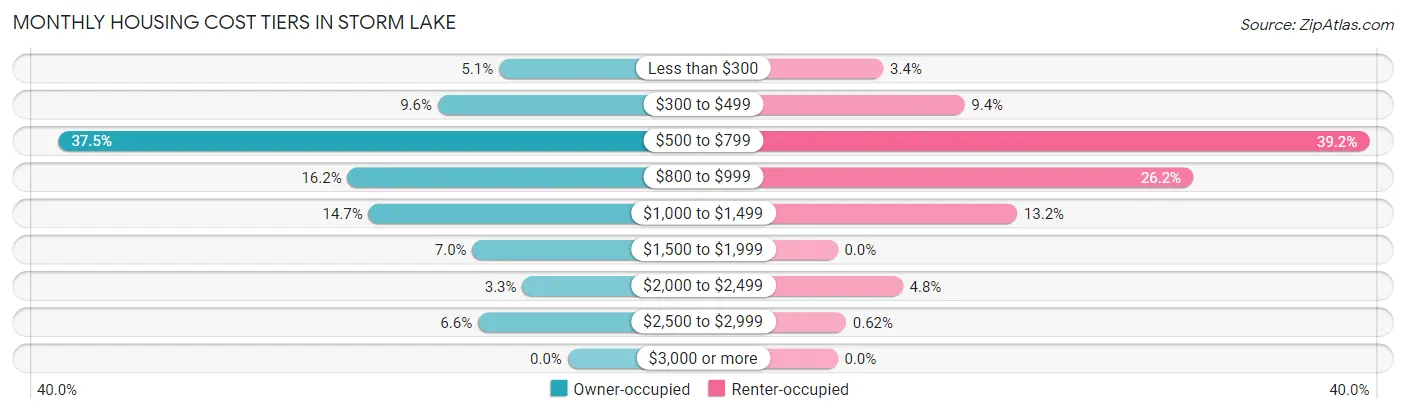
| Monthly Cost | Owner-occupied | Renter-occupied |
| Less than $300 | 121 (5.1%) | 54 (3.4%) |
| $300 to $499 | 229 (9.6%) | 150 (9.3%) |
| $500 to $799 | 897 (37.5%) | 628 (39.2%) |
| $800 to $999 | 388 (16.2%) | 420 (26.2%) |
| $1,000 to $1,499 | 351 (14.7%) | 212 (13.2%) |
| $1,500 to $1,999 | 168 (7.0%) | 0 (0.0%) |
| $2,000 to $2,499 | 80 (3.3%) | 77 (4.8%) |
| $2,500 to $2,999 | 158 (6.6%) | 10 (0.6%) |
| $3,000 or more | 0 (0.0%) | 0 (0.0%) |
| Total | 2,392 (100.0%) | 1,604 (100.0%) |
Physical Housing Characteristics in Storm Lake
Housing Structures in Storm Lake
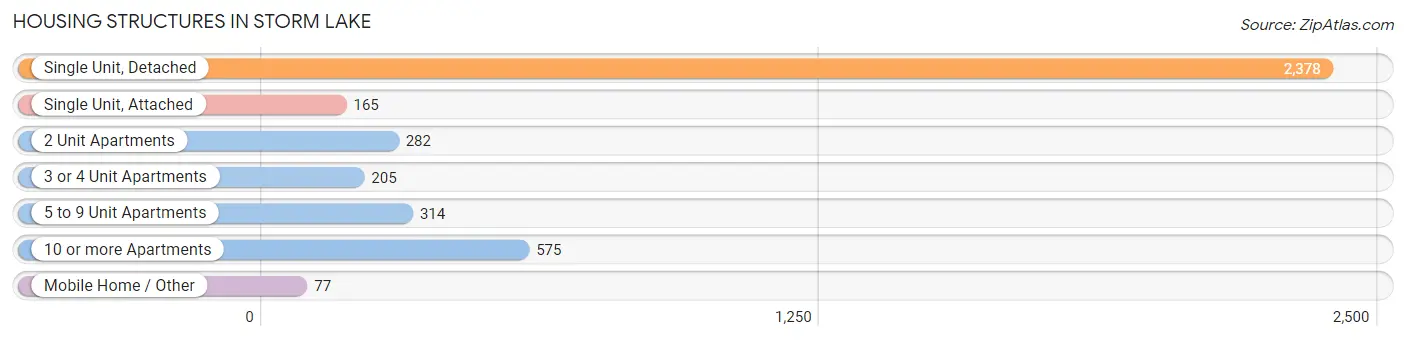
| Structure Type | # Housing Units | % Housing Units |
| Single Unit, Detached | 2,378 | 59.5% |
| Single Unit, Attached | 165 | 4.1% |
| 2 Unit Apartments | 282 | 7.1% |
| 3 or 4 Unit Apartments | 205 | 5.1% |
| 5 to 9 Unit Apartments | 314 | 7.9% |
| 10 or more Apartments | 575 | 14.4% |
| Mobile Home / Other | 77 | 1.9% |
| Total | 3,996 | 100.0% |
Housing Structures by Occupancy in Storm Lake
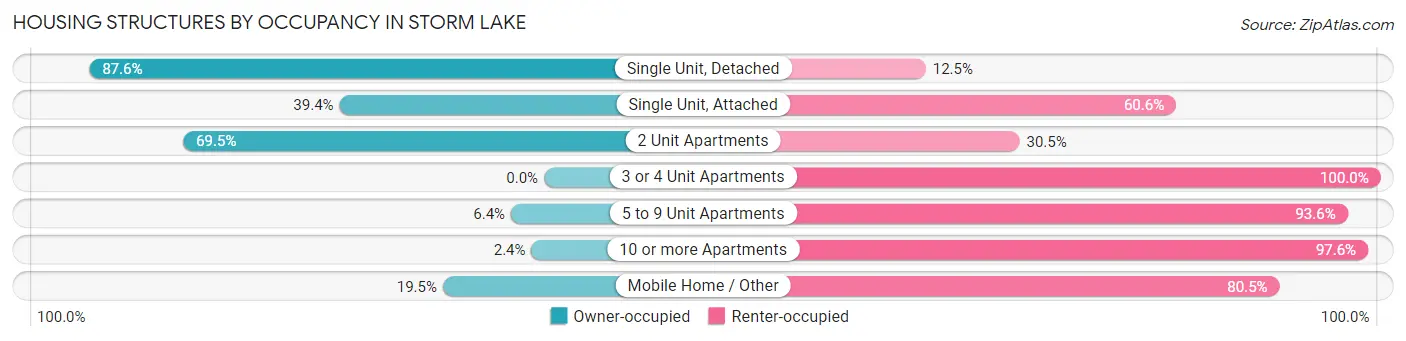
| Structure Type | Owner-occupied | Renter-occupied |
| Single Unit, Detached | 2,082 (87.5%) | 296 (12.4%) |
| Single Unit, Attached | 65 (39.4%) | 100 (60.6%) |
| 2 Unit Apartments | 196 (69.5%) | 86 (30.5%) |
| 3 or 4 Unit Apartments | 0 (0.0%) | 205 (100.0%) |
| 5 to 9 Unit Apartments | 20 (6.4%) | 294 (93.6%) |
| 10 or more Apartments | 14 (2.4%) | 561 (97.6%) |
| Mobile Home / Other | 15 (19.5%) | 62 (80.5%) |
| Total | 2,392 (59.9%) | 1,604 (40.1%) |
Housing Structures by Number of Rooms in Storm Lake
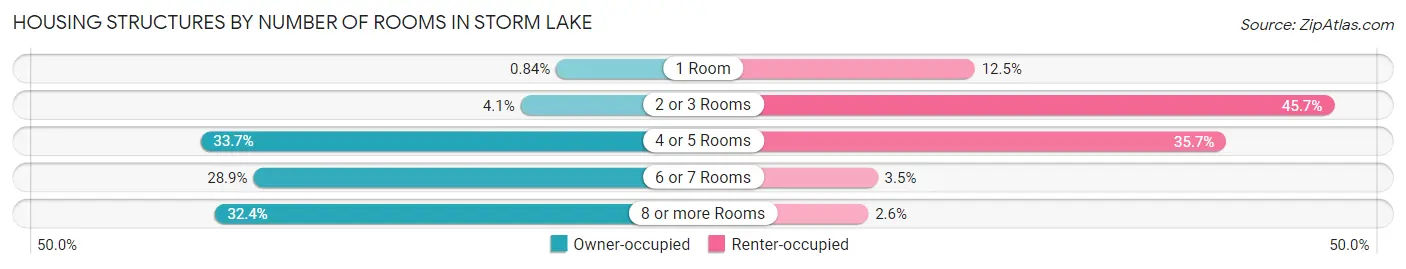
| Number of Rooms | Owner-occupied | Renter-occupied |
| 1 Room | 20 (0.8%) | 200 (12.5%) |
| 2 or 3 Rooms | 99 (4.1%) | 733 (45.7%) |
| 4 or 5 Rooms | 807 (33.7%) | 573 (35.7%) |
| 6 or 7 Rooms | 690 (28.8%) | 56 (3.5%) |
| 8 or more Rooms | 776 (32.4%) | 42 (2.6%) |
| Total | 2,392 (100.0%) | 1,604 (100.0%) |
Housing Structure by Heating Type in Storm Lake
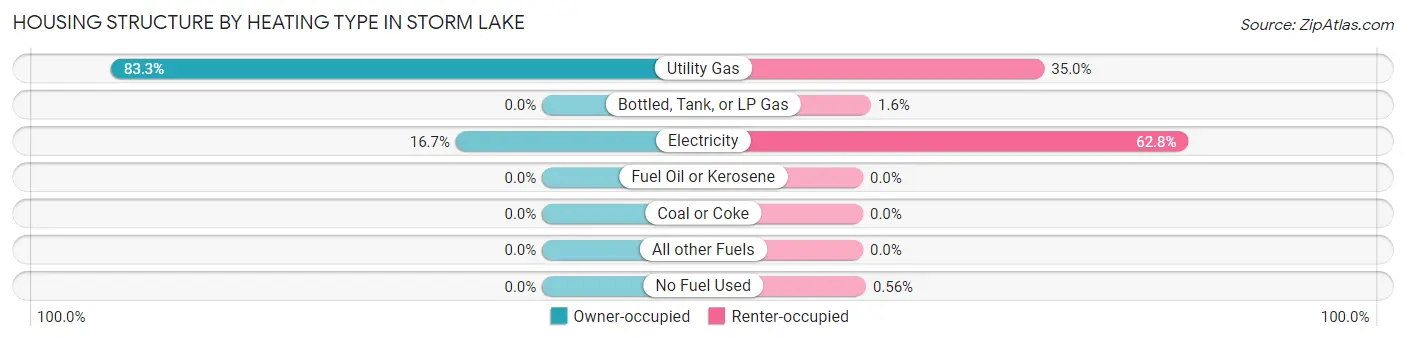
| Heating Type | Owner-occupied | Renter-occupied |
| Utility Gas | 1,993 (83.3%) | 562 (35.0%) |
| Bottled, Tank, or LP Gas | 0 (0.0%) | 25 (1.6%) |
| Electricity | 399 (16.7%) | 1,008 (62.8%) |
| Fuel Oil or Kerosene | 0 (0.0%) | 0 (0.0%) |
| Coal or Coke | 0 (0.0%) | 0 (0.0%) |
| All other Fuels | 0 (0.0%) | 0 (0.0%) |
| No Fuel Used | 0 (0.0%) | 9 (0.6%) |
| Total | 2,392 (100.0%) | 1,604 (100.0%) |
Household Vehicle Usage in Storm Lake
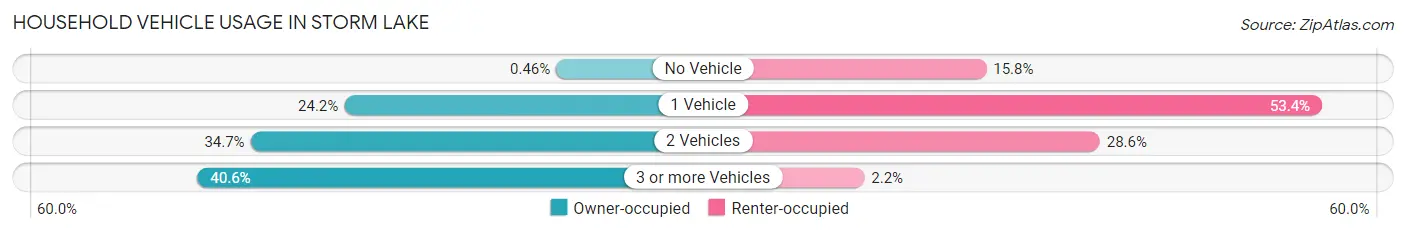
| Vehicles per Household | Owner-occupied | Renter-occupied |
| No Vehicle | 11 (0.5%) | 254 (15.8%) |
| 1 Vehicle | 579 (24.2%) | 857 (53.4%) |
| 2 Vehicles | 830 (34.7%) | 458 (28.5%) |
| 3 or more Vehicles | 972 (40.6%) | 35 (2.2%) |
| Total | 2,392 (100.0%) | 1,604 (100.0%) |
Real Estate & Mortgages in Storm Lake
Real Estate and Mortgage Overview in Storm Lake
| Characteristic | Without Mortgage | With Mortgage |
| Housing Units | 1,143 | 1,249 |
| Median Property Value | $160,900 | $142,600 |
| Median Household Income | $54,164 | $265 |
| Monthly Housing Costs | $558 | $0 |
| Real Estate Taxes | $2,223 | $0 |
Property Value by Mortgage Status in Storm Lake
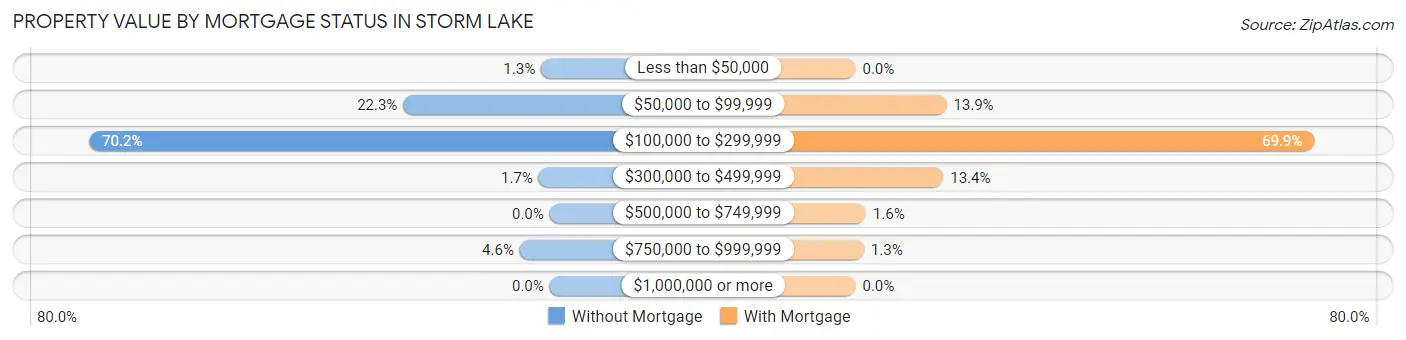
| Property Value | Without Mortgage | With Mortgage |
| Less than $50,000 | 15 (1.3%) | 0 (0.0%) |
| $50,000 to $99,999 | 255 (22.3%) | 173 (13.9%) |
| $100,000 to $299,999 | 802 (70.2%) | 873 (69.9%) |
| $300,000 to $499,999 | 19 (1.7%) | 167 (13.4%) |
| $500,000 to $749,999 | 0 (0.0%) | 20 (1.6%) |
| $750,000 to $999,999 | 52 (4.5%) | 16 (1.3%) |
| $1,000,000 or more | 0 (0.0%) | 0 (0.0%) |
| Total | 1,143 (100.0%) | 1,249 (100.0%) |
Household Income by Mortgage Status in Storm Lake
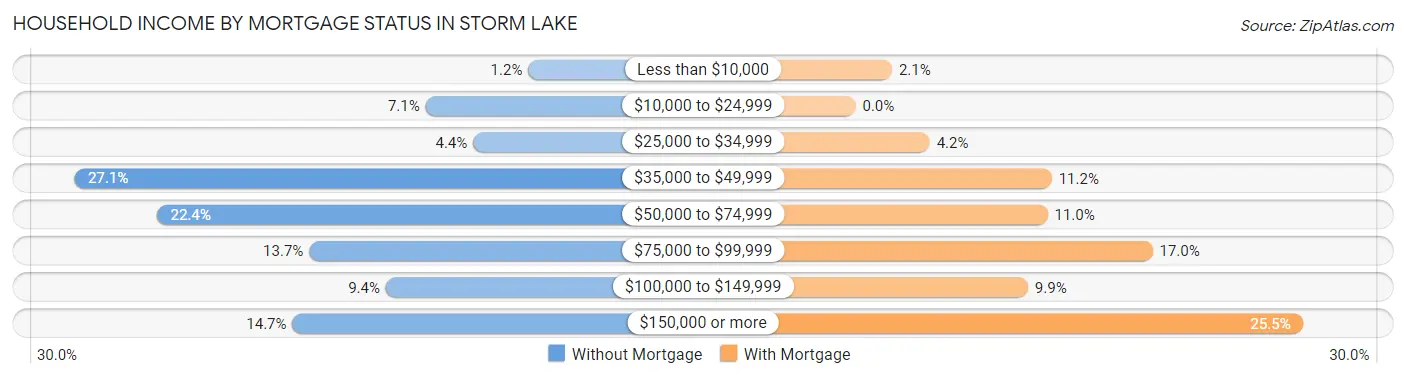
| Household Income | Without Mortgage | With Mortgage |
| Less than $10,000 | 14 (1.2%) | 26 (2.1%) |
| $10,000 to $24,999 | 81 (7.1%) | 0 (0.0%) |
| $25,000 to $34,999 | 50 (4.4%) | 53 (4.2%) |
| $35,000 to $49,999 | 310 (27.1%) | 140 (11.2%) |
| $50,000 to $74,999 | 256 (22.4%) | 137 (11.0%) |
| $75,000 to $99,999 | 157 (13.7%) | 212 (17.0%) |
| $100,000 to $149,999 | 107 (9.4%) | 123 (9.9%) |
| $150,000 or more | 168 (14.7%) | 319 (25.5%) |
| Total | 1,143 (100.0%) | 1,249 (100.0%) |
Property Value to Household Income Ratio in Storm Lake
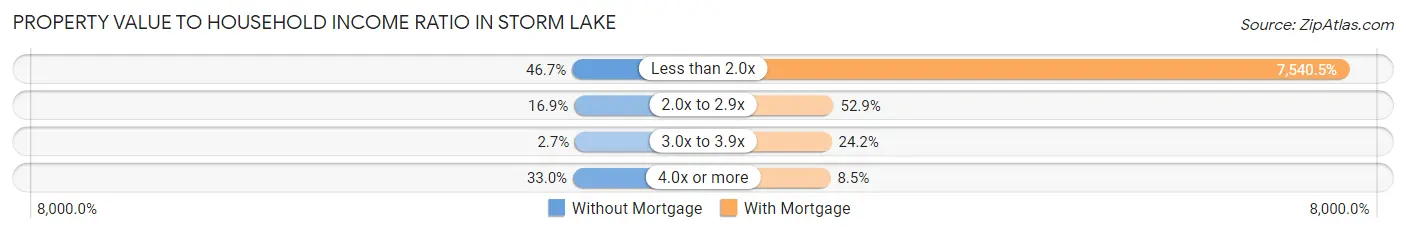
| Value-to-Income Ratio | Without Mortgage | With Mortgage |
| Less than 2.0x | 534 (46.7%) | 94,181 (7,540.5%) |
| 2.0x to 2.9x | 193 (16.9%) | 661 (52.9%) |
| 3.0x to 3.9x | 31 (2.7%) | 302 (24.2%) |
| 4.0x or more | 377 (33.0%) | 106 (8.5%) |
| Total | 1,143 (100.0%) | 1,249 (100.0%) |
Real Estate Taxes by Mortgage Status in Storm Lake
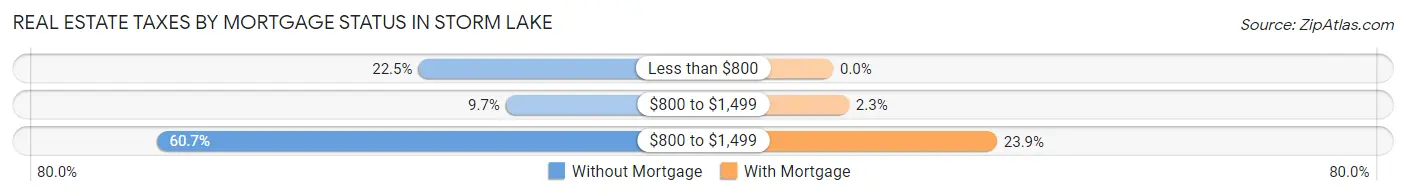
| Property Taxes | Without Mortgage | With Mortgage |
| Less than $800 | 257 (22.5%) | 0 (0.0%) |
| $800 to $1,499 | 111 (9.7%) | 29 (2.3%) |
| $800 to $1,499 | 694 (60.7%) | 299 (23.9%) |
| Total | 1,143 (100.0%) | 1,249 (100.0%) |
Health & Disability in Storm Lake
Health Insurance Coverage by Age in Storm Lake
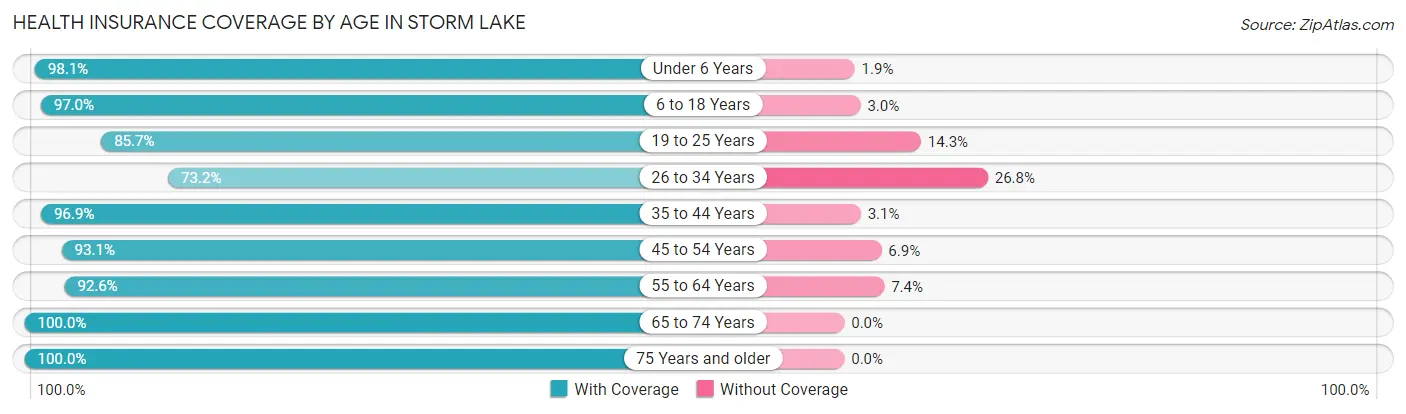
| Age Bracket | With Coverage | Without Coverage |
| Under 6 Years | 865 (98.1%) | 17 (1.9%) |
| 6 to 18 Years | 2,443 (97.0%) | 76 (3.0%) |
| 19 to 25 Years | 1,344 (85.7%) | 224 (14.3%) |
| 26 to 34 Years | 843 (73.2%) | 308 (26.8%) |
| 35 to 44 Years | 1,300 (96.9%) | 41 (3.1%) |
| 45 to 54 Years | 969 (93.1%) | 72 (6.9%) |
| 55 to 64 Years | 1,020 (92.6%) | 82 (7.4%) |
| 65 to 74 Years | 782 (100.0%) | 0 (0.0%) |
| 75 Years and older | 653 (100.0%) | 0 (0.0%) |
| Total | 10,219 (92.6%) | 820 (7.4%) |
Health Insurance Coverage by Citizenship Status in Storm Lake
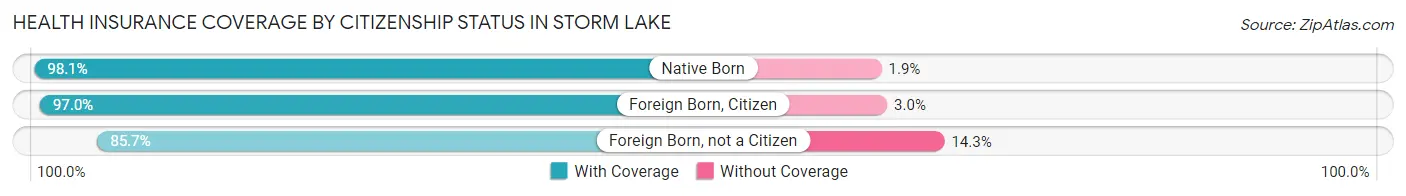
| Citizenship Status | With Coverage | Without Coverage |
| Native Born | 865 (98.1%) | 17 (1.9%) |
| Foreign Born, Citizen | 2,443 (97.0%) | 76 (3.0%) |
| Foreign Born, not a Citizen | 1,344 (85.7%) | 224 (14.3%) |
Health Insurance Coverage by Household Income in Storm Lake
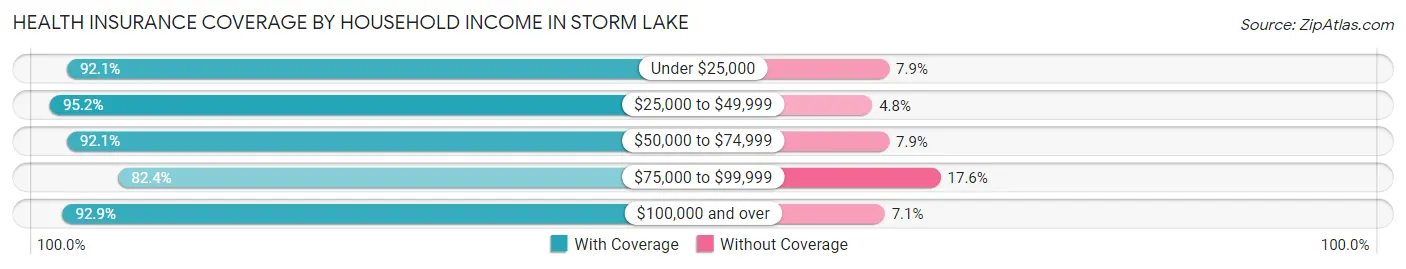
| Household Income | With Coverage | Without Coverage |
| Under $25,000 | 568 (92.1%) | 49 (7.9%) |
| $25,000 to $49,999 | 2,240 (95.2%) | 112 (4.8%) |
| $50,000 to $74,999 | 2,697 (92.1%) | 232 (7.9%) |
| $75,000 to $99,999 | 825 (82.4%) | 176 (17.6%) |
| $100,000 and over | 3,201 (92.9%) | 245 (7.1%) |
Public vs Private Health Insurance Coverage by Age in Storm Lake
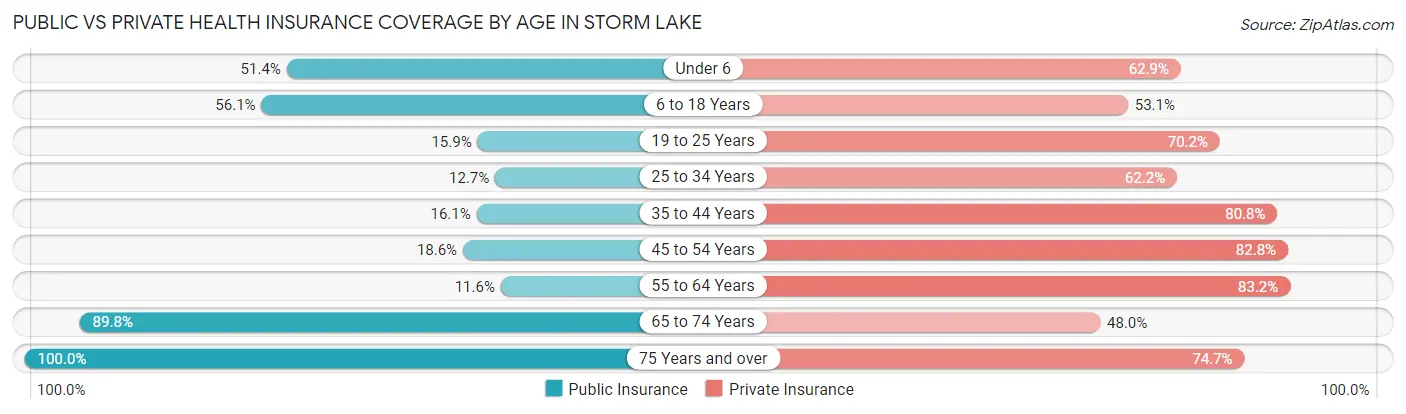
| Age Bracket | Public Insurance | Private Insurance |
| Under 6 | 453 (51.4%) | 555 (62.9%) |
| 6 to 18 Years | 1,412 (56.0%) | 1,337 (53.1%) |
| 19 to 25 Years | 250 (15.9%) | 1,100 (70.2%) |
| 25 to 34 Years | 146 (12.7%) | 716 (62.2%) |
| 35 to 44 Years | 216 (16.1%) | 1,084 (80.8%) |
| 45 to 54 Years | 194 (18.6%) | 862 (82.8%) |
| 55 to 64 Years | 128 (11.6%) | 917 (83.2%) |
| 65 to 74 Years | 702 (89.8%) | 375 (47.9%) |
| 75 Years and over | 653 (100.0%) | 488 (74.7%) |
| Total | 4,154 (37.6%) | 7,434 (67.3%) |
Disability Status by Sex by Age in Storm Lake
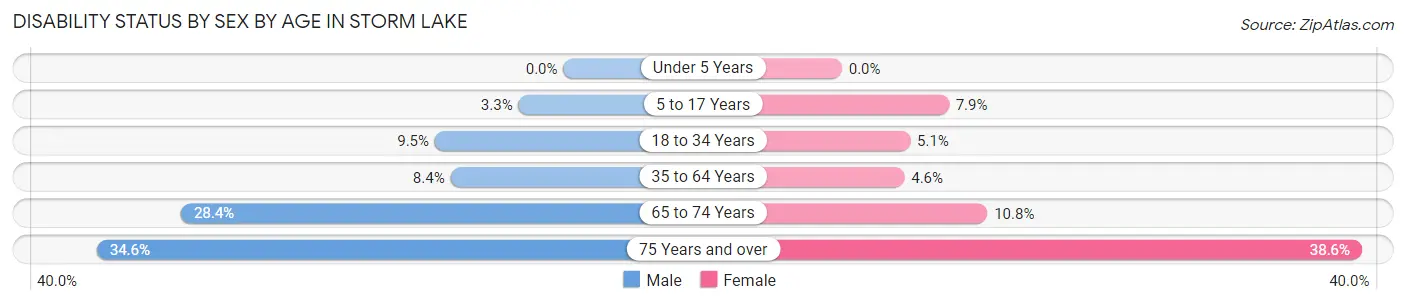
| Age Bracket | Male | Female |
| Under 5 Years | 0 (0.0%) | 0 (0.0%) |
| 5 to 17 Years | 38 (3.3%) | 85 (7.9%) |
| 18 to 34 Years | 154 (9.5%) | 76 (5.1%) |
| 35 to 64 Years | 142 (8.4%) | 83 (4.6%) |
| 65 to 74 Years | 109 (28.4%) | 43 (10.8%) |
| 75 Years and over | 62 (34.6%) | 183 (38.6%) |
Disability Class by Sex by Age in Storm Lake
Disability Class: Hearing Difficulty
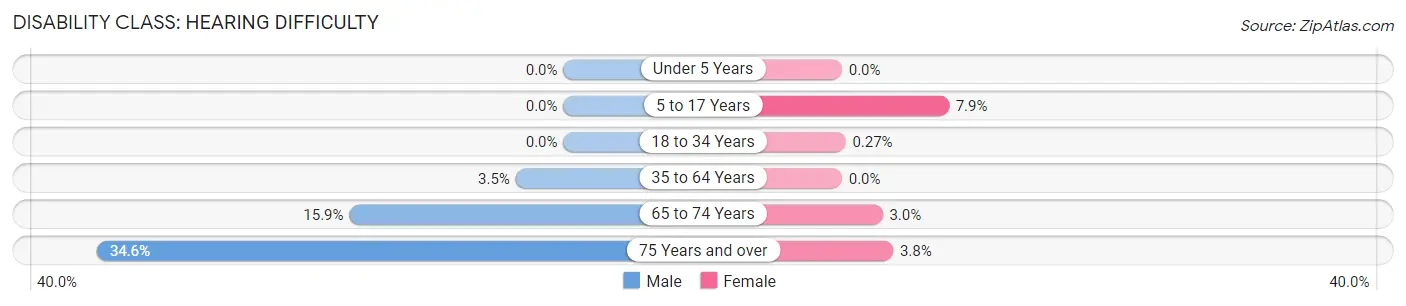
| Age Bracket | Male | Female |
| Under 5 Years | 0 (0.0%) | 0 (0.0%) |
| 5 to 17 Years | 0 (0.0%) | 85 (7.9%) |
| 18 to 34 Years | 0 (0.0%) | 4 (0.3%) |
| 35 to 64 Years | 60 (3.5%) | 0 (0.0%) |
| 65 to 74 Years | 61 (15.9%) | 12 (3.0%) |
| 75 Years and over | 62 (34.6%) | 18 (3.8%) |
Disability Class: Vision Difficulty
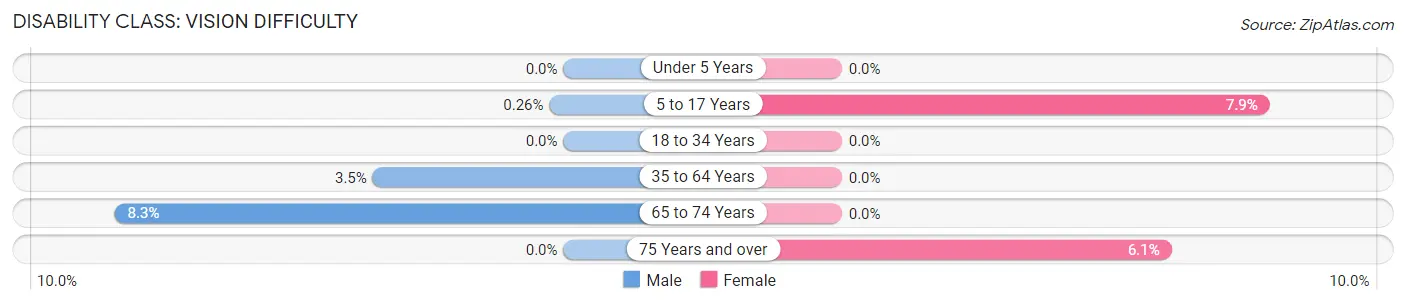
| Age Bracket | Male | Female |
| Under 5 Years | 0 (0.0%) | 0 (0.0%) |
| 5 to 17 Years | 3 (0.3%) | 85 (7.9%) |
| 18 to 34 Years | 0 (0.0%) | 0 (0.0%) |
| 35 to 64 Years | 60 (3.5%) | 0 (0.0%) |
| 65 to 74 Years | 32 (8.3%) | 0 (0.0%) |
| 75 Years and over | 0 (0.0%) | 29 (6.1%) |
Disability Class: Cognitive Difficulty
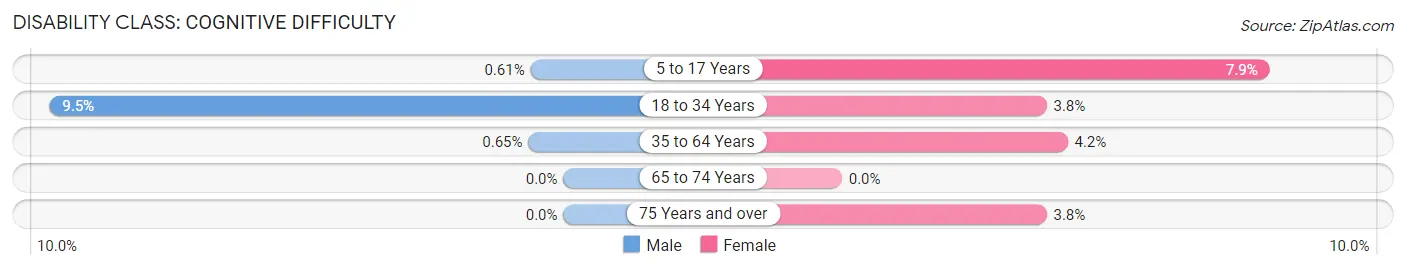
| Age Bracket | Male | Female |
| 5 to 17 Years | 7 (0.6%) | 85 (7.9%) |
| 18 to 34 Years | 154 (9.5%) | 57 (3.8%) |
| 35 to 64 Years | 11 (0.6%) | 75 (4.2%) |
| 65 to 74 Years | 0 (0.0%) | 0 (0.0%) |
| 75 Years and over | 0 (0.0%) | 18 (3.8%) |
Disability Class: Ambulatory Difficulty
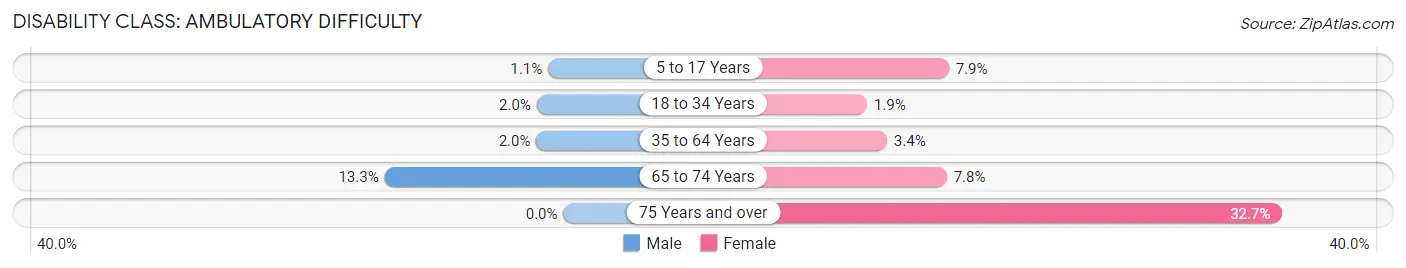
| Age Bracket | Male | Female |
| 5 to 17 Years | 13 (1.1%) | 85 (7.9%) |
| 18 to 34 Years | 32 (2.0%) | 28 (1.9%) |
| 35 to 64 Years | 34 (2.0%) | 60 (3.4%) |
| 65 to 74 Years | 51 (13.3%) | 31 (7.8%) |
| 75 Years and over | 0 (0.0%) | 155 (32.7%) |
Disability Class: Self-Care Difficulty
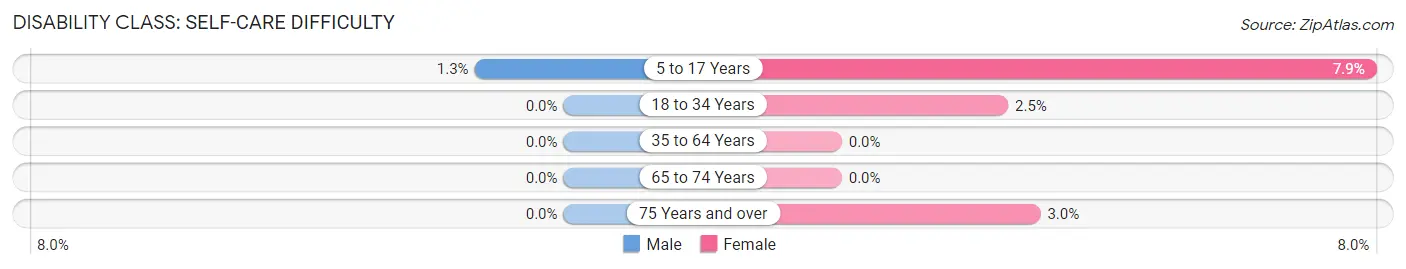
| Age Bracket | Male | Female |
| 5 to 17 Years | 15 (1.3%) | 85 (7.9%) |
| 18 to 34 Years | 0 (0.0%) | 37 (2.5%) |
| 35 to 64 Years | 0 (0.0%) | 0 (0.0%) |
| 65 to 74 Years | 0 (0.0%) | 0 (0.0%) |
| 75 Years and over | 0 (0.0%) | 14 (2.9%) |
Technology Access in Storm Lake
Computing Device Access in Storm Lake
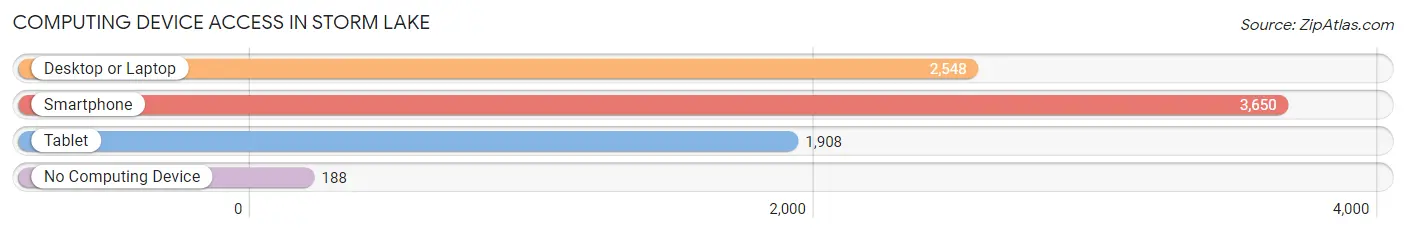
| Device Type | # Households | % Households |
| Desktop or Laptop | 2,548 | 63.8% |
| Smartphone | 3,650 | 91.3% |
| Tablet | 1,908 | 47.7% |
| No Computing Device | 188 | 4.7% |
| Total | 3,996 | 100.0% |
Internet Access in Storm Lake
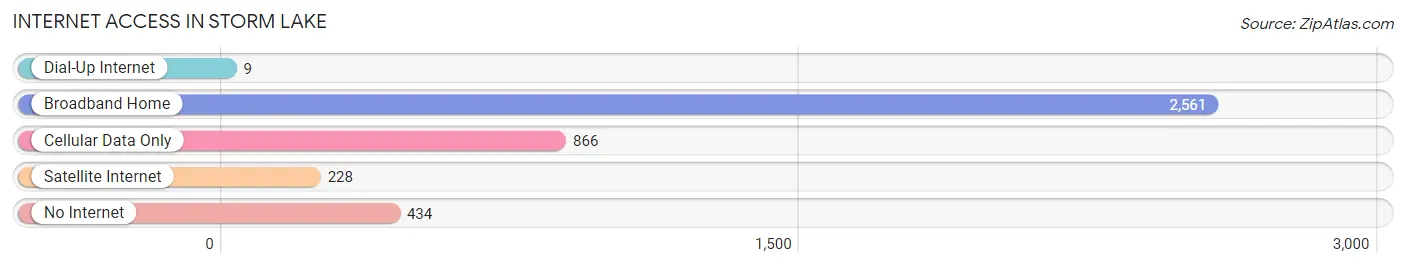
| Internet Type | # Households | % Households |
| Dial-Up Internet | 9 | 0.2% |
| Broadband Home | 2,561 | 64.1% |
| Cellular Data Only | 866 | 21.7% |
| Satellite Internet | 228 | 5.7% |
| No Internet | 434 | 10.9% |
| Total | 3,996 | 100.0% |
Storm Lake Summary
Introduction
Located in the northwest corner of Iowa, the city of Storm Lake is a vibrant and diverse community. With a population of 10,600, Storm Lake is the largest city in Buena Vista County and the second largest city in the state of Iowa. The city is situated on the shores of Storm Lake, a natural lake that was formed by glacial activity thousands of years ago. The city is home to Buena Vista University, a private liberal arts college, and is a popular destination for outdoor recreation.
History
The area that is now Storm Lake was first settled by European immigrants in the mid-1800s. The first settlers were primarily of German and Scandinavian descent, and the city was originally known as “New Vienna”. In 1856, the name was changed to Storm Lake, after a severe thunderstorm that occurred in the area.
The city was officially incorporated in 1868, and the first mayor was elected in 1869. The city quickly grew in size and population, and by the early 1900s, it had become a major agricultural center. The city was also home to several industries, including a flour mill, a brickyard, and a canning factory.
In the late 19th and early 20th centuries, Storm Lake was a popular destination for immigrants from Europe, particularly from Germany and Scandinavia. This influx of immigrants helped to shape the city’s culture and economy.
Geography
Storm Lake is located in the northwest corner of Iowa, in Buena Vista County. The city is situated on the shores of Storm Lake, a natural lake that was formed by glacial activity thousands of years ago. The lake is approximately 4,500 acres in size and is a popular destination for fishing, boating, and other outdoor activities.
The city is located in the Loess Hills region of Iowa, which is characterized by rolling hills and fertile soil. The city is surrounded by farmland, and the area is known for its production of corn, soybeans, and other crops.
Economy
Storm Lake’s economy is largely based on agriculture and manufacturing. The city is home to several large agricultural companies, including Tyson Foods, Cargill, and Land O’Lakes. The city is also home to several manufacturing companies, including Storm Lake Machine Works and Storm Lake Tool & Die.
The city is also home to Buena Vista University, a private liberal arts college. The university is a major employer in the city and provides a variety of educational and cultural opportunities for the community.
Demographics
As of the 2010 census, Storm Lake had a population of 10,600. The city is racially and ethnically diverse, with a population that is approximately 60% white, 20% Hispanic, and 10% Asian. The city also has a large immigrant population, with approximately 20% of the population being foreign-born.
Conclusion
Storm Lake is a vibrant and diverse city located in the northwest corner of Iowa. The city is home to a variety of industries, including agriculture, manufacturing, and education. The city is also home to a diverse population, with a large immigrant population and a variety of racial and ethnic backgrounds. Storm Lake is a popular destination for outdoor recreation, and is a great place to live, work, and play.
Common Questions
What is Per Capita Income in Storm Lake?
Per Capita income in Storm Lake is $28,834.
What is the Median Family Income in Storm Lake?
Median Family Income in Storm Lake is $82,716.
What is the Median Household income in Storm Lake?
Median Household Income in Storm Lake is $54,615.
What is Income or Wage Gap in Storm Lake?
Income or Wage Gap in Storm Lake is 20.6%.
Women in Storm Lake earn 79.4 cents for every dollar earned by a man.
What is Inequality or Gini Index in Storm Lake?
Inequality or Gini Index in Storm Lake is 0.42.
What is the Total Population of Storm Lake?
Total Population of Storm Lake is 11,194.
What is the Total Male Population of Storm Lake?
Total Male Population of Storm Lake is 5,585.
What is the Total Female Population of Storm Lake?
Total Female Population of Storm Lake is 5,609.
What is the Ratio of Males per 100 Females in Storm Lake?
There are 99.57 Males per 100 Females in Storm Lake.
What is the Ratio of Females per 100 Males in Storm Lake?
There are 100.43 Females per 100 Males in Storm Lake.
What is the Median Population Age in Storm Lake?
Median Population Age in Storm Lake is 31.0 Years.
What is the Average Family Size in Storm Lake
Average Family Size in Storm Lake is 3.8 People.
What is the Average Household Size in Storm Lake
Average Household Size in Storm Lake is 2.6 People.
How Large is the Labor Force in Storm Lake?
There are 5,857 People in the Labor Forcein in Storm Lake.
What is the Percentage of People in the Labor Force in Storm Lake?
68.5% of People are in the Labor Force in Storm Lake.
What is the Unemployment Rate in Storm Lake?
Unemployment Rate in Storm Lake is 4.1%.