Wisconsin Rapids, WI Map & Demographics
Wisconsin Rapids Map
Wisconsin Rapids Overview
$29,141
PER CAPITA INCOME
$65,271
AVG FAMILY INCOME
$51,186
AVG HOUSEHOLD INCOME
41.6%
WAGE / INCOME GAP [ % ]
58.4¢/ $1
WAGE / INCOME GAP [ $ ]
0.40
INEQUALITY / GINI INDEX
18,783
TOTAL POPULATION
8,511
MALE POPULATION
10,272
FEMALE POPULATION
82.86
MALES / 100 FEMALES
120.69
FEMALES / 100 MALES
38.3
MEDIAN AGE
2.9
AVG FAMILY SIZE
2.1
AVG HOUSEHOLD SIZE
9,494
LABOR FORCE [ PEOPLE ]
63.2%
PERCENT IN LABOR FORCE
6.4%
UNEMPLOYMENT RATE
Wisconsin Rapids Area Codes
Income in Wisconsin Rapids
Income Overview in Wisconsin Rapids
Per Capita Income in Wisconsin Rapids is $29,141, while median incomes of families and households are $65,271 and $51,186 respectively.
| Characteristic | Number | Measure |
| Per Capita Income | 18,783 | $29,141 |
| Median Family Income | 4,487 | $65,271 |
| Mean Family Income | 4,487 | $75,312 |
| Median Household Income | 8,527 | $51,186 |
| Mean Household Income | 8,527 | $63,427 |
| Income Deficit | 4,487 | $0 |
| Wage / Income Gap (%) | 18,783 | 41.57% |
| Wage / Income Gap ($) | 18,783 | 58.43¢ per $1 |
| Gini / Inequality Index | 18,783 | 0.40 |
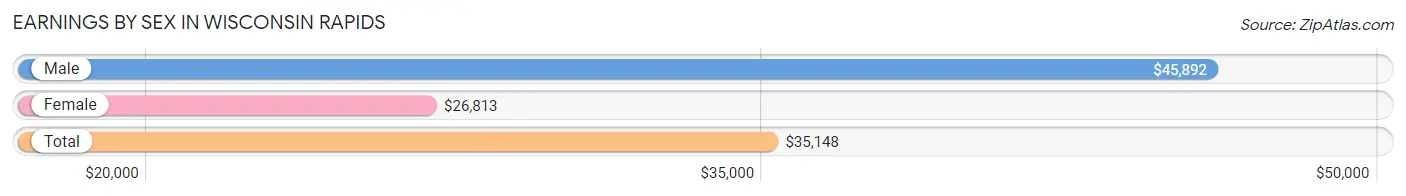
Earnings by Sex in Wisconsin Rapids
Average Earnings in Wisconsin Rapids are $35,148, $45,892 for men and $26,813 for women, a difference of 41.6%.
| Sex | Number | Average Earnings |
| Male | 4,560 (46.1%) | $45,892 |
| Female | 5,342 (53.9%) | $26,813 |
| Total | 9,902 (100.0%) | $35,148 |
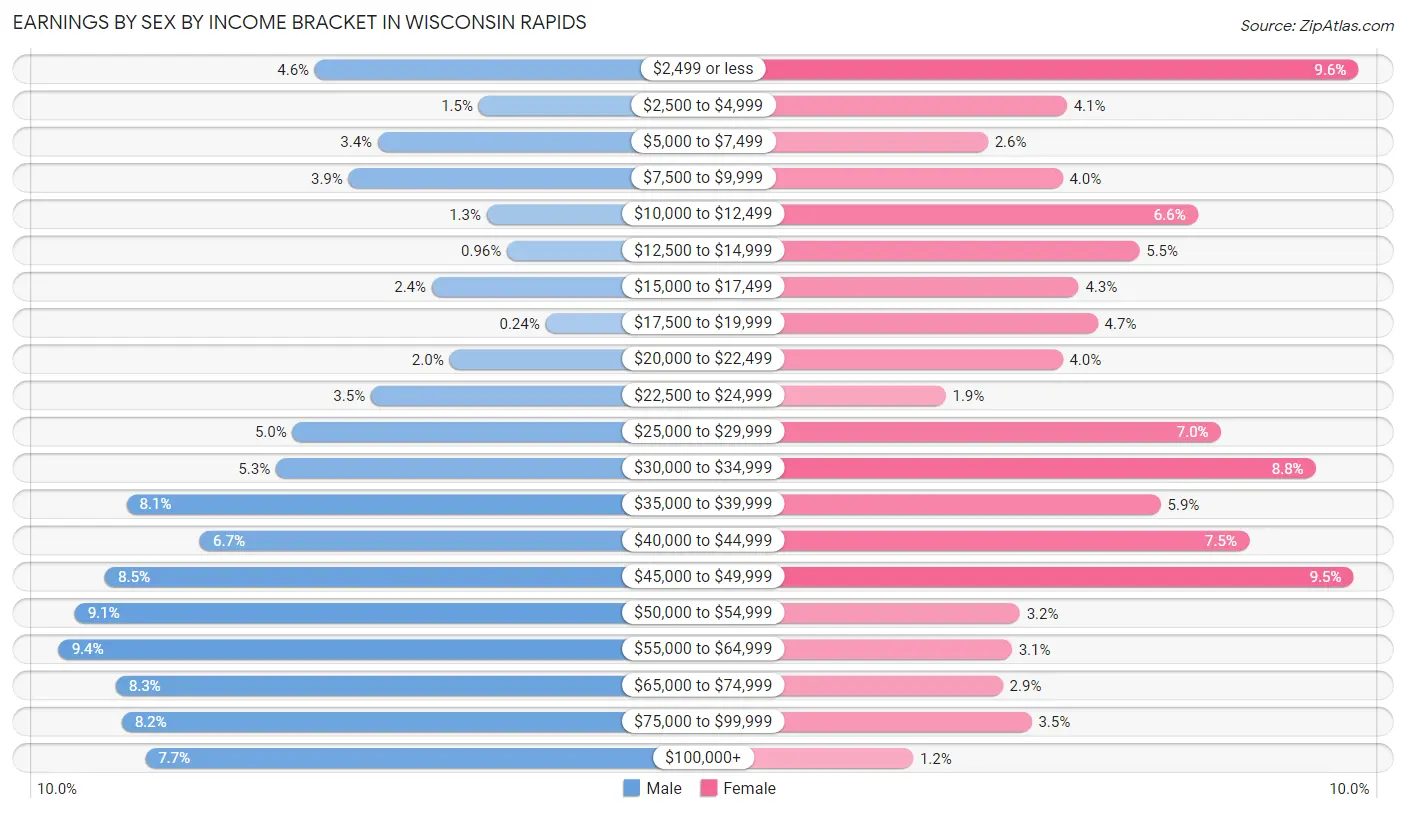
Earnings by Sex by Income Bracket in Wisconsin Rapids
The most common earnings brackets in Wisconsin Rapids are $55,000 to $64,999 for men (427 | 9.4%) and $2,499 or less for women (512 | 9.6%).
| Income | Male | Female |
| $2,499 or less | 208 (4.6%) | 512 (9.6%) |
| $2,500 to $4,999 | 68 (1.5%) | 220 (4.1%) |
| $5,000 to $7,499 | 154 (3.4%) | 141 (2.6%) |
| $7,500 to $9,999 | 179 (3.9%) | 216 (4.0%) |
| $10,000 to $12,499 | 61 (1.3%) | 351 (6.6%) |
| $12,500 to $14,999 | 44 (1.0%) | 293 (5.5%) |
| $15,000 to $17,499 | 108 (2.4%) | 232 (4.3%) |
| $17,500 to $19,999 | 11 (0.2%) | 251 (4.7%) |
| $20,000 to $22,499 | 93 (2.0%) | 216 (4.0%) |
| $22,500 to $24,999 | 160 (3.5%) | 99 (1.8%) |
| $25,000 to $29,999 | 227 (5.0%) | 374 (7.0%) |
| $30,000 to $34,999 | 241 (5.3%) | 469 (8.8%) |
| $35,000 to $39,999 | 369 (8.1%) | 314 (5.9%) |
| $40,000 to $44,999 | 306 (6.7%) | 402 (7.5%) |
| $45,000 to $49,999 | 387 (8.5%) | 507 (9.5%) |
| $50,000 to $54,999 | 413 (9.1%) | 173 (3.2%) |
| $55,000 to $64,999 | 427 (9.4%) | 165 (3.1%) |
| $65,000 to $74,999 | 378 (8.3%) | 156 (2.9%) |
| $75,000 to $99,999 | 373 (8.2%) | 185 (3.5%) |
| $100,000+ | 353 (7.7%) | 66 (1.2%) |
| Total | 4,560 (100.0%) | 5,342 (100.0%) |
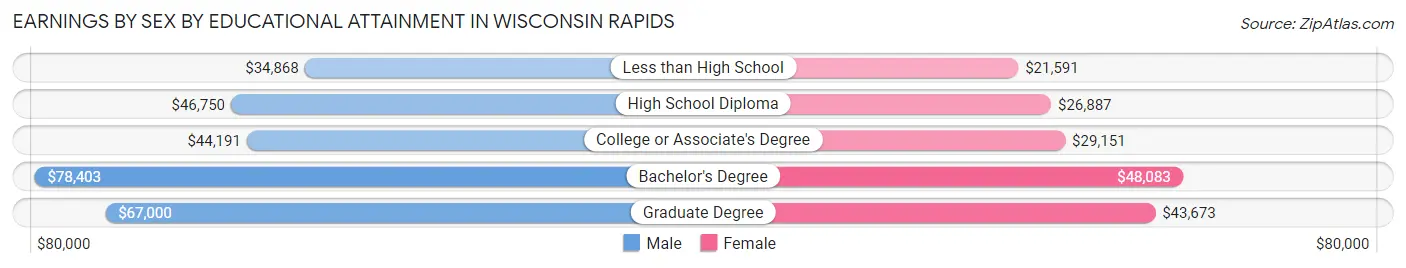
Earnings by Sex by Educational Attainment in Wisconsin Rapids
Average earnings in Wisconsin Rapids are $47,060 for men and $30,562 for women, a difference of 35.1%. Men with an educational attainment of bachelor's degree enjoy the highest average annual earnings of $78,403, while those with less than high school education earn the least with $34,868. Women with an educational attainment of bachelor's degree earn the most with the average annual earnings of $48,083, while those with less than high school education have the smallest earnings of $21,591.
| Educational Attainment | Male Income | Female Income |
| Less than High School | $34,868 | $21,591 |
| High School Diploma | $46,750 | $26,887 |
| College or Associate's Degree | $44,191 | $29,151 |
| Bachelor's Degree | $78,403 | $48,083 |
| Graduate Degree | $67,000 | $43,673 |
| Total | $47,060 | $30,562 |
Family Income in Wisconsin Rapids
Family Income Brackets in Wisconsin Rapids
According to the Wisconsin Rapids family income data, there are 1,153 families falling into the $50,000 to $74,999 income range, which is the most common income bracket and makes up 25.7% of all families. Conversely, the $10,000 to $14,999 income bracket is the least frequent group with only 18 families (0.4%) belonging to this category.
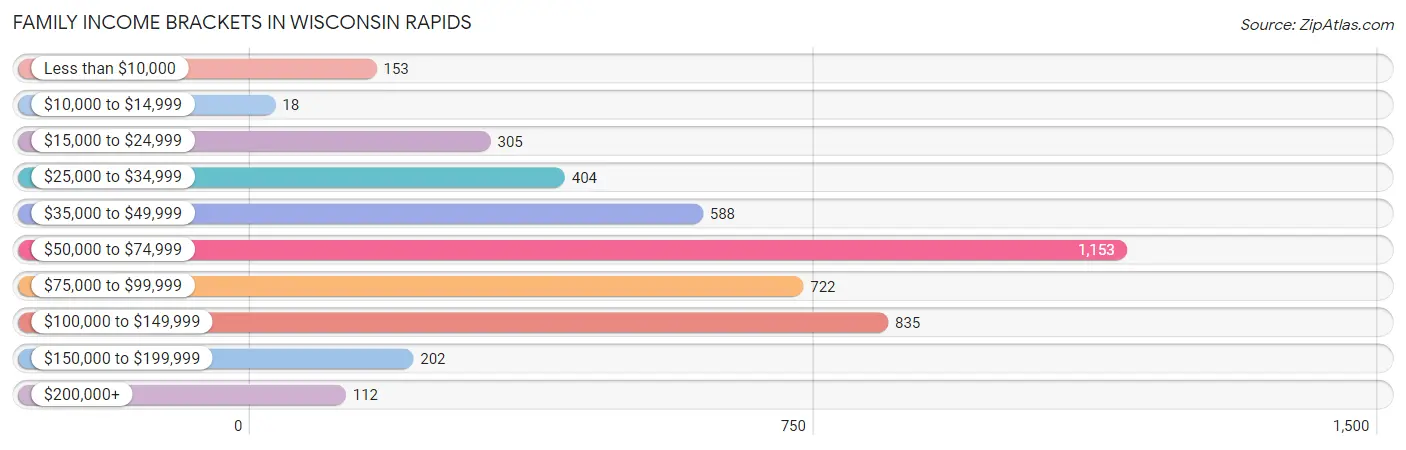
| Income Bracket | # Families | % Families |
| Less than $10,000 | 153 | 3.4% |
| $10,000 to $14,999 | 18 | 0.4% |
| $15,000 to $24,999 | 305 | 6.8% |
| $25,000 to $34,999 | 404 | 9.0% |
| $35,000 to $49,999 | 588 | 13.1% |
| $50,000 to $74,999 | 1,153 | 25.7% |
| $75,000 to $99,999 | 722 | 16.1% |
| $100,000 to $149,999 | 835 | 18.6% |
| $150,000 to $199,999 | 202 | 4.5% |
| $200,000+ | 112 | 2.5% |
Family Income by Famaliy Size in Wisconsin Rapids
6-person families (212 | 4.7%) account for the highest median family income in Wisconsin Rapids with $109,537 per family, while 2-person families (2,629 | 58.6%) have the highest median income of $31,430 per family member.
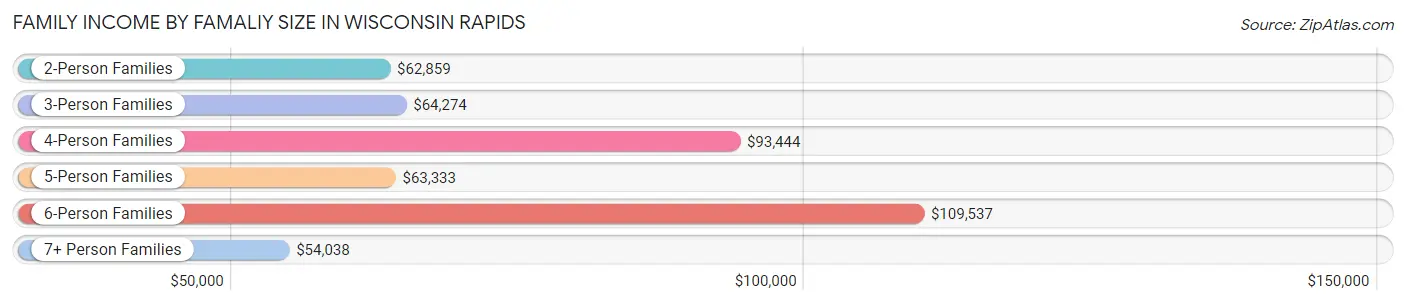
| Income Bracket | # Families | Median Income |
| 2-Person Families | 2,629 (58.6%) | $62,859 |
| 3-Person Families | 630 (14.0%) | $64,274 |
| 4-Person Families | 598 (13.3%) | $93,444 |
| 5-Person Families | 338 (7.5%) | $63,333 |
| 6-Person Families | 212 (4.7%) | $109,537 |
| 7+ Person Families | 80 (1.8%) | $54,038 |
| Total | 4,487 (100.0%) | $65,271 |
Family Income by Number of Earners in Wisconsin Rapids
The median family income in Wisconsin Rapids is $65,271, with families comprising 3+ earners (421) having the highest median family income of $110,518, while families with 1 earner (1,473) have the lowest median family income of $39,701, accounting for 9.4% and 32.8% of families, respectively.
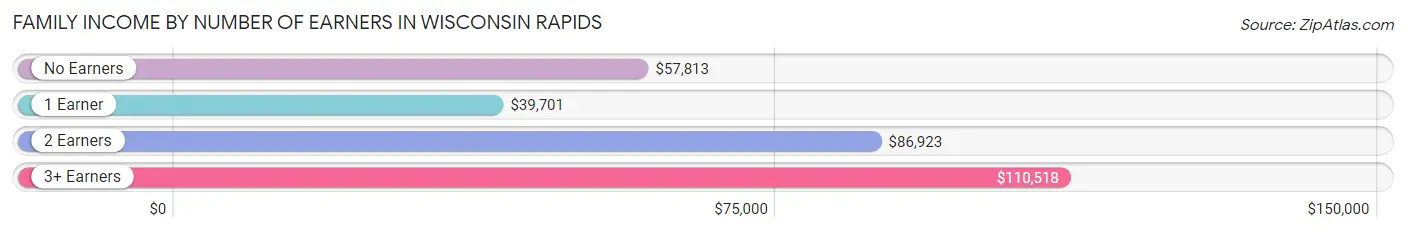
| Number of Earners | # Families | Median Income |
| No Earners | 889 (19.8%) | $57,813 |
| 1 Earner | 1,473 (32.8%) | $39,701 |
| 2 Earners | 1,704 (38.0%) | $86,923 |
| 3+ Earners | 421 (9.4%) | $110,518 |
| Total | 4,487 (100.0%) | $65,271 |
Household Income in Wisconsin Rapids
Household Income Brackets in Wisconsin Rapids
With 1,927 households falling in the category, the $50,000 to $74,999 income range is the most frequent in Wisconsin Rapids, accounting for 22.6% of all households. In contrast, only 188 households (2.2%) fall into the $200,000+ income bracket, making it the least populous group.
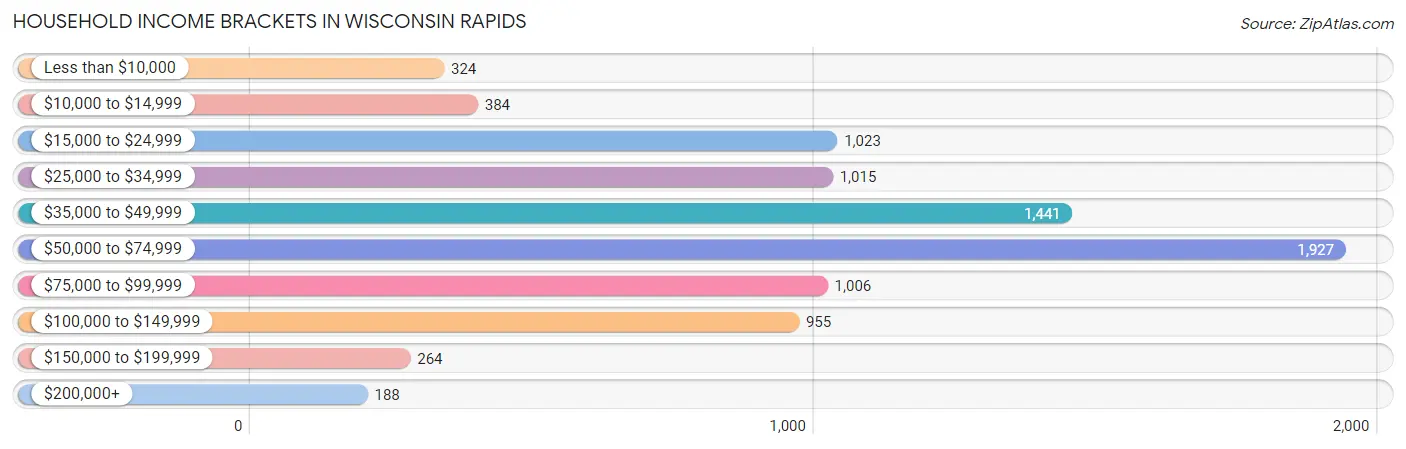
| Income Bracket | # Households | % Households |
| Less than $10,000 | 324 | 3.8% |
| $10,000 to $14,999 | 384 | 4.5% |
| $15,000 to $24,999 | 1,023 | 12.0% |
| $25,000 to $34,999 | 1,015 | 11.9% |
| $35,000 to $49,999 | 1,441 | 16.9% |
| $50,000 to $74,999 | 1,927 | 22.6% |
| $75,000 to $99,999 | 1,006 | 11.8% |
| $100,000 to $149,999 | 955 | 11.2% |
| $150,000 to $199,999 | 264 | 3.1% |
| $200,000+ | 188 | 2.2% |
Household Income by Householder Age in Wisconsin Rapids
The median household income in Wisconsin Rapids is $51,186, with the highest median household income of $61,082 found in the 45 to 64 years age bracket for the primary householder. A total of 2,762 households (32.4%) fall into this category. Meanwhile, the 65+ years age bracket for the primary householder has the lowest median household income of $39,836, with 2,790 households (32.7%) in this group.
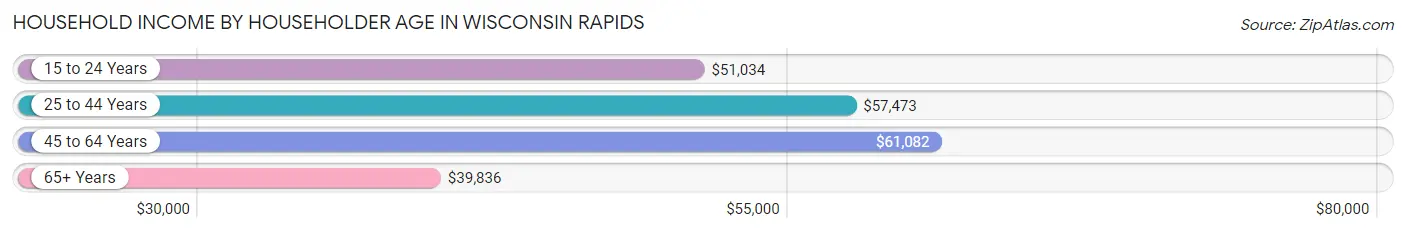
| Income Bracket | # Households | Median Income |
| 15 to 24 Years | 586 (6.9%) | $51,034 |
| 25 to 44 Years | 2,389 (28.0%) | $57,473 |
| 45 to 64 Years | 2,762 (32.4%) | $61,082 |
| 65+ Years | 2,790 (32.7%) | $39,836 |
| Total | 8,527 (100.0%) | $51,186 |
Poverty in Wisconsin Rapids
Income Below Poverty by Sex and Age in Wisconsin Rapids
With 10.9% poverty level for males and 17.1% for females among the residents of Wisconsin Rapids, 5 year old males and 18 to 24 year old females are the most vulnerable to poverty, with 48 males (45.3%) and 291 females (29.6%) in their respective age groups living below the poverty level.
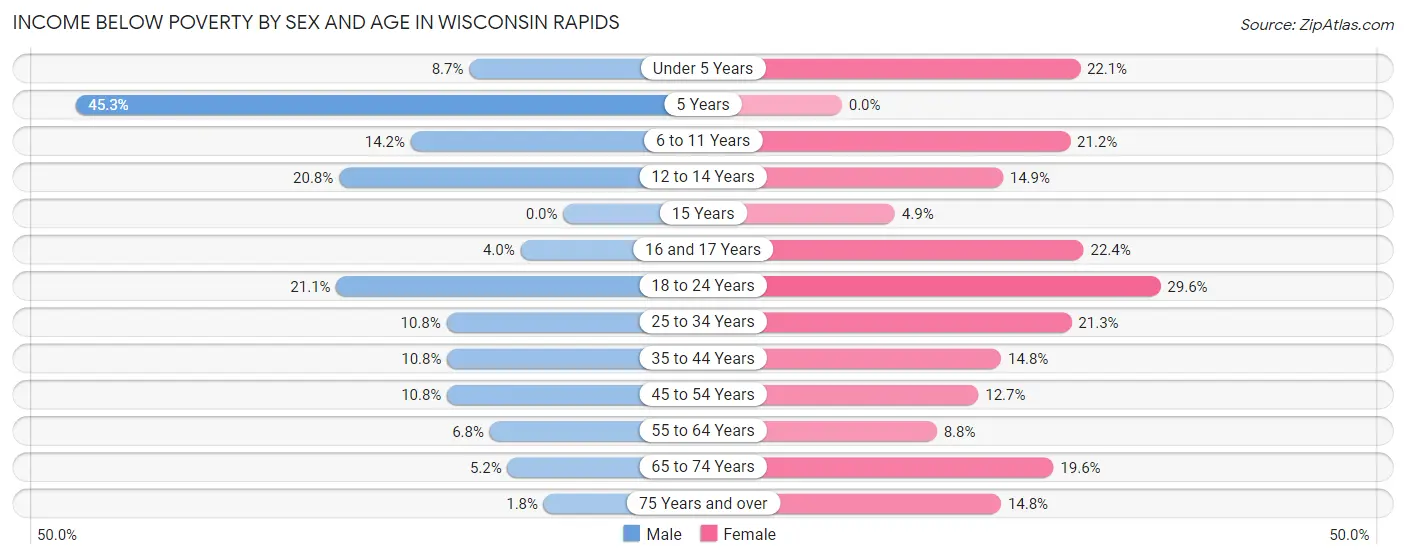
| Age Bracket | Male | Female |
| Under 5 Years | 37 (8.7%) | 116 (22.1%) |
| 5 Years | 48 (45.3%) | 0 (0.0%) |
| 6 to 11 Years | 115 (14.1%) | 125 (21.2%) |
| 12 to 14 Years | 82 (20.8%) | 69 (14.9%) |
| 15 Years | 0 (0.0%) | 10 (4.9%) |
| 16 and 17 Years | 11 (4.0%) | 35 (22.4%) |
| 18 to 24 Years | 159 (21.1%) | 291 (29.6%) |
| 25 to 34 Years | 123 (10.8%) | 297 (21.3%) |
| 35 to 44 Years | 124 (10.8%) | 137 (14.8%) |
| 45 to 54 Years | 93 (10.8%) | 151 (12.7%) |
| 55 to 64 Years | 74 (6.8%) | 112 (8.8%) |
| 65 to 74 Years | 35 (5.2%) | 219 (19.6%) |
| 75 Years and over | 12 (1.8%) | 169 (14.8%) |
| Total | 913 (10.9%) | 1,731 (17.1%) |
Income Above Poverty by Sex and Age in Wisconsin Rapids
According to the poverty statistics in Wisconsin Rapids, males aged 15 years and females aged 5 years are the age groups that are most secure financially, with 100.0% of males and 100.0% of females in these age groups living above the poverty line.
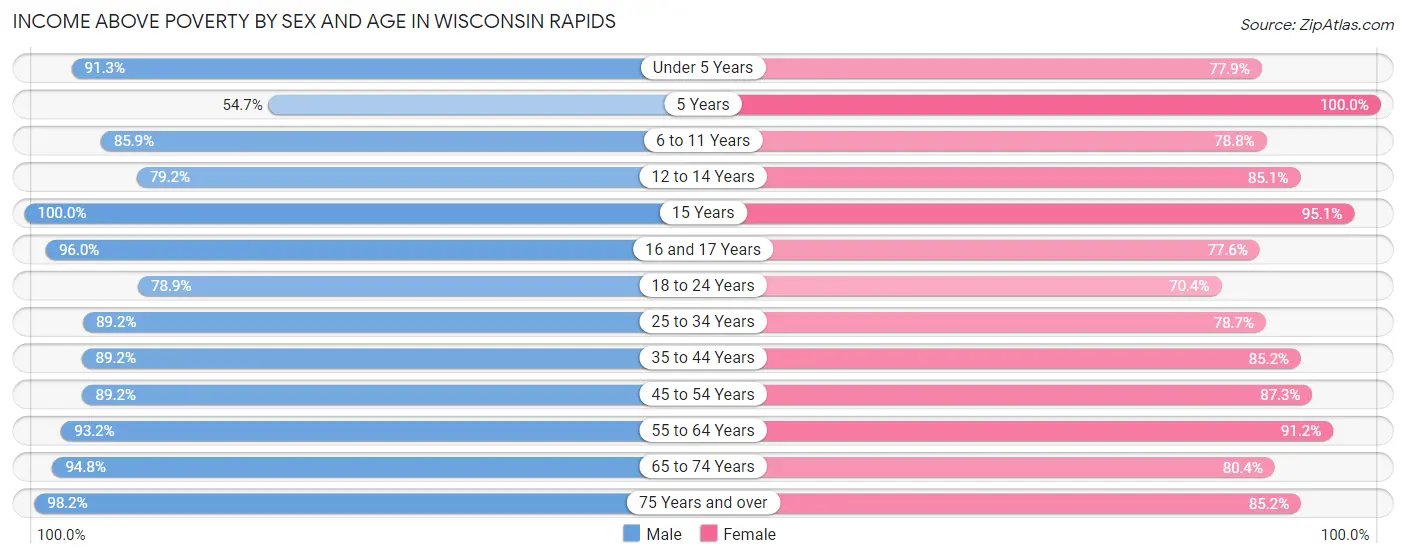
| Age Bracket | Male | Female |
| Under 5 Years | 387 (91.3%) | 409 (77.9%) |
| 5 Years | 58 (54.7%) | 178 (100.0%) |
| 6 to 11 Years | 698 (85.9%) | 465 (78.8%) |
| 12 to 14 Years | 312 (79.2%) | 393 (85.1%) |
| 15 Years | 28 (100.0%) | 193 (95.1%) |
| 16 and 17 Years | 266 (96.0%) | 121 (77.6%) |
| 18 to 24 Years | 596 (78.9%) | 693 (70.4%) |
| 25 to 34 Years | 1,012 (89.2%) | 1,097 (78.7%) |
| 35 to 44 Years | 1,027 (89.2%) | 789 (85.2%) |
| 45 to 54 Years | 770 (89.2%) | 1,041 (87.3%) |
| 55 to 64 Years | 1,010 (93.2%) | 1,160 (91.2%) |
| 65 to 74 Years | 641 (94.8%) | 896 (80.4%) |
| 75 Years and over | 651 (98.2%) | 975 (85.2%) |
| Total | 7,456 (89.1%) | 8,410 (82.9%) |
Income Below Poverty Among Married-Couple Families in Wisconsin Rapids
The poverty statistics for married-couple families in Wisconsin Rapids show that 1.5% or 44 of the total 2,910 families live below the poverty line. Families with 5 or more children have the highest poverty rate of 34.8%, comprising of 16 families. On the other hand, families with no children have the lowest poverty rate of 0.1%, which includes 2 families.
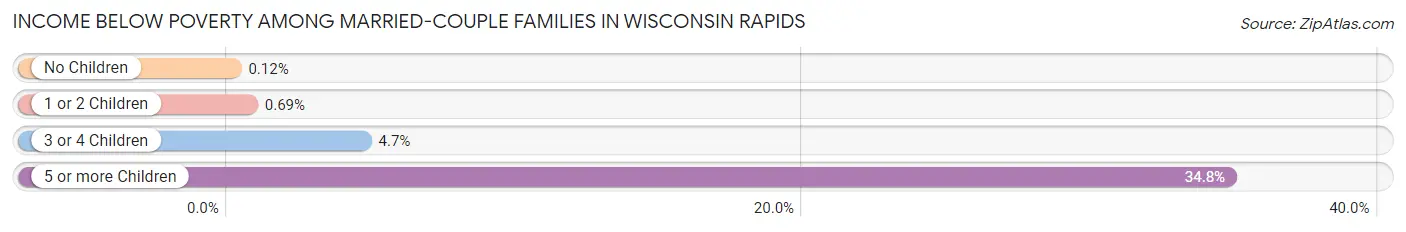
| Children | Above Poverty | Below Poverty |
| No Children | 1,683 (99.9%) | 2 (0.1%) |
| 1 or 2 Children | 722 (99.3%) | 5 (0.7%) |
| 3 or 4 Children | 431 (95.4%) | 21 (4.6%) |
| 5 or more Children | 30 (65.2%) | 16 (34.8%) |
| Total | 2,866 (98.5%) | 44 (1.5%) |
Income Below Poverty Among Single-Parent Households in Wisconsin Rapids
According to the poverty data in Wisconsin Rapids, 5.5% or 25 single-father households and 30.0% or 336 single-mother households are living below the poverty line. Among single-father households, those with 1 or 2 children have the highest poverty rate, with 21 households (9.5%) experiencing poverty. Likewise, among single-mother households, those with 5 or more children have the highest poverty rate, with 8 households (100.0%) falling below the poverty line.
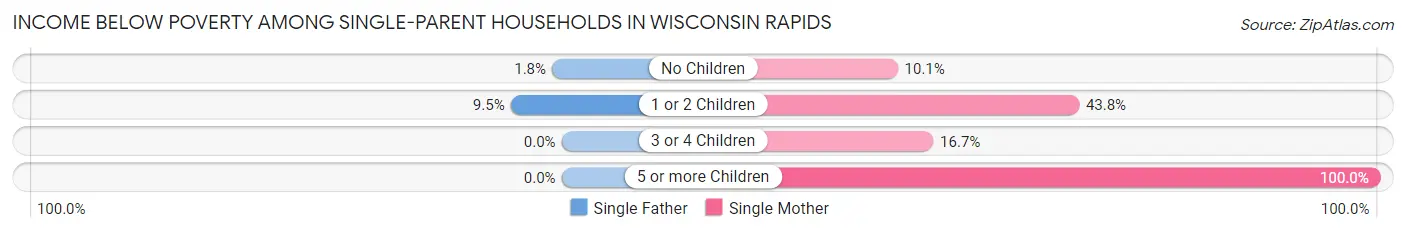
| Children | Single Father | Single Mother |
| No Children | 4 (1.8%) | 40 (10.1%) |
| 1 or 2 Children | 21 (9.5%) | 273 (43.8%) |
| 3 or 4 Children | 0 (0.0%) | 15 (16.7%) |
| 5 or more Children | 0 (0.0%) | 8 (100.0%) |
| Total | 25 (5.5%) | 336 (30.0%) |
Income Below Poverty Among Married-Couple vs Single-Parent Households in Wisconsin Rapids
The poverty data for Wisconsin Rapids shows that 44 of the married-couple family households (1.5%) and 361 of the single-parent households (22.9%) are living below the poverty level. Within the married-couple family households, those with 5 or more children have the highest poverty rate, with 16 households (34.8%) falling below the poverty line. Among the single-parent households, those with 5 or more children have the highest poverty rate, with 8 household (100.0%) living below poverty.
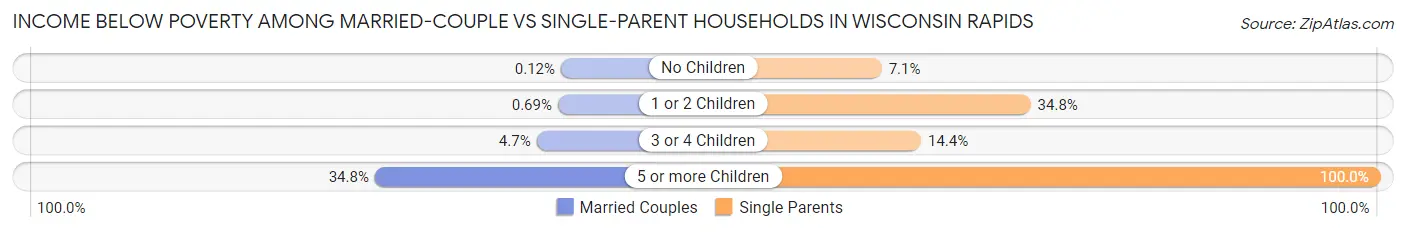
| Children | Married-Couple Families | Single-Parent Households |
| No Children | 2 (0.1%) | 44 (7.1%) |
| 1 or 2 Children | 5 (0.7%) | 294 (34.8%) |
| 3 or 4 Children | 21 (4.6%) | 15 (14.4%) |
| 5 or more Children | 16 (34.8%) | 8 (100.0%) |
| Total | 44 (1.5%) | 361 (22.9%) |
Race in Wisconsin Rapids
The most populous races in Wisconsin Rapids are White / Caucasian (16,790 | 89.4%), Hispanic or Latino (761 | 4.1%), and Asian (738 | 3.9%).
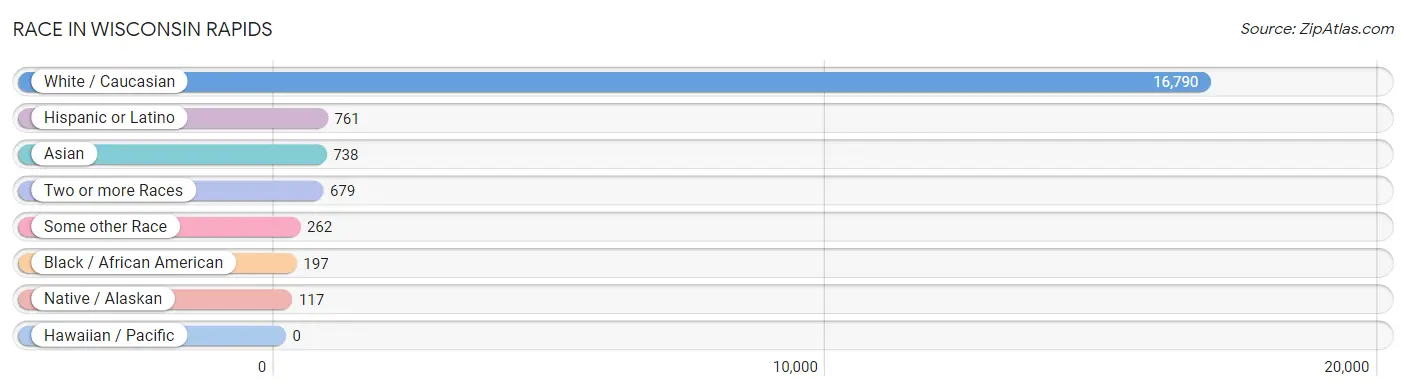
| Race | # Population | % Population |
| Asian | 738 | 3.9% |
| Black / African American | 197 | 1.1% |
| Hawaiian / Pacific | 0 | 0.0% |
| Hispanic or Latino | 761 | 4.1% |
| Native / Alaskan | 117 | 0.6% |
| White / Caucasian | 16,790 | 89.4% |
| Two or more Races | 679 | 3.6% |
| Some other Race | 262 | 1.4% |
| Total | 18,783 | 100.0% |
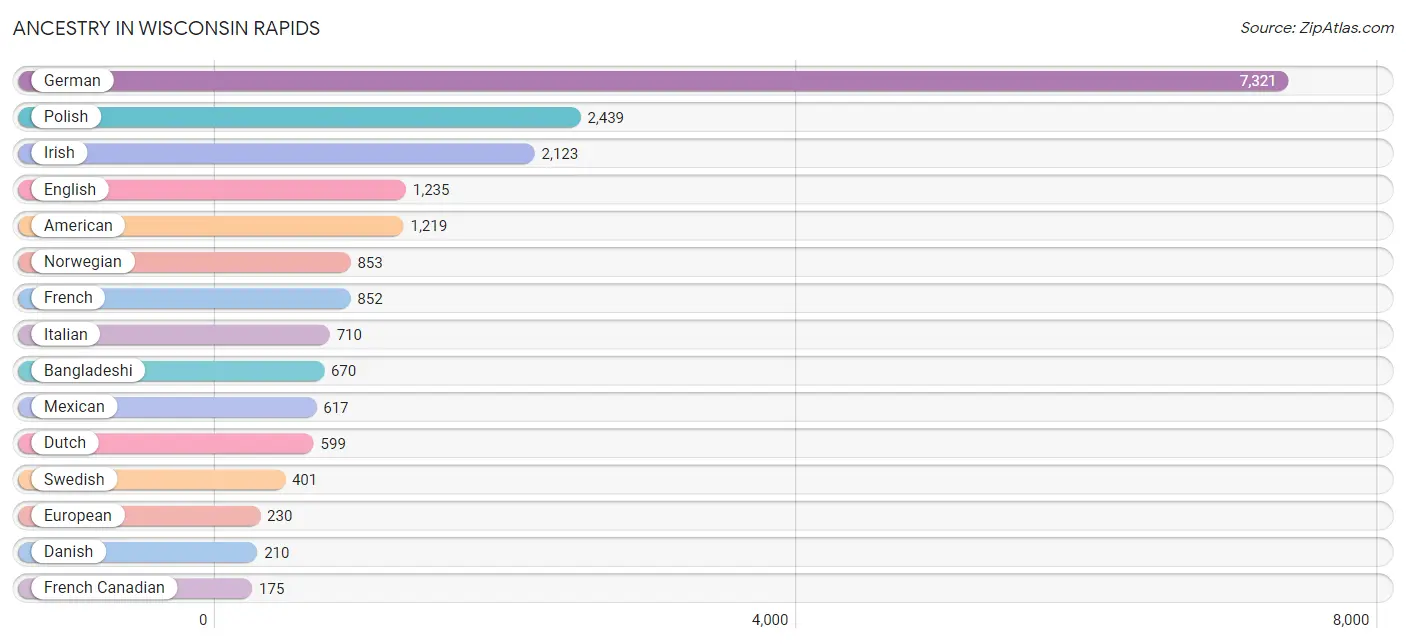
Ancestry in Wisconsin Rapids
The most populous ancestries reported in Wisconsin Rapids are German (7,321 | 39.0%), Polish (2,439 | 13.0%), Irish (2,123 | 11.3%), English (1,235 | 6.6%), and American (1,219 | 6.5%), together accounting for 76.3% of all Wisconsin Rapids residents.
| Ancestry | # Population | % Population |
| African | 12 | 0.1% |
| American | 1,219 | 6.5% |
| Arab | 51 | 0.3% |
| Austrian | 3 | 0.0% |
| Bangladeshi | 670 | 3.6% |
| Belgian | 49 | 0.3% |
| British | 117 | 0.6% |
| Canadian | 27 | 0.1% |
| Chippewa | 86 | 0.5% |
| Czech | 155 | 0.8% |
| Czechoslovakian | 9 | 0.1% |
| Danish | 210 | 1.1% |
| Dutch | 599 | 3.2% |
| English | 1,235 | 6.6% |
| European | 230 | 1.2% |
| Finnish | 37 | 0.2% |
| French | 852 | 4.5% |
| French Canadian | 175 | 0.9% |
| German | 7,321 | 39.0% |
| Greek | 28 | 0.2% |
| Haitian | 12 | 0.1% |
| Irish | 2,123 | 11.3% |
| Iroquois | 26 | 0.1% |
| Italian | 710 | 3.8% |
| Jamaican | 19 | 0.1% |
| Kiowa | 3 | 0.0% |
| Korean | 130 | 0.7% |
| Lebanese | 51 | 0.3% |
| Lithuanian | 18 | 0.1% |
| Menominee | 39 | 0.2% |
| Mexican | 617 | 3.3% |
| Mexican American Indian | 13 | 0.1% |
| Northern European | 32 | 0.2% |
| Norwegian | 853 | 4.5% |
| Polish | 2,439 | 13.0% |
| Portuguese | 3 | 0.0% |
| Puerto Rican | 91 | 0.5% |
| Romanian | 44 | 0.2% |
| Russian | 9 | 0.1% |
| Scandinavian | 34 | 0.2% |
| Scotch-Irish | 10 | 0.1% |
| Scottish | 16 | 0.1% |
| Sioux | 3 | 0.0% |
| South American | 23 | 0.1% |
| Subsaharan African | 12 | 0.1% |
| Swedish | 401 | 2.1% |
| Swiss | 47 | 0.3% |
| Thai | 48 | 0.3% |
| Ukrainian | 7 | 0.0% |
| Venezuelan | 23 | 0.1% |
| Welsh | 16 | 0.1% | View All 51 Rows |
Immigrants in Wisconsin Rapids
The most numerous immigrant groups reported in Wisconsin Rapids came from Asia (242 | 1.3%), South Eastern Asia (223 | 1.2%), Laos (119 | 0.6%), Thailand (70 | 0.4%), and Central America (50 | 0.3%), together accounting for 3.8% of all Wisconsin Rapids residents.
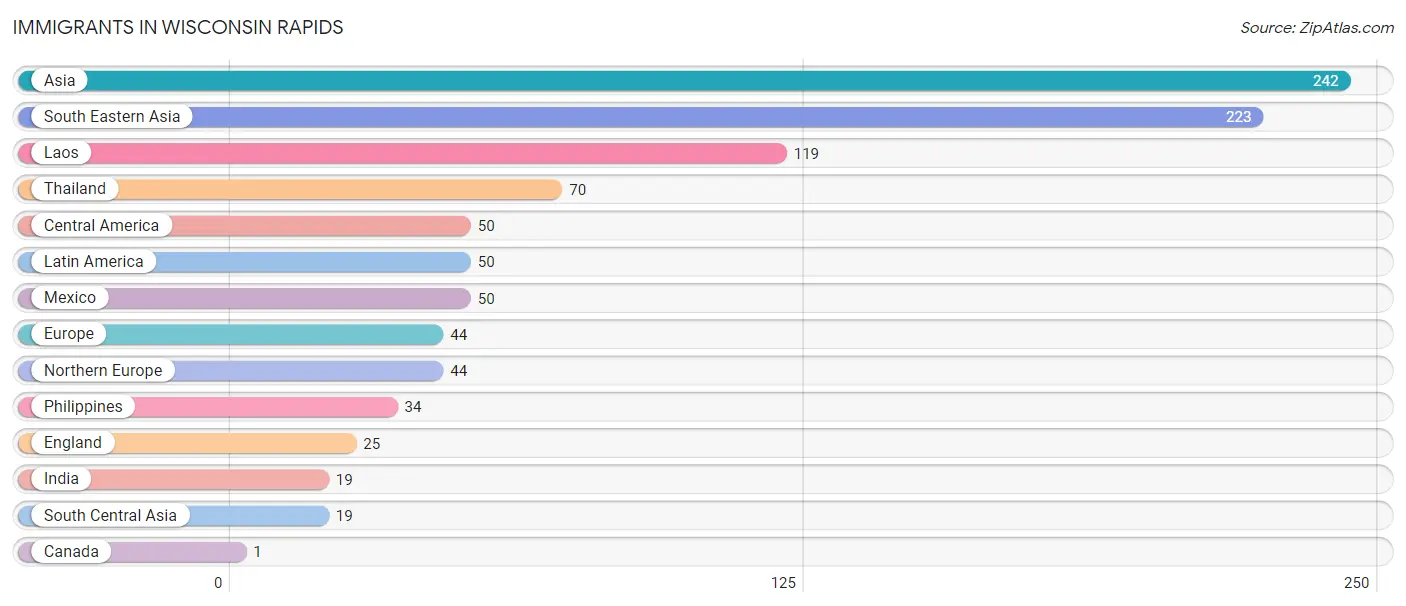
| Immigration Origin | # Population | % Population |
| Asia | 242 | 1.3% |
| Canada | 1 | 0.0% |
| Central America | 50 | 0.3% |
| England | 25 | 0.1% |
| Europe | 44 | 0.2% |
| India | 19 | 0.1% |
| Laos | 119 | 0.6% |
| Latin America | 50 | 0.3% |
| Mexico | 50 | 0.3% |
| Northern Europe | 44 | 0.2% |
| Philippines | 34 | 0.2% |
| South Central Asia | 19 | 0.1% |
| South Eastern Asia | 223 | 1.2% |
| Thailand | 70 | 0.4% | View All 14 Rows |
Sex and Age in Wisconsin Rapids
Sex and Age in Wisconsin Rapids
The most populous age groups in Wisconsin Rapids are 10 to 14 Years (742 | 8.7%) for men and 25 to 29 Years (802 | 7.8%) for women.
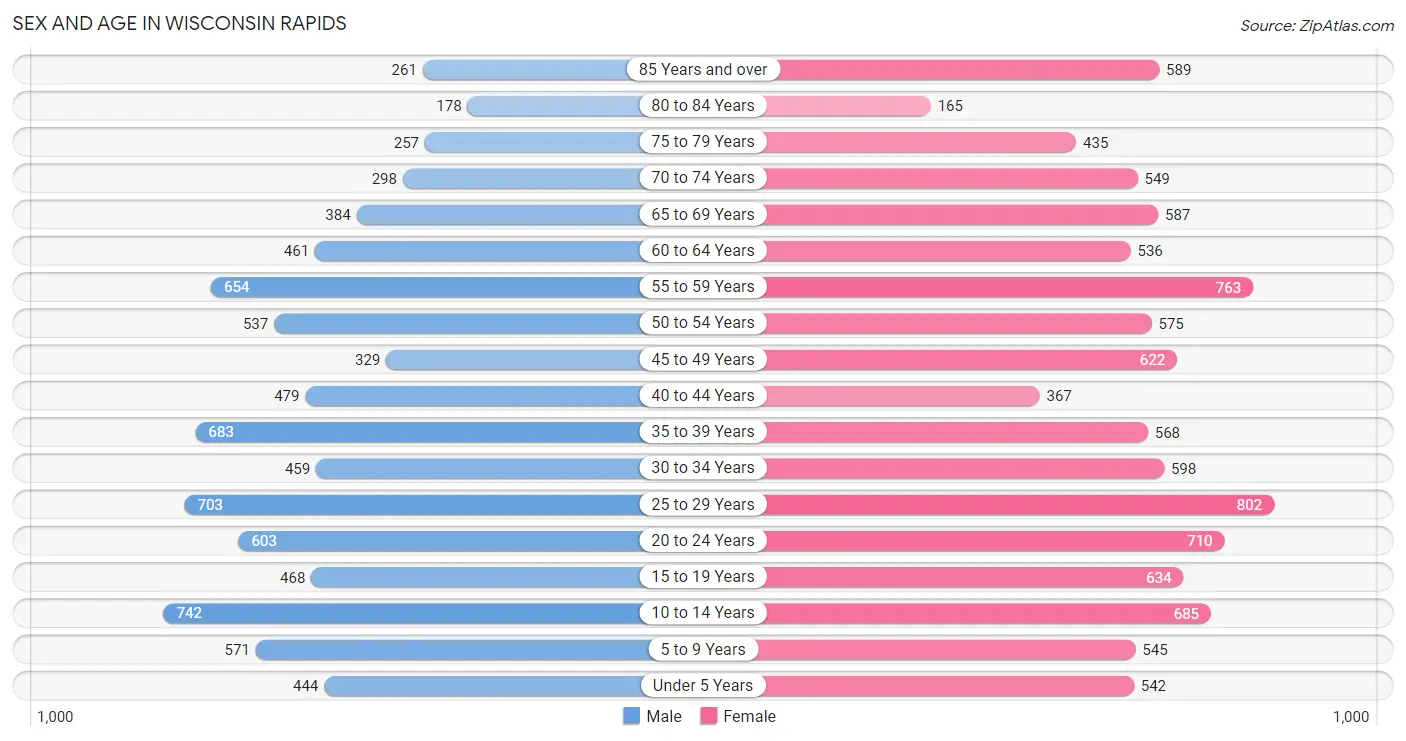
| Age Bracket | Male | Female |
| Under 5 Years | 444 (5.2%) | 542 (5.3%) |
| 5 to 9 Years | 571 (6.7%) | 545 (5.3%) |
| 10 to 14 Years | 742 (8.7%) | 685 (6.7%) |
| 15 to 19 Years | 468 (5.5%) | 634 (6.2%) |
| 20 to 24 Years | 603 (7.1%) | 710 (6.9%) |
| 25 to 29 Years | 703 (8.3%) | 802 (7.8%) |
| 30 to 34 Years | 459 (5.4%) | 598 (5.8%) |
| 35 to 39 Years | 683 (8.0%) | 568 (5.5%) |
| 40 to 44 Years | 479 (5.6%) | 367 (3.6%) |
| 45 to 49 Years | 329 (3.9%) | 622 (6.1%) |
| 50 to 54 Years | 537 (6.3%) | 575 (5.6%) |
| 55 to 59 Years | 654 (7.7%) | 763 (7.4%) |
| 60 to 64 Years | 461 (5.4%) | 536 (5.2%) |
| 65 to 69 Years | 384 (4.5%) | 587 (5.7%) |
| 70 to 74 Years | 298 (3.5%) | 549 (5.3%) |
| 75 to 79 Years | 257 (3.0%) | 435 (4.2%) |
| 80 to 84 Years | 178 (2.1%) | 165 (1.6%) |
| 85 Years and over | 261 (3.1%) | 589 (5.7%) |
| Total | 8,511 (100.0%) | 10,272 (100.0%) |
Families and Households in Wisconsin Rapids
Median Family Size in Wisconsin Rapids
The median family size in Wisconsin Rapids is 2.88 persons per family, with married-couple families (2,910 | 64.8%) accounting for the largest median family size of 3.07 persons per family. On the other hand, single male/father families (458 | 10.2%) represent the smallest median family size with 2.27 persons per family.
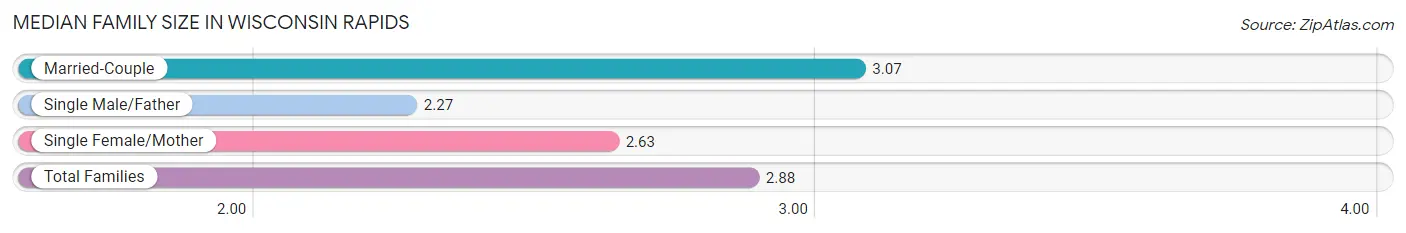
| Family Type | # Families | Family Size |
| Married-Couple | 2,910 (64.8%) | 3.07 |
| Single Male/Father | 458 (10.2%) | 2.27 |
| Single Female/Mother | 1,119 (24.9%) | 2.63 |
| Total Families | 4,487 (100.0%) | 2.88 |
Median Household Size in Wisconsin Rapids
The median household size in Wisconsin Rapids is 2.15 persons per household, with married-couple households (2,910 | 34.1%) accounting for the largest median household size of 3.1 persons per household. non-family households (4,040 | 47.4%) represent the smallest median household size with 1.17 persons per household.
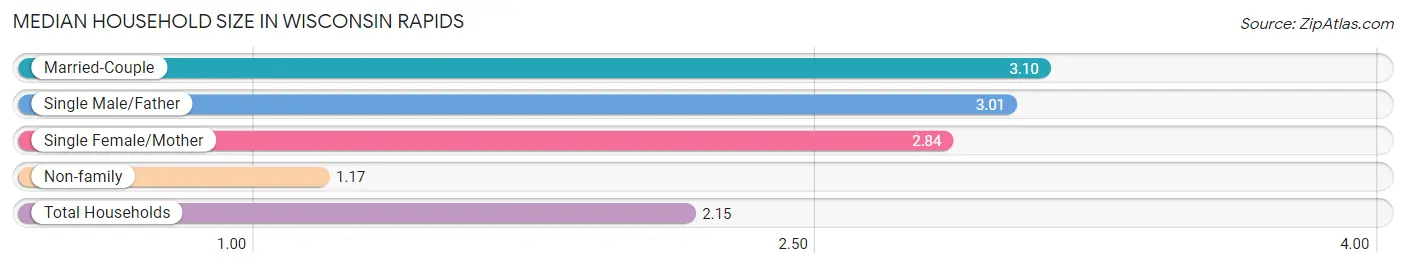
| Household Type | # Households | Household Size |
| Married-Couple | 2,910 (34.1%) | 3.10 |
| Single Male/Father | 458 (5.4%) | 3.01 |
| Single Female/Mother | 1,119 (13.1%) | 2.84 |
| Non-family | 4,040 (47.4%) | 1.17 |
| Total Households | 8,527 (100.0%) | 2.15 |
Household Size by Marriage Status in Wisconsin Rapids
Out of a total of 8,527 households in Wisconsin Rapids, 4,487 (52.6%) are family households, while 4,040 (47.4%) are nonfamily households. The most numerous type of family households are 2-person households, comprising 2,224, and the most common type of nonfamily households are 1-person households, comprising 3,453.
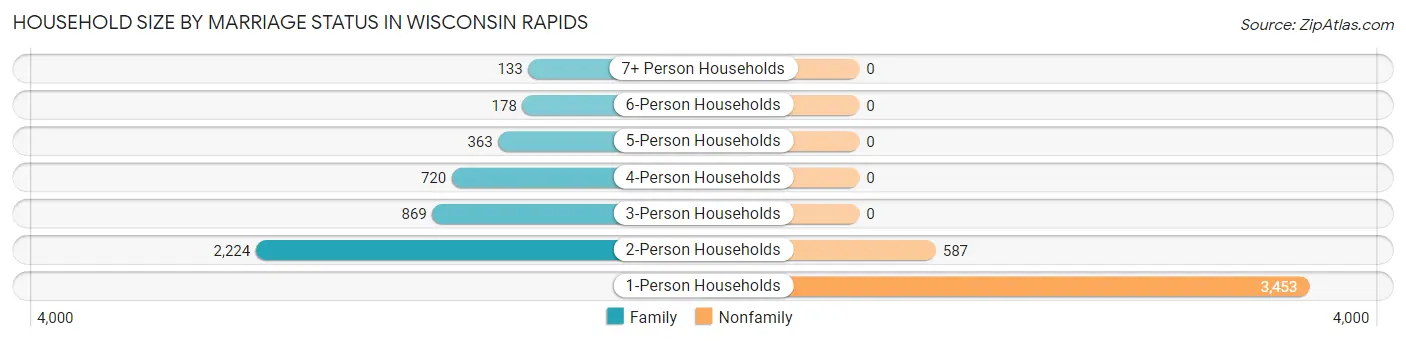
| Household Size | Family Households | Nonfamily Households |
| 1-Person Households | - | 3,453 (40.5%) |
| 2-Person Households | 2,224 (26.1%) | 587 (6.9%) |
| 3-Person Households | 869 (10.2%) | 0 (0.0%) |
| 4-Person Households | 720 (8.4%) | 0 (0.0%) |
| 5-Person Households | 363 (4.3%) | 0 (0.0%) |
| 6-Person Households | 178 (2.1%) | 0 (0.0%) |
| 7+ Person Households | 133 (1.6%) | 0 (0.0%) |
| Total | 4,487 (52.6%) | 4,040 (47.4%) |
Female Fertility in Wisconsin Rapids
Fertility by Age in Wisconsin Rapids
Average fertility rate in Wisconsin Rapids is 65.0 births per 1,000 women. Women in the age bracket of 15 to 19 years have the highest fertility rate with 123.0 births per 1,000 women. Women in the age bracket of 20 to 34 years acount for 56.8% of all women with births.
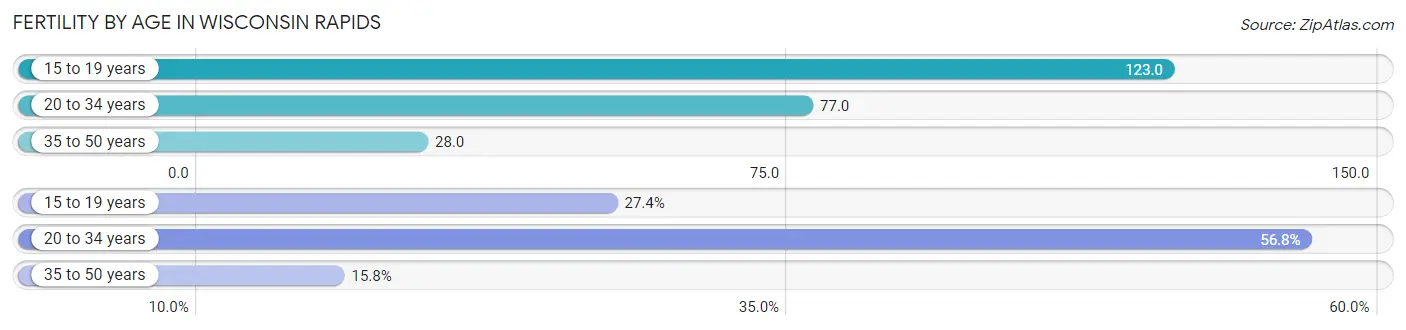
| Age Bracket | Women with Births | Births / 1,000 Women |
| 15 to 19 years | 78 (27.4%) | 123.0 |
| 20 to 34 years | 162 (56.8%) | 77.0 |
| 35 to 50 years | 45 (15.8%) | 28.0 |
| Total | 285 (100.0%) | 65.0 |
Fertility by Age by Marriage Status in Wisconsin Rapids
17.2% of women with births (285) in Wisconsin Rapids are married. The highest percentage of unmarried women with births falls into 15 to 19 years age bracket with 100.0% of them unmarried at the time of birth, while the lowest percentage of unmarried women with births belong to 35 to 50 years age bracket with 68.9% of them unmarried.
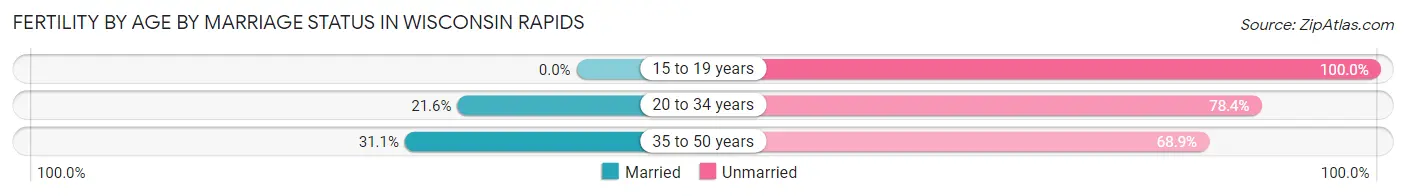
| Age Bracket | Married | Unmarried |
| 15 to 19 years | 0 (0.0%) | 78 (100.0%) |
| 20 to 34 years | 35 (21.6%) | 127 (78.4%) |
| 35 to 50 years | 14 (31.1%) | 31 (68.9%) |
| Total | 49 (17.2%) | 236 (82.8%) |
Fertility by Education in Wisconsin Rapids
Average fertility rate in Wisconsin Rapids is 65.0 births per 1,000 women. Women with the education attainment of graduate degree have the highest fertility rate of 218.0 births per 1,000 women, while women with the education attainment of high school diploma have the lowest fertility at 9.0 births per 1,000 women. Women with the education attainment of college or associate's degree represent 55.1% of all women with births.
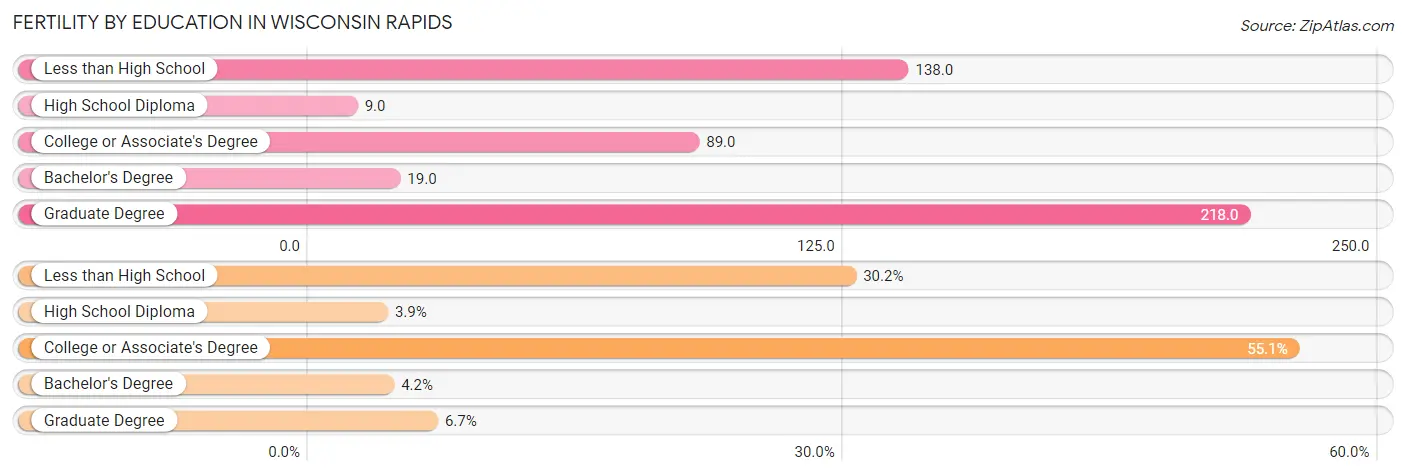
| Educational Attainment | Women with Births | Births / 1,000 Women |
| Less than High School | 86 (30.2%) | 138.0 |
| High School Diploma | 11 (3.9%) | 9.0 |
| College or Associate's Degree | 157 (55.1%) | 89.0 |
| Bachelor's Degree | 12 (4.2%) | 19.0 |
| Graduate Degree | 19 (6.7%) | 218.0 |
| Total | 285 (100.0%) | 65.0 |
Fertility by Education by Marriage Status in Wisconsin Rapids
82.8% of women with births in Wisconsin Rapids are unmarried. Women with the educational attainment of graduate degree are most likely to be married with 100.0% of them married at childbirth, while women with the educational attainment of less than high school are least likely to be married with 100.0% of them unmarried at childbirth.
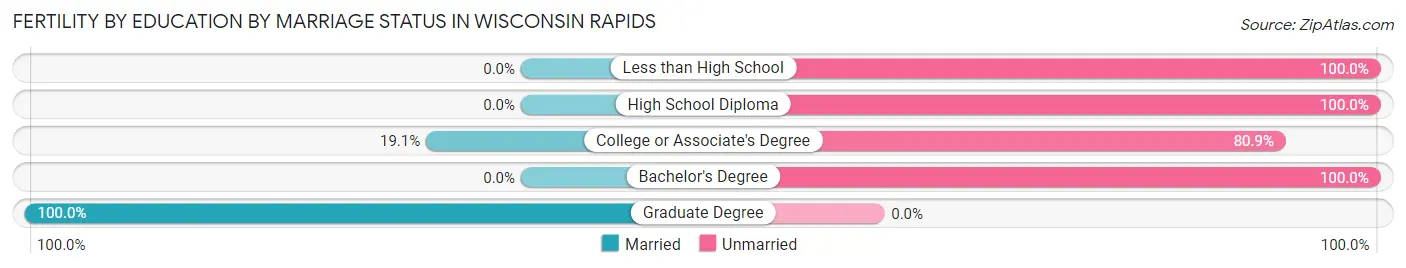
| Educational Attainment | Married | Unmarried |
| Less than High School | 0 (0.0%) | 86 (100.0%) |
| High School Diploma | 0 (0.0%) | 11 (100.0%) |
| College or Associate's Degree | 30 (19.1%) | 127 (80.9%) |
| Bachelor's Degree | 0 (0.0%) | 12 (100.0%) |
| Graduate Degree | 19 (100.0%) | 0 (0.0%) |
| Total | 49 (17.2%) | 236 (82.8%) |
Employment Characteristics in Wisconsin Rapids
Employment by Class of Employer in Wisconsin Rapids
Among the 8,658 employed individuals in Wisconsin Rapids, private company employees (6,563 | 75.8%), not-for-profit organizations (696 | 8.0%), and local government employees (656 | 7.6%) make up the most common classes of employment.
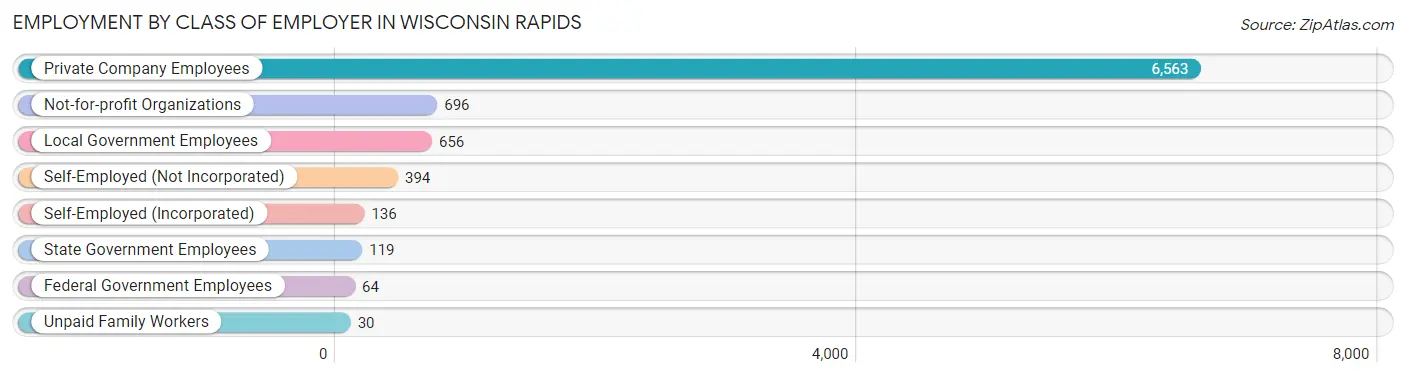
| Employer Class | # Employees | % Employees |
| Private Company Employees | 6,563 | 75.8% |
| Self-Employed (Incorporated) | 136 | 1.6% |
| Self-Employed (Not Incorporated) | 394 | 4.5% |
| Not-for-profit Organizations | 696 | 8.0% |
| Local Government Employees | 656 | 7.6% |
| State Government Employees | 119 | 1.4% |
| Federal Government Employees | 64 | 0.7% |
| Unpaid Family Workers | 30 | 0.4% |
| Total | 8,658 | 100.0% |
Employment Status by Age in Wisconsin Rapids
According to the labor force statistics for Wisconsin Rapids, out of the total population over 16 years of age (15,022), 63.2% or 9,494 individuals are in the labor force, with 6.4% or 608 of them unemployed. The age group with the highest labor force participation rate is 25 to 29 years, with 93.0% or 1,400 individuals in the labor force. Within the labor force, the 75 years and over age range has the highest percentage of unemployed individuals, with 71.5% or 93 of them being unemployed.
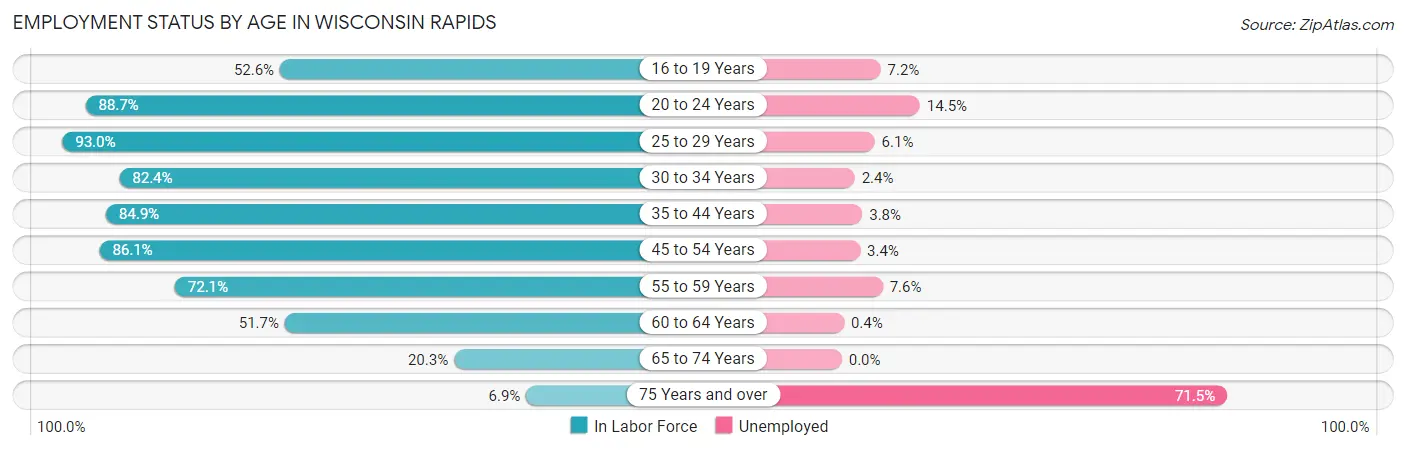
| Age Bracket | In Labor Force | Unemployed |
| 16 to 19 Years | 458 (52.6%) | 33 (7.2%) |
| 20 to 24 Years | 1,165 (88.7%) | 169 (14.5%) |
| 25 to 29 Years | 1,400 (93.0%) | 85 (6.1%) |
| 30 to 34 Years | 871 (82.4%) | 21 (2.4%) |
| 35 to 44 Years | 1,780 (84.9%) | 68 (3.8%) |
| 45 to 54 Years | 1,776 (86.1%) | 60 (3.4%) |
| 55 to 59 Years | 1,022 (72.1%) | 78 (7.6%) |
| 60 to 64 Years | 515 (51.7%) | 2 (0.4%) |
| 65 to 74 Years | 369 (20.3%) | 0 (0.0%) |
| 75 Years and over | 130 (6.9%) | 93 (71.5%) |
| Total | 9,494 (63.2%) | 608 (6.4%) |
Employment Status by Educational Attainment in Wisconsin Rapids
According to labor force statistics for Wisconsin Rapids, 80.6% of individuals (7,364) out of the total population between 25 and 64 years of age (9,136) are in the labor force, with 4.3% or 317 of them being unemployed. The group with the highest labor force participation rate are those with the educational attainment of bachelor's degree or higher, with 94.5% or 1,364 individuals in the labor force. Within the labor force, individuals with less than high school education have the highest percentage of unemployment, with 25.5% or 117 of them being unemployed.
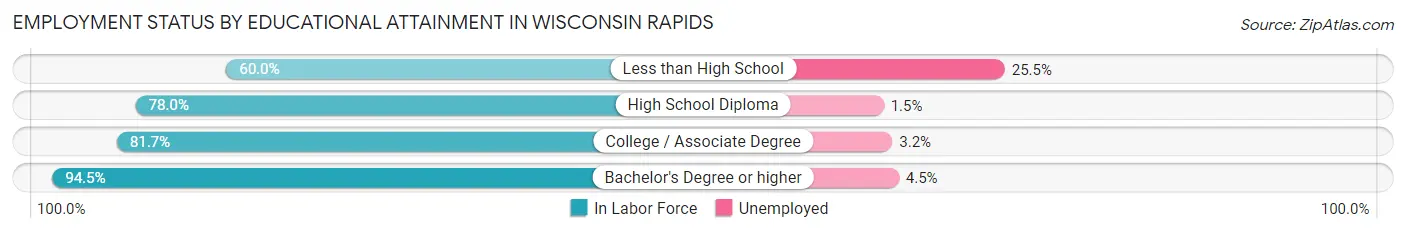
| Educational Attainment | In Labor Force | Unemployed |
| Less than High School | 458 (60.0%) | 195 (25.5%) |
| High School Diploma | 2,491 (78.0%) | 48 (1.5%) |
| College / Associate Degree | 3,052 (81.7%) | 120 (3.2%) |
| Bachelor's Degree or higher | 1,364 (94.5%) | 65 (4.5%) |
| Total | 7,364 (80.6%) | 393 (4.3%) |
Employment Occupations by Sex in Wisconsin Rapids
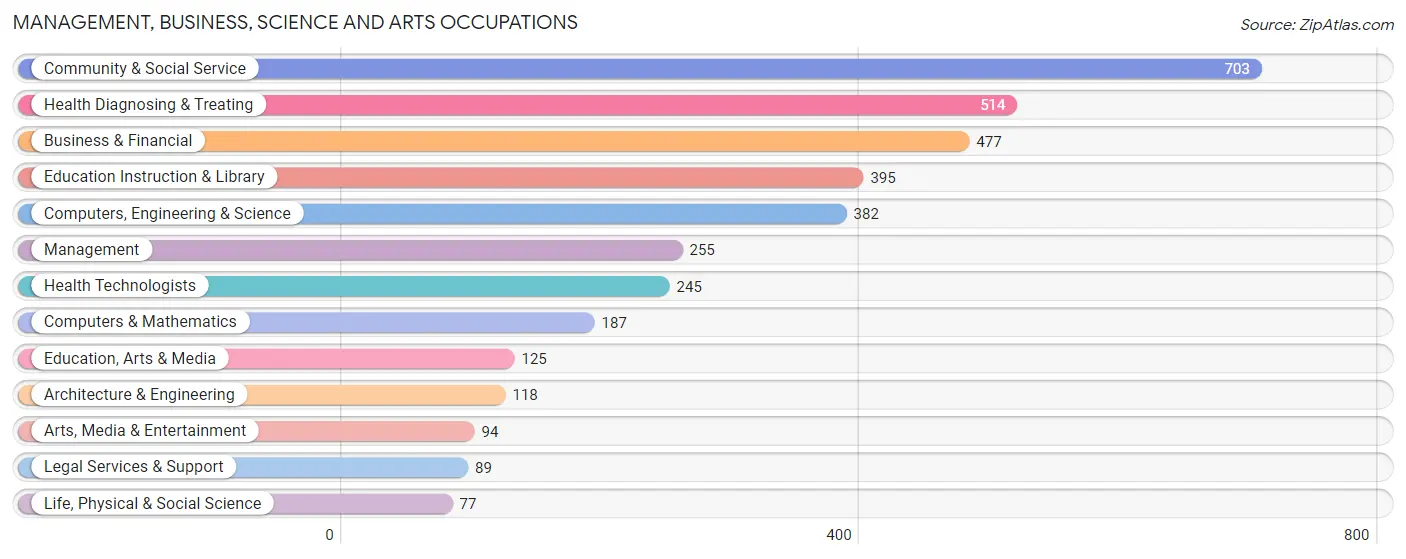
Management, Business, Science and Arts Occupations
The most common Management, Business, Science and Arts occupations in Wisconsin Rapids are Community & Social Service (703 | 7.9%), Health Diagnosing & Treating (514 | 5.8%), Business & Financial (477 | 5.4%), Education Instruction & Library (395 | 4.4%), and Computers, Engineering & Science (382 | 4.3%).
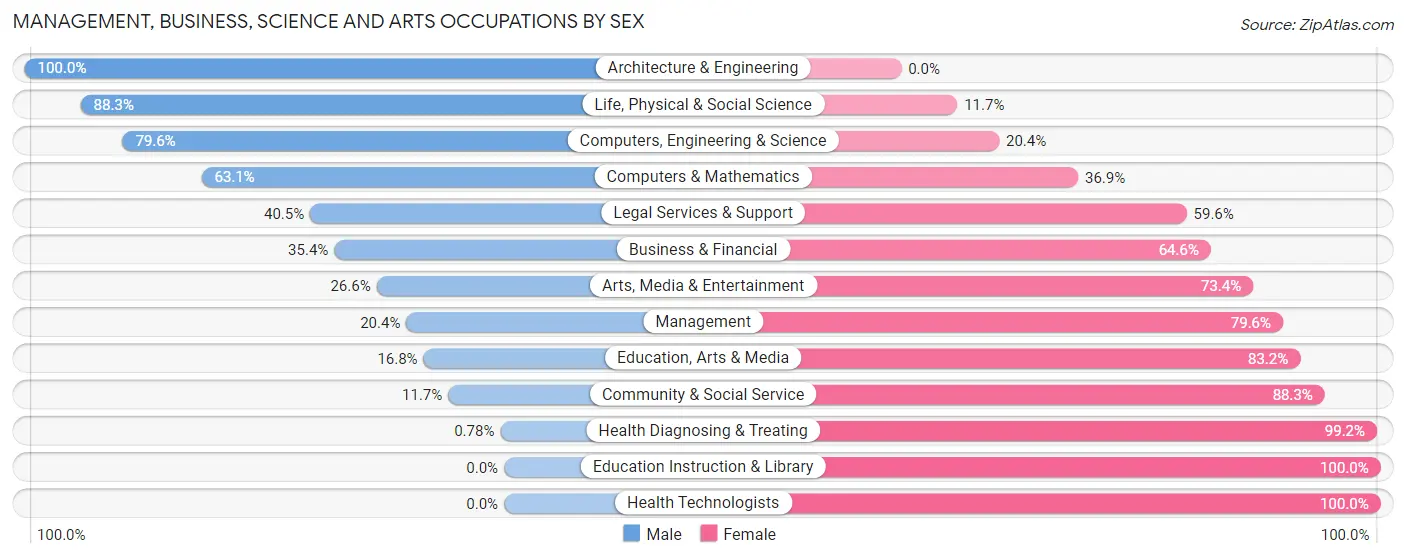
Management, Business, Science and Arts Occupations by Sex
Within the Management, Business, Science and Arts occupations in Wisconsin Rapids, the most male-oriented occupations are Architecture & Engineering (100.0%), Life, Physical & Social Science (88.3%), and Computers, Engineering & Science (79.6%), while the most female-oriented occupations are Education Instruction & Library (100.0%), Health Technologists (100.0%), and Health Diagnosing & Treating (99.2%).
| Occupation | Male | Female |
| Management | 52 (20.4%) | 203 (79.6%) |
| Business & Financial | 169 (35.4%) | 308 (64.6%) |
| Computers, Engineering & Science | 304 (79.6%) | 78 (20.4%) |
| Computers & Mathematics | 118 (63.1%) | 69 (36.9%) |
| Architecture & Engineering | 118 (100.0%) | 0 (0.0%) |
| Life, Physical & Social Science | 68 (88.3%) | 9 (11.7%) |
| Community & Social Service | 82 (11.7%) | 621 (88.3%) |
| Education, Arts & Media | 21 (16.8%) | 104 (83.2%) |
| Legal Services & Support | 36 (40.5%) | 53 (59.6%) |
| Education Instruction & Library | 0 (0.0%) | 395 (100.0%) |
| Arts, Media & Entertainment | 25 (26.6%) | 69 (73.4%) |
| Health Diagnosing & Treating | 4 (0.8%) | 510 (99.2%) |
| Health Technologists | 0 (0.0%) | 245 (100.0%) |
| Total (Category) | 611 (26.2%) | 1,720 (73.8%) |
| Total (Overall) | 4,055 (45.7%) | 4,823 (54.3%) |
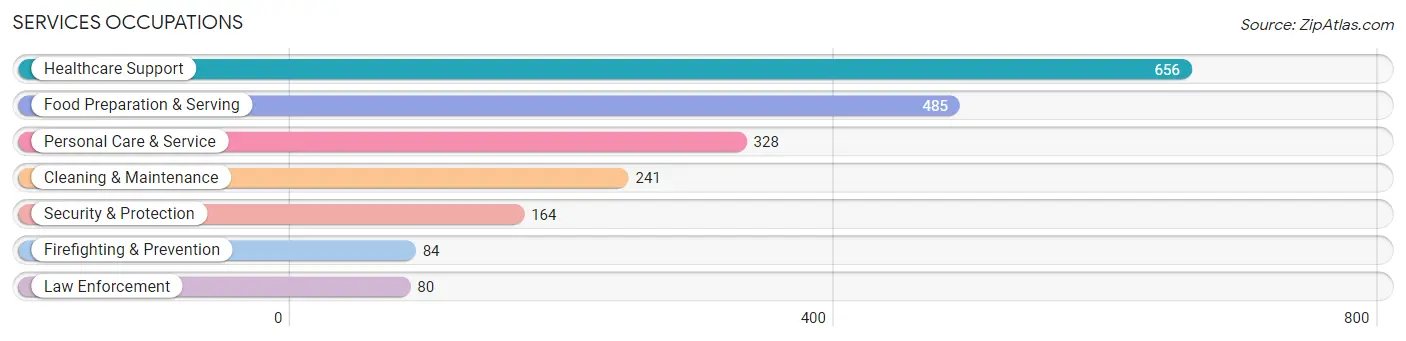
Services Occupations
The most common Services occupations in Wisconsin Rapids are Healthcare Support (656 | 7.4%), Food Preparation & Serving (485 | 5.5%), Personal Care & Service (328 | 3.7%), Cleaning & Maintenance (241 | 2.7%), and Security & Protection (164 | 1.8%).
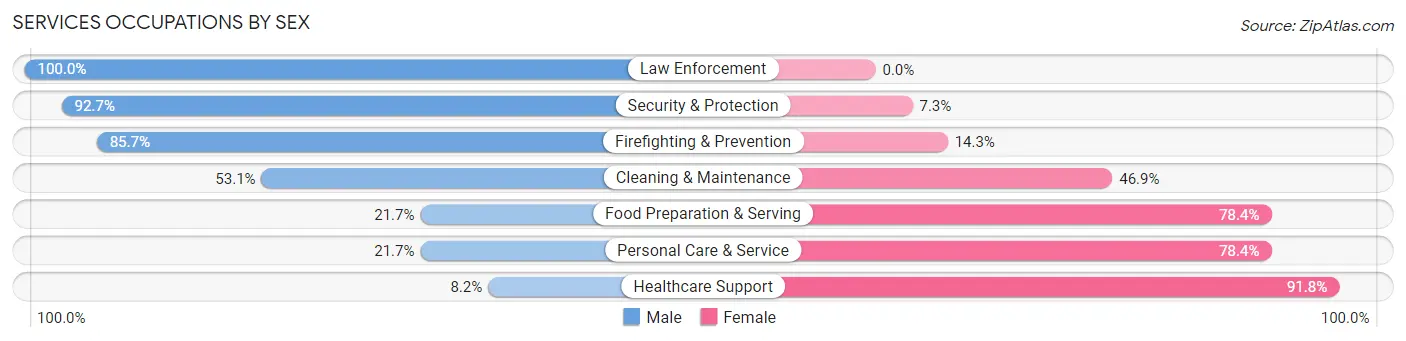
Services Occupations by Sex
Within the Services occupations in Wisconsin Rapids, the most male-oriented occupations are Law Enforcement (100.0%), Security & Protection (92.7%), and Firefighting & Prevention (85.7%), while the most female-oriented occupations are Healthcare Support (91.8%), Food Preparation & Serving (78.3%), and Personal Care & Service (78.3%).
| Occupation | Male | Female |
| Healthcare Support | 54 (8.2%) | 602 (91.8%) |
| Security & Protection | 152 (92.7%) | 12 (7.3%) |
| Firefighting & Prevention | 72 (85.7%) | 12 (14.3%) |
| Law Enforcement | 80 (100.0%) | 0 (0.0%) |
| Food Preparation & Serving | 105 (21.6%) | 380 (78.3%) |
| Cleaning & Maintenance | 128 (53.1%) | 113 (46.9%) |
| Personal Care & Service | 71 (21.6%) | 257 (78.3%) |
| Total (Category) | 510 (27.2%) | 1,364 (72.8%) |
| Total (Overall) | 4,055 (45.7%) | 4,823 (54.3%) |
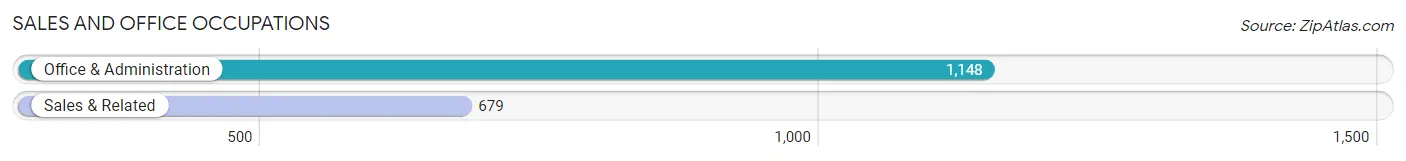
Sales and Office Occupations
The most common Sales and Office occupations in Wisconsin Rapids are Office & Administration (1,148 | 12.9%), and Sales & Related (679 | 7.6%).
Sales and Office Occupations by Sex
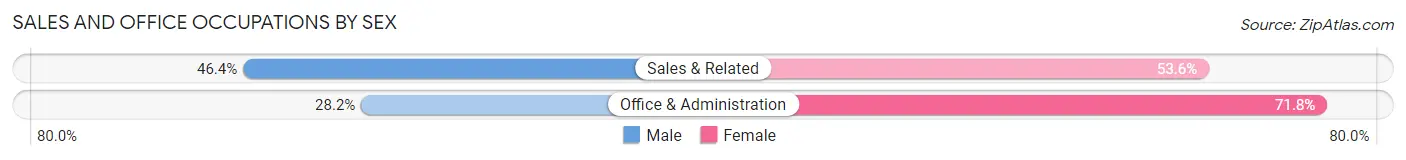
| Occupation | Male | Female |
| Sales & Related | 315 (46.4%) | 364 (53.6%) |
| Office & Administration | 324 (28.2%) | 824 (71.8%) |
| Total (Category) | 639 (35.0%) | 1,188 (65.0%) |
| Total (Overall) | 4,055 (45.7%) | 4,823 (54.3%) |
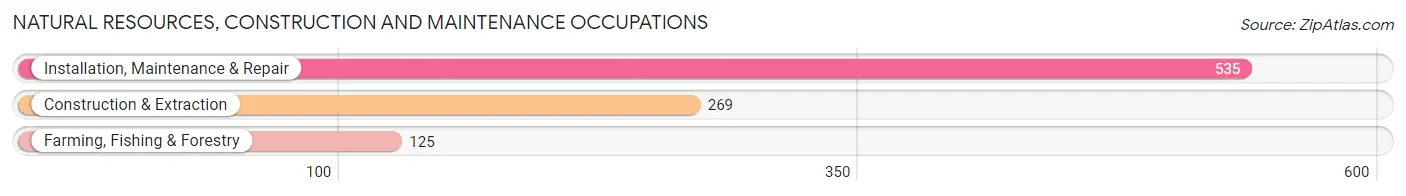
Natural Resources, Construction and Maintenance Occupations
The most common Natural Resources, Construction and Maintenance occupations in Wisconsin Rapids are Installation, Maintenance & Repair (535 | 6.0%), Construction & Extraction (269 | 3.0%), and Farming, Fishing & Forestry (125 | 1.4%).
Natural Resources, Construction and Maintenance Occupations by Sex
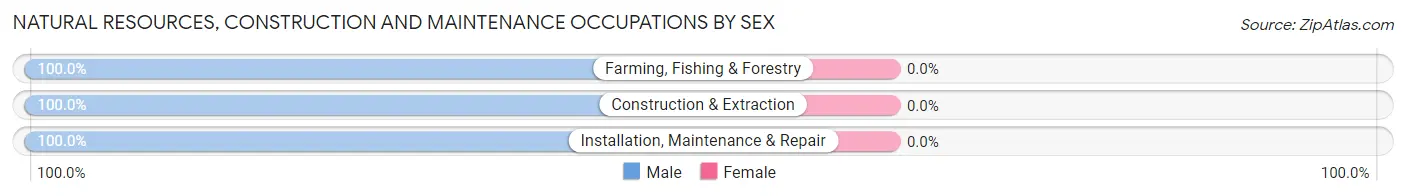
| Occupation | Male | Female |
| Farming, Fishing & Forestry | 125 (100.0%) | 0 (0.0%) |
| Construction & Extraction | 269 (100.0%) | 0 (0.0%) |
| Installation, Maintenance & Repair | 535 (100.0%) | 0 (0.0%) |
| Total (Category) | 929 (100.0%) | 0 (0.0%) |
| Total (Overall) | 4,055 (45.7%) | 4,823 (54.3%) |
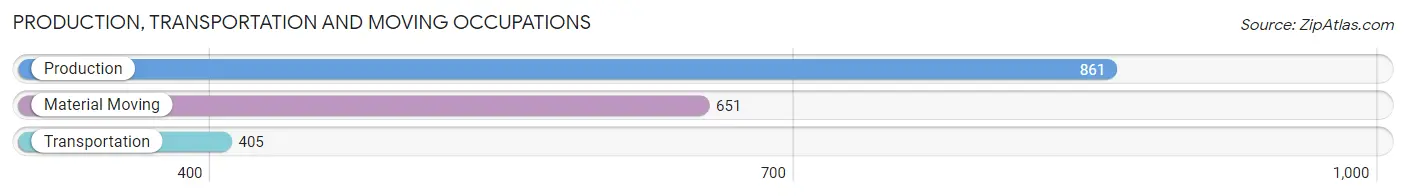
Production, Transportation and Moving Occupations
The most common Production, Transportation and Moving occupations in Wisconsin Rapids are Production (861 | 9.7%), Material Moving (651 | 7.3%), and Transportation (405 | 4.6%).
Production, Transportation and Moving Occupations by Sex
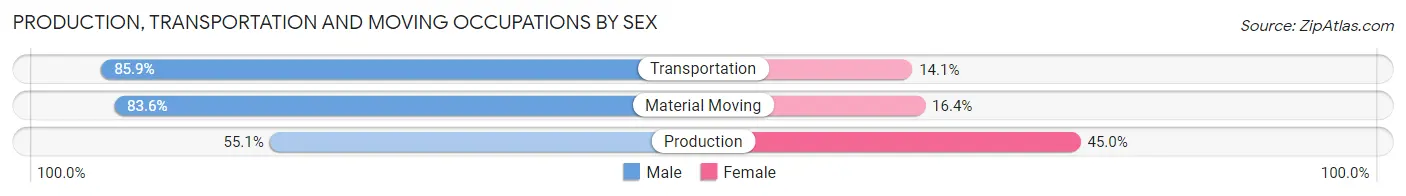
| Occupation | Male | Female |
| Production | 474 (55.0%) | 387 (45.0%) |
| Transportation | 348 (85.9%) | 57 (14.1%) |
| Material Moving | 544 (83.6%) | 107 (16.4%) |
| Total (Category) | 1,366 (71.3%) | 551 (28.7%) |
| Total (Overall) | 4,055 (45.7%) | 4,823 (54.3%) |
Employment Industries by Sex in Wisconsin Rapids
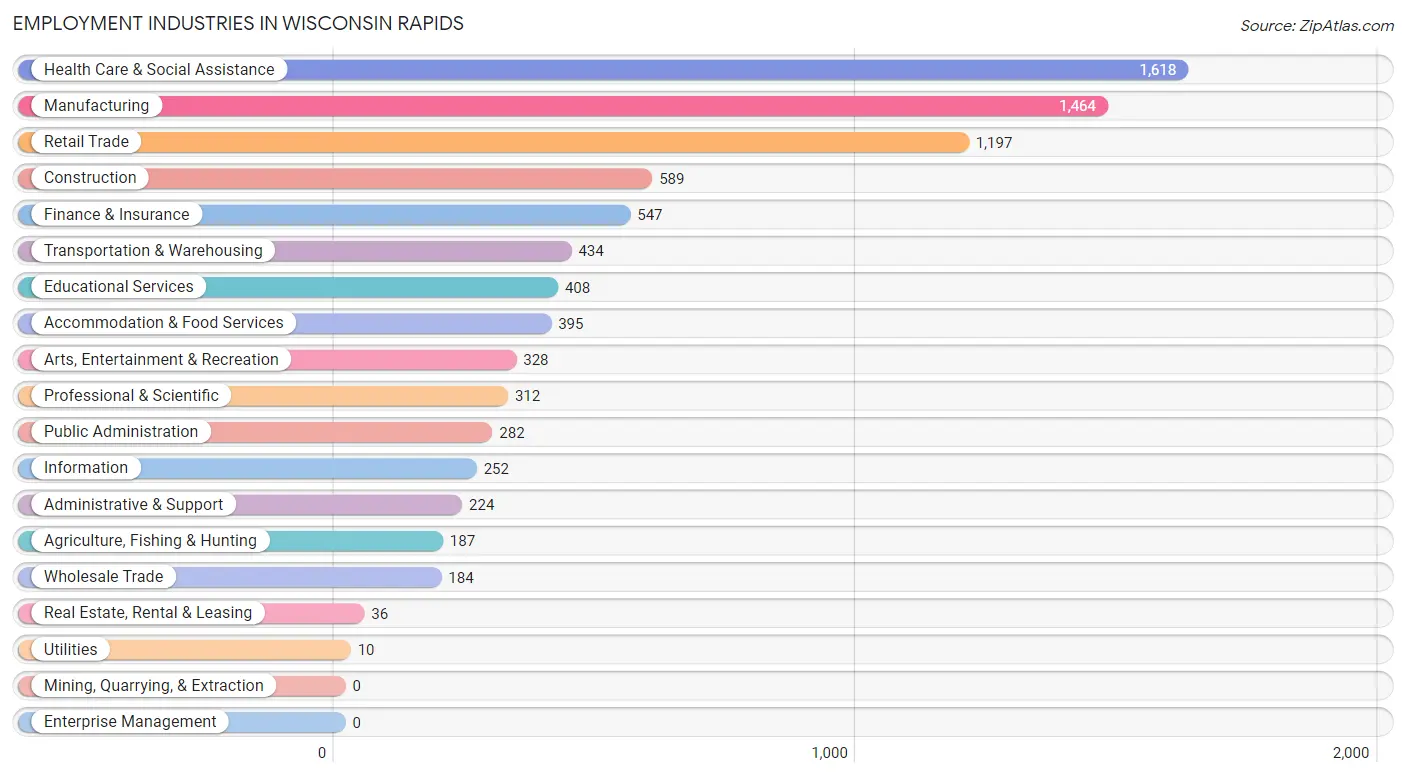
Employment Industries in Wisconsin Rapids
The major employment industries in Wisconsin Rapids include Health Care & Social Assistance (1,618 | 18.2%), Manufacturing (1,464 | 16.5%), Retail Trade (1,197 | 13.5%), Construction (589 | 6.6%), and Finance & Insurance (547 | 6.2%).
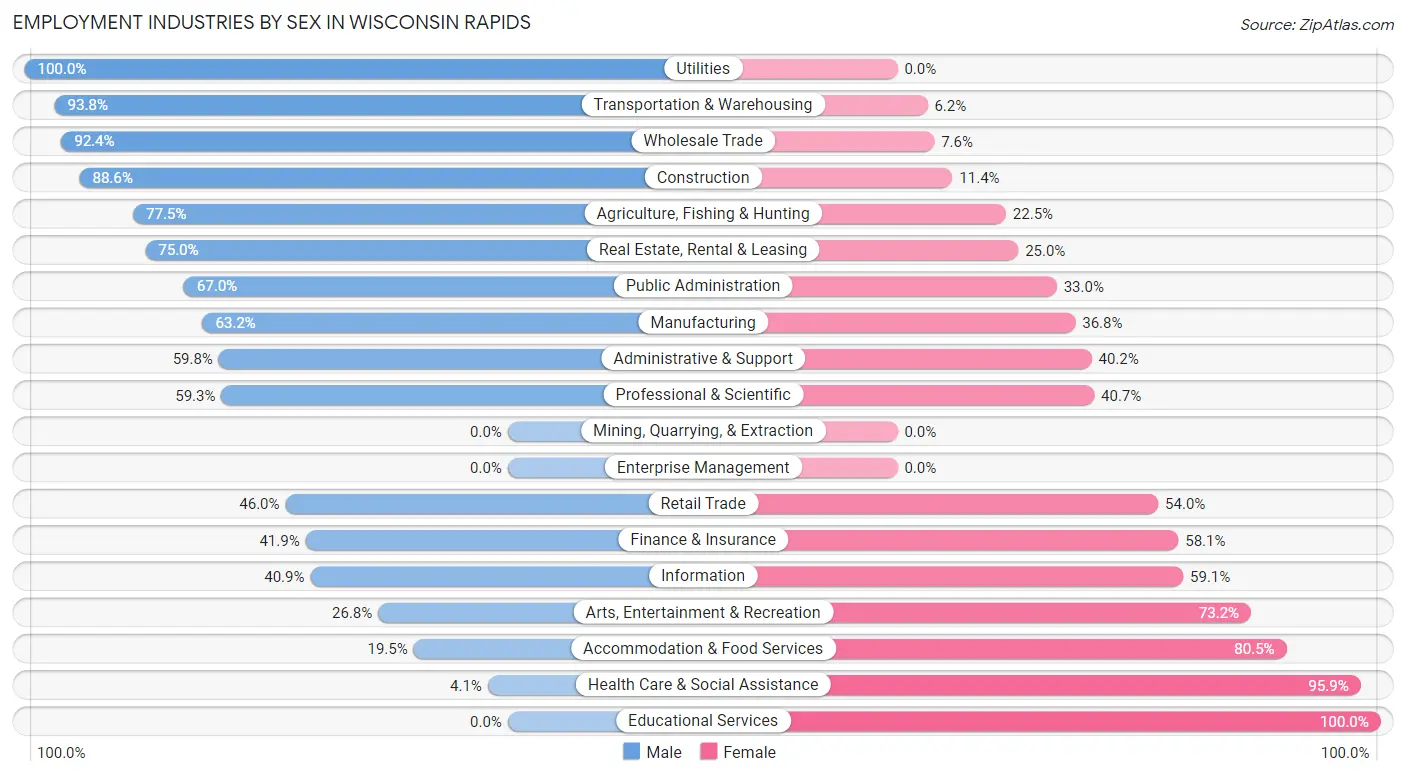
Employment Industries by Sex in Wisconsin Rapids
The Wisconsin Rapids industries that see more men than women are Utilities (100.0%), Transportation & Warehousing (93.8%), and Wholesale Trade (92.4%), whereas the industries that tend to have a higher number of women are Educational Services (100.0%), Health Care & Social Assistance (95.9%), and Accommodation & Food Services (80.5%).
| Industry | Male | Female |
| Agriculture, Fishing & Hunting | 145 (77.5%) | 42 (22.5%) |
| Mining, Quarrying, & Extraction | 0 (0.0%) | 0 (0.0%) |
| Construction | 522 (88.6%) | 67 (11.4%) |
| Manufacturing | 925 (63.2%) | 539 (36.8%) |
| Wholesale Trade | 170 (92.4%) | 14 (7.6%) |
| Retail Trade | 551 (46.0%) | 646 (54.0%) |
| Transportation & Warehousing | 407 (93.8%) | 27 (6.2%) |
| Utilities | 10 (100.0%) | 0 (0.0%) |
| Information | 103 (40.9%) | 149 (59.1%) |
| Finance & Insurance | 229 (41.9%) | 318 (58.1%) |
| Real Estate, Rental & Leasing | 27 (75.0%) | 9 (25.0%) |
| Professional & Scientific | 185 (59.3%) | 127 (40.7%) |
| Enterprise Management | 0 (0.0%) | 0 (0.0%) |
| Administrative & Support | 134 (59.8%) | 90 (40.2%) |
| Educational Services | 0 (0.0%) | 408 (100.0%) |
| Health Care & Social Assistance | 67 (4.1%) | 1,551 (95.9%) |
| Arts, Entertainment & Recreation | 88 (26.8%) | 240 (73.2%) |
| Accommodation & Food Services | 77 (19.5%) | 318 (80.5%) |
| Public Administration | 189 (67.0%) | 93 (33.0%) |
| Total | 4,055 (45.7%) | 4,823 (54.3%) |
Education in Wisconsin Rapids
School Enrollment in Wisconsin Rapids
The most common levels of schooling among the 4,066 students in Wisconsin Rapids are middle school (1,119 | 27.5%), high school (940 | 23.1%), and elementary school (779 | 19.2%).
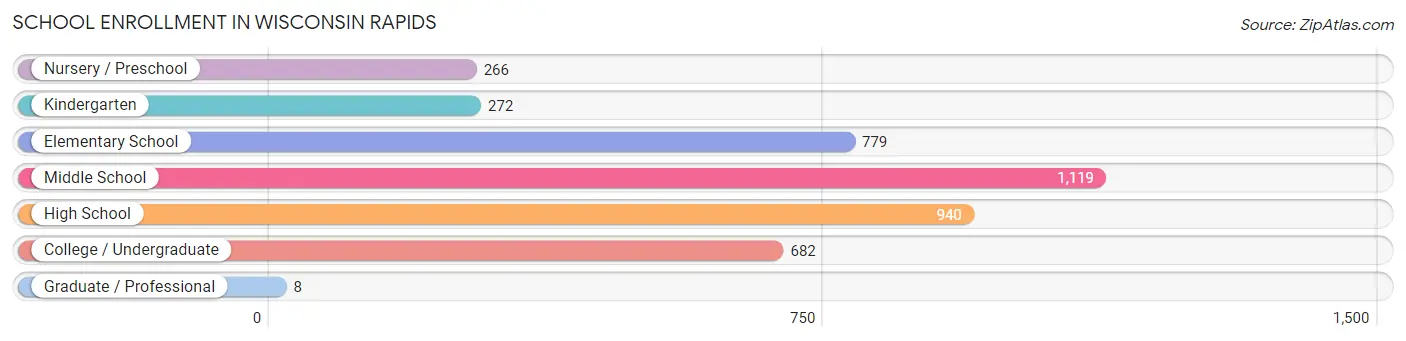
| School Level | # Students | % Students |
| Nursery / Preschool | 266 | 6.5% |
| Kindergarten | 272 | 6.7% |
| Elementary School | 779 | 19.2% |
| Middle School | 1,119 | 27.5% |
| High School | 940 | 23.1% |
| College / Undergraduate | 682 | 16.8% |
| Graduate / Professional | 8 | 0.2% |
| Total | 4,066 | 100.0% |
School Enrollment by Age by Funding Source in Wisconsin Rapids
Out of a total of 4,066 students who are enrolled in schools in Wisconsin Rapids, 744 (18.3%) attend a private institution, while the remaining 3,322 (81.7%) are enrolled in public schools. The age group of 3 to 4 year olds has the highest likelihood of being enrolled in private schools, with 56 (37.6% in the age bracket) enrolled. Conversely, the age group of 18 to 19 year olds has the lowest likelihood of being enrolled in a private school, with 239 (89.5% in the age bracket) attending a public institution.
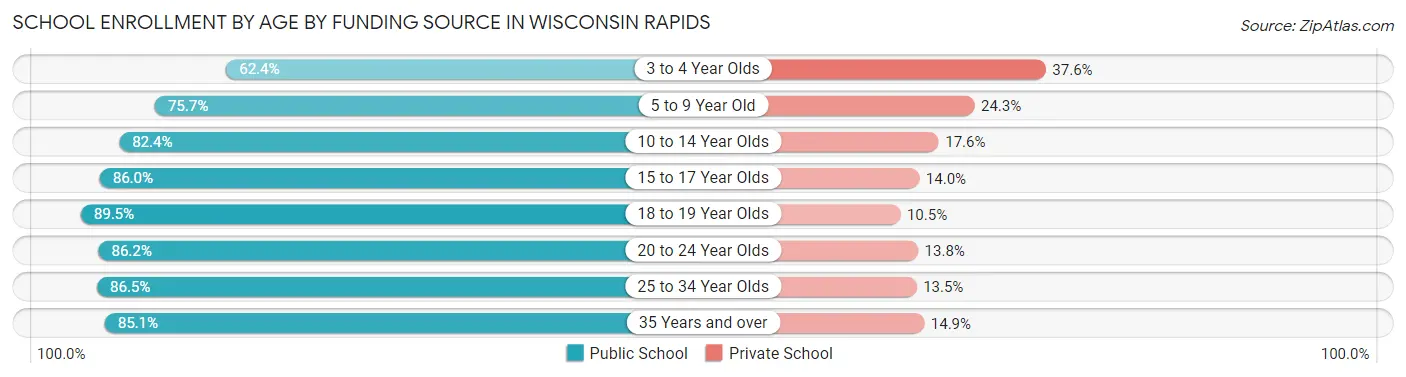
| Age Bracket | Public School | Private School |
| 3 to 4 Year Olds | 93 (62.4%) | 56 (37.6%) |
| 5 to 9 Year Old | 745 (75.7%) | 239 (24.3%) |
| 10 to 14 Year Olds | 1,131 (82.4%) | 242 (17.6%) |
| 15 to 17 Year Olds | 571 (86.0%) | 93 (14.0%) |
| 18 to 19 Year Olds | 239 (89.5%) | 28 (10.5%) |
| 20 to 24 Year Olds | 169 (86.2%) | 27 (13.8%) |
| 25 to 34 Year Olds | 224 (86.5%) | 35 (13.5%) |
| 35 Years and over | 148 (85.1%) | 26 (14.9%) |
| Total | 3,322 (81.7%) | 744 (18.3%) |
Educational Attainment by Field of Study in Wisconsin Rapids
Business (560 | 24.2%), education (498 | 21.5%), psychology (190 | 8.2%), computers & mathematics (176 | 7.6%), and social sciences (126 | 5.4%) are the most common fields of study among 2,317 individuals in Wisconsin Rapids who have obtained a bachelor's degree or higher.
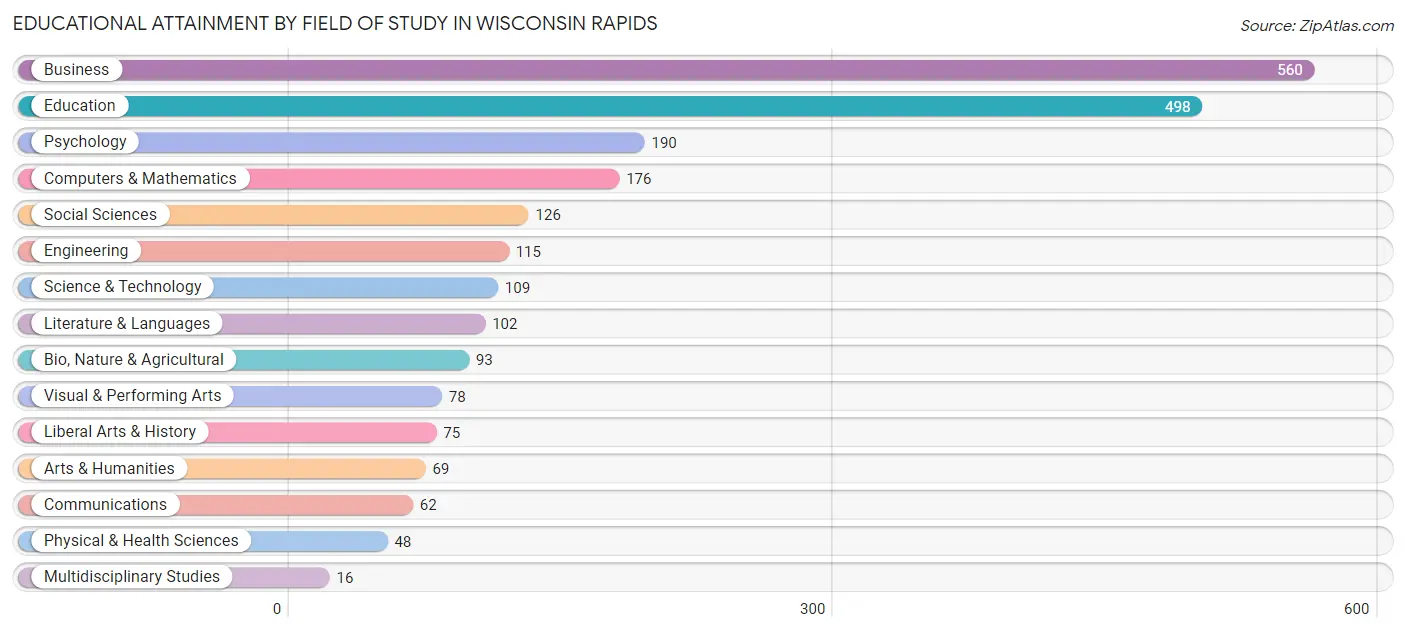
| Field of Study | # Graduates | % Graduates |
| Computers & Mathematics | 176 | 7.6% |
| Bio, Nature & Agricultural | 93 | 4.0% |
| Physical & Health Sciences | 48 | 2.1% |
| Psychology | 190 | 8.2% |
| Social Sciences | 126 | 5.4% |
| Engineering | 115 | 5.0% |
| Multidisciplinary Studies | 16 | 0.7% |
| Science & Technology | 109 | 4.7% |
| Business | 560 | 24.2% |
| Education | 498 | 21.5% |
| Literature & Languages | 102 | 4.4% |
| Liberal Arts & History | 75 | 3.2% |
| Visual & Performing Arts | 78 | 3.4% |
| Communications | 62 | 2.7% |
| Arts & Humanities | 69 | 3.0% |
| Total | 2,317 | 100.0% |
Transportation & Commute in Wisconsin Rapids
Vehicle Availability by Sex in Wisconsin Rapids
The most prevalent vehicle ownership categories in Wisconsin Rapids are males with 2 vehicles (1,730, accounting for 43.8%) and females with 2 vehicles (2,327, making up 37.3%).
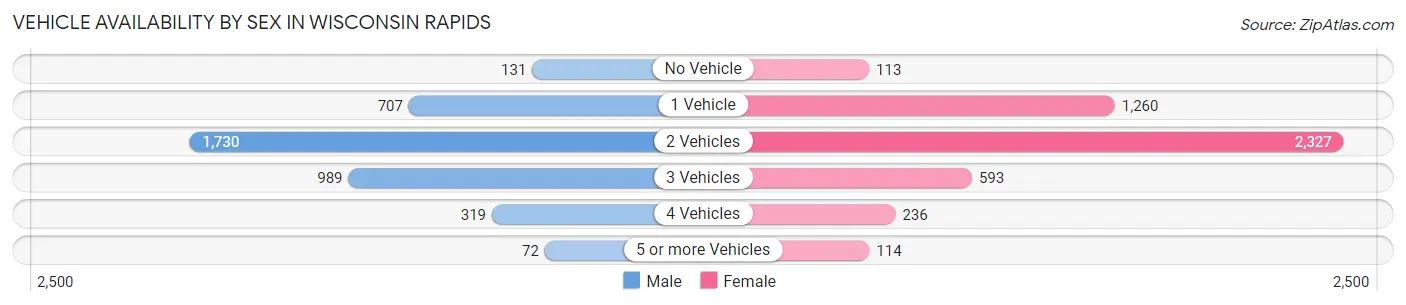
| Vehicles Available | Male | Female |
| No Vehicle | 131 (3.3%) | 113 (2.4%) |
| 1 Vehicle | 707 (17.9%) | 1,260 (27.1%) |
| 2 Vehicles | 1,730 (43.8%) | 2,327 (50.1%) |
| 3 Vehicles | 989 (25.1%) | 593 (12.8%) |
| 4 Vehicles | 319 (8.1%) | 236 (5.1%) |
| 5 or more Vehicles | 72 (1.8%) | 114 (2.5%) |
| Total | 3,948 (100.0%) | 4,643 (100.0%) |
Commute Time in Wisconsin Rapids
The most frequently occuring commute durations in Wisconsin Rapids are 5 to 9 minutes (1,605 commuters, 19.8%), 10 to 14 minutes (1,520 commuters, 18.8%), and 30 to 34 minutes (1,484 commuters, 18.3%).
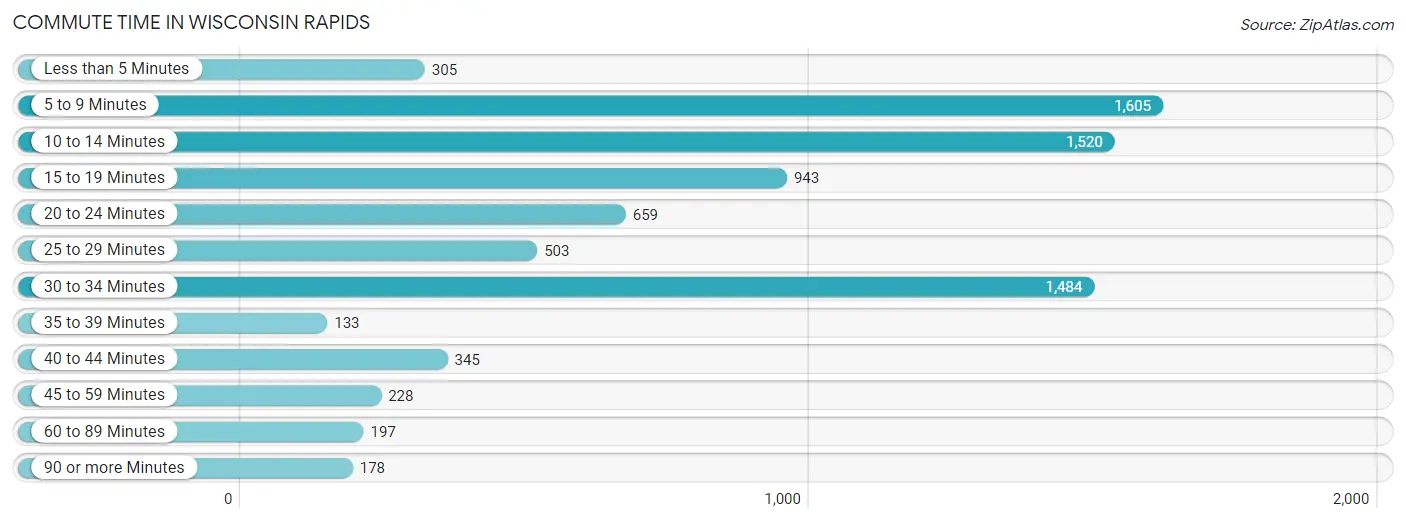
| Commute Time | # Commuters | % Commuters |
| Less than 5 Minutes | 305 | 3.8% |
| 5 to 9 Minutes | 1,605 | 19.8% |
| 10 to 14 Minutes | 1,520 | 18.8% |
| 15 to 19 Minutes | 943 | 11.6% |
| 20 to 24 Minutes | 659 | 8.1% |
| 25 to 29 Minutes | 503 | 6.2% |
| 30 to 34 Minutes | 1,484 | 18.3% |
| 35 to 39 Minutes | 133 | 1.6% |
| 40 to 44 Minutes | 345 | 4.3% |
| 45 to 59 Minutes | 228 | 2.8% |
| 60 to 89 Minutes | 197 | 2.4% |
| 90 or more Minutes | 178 | 2.2% |
Commute Time by Sex in Wisconsin Rapids
The most common commute times in Wisconsin Rapids are 30 to 34 minutes (927 commuters, 24.1%) for males and 5 to 9 minutes (1,000 commuters, 23.5%) for females.
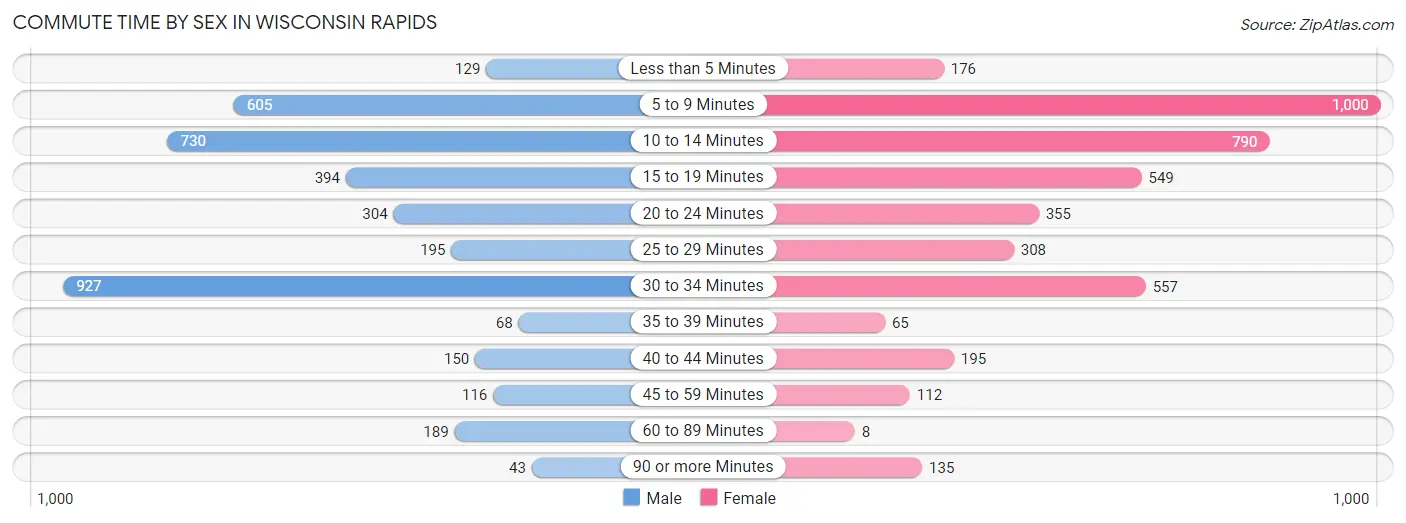
| Commute Time | Male | Female |
| Less than 5 Minutes | 129 (3.4%) | 176 (4.1%) |
| 5 to 9 Minutes | 605 (15.7%) | 1,000 (23.5%) |
| 10 to 14 Minutes | 730 (19.0%) | 790 (18.6%) |
| 15 to 19 Minutes | 394 (10.2%) | 549 (12.9%) |
| 20 to 24 Minutes | 304 (7.9%) | 355 (8.4%) |
| 25 to 29 Minutes | 195 (5.1%) | 308 (7.2%) |
| 30 to 34 Minutes | 927 (24.1%) | 557 (13.1%) |
| 35 to 39 Minutes | 68 (1.8%) | 65 (1.5%) |
| 40 to 44 Minutes | 150 (3.9%) | 195 (4.6%) |
| 45 to 59 Minutes | 116 (3.0%) | 112 (2.6%) |
| 60 to 89 Minutes | 189 (4.9%) | 8 (0.2%) |
| 90 or more Minutes | 43 (1.1%) | 135 (3.2%) |
Time of Departure to Work by Sex in Wisconsin Rapids
The most frequent times of departure to work in Wisconsin Rapids are 4:00 PM to 11:59 PM (654, 17.0%) for males and 4:00 PM to 11:59 PM (677, 15.9%) for females.
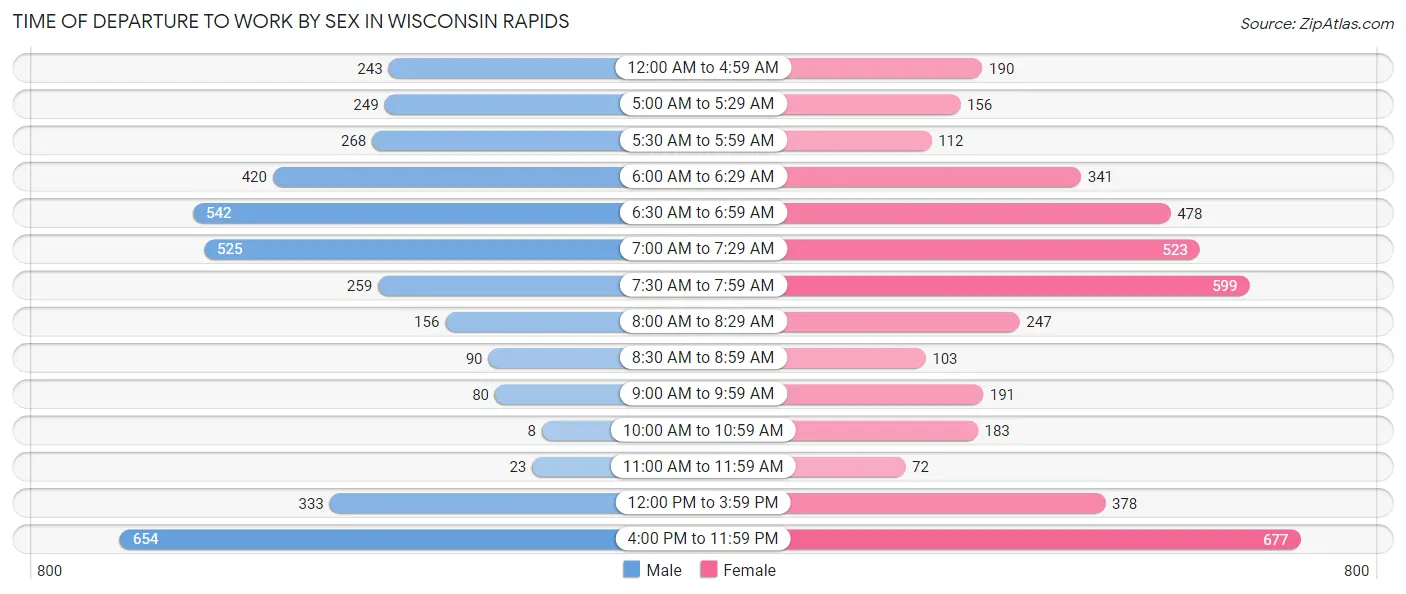
| Time of Departure | Male | Female |
| 12:00 AM to 4:59 AM | 243 (6.3%) | 190 (4.5%) |
| 5:00 AM to 5:29 AM | 249 (6.5%) | 156 (3.7%) |
| 5:30 AM to 5:59 AM | 268 (7.0%) | 112 (2.6%) |
| 6:00 AM to 6:29 AM | 420 (10.9%) | 341 (8.0%) |
| 6:30 AM to 6:59 AM | 542 (14.1%) | 478 (11.3%) |
| 7:00 AM to 7:29 AM | 525 (13.6%) | 523 (12.3%) |
| 7:30 AM to 7:59 AM | 259 (6.7%) | 599 (14.1%) |
| 8:00 AM to 8:29 AM | 156 (4.1%) | 247 (5.8%) |
| 8:30 AM to 8:59 AM | 90 (2.3%) | 103 (2.4%) |
| 9:00 AM to 9:59 AM | 80 (2.1%) | 191 (4.5%) |
| 10:00 AM to 10:59 AM | 8 (0.2%) | 183 (4.3%) |
| 11:00 AM to 11:59 AM | 23 (0.6%) | 72 (1.7%) |
| 12:00 PM to 3:59 PM | 333 (8.6%) | 378 (8.9%) |
| 4:00 PM to 11:59 PM | 654 (17.0%) | 677 (15.9%) |
| Total | 3,850 (100.0%) | 4,250 (100.0%) |
Housing Occupancy in Wisconsin Rapids
Occupancy by Ownership in Wisconsin Rapids
Of the total 8,527 dwellings in Wisconsin Rapids, owner-occupied units account for 4,638 (54.4%), while renter-occupied units make up 3,889 (45.6%).
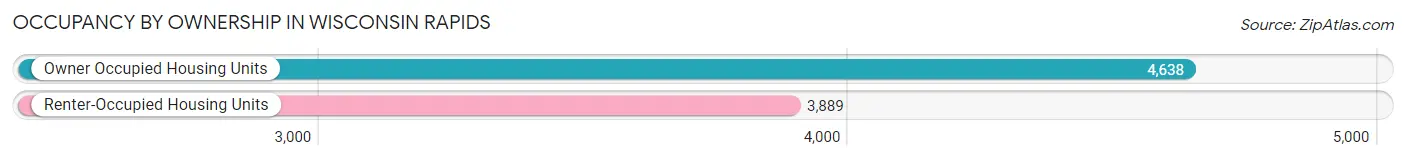
| Occupancy | # Housing Units | % Housing Units |
| Owner Occupied Housing Units | 4,638 | 54.4% |
| Renter-Occupied Housing Units | 3,889 | 45.6% |
| Total Occupied Housing Units | 8,527 | 100.0% |
Occupancy by Household Size in Wisconsin Rapids
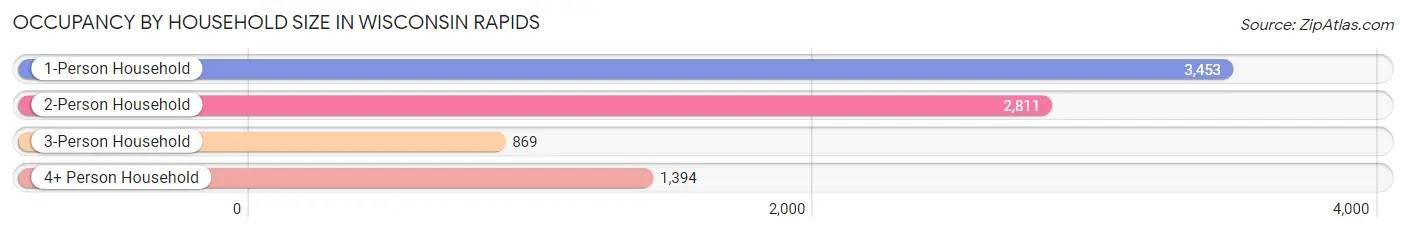
| Household Size | # Housing Units | % Housing Units |
| 1-Person Household | 3,453 | 40.5% |
| 2-Person Household | 2,811 | 33.0% |
| 3-Person Household | 869 | 10.2% |
| 4+ Person Household | 1,394 | 16.4% |
| Total Housing Units | 8,527 | 100.0% |
Occupancy by Ownership by Household Size in Wisconsin Rapids
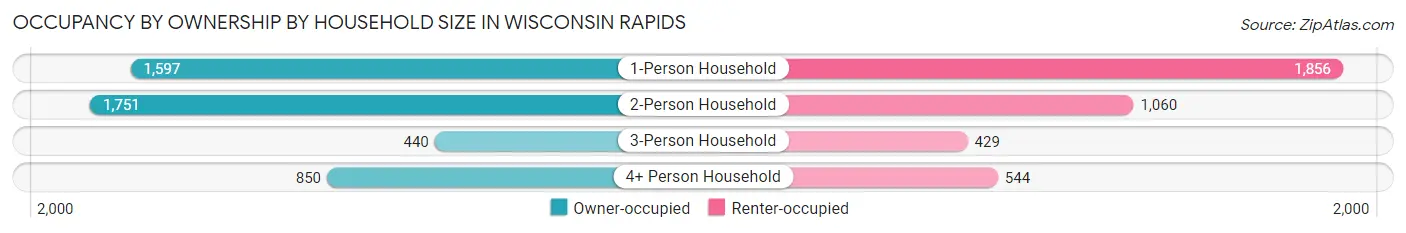
| Household Size | Owner-occupied | Renter-occupied |
| 1-Person Household | 1,597 (46.3%) | 1,856 (53.7%) |
| 2-Person Household | 1,751 (62.3%) | 1,060 (37.7%) |
| 3-Person Household | 440 (50.6%) | 429 (49.4%) |
| 4+ Person Household | 850 (61.0%) | 544 (39.0%) |
| Total Housing Units | 4,638 (54.4%) | 3,889 (45.6%) |
Occupancy by Educational Attainment in Wisconsin Rapids
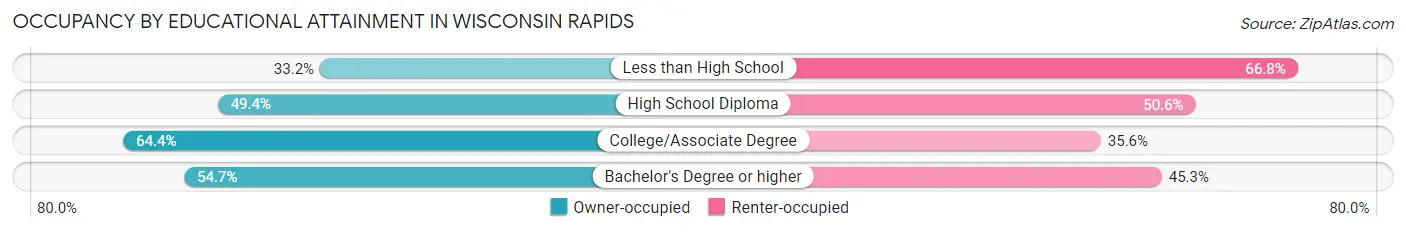
| Household Size | Owner-occupied | Renter-occupied |
| Less than High School | 186 (33.2%) | 375 (66.8%) |
| High School Diploma | 1,725 (49.4%) | 1,769 (50.6%) |
| College/Associate Degree | 1,871 (64.4%) | 1,036 (35.6%) |
| Bachelor's Degree or higher | 856 (54.7%) | 709 (45.3%) |
Occupancy by Age of Householder in Wisconsin Rapids
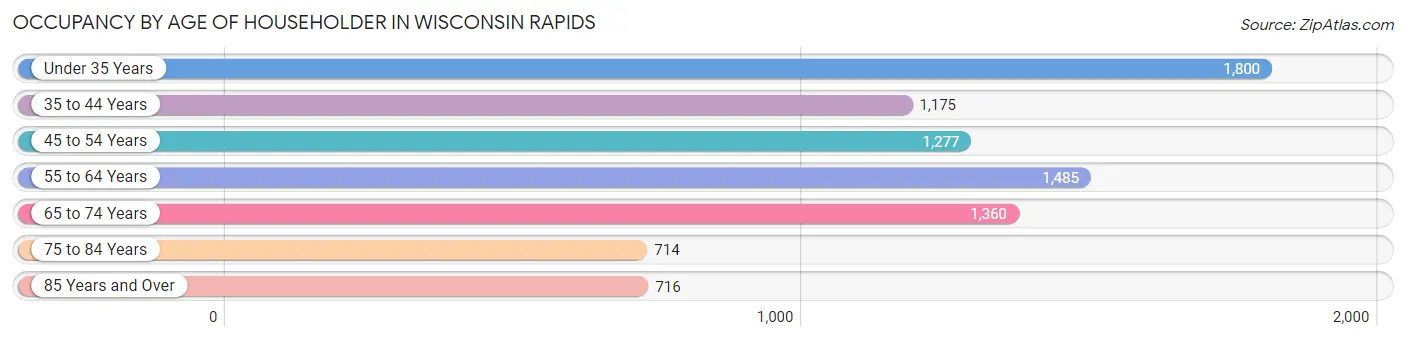
| Age Bracket | # Households | % Households |
| Under 35 Years | 1,800 | 21.1% |
| 35 to 44 Years | 1,175 | 13.8% |
| 45 to 54 Years | 1,277 | 15.0% |
| 55 to 64 Years | 1,485 | 17.4% |
| 65 to 74 Years | 1,360 | 16.0% |
| 75 to 84 Years | 714 | 8.4% |
| 85 Years and Over | 716 | 8.4% |
| Total | 8,527 | 100.0% |
Housing Finances in Wisconsin Rapids
Median Income by Occupancy in Wisconsin Rapids
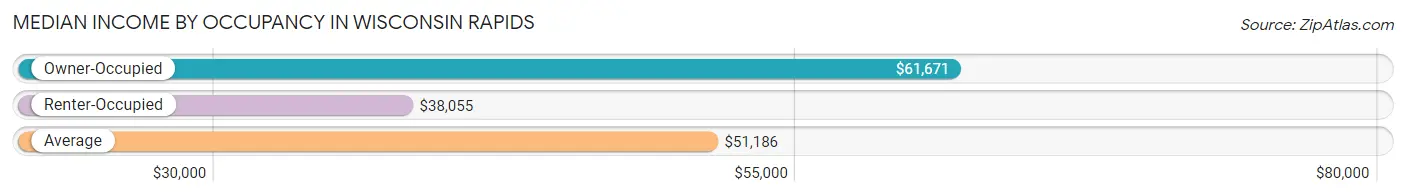
| Occupancy Type | # Households | Median Income |
| Owner-Occupied | 4,638 (54.4%) | $61,671 |
| Renter-Occupied | 3,889 (45.6%) | $38,055 |
| Average | 8,527 (100.0%) | $51,186 |
Occupancy by Householder Income Bracket in Wisconsin Rapids
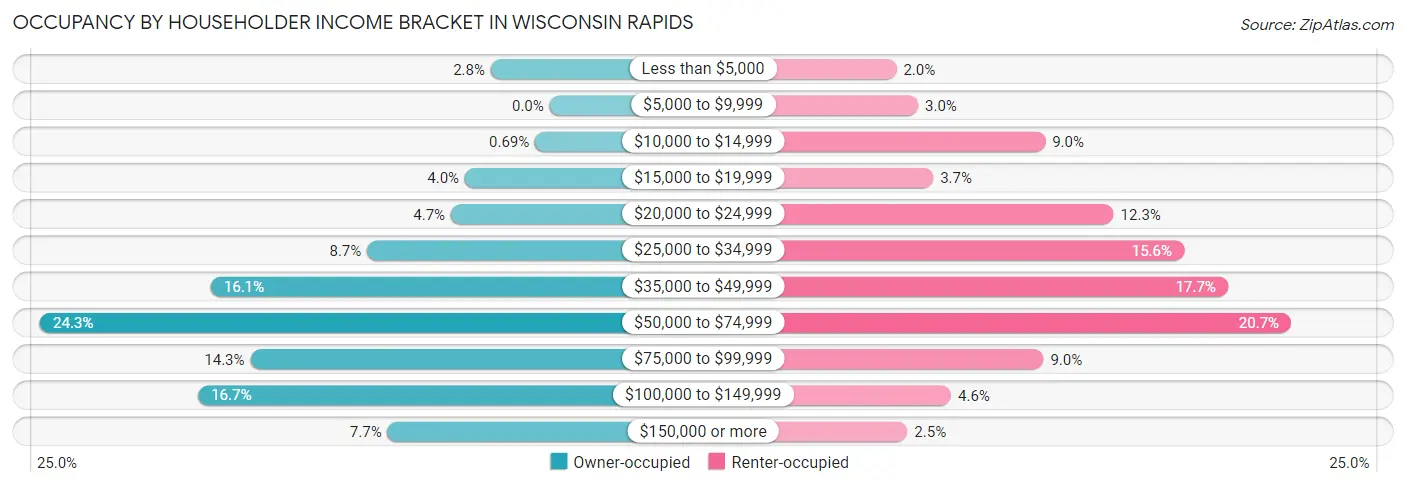
| Income Bracket | Owner-occupied | Renter-occupied |
| Less than $5,000 | 130 (2.8%) | 76 (1.9%) |
| $5,000 to $9,999 | 0 (0.0%) | 116 (3.0%) |
| $10,000 to $14,999 | 32 (0.7%) | 351 (9.0%) |
| $15,000 to $19,999 | 187 (4.0%) | 144 (3.7%) |
| $20,000 to $24,999 | 218 (4.7%) | 478 (12.3%) |
| $25,000 to $34,999 | 403 (8.7%) | 608 (15.6%) |
| $35,000 to $49,999 | 748 (16.1%) | 689 (17.7%) |
| $50,000 to $74,999 | 1,125 (24.3%) | 806 (20.7%) |
| $75,000 to $99,999 | 661 (14.2%) | 348 (8.9%) |
| $100,000 to $149,999 | 776 (16.7%) | 177 (4.5%) |
| $150,000 or more | 358 (7.7%) | 96 (2.5%) |
| Total | 4,638 (100.0%) | 3,889 (100.0%) |
Monthly Housing Cost Tiers in Wisconsin Rapids
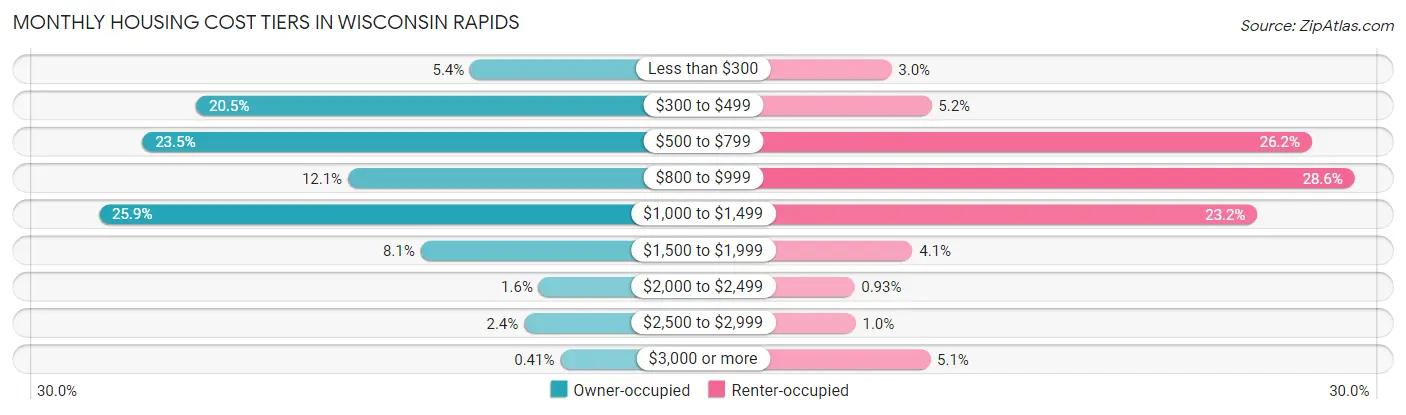
| Monthly Cost | Owner-occupied | Renter-occupied |
| Less than $300 | 250 (5.4%) | 116 (3.0%) |
| $300 to $499 | 952 (20.5%) | 202 (5.2%) |
| $500 to $799 | 1,090 (23.5%) | 1,019 (26.2%) |
| $800 to $999 | 563 (12.1%) | 1,111 (28.6%) |
| $1,000 to $1,499 | 1,201 (25.9%) | 902 (23.2%) |
| $1,500 to $1,999 | 377 (8.1%) | 161 (4.1%) |
| $2,000 to $2,499 | 74 (1.6%) | 36 (0.9%) |
| $2,500 to $2,999 | 112 (2.4%) | 39 (1.0%) |
| $3,000 or more | 19 (0.4%) | 199 (5.1%) |
| Total | 4,638 (100.0%) | 3,889 (100.0%) |
Physical Housing Characteristics in Wisconsin Rapids
Housing Structures in Wisconsin Rapids
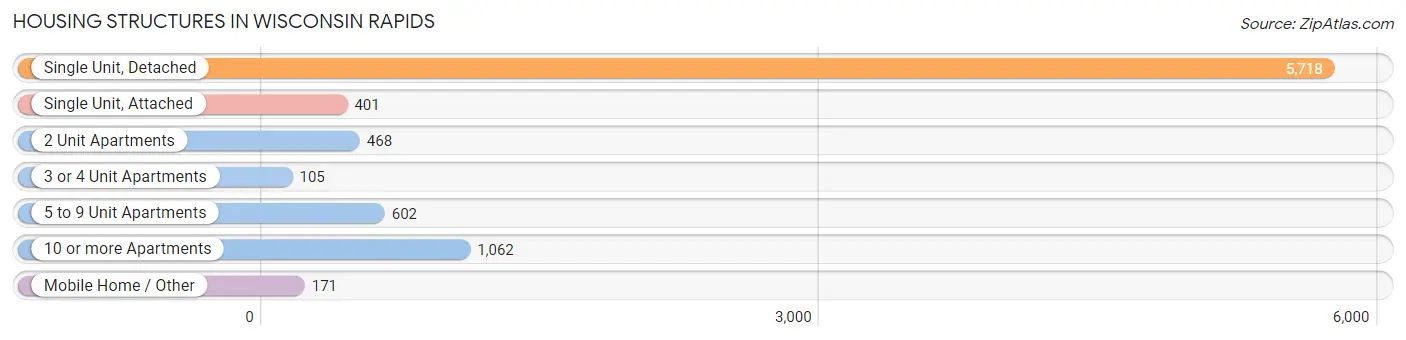
| Structure Type | # Housing Units | % Housing Units |
| Single Unit, Detached | 5,718 | 67.1% |
| Single Unit, Attached | 401 | 4.7% |
| 2 Unit Apartments | 468 | 5.5% |
| 3 or 4 Unit Apartments | 105 | 1.2% |
| 5 to 9 Unit Apartments | 602 | 7.1% |
| 10 or more Apartments | 1,062 | 12.4% |
| Mobile Home / Other | 171 | 2.0% |
| Total | 8,527 | 100.0% |
Housing Structures by Occupancy in Wisconsin Rapids
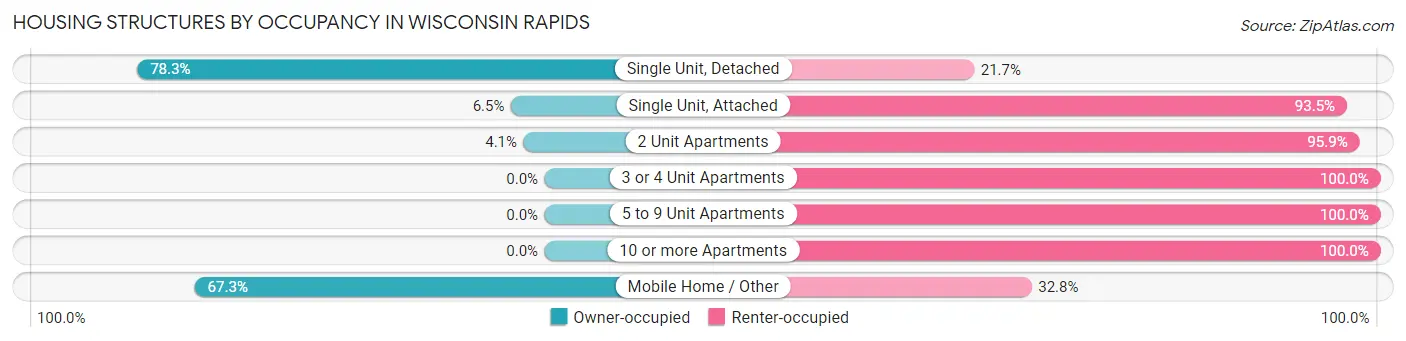
| Structure Type | Owner-occupied | Renter-occupied |
| Single Unit, Detached | 4,478 (78.3%) | 1,240 (21.7%) |
| Single Unit, Attached | 26 (6.5%) | 375 (93.5%) |
| 2 Unit Apartments | 19 (4.1%) | 449 (95.9%) |
| 3 or 4 Unit Apartments | 0 (0.0%) | 105 (100.0%) |
| 5 to 9 Unit Apartments | 0 (0.0%) | 602 (100.0%) |
| 10 or more Apartments | 0 (0.0%) | 1,062 (100.0%) |
| Mobile Home / Other | 115 (67.2%) | 56 (32.8%) |
| Total | 4,638 (54.4%) | 3,889 (45.6%) |
Housing Structures by Number of Rooms in Wisconsin Rapids
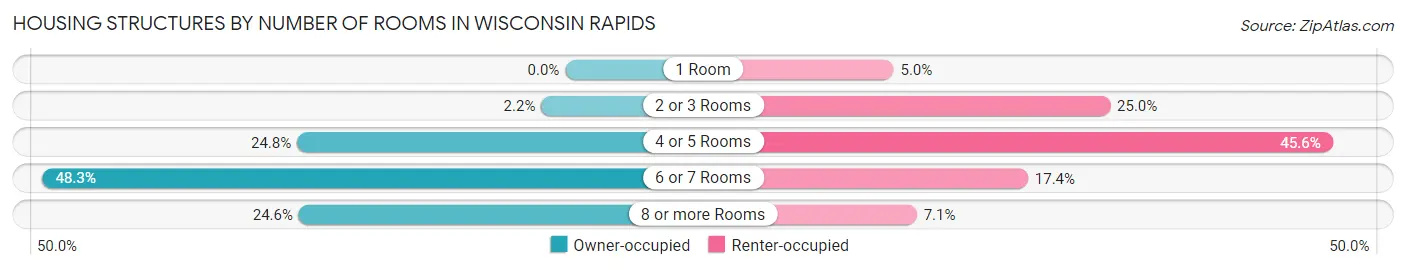
| Number of Rooms | Owner-occupied | Renter-occupied |
| 1 Room | 0 (0.0%) | 193 (5.0%) |
| 2 or 3 Rooms | 103 (2.2%) | 972 (25.0%) |
| 4 or 5 Rooms | 1,150 (24.8%) | 1,772 (45.6%) |
| 6 or 7 Rooms | 2,242 (48.3%) | 676 (17.4%) |
| 8 or more Rooms | 1,143 (24.6%) | 276 (7.1%) |
| Total | 4,638 (100.0%) | 3,889 (100.0%) |
Housing Structure by Heating Type in Wisconsin Rapids
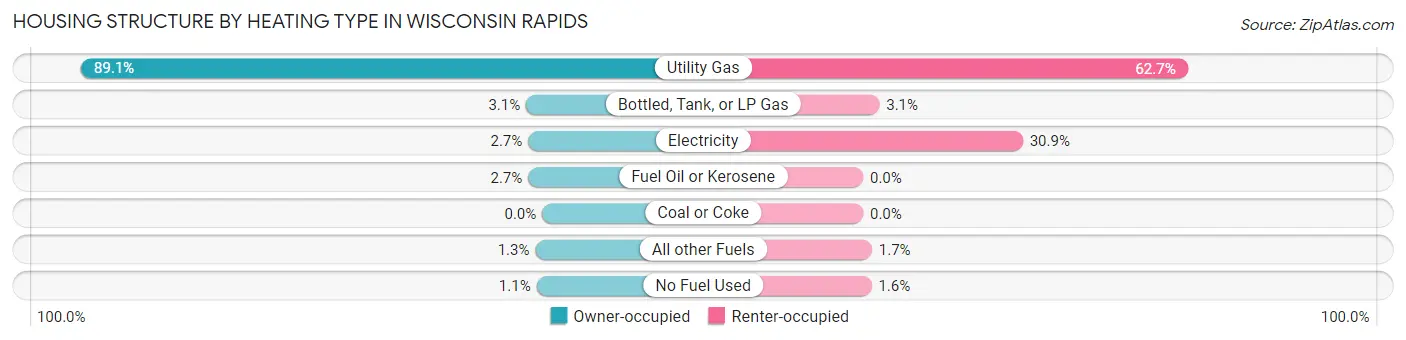
| Heating Type | Owner-occupied | Renter-occupied |
| Utility Gas | 4,133 (89.1%) | 2,438 (62.7%) |
| Bottled, Tank, or LP Gas | 144 (3.1%) | 122 (3.1%) |
| Electricity | 125 (2.7%) | 1,200 (30.9%) |
| Fuel Oil or Kerosene | 125 (2.7%) | 0 (0.0%) |
| Coal or Coke | 0 (0.0%) | 0 (0.0%) |
| All other Fuels | 61 (1.3%) | 66 (1.7%) |
| No Fuel Used | 50 (1.1%) | 63 (1.6%) |
| Total | 4,638 (100.0%) | 3,889 (100.0%) |
Household Vehicle Usage in Wisconsin Rapids
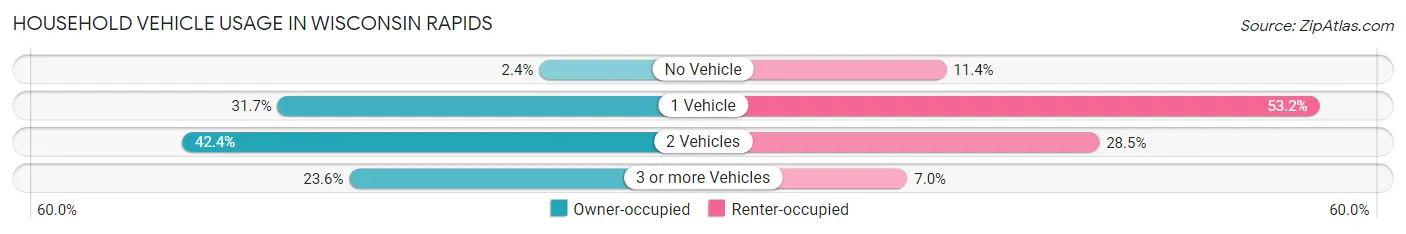
| Vehicles per Household | Owner-occupied | Renter-occupied |
| No Vehicle | 109 (2.4%) | 442 (11.4%) |
| 1 Vehicle | 1,468 (31.7%) | 2,067 (53.1%) |
| 2 Vehicles | 1,965 (42.4%) | 1,108 (28.5%) |
| 3 or more Vehicles | 1,096 (23.6%) | 272 (7.0%) |
| Total | 4,638 (100.0%) | 3,889 (100.0%) |
Real Estate & Mortgages in Wisconsin Rapids
Real Estate and Mortgage Overview in Wisconsin Rapids
| Characteristic | Without Mortgage | With Mortgage |
| Housing Units | 2,061 | 2,577 |
| Median Property Value | $98,600 | $118,000 |
| Median Household Income | $53,724 | $208 |
| Monthly Housing Costs | $470 | $19 |
| Real Estate Taxes | $1,988 | $0 |
Property Value by Mortgage Status in Wisconsin Rapids
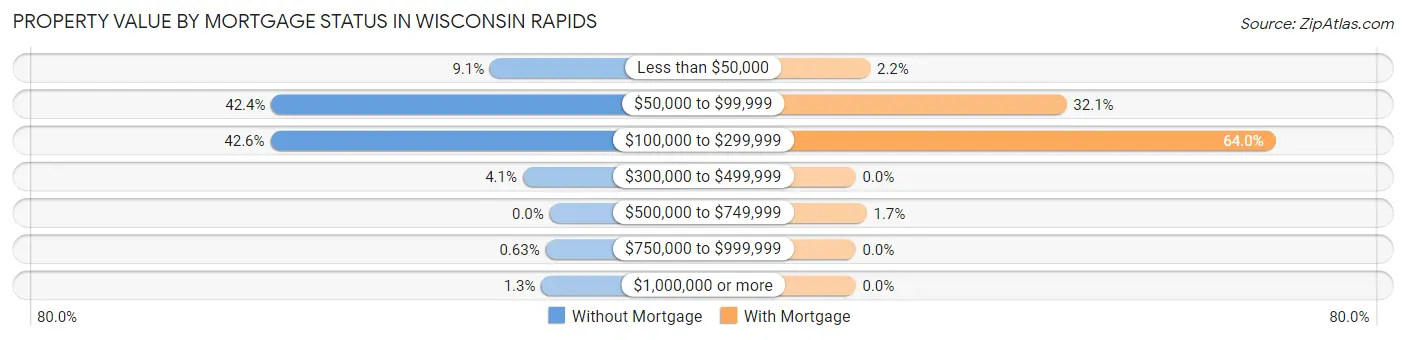
| Property Value | Without Mortgage | With Mortgage |
| Less than $50,000 | 187 (9.1%) | 57 (2.2%) |
| $50,000 to $99,999 | 874 (42.4%) | 828 (32.1%) |
| $100,000 to $299,999 | 877 (42.5%) | 1,649 (64.0%) |
| $300,000 to $499,999 | 84 (4.1%) | 0 (0.0%) |
| $500,000 to $749,999 | 0 (0.0%) | 43 (1.7%) |
| $750,000 to $999,999 | 13 (0.6%) | 0 (0.0%) |
| $1,000,000 or more | 26 (1.3%) | 0 (0.0%) |
| Total | 2,061 (100.0%) | 2,577 (100.0%) |
Household Income by Mortgage Status in Wisconsin Rapids
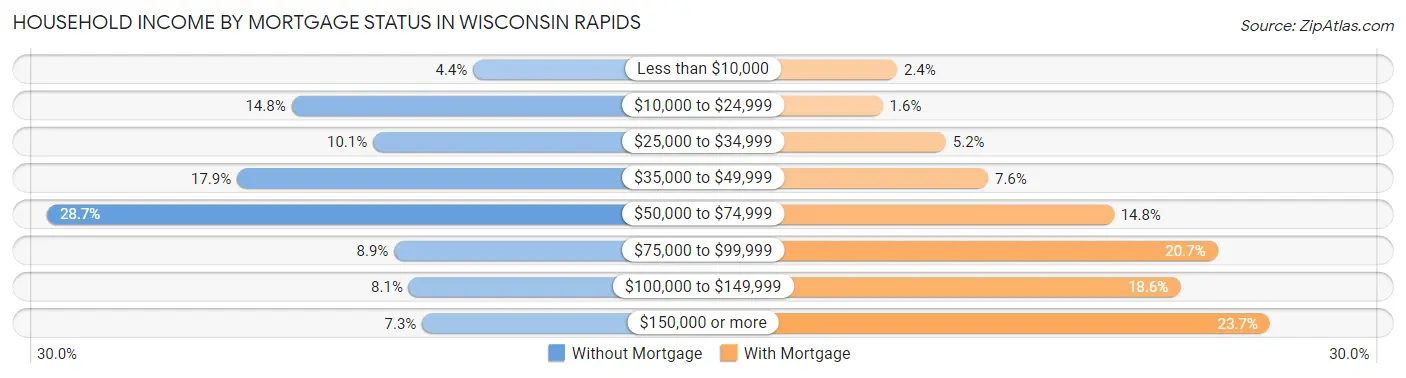
| Household Income | Without Mortgage | With Mortgage |
| Less than $10,000 | 90 (4.4%) | 61 (2.4%) |
| $10,000 to $24,999 | 304 (14.7%) | 40 (1.5%) |
| $25,000 to $34,999 | 208 (10.1%) | 133 (5.2%) |
| $35,000 to $49,999 | 368 (17.9%) | 195 (7.6%) |
| $50,000 to $74,999 | 592 (28.7%) | 380 (14.7%) |
| $75,000 to $99,999 | 183 (8.9%) | 533 (20.7%) |
| $100,000 to $149,999 | 166 (8.1%) | 478 (18.5%) |
| $150,000 or more | 150 (7.3%) | 610 (23.7%) |
| Total | 2,061 (100.0%) | 2,577 (100.0%) |
Property Value to Household Income Ratio in Wisconsin Rapids
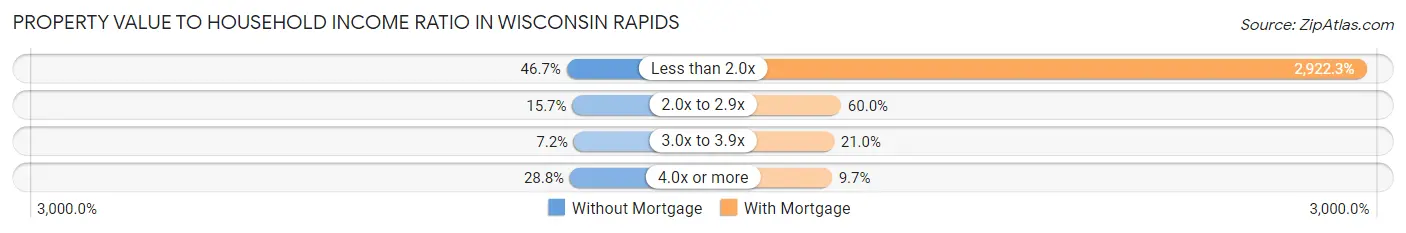
| Value-to-Income Ratio | Without Mortgage | With Mortgage |
| Less than 2.0x | 962 (46.7%) | 75,307 (2,922.3%) |
| 2.0x to 2.9x | 324 (15.7%) | 1,545 (60.0%) |
| 3.0x to 3.9x | 149 (7.2%) | 541 (21.0%) |
| 4.0x or more | 594 (28.8%) | 250 (9.7%) |
| Total | 2,061 (100.0%) | 2,577 (100.0%) |
Real Estate Taxes by Mortgage Status in Wisconsin Rapids
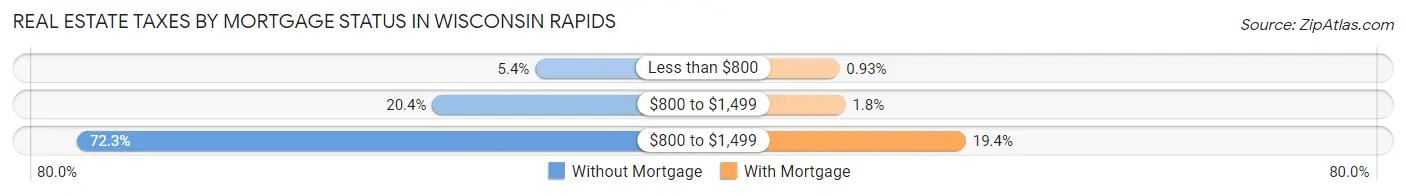
| Property Taxes | Without Mortgage | With Mortgage |
| Less than $800 | 111 (5.4%) | 24 (0.9%) |
| $800 to $1,499 | 421 (20.4%) | 47 (1.8%) |
| $800 to $1,499 | 1,491 (72.3%) | 500 (19.4%) |
| Total | 2,061 (100.0%) | 2,577 (100.0%) |
Health & Disability in Wisconsin Rapids
Health Insurance Coverage by Age in Wisconsin Rapids
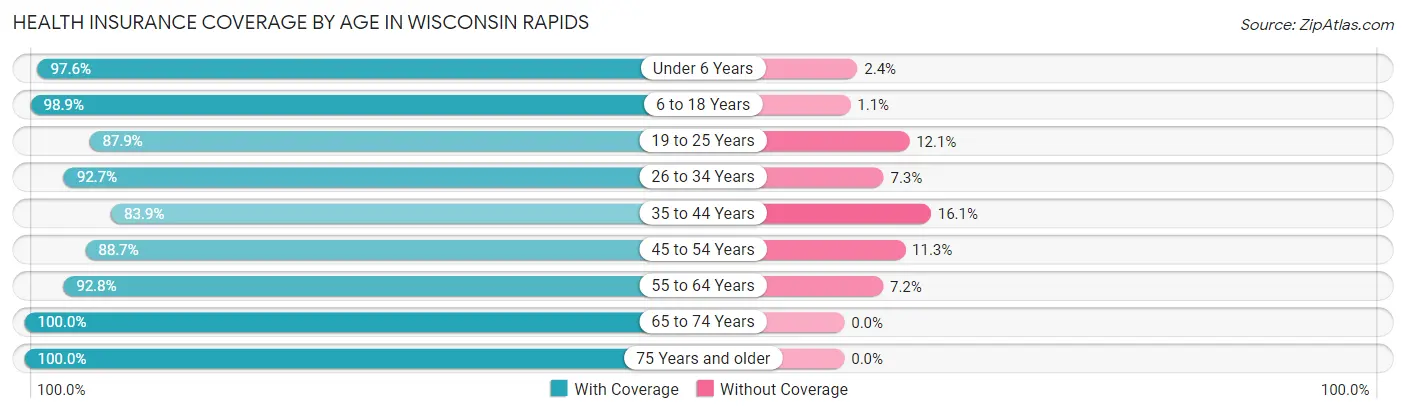
| Age Bracket | With Coverage | Without Coverage |
| Under 6 Years | 1,239 (97.6%) | 31 (2.4%) |
| 6 to 18 Years | 3,150 (98.9%) | 36 (1.1%) |
| 19 to 25 Years | 1,634 (87.9%) | 225 (12.1%) |
| 26 to 34 Years | 1,989 (92.7%) | 157 (7.3%) |
| 35 to 44 Years | 1,742 (83.9%) | 335 (16.1%) |
| 45 to 54 Years | 1,822 (88.7%) | 233 (11.3%) |
| 55 to 64 Years | 2,186 (92.8%) | 170 (7.2%) |
| 65 to 74 Years | 1,791 (100.0%) | 0 (0.0%) |
| 75 Years and older | 1,807 (100.0%) | 0 (0.0%) |
| Total | 17,360 (93.6%) | 1,187 (6.4%) |
Health Insurance Coverage by Citizenship Status in Wisconsin Rapids
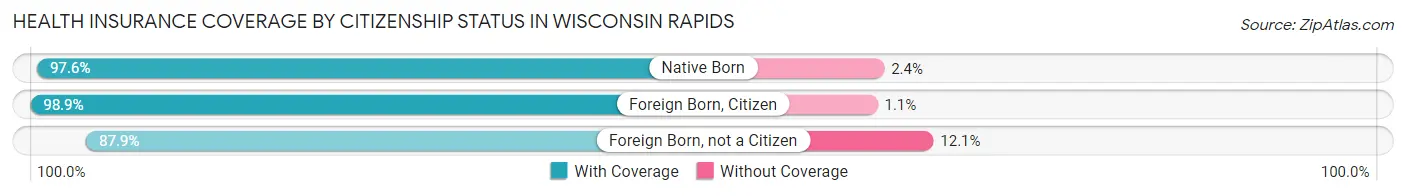
| Citizenship Status | With Coverage | Without Coverage |
| Native Born | 1,239 (97.6%) | 31 (2.4%) |
| Foreign Born, Citizen | 3,150 (98.9%) | 36 (1.1%) |
| Foreign Born, not a Citizen | 1,634 (87.9%) | 225 (12.1%) |
Health Insurance Coverage by Household Income in Wisconsin Rapids
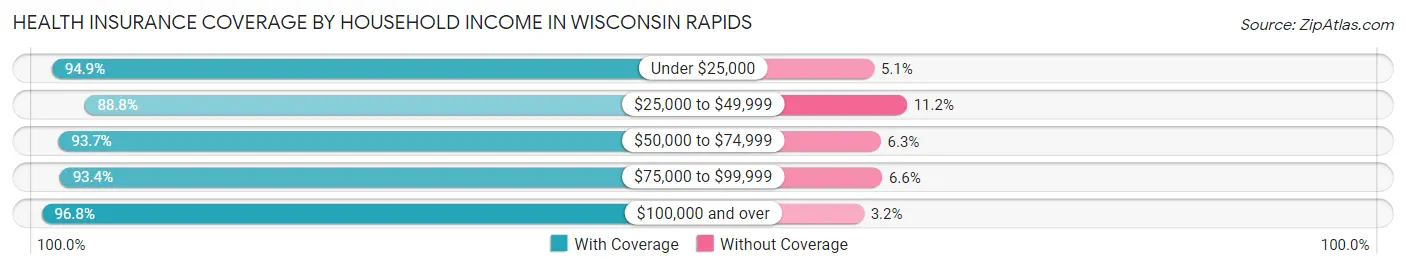
| Household Income | With Coverage | Without Coverage |
| Under $25,000 | 2,437 (94.9%) | 131 (5.1%) |
| $25,000 to $49,999 | 3,628 (88.8%) | 459 (11.2%) |
| $50,000 to $74,999 | 3,946 (93.7%) | 267 (6.3%) |
| $75,000 to $99,999 | 2,552 (93.4%) | 180 (6.6%) |
| $100,000 and over | 4,545 (96.8%) | 149 (3.2%) |
Public vs Private Health Insurance Coverage by Age in Wisconsin Rapids
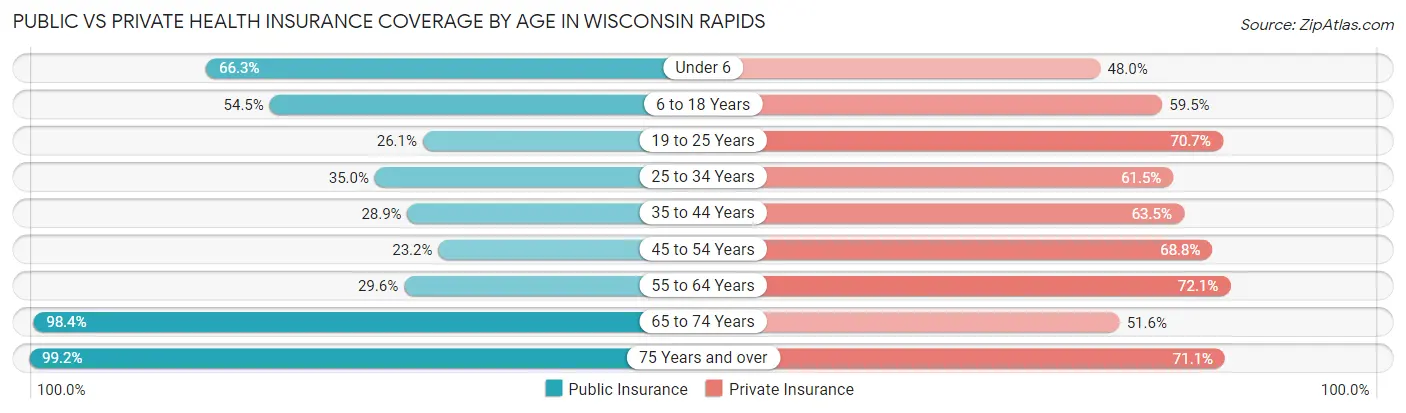
| Age Bracket | Public Insurance | Private Insurance |
| Under 6 | 842 (66.3%) | 610 (48.0%) |
| 6 to 18 Years | 1,737 (54.5%) | 1,896 (59.5%) |
| 19 to 25 Years | 485 (26.1%) | 1,314 (70.7%) |
| 25 to 34 Years | 751 (35.0%) | 1,320 (61.5%) |
| 35 to 44 Years | 601 (28.9%) | 1,318 (63.5%) |
| 45 to 54 Years | 477 (23.2%) | 1,413 (68.8%) |
| 55 to 64 Years | 697 (29.6%) | 1,698 (72.1%) |
| 65 to 74 Years | 1,762 (98.4%) | 924 (51.6%) |
| 75 Years and over | 1,792 (99.2%) | 1,285 (71.1%) |
| Total | 9,144 (49.3%) | 11,778 (63.5%) |
Disability Status by Sex by Age in Wisconsin Rapids
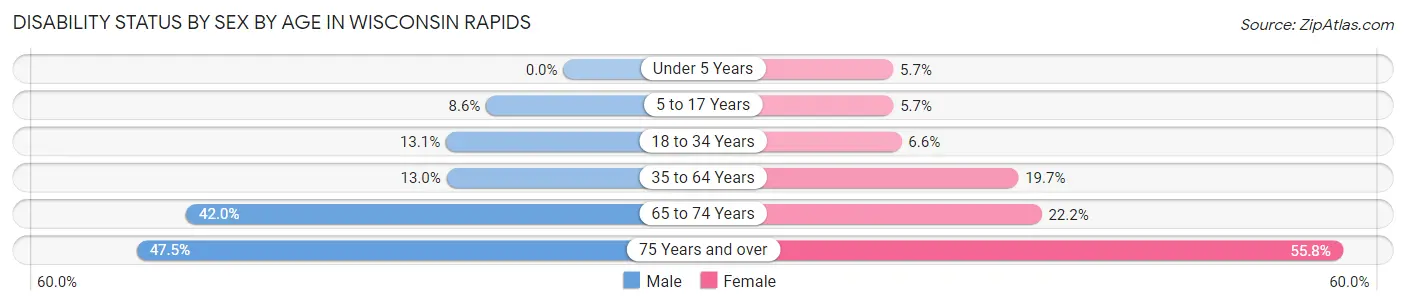
| Age Bracket | Male | Female |
| Under 5 Years | 0 (0.0%) | 31 (5.7%) |
| 5 to 17 Years | 139 (8.6%) | 91 (5.7%) |
| 18 to 34 Years | 247 (13.1%) | 158 (6.6%) |
| 35 to 64 Years | 403 (13.0%) | 666 (19.7%) |
| 65 to 74 Years | 284 (42.0%) | 248 (22.2%) |
| 75 Years and over | 315 (47.5%) | 638 (55.8%) |
Disability Class by Sex by Age in Wisconsin Rapids
Disability Class: Hearing Difficulty
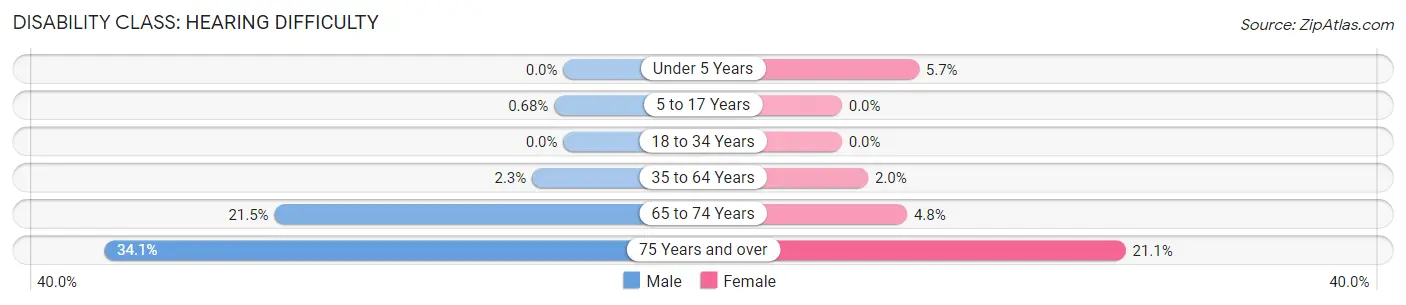
| Age Bracket | Male | Female |
| Under 5 Years | 0 (0.0%) | 31 (5.7%) |
| 5 to 17 Years | 11 (0.7%) | 0 (0.0%) |
| 18 to 34 Years | 0 (0.0%) | 0 (0.0%) |
| 35 to 64 Years | 72 (2.3%) | 66 (1.9%) |
| 65 to 74 Years | 145 (21.4%) | 54 (4.8%) |
| 75 Years and over | 226 (34.1%) | 241 (21.1%) |
Disability Class: Vision Difficulty
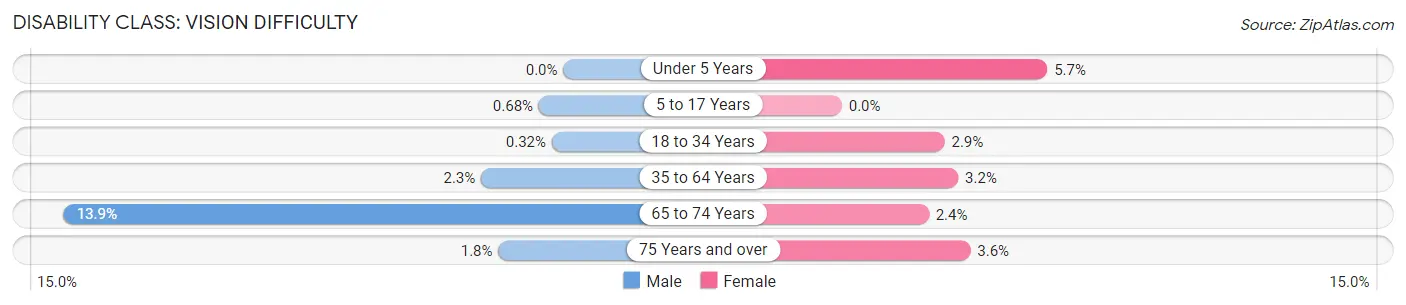
| Age Bracket | Male | Female |
| Under 5 Years | 0 (0.0%) | 31 (5.7%) |
| 5 to 17 Years | 11 (0.7%) | 0 (0.0%) |
| 18 to 34 Years | 6 (0.3%) | 68 (2.9%) |
| 35 to 64 Years | 71 (2.3%) | 110 (3.2%) |
| 65 to 74 Years | 94 (13.9%) | 27 (2.4%) |
| 75 Years and over | 12 (1.8%) | 41 (3.6%) |
Disability Class: Cognitive Difficulty
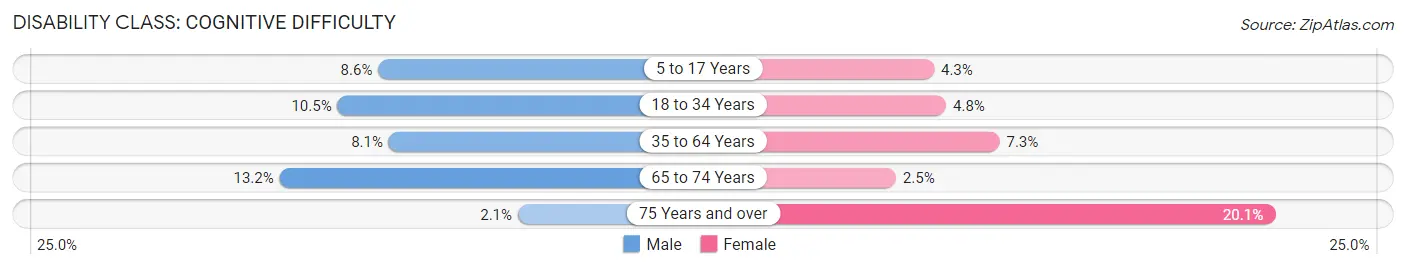
| Age Bracket | Male | Female |
| 5 to 17 Years | 139 (8.6%) | 68 (4.3%) |
| 18 to 34 Years | 198 (10.5%) | 115 (4.8%) |
| 35 to 64 Years | 251 (8.1%) | 248 (7.3%) |
| 65 to 74 Years | 89 (13.2%) | 28 (2.5%) |
| 75 Years and over | 14 (2.1%) | 230 (20.1%) |
Disability Class: Ambulatory Difficulty
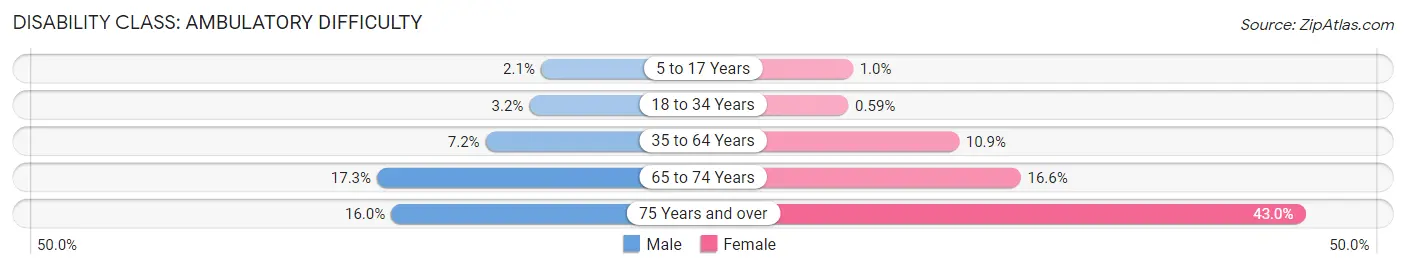
| Age Bracket | Male | Female |
| 5 to 17 Years | 34 (2.1%) | 16 (1.0%) |
| 18 to 34 Years | 60 (3.2%) | 14 (0.6%) |
| 35 to 64 Years | 224 (7.2%) | 368 (10.9%) |
| 65 to 74 Years | 117 (17.3%) | 185 (16.6%) |
| 75 Years and over | 106 (16.0%) | 492 (43.0%) |
Disability Class: Self-Care Difficulty
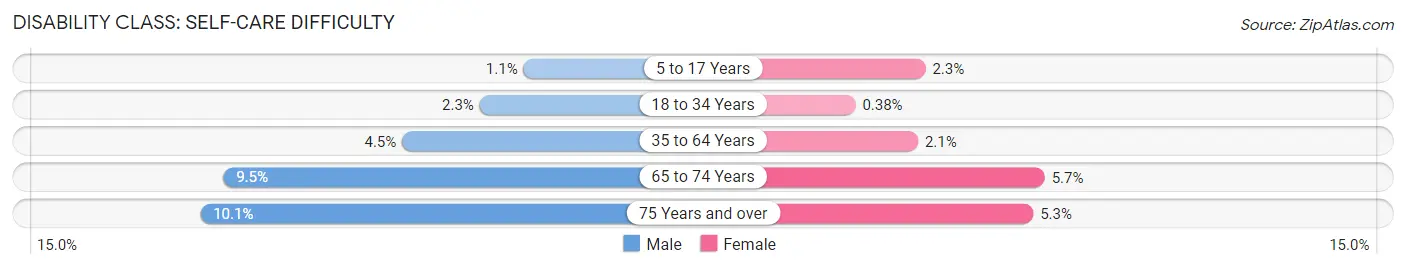
| Age Bracket | Male | Female |
| 5 to 17 Years | 18 (1.1%) | 37 (2.3%) |
| 18 to 34 Years | 44 (2.3%) | 9 (0.4%) |
| 35 to 64 Years | 139 (4.5%) | 72 (2.1%) |
| 65 to 74 Years | 64 (9.5%) | 63 (5.7%) |
| 75 Years and over | 67 (10.1%) | 61 (5.3%) |
Technology Access in Wisconsin Rapids
Computing Device Access in Wisconsin Rapids
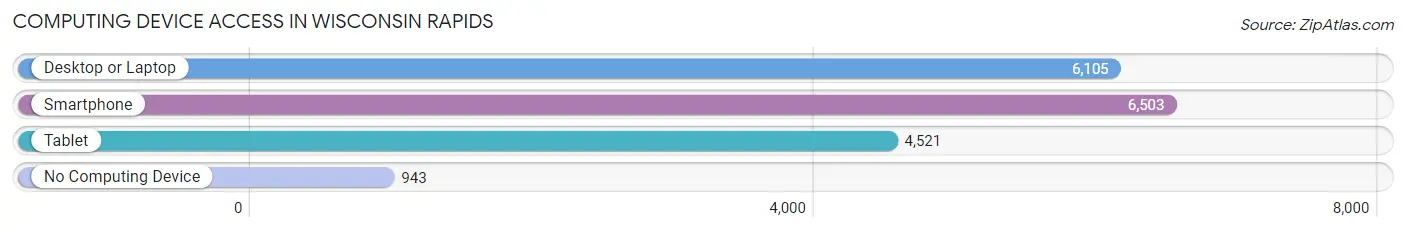
| Device Type | # Households | % Households |
| Desktop or Laptop | 6,105 | 71.6% |
| Smartphone | 6,503 | 76.3% |
| Tablet | 4,521 | 53.0% |
| No Computing Device | 943 | 11.1% |
| Total | 8,527 | 100.0% |
Internet Access in Wisconsin Rapids
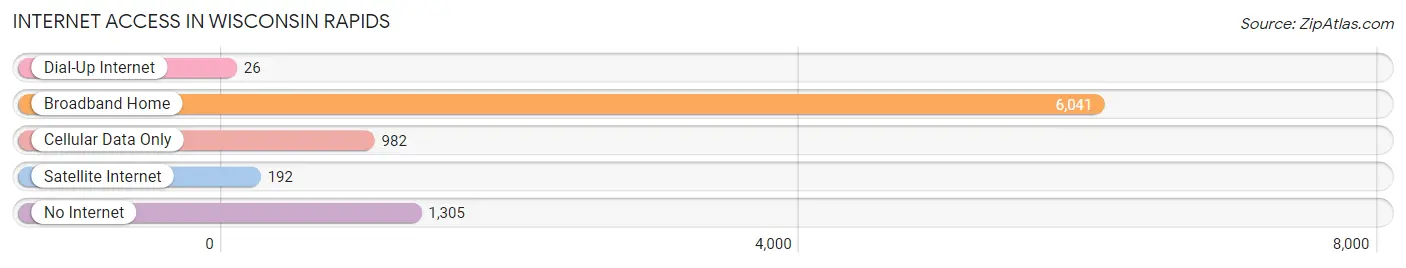
| Internet Type | # Households | % Households |
| Dial-Up Internet | 26 | 0.3% |
| Broadband Home | 6,041 | 70.9% |
| Cellular Data Only | 982 | 11.5% |
| Satellite Internet | 192 | 2.2% |
| No Internet | 1,305 | 15.3% |
| Total | 8,527 | 100.0% |
Wisconsin Rapids Summary
History
The city of Wisconsin Rapids, Wisconsin is located in the central part of the state in Wood County. It is situated on the Wisconsin River and is the county seat. The city was originally known as Grand Rapids, and was founded in 1856. The name was changed to Wisconsin Rapids in 1872.
The city was originally inhabited by the Ho-Chunk Native American tribe. The first white settlers arrived in the area in the early 1800s. The first sawmill was built in 1854, and the city was officially incorporated in 1856.
The city grew rapidly in the late 1800s and early 1900s due to the lumber industry. The city was home to several large sawmills and lumber companies, and the population grew to over 10,000 by 1910. The city was also home to several paper mills, which provided employment for many of the city’s residents.
The city experienced a decline in the lumber industry in the mid-1900s, and the population began to decline as well. The city’s economy shifted to focus on manufacturing and tourism. The city is now home to several large manufacturing companies, including Consolidated Papers, Inc., and the Wisconsin Rapids Wood Products Company.
The city is also home to several tourist attractions, including the Wisconsin Rapids Municipal Zoo, the Alexander House Museum, and the Wisconsin Rapids Historical Society.
Geography
Wisconsin Rapids is located in the central part of the state in Wood County. It is situated on the Wisconsin River and is the county seat. The city is located at the intersection of Interstate 39 and US Highway 10.
The city has a total area of 16.2 square miles, of which 15.9 square miles is land and 0.3 square miles is water. The city is located in a hilly region, with the highest point being at an elevation of 890 feet.
The climate in Wisconsin Rapids is classified as humid continental, with cold winters and hot, humid summers. The average annual temperature is 43.2 degrees Fahrenheit, and the average annual precipitation is 33.3 inches.
Economy
The economy of Wisconsin Rapids is largely based on manufacturing and tourism. The city is home to several large manufacturing companies, including Consolidated Papers, Inc., and the Wisconsin Rapids Wood Products Company.
The city is also home to several tourist attractions, including the Wisconsin Rapids Municipal Zoo, the Alexander House Museum, and the Wisconsin Rapids Historical Society.
The city has a low unemployment rate of 3.7%, which is lower than the national average. The median household income is $45,845, which is slightly lower than the national average.
Demographics
As of the 2010 census, the population of Wisconsin Rapids was 18,367. The population is predominantly white, with 91.3% of the population identifying as white. The city is also home to a small Hispanic population, with 4.3% of the population identifying as Hispanic or Latino.
The median age in Wisconsin Rapids is 38.7 years, and the median household income is $45,845. The city has a poverty rate of 13.2%, which is slightly higher than the national average.
Conclusion
Wisconsin Rapids is a city located in the central part of the state in Wood County. It is situated on the Wisconsin River and is the county seat. The city was originally known as Grand Rapids, and was founded in 1856. The city has a population of 18,367, and the economy is largely based on manufacturing and tourism. The city is home to several large manufacturing companies, and is also home to several tourist attractions. The median household income is $45,845, and the poverty rate is 13.2%.
Common Questions
What is Per Capita Income in Wisconsin Rapids?
Per Capita income in Wisconsin Rapids is $29,141.
What is the Median Family Income in Wisconsin Rapids?
Median Family Income in Wisconsin Rapids is $65,271.
What is the Median Household income in Wisconsin Rapids?
Median Household Income in Wisconsin Rapids is $51,186.
What is Income or Wage Gap in Wisconsin Rapids?
Income or Wage Gap in Wisconsin Rapids is 41.6%.
Women in Wisconsin Rapids earn 58.4 cents for every dollar earned by a man.
What is Inequality or Gini Index in Wisconsin Rapids?
Inequality or Gini Index in Wisconsin Rapids is 0.40.
What is the Total Population of Wisconsin Rapids?
Total Population of Wisconsin Rapids is 18,783.
What is the Total Male Population of Wisconsin Rapids?
Total Male Population of Wisconsin Rapids is 8,511.
What is the Total Female Population of Wisconsin Rapids?
Total Female Population of Wisconsin Rapids is 10,272.
What is the Ratio of Males per 100 Females in Wisconsin Rapids?
There are 82.86 Males per 100 Females in Wisconsin Rapids.
What is the Ratio of Females per 100 Males in Wisconsin Rapids?
There are 120.69 Females per 100 Males in Wisconsin Rapids.
What is the Median Population Age in Wisconsin Rapids?
Median Population Age in Wisconsin Rapids is 38.3 Years.
What is the Average Family Size in Wisconsin Rapids
Average Family Size in Wisconsin Rapids is 2.9 People.
What is the Average Household Size in Wisconsin Rapids
Average Household Size in Wisconsin Rapids is 2.1 People.
How Large is the Labor Force in Wisconsin Rapids?
There are 9,494 People in the Labor Forcein in Wisconsin Rapids.
What is the Percentage of People in the Labor Force in Wisconsin Rapids?
63.2% of People are in the Labor Force in Wisconsin Rapids.
What is the Unemployment Rate in Wisconsin Rapids?
Unemployment Rate in Wisconsin Rapids is 6.4%.