Spring Lake Park, MN Map & Demographics
Spring Lake Park Map
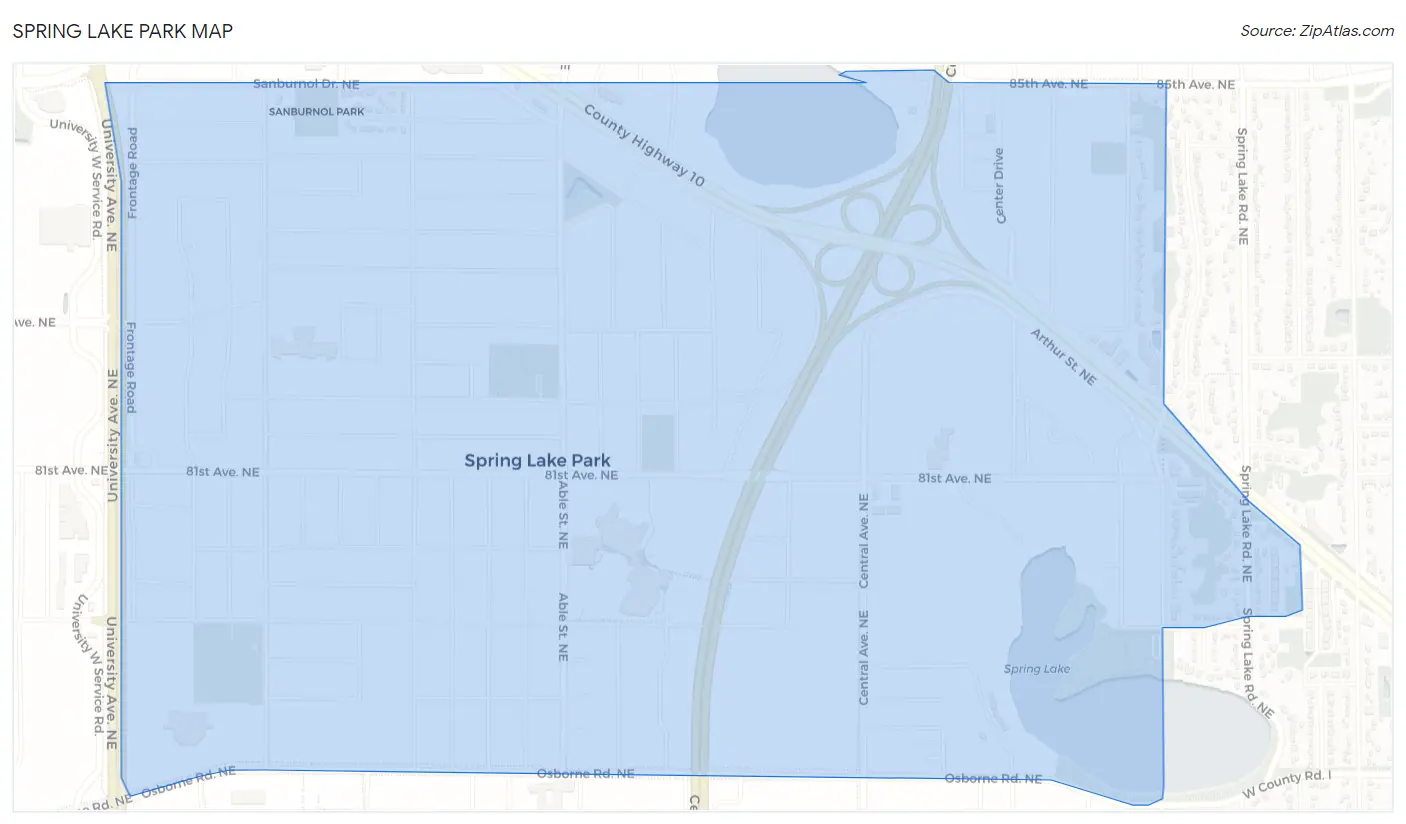
Spring Lake Park Overview
$34,355
PER CAPITA INCOME
$96,490
AVG FAMILY INCOME
$74,697
AVG HOUSEHOLD INCOME
19.5%
WAGE / INCOME GAP [ % ]
80.5¢/ $1
WAGE / INCOME GAP [ $ ]
$12,220
FAMILY INCOME DEFICIT
0.37
INEQUALITY / GINI INDEX
6,966
TOTAL POPULATION
3,477
MALE POPULATION
3,489
FEMALE POPULATION
99.66
MALES / 100 FEMALES
100.35
FEMALES / 100 MALES
41.4
MEDIAN AGE
3.2
AVG FAMILY SIZE
2.6
AVG HOUSEHOLD SIZE
3,574
LABOR FORCE [ PEOPLE ]
62.1%
PERCENT IN LABOR FORCE
2.7%
UNEMPLOYMENT RATE
Income in Spring Lake Park
Income Overview in Spring Lake Park
Per Capita Income in Spring Lake Park is $34,355, while median incomes of families and households are $96,490 and $74,697 respectively.
| Characteristic | Number | Measure |
| Per Capita Income | 6,966 | $34,355 |
| Median Family Income | 1,660 | $96,490 |
| Mean Family Income | 1,660 | $95,624 |
| Median Household Income | 2,658 | $74,697 |
| Mean Household Income | 2,658 | $85,889 |
| Income Deficit | 1,660 | $12,220 |
| Wage / Income Gap (%) | 6,966 | 19.47% |
| Wage / Income Gap ($) | 6,966 | 80.53¢ per $1 |
| Gini / Inequality Index | 6,966 | 0.37 |
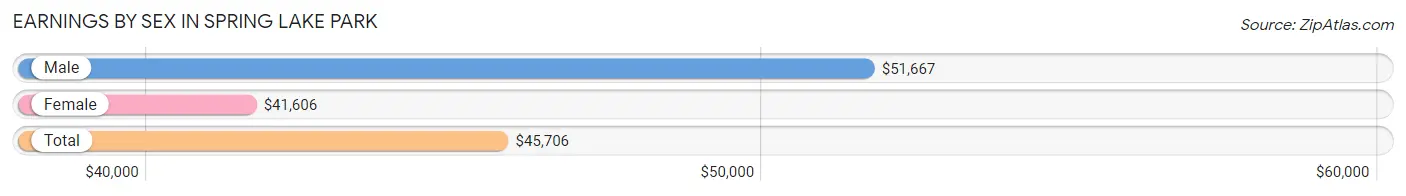
Earnings by Sex in Spring Lake Park
Average Earnings in Spring Lake Park are $45,706, $51,667 for men and $41,606 for women, a difference of 19.5%.
| Sex | Number | Average Earnings |
| Male | 2,050 (55.5%) | $51,667 |
| Female | 1,644 (44.5%) | $41,606 |
| Total | 3,694 (100.0%) | $45,706 |
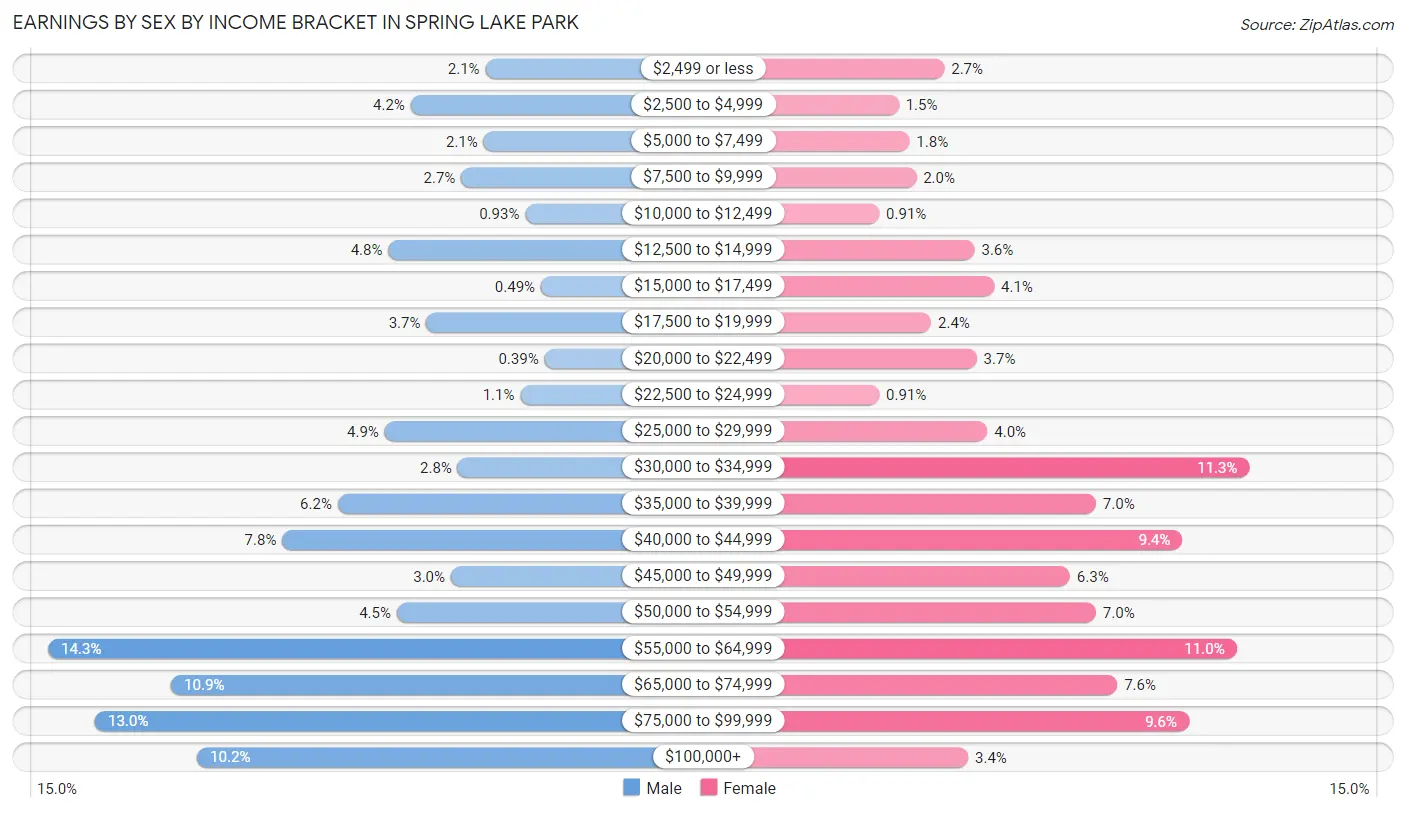
Earnings by Sex by Income Bracket in Spring Lake Park
The most common earnings brackets in Spring Lake Park are $55,000 to $64,999 for men (294 | 14.3%) and $30,000 to $34,999 for women (186 | 11.3%).
| Income | Male | Female |
| $2,499 or less | 42 (2.1%) | 45 (2.7%) |
| $2,500 to $4,999 | 85 (4.2%) | 24 (1.5%) |
| $5,000 to $7,499 | 43 (2.1%) | 29 (1.8%) |
| $7,500 to $9,999 | 56 (2.7%) | 32 (1.9%) |
| $10,000 to $12,499 | 19 (0.9%) | 15 (0.9%) |
| $12,500 to $14,999 | 98 (4.8%) | 59 (3.6%) |
| $15,000 to $17,499 | 10 (0.5%) | 68 (4.1%) |
| $17,500 to $19,999 | 76 (3.7%) | 39 (2.4%) |
| $20,000 to $22,499 | 8 (0.4%) | 60 (3.6%) |
| $22,500 to $24,999 | 22 (1.1%) | 15 (0.9%) |
| $25,000 to $29,999 | 100 (4.9%) | 65 (4.0%) |
| $30,000 to $34,999 | 58 (2.8%) | 186 (11.3%) |
| $35,000 to $39,999 | 127 (6.2%) | 115 (7.0%) |
| $40,000 to $44,999 | 159 (7.8%) | 155 (9.4%) |
| $45,000 to $49,999 | 62 (3.0%) | 103 (6.3%) |
| $50,000 to $54,999 | 93 (4.5%) | 115 (7.0%) |
| $55,000 to $64,999 | 294 (14.3%) | 180 (11.0%) |
| $65,000 to $74,999 | 223 (10.9%) | 125 (7.6%) |
| $75,000 to $99,999 | 267 (13.0%) | 158 (9.6%) |
| $100,000+ | 208 (10.2%) | 56 (3.4%) |
| Total | 2,050 (100.0%) | 1,644 (100.0%) |
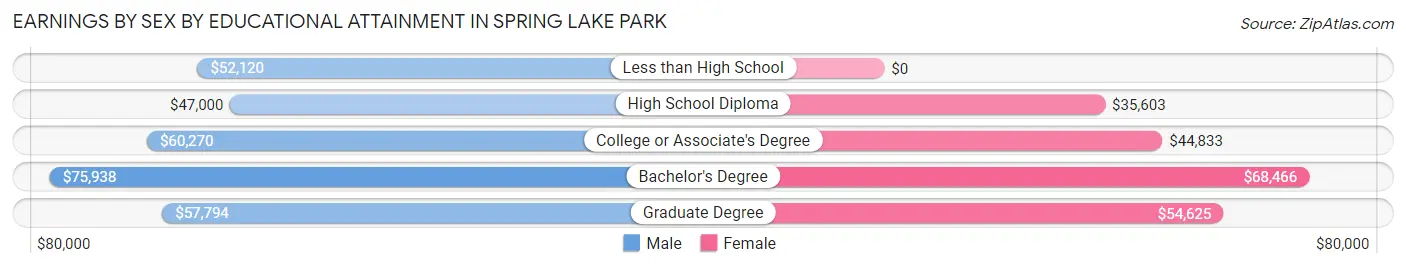
Earnings by Sex by Educational Attainment in Spring Lake Park
Average earnings in Spring Lake Park are $59,891 for men and $45,805 for women, a difference of 23.5%. Men with an educational attainment of bachelor's degree enjoy the highest average annual earnings of $75,938, while those with high school diploma education earn the least with $47,000. Women with an educational attainment of bachelor's degree earn the most with the average annual earnings of $68,466, while those with high school diploma education have the smallest earnings of $35,603.
| Educational Attainment | Male Income | Female Income |
| Less than High School | $52,120 | $0 |
| High School Diploma | $47,000 | $35,603 |
| College or Associate's Degree | $60,270 | $44,833 |
| Bachelor's Degree | $75,938 | $68,466 |
| Graduate Degree | $57,794 | $54,625 |
| Total | $59,891 | $45,805 |
Family Income in Spring Lake Park
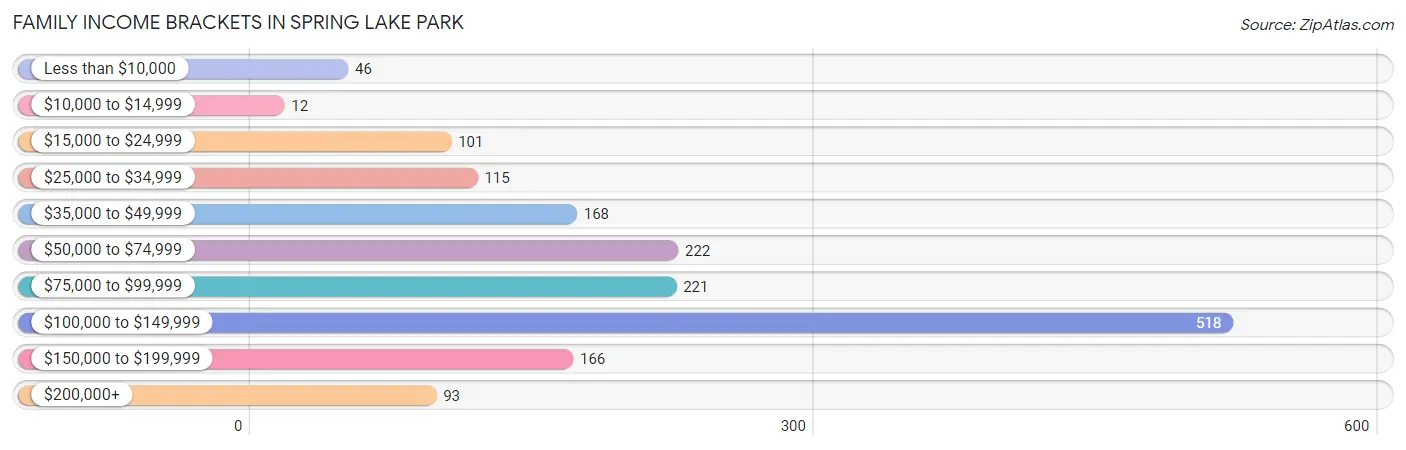
Family Income Brackets in Spring Lake Park
According to the Spring Lake Park family income data, there are 518 families falling into the $100,000 to $149,999 income range, which is the most common income bracket and makes up 31.2% of all families. Conversely, the $10,000 to $14,999 income bracket is the least frequent group with only 12 families (0.7%) belonging to this category.
| Income Bracket | # Families | % Families |
| Less than $10,000 | 46 | 2.8% |
| $10,000 to $14,999 | 12 | 0.7% |
| $15,000 to $24,999 | 101 | 6.1% |
| $25,000 to $34,999 | 115 | 6.9% |
| $35,000 to $49,999 | 168 | 10.1% |
| $50,000 to $74,999 | 222 | 13.4% |
| $75,000 to $99,999 | 221 | 13.3% |
| $100,000 to $149,999 | 518 | 31.2% |
| $150,000 to $199,999 | 166 | 10.0% |
| $200,000+ | 93 | 5.6% |
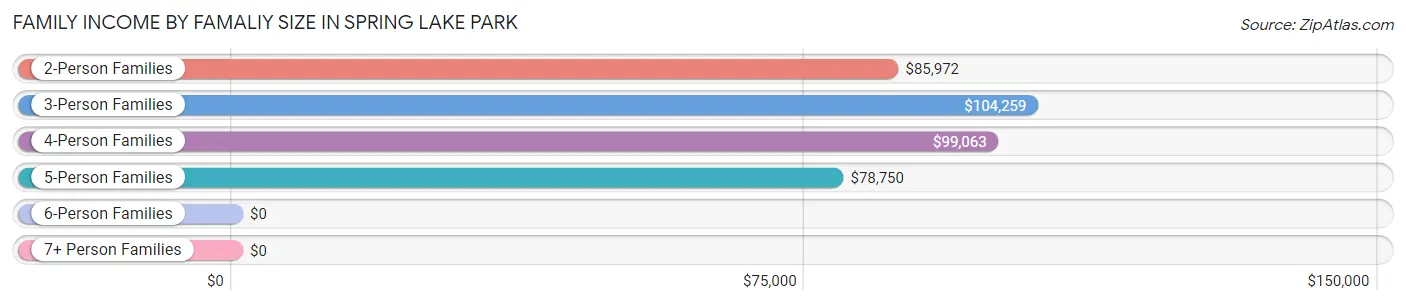
Family Income by Famaliy Size in Spring Lake Park
3-person families (386 | 23.3%) account for the highest median family income in Spring Lake Park with $104,259 per family, while 2-person families (769 | 46.3%) have the highest median income of $42,986 per family member.
| Income Bracket | # Families | Median Income |
| 2-Person Families | 769 (46.3%) | $85,972 |
| 3-Person Families | 386 (23.3%) | $104,259 |
| 4-Person Families | 336 (20.2%) | $99,063 |
| 5-Person Families | 127 (7.6%) | $78,750 |
| 6-Person Families | 23 (1.4%) | $0 |
| 7+ Person Families | 19 (1.1%) | $0 |
| Total | 1,660 (100.0%) | $96,490 |
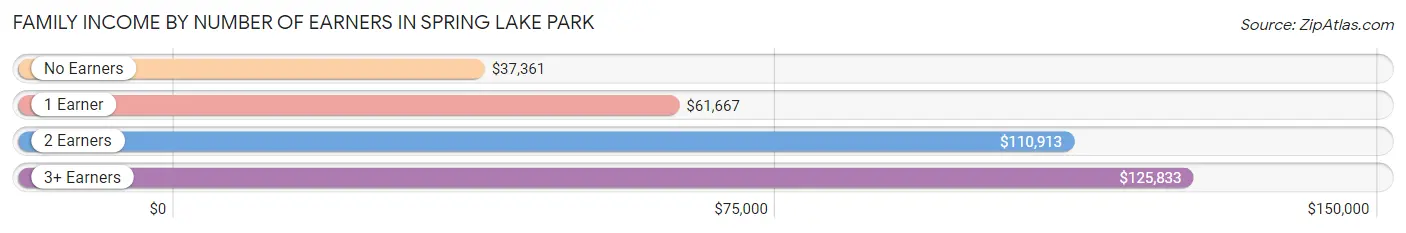
Family Income by Number of Earners in Spring Lake Park
The median family income in Spring Lake Park is $96,490, with families comprising 3+ earners (224) having the highest median family income of $125,833, while families with no earners (319) have the lowest median family income of $37,361, accounting for 13.5% and 19.2% of families, respectively.
| Number of Earners | # Families | Median Income |
| No Earners | 319 (19.2%) | $37,361 |
| 1 Earner | 442 (26.6%) | $61,667 |
| 2 Earners | 675 (40.7%) | $110,913 |
| 3+ Earners | 224 (13.5%) | $125,833 |
| Total | 1,660 (100.0%) | $96,490 |
Household Income in Spring Lake Park
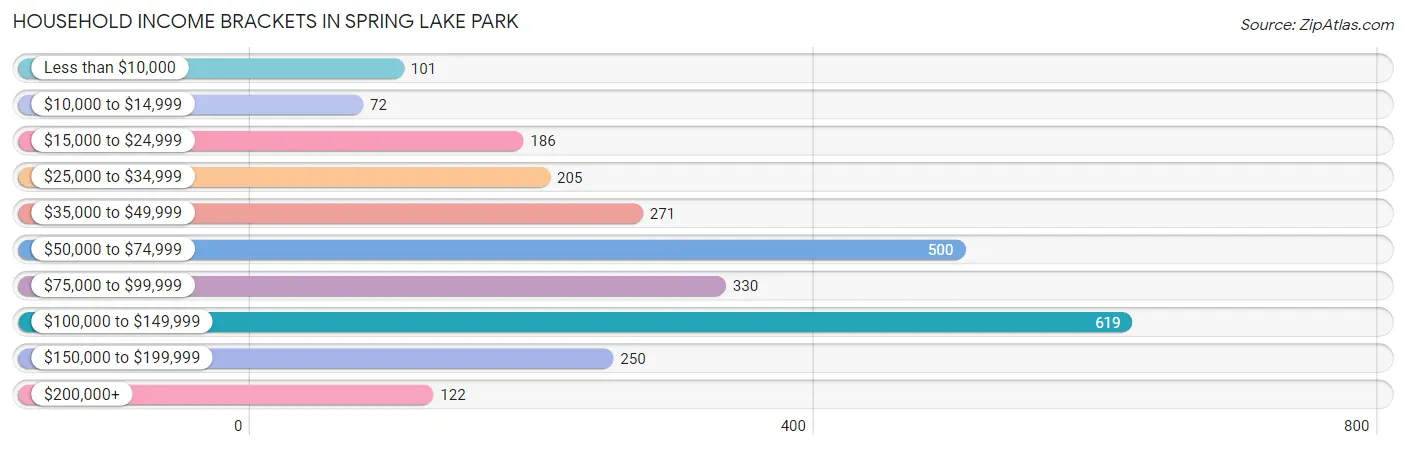
Household Income Brackets in Spring Lake Park
With 619 households falling in the category, the $100,000 to $149,999 income range is the most frequent in Spring Lake Park, accounting for 23.3% of all households. In contrast, only 72 households (2.7%) fall into the $10,000 to $14,999 income bracket, making it the least populous group.
| Income Bracket | # Households | % Households |
| Less than $10,000 | 101 | 3.8% |
| $10,000 to $14,999 | 72 | 2.7% |
| $15,000 to $24,999 | 186 | 7.0% |
| $25,000 to $34,999 | 205 | 7.7% |
| $35,000 to $49,999 | 271 | 10.2% |
| $50,000 to $74,999 | 500 | 18.8% |
| $75,000 to $99,999 | 330 | 12.4% |
| $100,000 to $149,999 | 619 | 23.3% |
| $150,000 to $199,999 | 250 | 9.4% |
| $200,000+ | 122 | 4.6% |
Household Income by Householder Age in Spring Lake Park
The median household income in Spring Lake Park is $74,697, with the highest median household income of $99,844 found in the 25 to 44 years age bracket for the primary householder. A total of 739 households (27.8%) fall into this category. Meanwhile, the 65+ years age bracket for the primary householder has the lowest median household income of $43,100, with 968 households (36.4%) in this group.
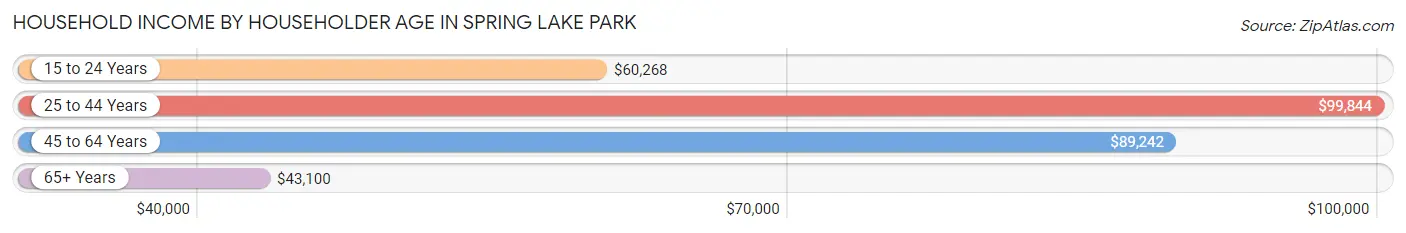
| Income Bracket | # Households | Median Income |
| 15 to 24 Years | 59 (2.2%) | $60,268 |
| 25 to 44 Years | 739 (27.8%) | $99,844 |
| 45 to 64 Years | 892 (33.6%) | $89,242 |
| 65+ Years | 968 (36.4%) | $43,100 |
| Total | 2,658 (100.0%) | $74,697 |
Poverty in Spring Lake Park
Income Below Poverty by Sex and Age in Spring Lake Park
With 11.3% poverty level for males and 11.9% for females among the residents of Spring Lake Park, under 5 year old males and 15 year old females are the most vulnerable to poverty, with 52 males (55.9%) and 24 females (63.2%) in their respective age groups living below the poverty level.
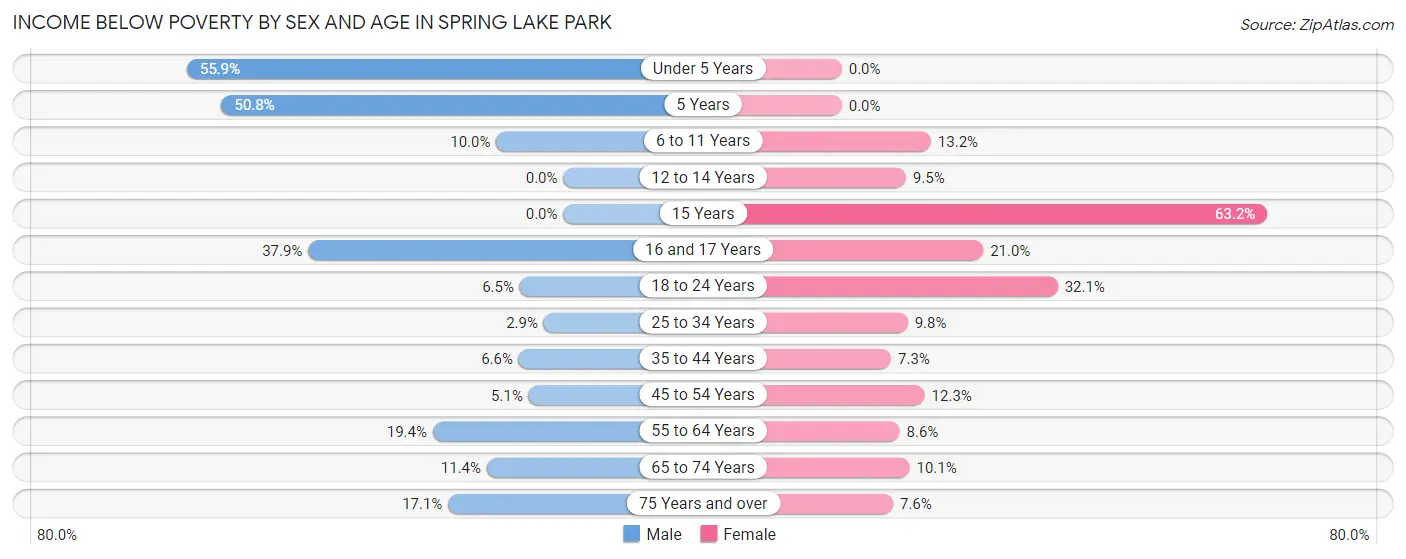
| Age Bracket | Male | Female |
| Under 5 Years | 52 (55.9%) | 0 (0.0%) |
| 5 Years | 33 (50.8%) | 0 (0.0%) |
| 6 to 11 Years | 24 (10.0%) | 34 (13.2%) |
| 12 to 14 Years | 0 (0.0%) | 20 (9.5%) |
| 15 Years | 0 (0.0%) | 24 (63.2%) |
| 16 and 17 Years | 36 (37.9%) | 21 (21.0%) |
| 18 to 24 Years | 26 (6.5%) | 92 (32.1%) |
| 25 to 34 Years | 15 (2.9%) | 28 (9.8%) |
| 35 to 44 Years | 25 (6.6%) | 36 (7.3%) |
| 45 to 54 Years | 31 (5.1%) | 54 (12.3%) |
| 55 to 64 Years | 56 (19.4%) | 40 (8.6%) |
| 65 to 74 Years | 35 (11.4%) | 33 (10.1%) |
| 75 Years and over | 53 (17.1%) | 34 (7.6%) |
| Total | 386 (11.3%) | 416 (11.9%) |
Income Above Poverty by Sex and Age in Spring Lake Park
According to the poverty statistics in Spring Lake Park, males aged 12 to 14 years and females aged under 5 years are the age groups that are most secure financially, with 100.0% of males and 100.0% of females in these age groups living above the poverty line.
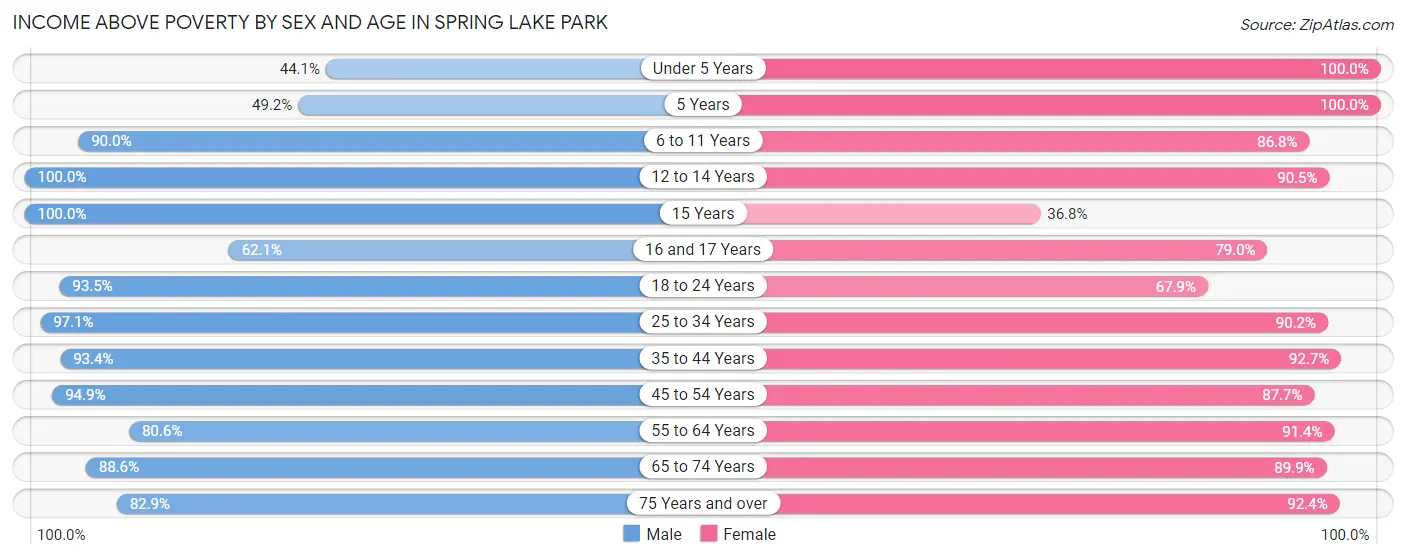
| Age Bracket | Male | Female |
| Under 5 Years | 41 (44.1%) | 121 (100.0%) |
| 5 Years | 32 (49.2%) | 18 (100.0%) |
| 6 to 11 Years | 217 (90.0%) | 223 (86.8%) |
| 12 to 14 Years | 114 (100.0%) | 190 (90.5%) |
| 15 Years | 12 (100.0%) | 14 (36.8%) |
| 16 and 17 Years | 59 (62.1%) | 79 (79.0%) |
| 18 to 24 Years | 376 (93.5%) | 195 (67.9%) |
| 25 to 34 Years | 502 (97.1%) | 258 (90.2%) |
| 35 to 44 Years | 353 (93.4%) | 456 (92.7%) |
| 45 to 54 Years | 572 (94.9%) | 385 (87.7%) |
| 55 to 64 Years | 233 (80.6%) | 426 (91.4%) |
| 65 to 74 Years | 273 (88.6%) | 295 (89.9%) |
| 75 Years and over | 257 (82.9%) | 413 (92.4%) |
| Total | 3,041 (88.7%) | 3,073 (88.1%) |
Income Below Poverty Among Married-Couple Families in Spring Lake Park
The poverty statistics for married-couple families in Spring Lake Park show that 5.8% or 62 of the total 1,074 families live below the poverty line. Families with 3 or 4 children have the highest poverty rate of 12.7%, comprising of 7 families. On the other hand, families with 5 or more children have the lowest poverty rate of 0.0%, which includes 0 families.
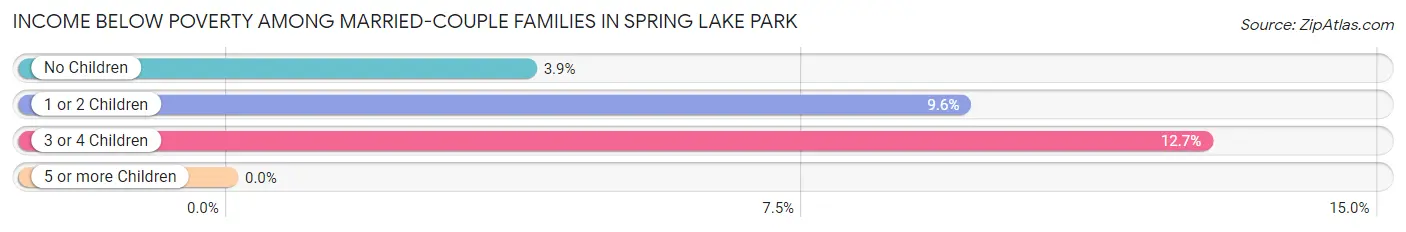
| Children | Above Poverty | Below Poverty |
| No Children | 690 (96.1%) | 28 (3.9%) |
| 1 or 2 Children | 255 (90.4%) | 27 (9.6%) |
| 3 or 4 Children | 48 (87.3%) | 7 (12.7%) |
| 5 or more Children | 19 (100.0%) | 0 (0.0%) |
| Total | 1,012 (94.2%) | 62 (5.8%) |
Income Below Poverty Among Single-Parent Households in Spring Lake Park
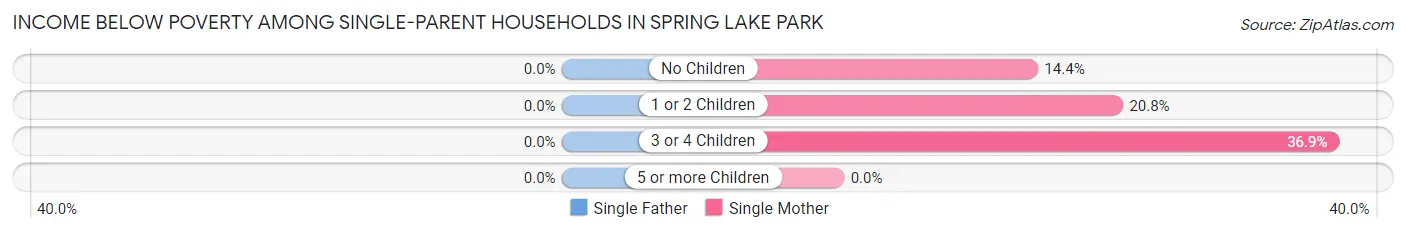
| Children | Single Father | Single Mother |
| No Children | 0 (0.0%) | 27 (14.4%) |
| 1 or 2 Children | 0 (0.0%) | 38 (20.8%) |
| 3 or 4 Children | 0 (0.0%) | 24 (36.9%) |
| 5 or more Children | 0 (0.0%) | 0 (0.0%) |
| Total | 0 (0.0%) | 89 (20.5%) |
Income Below Poverty Among Married-Couple vs Single-Parent Households in Spring Lake Park
The poverty data for Spring Lake Park shows that 62 of the married-couple family households (5.8%) and 89 of the single-parent households (15.2%) are living below the poverty level. Within the married-couple family households, those with 3 or 4 children have the highest poverty rate, with 7 households (12.7%) falling below the poverty line. Among the single-parent households, those with 3 or 4 children have the highest poverty rate, with 24 household (36.9%) living below poverty.
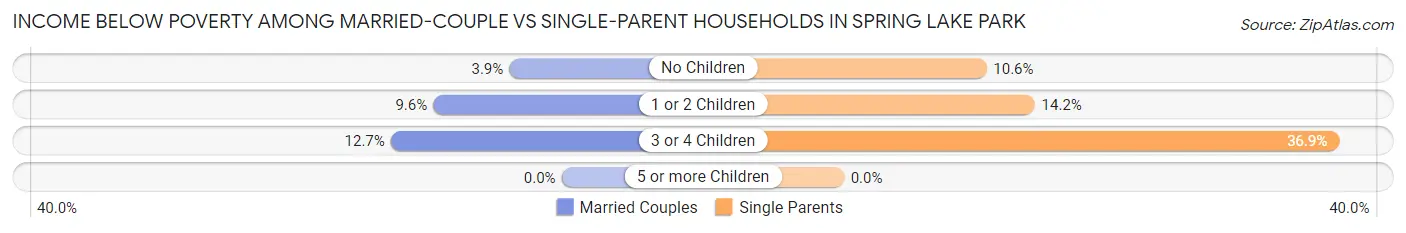
| Children | Married-Couple Families | Single-Parent Households |
| No Children | 28 (3.9%) | 27 (10.6%) |
| 1 or 2 Children | 27 (9.6%) | 38 (14.2%) |
| 3 or 4 Children | 7 (12.7%) | 24 (36.9%) |
| 5 or more Children | 0 (0.0%) | 0 (0.0%) |
| Total | 62 (5.8%) | 89 (15.2%) |
Race in Spring Lake Park
The most populous races in Spring Lake Park are White / Caucasian (4,750 | 68.2%), Hispanic or Latino (864 | 12.4%), and Two or more Races (727 | 10.4%).
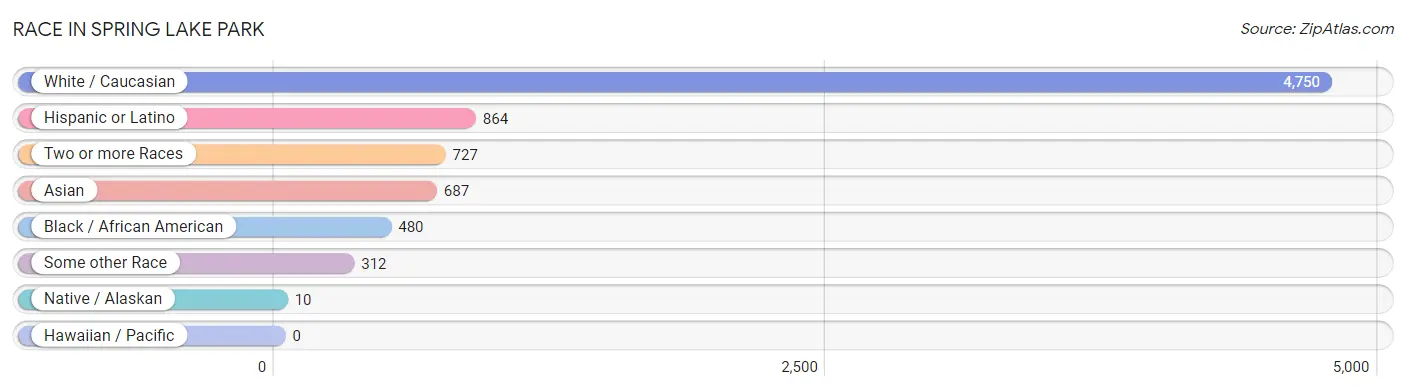
| Race | # Population | % Population |
| Asian | 687 | 9.9% |
| Black / African American | 480 | 6.9% |
| Hawaiian / Pacific | 0 | 0.0% |
| Hispanic or Latino | 864 | 12.4% |
| Native / Alaskan | 10 | 0.1% |
| White / Caucasian | 4,750 | 68.2% |
| Two or more Races | 727 | 10.4% |
| Some other Race | 312 | 4.5% |
| Total | 6,966 | 100.0% |
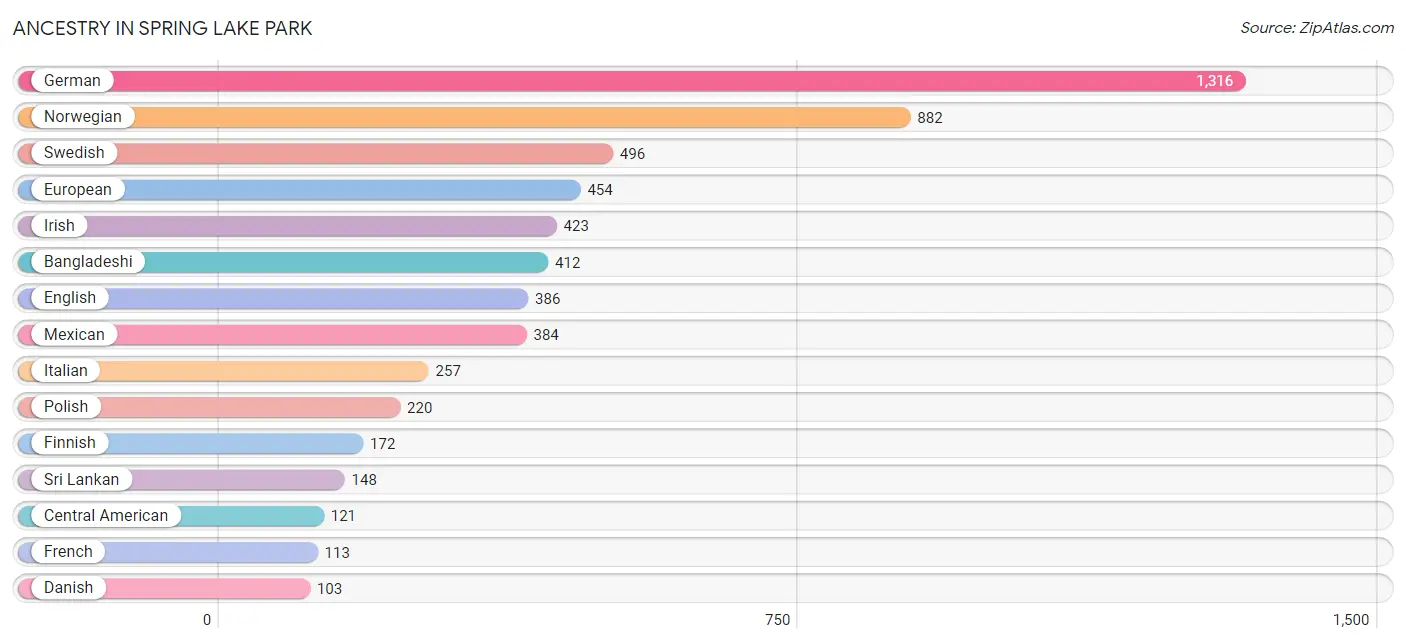
Ancestry in Spring Lake Park
The most populous ancestries reported in Spring Lake Park are German (1,316 | 18.9%), Norwegian (882 | 12.7%), Swedish (496 | 7.1%), European (454 | 6.5%), and Irish (423 | 6.1%), together accounting for 51.3% of all Spring Lake Park residents.
| Ancestry | # Population | % Population |
| African | 63 | 0.9% |
| American | 92 | 1.3% |
| Arab | 32 | 0.5% |
| Argentinean | 20 | 0.3% |
| Bangladeshi | 412 | 5.9% |
| Belgian | 10 | 0.1% |
| Bhutanese | 42 | 0.6% |
| Blackfeet | 6 | 0.1% |
| British | 72 | 1.0% |
| Burmese | 86 | 1.2% |
| Canadian | 10 | 0.1% |
| Central American | 121 | 1.7% |
| Chippewa | 69 | 1.0% |
| Colombian | 59 | 0.9% |
| Croatian | 8 | 0.1% |
| Czech | 99 | 1.4% |
| Czechoslovakian | 31 | 0.4% |
| Danish | 103 | 1.5% |
| Dutch | 14 | 0.2% |
| Egyptian | 19 | 0.3% |
| English | 386 | 5.5% |
| Ethiopian | 35 | 0.5% |
| European | 454 | 6.5% |
| Finnish | 172 | 2.5% |
| French | 113 | 1.6% |
| French Canadian | 89 | 1.3% |
| German | 1,316 | 18.9% |
| Greek | 52 | 0.7% |
| Guatemalan | 61 | 0.9% |
| Guyanese | 9 | 0.1% |
| Hungarian | 10 | 0.1% |
| Indian (Asian) | 54 | 0.8% |
| Irish | 423 | 6.1% |
| Italian | 257 | 3.7% |
| Korean | 85 | 1.2% |
| Mexican | 384 | 5.5% |
| Nicaraguan | 23 | 0.3% |
| Northern European | 37 | 0.5% |
| Norwegian | 882 | 12.7% |
| Palestinian | 6 | 0.1% |
| Polish | 220 | 3.2% |
| Puerto Rican | 16 | 0.2% |
| Russian | 2 | 0.0% |
| Salvadoran | 37 | 0.5% |
| Scandinavian | 71 | 1.0% |
| Scotch-Irish | 9 | 0.1% |
| Scottish | 65 | 0.9% |
| Slavic | 11 | 0.2% |
| South American | 79 | 1.1% |
| Spaniard | 12 | 0.2% |
| Sri Lankan | 148 | 2.1% |
| Subsaharan African | 98 | 1.4% |
| Swedish | 496 | 7.1% |
| Swiss | 7 | 0.1% |
| Ukrainian | 29 | 0.4% |
| Welsh | 11 | 0.2% |
| Yugoslavian | 103 | 1.5% | View All 57 Rows |
Immigrants in Spring Lake Park
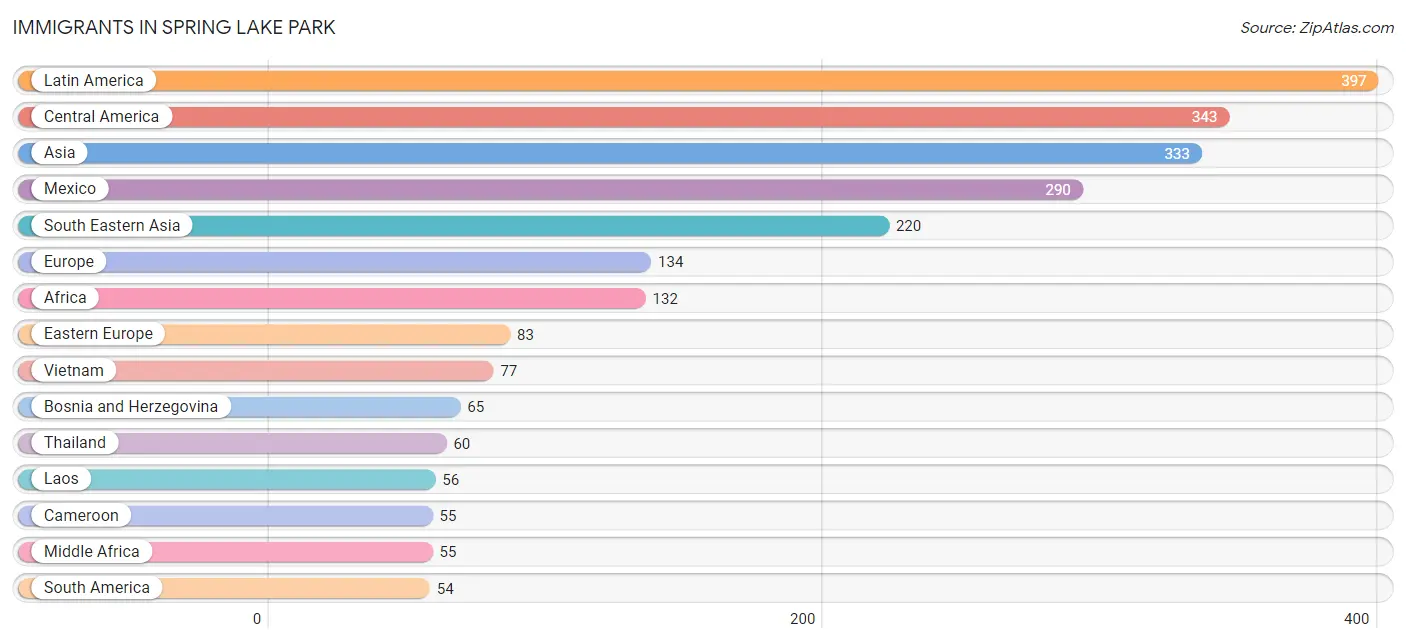
The most numerous immigrant groups reported in Spring Lake Park came from Latin America (397 | 5.7%), Central America (343 | 4.9%), Asia (333 | 4.8%), Mexico (290 | 4.2%), and South Eastern Asia (220 | 3.2%), together accounting for 22.7% of all Spring Lake Park residents.
| Immigration Origin | # Population | % Population |
| Africa | 132 | 1.9% |
| Asia | 333 | 4.8% |
| Bosnia and Herzegovina | 65 | 0.9% |
| Cameroon | 55 | 0.8% |
| Canada | 10 | 0.1% |
| Central America | 343 | 4.9% |
| China | 14 | 0.2% |
| Colombia | 36 | 0.5% |
| Eastern Africa | 46 | 0.7% |
| Eastern Asia | 46 | 0.7% |
| Eastern Europe | 83 | 1.2% |
| Egypt | 19 | 0.3% |
| El Salvador | 30 | 0.4% |
| Ethiopia | 46 | 0.7% |
| Europe | 134 | 1.9% |
| Germany | 38 | 0.5% |
| Guyana | 18 | 0.3% |
| India | 40 | 0.6% |
| Iraq | 7 | 0.1% |
| Japan | 18 | 0.3% |
| Jordan | 7 | 0.1% |
| Korea | 14 | 0.2% |
| Laos | 56 | 0.8% |
| Latin America | 397 | 5.7% |
| Lebanon | 13 | 0.2% |
| Mexico | 290 | 4.2% |
| Middle Africa | 55 | 0.8% |
| Nicaragua | 23 | 0.3% |
| Northern Africa | 19 | 0.3% |
| Northern Europe | 13 | 0.2% |
| Philippines | 27 | 0.4% |
| Poland | 18 | 0.3% |
| Sierra Leone | 12 | 0.2% |
| South America | 54 | 0.8% |
| South Central Asia | 40 | 0.6% |
| South Eastern Asia | 220 | 3.2% |
| Thailand | 60 | 0.9% |
| Vietnam | 77 | 1.1% |
| Western Africa | 12 | 0.2% |
| Western Asia | 27 | 0.4% |
| Western Europe | 38 | 0.5% | View All 41 Rows |
Sex and Age in Spring Lake Park
Sex and Age in Spring Lake Park
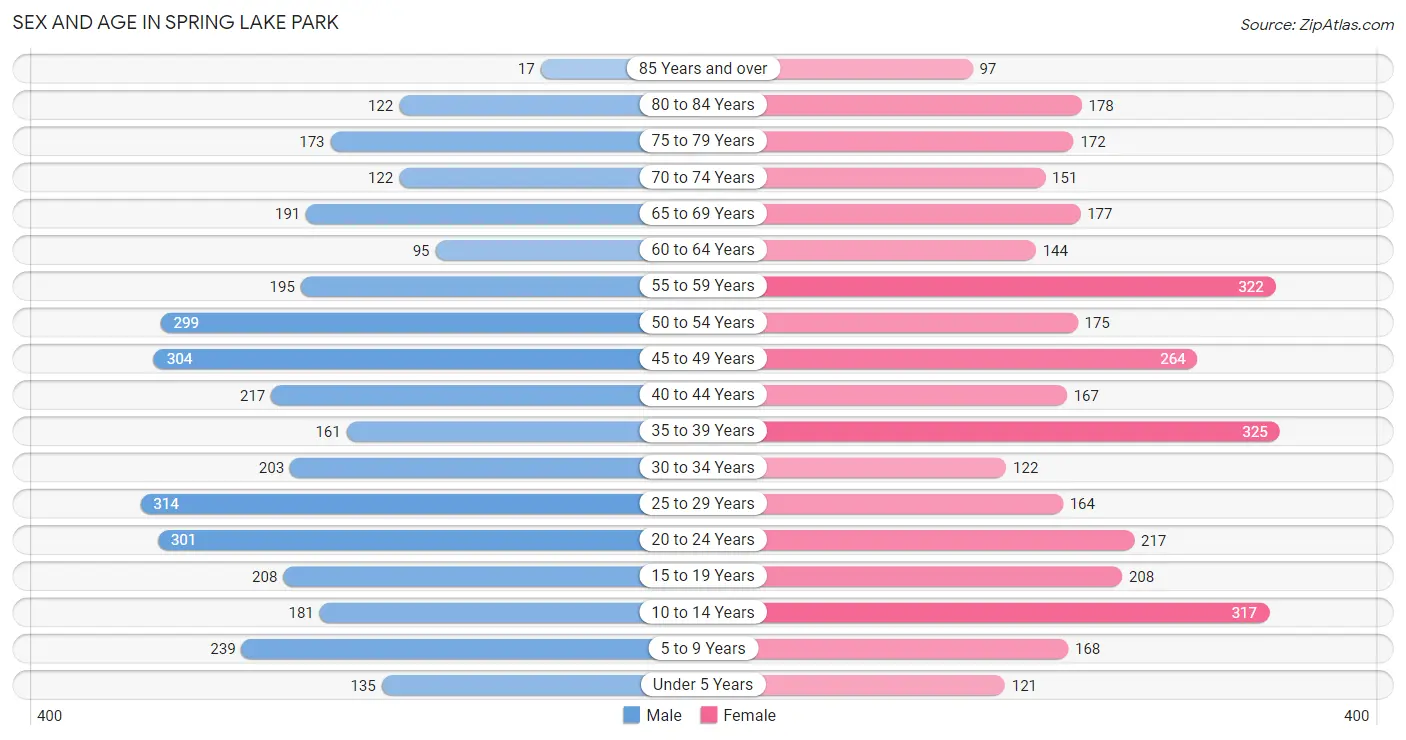
The most populous age groups in Spring Lake Park are 25 to 29 Years (314 | 9.0%) for men and 35 to 39 Years (325 | 9.3%) for women.
| Age Bracket | Male | Female |
| Under 5 Years | 135 (3.9%) | 121 (3.5%) |
| 5 to 9 Years | 239 (6.9%) | 168 (4.8%) |
| 10 to 14 Years | 181 (5.2%) | 317 (9.1%) |
| 15 to 19 Years | 208 (6.0%) | 208 (6.0%) |
| 20 to 24 Years | 301 (8.7%) | 217 (6.2%) |
| 25 to 29 Years | 314 (9.0%) | 164 (4.7%) |
| 30 to 34 Years | 203 (5.8%) | 122 (3.5%) |
| 35 to 39 Years | 161 (4.6%) | 325 (9.3%) |
| 40 to 44 Years | 217 (6.2%) | 167 (4.8%) |
| 45 to 49 Years | 304 (8.7%) | 264 (7.6%) |
| 50 to 54 Years | 299 (8.6%) | 175 (5.0%) |
| 55 to 59 Years | 195 (5.6%) | 322 (9.2%) |
| 60 to 64 Years | 95 (2.7%) | 144 (4.1%) |
| 65 to 69 Years | 191 (5.5%) | 177 (5.1%) |
| 70 to 74 Years | 122 (3.5%) | 151 (4.3%) |
| 75 to 79 Years | 173 (5.0%) | 172 (4.9%) |
| 80 to 84 Years | 122 (3.5%) | 178 (5.1%) |
| 85 Years and over | 17 (0.5%) | 97 (2.8%) |
| Total | 3,477 (100.0%) | 3,489 (100.0%) |
Families and Households in Spring Lake Park
Median Family Size in Spring Lake Park
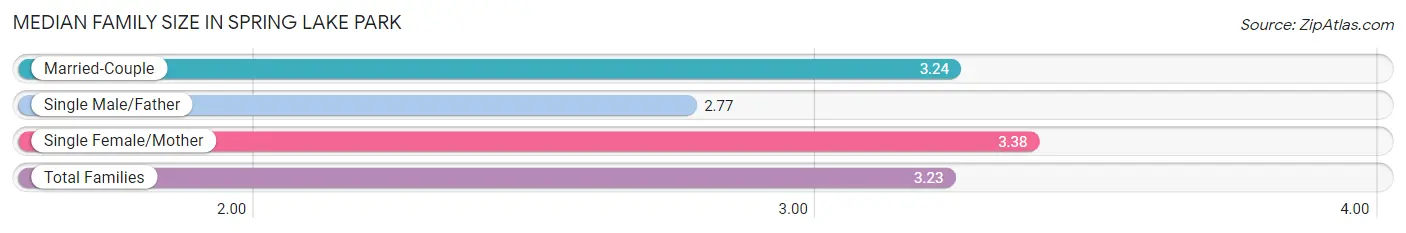
The median family size in Spring Lake Park is 3.23 persons per family, with single female/mother families (435 | 26.2%) accounting for the largest median family size of 3.38 persons per family. On the other hand, single male/father families (151 | 9.1%) represent the smallest median family size with 2.77 persons per family.
| Family Type | # Families | Family Size |
| Married-Couple | 1,074 (64.7%) | 3.24 |
| Single Male/Father | 151 (9.1%) | 2.77 |
| Single Female/Mother | 435 (26.2%) | 3.38 |
| Total Families | 1,660 (100.0%) | 3.23 |
Median Household Size in Spring Lake Park
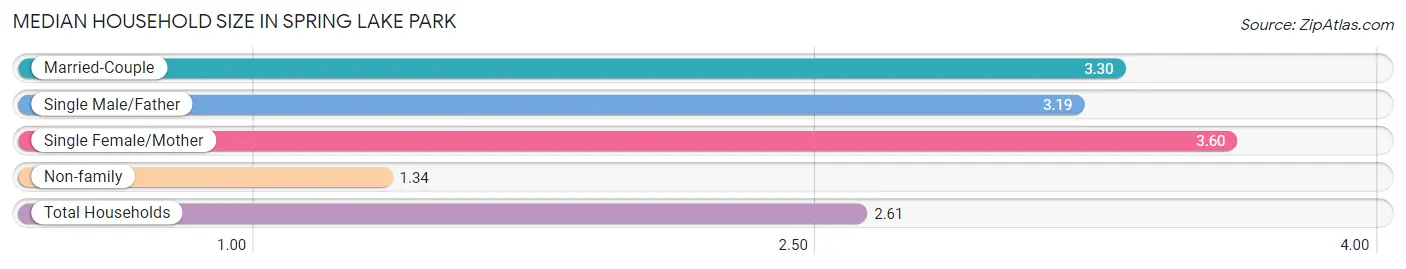
The median household size in Spring Lake Park is 2.61 persons per household, with single female/mother households (435 | 16.4%) accounting for the largest median household size of 3.6 persons per household. non-family households (998 | 37.6%) represent the smallest median household size with 1.34 persons per household.
| Household Type | # Households | Household Size |
| Married-Couple | 1,074 (40.4%) | 3.30 |
| Single Male/Father | 151 (5.7%) | 3.19 |
| Single Female/Mother | 435 (16.4%) | 3.60 |
| Non-family | 998 (37.6%) | 1.34 |
| Total Households | 2,658 (100.0%) | 2.61 |
Household Size by Marriage Status in Spring Lake Park
Out of a total of 2,658 households in Spring Lake Park, 1,660 (62.5%) are family households, while 998 (37.6%) are nonfamily households. The most numerous type of family households are 2-person households, comprising 726, and the most common type of nonfamily households are 1-person households, comprising 750.
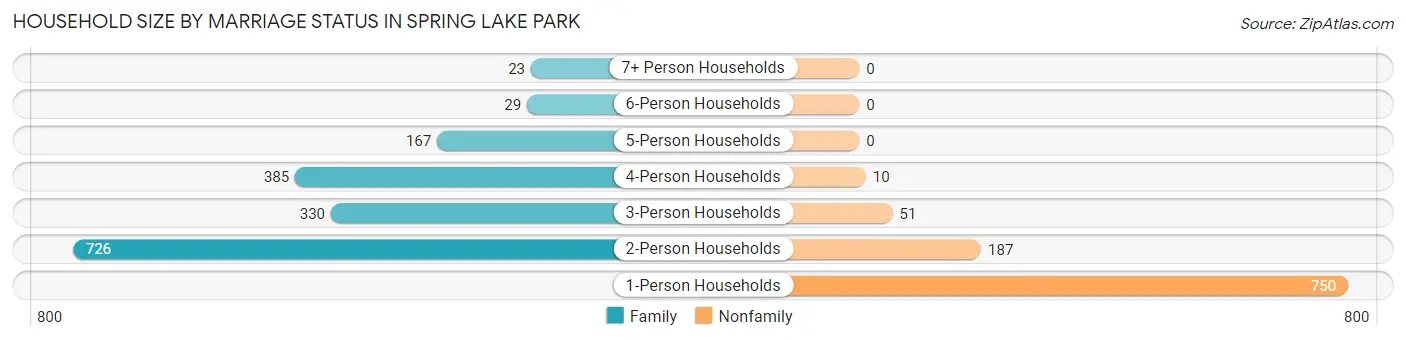
| Household Size | Family Households | Nonfamily Households |
| 1-Person Households | - | 750 (28.2%) |
| 2-Person Households | 726 (27.3%) | 187 (7.0%) |
| 3-Person Households | 330 (12.4%) | 51 (1.9%) |
| 4-Person Households | 385 (14.5%) | 10 (0.4%) |
| 5-Person Households | 167 (6.3%) | 0 (0.0%) |
| 6-Person Households | 29 (1.1%) | 0 (0.0%) |
| 7+ Person Households | 23 (0.9%) | 0 (0.0%) |
| Total | 1,660 (62.5%) | 998 (37.6%) |
Female Fertility in Spring Lake Park
Fertility by Age in Spring Lake Park
Average fertility rate in Spring Lake Park is 38.0 births per 1,000 women. Women in the age bracket of 20 to 34 years have the highest fertility rate with 70.0 births per 1,000 women. Women in the age bracket of 20 to 34 years acount for 62.5% of all women with births.
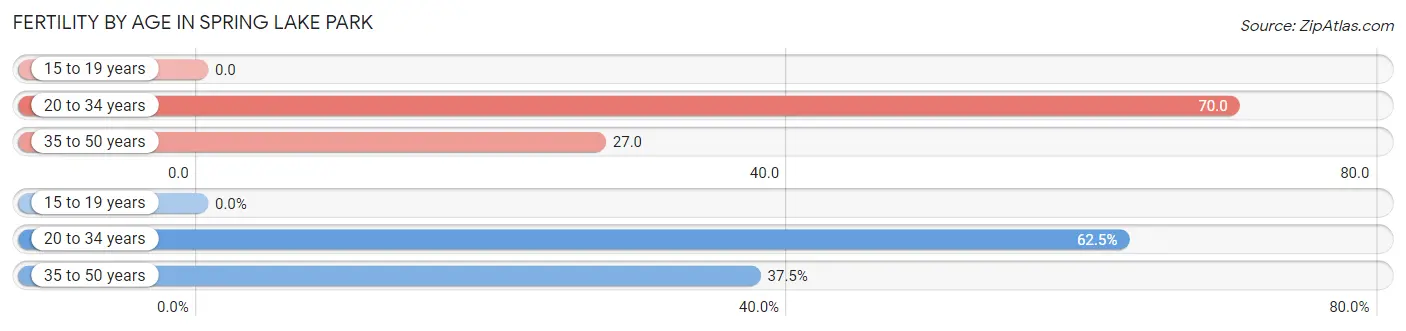
| Age Bracket | Women with Births | Births / 1,000 Women |
| 15 to 19 years | 0 (0.0%) | 0.0 |
| 20 to 34 years | 35 (62.5%) | 70.0 |
| 35 to 50 years | 21 (37.5%) | 27.0 |
| Total | 56 (100.0%) | 38.0 |
Fertility by Age by Marriage Status in Spring Lake Park
53.6% of women with births (56) in Spring Lake Park are married. The highest percentage of unmarried women with births falls into 35 to 50 years age bracket with 47.6% of them unmarried at the time of birth, while the lowest percentage of unmarried women with births belong to 20 to 34 years age bracket with 45.7% of them unmarried.
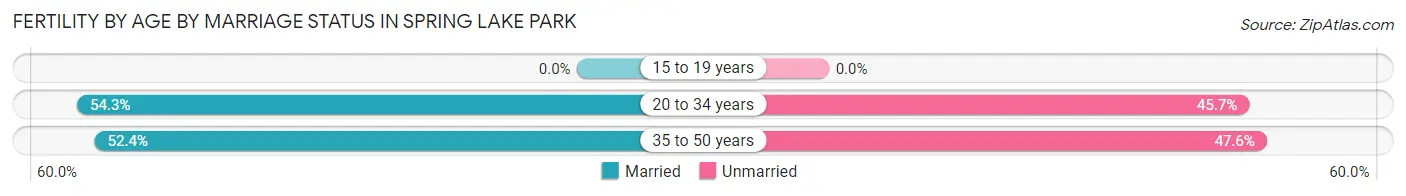
| Age Bracket | Married | Unmarried |
| 15 to 19 years | 0 (0.0%) | 0 (0.0%) |
| 20 to 34 years | 19 (54.3%) | 16 (45.7%) |
| 35 to 50 years | 11 (52.4%) | 10 (47.6%) |
| Total | 30 (53.6%) | 26 (46.4%) |
Fertility by Education in Spring Lake Park
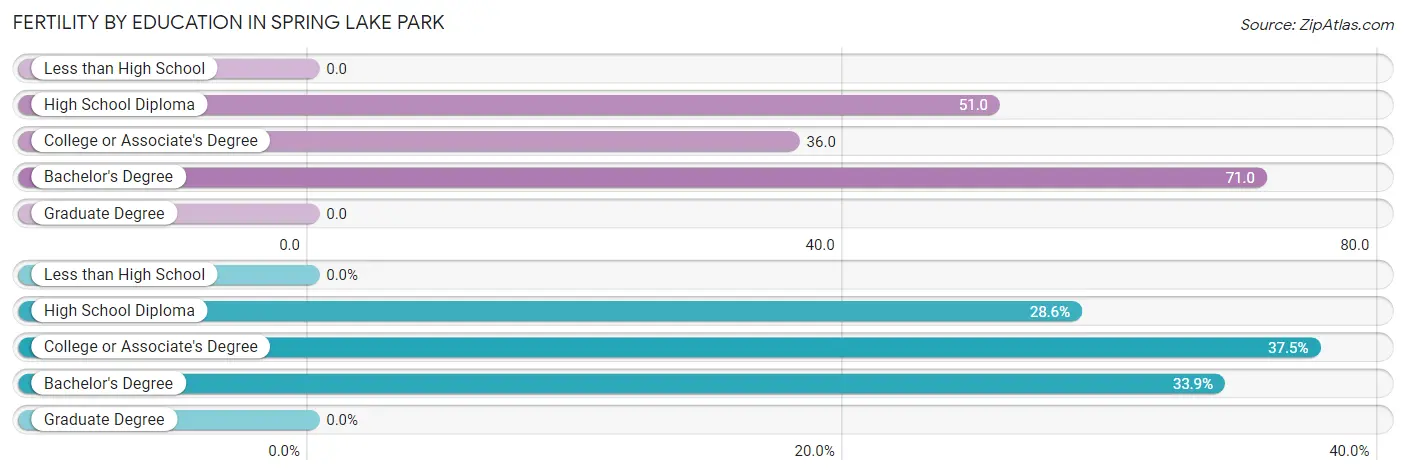
| Educational Attainment | Women with Births | Births / 1,000 Women |
| Less than High School | 0 (0.0%) | 0.0 |
| High School Diploma | 16 (28.6%) | 51.0 |
| College or Associate's Degree | 21 (37.5%) | 36.0 |
| Bachelor's Degree | 19 (33.9%) | 71.0 |
| Graduate Degree | 0 (0.0%) | 0.0 |
| Total | 56 (100.0%) | 38.0 |
Fertility by Education by Marriage Status in Spring Lake Park
46.4% of women with births in Spring Lake Park are unmarried. Women with the educational attainment of bachelor's degree are most likely to be married with 100.0% of them married at childbirth, while women with the educational attainment of high school diploma are least likely to be married with 100.0% of them unmarried at childbirth.
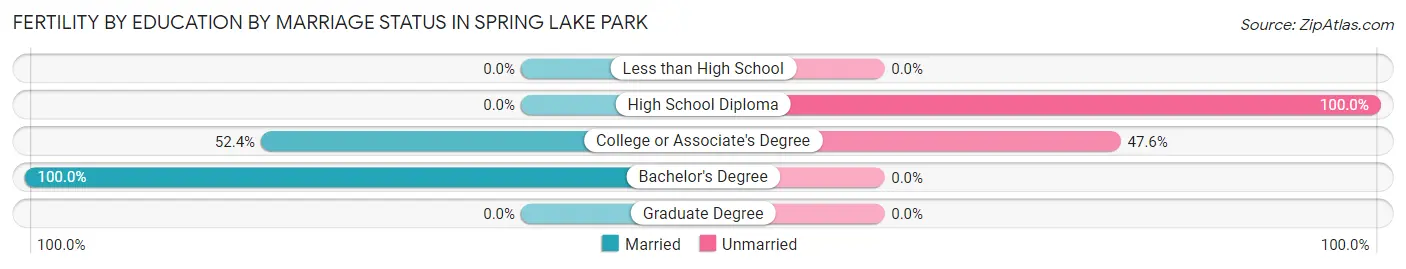
| Educational Attainment | Married | Unmarried |
| Less than High School | 0 (0.0%) | 0 (0.0%) |
| High School Diploma | 0 (0.0%) | 16 (100.0%) |
| College or Associate's Degree | 11 (52.4%) | 10 (47.6%) |
| Bachelor's Degree | 19 (100.0%) | 0 (0.0%) |
| Graduate Degree | 0 (0.0%) | 0 (0.0%) |
| Total | 30 (53.6%) | 26 (46.4%) |
Employment Characteristics in Spring Lake Park
Employment by Class of Employer in Spring Lake Park
Among the 3,429 employed individuals in Spring Lake Park, private company employees (2,631 | 76.7%), not-for-profit organizations (239 | 7.0%), and self-employed (not incorporated) (146 | 4.3%) make up the most common classes of employment.
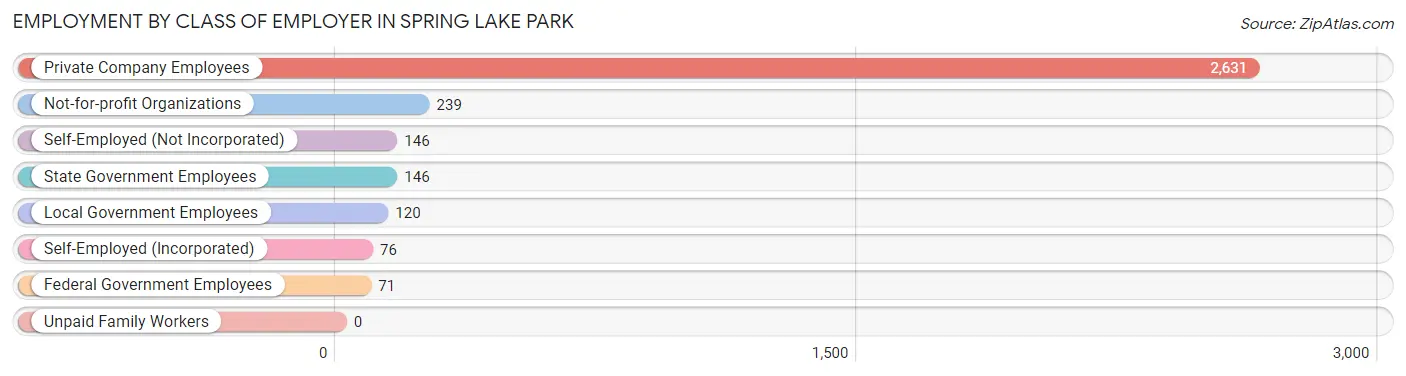
| Employer Class | # Employees | % Employees |
| Private Company Employees | 2,631 | 76.7% |
| Self-Employed (Incorporated) | 76 | 2.2% |
| Self-Employed (Not Incorporated) | 146 | 4.3% |
| Not-for-profit Organizations | 239 | 7.0% |
| Local Government Employees | 120 | 3.5% |
| State Government Employees | 146 | 4.3% |
| Federal Government Employees | 71 | 2.1% |
| Unpaid Family Workers | 0 | 0.0% |
| Total | 3,429 | 100.0% |
Employment Status by Age in Spring Lake Park
According to the labor force statistics for Spring Lake Park, out of the total population over 16 years of age (5,755), 62.1% or 3,574 individuals are in the labor force, with 2.7% or 96 of them unemployed. The age group with the highest labor force participation rate is 30 to 34 years, with 100.0% or 325 individuals in the labor force. Within the labor force, the 16 to 19 years age range has the highest percentage of unemployed individuals, with 16.9% or 22 of them being unemployed.
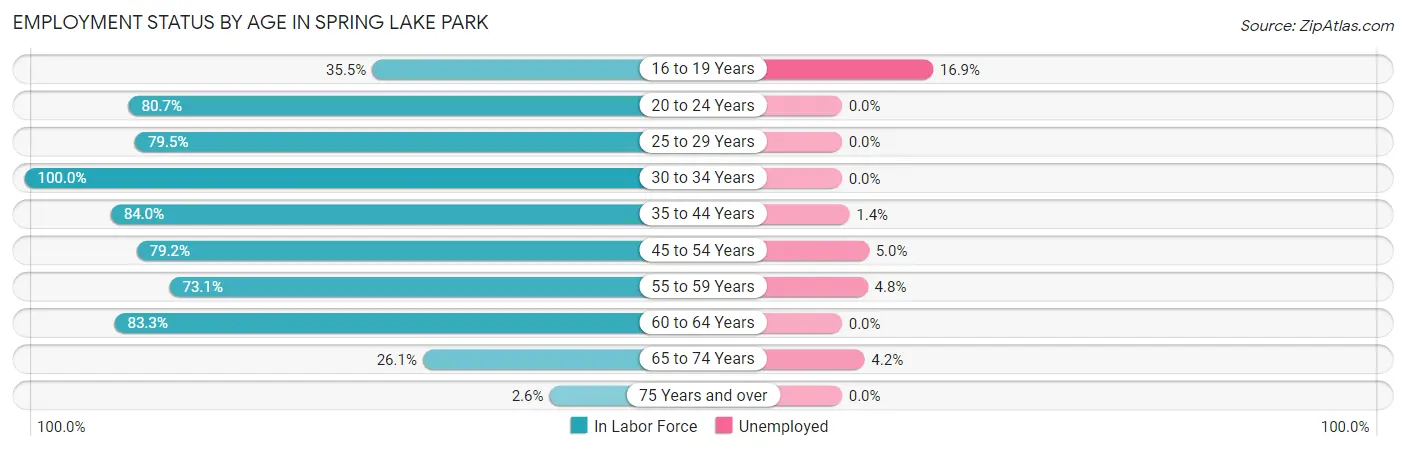
| Age Bracket | In Labor Force | Unemployed |
| 16 to 19 Years | 130 (35.5%) | 22 (16.9%) |
| 20 to 24 Years | 418 (80.7%) | 0 (0.0%) |
| 25 to 29 Years | 380 (79.5%) | 0 (0.0%) |
| 30 to 34 Years | 325 (100.0%) | 0 (0.0%) |
| 35 to 44 Years | 731 (84.0%) | 10 (1.4%) |
| 45 to 54 Years | 825 (79.2%) | 41 (5.0%) |
| 55 to 59 Years | 378 (73.1%) | 18 (4.8%) |
| 60 to 64 Years | 199 (83.3%) | 0 (0.0%) |
| 65 to 74 Years | 167 (26.1%) | 7 (4.2%) |
| 75 Years and over | 20 (2.6%) | 0 (0.0%) |
| Total | 3,574 (62.1%) | 96 (2.7%) |
Employment Status by Educational Attainment in Spring Lake Park
According to labor force statistics for Spring Lake Park, 81.8% of individuals (2,839) out of the total population between 25 and 64 years of age (3,471) are in the labor force, with 2.4% or 68 of them being unemployed. The group with the highest labor force participation rate are those with the educational attainment of college / associate degree, with 88.4% or 1,298 individuals in the labor force. Within the labor force, individuals with less than high school education have the highest percentage of unemployment, with 10.3% or 18 of them being unemployed.
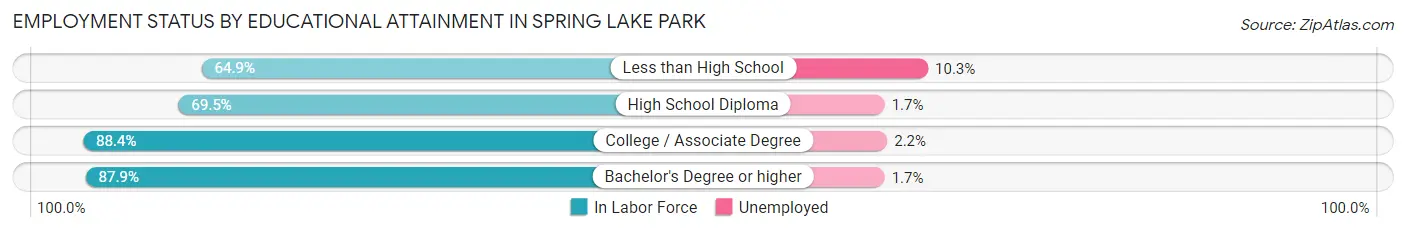
| Educational Attainment | In Labor Force | Unemployed |
| Less than High School | 174 (64.9%) | 28 (10.3%) |
| High School Diploma | 598 (69.5%) | 15 (1.7%) |
| College / Associate Degree | 1,298 (88.4%) | 32 (2.2%) |
| Bachelor's Degree or higher | 768 (87.9%) | 15 (1.7%) |
| Total | 2,839 (81.8%) | 83 (2.4%) |
Employment Occupations by Sex in Spring Lake Park
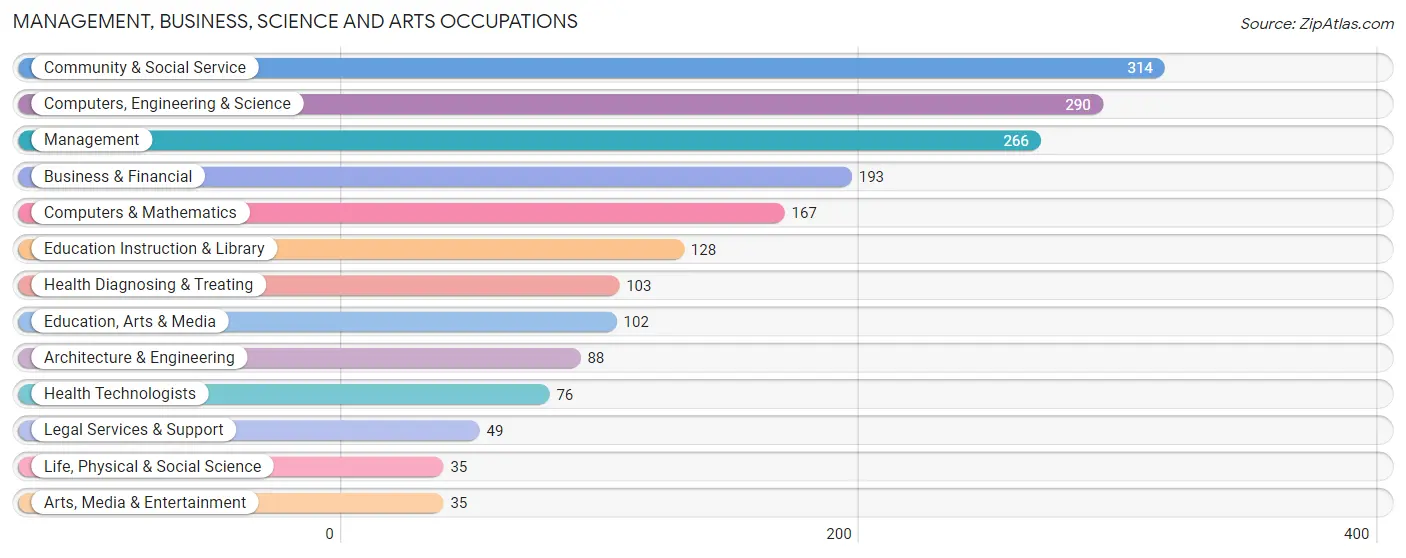
Management, Business, Science and Arts Occupations
The most common Management, Business, Science and Arts occupations in Spring Lake Park are Community & Social Service (314 | 9.0%), Computers, Engineering & Science (290 | 8.4%), Management (266 | 7.6%), Business & Financial (193 | 5.6%), and Computers & Mathematics (167 | 4.8%).
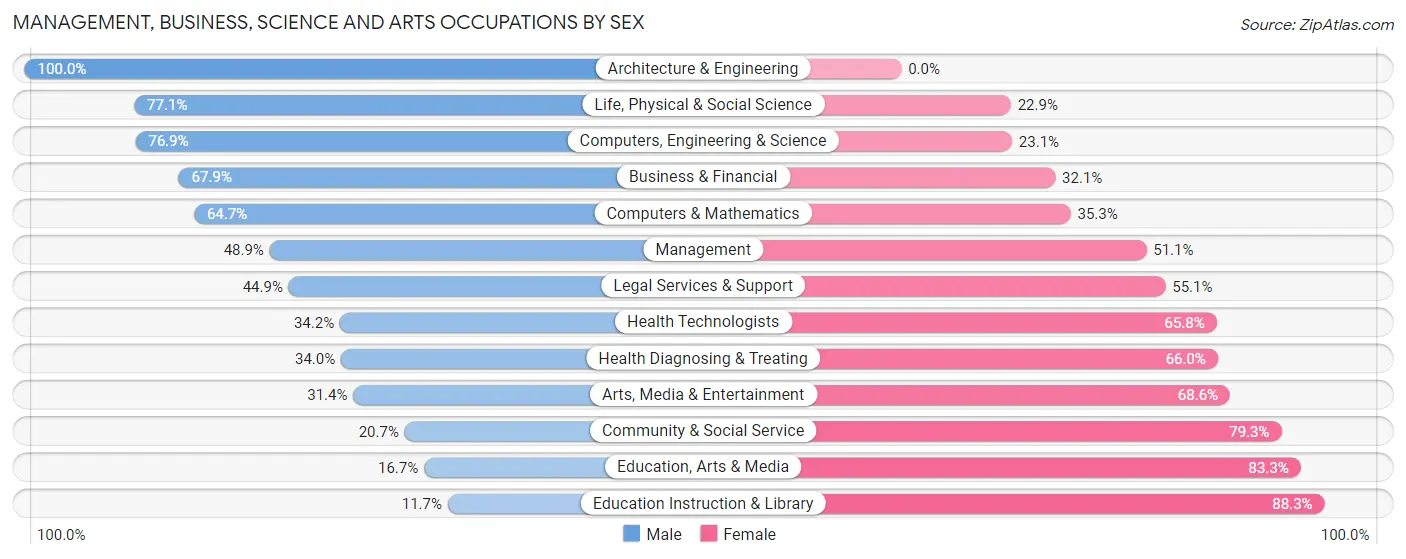
Management, Business, Science and Arts Occupations by Sex
Within the Management, Business, Science and Arts occupations in Spring Lake Park, the most male-oriented occupations are Architecture & Engineering (100.0%), Life, Physical & Social Science (77.1%), and Computers, Engineering & Science (76.9%), while the most female-oriented occupations are Education Instruction & Library (88.3%), Education, Arts & Media (83.3%), and Community & Social Service (79.3%).
| Occupation | Male | Female |
| Management | 130 (48.9%) | 136 (51.1%) |
| Business & Financial | 131 (67.9%) | 62 (32.1%) |
| Computers, Engineering & Science | 223 (76.9%) | 67 (23.1%) |
| Computers & Mathematics | 108 (64.7%) | 59 (35.3%) |
| Architecture & Engineering | 88 (100.0%) | 0 (0.0%) |
| Life, Physical & Social Science | 27 (77.1%) | 8 (22.9%) |
| Community & Social Service | 65 (20.7%) | 249 (79.3%) |
| Education, Arts & Media | 17 (16.7%) | 85 (83.3%) |
| Legal Services & Support | 22 (44.9%) | 27 (55.1%) |
| Education Instruction & Library | 15 (11.7%) | 113 (88.3%) |
| Arts, Media & Entertainment | 11 (31.4%) | 24 (68.6%) |
| Health Diagnosing & Treating | 35 (34.0%) | 68 (66.0%) |
| Health Technologists | 26 (34.2%) | 50 (65.8%) |
| Total (Category) | 584 (50.1%) | 582 (49.9%) |
| Total (Overall) | 1,877 (54.0%) | 1,598 (46.0%) |
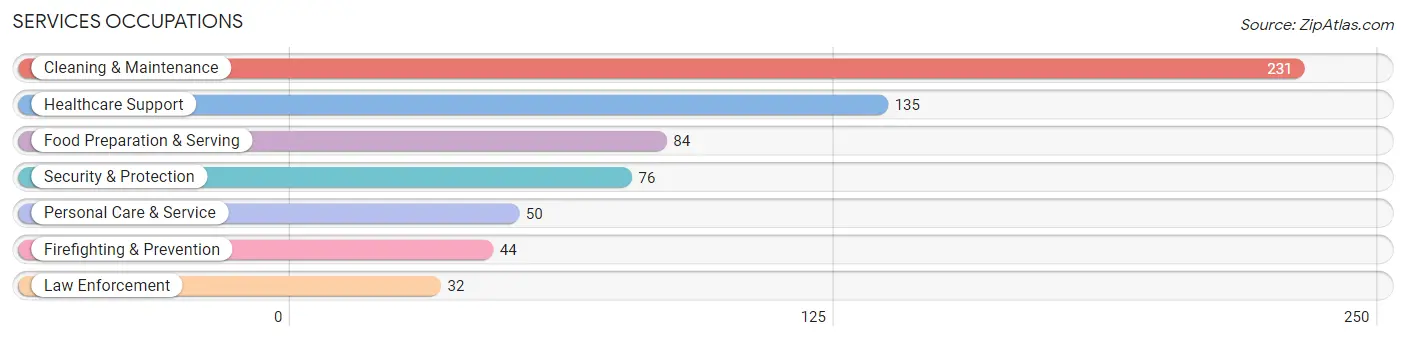
Services Occupations
The most common Services occupations in Spring Lake Park are Cleaning & Maintenance (231 | 6.7%), Healthcare Support (135 | 3.9%), Food Preparation & Serving (84 | 2.4%), Security & Protection (76 | 2.2%), and Personal Care & Service (50 | 1.4%).
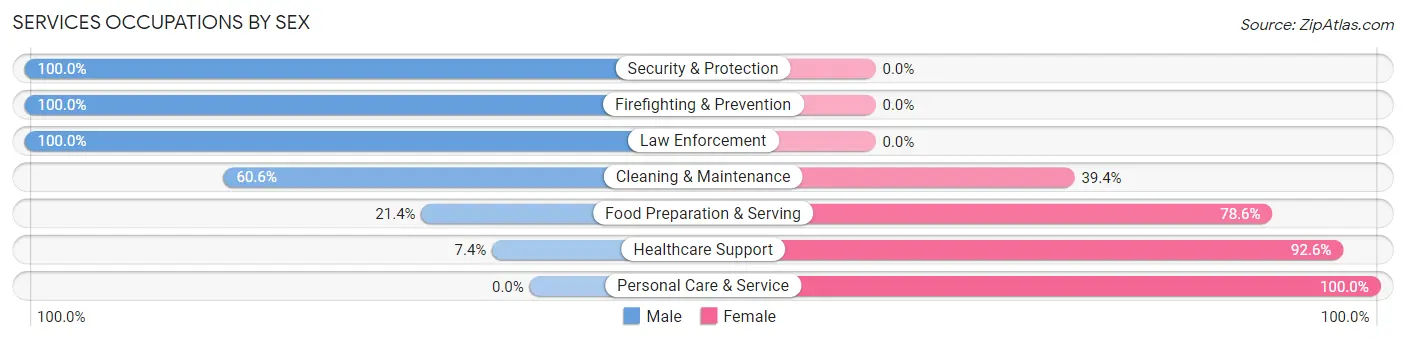
Services Occupations by Sex
Within the Services occupations in Spring Lake Park, the most male-oriented occupations are Security & Protection (100.0%), Firefighting & Prevention (100.0%), and Law Enforcement (100.0%), while the most female-oriented occupations are Personal Care & Service (100.0%), Healthcare Support (92.6%), and Food Preparation & Serving (78.6%).
| Occupation | Male | Female |
| Healthcare Support | 10 (7.4%) | 125 (92.6%) |
| Security & Protection | 76 (100.0%) | 0 (0.0%) |
| Firefighting & Prevention | 44 (100.0%) | 0 (0.0%) |
| Law Enforcement | 32 (100.0%) | 0 (0.0%) |
| Food Preparation & Serving | 18 (21.4%) | 66 (78.6%) |
| Cleaning & Maintenance | 140 (60.6%) | 91 (39.4%) |
| Personal Care & Service | 0 (0.0%) | 50 (100.0%) |
| Total (Category) | 244 (42.4%) | 332 (57.6%) |
| Total (Overall) | 1,877 (54.0%) | 1,598 (46.0%) |
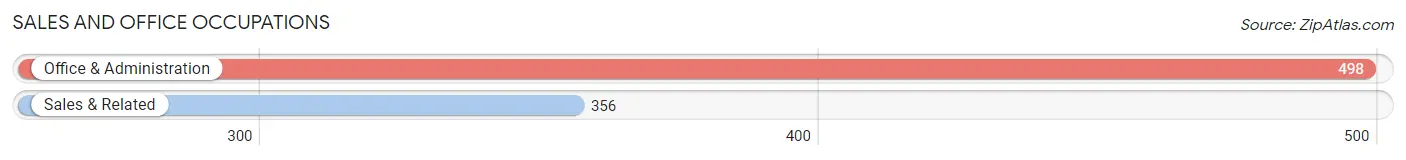
Sales and Office Occupations
The most common Sales and Office occupations in Spring Lake Park are Office & Administration (498 | 14.3%), and Sales & Related (356 | 10.2%).
Sales and Office Occupations by Sex
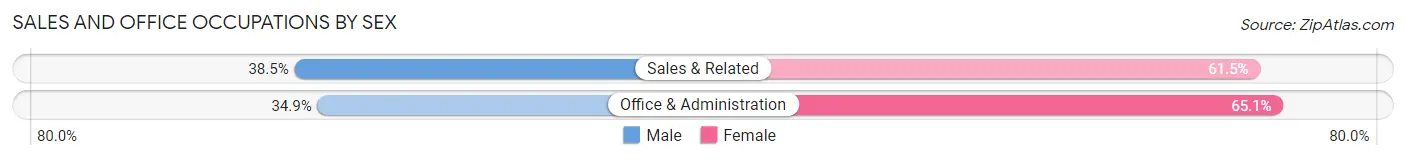
| Occupation | Male | Female |
| Sales & Related | 137 (38.5%) | 219 (61.5%) |
| Office & Administration | 174 (34.9%) | 324 (65.1%) |
| Total (Category) | 311 (36.4%) | 543 (63.6%) |
| Total (Overall) | 1,877 (54.0%) | 1,598 (46.0%) |
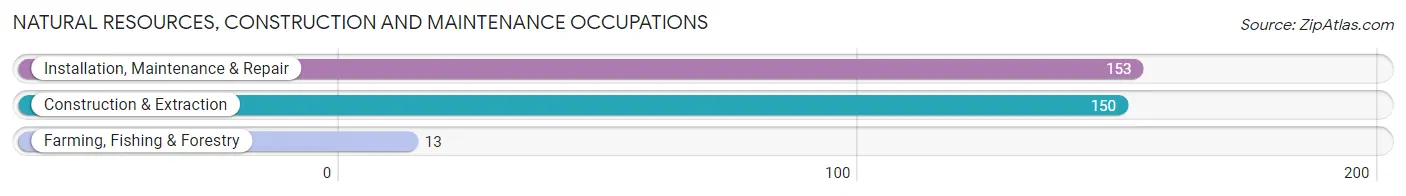
Natural Resources, Construction and Maintenance Occupations
The most common Natural Resources, Construction and Maintenance occupations in Spring Lake Park are Installation, Maintenance & Repair (153 | 4.4%), Construction & Extraction (150 | 4.3%), and Farming, Fishing & Forestry (13 | 0.4%).
Natural Resources, Construction and Maintenance Occupations by Sex
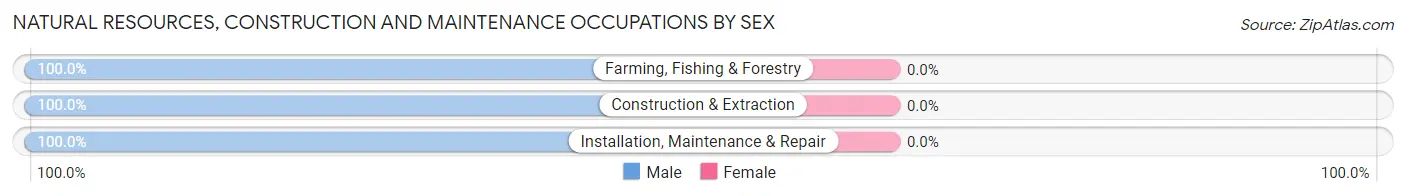
| Occupation | Male | Female |
| Farming, Fishing & Forestry | 13 (100.0%) | 0 (0.0%) |
| Construction & Extraction | 150 (100.0%) | 0 (0.0%) |
| Installation, Maintenance & Repair | 153 (100.0%) | 0 (0.0%) |
| Total (Category) | 316 (100.0%) | 0 (0.0%) |
| Total (Overall) | 1,877 (54.0%) | 1,598 (46.0%) |
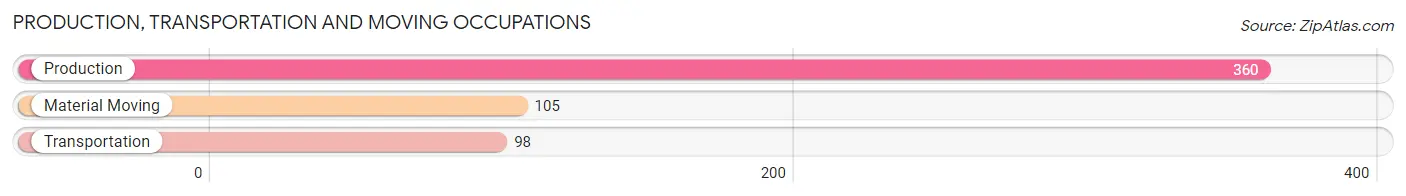
Production, Transportation and Moving Occupations
The most common Production, Transportation and Moving occupations in Spring Lake Park are Production (360 | 10.4%), Material Moving (105 | 3.0%), and Transportation (98 | 2.8%).
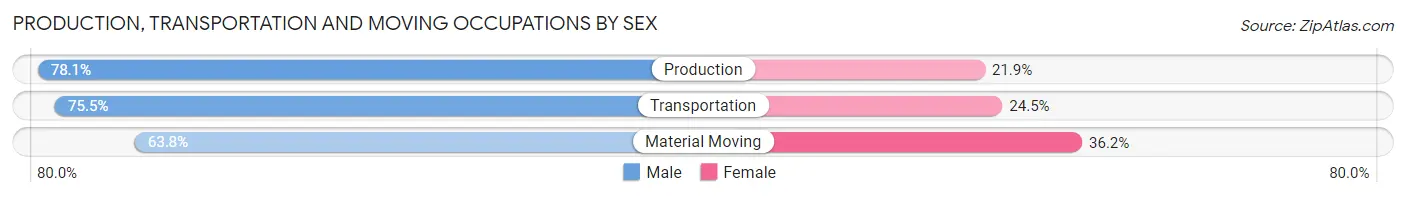
Production, Transportation and Moving Occupations by Sex
| Occupation | Male | Female |
| Production | 281 (78.1%) | 79 (21.9%) |
| Transportation | 74 (75.5%) | 24 (24.5%) |
| Material Moving | 67 (63.8%) | 38 (36.2%) |
| Total (Category) | 422 (75.0%) | 141 (25.0%) |
| Total (Overall) | 1,877 (54.0%) | 1,598 (46.0%) |
Employment Industries by Sex in Spring Lake Park
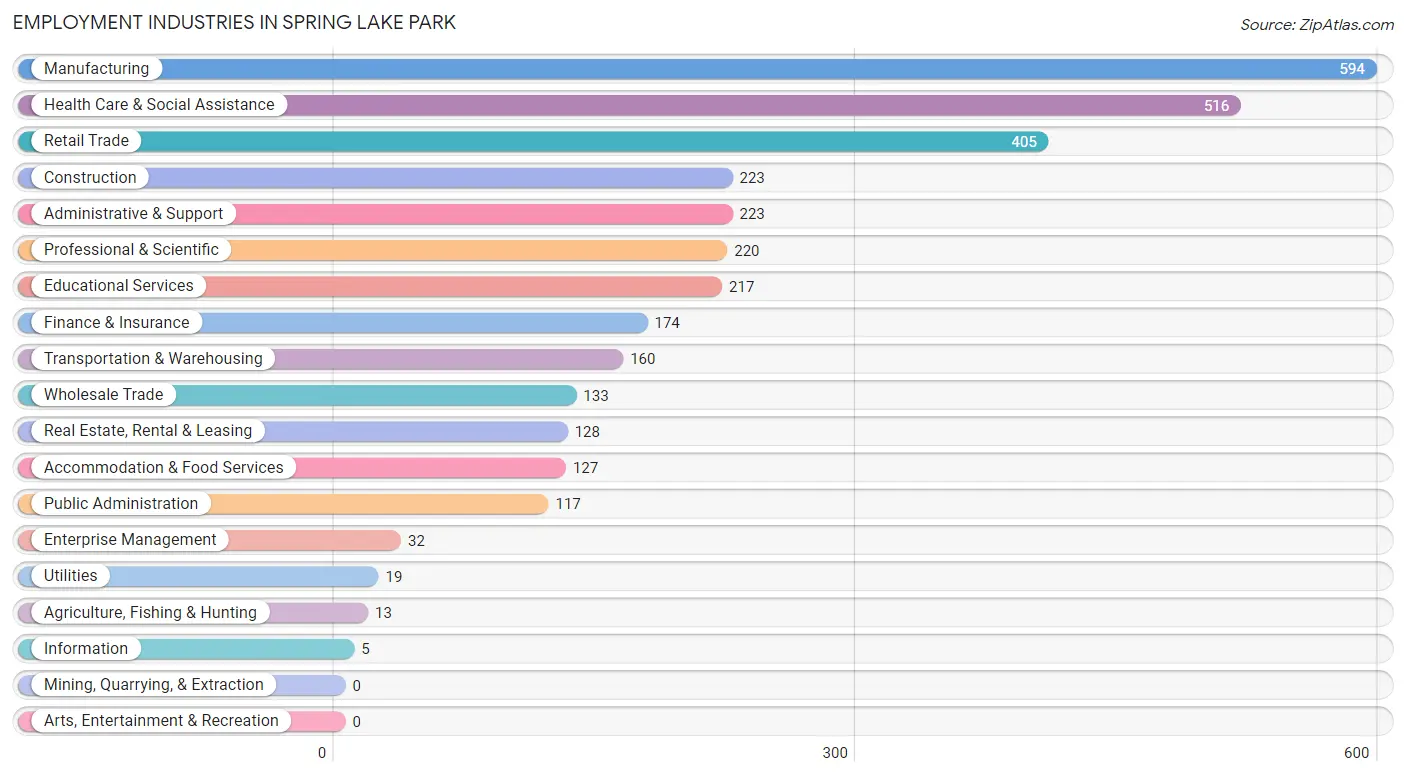
Employment Industries in Spring Lake Park
The major employment industries in Spring Lake Park include Manufacturing (594 | 17.1%), Health Care & Social Assistance (516 | 14.8%), Retail Trade (405 | 11.7%), Construction (223 | 6.4%), and Administrative & Support (223 | 6.4%).
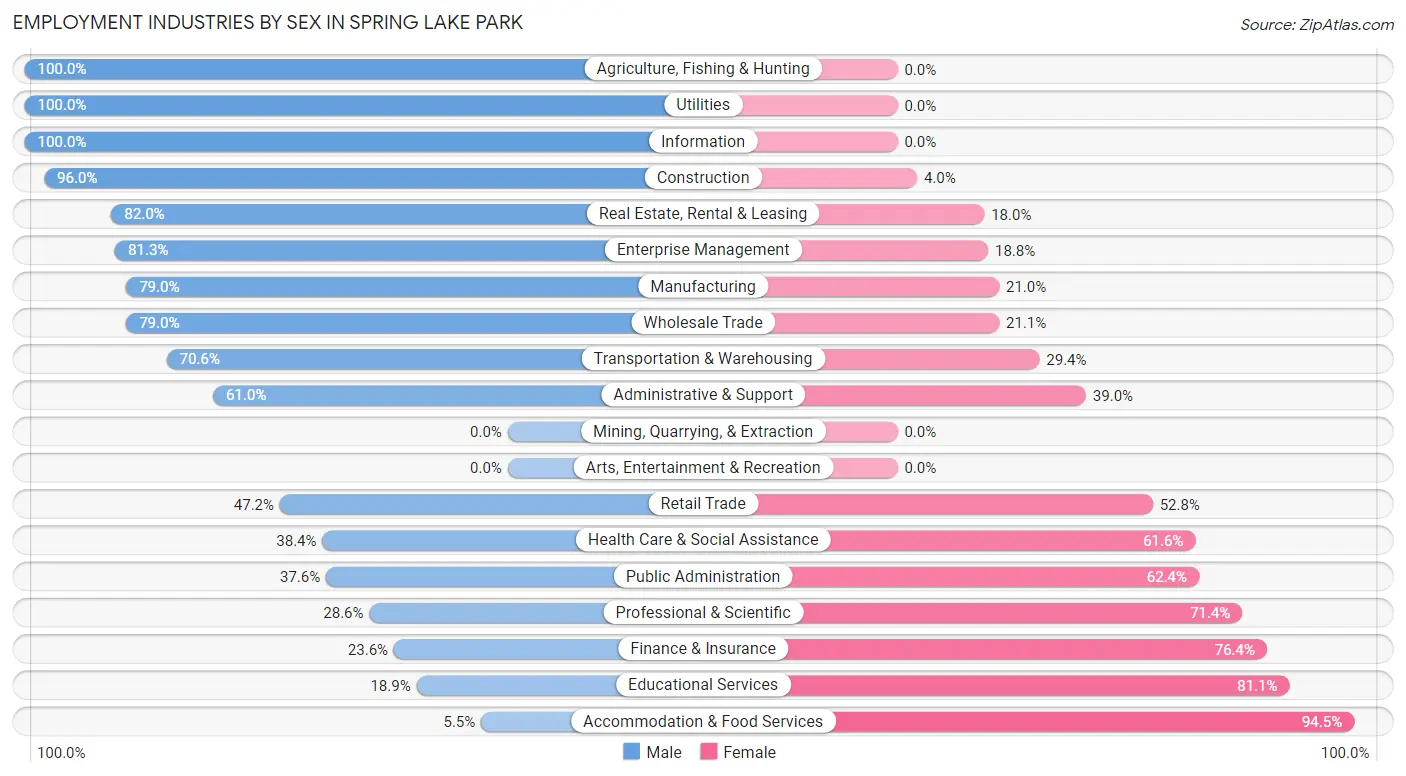
Employment Industries by Sex in Spring Lake Park
The Spring Lake Park industries that see more men than women are Agriculture, Fishing & Hunting (100.0%), Utilities (100.0%), and Information (100.0%), whereas the industries that tend to have a higher number of women are Accommodation & Food Services (94.5%), Educational Services (81.1%), and Finance & Insurance (76.4%).
| Industry | Male | Female |
| Agriculture, Fishing & Hunting | 13 (100.0%) | 0 (0.0%) |
| Mining, Quarrying, & Extraction | 0 (0.0%) | 0 (0.0%) |
| Construction | 214 (96.0%) | 9 (4.0%) |
| Manufacturing | 469 (79.0%) | 125 (21.0%) |
| Wholesale Trade | 105 (78.9%) | 28 (21.0%) |
| Retail Trade | 191 (47.2%) | 214 (52.8%) |
| Transportation & Warehousing | 113 (70.6%) | 47 (29.4%) |
| Utilities | 19 (100.0%) | 0 (0.0%) |
| Information | 5 (100.0%) | 0 (0.0%) |
| Finance & Insurance | 41 (23.6%) | 133 (76.4%) |
| Real Estate, Rental & Leasing | 105 (82.0%) | 23 (18.0%) |
| Professional & Scientific | 63 (28.6%) | 157 (71.4%) |
| Enterprise Management | 26 (81.2%) | 6 (18.8%) |
| Administrative & Support | 136 (61.0%) | 87 (39.0%) |
| Educational Services | 41 (18.9%) | 176 (81.1%) |
| Health Care & Social Assistance | 198 (38.4%) | 318 (61.6%) |
| Arts, Entertainment & Recreation | 0 (0.0%) | 0 (0.0%) |
| Accommodation & Food Services | 7 (5.5%) | 120 (94.5%) |
| Public Administration | 44 (37.6%) | 73 (62.4%) |
| Total | 1,877 (54.0%) | 1,598 (46.0%) |
Education in Spring Lake Park
School Enrollment in Spring Lake Park
The most common levels of schooling among the 1,466 students in Spring Lake Park are middle school (384 | 26.2%), elementary school (360 | 24.6%), and high school (358 | 24.4%).
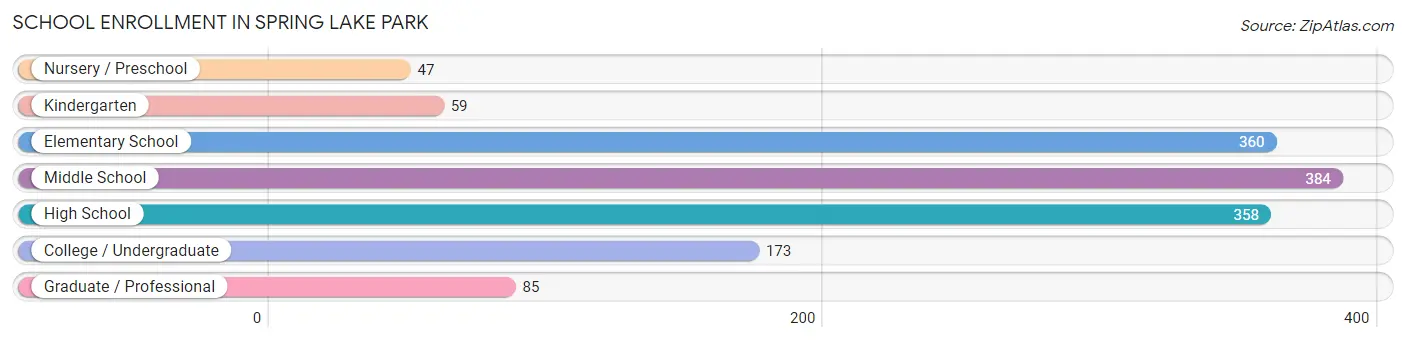
| School Level | # Students | % Students |
| Nursery / Preschool | 47 | 3.2% |
| Kindergarten | 59 | 4.0% |
| Elementary School | 360 | 24.6% |
| Middle School | 384 | 26.2% |
| High School | 358 | 24.4% |
| College / Undergraduate | 173 | 11.8% |
| Graduate / Professional | 85 | 5.8% |
| Total | 1,466 | 100.0% |
School Enrollment by Age by Funding Source in Spring Lake Park
Out of a total of 1,466 students who are enrolled in schools in Spring Lake Park, 40 (2.7%) attend a private institution, while the remaining 1,426 (97.3%) are enrolled in public schools. The age group of 35 years and over has the highest likelihood of being enrolled in private schools, with 13 (18.1% in the age bracket) enrolled. Conversely, the age group of 3 to 4 year olds has the lowest likelihood of being enrolled in a private school, with 5 (100.0% in the age bracket) attending a public institution.
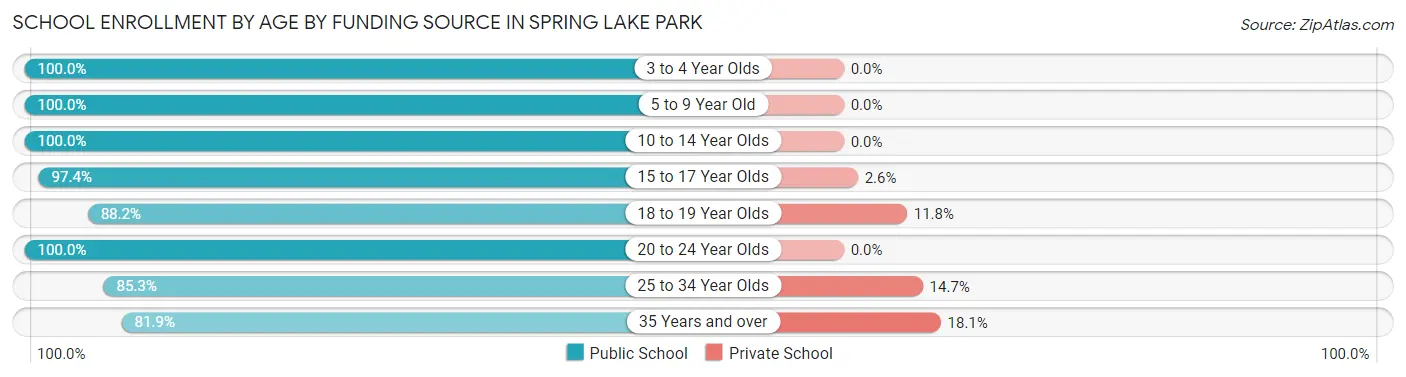
| Age Bracket | Public School | Private School |
| 3 to 4 Year Olds | 5 (100.0%) | 0 (0.0%) |
| 5 to 9 Year Old | 386 (100.0%) | 0 (0.0%) |
| 10 to 14 Year Olds | 484 (100.0%) | 0 (0.0%) |
| 15 to 17 Year Olds | 223 (97.4%) | 6 (2.6%) |
| 18 to 19 Year Olds | 75 (88.2%) | 10 (11.8%) |
| 20 to 24 Year Olds | 137 (100.0%) | 0 (0.0%) |
| 25 to 34 Year Olds | 58 (85.3%) | 10 (14.7%) |
| 35 Years and over | 59 (81.9%) | 13 (18.1%) |
| Total | 1,426 (97.3%) | 40 (2.7%) |
Educational Attainment by Field of Study in Spring Lake Park
Business (289 | 23.7%), education (176 | 14.4%), literature & languages (82 | 6.7%), engineering (81 | 6.7%), and social sciences (80 | 6.6%) are the most common fields of study among 1,218 individuals in Spring Lake Park who have obtained a bachelor's degree or higher.
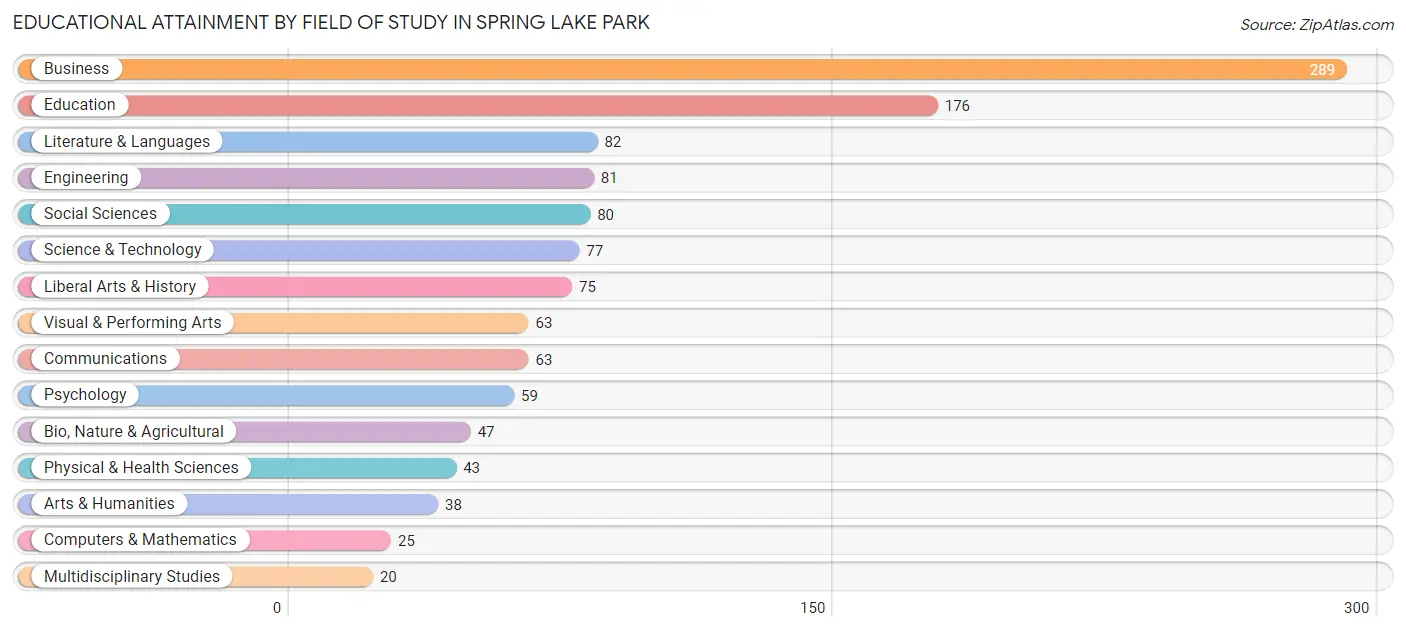
| Field of Study | # Graduates | % Graduates |
| Computers & Mathematics | 25 | 2.1% |
| Bio, Nature & Agricultural | 47 | 3.9% |
| Physical & Health Sciences | 43 | 3.5% |
| Psychology | 59 | 4.8% |
| Social Sciences | 80 | 6.6% |
| Engineering | 81 | 6.7% |
| Multidisciplinary Studies | 20 | 1.6% |
| Science & Technology | 77 | 6.3% |
| Business | 289 | 23.7% |
| Education | 176 | 14.4% |
| Literature & Languages | 82 | 6.7% |
| Liberal Arts & History | 75 | 6.2% |
| Visual & Performing Arts | 63 | 5.2% |
| Communications | 63 | 5.2% |
| Arts & Humanities | 38 | 3.1% |
| Total | 1,218 | 100.0% |
Transportation & Commute in Spring Lake Park
Vehicle Availability by Sex in Spring Lake Park
The most prevalent vehicle ownership categories in Spring Lake Park are males with 2 vehicles (902, accounting for 48.5%) and females with 2 vehicles (863, making up 57.7%).
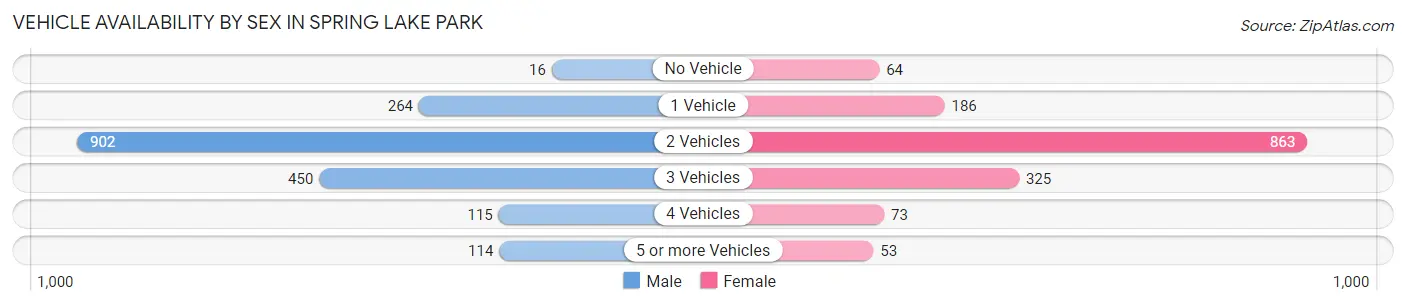
| Vehicles Available | Male | Female |
| No Vehicle | 16 (0.9%) | 64 (4.1%) |
| 1 Vehicle | 264 (14.2%) | 186 (11.9%) |
| 2 Vehicles | 902 (48.5%) | 863 (55.2%) |
| 3 Vehicles | 450 (24.2%) | 325 (20.8%) |
| 4 Vehicles | 115 (6.2%) | 73 (4.7%) |
| 5 or more Vehicles | 114 (6.1%) | 53 (3.4%) |
| Total | 1,861 (100.0%) | 1,564 (100.0%) |
Commute Time in Spring Lake Park
The most frequently occuring commute durations in Spring Lake Park are 20 to 24 minutes (535 commuters, 18.2%), 30 to 34 minutes (481 commuters, 16.4%), and 10 to 14 minutes (396 commuters, 13.5%).
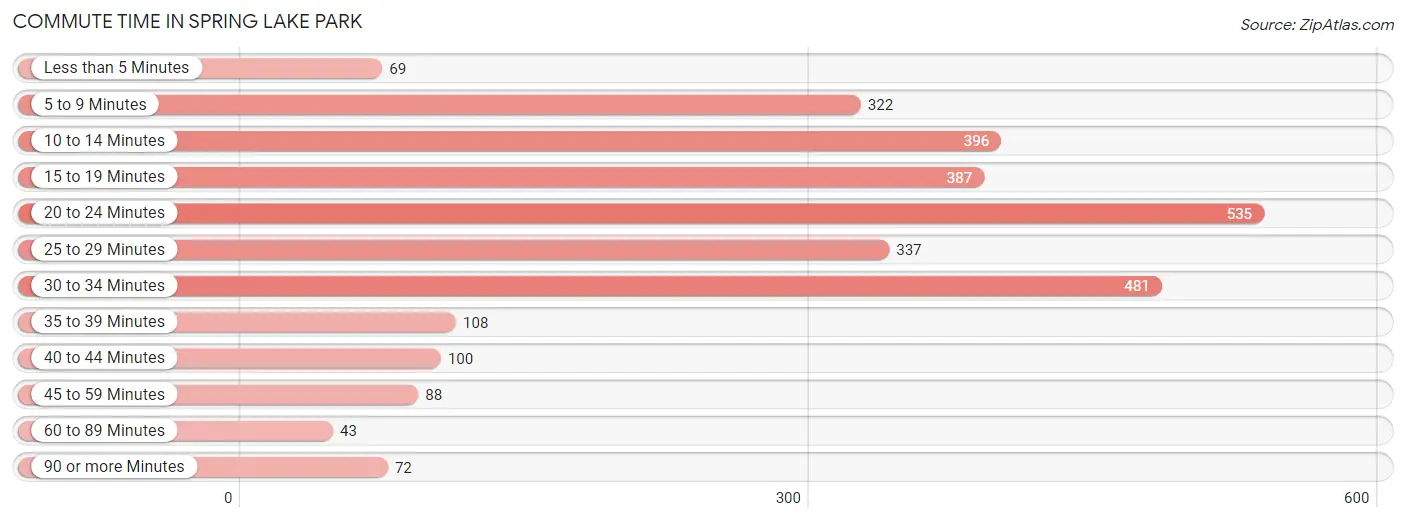
| Commute Time | # Commuters | % Commuters |
| Less than 5 Minutes | 69 | 2.4% |
| 5 to 9 Minutes | 322 | 11.0% |
| 10 to 14 Minutes | 396 | 13.5% |
| 15 to 19 Minutes | 387 | 13.2% |
| 20 to 24 Minutes | 535 | 18.2% |
| 25 to 29 Minutes | 337 | 11.5% |
| 30 to 34 Minutes | 481 | 16.4% |
| 35 to 39 Minutes | 108 | 3.7% |
| 40 to 44 Minutes | 100 | 3.4% |
| 45 to 59 Minutes | 88 | 3.0% |
| 60 to 89 Minutes | 43 | 1.5% |
| 90 or more Minutes | 72 | 2.5% |
Commute Time by Sex in Spring Lake Park
The most common commute times in Spring Lake Park are 30 to 34 minutes (333 commuters, 20.0%) for males and 20 to 24 minutes (219 commuters, 17.2%) for females.
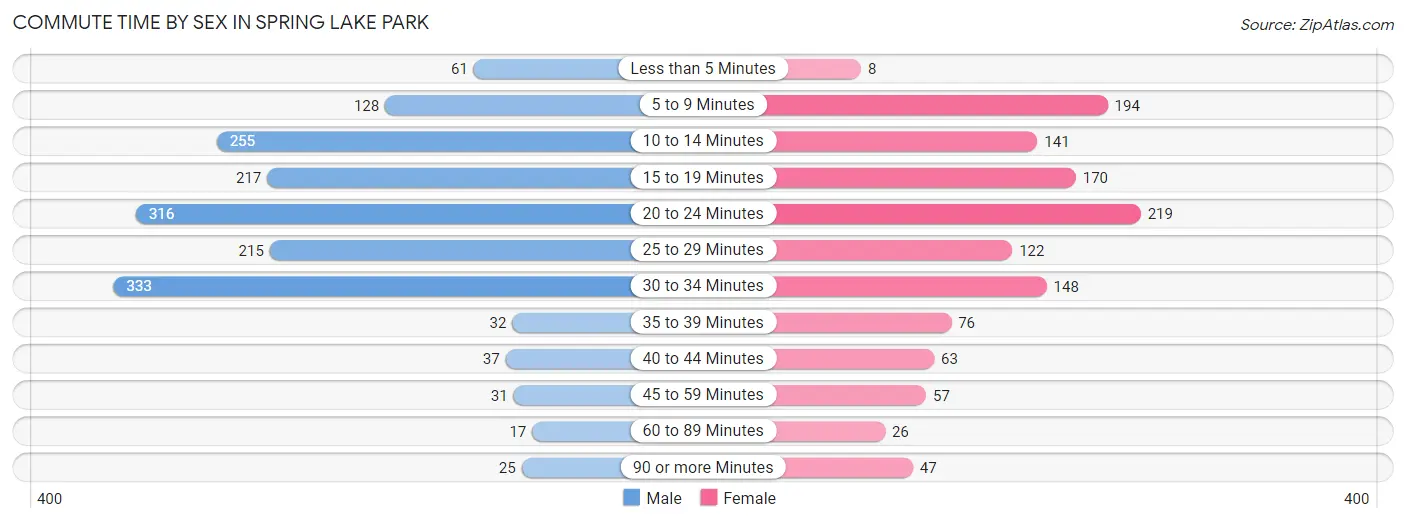
| Commute Time | Male | Female |
| Less than 5 Minutes | 61 (3.7%) | 8 (0.6%) |
| 5 to 9 Minutes | 128 (7.7%) | 194 (15.3%) |
| 10 to 14 Minutes | 255 (15.3%) | 141 (11.1%) |
| 15 to 19 Minutes | 217 (13.0%) | 170 (13.4%) |
| 20 to 24 Minutes | 316 (19.0%) | 219 (17.2%) |
| 25 to 29 Minutes | 215 (12.9%) | 122 (9.6%) |
| 30 to 34 Minutes | 333 (20.0%) | 148 (11.6%) |
| 35 to 39 Minutes | 32 (1.9%) | 76 (6.0%) |
| 40 to 44 Minutes | 37 (2.2%) | 63 (5.0%) |
| 45 to 59 Minutes | 31 (1.9%) | 57 (4.5%) |
| 60 to 89 Minutes | 17 (1.0%) | 26 (2.1%) |
| 90 or more Minutes | 25 (1.5%) | 47 (3.7%) |
Time of Departure to Work by Sex in Spring Lake Park
The most frequent times of departure to work in Spring Lake Park are 6:30 AM to 6:59 AM (177, 10.6%) for males and 7:00 AM to 7:29 AM (188, 14.8%) for females.
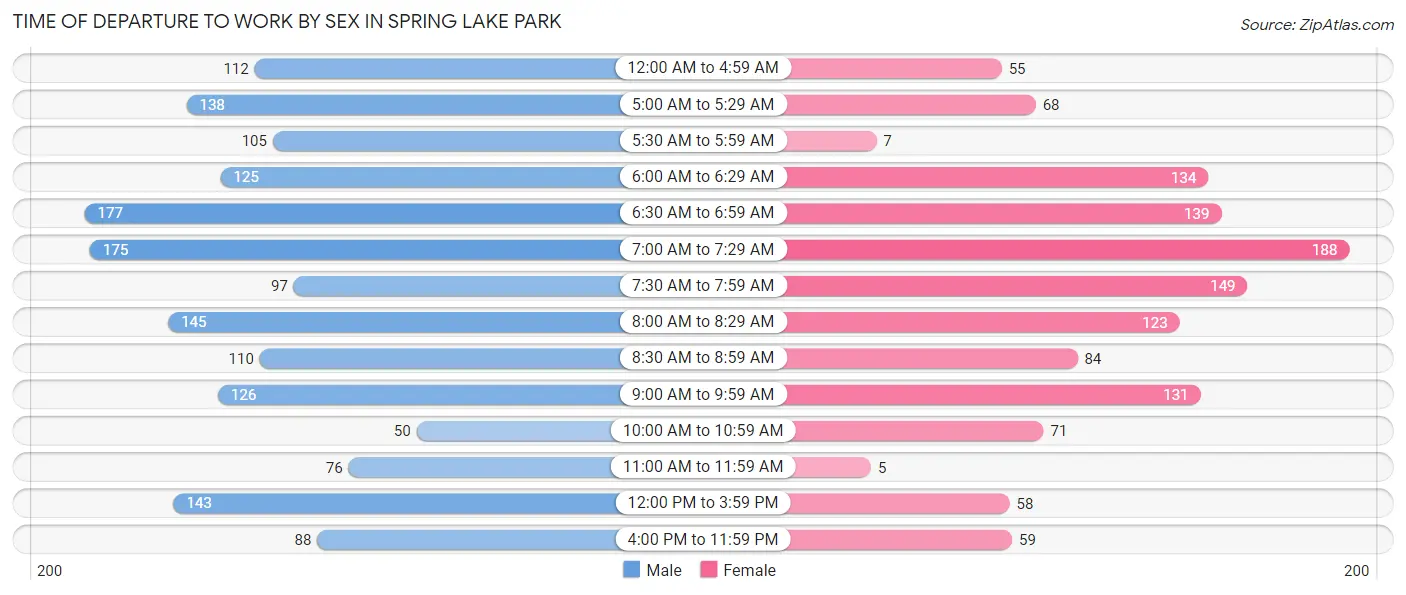
| Time of Departure | Male | Female |
| 12:00 AM to 4:59 AM | 112 (6.7%) | 55 (4.3%) |
| 5:00 AM to 5:29 AM | 138 (8.3%) | 68 (5.3%) |
| 5:30 AM to 5:59 AM | 105 (6.3%) | 7 (0.5%) |
| 6:00 AM to 6:29 AM | 125 (7.5%) | 134 (10.5%) |
| 6:30 AM to 6:59 AM | 177 (10.6%) | 139 (10.9%) |
| 7:00 AM to 7:29 AM | 175 (10.5%) | 188 (14.8%) |
| 7:30 AM to 7:59 AM | 97 (5.8%) | 149 (11.7%) |
| 8:00 AM to 8:29 AM | 145 (8.7%) | 123 (9.7%) |
| 8:30 AM to 8:59 AM | 110 (6.6%) | 84 (6.6%) |
| 9:00 AM to 9:59 AM | 126 (7.6%) | 131 (10.3%) |
| 10:00 AM to 10:59 AM | 50 (3.0%) | 71 (5.6%) |
| 11:00 AM to 11:59 AM | 76 (4.6%) | 5 (0.4%) |
| 12:00 PM to 3:59 PM | 143 (8.6%) | 58 (4.6%) |
| 4:00 PM to 11:59 PM | 88 (5.3%) | 59 (4.6%) |
| Total | 1,667 (100.0%) | 1,271 (100.0%) |
Housing Occupancy in Spring Lake Park
Occupancy by Ownership in Spring Lake Park
Of the total 2,658 dwellings in Spring Lake Park, owner-occupied units account for 1,865 (70.2%), while renter-occupied units make up 793 (29.8%).
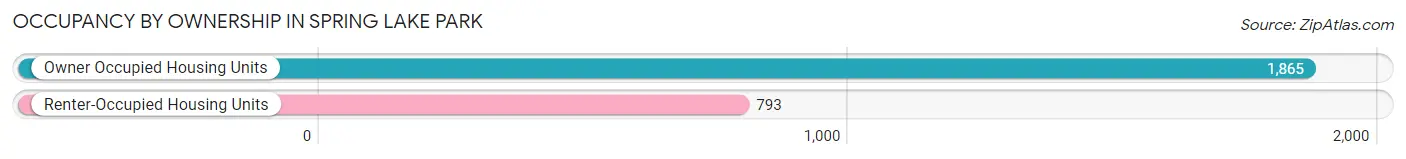
| Occupancy | # Housing Units | % Housing Units |
| Owner Occupied Housing Units | 1,865 | 70.2% |
| Renter-Occupied Housing Units | 793 | 29.8% |
| Total Occupied Housing Units | 2,658 | 100.0% |
Occupancy by Household Size in Spring Lake Park
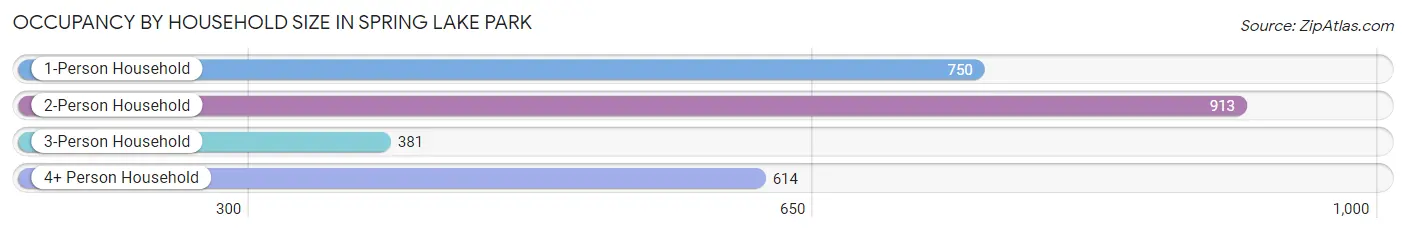
| Household Size | # Housing Units | % Housing Units |
| 1-Person Household | 750 | 28.2% |
| 2-Person Household | 913 | 34.4% |
| 3-Person Household | 381 | 14.3% |
| 4+ Person Household | 614 | 23.1% |
| Total Housing Units | 2,658 | 100.0% |
Occupancy by Ownership by Household Size in Spring Lake Park
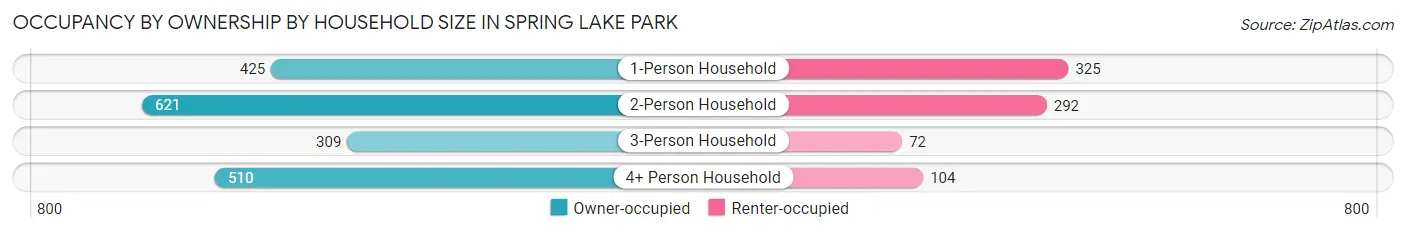
| Household Size | Owner-occupied | Renter-occupied |
| 1-Person Household | 425 (56.7%) | 325 (43.3%) |
| 2-Person Household | 621 (68.0%) | 292 (32.0%) |
| 3-Person Household | 309 (81.1%) | 72 (18.9%) |
| 4+ Person Household | 510 (83.1%) | 104 (16.9%) |
| Total Housing Units | 1,865 (70.2%) | 793 (29.8%) |
Occupancy by Educational Attainment in Spring Lake Park
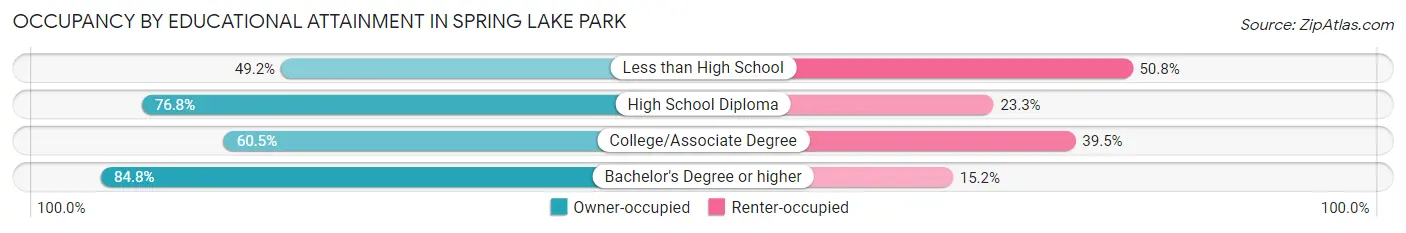
| Household Size | Owner-occupied | Renter-occupied |
| Less than High School | 90 (49.2%) | 93 (50.8%) |
| High School Diploma | 571 (76.7%) | 173 (23.3%) |
| College/Associate Degree | 657 (60.5%) | 429 (39.5%) |
| Bachelor's Degree or higher | 547 (84.8%) | 98 (15.2%) |
Occupancy by Age of Householder in Spring Lake Park
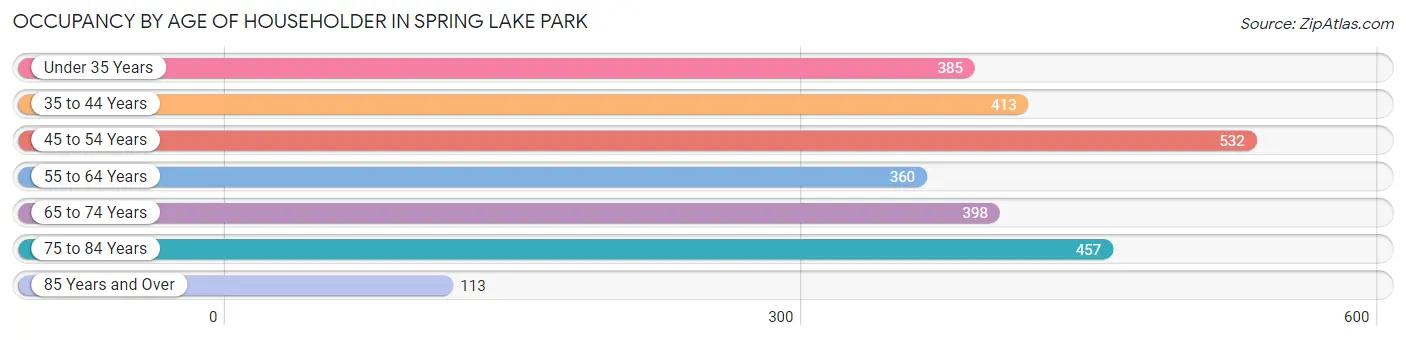
| Age Bracket | # Households | % Households |
| Under 35 Years | 385 | 14.5% |
| 35 to 44 Years | 413 | 15.5% |
| 45 to 54 Years | 532 | 20.0% |
| 55 to 64 Years | 360 | 13.5% |
| 65 to 74 Years | 398 | 15.0% |
| 75 to 84 Years | 457 | 17.2% |
| 85 Years and Over | 113 | 4.3% |
| Total | 2,658 | 100.0% |
Housing Finances in Spring Lake Park
Median Income by Occupancy in Spring Lake Park
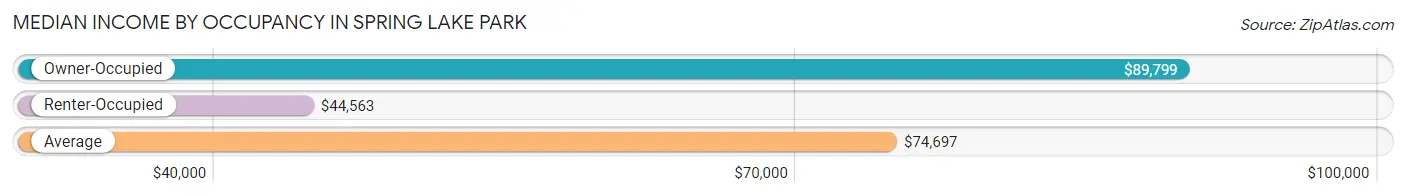
| Occupancy Type | # Households | Median Income |
| Owner-Occupied | 1,865 (70.2%) | $89,799 |
| Renter-Occupied | 793 (29.8%) | $44,563 |
| Average | 2,658 (100.0%) | $74,697 |
Occupancy by Householder Income Bracket in Spring Lake Park
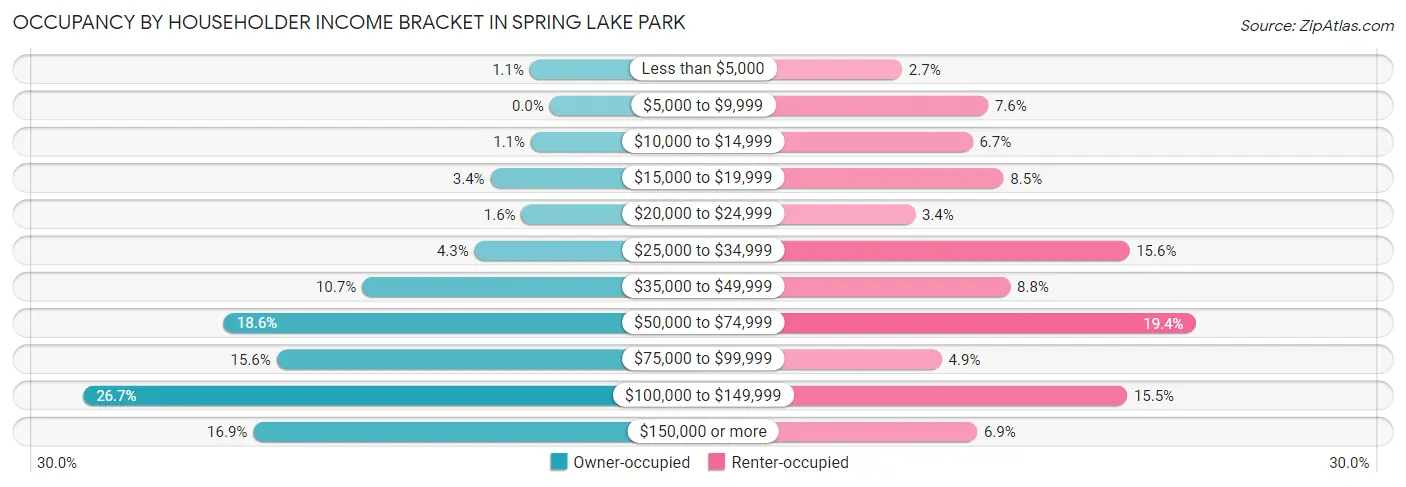
| Income Bracket | Owner-occupied | Renter-occupied |
| Less than $5,000 | 21 (1.1%) | 21 (2.6%) |
| $5,000 to $9,999 | 0 (0.0%) | 60 (7.6%) |
| $10,000 to $14,999 | 20 (1.1%) | 53 (6.7%) |
| $15,000 to $19,999 | 63 (3.4%) | 67 (8.5%) |
| $20,000 to $24,999 | 30 (1.6%) | 27 (3.4%) |
| $25,000 to $34,999 | 80 (4.3%) | 124 (15.6%) |
| $35,000 to $49,999 | 200 (10.7%) | 70 (8.8%) |
| $50,000 to $74,999 | 347 (18.6%) | 154 (19.4%) |
| $75,000 to $99,999 | 291 (15.6%) | 39 (4.9%) |
| $100,000 to $149,999 | 497 (26.7%) | 123 (15.5%) |
| $150,000 or more | 316 (16.9%) | 55 (6.9%) |
| Total | 1,865 (100.0%) | 793 (100.0%) |
Monthly Housing Cost Tiers in Spring Lake Park
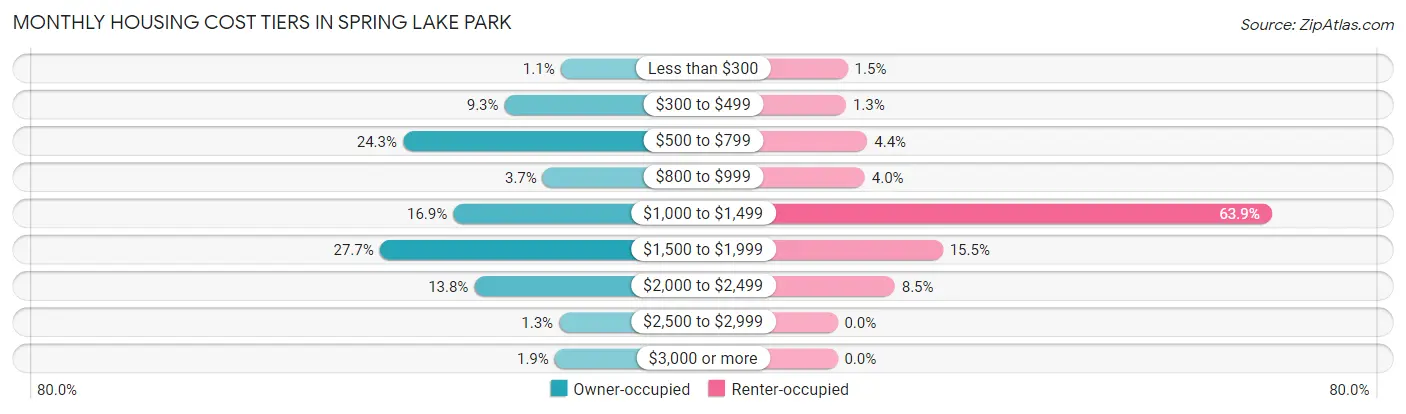
| Monthly Cost | Owner-occupied | Renter-occupied |
| Less than $300 | 20 (1.1%) | 12 (1.5%) |
| $300 to $499 | 174 (9.3%) | 10 (1.3%) |
| $500 to $799 | 453 (24.3%) | 35 (4.4%) |
| $800 to $999 | 69 (3.7%) | 32 (4.0%) |
| $1,000 to $1,499 | 315 (16.9%) | 507 (63.9%) |
| $1,500 to $1,999 | 517 (27.7%) | 123 (15.5%) |
| $2,000 to $2,499 | 257 (13.8%) | 67 (8.5%) |
| $2,500 to $2,999 | 24 (1.3%) | 0 (0.0%) |
| $3,000 or more | 36 (1.9%) | 0 (0.0%) |
| Total | 1,865 (100.0%) | 793 (100.0%) |
Physical Housing Characteristics in Spring Lake Park
Housing Structures in Spring Lake Park
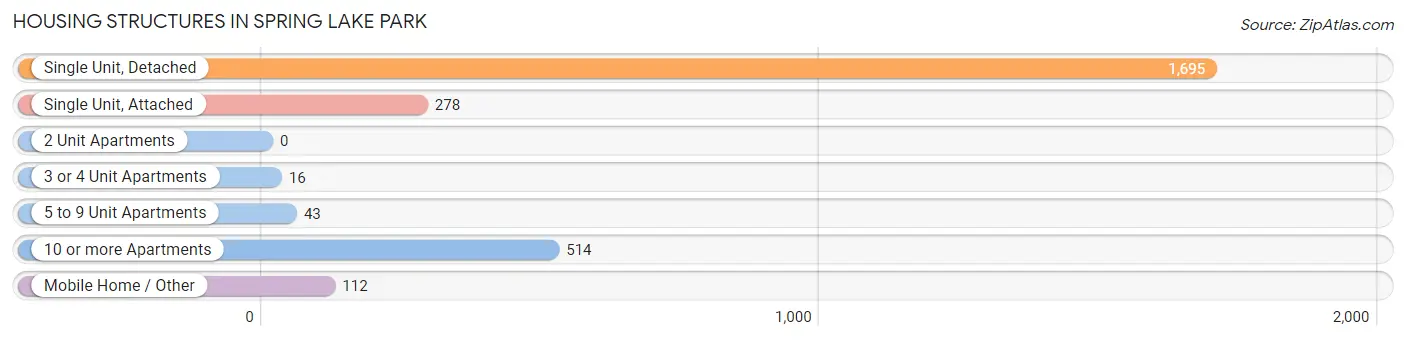
| Structure Type | # Housing Units | % Housing Units |
| Single Unit, Detached | 1,695 | 63.8% |
| Single Unit, Attached | 278 | 10.5% |
| 2 Unit Apartments | 0 | 0.0% |
| 3 or 4 Unit Apartments | 16 | 0.6% |
| 5 to 9 Unit Apartments | 43 | 1.6% |
| 10 or more Apartments | 514 | 19.3% |
| Mobile Home / Other | 112 | 4.2% |
| Total | 2,658 | 100.0% |
Housing Structures by Occupancy in Spring Lake Park
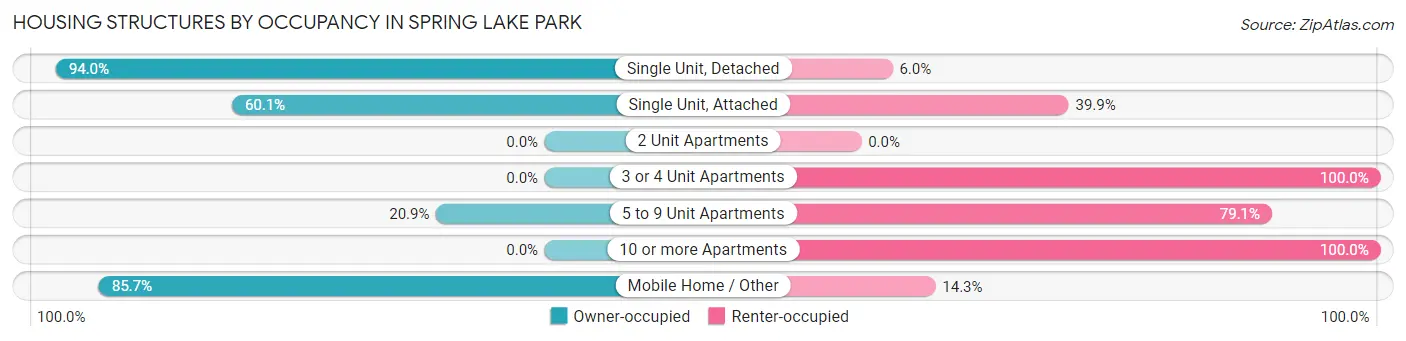
| Structure Type | Owner-occupied | Renter-occupied |
| Single Unit, Detached | 1,593 (94.0%) | 102 (6.0%) |
| Single Unit, Attached | 167 (60.1%) | 111 (39.9%) |
| 2 Unit Apartments | 0 (0.0%) | 0 (0.0%) |
| 3 or 4 Unit Apartments | 0 (0.0%) | 16 (100.0%) |
| 5 to 9 Unit Apartments | 9 (20.9%) | 34 (79.1%) |
| 10 or more Apartments | 0 (0.0%) | 514 (100.0%) |
| Mobile Home / Other | 96 (85.7%) | 16 (14.3%) |
| Total | 1,865 (70.2%) | 793 (29.8%) |
Housing Structures by Number of Rooms in Spring Lake Park
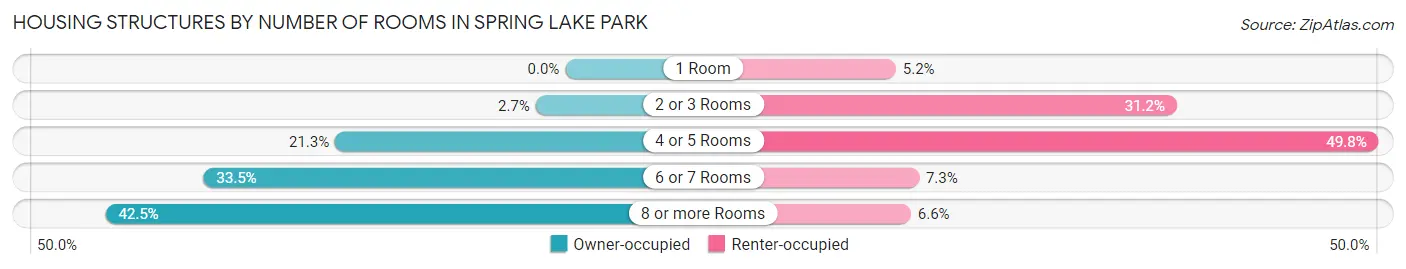
| Number of Rooms | Owner-occupied | Renter-occupied |
| 1 Room | 0 (0.0%) | 41 (5.2%) |
| 2 or 3 Rooms | 51 (2.7%) | 247 (31.1%) |
| 4 or 5 Rooms | 397 (21.3%) | 395 (49.8%) |
| 6 or 7 Rooms | 624 (33.5%) | 58 (7.3%) |
| 8 or more Rooms | 793 (42.5%) | 52 (6.6%) |
| Total | 1,865 (100.0%) | 793 (100.0%) |
Housing Structure by Heating Type in Spring Lake Park
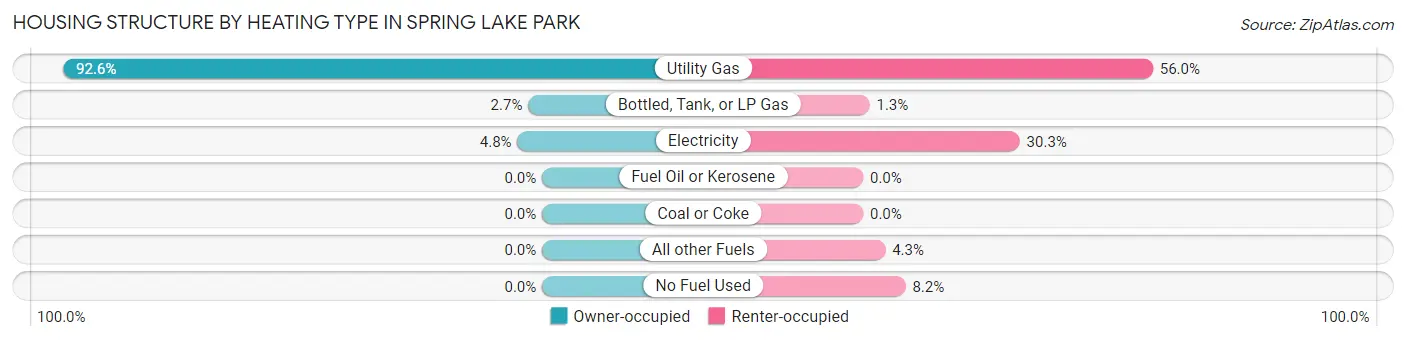
| Heating Type | Owner-occupied | Renter-occupied |
| Utility Gas | 1,726 (92.5%) | 444 (56.0%) |
| Bottled, Tank, or LP Gas | 50 (2.7%) | 10 (1.3%) |
| Electricity | 89 (4.8%) | 240 (30.3%) |
| Fuel Oil or Kerosene | 0 (0.0%) | 0 (0.0%) |
| Coal or Coke | 0 (0.0%) | 0 (0.0%) |
| All other Fuels | 0 (0.0%) | 34 (4.3%) |
| No Fuel Used | 0 (0.0%) | 65 (8.2%) |
| Total | 1,865 (100.0%) | 793 (100.0%) |
Household Vehicle Usage in Spring Lake Park
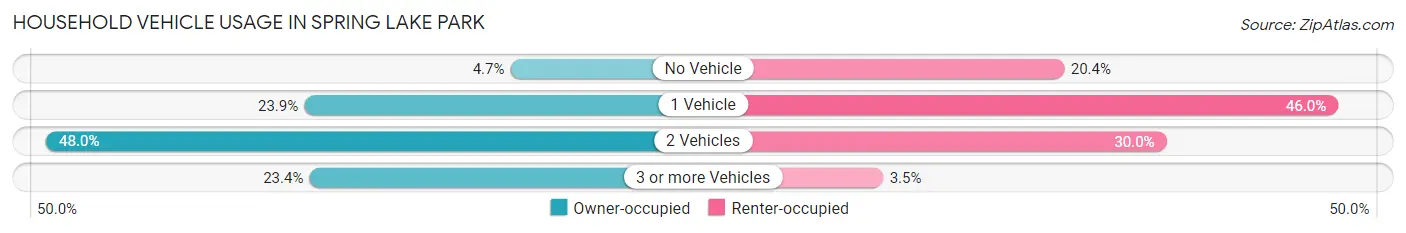
| Vehicles per Household | Owner-occupied | Renter-occupied |
| No Vehicle | 87 (4.7%) | 162 (20.4%) |
| 1 Vehicle | 446 (23.9%) | 365 (46.0%) |
| 2 Vehicles | 895 (48.0%) | 238 (30.0%) |
| 3 or more Vehicles | 437 (23.4%) | 28 (3.5%) |
| Total | 1,865 (100.0%) | 793 (100.0%) |
Real Estate & Mortgages in Spring Lake Park
Real Estate and Mortgage Overview in Spring Lake Park
| Characteristic | Without Mortgage | With Mortgage |
| Housing Units | 677 | 1,188 |
| Median Property Value | $249,200 | $267,800 |
| Median Household Income | $77,614 | $265 |
| Monthly Housing Costs | $625 | $36 |
| Real Estate Taxes | $2,759 | $0 |
Property Value by Mortgage Status in Spring Lake Park
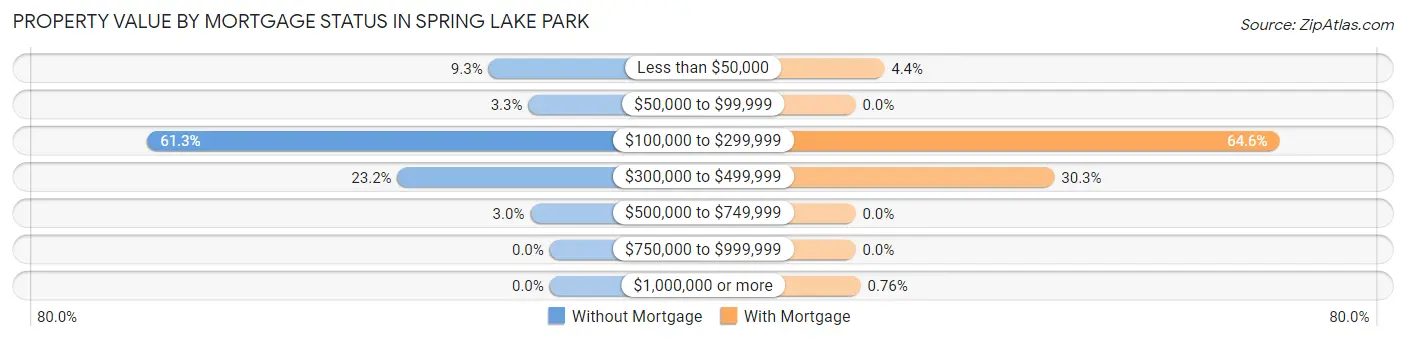
| Property Value | Without Mortgage | With Mortgage |
| Less than $50,000 | 63 (9.3%) | 52 (4.4%) |
| $50,000 to $99,999 | 22 (3.3%) | 0 (0.0%) |
| $100,000 to $299,999 | 415 (61.3%) | 767 (64.6%) |
| $300,000 to $499,999 | 157 (23.2%) | 360 (30.3%) |
| $500,000 to $749,999 | 20 (2.9%) | 0 (0.0%) |
| $750,000 to $999,999 | 0 (0.0%) | 0 (0.0%) |
| $1,000,000 or more | 0 (0.0%) | 9 (0.8%) |
| Total | 677 (100.0%) | 1,188 (100.0%) |
Household Income by Mortgage Status in Spring Lake Park
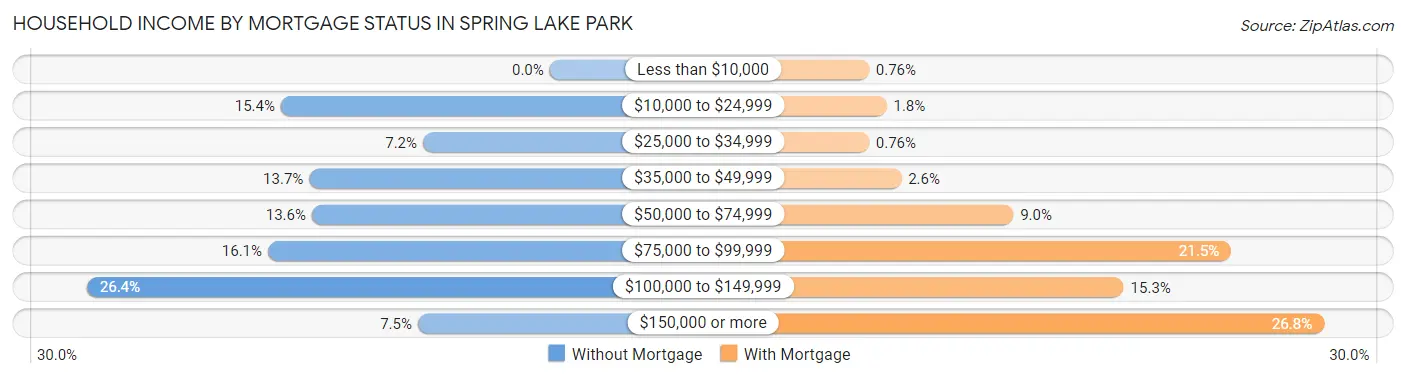
| Household Income | Without Mortgage | With Mortgage |
| Less than $10,000 | 0 (0.0%) | 9 (0.8%) |
| $10,000 to $24,999 | 104 (15.4%) | 21 (1.8%) |
| $25,000 to $34,999 | 49 (7.2%) | 9 (0.8%) |
| $35,000 to $49,999 | 93 (13.7%) | 31 (2.6%) |
| $50,000 to $74,999 | 92 (13.6%) | 107 (9.0%) |
| $75,000 to $99,999 | 109 (16.1%) | 255 (21.5%) |
| $100,000 to $149,999 | 179 (26.4%) | 182 (15.3%) |
| $150,000 or more | 51 (7.5%) | 318 (26.8%) |
| Total | 677 (100.0%) | 1,188 (100.0%) |
Property Value to Household Income Ratio in Spring Lake Park
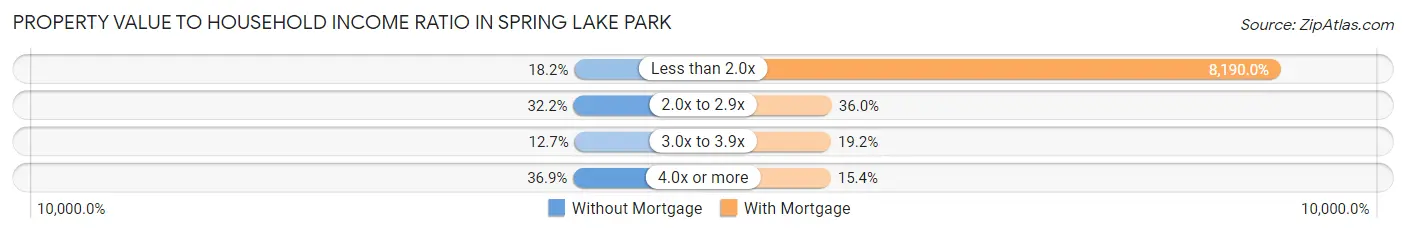
| Value-to-Income Ratio | Without Mortgage | With Mortgage |
| Less than 2.0x | 123 (18.2%) | 97,297 (8,190.0%) |
| 2.0x to 2.9x | 218 (32.2%) | 428 (36.0%) |
| 3.0x to 3.9x | 86 (12.7%) | 228 (19.2%) |
| 4.0x or more | 250 (36.9%) | 183 (15.4%) |
| Total | 677 (100.0%) | 1,188 (100.0%) |
Real Estate Taxes by Mortgage Status in Spring Lake Park
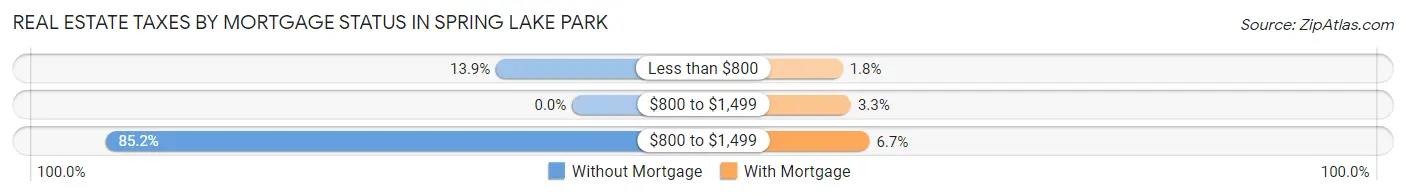
| Property Taxes | Without Mortgage | With Mortgage |
| Less than $800 | 94 (13.9%) | 21 (1.8%) |
| $800 to $1,499 | 0 (0.0%) | 39 (3.3%) |
| $800 to $1,499 | 577 (85.2%) | 79 (6.7%) |
| Total | 677 (100.0%) | 1,188 (100.0%) |
Health & Disability in Spring Lake Park
Health Insurance Coverage by Age in Spring Lake Park
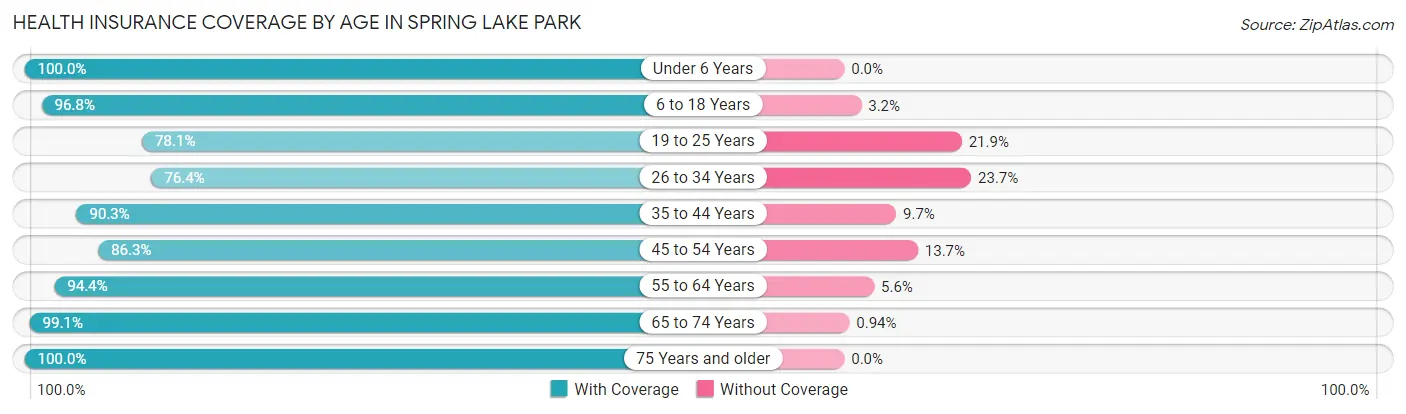
| Age Bracket | With Coverage | Without Coverage |
| Under 6 Years | 339 (100.0%) | 0 (0.0%) |
| 6 to 18 Years | 1,100 (96.8%) | 36 (3.2%) |
| 19 to 25 Years | 517 (78.1%) | 145 (21.9%) |
| 26 to 34 Years | 581 (76.3%) | 180 (23.6%) |
| 35 to 44 Years | 786 (90.3%) | 84 (9.7%) |
| 45 to 54 Years | 899 (86.3%) | 143 (13.7%) |
| 55 to 64 Years | 713 (94.4%) | 42 (5.6%) |
| 65 to 74 Years | 630 (99.1%) | 6 (0.9%) |
| 75 Years and older | 757 (100.0%) | 0 (0.0%) |
| Total | 6,322 (90.9%) | 636 (9.1%) |
Health Insurance Coverage by Citizenship Status in Spring Lake Park
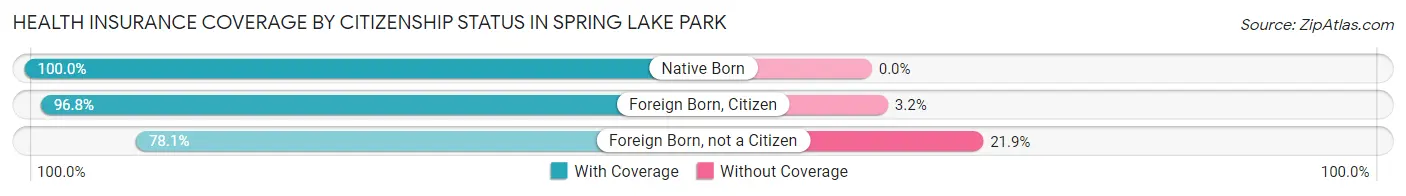
| Citizenship Status | With Coverage | Without Coverage |
| Native Born | 339 (100.0%) | 0 (0.0%) |
| Foreign Born, Citizen | 1,100 (96.8%) | 36 (3.2%) |
| Foreign Born, not a Citizen | 517 (78.1%) | 145 (21.9%) |
Health Insurance Coverage by Household Income in Spring Lake Park
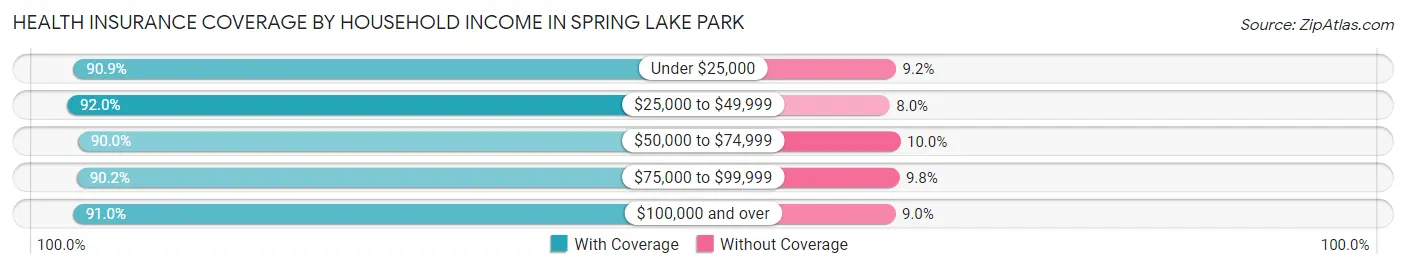
| Household Income | With Coverage | Without Coverage |
| Under $25,000 | 596 (90.8%) | 60 (9.1%) |
| $25,000 to $49,999 | 807 (92.0%) | 70 (8.0%) |
| $50,000 to $74,999 | 1,064 (90.0%) | 118 (10.0%) |
| $75,000 to $99,999 | 868 (90.2%) | 94 (9.8%) |
| $100,000 and over | 2,965 (91.0%) | 294 (9.0%) |
Public vs Private Health Insurance Coverage by Age in Spring Lake Park
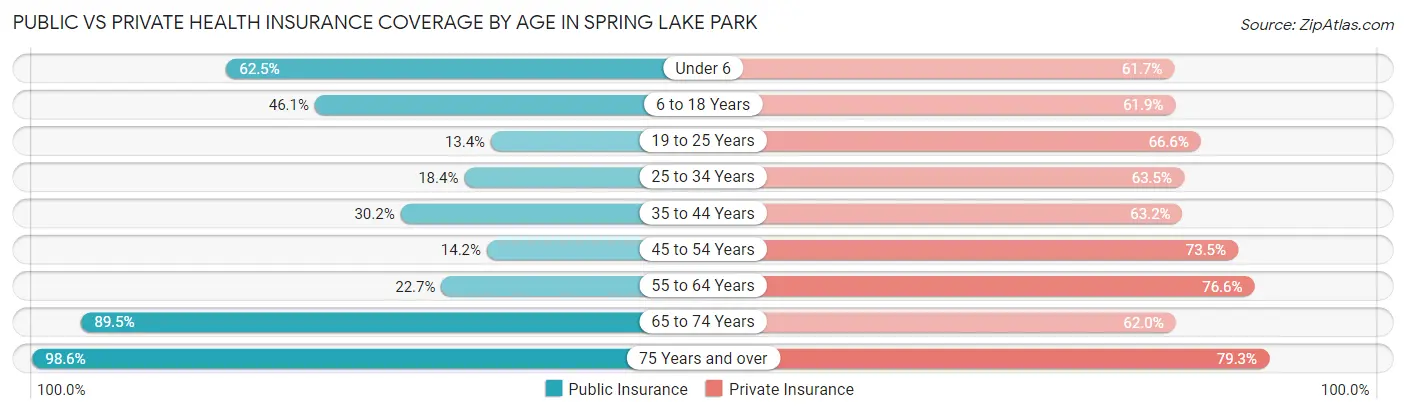
| Age Bracket | Public Insurance | Private Insurance |
| Under 6 | 212 (62.5%) | 209 (61.7%) |
| 6 to 18 Years | 524 (46.1%) | 703 (61.9%) |
| 19 to 25 Years | 89 (13.4%) | 441 (66.6%) |
| 25 to 34 Years | 140 (18.4%) | 483 (63.5%) |
| 35 to 44 Years | 263 (30.2%) | 550 (63.2%) |
| 45 to 54 Years | 148 (14.2%) | 766 (73.5%) |
| 55 to 64 Years | 171 (22.7%) | 578 (76.6%) |
| 65 to 74 Years | 569 (89.5%) | 394 (62.0%) |
| 75 Years and over | 746 (98.6%) | 600 (79.3%) |
| Total | 2,862 (41.1%) | 4,724 (67.9%) |
Disability Status by Sex by Age in Spring Lake Park
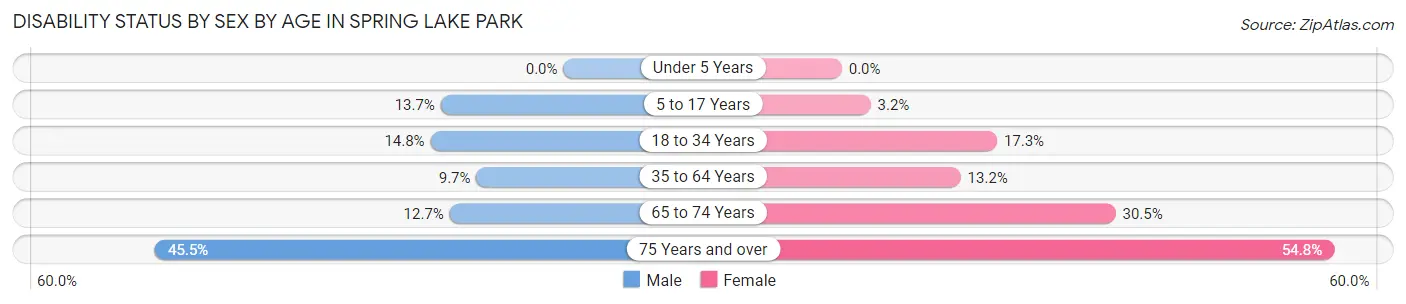
| Age Bracket | Male | Female |
| Under 5 Years | 0 (0.0%) | 0 (0.0%) |
| 5 to 17 Years | 72 (13.7%) | 20 (3.2%) |
| 18 to 34 Years | 136 (14.8%) | 99 (17.3%) |
| 35 to 64 Years | 123 (9.7%) | 185 (13.2%) |
| 65 to 74 Years | 39 (12.7%) | 100 (30.5%) |
| 75 Years and over | 141 (45.5%) | 245 (54.8%) |
Disability Class by Sex by Age in Spring Lake Park
Disability Class: Hearing Difficulty
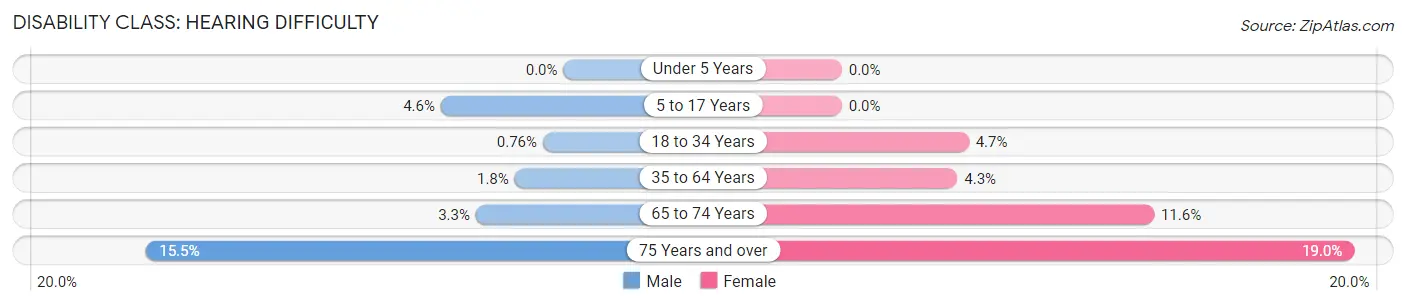
| Age Bracket | Male | Female |
| Under 5 Years | 0 (0.0%) | 0 (0.0%) |
| 5 to 17 Years | 24 (4.5%) | 0 (0.0%) |
| 18 to 34 Years | 7 (0.8%) | 27 (4.7%) |
| 35 to 64 Years | 23 (1.8%) | 60 (4.3%) |
| 65 to 74 Years | 10 (3.3%) | 38 (11.6%) |
| 75 Years and over | 48 (15.5%) | 85 (19.0%) |
Disability Class: Vision Difficulty
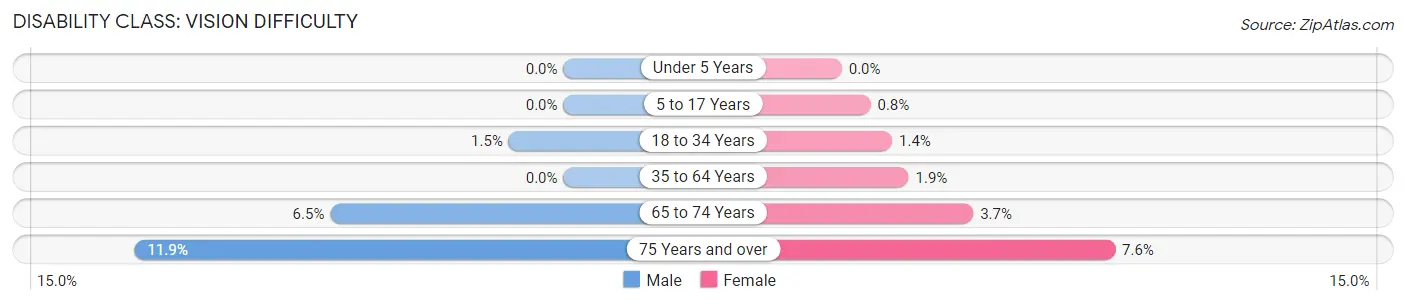
| Age Bracket | Male | Female |
| Under 5 Years | 0 (0.0%) | 0 (0.0%) |
| 5 to 17 Years | 0 (0.0%) | 5 (0.8%) |
| 18 to 34 Years | 14 (1.5%) | 8 (1.4%) |
| 35 to 64 Years | 0 (0.0%) | 26 (1.9%) |
| 65 to 74 Years | 20 (6.5%) | 12 (3.7%) |
| 75 Years and over | 37 (11.9%) | 34 (7.6%) |
Disability Class: Cognitive Difficulty
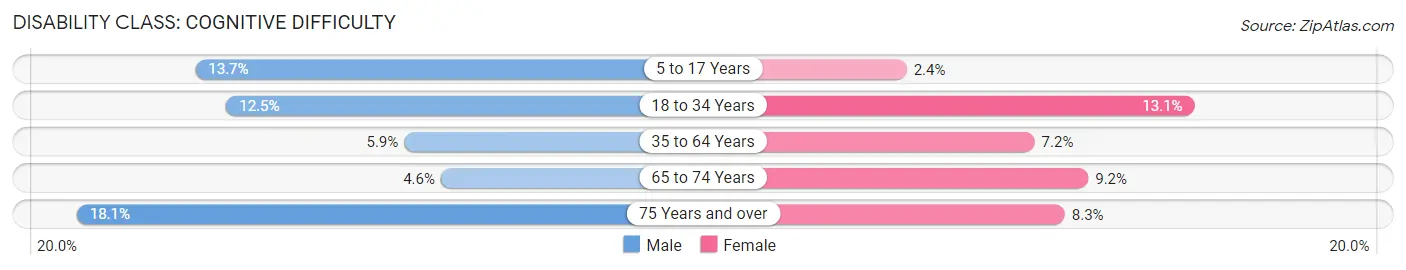
| Age Bracket | Male | Female |
| 5 to 17 Years | 72 (13.7%) | 15 (2.4%) |
| 18 to 34 Years | 115 (12.5%) | 75 (13.1%) |
| 35 to 64 Years | 75 (5.9%) | 100 (7.2%) |
| 65 to 74 Years | 14 (4.5%) | 30 (9.1%) |
| 75 Years and over | 56 (18.1%) | 37 (8.3%) |
Disability Class: Ambulatory Difficulty
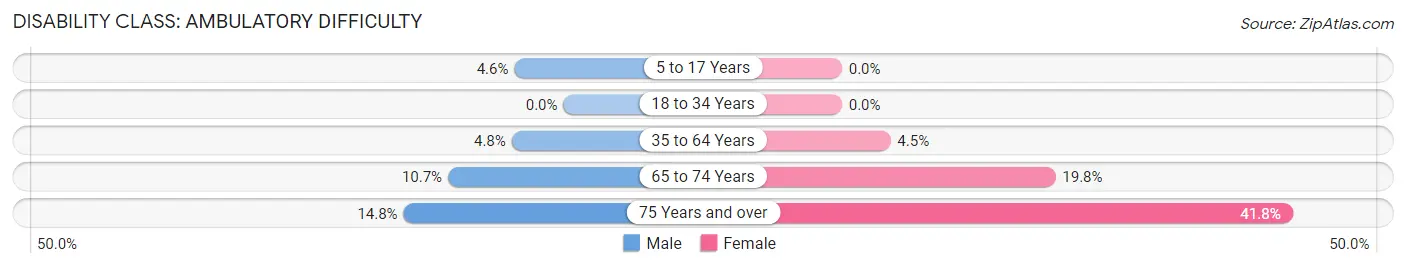
| Age Bracket | Male | Female |
| 5 to 17 Years | 24 (4.5%) | 0 (0.0%) |
| 18 to 34 Years | 0 (0.0%) | 0 (0.0%) |
| 35 to 64 Years | 61 (4.8%) | 63 (4.5%) |
| 65 to 74 Years | 33 (10.7%) | 65 (19.8%) |
| 75 Years and over | 46 (14.8%) | 187 (41.8%) |
Disability Class: Self-Care Difficulty
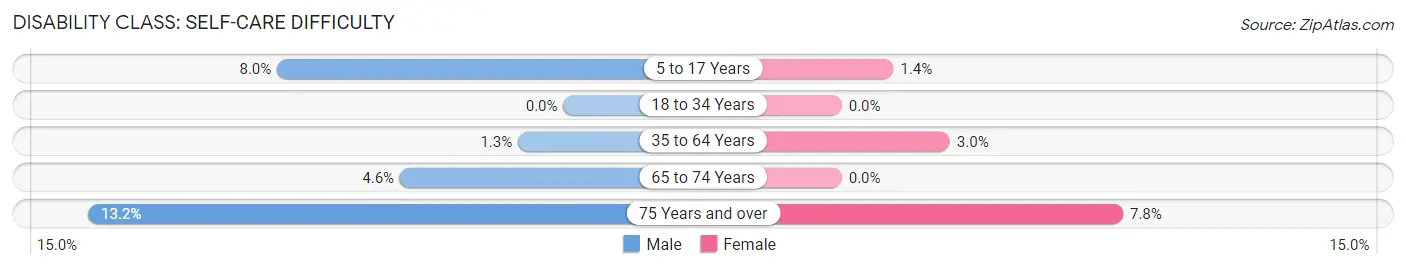
| Age Bracket | Male | Female |
| 5 to 17 Years | 42 (8.0%) | 9 (1.4%) |
| 18 to 34 Years | 0 (0.0%) | 0 (0.0%) |
| 35 to 64 Years | 16 (1.3%) | 42 (3.0%) |
| 65 to 74 Years | 14 (4.5%) | 0 (0.0%) |
| 75 Years and over | 41 (13.2%) | 35 (7.8%) |
Technology Access in Spring Lake Park
Computing Device Access in Spring Lake Park
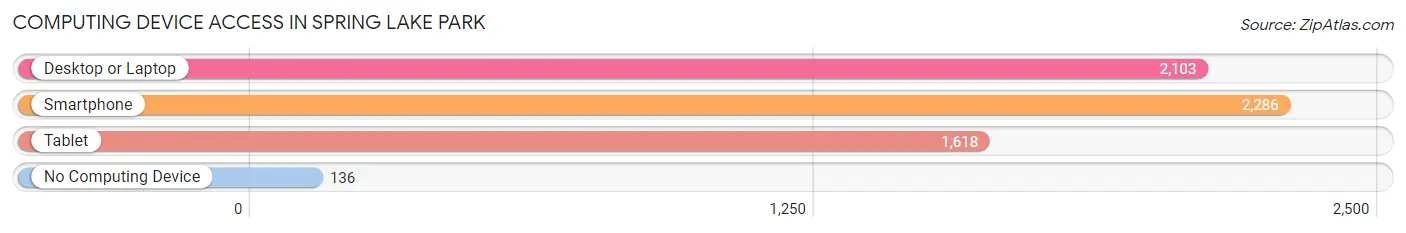
| Device Type | # Households | % Households |
| Desktop or Laptop | 2,103 | 79.1% |
| Smartphone | 2,286 | 86.0% |
| Tablet | 1,618 | 60.9% |
| No Computing Device | 136 | 5.1% |
| Total | 2,658 | 100.0% |
Internet Access in Spring Lake Park
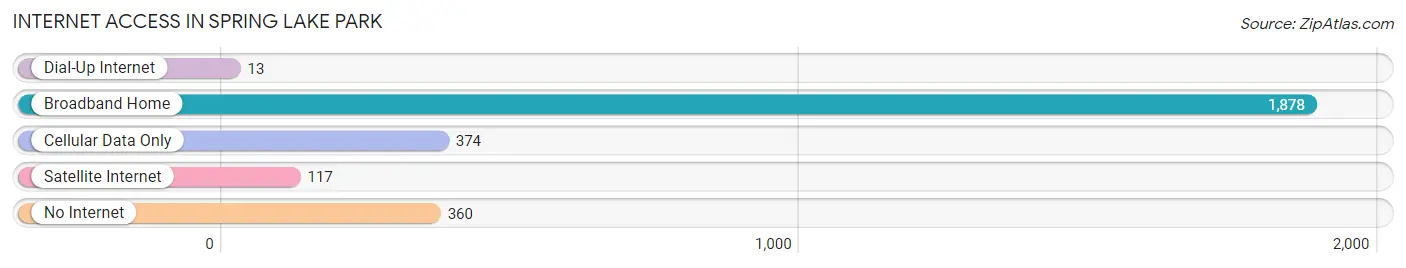
| Internet Type | # Households | % Households |
| Dial-Up Internet | 13 | 0.5% |
| Broadband Home | 1,878 | 70.7% |
| Cellular Data Only | 374 | 14.1% |
| Satellite Internet | 117 | 4.4% |
| No Internet | 360 | 13.5% |
| Total | 2,658 | 100.0% |
Spring Lake Park Summary
History
Spring Lake Park is a city located in Anoka County, Minnesota. It is a northern suburb of the Twin Cities metropolitan area. The city was incorporated in 1949 and is located on the border of Anoka and Ramsey counties. The city is named after the nearby Spring Lake, which is located in the city limits.
The area that is now Spring Lake Park was originally inhabited by the Dakota people. The first European settlers arrived in the area in the mid-1800s. The area was primarily used for farming and logging. In the late 1800s, the area was developed as a resort community. The area was known as Spring Lake Park and was a popular destination for people looking to escape the hustle and bustle of the city.
In the early 1900s, the area began to be developed as a residential community. The city was officially incorporated in 1949. Since then, the city has grown steadily and is now home to over 8,000 people.
Geography
Spring Lake Park is located in Anoka County, Minnesota. It is located on the border of Anoka and Ramsey counties. The city is located approximately 15 miles north of Minneapolis and is part of the Twin Cities metropolitan area.
The city is located on the banks of Spring Lake, which is located in the city limits. The lake is a popular destination for fishing, swimming, and boating. The city is also home to several parks, including Central Park, which is located in the center of the city.
The city has a total area of 4.2 square miles, all of which is land. The city is located at an elevation of 890 feet above sea level.
Economy
The economy of Spring Lake Park is largely based on the service industry. The city is home to several restaurants, retail stores, and other businesses. The city is also home to several corporate offices, including those of Target Corporation and Best Buy.
The city is also home to several manufacturing companies, including 3M and Honeywell. The city is also home to several medical facilities, including the Spring Lake Park Medical Center.
Demographics
As of the 2010 census, the population of Spring Lake Park was 8,072. The population is made up of a diverse mix of people from different backgrounds. The racial makeup of the city is 79.2% White, 8.3% African American, 0.4% Native American, 5.2% Asian, and 6.9% from other races.
The median household income in Spring Lake Park is $60,945. The median age of the population is 37.7 years. The city has a higher than average rate of homeownership, with 73.3% of the population owning their own homes.
Conclusion
Spring Lake Park is a city located in Anoka County, Minnesota. It is a northern suburb of the Twin Cities metropolitan area and is located on the border of Anoka and Ramsey counties. The city was incorporated in 1949 and is home to over 8,000 people. The economy of the city is largely based on the service industry, with several restaurants, retail stores, and corporate offices located in the city. The population of the city is diverse, with a mix of people from different backgrounds. The median household income in Spring Lake Park is $60,945 and the median age of the population is 37.7 years. The city is home to several parks, including Central Park, which is located in the center of the city.
Common Questions
What is Per Capita Income in Spring Lake Park?
Per Capita income in Spring Lake Park is $34,355.
What is the Median Family Income in Spring Lake Park?
Median Family Income in Spring Lake Park is $96,490.
What is the Median Household income in Spring Lake Park?
Median Household Income in Spring Lake Park is $74,697.
What is Income or Wage Gap in Spring Lake Park?
Income or Wage Gap in Spring Lake Park is 19.5%.
Women in Spring Lake Park earn 80.5 cents for every dollar earned by a man.
What is Family Income Deficit in Spring Lake Park?
Family Income Deficit in Spring Lake Park is $12,220.
Families that are below poverty line in Spring Lake Park earn $12,220 less on average than the poverty threshold level.
What is Inequality or Gini Index in Spring Lake Park?
Inequality or Gini Index in Spring Lake Park is 0.37.
What is the Total Population of Spring Lake Park?
Total Population of Spring Lake Park is 6,966.
What is the Total Male Population of Spring Lake Park?
Total Male Population of Spring Lake Park is 3,477.
What is the Total Female Population of Spring Lake Park?
Total Female Population of Spring Lake Park is 3,489.
What is the Ratio of Males per 100 Females in Spring Lake Park?
There are 99.66 Males per 100 Females in Spring Lake Park.
What is the Ratio of Females per 100 Males in Spring Lake Park?
There are 100.35 Females per 100 Males in Spring Lake Park.
What is the Median Population Age in Spring Lake Park?
Median Population Age in Spring Lake Park is 41.4 Years.
What is the Average Family Size in Spring Lake Park
Average Family Size in Spring Lake Park is 3.2 People.
What is the Average Household Size in Spring Lake Park
Average Household Size in Spring Lake Park is 2.6 People.
How Large is the Labor Force in Spring Lake Park?
There are 3,574 People in the Labor Forcein in Spring Lake Park.
What is the Percentage of People in the Labor Force in Spring Lake Park?
62.1% of People are in the Labor Force in Spring Lake Park.
What is the Unemployment Rate in Spring Lake Park?
Unemployment Rate in Spring Lake Park is 2.7%.