North Little Rock, AR Map & Demographics
North Little Rock Map
North Little Rock Overview
$31,941
PER CAPITA INCOME
$63,522
AVG FAMILY INCOME
$49,166
AVG HOUSEHOLD INCOME
21.0%
WAGE / INCOME GAP [ % ]
79.0¢/ $1
WAGE / INCOME GAP [ $ ]
$11,366
FAMILY INCOME DEFICIT
0.48
INEQUALITY / GINI INDEX
64,454
TOTAL POPULATION
30,734
MALE POPULATION
33,720
FEMALE POPULATION
91.14
MALES / 100 FEMALES
109.72
FEMALES / 100 MALES
36.7
MEDIAN AGE
3.0
AVG FAMILY SIZE
2.2
AVG HOUSEHOLD SIZE
33,208
LABOR FORCE [ PEOPLE ]
65.0%
PERCENT IN LABOR FORCE
6.6%
UNEMPLOYMENT RATE
North Little Rock Area Codes
Income in North Little Rock
Income Overview in North Little Rock
Per Capita Income in North Little Rock is $31,941, while median incomes of families and households are $63,522 and $49,166 respectively.
| Characteristic | Number | Measure |
| Per Capita Income | 64,454 | $31,941 |
| Median Family Income | 14,906 | $63,522 |
| Mean Family Income | 14,906 | $85,386 |
| Median Household Income | 29,127 | $49,166 |
| Mean Household Income | 29,127 | $69,058 |
| Income Deficit | 14,906 | $11,366 |
| Wage / Income Gap (%) | 64,454 | 20.96% |
| Wage / Income Gap ($) | 64,454 | 79.04¢ per $1 |
| Gini / Inequality Index | 64,454 | 0.48 |
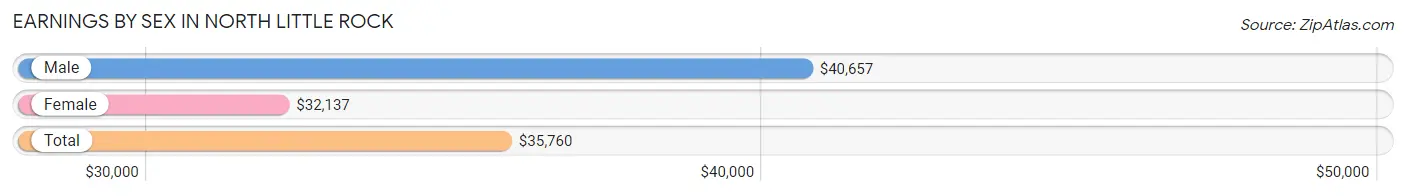
Earnings by Sex in North Little Rock
Average Earnings in North Little Rock are $35,760, $40,657 for men and $32,137 for women, a difference of 21.0%.
| Sex | Number | Average Earnings |
| Male | 15,836 (46.9%) | $40,657 |
| Female | 17,901 (53.1%) | $32,137 |
| Total | 33,737 (100.0%) | $35,760 |
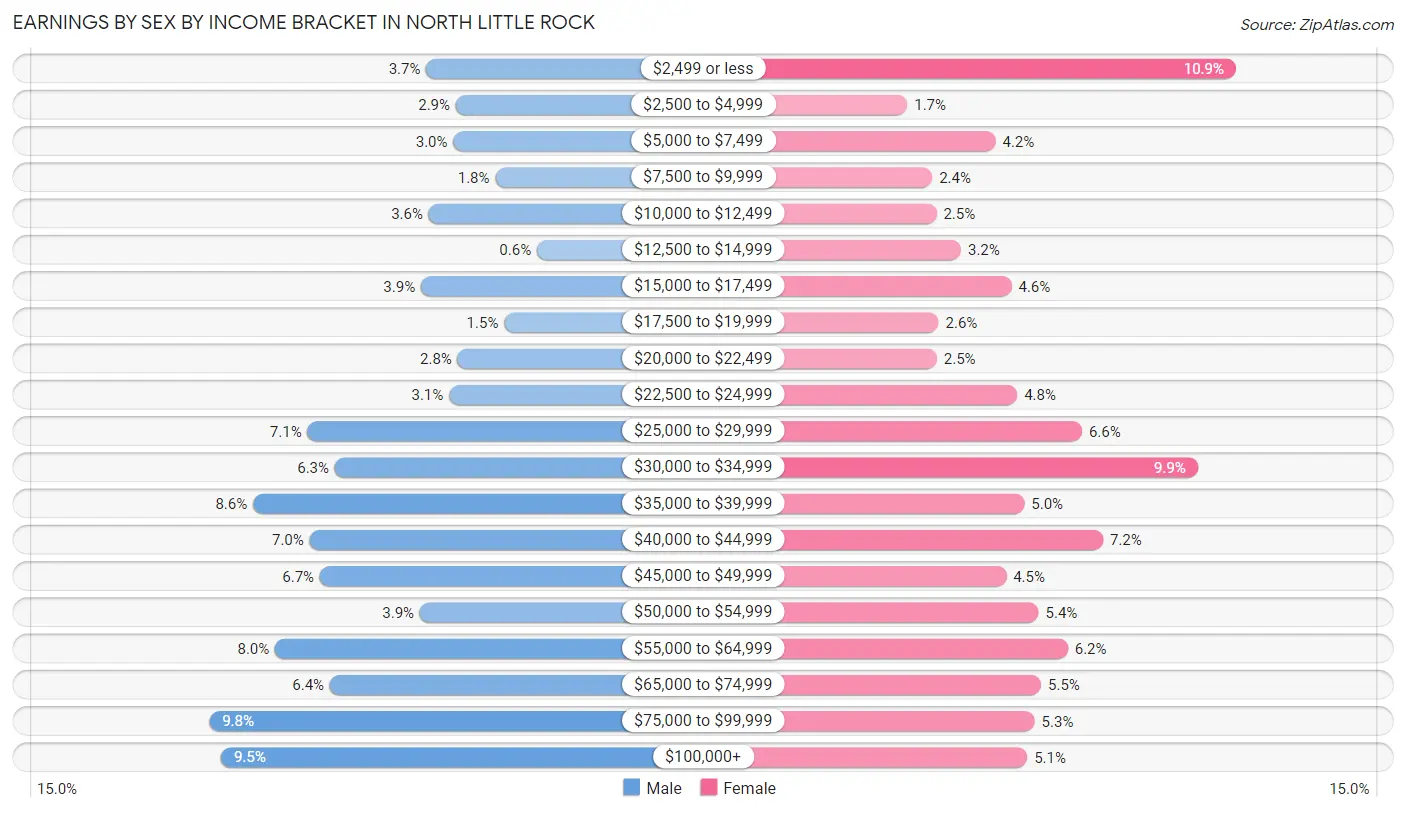
Earnings by Sex by Income Bracket in North Little Rock
The most common earnings brackets in North Little Rock are $75,000 to $99,999 for men (1,553 | 9.8%) and $2,499 or less for women (1,957 | 10.9%).
| Income | Male | Female |
| $2,499 or less | 588 (3.7%) | 1,957 (10.9%) |
| $2,500 to $4,999 | 456 (2.9%) | 305 (1.7%) |
| $5,000 to $7,499 | 467 (2.9%) | 748 (4.2%) |
| $7,500 to $9,999 | 281 (1.8%) | 429 (2.4%) |
| $10,000 to $12,499 | 576 (3.6%) | 452 (2.5%) |
| $12,500 to $14,999 | 95 (0.6%) | 574 (3.2%) |
| $15,000 to $17,499 | 612 (3.9%) | 829 (4.6%) |
| $17,500 to $19,999 | 240 (1.5%) | 461 (2.6%) |
| $20,000 to $22,499 | 448 (2.8%) | 453 (2.5%) |
| $22,500 to $24,999 | 486 (3.1%) | 857 (4.8%) |
| $25,000 to $29,999 | 1,116 (7.0%) | 1,183 (6.6%) |
| $30,000 to $34,999 | 995 (6.3%) | 1,765 (9.9%) |
| $35,000 to $39,999 | 1,359 (8.6%) | 894 (5.0%) |
| $40,000 to $44,999 | 1,107 (7.0%) | 1,288 (7.2%) |
| $45,000 to $49,999 | 1,061 (6.7%) | 802 (4.5%) |
| $50,000 to $54,999 | 616 (3.9%) | 964 (5.4%) |
| $55,000 to $64,999 | 1,261 (8.0%) | 1,111 (6.2%) |
| $65,000 to $74,999 | 1,017 (6.4%) | 977 (5.5%) |
| $75,000 to $99,999 | 1,553 (9.8%) | 945 (5.3%) |
| $100,000+ | 1,502 (9.5%) | 907 (5.1%) |
| Total | 15,836 (100.0%) | 17,901 (100.0%) |
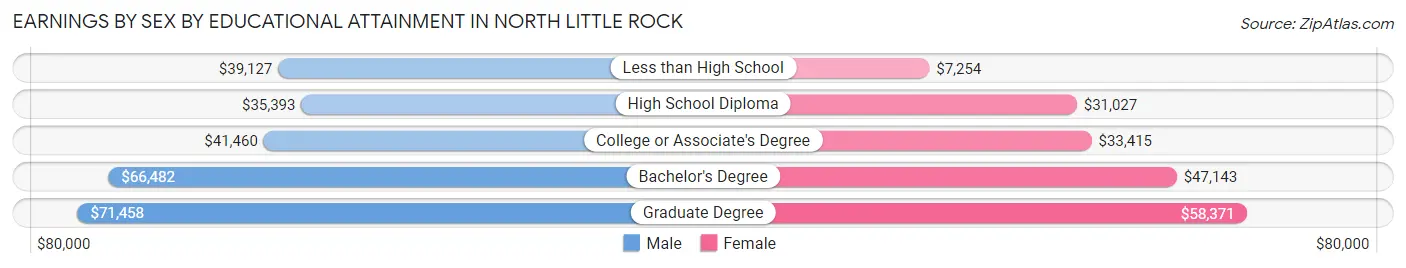
Earnings by Sex by Educational Attainment in North Little Rock
Average earnings in North Little Rock are $44,118 for men and $35,017 for women, a difference of 20.6%. Men with an educational attainment of graduate degree enjoy the highest average annual earnings of $71,458, while those with high school diploma education earn the least with $35,393. Women with an educational attainment of graduate degree earn the most with the average annual earnings of $58,371, while those with less than high school education have the smallest earnings of $7,254.
| Educational Attainment | Male Income | Female Income |
| Less than High School | $39,127 | $7,254 |
| High School Diploma | $35,393 | $31,027 |
| College or Associate's Degree | $41,460 | $33,415 |
| Bachelor's Degree | $66,482 | $47,143 |
| Graduate Degree | $71,458 | $58,371 |
| Total | $44,118 | $35,017 |
Family Income in North Little Rock
Family Income Brackets in North Little Rock
According to the North Little Rock family income data, there are 2,623 families falling into the $100,000 to $149,999 income range, which is the most common income bracket and makes up 17.6% of all families. Conversely, the $10,000 to $14,999 income bracket is the least frequent group with only 581 families (3.9%) belonging to this category.
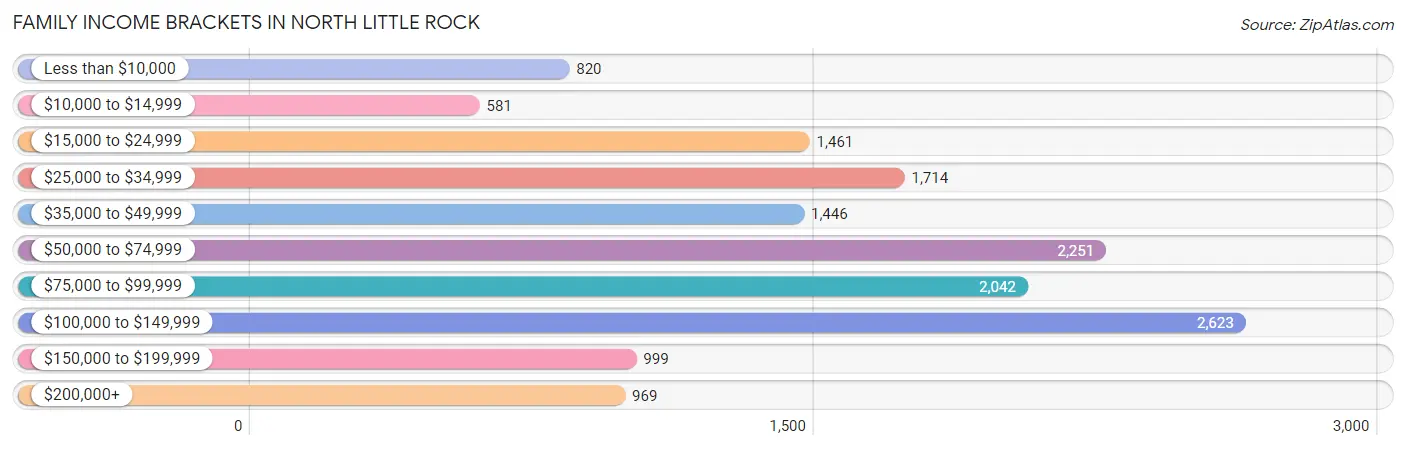
| Income Bracket | # Families | % Families |
| Less than $10,000 | 820 | 5.5% |
| $10,000 to $14,999 | 581 | 3.9% |
| $15,000 to $24,999 | 1,461 | 9.8% |
| $25,000 to $34,999 | 1,714 | 11.5% |
| $35,000 to $49,999 | 1,446 | 9.7% |
| $50,000 to $74,999 | 2,251 | 15.1% |
| $75,000 to $99,999 | 2,042 | 13.7% |
| $100,000 to $149,999 | 2,623 | 17.6% |
| $150,000 to $199,999 | 999 | 6.7% |
| $200,000+ | 969 | 6.5% |
Family Income by Famaliy Size in North Little Rock
6-person families (581 | 3.9%) account for the highest median family income in North Little Rock with $91,629 per family, while 2-person families (7,922 | 53.1%) have the highest median income of $31,140 per family member.
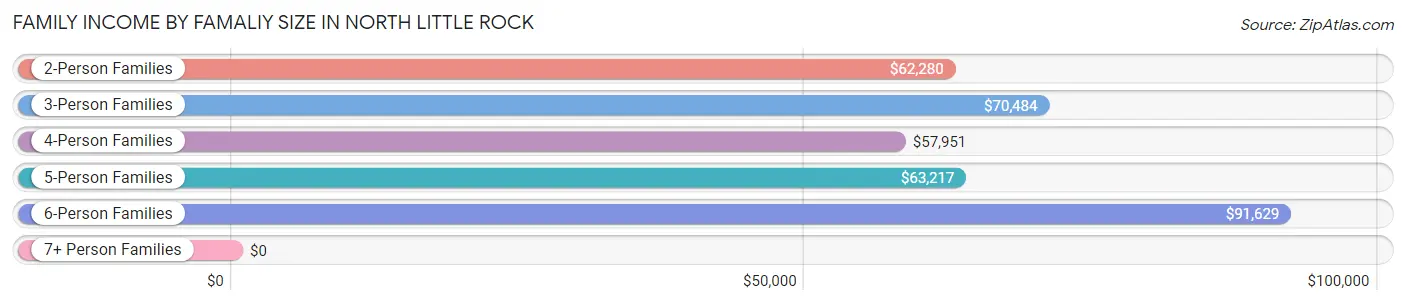
| Income Bracket | # Families | Median Income |
| 2-Person Families | 7,922 (53.1%) | $62,280 |
| 3-Person Families | 3,388 (22.7%) | $70,484 |
| 4-Person Families | 1,855 (12.4%) | $57,951 |
| 5-Person Families | 1,029 (6.9%) | $63,217 |
| 6-Person Families | 581 (3.9%) | $91,629 |
| 7+ Person Families | 131 (0.9%) | $0 |
| Total | 14,906 (100.0%) | $63,522 |
Family Income by Number of Earners in North Little Rock
The median family income in North Little Rock is $63,522, with families comprising 3+ earners (964) having the highest median family income of $113,108, while families with no earners (2,718) have the lowest median family income of $30,754, accounting for 6.5% and 18.2% of families, respectively.
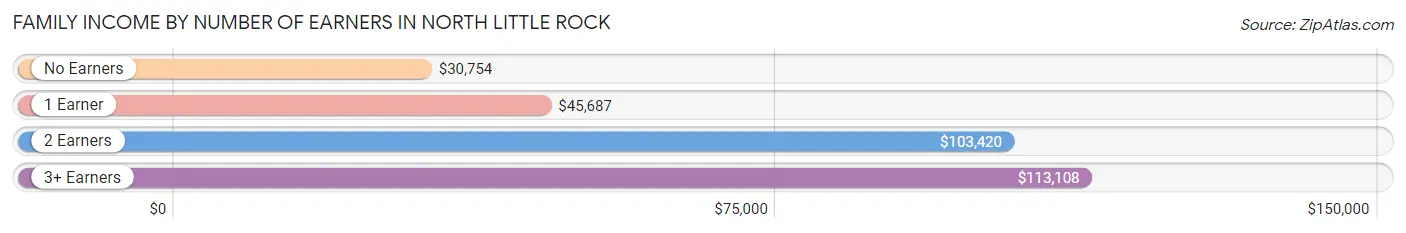
| Number of Earners | # Families | Median Income |
| No Earners | 2,718 (18.2%) | $30,754 |
| 1 Earner | 5,873 (39.4%) | $45,687 |
| 2 Earners | 5,351 (35.9%) | $103,420 |
| 3+ Earners | 964 (6.5%) | $113,108 |
| Total | 14,906 (100.0%) | $63,522 |
Household Income in North Little Rock
Household Income Brackets in North Little Rock
With 4,952 households falling in the category, the $50,000 to $74,999 income range is the most frequent in North Little Rock, accounting for 17.0% of all households. In contrast, only 1,078 households (3.7%) fall into the $200,000+ income bracket, making it the least populous group.
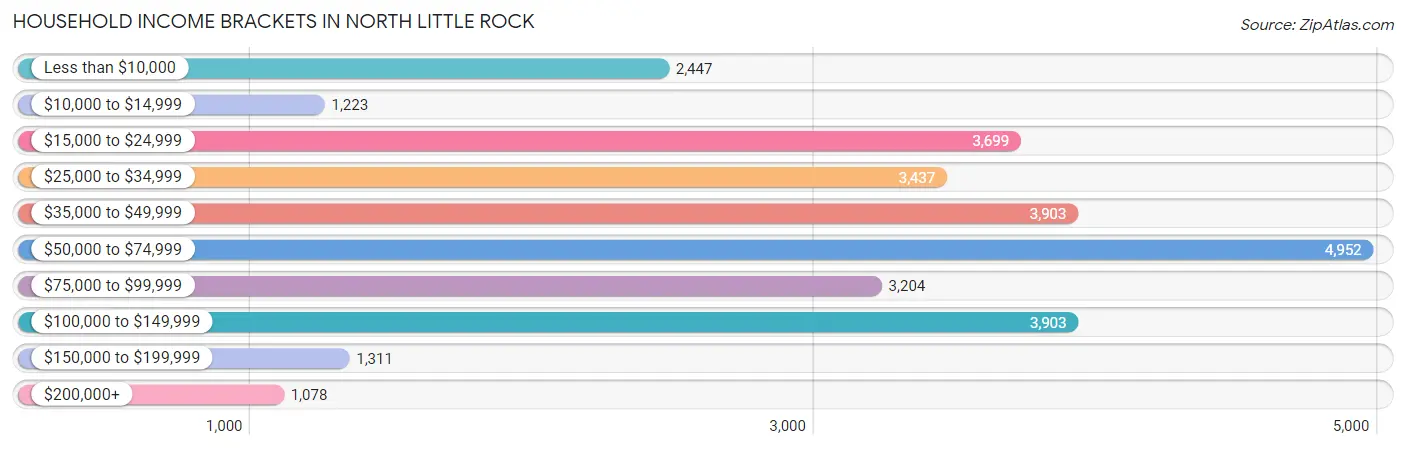
| Income Bracket | # Households | % Households |
| Less than $10,000 | 2,447 | 8.4% |
| $10,000 to $14,999 | 1,223 | 4.2% |
| $15,000 to $24,999 | 3,699 | 12.7% |
| $25,000 to $34,999 | 3,437 | 11.8% |
| $35,000 to $49,999 | 3,903 | 13.4% |
| $50,000 to $74,999 | 4,952 | 17.0% |
| $75,000 to $99,999 | 3,204 | 11.0% |
| $100,000 to $149,999 | 3,903 | 13.4% |
| $150,000 to $199,999 | 1,311 | 4.5% |
| $200,000+ | 1,078 | 3.7% |
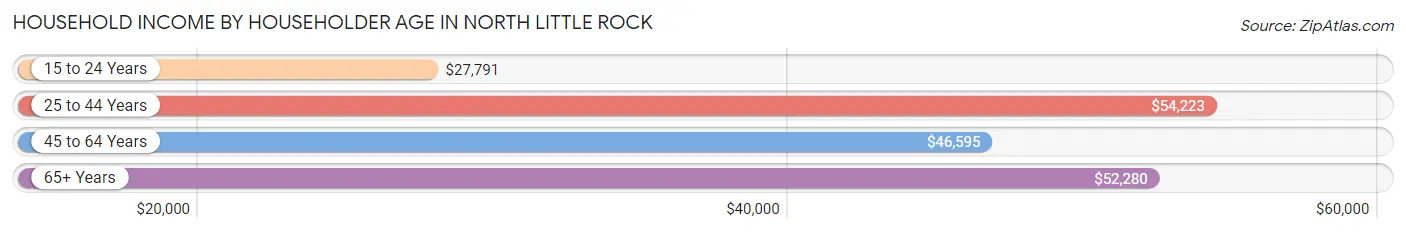
Household Income by Householder Age in North Little Rock
The median household income in North Little Rock is $49,166, with the highest median household income of $54,223 found in the 25 to 44 years age bracket for the primary householder. A total of 10,430 households (35.8%) fall into this category. Meanwhile, the 15 to 24 years age bracket for the primary householder has the lowest median household income of $27,791, with 1,663 households (5.7%) in this group.
| Income Bracket | # Households | Median Income |
| 15 to 24 Years | 1,663 (5.7%) | $27,791 |
| 25 to 44 Years | 10,430 (35.8%) | $54,223 |
| 45 to 64 Years | 9,876 (33.9%) | $46,595 |
| 65+ Years | 7,158 (24.6%) | $52,280 |
| Total | 29,127 (100.0%) | $49,166 |
Poverty in North Little Rock
Income Below Poverty by Sex and Age in North Little Rock
With 19.7% poverty level for males and 22.6% for females among the residents of North Little Rock, 15 year old males and 15 year old females are the most vulnerable to poverty, with 144 males (52.4%) and 261 females (57.7%) in their respective age groups living below the poverty level.
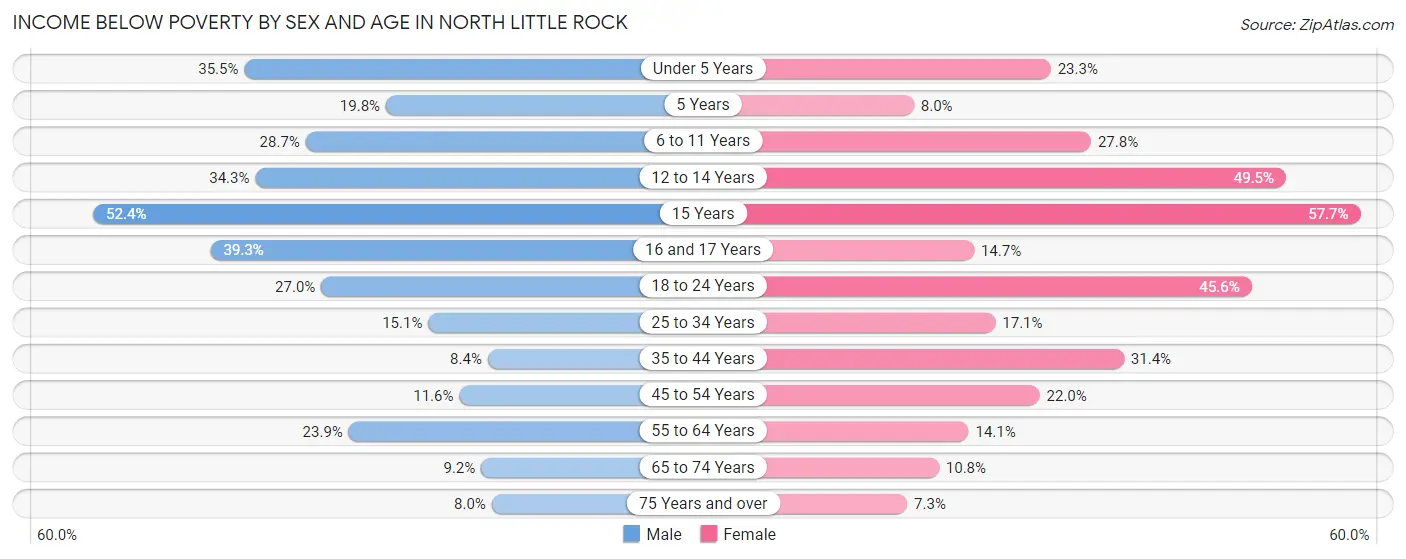
| Age Bracket | Male | Female |
| Under 5 Years | 799 (35.5%) | 434 (23.3%) |
| 5 Years | 50 (19.8%) | 19 (8.0%) |
| 6 to 11 Years | 757 (28.7%) | 757 (27.8%) |
| 12 to 14 Years | 635 (34.3%) | 357 (49.4%) |
| 15 Years | 144 (52.4%) | 261 (57.7%) |
| 16 and 17 Years | 191 (39.3%) | 107 (14.7%) |
| 18 to 24 Years | 653 (27.0%) | 1,356 (45.6%) |
| 25 to 34 Years | 765 (15.0%) | 997 (17.1%) |
| 35 to 44 Years | 289 (8.4%) | 1,239 (31.4%) |
| 45 to 54 Years | 374 (11.6%) | 893 (22.0%) |
| 55 to 64 Years | 907 (23.9%) | 600 (14.1%) |
| 65 to 74 Years | 271 (9.2%) | 382 (10.8%) |
| 75 Years and over | 135 (8.0%) | 157 (7.3%) |
| Total | 5,970 (19.7%) | 7,559 (22.6%) |
Income Above Poverty by Sex and Age in North Little Rock
According to the poverty statistics in North Little Rock, males aged 75 years and over and females aged 75 years and over are the age groups that are most secure financially, with 92.0% of males and 92.7% of females in these age groups living above the poverty line.
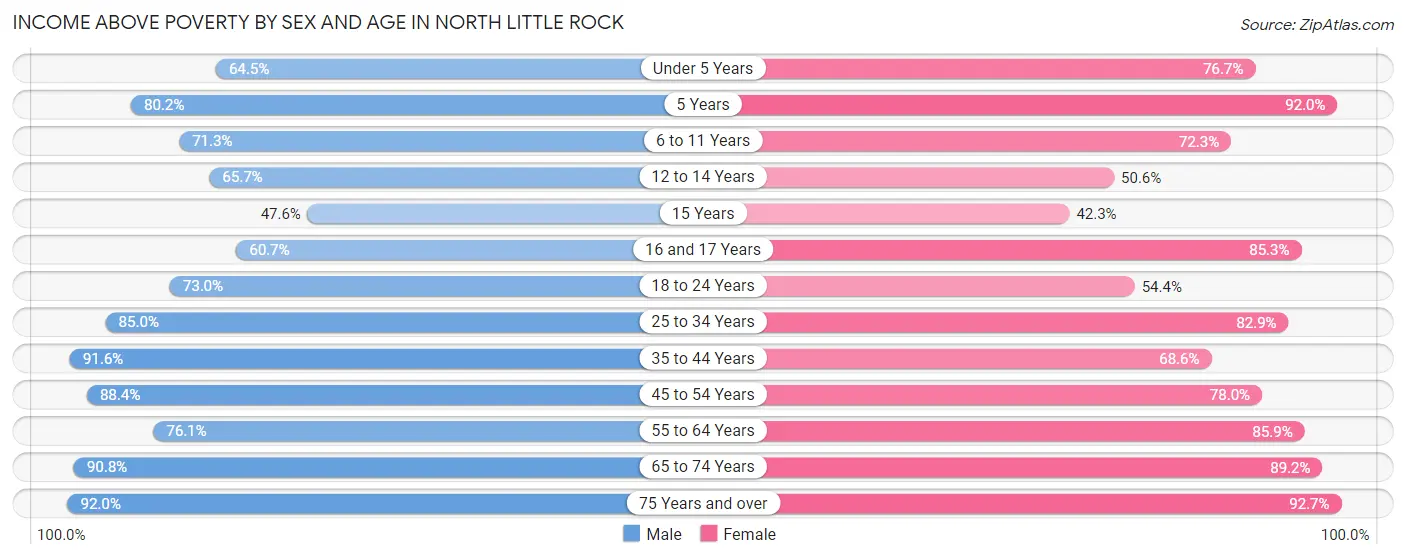
| Age Bracket | Male | Female |
| Under 5 Years | 1,450 (64.5%) | 1,431 (76.7%) |
| 5 Years | 203 (80.2%) | 218 (92.0%) |
| 6 to 11 Years | 1,881 (71.3%) | 1,971 (72.3%) |
| 12 to 14 Years | 1,216 (65.7%) | 365 (50.5%) |
| 15 Years | 131 (47.6%) | 191 (42.3%) |
| 16 and 17 Years | 295 (60.7%) | 620 (85.3%) |
| 18 to 24 Years | 1,768 (73.0%) | 1,616 (54.4%) |
| 25 to 34 Years | 4,317 (85.0%) | 4,835 (82.9%) |
| 35 to 44 Years | 3,145 (91.6%) | 2,704 (68.6%) |
| 45 to 54 Years | 2,853 (88.4%) | 3,160 (78.0%) |
| 55 to 64 Years | 2,887 (76.1%) | 3,648 (85.9%) |
| 65 to 74 Years | 2,686 (90.8%) | 3,152 (89.2%) |
| 75 Years and over | 1,557 (92.0%) | 2,001 (92.7%) |
| Total | 24,389 (80.3%) | 25,912 (77.4%) |
Income Below Poverty Among Married-Couple Families in North Little Rock
The poverty statistics for married-couple families in North Little Rock show that 10.8% or 1,003 of the total 9,279 families live below the poverty line. Families with 5 or more children have the highest poverty rate of 100.0%, comprising of 83 families. On the other hand, families with 3 or 4 children have the lowest poverty rate of 3.5%, which includes 31 families.
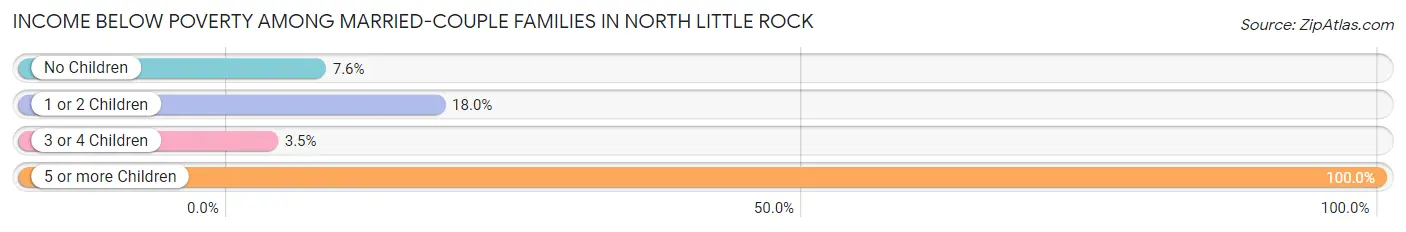
| Children | Above Poverty | Below Poverty |
| No Children | 5,402 (92.4%) | 447 (7.6%) |
| 1 or 2 Children | 2,009 (82.0%) | 442 (18.0%) |
| 3 or 4 Children | 865 (96.5%) | 31 (3.5%) |
| 5 or more Children | 0 (0.0%) | 83 (100.0%) |
| Total | 8,276 (89.2%) | 1,003 (10.8%) |
Income Below Poverty Among Single-Parent Households in North Little Rock
According to the poverty data in North Little Rock, 12.2% or 141 single-father households and 32.2% or 1,441 single-mother households are living below the poverty line. Among single-father households, those with 3 or 4 children have the highest poverty rate, with 57 households (54.8%) experiencing poverty. Likewise, among single-mother households, those with 5 or more children have the highest poverty rate, with 7 households (100.0%) falling below the poverty line.
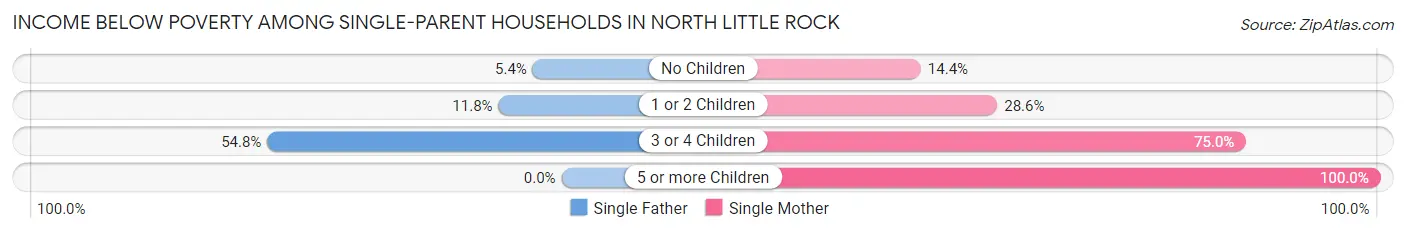
| Children | Single Father | Single Mother |
| No Children | 33 (5.4%) | 183 (14.4%) |
| 1 or 2 Children | 51 (11.7%) | 706 (28.6%) |
| 3 or 4 Children | 57 (54.8%) | 545 (75.0%) |
| 5 or more Children | 0 (0.0%) | 7 (100.0%) |
| Total | 141 (12.2%) | 1,441 (32.2%) |
Income Below Poverty Among Married-Couple vs Single-Parent Households in North Little Rock
The poverty data for North Little Rock shows that 1,003 of the married-couple family households (10.8%) and 1,582 of the single-parent households (28.1%) are living below the poverty level. Within the married-couple family households, those with 5 or more children have the highest poverty rate, with 83 households (100.0%) falling below the poverty line. Among the single-parent households, those with 5 or more children have the highest poverty rate, with 7 household (100.0%) living below poverty.
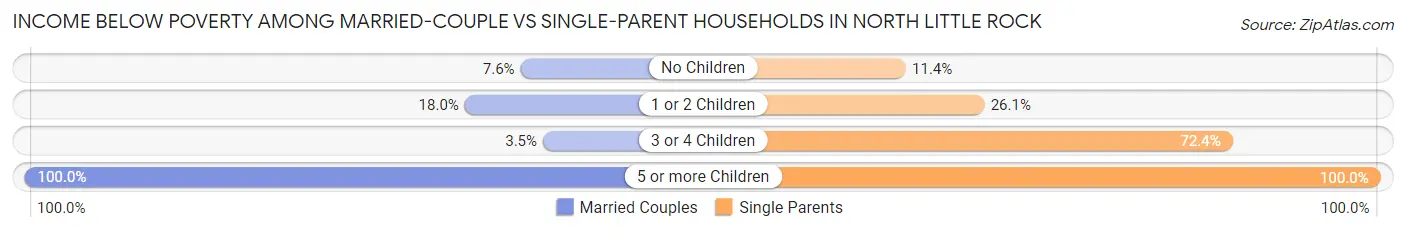
| Children | Married-Couple Families | Single-Parent Households |
| No Children | 447 (7.6%) | 216 (11.4%) |
| 1 or 2 Children | 442 (18.0%) | 757 (26.1%) |
| 3 or 4 Children | 31 (3.5%) | 602 (72.4%) |
| 5 or more Children | 83 (100.0%) | 7 (100.0%) |
| Total | 1,003 (10.8%) | 1,582 (28.1%) |
Race in North Little Rock
The most populous races in North Little Rock are White / Caucasian (30,350 | 47.1%), Black / African American (27,859 | 43.2%), and Hispanic or Latino (4,027 | 6.2%).
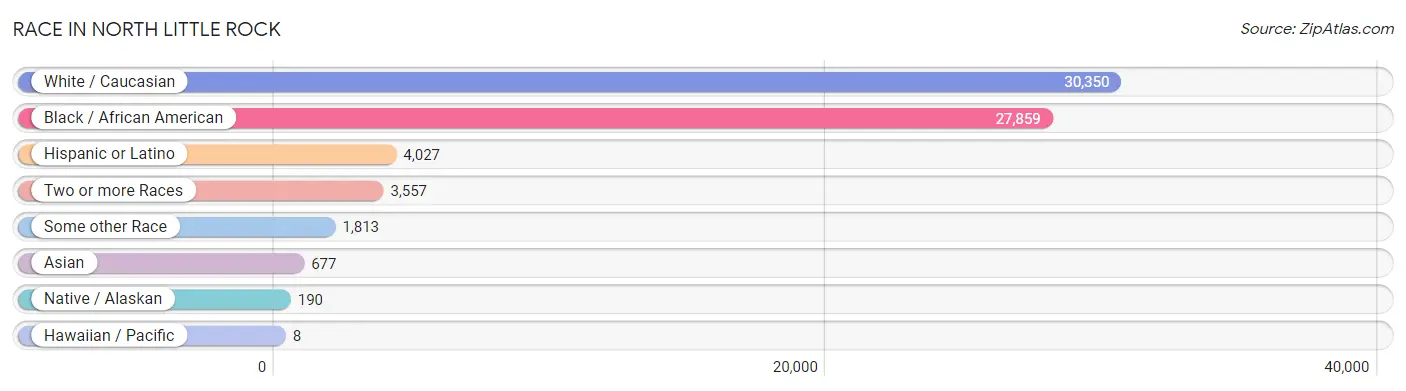
| Race | # Population | % Population |
| Asian | 677 | 1.1% |
| Black / African American | 27,859 | 43.2% |
| Hawaiian / Pacific | 8 | 0.0% |
| Hispanic or Latino | 4,027 | 6.2% |
| Native / Alaskan | 190 | 0.3% |
| White / Caucasian | 30,350 | 47.1% |
| Two or more Races | 3,557 | 5.5% |
| Some other Race | 1,813 | 2.8% |
| Total | 64,454 | 100.0% |
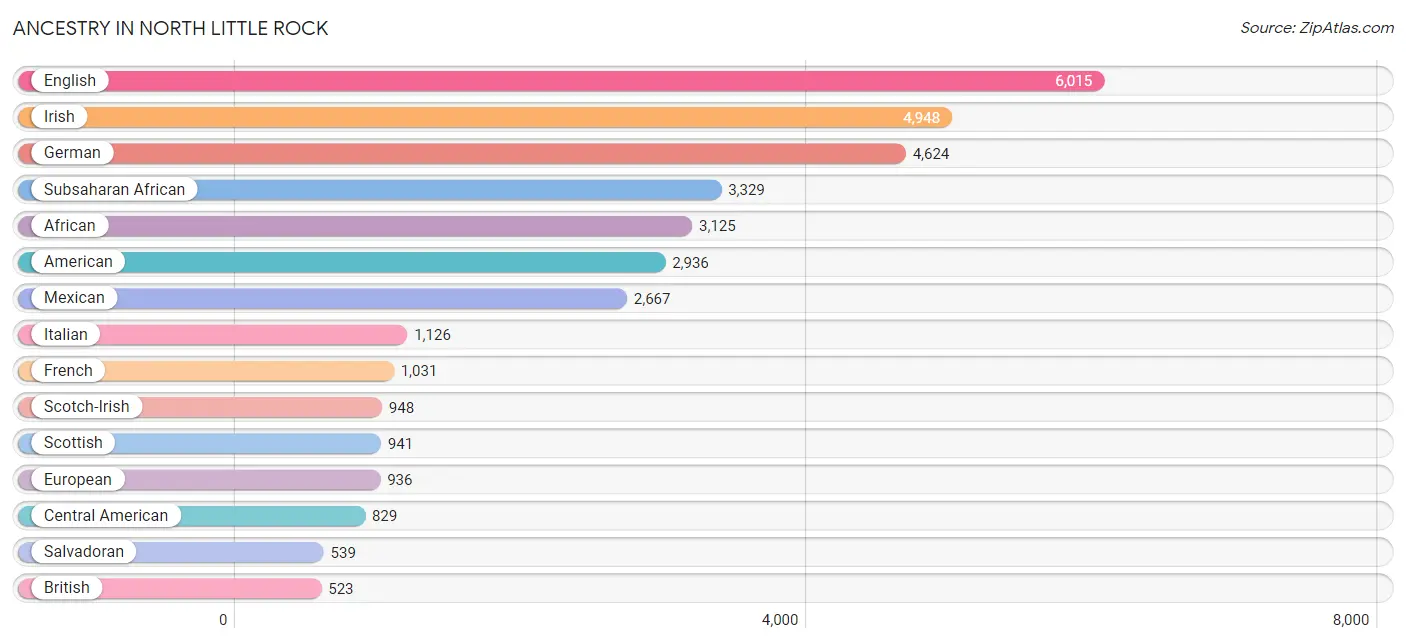
Ancestry in North Little Rock
The most populous ancestries reported in North Little Rock are English (6,015 | 9.3%), Irish (4,948 | 7.7%), German (4,624 | 7.2%), Subsaharan African (3,329 | 5.2%), and African (3,125 | 4.9%), together accounting for 34.2% of all North Little Rock residents.
| Ancestry | # Population | % Population |
| Afghan | 28 | 0.0% |
| African | 3,125 | 4.9% |
| American | 2,936 | 4.6% |
| Apache | 6 | 0.0% |
| Arab | 179 | 0.3% |
| Armenian | 22 | 0.0% |
| Assyrian / Chaldean / Syriac | 53 | 0.1% |
| Austrian | 51 | 0.1% |
| Belgian | 11 | 0.0% |
| Bhutanese | 293 | 0.4% |
| Blackfeet | 49 | 0.1% |
| British | 523 | 0.8% |
| British West Indian | 18 | 0.0% |
| Bulgarian | 7 | 0.0% |
| Burmese | 171 | 0.3% |
| Cajun | 61 | 0.1% |
| Canadian | 143 | 0.2% |
| Central American | 829 | 1.3% |
| Central American Indian | 69 | 0.1% |
| Cherokee | 225 | 0.4% |
| Choctaw | 52 | 0.1% |
| Colombian | 63 | 0.1% |
| Creek | 17 | 0.0% |
| Croatian | 32 | 0.1% |
| Czech | 32 | 0.1% |
| Danish | 48 | 0.1% |
| Dutch | 424 | 0.7% |
| Eastern European | 25 | 0.0% |
| Egyptian | 17 | 0.0% |
| English | 6,015 | 9.3% |
| European | 936 | 1.5% |
| Fijian | 4 | 0.0% |
| Finnish | 5 | 0.0% |
| French | 1,031 | 1.6% |
| French Canadian | 106 | 0.2% |
| German | 4,624 | 7.2% |
| Greek | 8 | 0.0% |
| Guamanian / Chamorro | 20 | 0.0% |
| Guatemalan | 165 | 0.3% |
| Honduran | 25 | 0.0% |
| Hungarian | 38 | 0.1% |
| Indian (Asian) | 46 | 0.1% |
| Iranian | 10 | 0.0% |
| Irish | 4,948 | 7.7% |
| Italian | 1,126 | 1.8% |
| Jamaican | 19 | 0.0% |
| Jordanian | 4 | 0.0% |
| Korean | 397 | 0.6% |
| Lebanese | 6 | 0.0% |
| Mexican | 2,667 | 4.1% |
| Mexican American Indian | 36 | 0.1% |
| Mongolian | 11 | 0.0% |
| Native Hawaiian | 8 | 0.0% |
| Navajo | 2 | 0.0% |
| Nicaraguan | 17 | 0.0% |
| Nigerian | 82 | 0.1% |
| Northern European | 33 | 0.1% |
| Norwegian | 163 | 0.3% |
| Pakistani | 45 | 0.1% |
| Palestinian | 51 | 0.1% |
| Panamanian | 83 | 0.1% |
| Peruvian | 26 | 0.0% |
| Polish | 288 | 0.4% |
| Portuguese | 61 | 0.1% |
| Puerto Rican | 71 | 0.1% |
| Russian | 62 | 0.1% |
| Salvadoran | 539 | 0.8% |
| Scandinavian | 134 | 0.2% |
| Scotch-Irish | 948 | 1.5% |
| Scottish | 941 | 1.5% |
| Serbian | 11 | 0.0% |
| Sioux | 38 | 0.1% |
| Slovak | 12 | 0.0% |
| South American | 107 | 0.2% |
| Spanish | 49 | 0.1% |
| Sri Lankan | 87 | 0.1% |
| Subsaharan African | 3,329 | 5.2% |
| Swedish | 129 | 0.2% |
| Swiss | 47 | 0.1% |
| Syrian | 69 | 0.1% |
| Thai | 48 | 0.1% |
| Tohono O'Odham | 60 | 0.1% |
| Ukrainian | 10 | 0.0% |
| Venezuelan | 18 | 0.0% |
| Vietnamese | 22 | 0.0% |
| Welsh | 289 | 0.4% |
| Yugoslavian | 9 | 0.0% | View All 87 Rows |
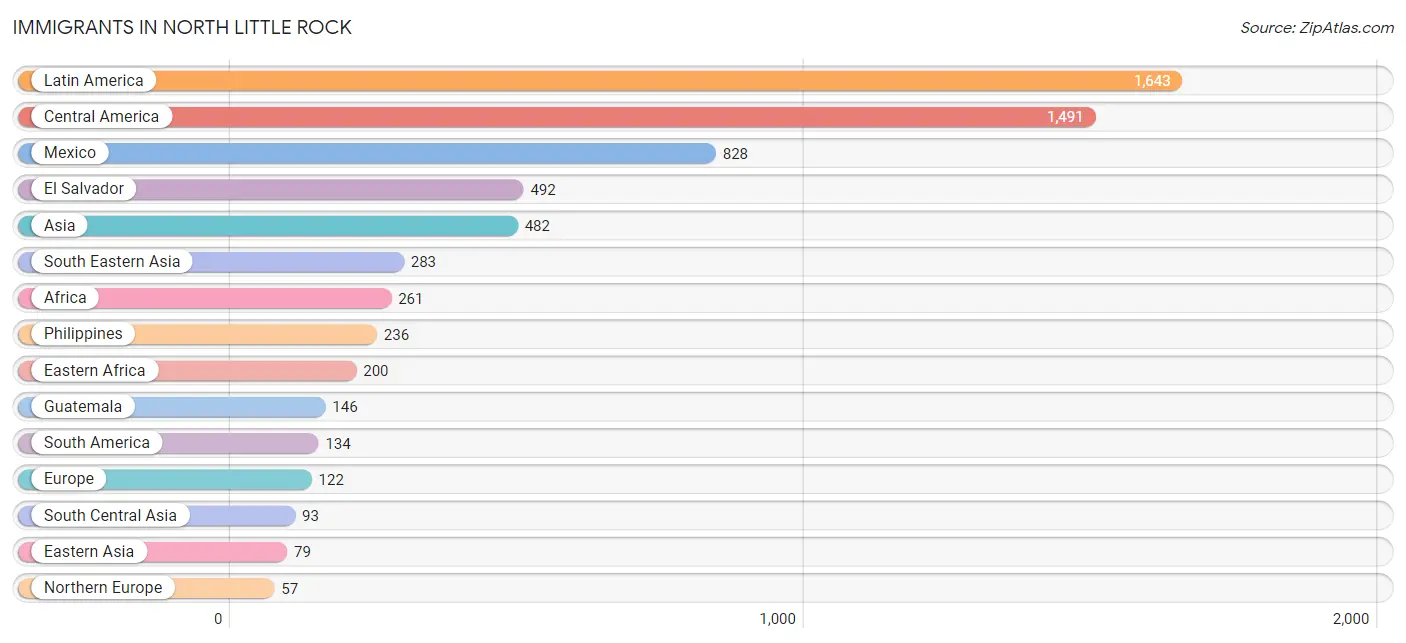
Immigrants in North Little Rock
The most numerous immigrant groups reported in North Little Rock came from Latin America (1,643 | 2.5%), Central America (1,491 | 2.3%), Mexico (828 | 1.3%), El Salvador (492 | 0.8%), and Asia (482 | 0.7%), together accounting for 7.6% of all North Little Rock residents.
| Immigration Origin | # Population | % Population |
| Afghanistan | 28 | 0.0% |
| Africa | 261 | 0.4% |
| Asia | 482 | 0.7% |
| Bangladesh | 22 | 0.0% |
| Brazil | 50 | 0.1% |
| Canada | 56 | 0.1% |
| Caribbean | 18 | 0.0% |
| Central America | 1,491 | 2.3% |
| China | 21 | 0.0% |
| Colombia | 49 | 0.1% |
| Eastern Africa | 200 | 0.3% |
| Eastern Asia | 79 | 0.1% |
| Eastern Europe | 18 | 0.0% |
| Egypt | 49 | 0.1% |
| El Salvador | 492 | 0.8% |
| England | 11 | 0.0% |
| Europe | 122 | 0.2% |
| France | 10 | 0.0% |
| Germany | 30 | 0.1% |
| Guatemala | 146 | 0.2% |
| Honduras | 25 | 0.0% |
| Hong Kong | 8 | 0.0% |
| India | 33 | 0.1% |
| Iran | 10 | 0.0% |
| Israel | 8 | 0.0% |
| Italy | 7 | 0.0% |
| Japan | 12 | 0.0% |
| Korea | 46 | 0.1% |
| Kuwait | 6 | 0.0% |
| Latin America | 1,643 | 2.5% |
| Malaysia | 11 | 0.0% |
| Mexico | 828 | 1.3% |
| Middle Africa | 12 | 0.0% |
| Northern Africa | 49 | 0.1% |
| Northern Europe | 57 | 0.1% |
| Peru | 26 | 0.0% |
| Philippines | 236 | 0.4% |
| Poland | 8 | 0.0% |
| South America | 134 | 0.2% |
| South Central Asia | 93 | 0.1% |
| South Eastern Asia | 283 | 0.4% |
| Southern Europe | 7 | 0.0% |
| Ukraine | 10 | 0.0% |
| Venezuela | 9 | 0.0% |
| Vietnam | 36 | 0.1% |
| Western Asia | 14 | 0.0% |
| Western Europe | 40 | 0.1% |
| Zaire | 12 | 0.0% | View All 48 Rows |
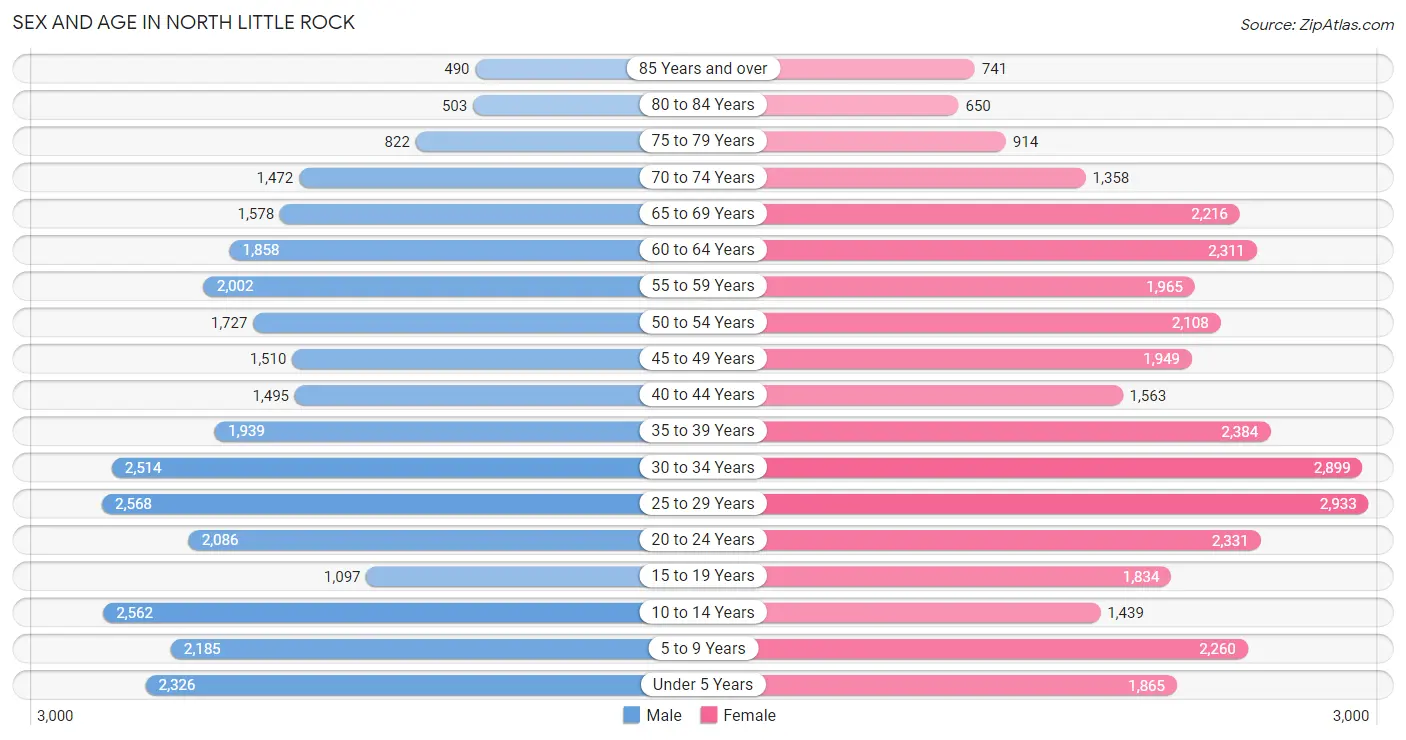
Sex and Age in North Little Rock
Sex and Age in North Little Rock
The most populous age groups in North Little Rock are 25 to 29 Years (2,568 | 8.4%) for men and 25 to 29 Years (2,933 | 8.7%) for women.
| Age Bracket | Male | Female |
| Under 5 Years | 2,326 (7.6%) | 1,865 (5.5%) |
| 5 to 9 Years | 2,185 (7.1%) | 2,260 (6.7%) |
| 10 to 14 Years | 2,562 (8.3%) | 1,439 (4.3%) |
| 15 to 19 Years | 1,097 (3.6%) | 1,834 (5.4%) |
| 20 to 24 Years | 2,086 (6.8%) | 2,331 (6.9%) |
| 25 to 29 Years | 2,568 (8.4%) | 2,933 (8.7%) |
| 30 to 34 Years | 2,514 (8.2%) | 2,899 (8.6%) |
| 35 to 39 Years | 1,939 (6.3%) | 2,384 (7.1%) |
| 40 to 44 Years | 1,495 (4.9%) | 1,563 (4.6%) |
| 45 to 49 Years | 1,510 (4.9%) | 1,949 (5.8%) |
| 50 to 54 Years | 1,727 (5.6%) | 2,108 (6.2%) |
| 55 to 59 Years | 2,002 (6.5%) | 1,965 (5.8%) |
| 60 to 64 Years | 1,858 (6.0%) | 2,311 (6.9%) |
| 65 to 69 Years | 1,578 (5.1%) | 2,216 (6.6%) |
| 70 to 74 Years | 1,472 (4.8%) | 1,358 (4.0%) |
| 75 to 79 Years | 822 (2.7%) | 914 (2.7%) |
| 80 to 84 Years | 503 (1.6%) | 650 (1.9%) |
| 85 Years and over | 490 (1.6%) | 741 (2.2%) |
| Total | 30,734 (100.0%) | 33,720 (100.0%) |
Families and Households in North Little Rock
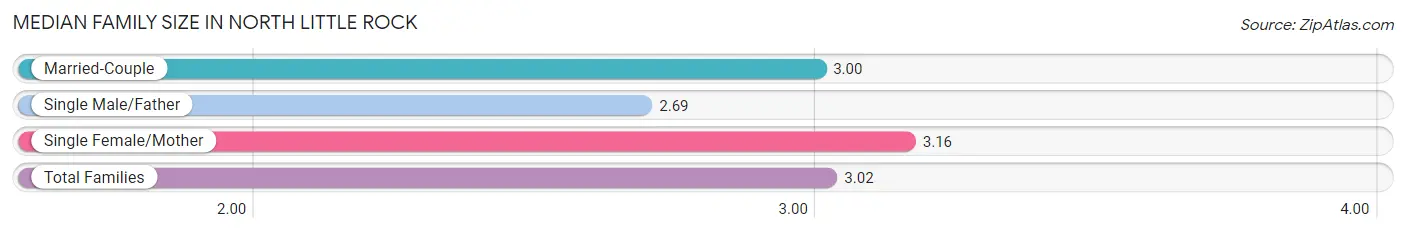
Median Family Size in North Little Rock
The median family size in North Little Rock is 3.02 persons per family, with single female/mother families (4,473 | 30.0%) accounting for the largest median family size of 3.16 persons per family. On the other hand, single male/father families (1,154 | 7.7%) represent the smallest median family size with 2.69 persons per family.
| Family Type | # Families | Family Size |
| Married-Couple | 9,279 (62.3%) | 3.00 |
| Single Male/Father | 1,154 (7.7%) | 2.69 |
| Single Female/Mother | 4,473 (30.0%) | 3.16 |
| Total Families | 14,906 (100.0%) | 3.02 |
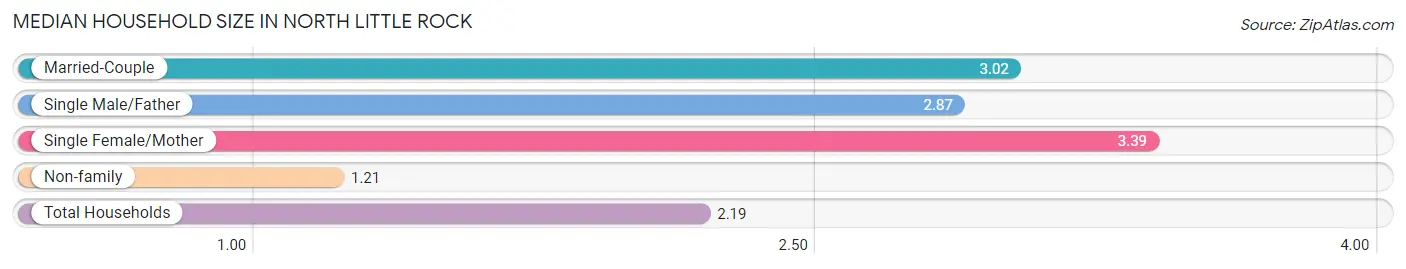
Median Household Size in North Little Rock
The median household size in North Little Rock is 2.19 persons per household, with single female/mother households (4,473 | 15.4%) accounting for the largest median household size of 3.39 persons per household. non-family households (14,221 | 48.8%) represent the smallest median household size with 1.21 persons per household.
| Household Type | # Households | Household Size |
| Married-Couple | 9,279 (31.9%) | 3.02 |
| Single Male/Father | 1,154 (4.0%) | 2.87 |
| Single Female/Mother | 4,473 (15.4%) | 3.39 |
| Non-family | 14,221 (48.8%) | 1.21 |
| Total Households | 29,127 (100.0%) | 2.19 |
Household Size by Marriage Status in North Little Rock
Out of a total of 29,127 households in North Little Rock, 14,906 (51.2%) are family households, while 14,221 (48.8%) are nonfamily households. The most numerous type of family households are 2-person households, comprising 7,280, and the most common type of nonfamily households are 1-person households, comprising 11,961.
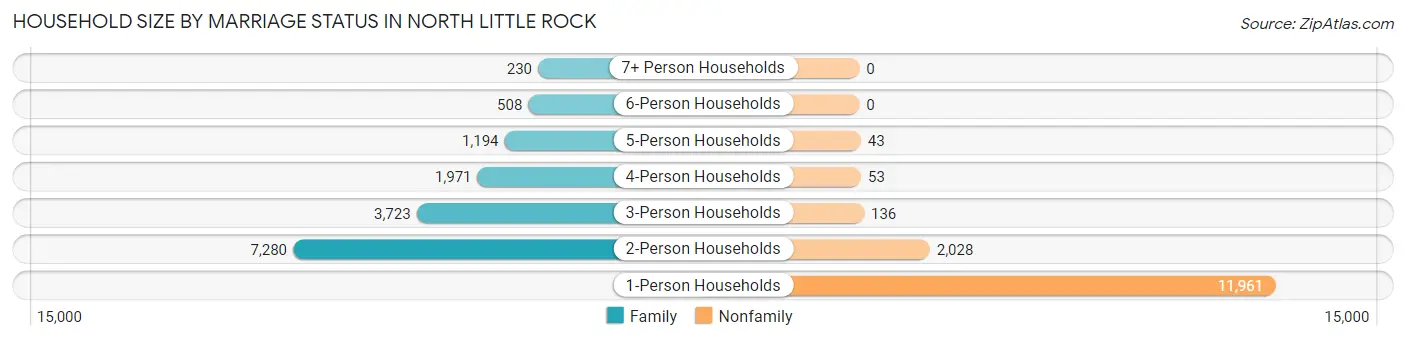
| Household Size | Family Households | Nonfamily Households |
| 1-Person Households | - | 11,961 (41.1%) |
| 2-Person Households | 7,280 (25.0%) | 2,028 (7.0%) |
| 3-Person Households | 3,723 (12.8%) | 136 (0.5%) |
| 4-Person Households | 1,971 (6.8%) | 53 (0.2%) |
| 5-Person Households | 1,194 (4.1%) | 43 (0.2%) |
| 6-Person Households | 508 (1.7%) | 0 (0.0%) |
| 7+ Person Households | 230 (0.8%) | 0 (0.0%) |
| Total | 14,906 (51.2%) | 14,221 (48.8%) |
Female Fertility in North Little Rock
Fertility by Age in North Little Rock
Average fertility rate in North Little Rock is 44.0 births per 1,000 women. Women in the age bracket of 20 to 34 years have the highest fertility rate with 71.0 births per 1,000 women. Women in the age bracket of 20 to 34 years acount for 80.5% of all women with births.
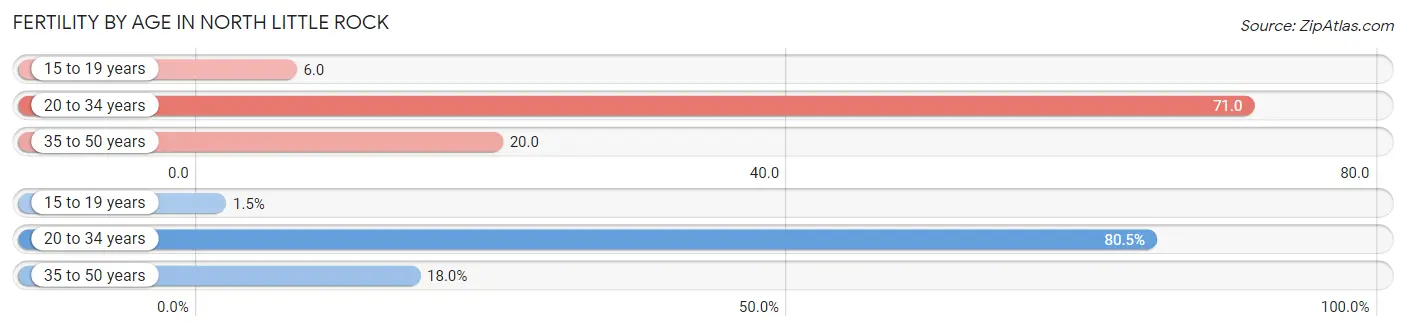
| Age Bracket | Women with Births | Births / 1,000 Women |
| 15 to 19 years | 11 (1.5%) | 6.0 |
| 20 to 34 years | 577 (80.5%) | 71.0 |
| 35 to 50 years | 129 (18.0%) | 20.0 |
| Total | 717 (100.0%) | 44.0 |
Fertility by Age by Marriage Status in North Little Rock
64.9% of women with births (717) in North Little Rock are married. The highest percentage of unmarried women with births falls into 15 to 19 years age bracket with 100.0% of them unmarried at the time of birth, while the lowest percentage of unmarried women with births belong to 20 to 34 years age bracket with 33.3% of them unmarried.
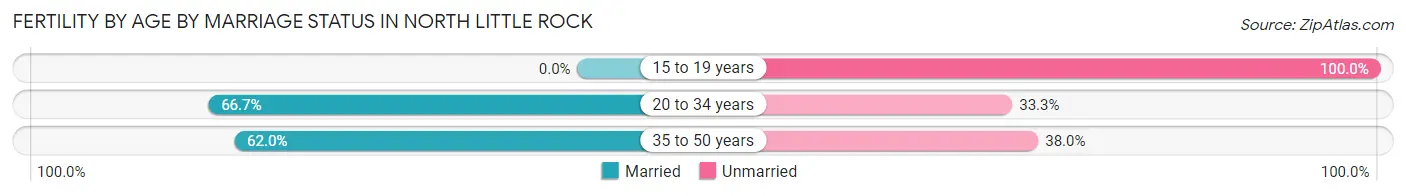
| Age Bracket | Married | Unmarried |
| 15 to 19 years | 0 (0.0%) | 11 (100.0%) |
| 20 to 34 years | 385 (66.7%) | 192 (33.3%) |
| 35 to 50 years | 80 (62.0%) | 49 (38.0%) |
| Total | 465 (64.8%) | 252 (35.1%) |
Fertility by Education in North Little Rock
Average fertility rate in North Little Rock is 44.0 births per 1,000 women. Women with the education attainment of college or associate's degree have the highest fertility rate of 63.0 births per 1,000 women, while women with the education attainment of less than high school have the lowest fertility at 6.0 births per 1,000 women. Women with the education attainment of college or associate's degree represent 46.0% of all women with births.
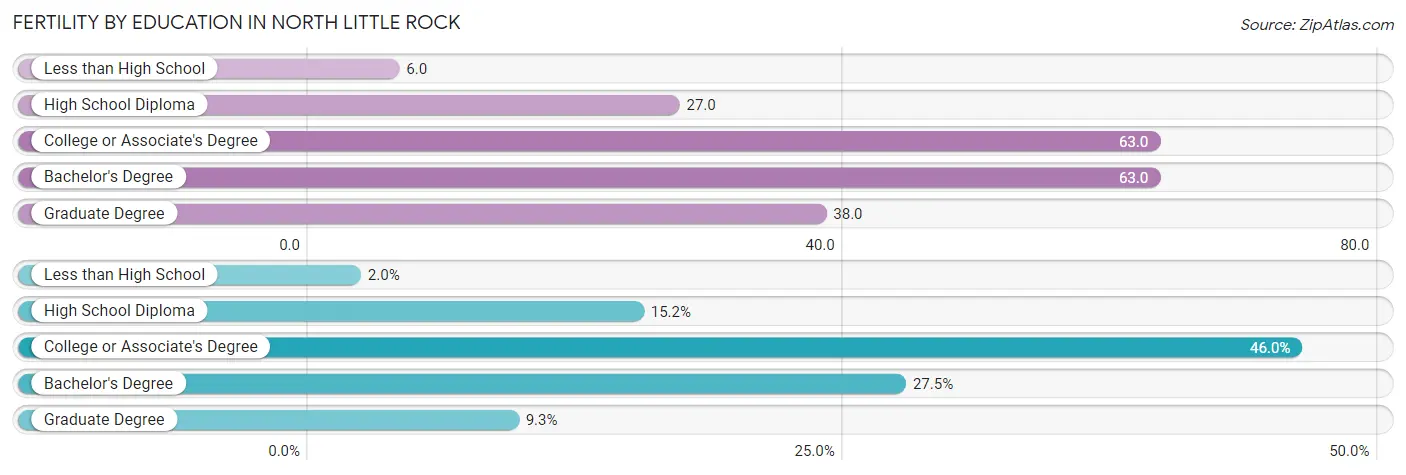
| Educational Attainment | Women with Births | Births / 1,000 Women |
| Less than High School | 14 (1.9%) | 6.0 |
| High School Diploma | 109 (15.2%) | 27.0 |
| College or Associate's Degree | 330 (46.0%) | 63.0 |
| Bachelor's Degree | 197 (27.5%) | 63.0 |
| Graduate Degree | 67 (9.3%) | 38.0 |
| Total | 717 (100.0%) | 44.0 |
Fertility by Education by Marriage Status in North Little Rock
35.1% of women with births in North Little Rock are unmarried. Women with the educational attainment of bachelor's degree are most likely to be married with 100.0% of them married at childbirth, while women with the educational attainment of less than high school are least likely to be married with 100.0% of them unmarried at childbirth.
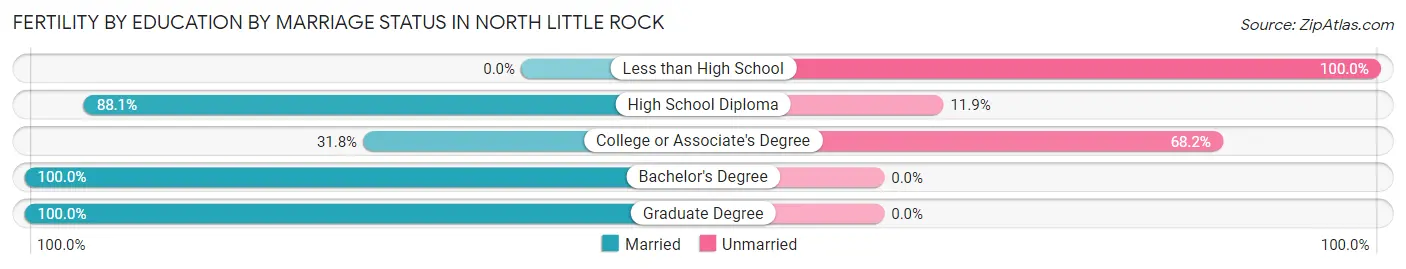
| Educational Attainment | Married | Unmarried |
| Less than High School | 0 (0.0%) | 14 (100.0%) |
| High School Diploma | 96 (88.1%) | 13 (11.9%) |
| College or Associate's Degree | 105 (31.8%) | 225 (68.2%) |
| Bachelor's Degree | 197 (100.0%) | 0 (0.0%) |
| Graduate Degree | 67 (100.0%) | 0 (0.0%) |
| Total | 465 (64.8%) | 252 (35.1%) |
Employment Characteristics in North Little Rock
Employment by Class of Employer in North Little Rock
Among the 30,566 employed individuals in North Little Rock, private company employees (19,916 | 65.2%), state government employees (2,834 | 9.3%), and not-for-profit organizations (2,078 | 6.8%) make up the most common classes of employment.
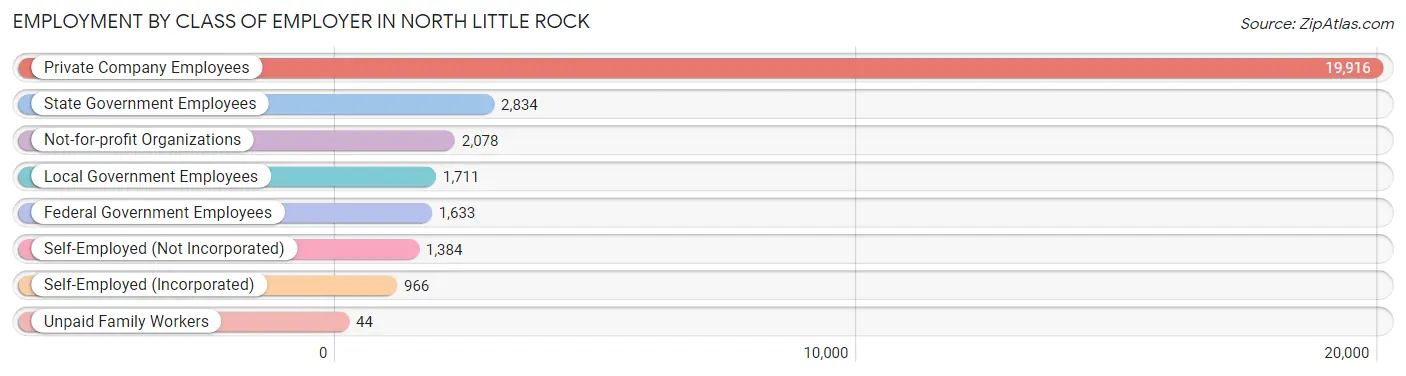
| Employer Class | # Employees | % Employees |
| Private Company Employees | 19,916 | 65.2% |
| Self-Employed (Incorporated) | 966 | 3.2% |
| Self-Employed (Not Incorporated) | 1,384 | 4.5% |
| Not-for-profit Organizations | 2,078 | 6.8% |
| Local Government Employees | 1,711 | 5.6% |
| State Government Employees | 2,834 | 9.3% |
| Federal Government Employees | 1,633 | 5.3% |
| Unpaid Family Workers | 44 | 0.1% |
| Total | 30,566 | 100.0% |
Employment Status by Age in North Little Rock
According to the labor force statistics for North Little Rock, out of the total population over 16 years of age (51,090), 65.0% or 33,208 individuals are in the labor force, with 6.6% or 2,192 of them unemployed. The age group with the highest labor force participation rate is 25 to 29 years, with 90.2% or 4,962 individuals in the labor force. Within the labor force, the 16 to 19 years age range has the highest percentage of unemployed individuals, with 22.1% or 152 of them being unemployed.
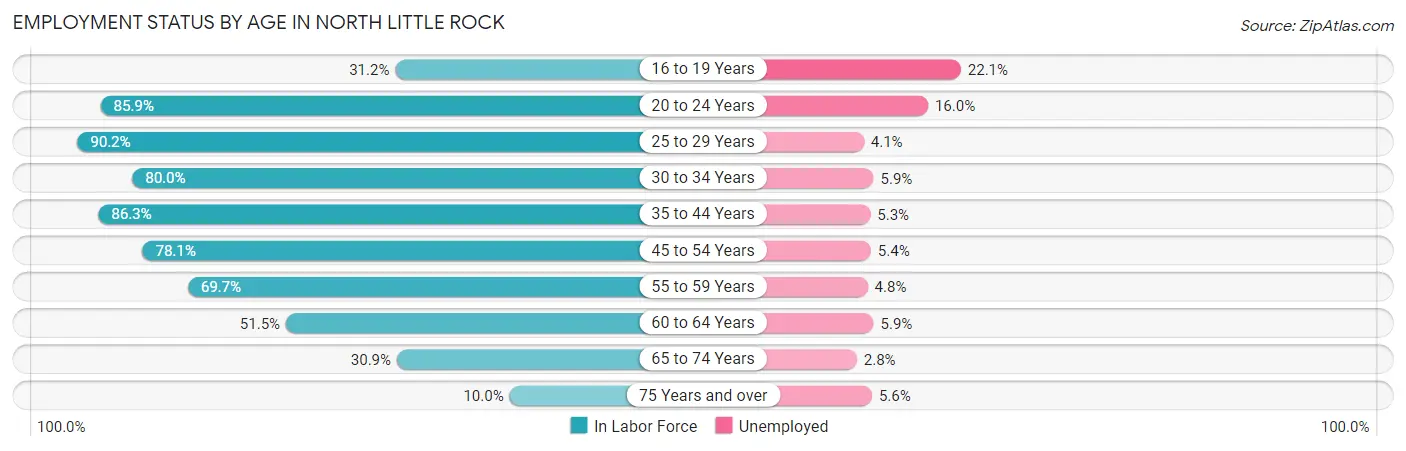
| Age Bracket | In Labor Force | Unemployed |
| 16 to 19 Years | 688 (31.2%) | 152 (22.1%) |
| 20 to 24 Years | 3,794 (85.9%) | 607 (16.0%) |
| 25 to 29 Years | 4,962 (90.2%) | 203 (4.1%) |
| 30 to 34 Years | 4,330 (80.0%) | 255 (5.9%) |
| 35 to 44 Years | 6,370 (86.3%) | 338 (5.3%) |
| 45 to 54 Years | 5,697 (78.1%) | 308 (5.4%) |
| 55 to 59 Years | 2,765 (69.7%) | 133 (4.8%) |
| 60 to 64 Years | 2,147 (51.5%) | 127 (5.9%) |
| 65 to 74 Years | 2,047 (30.9%) | 57 (2.8%) |
| 75 Years and over | 412 (10.0%) | 23 (5.6%) |
| Total | 33,208 (65.0%) | 2,192 (6.6%) |
Employment Status by Educational Attainment in North Little Rock
According to labor force statistics for North Little Rock, 77.9% of individuals (26,272) out of the total population between 25 and 64 years of age (33,725) are in the labor force, with 5.2% or 1,366 of them being unemployed. The group with the highest labor force participation rate are those with the educational attainment of bachelor's degree or higher, with 87.9% or 8,914 individuals in the labor force. Within the labor force, individuals with less than high school education have the highest percentage of unemployment, with 6.8% or 104 of them being unemployed.
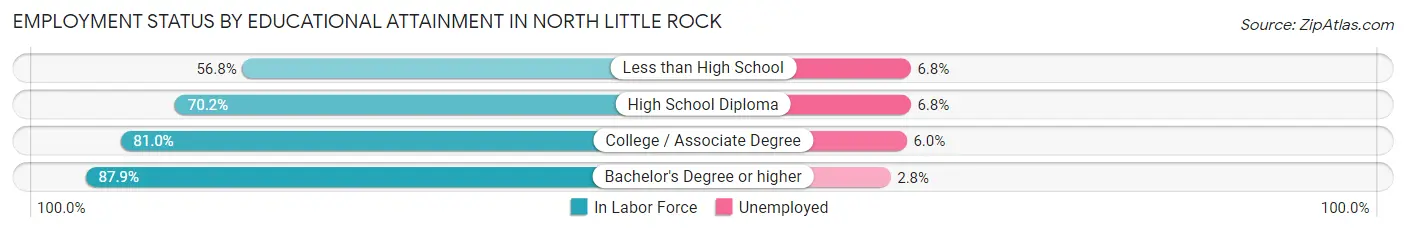
| Educational Attainment | In Labor Force | Unemployed |
| Less than High School | 1,534 (56.8%) | 184 (6.8%) |
| High School Diploma | 7,114 (70.2%) | 689 (6.8%) |
| College / Associate Degree | 8,708 (81.0%) | 645 (6.0%) |
| Bachelor's Degree or higher | 8,914 (87.9%) | 284 (2.8%) |
| Total | 26,272 (77.9%) | 1,754 (5.2%) |
Employment Occupations by Sex in North Little Rock
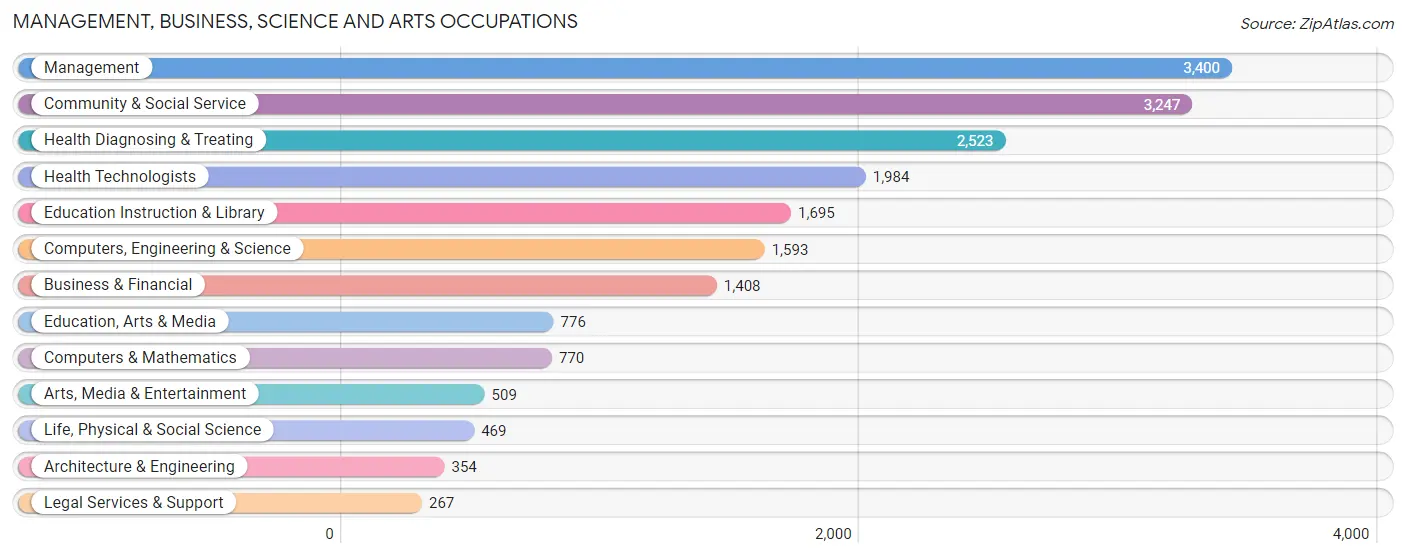
Management, Business, Science and Arts Occupations
The most common Management, Business, Science and Arts occupations in North Little Rock are Management (3,400 | 11.1%), Community & Social Service (3,247 | 10.6%), Health Diagnosing & Treating (2,523 | 8.2%), Health Technologists (1,984 | 6.5%), and Education Instruction & Library (1,695 | 5.5%).
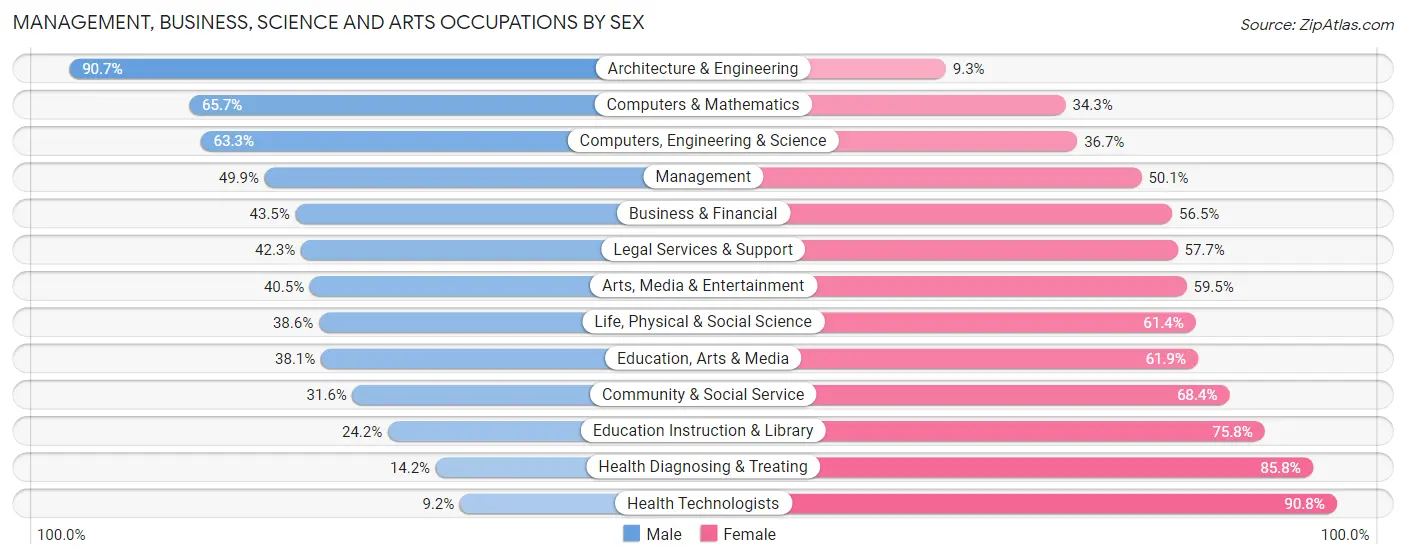
Management, Business, Science and Arts Occupations by Sex
Within the Management, Business, Science and Arts occupations in North Little Rock, the most male-oriented occupations are Architecture & Engineering (90.7%), Computers & Mathematics (65.7%), and Computers, Engineering & Science (63.3%), while the most female-oriented occupations are Health Technologists (90.8%), Health Diagnosing & Treating (85.8%), and Education Instruction & Library (75.8%).
| Occupation | Male | Female |
| Management | 1,696 (49.9%) | 1,704 (50.1%) |
| Business & Financial | 612 (43.5%) | 796 (56.5%) |
| Computers, Engineering & Science | 1,008 (63.3%) | 585 (36.7%) |
| Computers & Mathematics | 506 (65.7%) | 264 (34.3%) |
| Architecture & Engineering | 321 (90.7%) | 33 (9.3%) |
| Life, Physical & Social Science | 181 (38.6%) | 288 (61.4%) |
| Community & Social Service | 1,025 (31.6%) | 2,222 (68.4%) |
| Education, Arts & Media | 296 (38.1%) | 480 (61.9%) |
| Legal Services & Support | 113 (42.3%) | 154 (57.7%) |
| Education Instruction & Library | 410 (24.2%) | 1,285 (75.8%) |
| Arts, Media & Entertainment | 206 (40.5%) | 303 (59.5%) |
| Health Diagnosing & Treating | 358 (14.2%) | 2,165 (85.8%) |
| Health Technologists | 182 (9.2%) | 1,802 (90.8%) |
| Total (Category) | 4,699 (38.6%) | 7,472 (61.4%) |
| Total (Overall) | 14,635 (47.7%) | 16,019 (52.3%) |
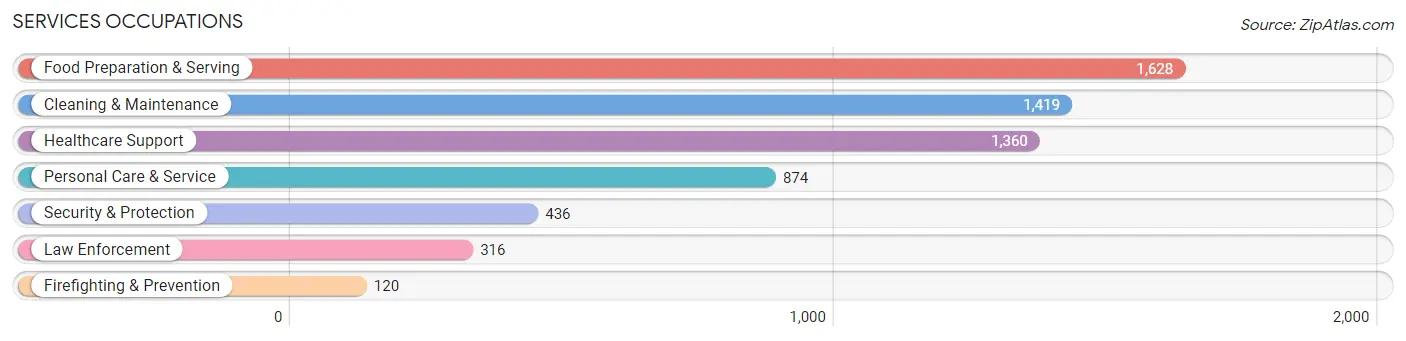
Services Occupations
The most common Services occupations in North Little Rock are Food Preparation & Serving (1,628 | 5.3%), Cleaning & Maintenance (1,419 | 4.6%), Healthcare Support (1,360 | 4.4%), Personal Care & Service (874 | 2.9%), and Security & Protection (436 | 1.4%).
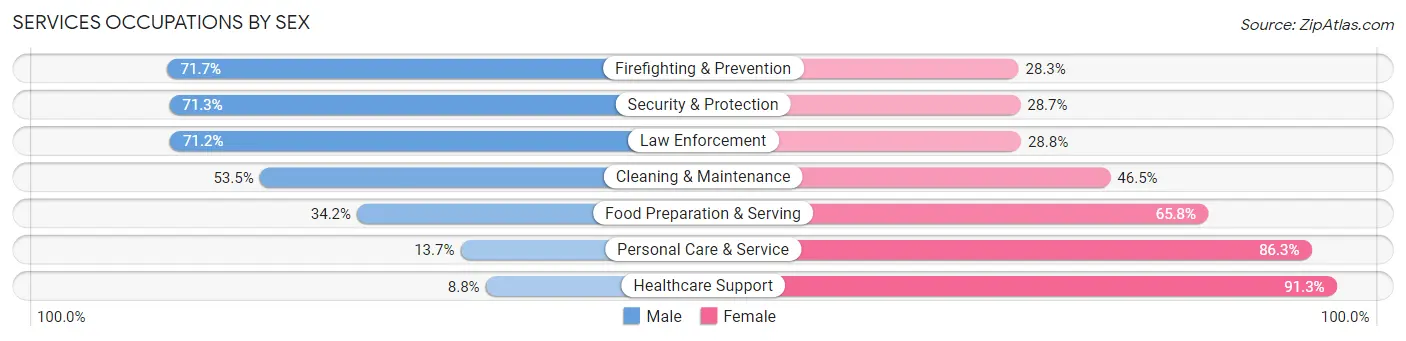
Services Occupations by Sex
Within the Services occupations in North Little Rock, the most male-oriented occupations are Firefighting & Prevention (71.7%), Security & Protection (71.3%), and Law Enforcement (71.2%), while the most female-oriented occupations are Healthcare Support (91.2%), Personal Care & Service (86.3%), and Food Preparation & Serving (65.8%).
| Occupation | Male | Female |
| Healthcare Support | 119 (8.7%) | 1,241 (91.2%) |
| Security & Protection | 311 (71.3%) | 125 (28.7%) |
| Firefighting & Prevention | 86 (71.7%) | 34 (28.3%) |
| Law Enforcement | 225 (71.2%) | 91 (28.8%) |
| Food Preparation & Serving | 557 (34.2%) | 1,071 (65.8%) |
| Cleaning & Maintenance | 759 (53.5%) | 660 (46.5%) |
| Personal Care & Service | 120 (13.7%) | 754 (86.3%) |
| Total (Category) | 1,866 (32.6%) | 3,851 (67.4%) |
| Total (Overall) | 14,635 (47.7%) | 16,019 (52.3%) |
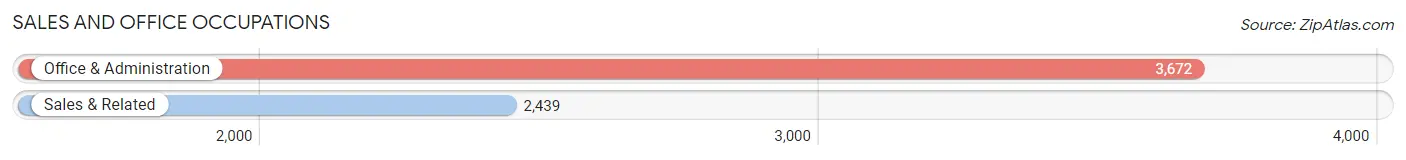
Sales and Office Occupations
The most common Sales and Office occupations in North Little Rock are Office & Administration (3,672 | 12.0%), and Sales & Related (2,439 | 8.0%).
Sales and Office Occupations by Sex
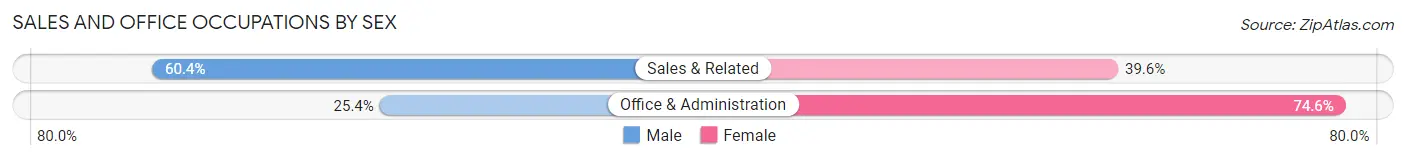
| Occupation | Male | Female |
| Sales & Related | 1,473 (60.4%) | 966 (39.6%) |
| Office & Administration | 932 (25.4%) | 2,740 (74.6%) |
| Total (Category) | 2,405 (39.4%) | 3,706 (60.6%) |
| Total (Overall) | 14,635 (47.7%) | 16,019 (52.3%) |
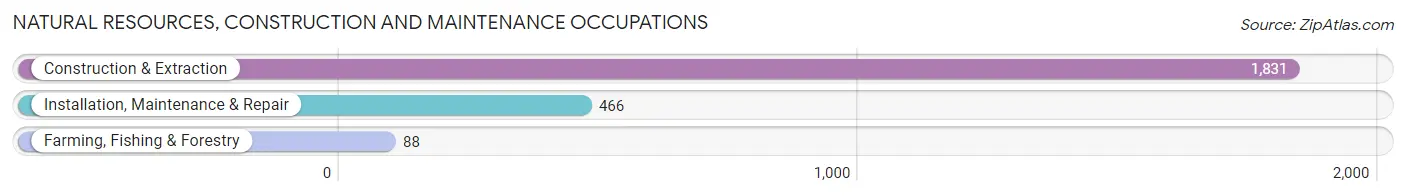
Natural Resources, Construction and Maintenance Occupations
The most common Natural Resources, Construction and Maintenance occupations in North Little Rock are Construction & Extraction (1,831 | 6.0%), Installation, Maintenance & Repair (466 | 1.5%), and Farming, Fishing & Forestry (88 | 0.3%).
Natural Resources, Construction and Maintenance Occupations by Sex
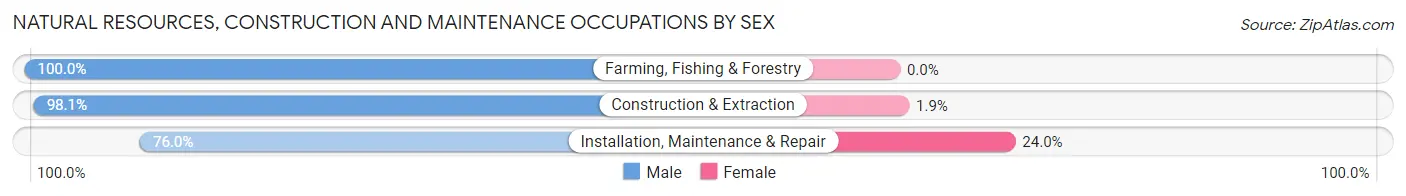
| Occupation | Male | Female |
| Farming, Fishing & Forestry | 88 (100.0%) | 0 (0.0%) |
| Construction & Extraction | 1,796 (98.1%) | 35 (1.9%) |
| Installation, Maintenance & Repair | 354 (76.0%) | 112 (24.0%) |
| Total (Category) | 2,238 (93.8%) | 147 (6.2%) |
| Total (Overall) | 14,635 (47.7%) | 16,019 (52.3%) |
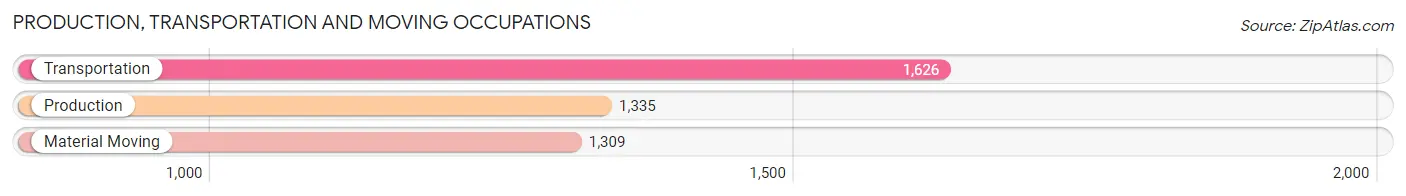
Production, Transportation and Moving Occupations
The most common Production, Transportation and Moving occupations in North Little Rock are Transportation (1,626 | 5.3%), Production (1,335 | 4.4%), and Material Moving (1,309 | 4.3%).
Production, Transportation and Moving Occupations by Sex
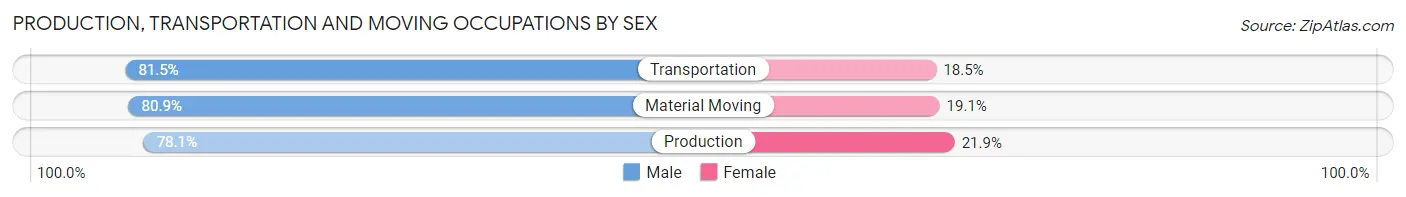
| Occupation | Male | Female |
| Production | 1,043 (78.1%) | 292 (21.9%) |
| Transportation | 1,325 (81.5%) | 301 (18.5%) |
| Material Moving | 1,059 (80.9%) | 250 (19.1%) |
| Total (Category) | 3,427 (80.3%) | 843 (19.7%) |
| Total (Overall) | 14,635 (47.7%) | 16,019 (52.3%) |
Employment Industries by Sex in North Little Rock
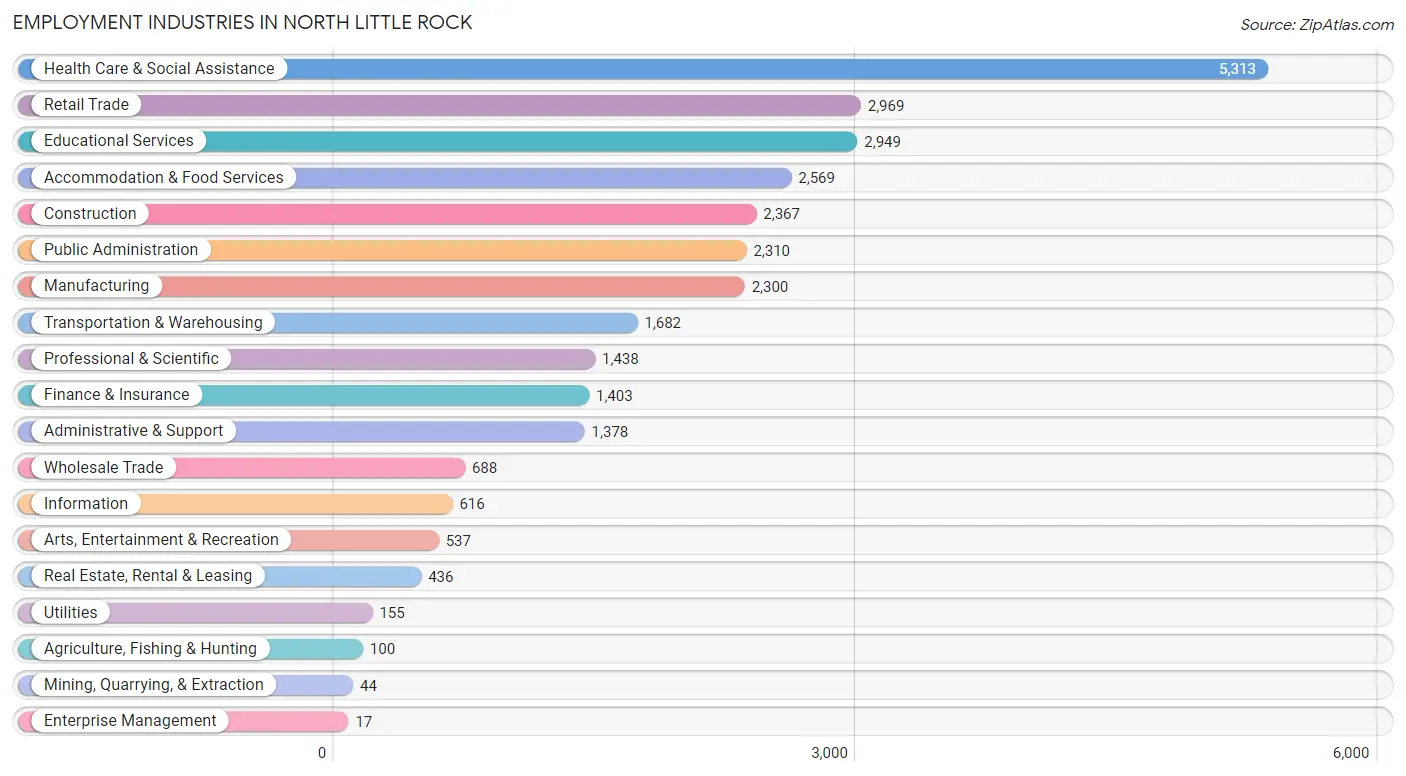
Employment Industries in North Little Rock
The major employment industries in North Little Rock include Health Care & Social Assistance (5,313 | 17.3%), Retail Trade (2,969 | 9.7%), Educational Services (2,949 | 9.6%), Accommodation & Food Services (2,569 | 8.4%), and Construction (2,367 | 7.7%).
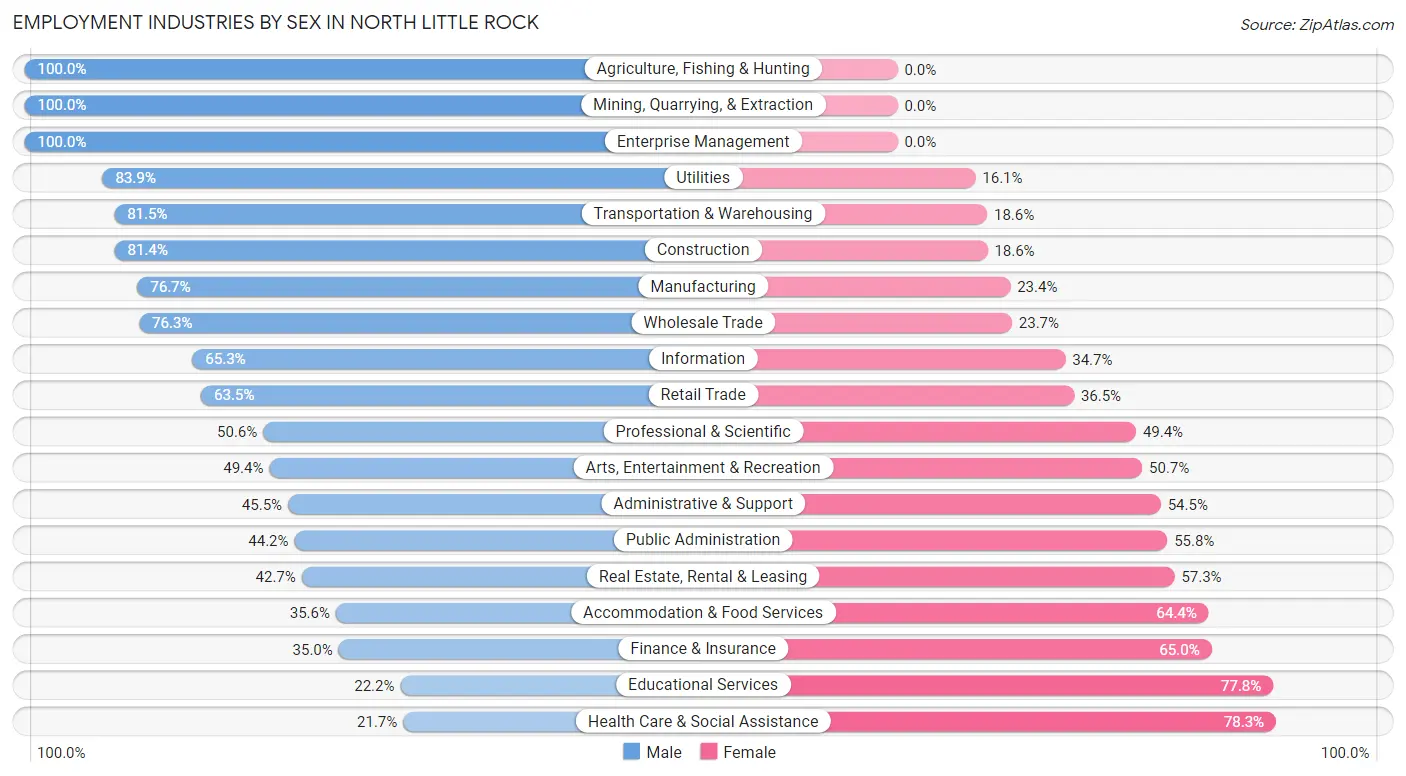
Employment Industries by Sex in North Little Rock
The North Little Rock industries that see more men than women are Agriculture, Fishing & Hunting (100.0%), Mining, Quarrying, & Extraction (100.0%), and Enterprise Management (100.0%), whereas the industries that tend to have a higher number of women are Health Care & Social Assistance (78.3%), Educational Services (77.8%), and Finance & Insurance (65.0%).
| Industry | Male | Female |
| Agriculture, Fishing & Hunting | 100 (100.0%) | 0 (0.0%) |
| Mining, Quarrying, & Extraction | 44 (100.0%) | 0 (0.0%) |
| Construction | 1,926 (81.4%) | 441 (18.6%) |
| Manufacturing | 1,763 (76.6%) | 537 (23.4%) |
| Wholesale Trade | 525 (76.3%) | 163 (23.7%) |
| Retail Trade | 1,884 (63.5%) | 1,085 (36.5%) |
| Transportation & Warehousing | 1,370 (81.5%) | 312 (18.5%) |
| Utilities | 130 (83.9%) | 25 (16.1%) |
| Information | 402 (65.3%) | 214 (34.7%) |
| Finance & Insurance | 491 (35.0%) | 912 (65.0%) |
| Real Estate, Rental & Leasing | 186 (42.7%) | 250 (57.3%) |
| Professional & Scientific | 728 (50.6%) | 710 (49.4%) |
| Enterprise Management | 17 (100.0%) | 0 (0.0%) |
| Administrative & Support | 627 (45.5%) | 751 (54.5%) |
| Educational Services | 656 (22.2%) | 2,293 (77.8%) |
| Health Care & Social Assistance | 1,151 (21.7%) | 4,162 (78.3%) |
| Arts, Entertainment & Recreation | 265 (49.3%) | 272 (50.6%) |
| Accommodation & Food Services | 914 (35.6%) | 1,655 (64.4%) |
| Public Administration | 1,020 (44.2%) | 1,290 (55.8%) |
| Total | 14,635 (47.7%) | 16,019 (52.3%) |
Education in North Little Rock
School Enrollment in North Little Rock
The most common levels of schooling among the 14,446 students in North Little Rock are elementary school (3,688 | 25.5%), middle school (3,136 | 21.7%), and high school (2,846 | 19.7%).
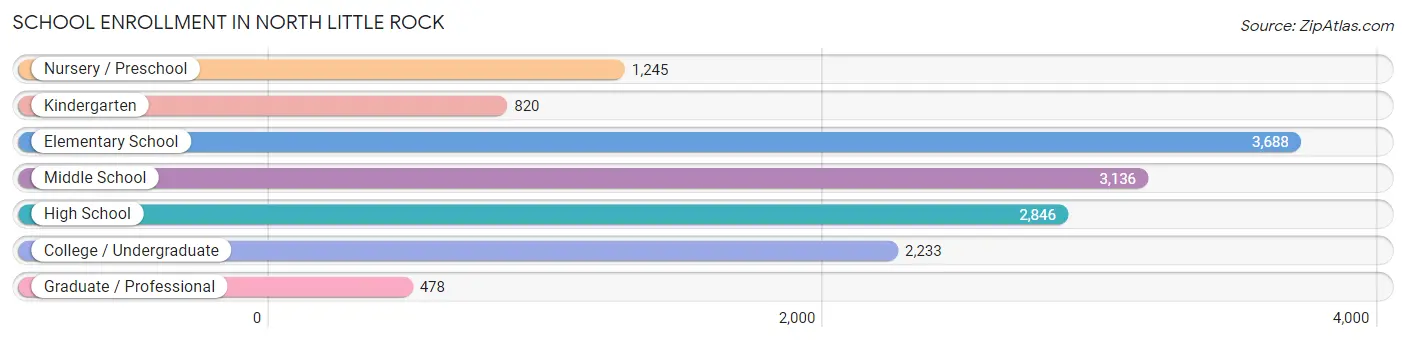
| School Level | # Students | % Students |
| Nursery / Preschool | 1,245 | 8.6% |
| Kindergarten | 820 | 5.7% |
| Elementary School | 3,688 | 25.5% |
| Middle School | 3,136 | 21.7% |
| High School | 2,846 | 19.7% |
| College / Undergraduate | 2,233 | 15.5% |
| Graduate / Professional | 478 | 3.3% |
| Total | 14,446 | 100.0% |
School Enrollment by Age by Funding Source in North Little Rock
Out of a total of 14,446 students who are enrolled in schools in North Little Rock, 1,488 (10.3%) attend a private institution, while the remaining 12,958 (89.7%) are enrolled in public schools. The age group of 35 years and over has the highest likelihood of being enrolled in private schools, with 206 (23.7% in the age bracket) enrolled. Conversely, the age group of 5 to 9 year old has the lowest likelihood of being enrolled in a private school, with 4,066 (93.2% in the age bracket) attending a public institution.
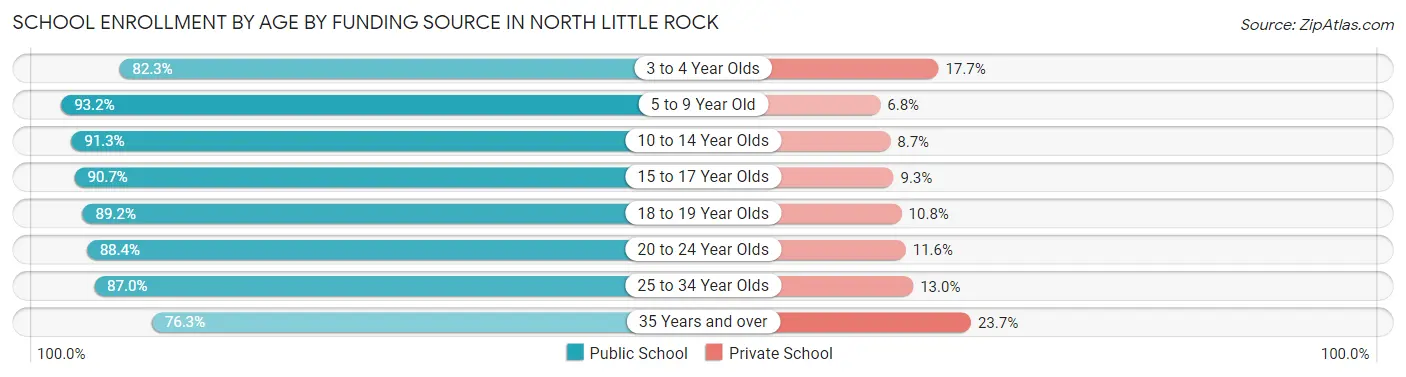
| Age Bracket | Public School | Private School |
| 3 to 4 Year Olds | 858 (82.3%) | 184 (17.7%) |
| 5 to 9 Year Old | 4,066 (93.2%) | 298 (6.8%) |
| 10 to 14 Year Olds | 3,443 (91.3%) | 328 (8.7%) |
| 15 to 17 Year Olds | 1,738 (90.7%) | 178 (9.3%) |
| 18 to 19 Year Olds | 545 (89.2%) | 66 (10.8%) |
| 20 to 24 Year Olds | 749 (88.4%) | 98 (11.6%) |
| 25 to 34 Year Olds | 893 (87.0%) | 133 (13.0%) |
| 35 Years and over | 663 (76.3%) | 206 (23.7%) |
| Total | 12,958 (89.7%) | 1,488 (10.3%) |
Educational Attainment by Field of Study in North Little Rock
Business (3,082 | 20.9%), education (1,634 | 11.1%), arts & humanities (1,561 | 10.6%), science & technology (1,510 | 10.2%), and bio, nature & agricultural (896 | 6.1%) are the most common fields of study among 14,749 individuals in North Little Rock who have obtained a bachelor's degree or higher.
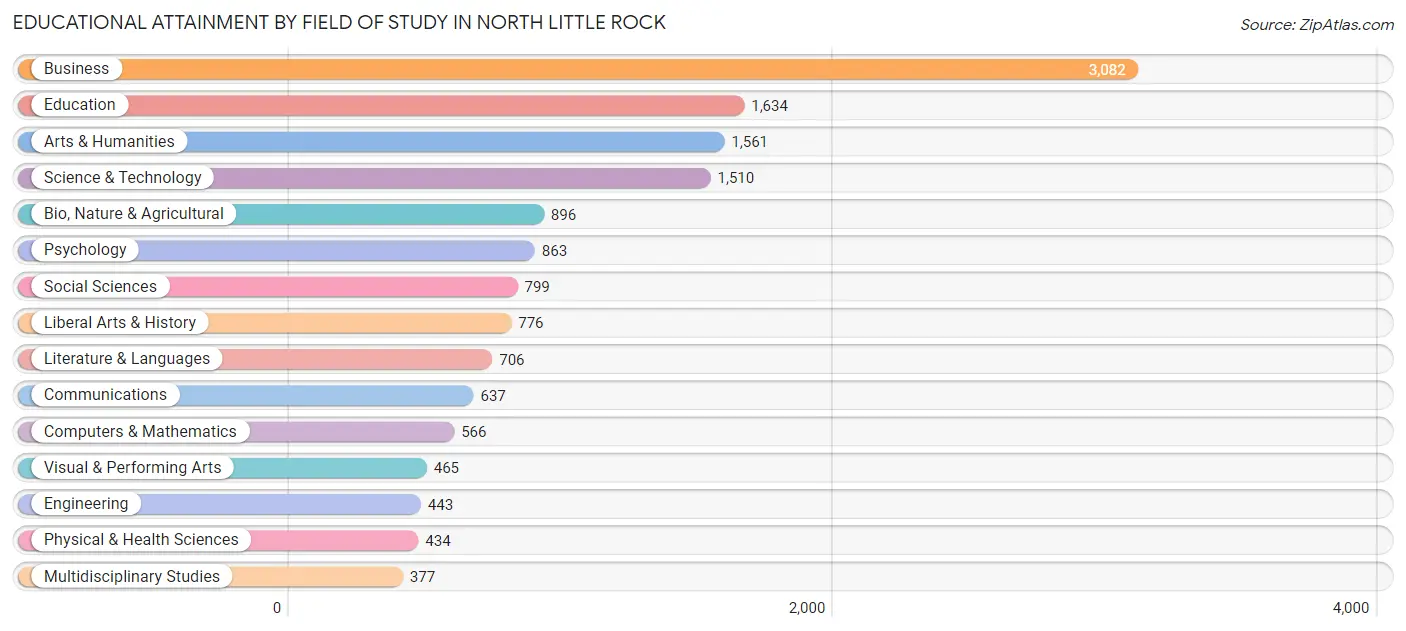
| Field of Study | # Graduates | % Graduates |
| Computers & Mathematics | 566 | 3.8% |
| Bio, Nature & Agricultural | 896 | 6.1% |
| Physical & Health Sciences | 434 | 2.9% |
| Psychology | 863 | 5.9% |
| Social Sciences | 799 | 5.4% |
| Engineering | 443 | 3.0% |
| Multidisciplinary Studies | 377 | 2.6% |
| Science & Technology | 1,510 | 10.2% |
| Business | 3,082 | 20.9% |
| Education | 1,634 | 11.1% |
| Literature & Languages | 706 | 4.8% |
| Liberal Arts & History | 776 | 5.3% |
| Visual & Performing Arts | 465 | 3.2% |
| Communications | 637 | 4.3% |
| Arts & Humanities | 1,561 | 10.6% |
| Total | 14,749 | 100.0% |
Transportation & Commute in North Little Rock
Vehicle Availability by Sex in North Little Rock
The most prevalent vehicle ownership categories in North Little Rock are males with 2 vehicles (6,621, accounting for 44.9%) and females with 2 vehicles (5,741, making up 42.0%).
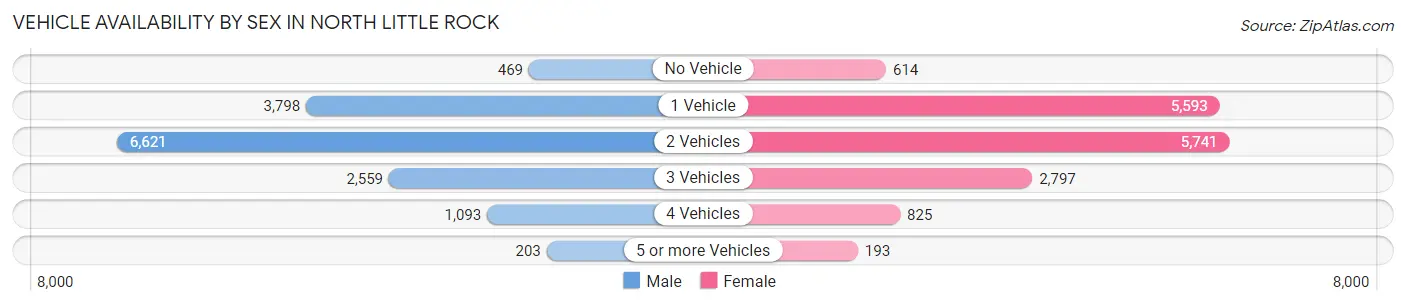
| Vehicles Available | Male | Female |
| No Vehicle | 469 (3.2%) | 614 (3.9%) |
| 1 Vehicle | 3,798 (25.8%) | 5,593 (35.5%) |
| 2 Vehicles | 6,621 (44.9%) | 5,741 (36.4%) |
| 3 Vehicles | 2,559 (17.4%) | 2,797 (17.7%) |
| 4 Vehicles | 1,093 (7.4%) | 825 (5.2%) |
| 5 or more Vehicles | 203 (1.4%) | 193 (1.2%) |
| Total | 14,743 (100.0%) | 15,763 (100.0%) |
Commute Time in North Little Rock
The most frequently occuring commute durations in North Little Rock are 15 to 19 minutes (7,077 commuters, 24.6%), 20 to 24 minutes (5,913 commuters, 20.6%), and 10 to 14 minutes (5,000 commuters, 17.4%).
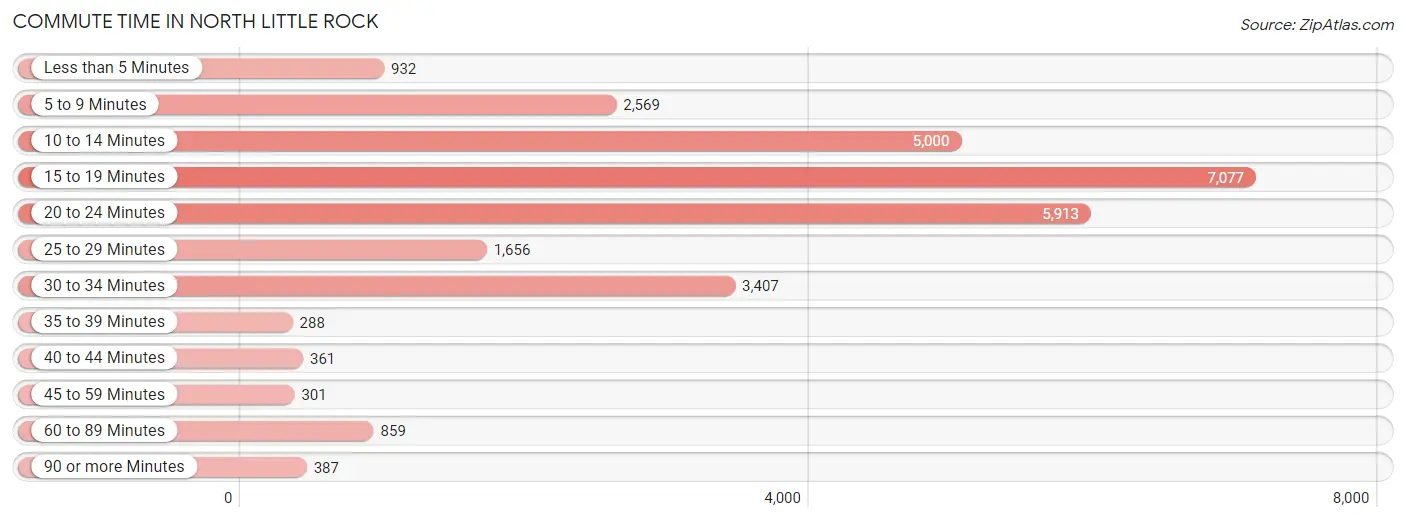
| Commute Time | # Commuters | % Commuters |
| Less than 5 Minutes | 932 | 3.2% |
| 5 to 9 Minutes | 2,569 | 8.9% |
| 10 to 14 Minutes | 5,000 | 17.4% |
| 15 to 19 Minutes | 7,077 | 24.6% |
| 20 to 24 Minutes | 5,913 | 20.6% |
| 25 to 29 Minutes | 1,656 | 5.8% |
| 30 to 34 Minutes | 3,407 | 11.8% |
| 35 to 39 Minutes | 288 | 1.0% |
| 40 to 44 Minutes | 361 | 1.3% |
| 45 to 59 Minutes | 301 | 1.1% |
| 60 to 89 Minutes | 859 | 3.0% |
| 90 or more Minutes | 387 | 1.3% |
Commute Time by Sex in North Little Rock
The most common commute times in North Little Rock are 20 to 24 minutes (3,276 commuters, 23.4%) for males and 15 to 19 minutes (4,084 commuters, 27.7%) for females.
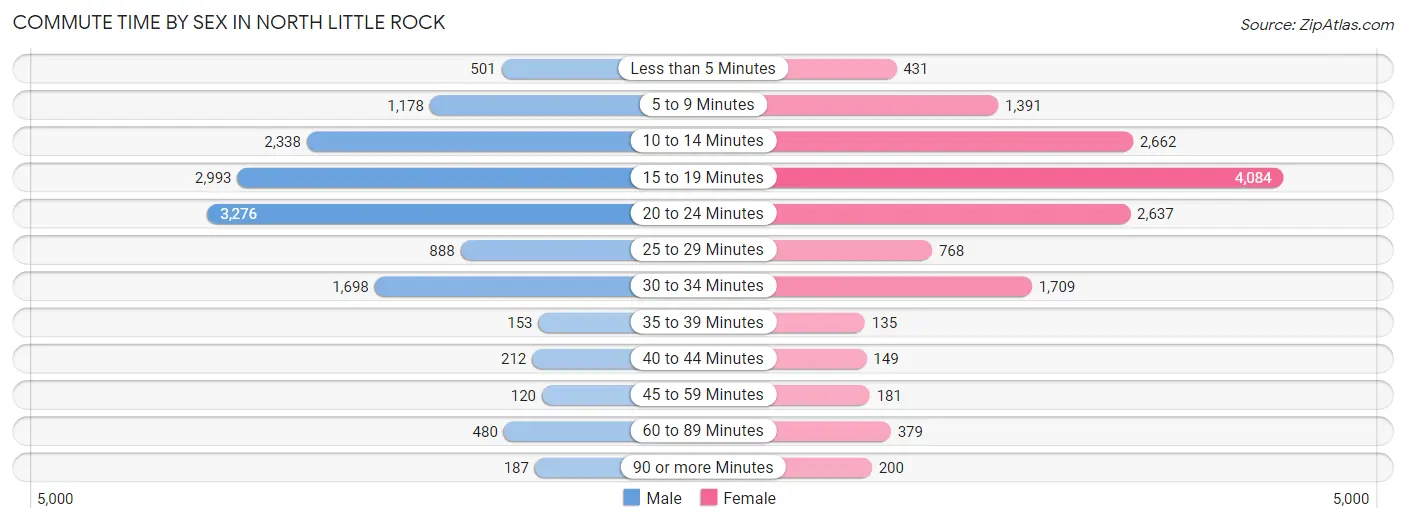
| Commute Time | Male | Female |
| Less than 5 Minutes | 501 (3.6%) | 431 (2.9%) |
| 5 to 9 Minutes | 1,178 (8.4%) | 1,391 (9.5%) |
| 10 to 14 Minutes | 2,338 (16.7%) | 2,662 (18.1%) |
| 15 to 19 Minutes | 2,993 (21.3%) | 4,084 (27.7%) |
| 20 to 24 Minutes | 3,276 (23.4%) | 2,637 (17.9%) |
| 25 to 29 Minutes | 888 (6.3%) | 768 (5.2%) |
| 30 to 34 Minutes | 1,698 (12.1%) | 1,709 (11.6%) |
| 35 to 39 Minutes | 153 (1.1%) | 135 (0.9%) |
| 40 to 44 Minutes | 212 (1.5%) | 149 (1.0%) |
| 45 to 59 Minutes | 120 (0.9%) | 181 (1.2%) |
| 60 to 89 Minutes | 480 (3.4%) | 379 (2.6%) |
| 90 or more Minutes | 187 (1.3%) | 200 (1.4%) |
Time of Departure to Work by Sex in North Little Rock
The most frequent times of departure to work in North Little Rock are 7:30 AM to 7:59 AM (2,308, 16.5%) for males and 7:00 AM to 7:29 AM (3,516, 23.9%) for females.
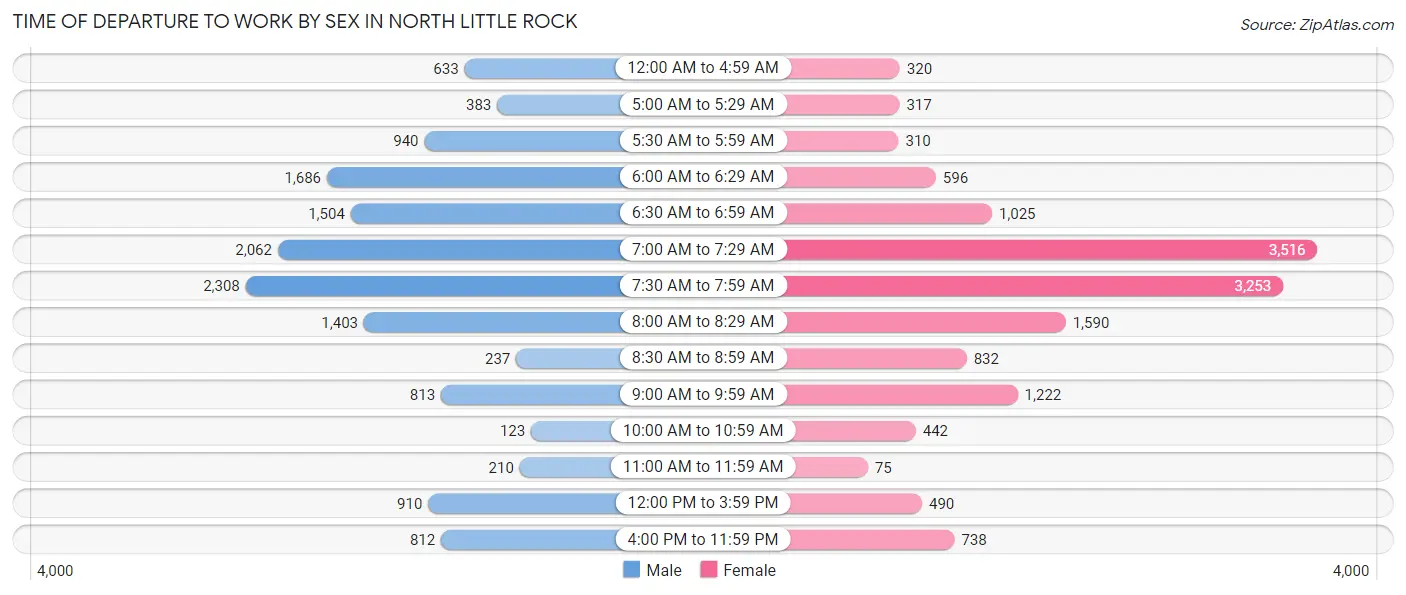
| Time of Departure | Male | Female |
| 12:00 AM to 4:59 AM | 633 (4.5%) | 320 (2.2%) |
| 5:00 AM to 5:29 AM | 383 (2.7%) | 317 (2.1%) |
| 5:30 AM to 5:59 AM | 940 (6.7%) | 310 (2.1%) |
| 6:00 AM to 6:29 AM | 1,686 (12.0%) | 596 (4.1%) |
| 6:30 AM to 6:59 AM | 1,504 (10.7%) | 1,025 (7.0%) |
| 7:00 AM to 7:29 AM | 2,062 (14.7%) | 3,516 (23.9%) |
| 7:30 AM to 7:59 AM | 2,308 (16.5%) | 3,253 (22.1%) |
| 8:00 AM to 8:29 AM | 1,403 (10.0%) | 1,590 (10.8%) |
| 8:30 AM to 8:59 AM | 237 (1.7%) | 832 (5.7%) |
| 9:00 AM to 9:59 AM | 813 (5.8%) | 1,222 (8.3%) |
| 10:00 AM to 10:59 AM | 123 (0.9%) | 442 (3.0%) |
| 11:00 AM to 11:59 AM | 210 (1.5%) | 75 (0.5%) |
| 12:00 PM to 3:59 PM | 910 (6.5%) | 490 (3.3%) |
| 4:00 PM to 11:59 PM | 812 (5.8%) | 738 (5.0%) |
| Total | 14,024 (100.0%) | 14,726 (100.0%) |
Housing Occupancy in North Little Rock
Occupancy by Ownership in North Little Rock
Of the total 29,127 dwellings in North Little Rock, owner-occupied units account for 13,864 (47.6%), while renter-occupied units make up 15,263 (52.4%).
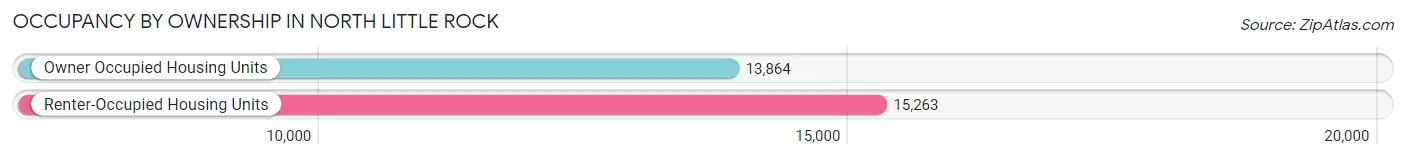
| Occupancy | # Housing Units | % Housing Units |
| Owner Occupied Housing Units | 13,864 | 47.6% |
| Renter-Occupied Housing Units | 15,263 | 52.4% |
| Total Occupied Housing Units | 29,127 | 100.0% |
Occupancy by Household Size in North Little Rock
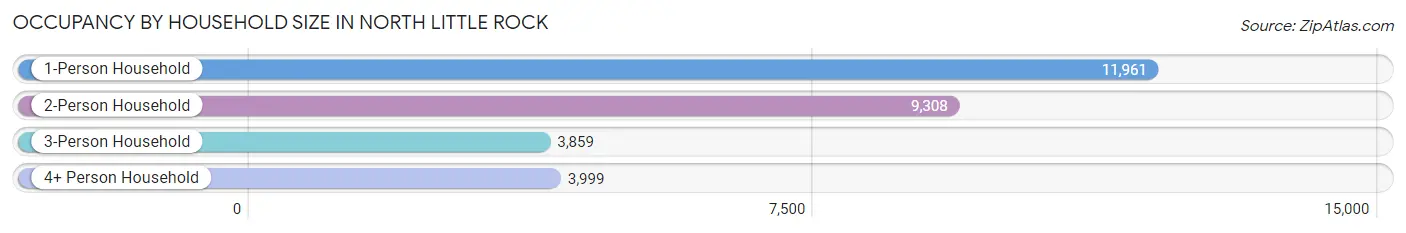
| Household Size | # Housing Units | % Housing Units |
| 1-Person Household | 11,961 | 41.1% |
| 2-Person Household | 9,308 | 32.0% |
| 3-Person Household | 3,859 | 13.3% |
| 4+ Person Household | 3,999 | 13.7% |
| Total Housing Units | 29,127 | 100.0% |
Occupancy by Ownership by Household Size in North Little Rock
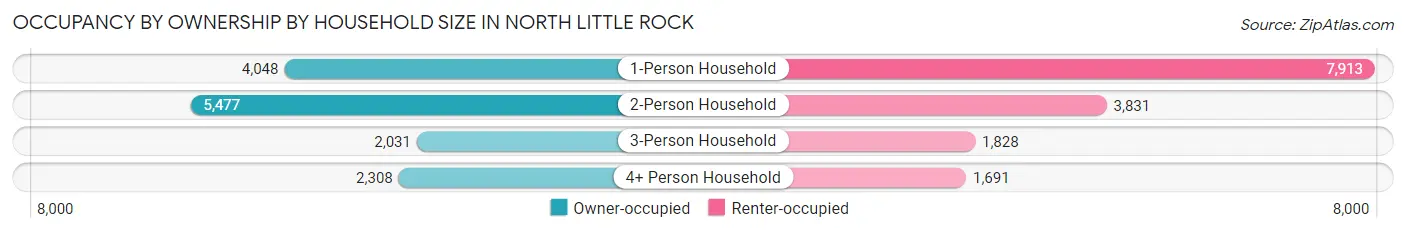
| Household Size | Owner-occupied | Renter-occupied |
| 1-Person Household | 4,048 (33.8%) | 7,913 (66.2%) |
| 2-Person Household | 5,477 (58.8%) | 3,831 (41.2%) |
| 3-Person Household | 2,031 (52.6%) | 1,828 (47.4%) |
| 4+ Person Household | 2,308 (57.7%) | 1,691 (42.3%) |
| Total Housing Units | 13,864 (47.6%) | 15,263 (52.4%) |
Occupancy by Educational Attainment in North Little Rock
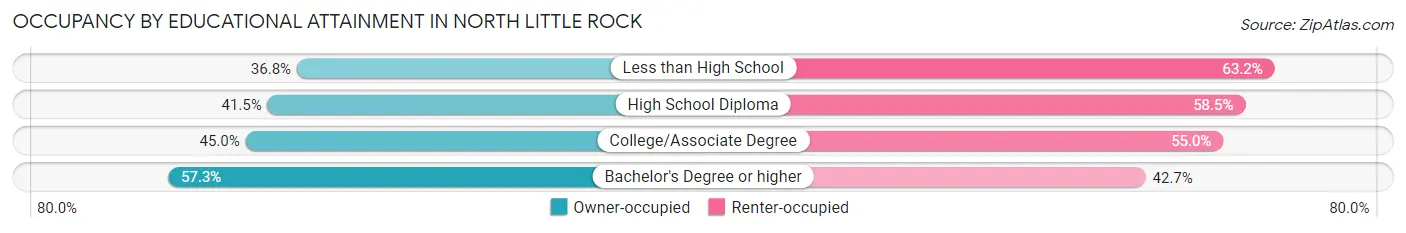
| Household Size | Owner-occupied | Renter-occupied |
| Less than High School | 738 (36.8%) | 1,267 (63.2%) |
| High School Diploma | 3,130 (41.5%) | 4,418 (58.5%) |
| College/Associate Degree | 4,431 (45.0%) | 5,425 (55.0%) |
| Bachelor's Degree or higher | 5,565 (57.3%) | 4,153 (42.7%) |
Occupancy by Age of Householder in North Little Rock
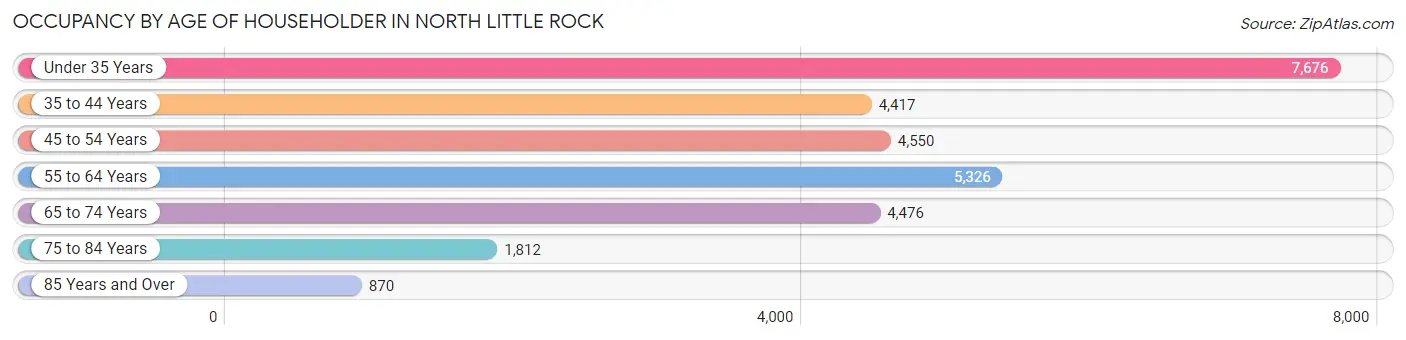
| Age Bracket | # Households | % Households |
| Under 35 Years | 7,676 | 26.4% |
| 35 to 44 Years | 4,417 | 15.2% |
| 45 to 54 Years | 4,550 | 15.6% |
| 55 to 64 Years | 5,326 | 18.3% |
| 65 to 74 Years | 4,476 | 15.4% |
| 75 to 84 Years | 1,812 | 6.2% |
| 85 Years and Over | 870 | 3.0% |
| Total | 29,127 | 100.0% |
Housing Finances in North Little Rock
Median Income by Occupancy in North Little Rock
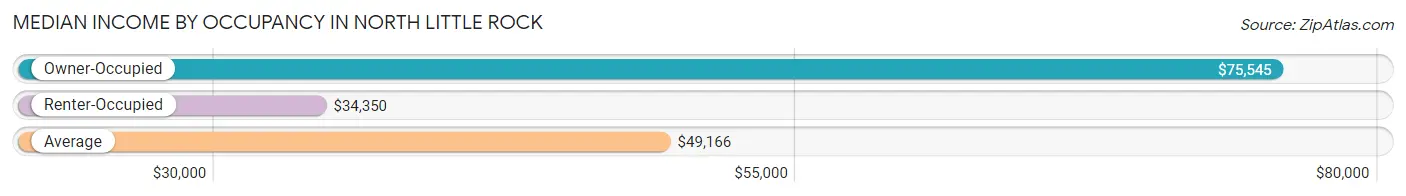
| Occupancy Type | # Households | Median Income |
| Owner-Occupied | 13,864 (47.6%) | $75,545 |
| Renter-Occupied | 15,263 (52.4%) | $34,350 |
| Average | 29,127 (100.0%) | $49,166 |
Occupancy by Householder Income Bracket in North Little Rock
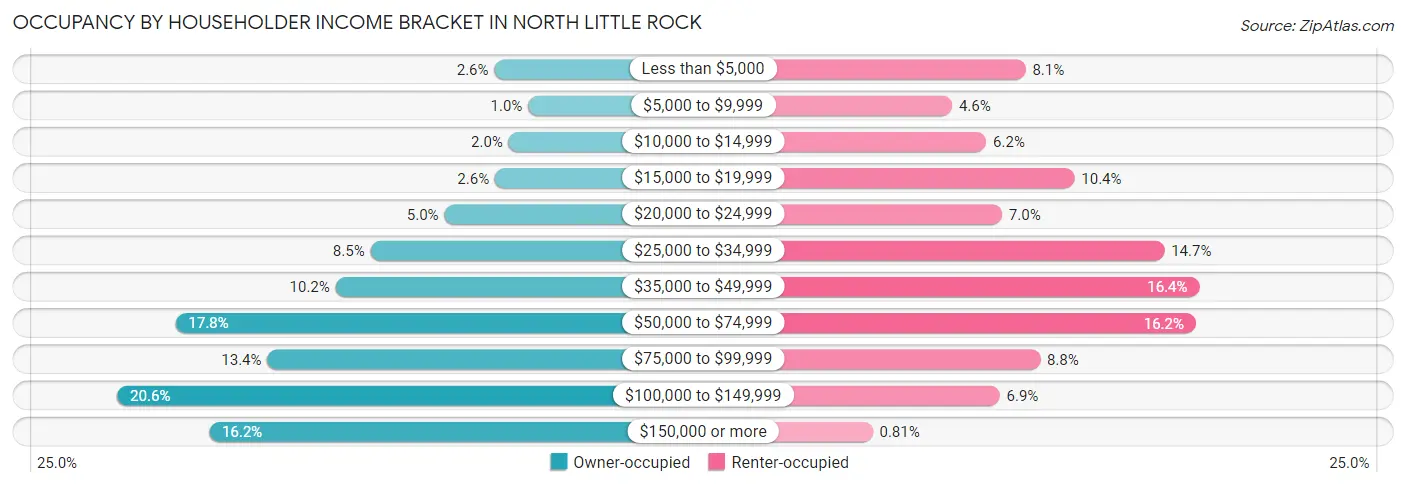
| Income Bracket | Owner-occupied | Renter-occupied |
| Less than $5,000 | 364 (2.6%) | 1,235 (8.1%) |
| $5,000 to $9,999 | 141 (1.0%) | 700 (4.6%) |
| $10,000 to $14,999 | 271 (1.9%) | 949 (6.2%) |
| $15,000 to $19,999 | 360 (2.6%) | 1,590 (10.4%) |
| $20,000 to $24,999 | 694 (5.0%) | 1,064 (7.0%) |
| $25,000 to $34,999 | 1,183 (8.5%) | 2,244 (14.7%) |
| $35,000 to $49,999 | 1,413 (10.2%) | 2,499 (16.4%) |
| $50,000 to $74,999 | 2,470 (17.8%) | 2,472 (16.2%) |
| $75,000 to $99,999 | 1,864 (13.4%) | 1,340 (8.8%) |
| $100,000 to $149,999 | 2,855 (20.6%) | 1,047 (6.9%) |
| $150,000 or more | 2,249 (16.2%) | 123 (0.8%) |
| Total | 13,864 (100.0%) | 15,263 (100.0%) |
Monthly Housing Cost Tiers in North Little Rock
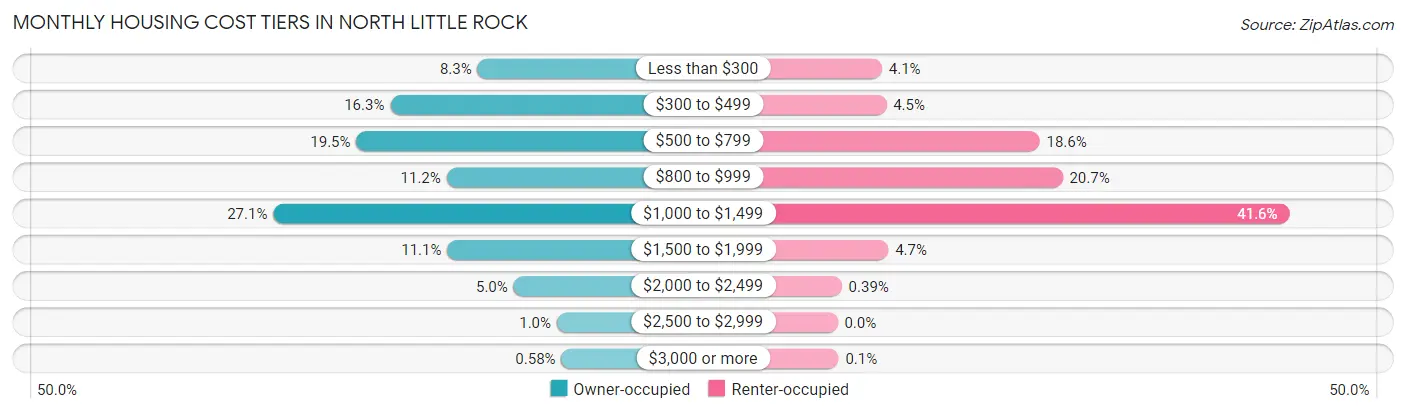
| Monthly Cost | Owner-occupied | Renter-occupied |
| Less than $300 | 1,151 (8.3%) | 625 (4.1%) |
| $300 to $499 | 2,266 (16.3%) | 685 (4.5%) |
| $500 to $799 | 2,698 (19.5%) | 2,841 (18.6%) |
| $800 to $999 | 1,546 (11.2%) | 3,162 (20.7%) |
| $1,000 to $1,499 | 3,758 (27.1%) | 6,350 (41.6%) |
| $1,500 to $1,999 | 1,537 (11.1%) | 714 (4.7%) |
| $2,000 to $2,499 | 690 (5.0%) | 60 (0.4%) |
| $2,500 to $2,999 | 138 (1.0%) | 0 (0.0%) |
| $3,000 or more | 80 (0.6%) | 16 (0.1%) |
| Total | 13,864 (100.0%) | 15,263 (100.0%) |
Physical Housing Characteristics in North Little Rock
Housing Structures in North Little Rock
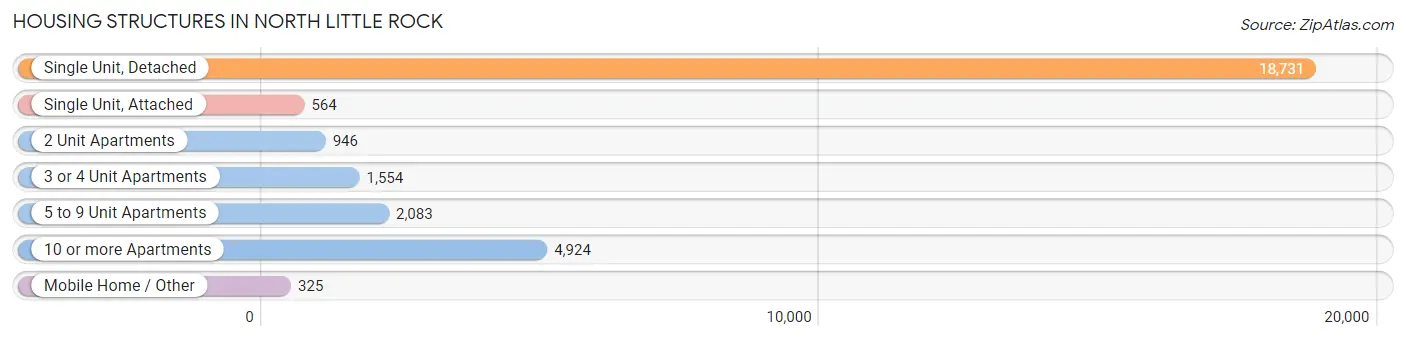
| Structure Type | # Housing Units | % Housing Units |
| Single Unit, Detached | 18,731 | 64.3% |
| Single Unit, Attached | 564 | 1.9% |
| 2 Unit Apartments | 946 | 3.3% |
| 3 or 4 Unit Apartments | 1,554 | 5.3% |
| 5 to 9 Unit Apartments | 2,083 | 7.1% |
| 10 or more Apartments | 4,924 | 16.9% |
| Mobile Home / Other | 325 | 1.1% |
| Total | 29,127 | 100.0% |
Housing Structures by Occupancy in North Little Rock
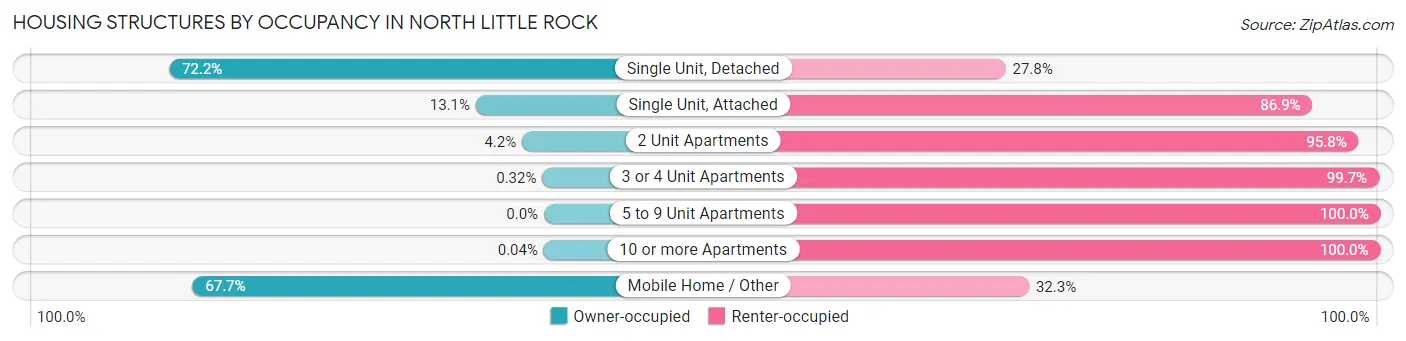
| Structure Type | Owner-occupied | Renter-occupied |
| Single Unit, Detached | 13,523 (72.2%) | 5,208 (27.8%) |
| Single Unit, Attached | 74 (13.1%) | 490 (86.9%) |
| 2 Unit Apartments | 40 (4.2%) | 906 (95.8%) |
| 3 or 4 Unit Apartments | 5 (0.3%) | 1,549 (99.7%) |
| 5 to 9 Unit Apartments | 0 (0.0%) | 2,083 (100.0%) |
| 10 or more Apartments | 2 (0.0%) | 4,922 (100.0%) |
| Mobile Home / Other | 220 (67.7%) | 105 (32.3%) |
| Total | 13,864 (47.6%) | 15,263 (52.4%) |
Housing Structures by Number of Rooms in North Little Rock
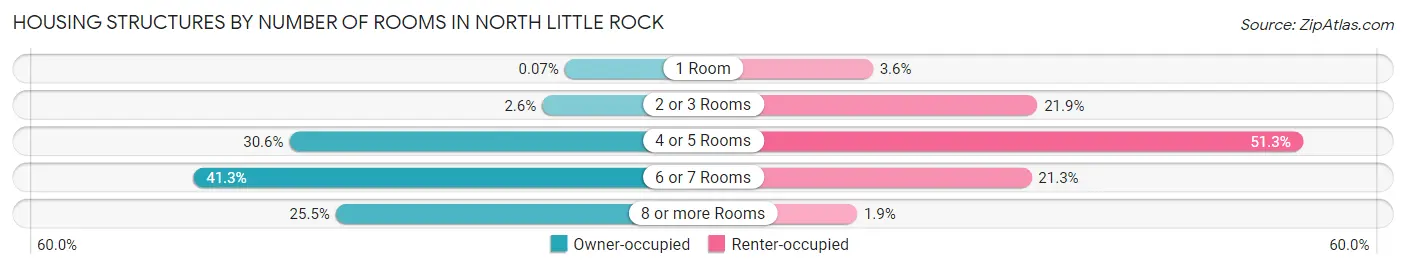
| Number of Rooms | Owner-occupied | Renter-occupied |
| 1 Room | 10 (0.1%) | 555 (3.6%) |
| 2 or 3 Rooms | 356 (2.6%) | 3,343 (21.9%) |
| 4 or 5 Rooms | 4,245 (30.6%) | 7,834 (51.3%) |
| 6 or 7 Rooms | 5,721 (41.3%) | 3,243 (21.2%) |
| 8 or more Rooms | 3,532 (25.5%) | 288 (1.9%) |
| Total | 13,864 (100.0%) | 15,263 (100.0%) |
Housing Structure by Heating Type in North Little Rock
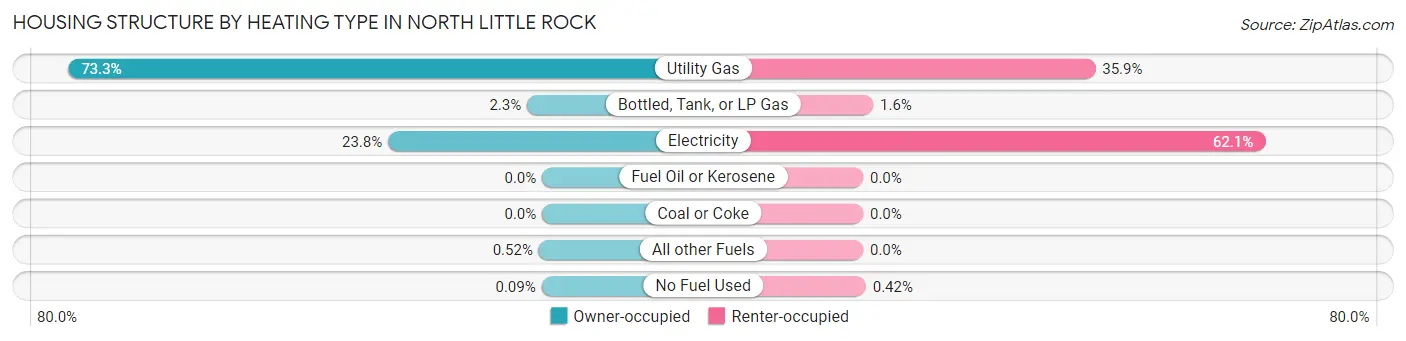
| Heating Type | Owner-occupied | Renter-occupied |
| Utility Gas | 10,155 (73.3%) | 5,479 (35.9%) |
| Bottled, Tank, or LP Gas | 323 (2.3%) | 236 (1.5%) |
| Electricity | 3,302 (23.8%) | 9,484 (62.1%) |
| Fuel Oil or Kerosene | 0 (0.0%) | 0 (0.0%) |
| Coal or Coke | 0 (0.0%) | 0 (0.0%) |
| All other Fuels | 72 (0.5%) | 0 (0.0%) |
| No Fuel Used | 12 (0.1%) | 64 (0.4%) |
| Total | 13,864 (100.0%) | 15,263 (100.0%) |
Household Vehicle Usage in North Little Rock
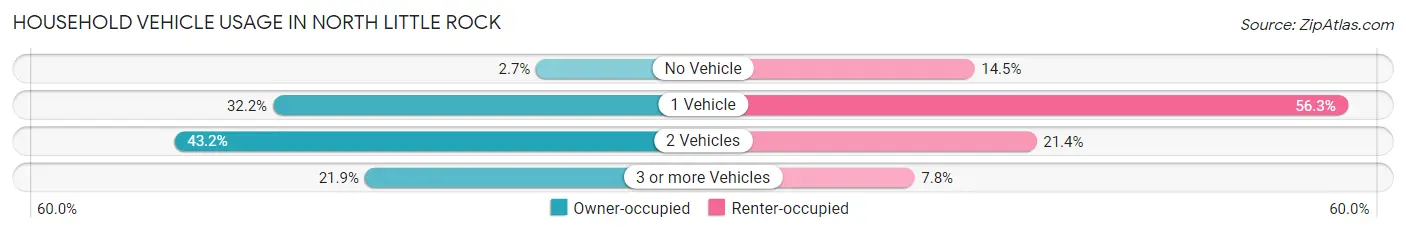
| Vehicles per Household | Owner-occupied | Renter-occupied |
| No Vehicle | 373 (2.7%) | 2,212 (14.5%) |
| 1 Vehicle | 4,461 (32.2%) | 8,592 (56.3%) |
| 2 Vehicles | 5,994 (43.2%) | 3,272 (21.4%) |
| 3 or more Vehicles | 3,036 (21.9%) | 1,187 (7.8%) |
| Total | 13,864 (100.0%) | 15,263 (100.0%) |
Real Estate & Mortgages in North Little Rock
Real Estate and Mortgage Overview in North Little Rock
| Characteristic | Without Mortgage | With Mortgage |
| Housing Units | 5,352 | 8,512 |
| Median Property Value | $169,800 | $163,900 |
| Median Household Income | $58,638 | $1,667 |
| Monthly Housing Costs | $441 | $80 |
| Real Estate Taxes | $1,447 | $478 |
Property Value by Mortgage Status in North Little Rock
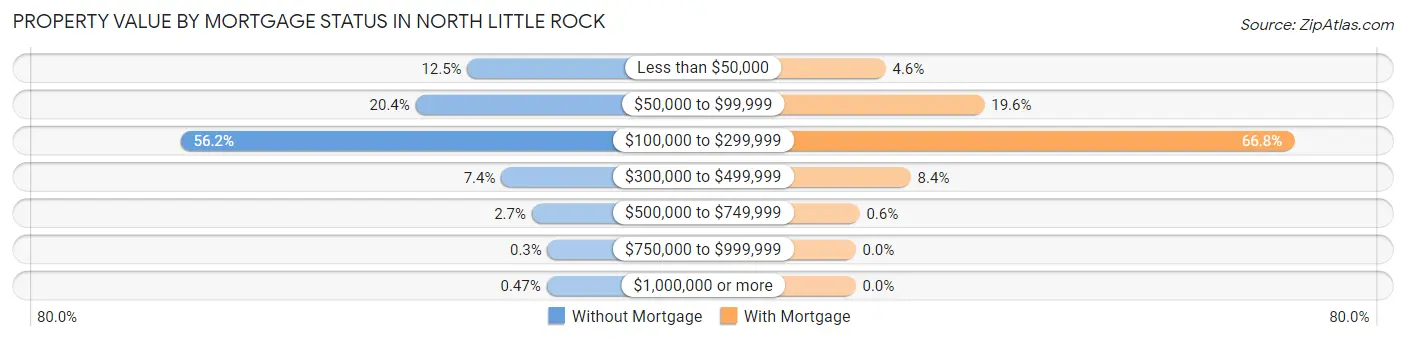
| Property Value | Without Mortgage | With Mortgage |
| Less than $50,000 | 670 (12.5%) | 389 (4.6%) |
| $50,000 to $99,999 | 1,093 (20.4%) | 1,670 (19.6%) |
| $100,000 to $299,999 | 3,009 (56.2%) | 5,687 (66.8%) |
| $300,000 to $499,999 | 394 (7.4%) | 715 (8.4%) |
| $500,000 to $749,999 | 145 (2.7%) | 51 (0.6%) |
| $750,000 to $999,999 | 16 (0.3%) | 0 (0.0%) |
| $1,000,000 or more | 25 (0.5%) | 0 (0.0%) |
| Total | 5,352 (100.0%) | 8,512 (100.0%) |
Household Income by Mortgage Status in North Little Rock
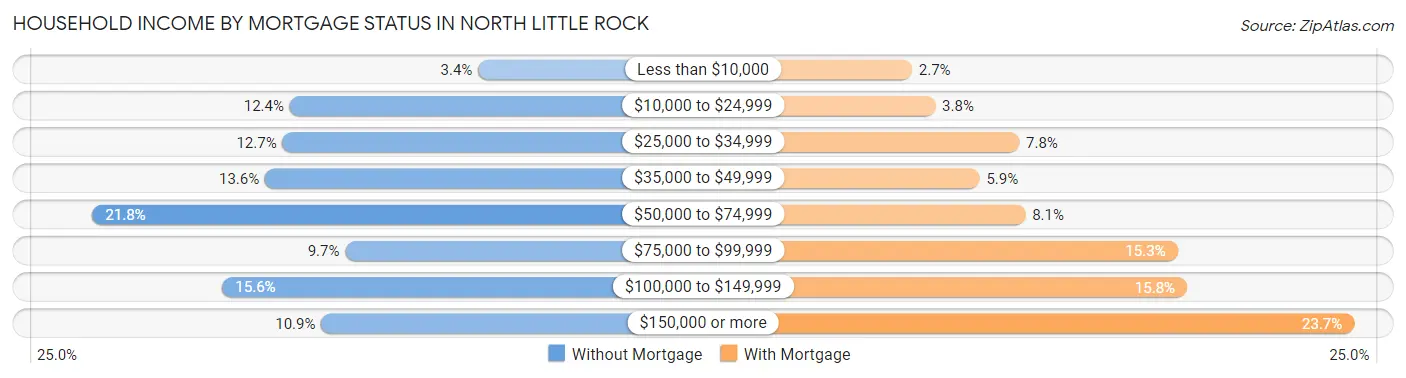
| Household Income | Without Mortgage | With Mortgage |
| Less than $10,000 | 182 (3.4%) | 228 (2.7%) |
| $10,000 to $24,999 | 662 (12.4%) | 323 (3.8%) |
| $25,000 to $34,999 | 681 (12.7%) | 663 (7.8%) |
| $35,000 to $49,999 | 725 (13.6%) | 502 (5.9%) |
| $50,000 to $74,999 | 1,165 (21.8%) | 688 (8.1%) |
| $75,000 to $99,999 | 521 (9.7%) | 1,305 (15.3%) |
| $100,000 to $149,999 | 834 (15.6%) | 1,343 (15.8%) |
| $150,000 or more | 582 (10.9%) | 2,021 (23.7%) |
| Total | 5,352 (100.0%) | 8,512 (100.0%) |
Property Value to Household Income Ratio in North Little Rock
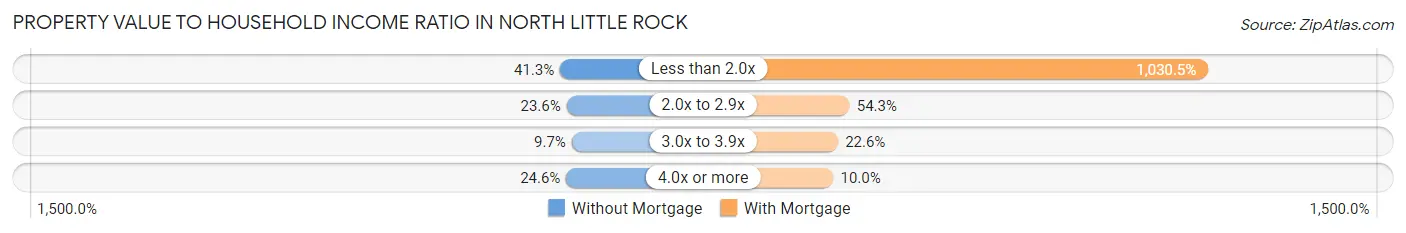
| Value-to-Income Ratio | Without Mortgage | With Mortgage |
| Less than 2.0x | 2,210 (41.3%) | 87,716 (1,030.5%) |
| 2.0x to 2.9x | 1,265 (23.6%) | 4,619 (54.3%) |
| 3.0x to 3.9x | 519 (9.7%) | 1,924 (22.6%) |
| 4.0x or more | 1,315 (24.6%) | 851 (10.0%) |
| Total | 5,352 (100.0%) | 8,512 (100.0%) |
Real Estate Taxes by Mortgage Status in North Little Rock
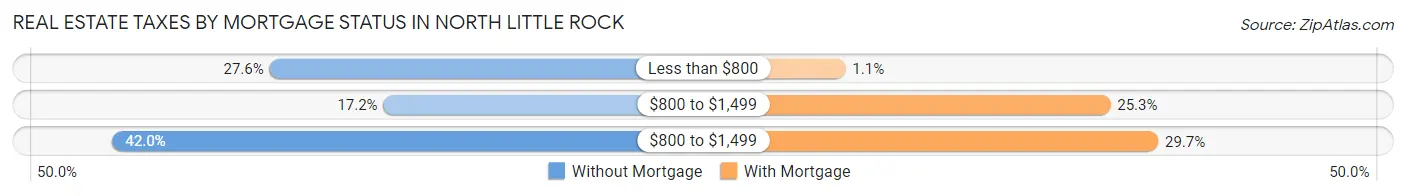
| Property Taxes | Without Mortgage | With Mortgage |
| Less than $800 | 1,479 (27.6%) | 96 (1.1%) |
| $800 to $1,499 | 922 (17.2%) | 2,155 (25.3%) |
| $800 to $1,499 | 2,247 (42.0%) | 2,526 (29.7%) |
| Total | 5,352 (100.0%) | 8,512 (100.0%) |
Health & Disability in North Little Rock
Health Insurance Coverage by Age in North Little Rock
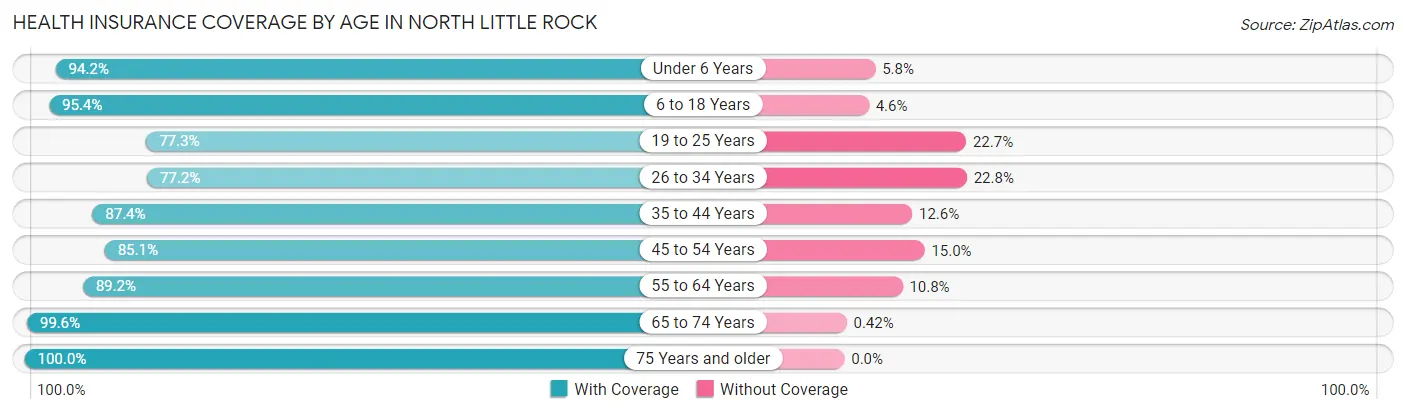
| Age Bracket | With Coverage | Without Coverage |
| Under 6 Years | 4,411 (94.2%) | 270 (5.8%) |
| 6 to 18 Years | 10,153 (95.4%) | 485 (4.6%) |
| 19 to 25 Years | 4,553 (77.3%) | 1,336 (22.7%) |
| 26 to 34 Years | 7,207 (77.2%) | 2,132 (22.8%) |
| 35 to 44 Years | 6,427 (87.4%) | 930 (12.6%) |
| 45 to 54 Years | 6,192 (85.1%) | 1,088 (14.9%) |
| 55 to 64 Years | 7,151 (89.2%) | 869 (10.8%) |
| 65 to 74 Years | 6,464 (99.6%) | 27 (0.4%) |
| 75 Years and older | 3,850 (100.0%) | 0 (0.0%) |
| Total | 56,408 (88.8%) | 7,137 (11.2%) |
Health Insurance Coverage by Citizenship Status in North Little Rock
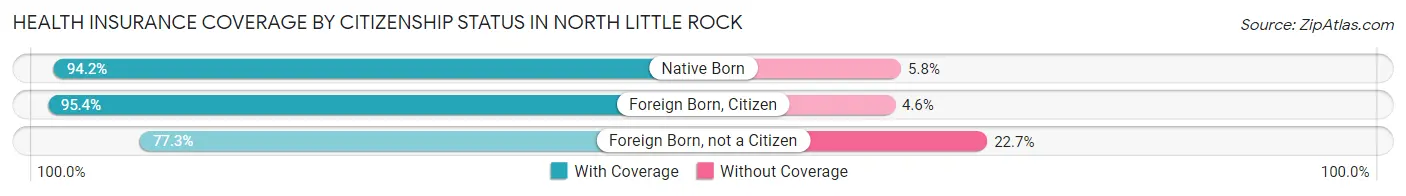
| Citizenship Status | With Coverage | Without Coverage |
| Native Born | 4,411 (94.2%) | 270 (5.8%) |
| Foreign Born, Citizen | 10,153 (95.4%) | 485 (4.6%) |
| Foreign Born, not a Citizen | 4,553 (77.3%) | 1,336 (22.7%) |
Health Insurance Coverage by Household Income in North Little Rock
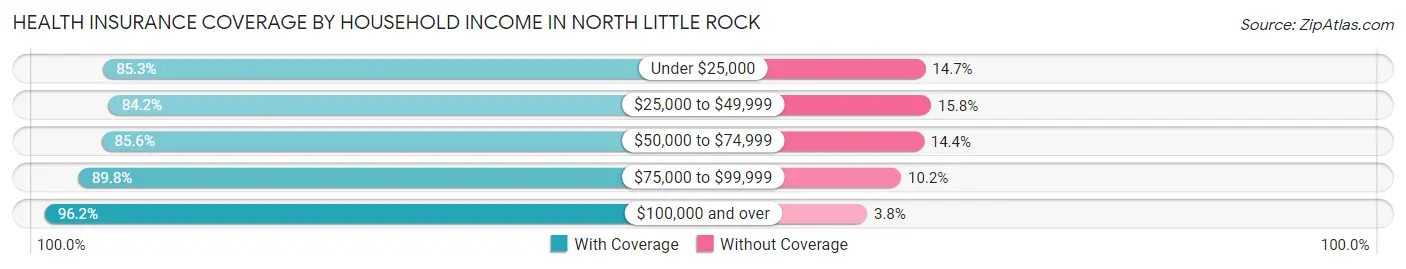
| Household Income | With Coverage | Without Coverage |
| Under $25,000 | 11,771 (85.3%) | 2,033 (14.7%) |
| $25,000 to $49,999 | 11,217 (84.2%) | 2,101 (15.8%) |
| $50,000 to $74,999 | 9,192 (85.6%) | 1,550 (14.4%) |
| $75,000 to $99,999 | 6,167 (89.8%) | 699 (10.2%) |
| $100,000 and over | 17,868 (96.2%) | 704 (3.8%) |
Public vs Private Health Insurance Coverage by Age in North Little Rock
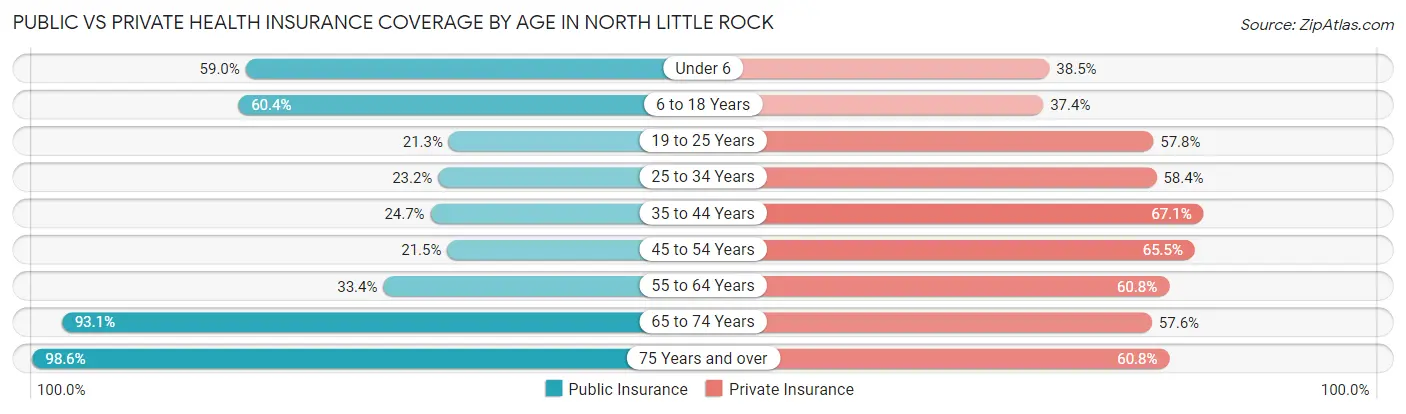
| Age Bracket | Public Insurance | Private Insurance |
| Under 6 | 2,761 (59.0%) | 1,804 (38.5%) |
| 6 to 18 Years | 6,420 (60.4%) | 3,978 (37.4%) |
| 19 to 25 Years | 1,252 (21.3%) | 3,405 (57.8%) |
| 25 to 34 Years | 2,169 (23.2%) | 5,454 (58.4%) |
| 35 to 44 Years | 1,815 (24.7%) | 4,939 (67.1%) |
| 45 to 54 Years | 1,568 (21.5%) | 4,770 (65.5%) |
| 55 to 64 Years | 2,680 (33.4%) | 4,872 (60.8%) |
| 65 to 74 Years | 6,043 (93.1%) | 3,736 (57.6%) |
| 75 Years and over | 3,794 (98.6%) | 2,340 (60.8%) |
| Total | 28,502 (44.9%) | 35,298 (55.5%) |
Disability Status by Sex by Age in North Little Rock
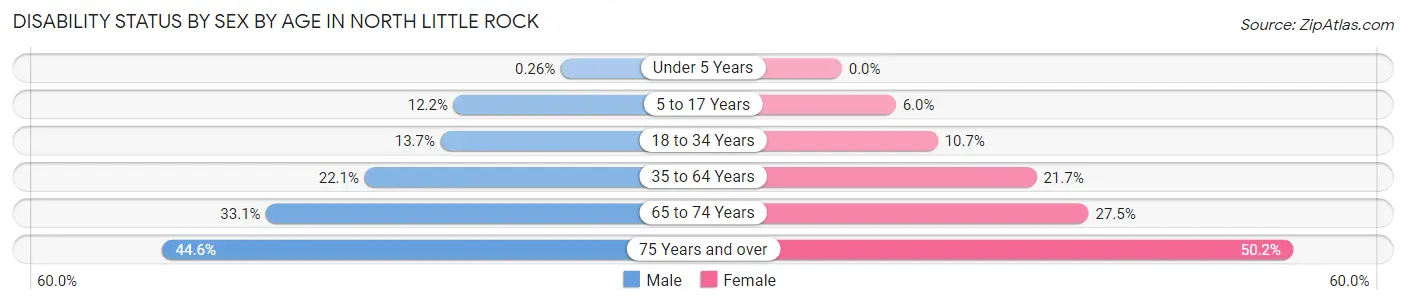
| Age Bracket | Male | Female |
| Under 5 Years | 6 (0.3%) | 0 (0.0%) |
| 5 to 17 Years | 672 (12.2%) | 293 (6.0%) |
| 18 to 34 Years | 984 (13.7%) | 936 (10.7%) |
| 35 to 64 Years | 2,302 (22.1%) | 2,654 (21.7%) |
| 65 to 74 Years | 978 (33.1%) | 971 (27.5%) |
| 75 Years and over | 755 (44.6%) | 1,084 (50.2%) |
Disability Class by Sex by Age in North Little Rock
Disability Class: Hearing Difficulty
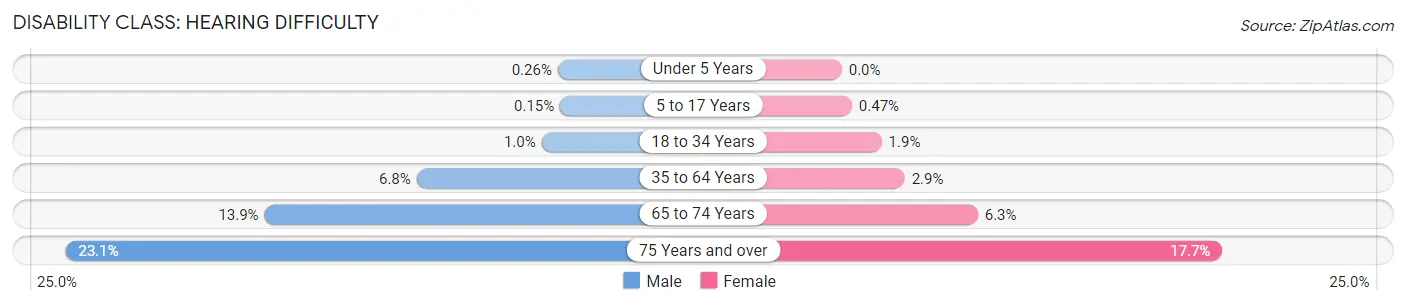
| Age Bracket | Male | Female |
| Under 5 Years | 6 (0.3%) | 0 (0.0%) |
| 5 to 17 Years | 8 (0.2%) | 23 (0.5%) |
| 18 to 34 Years | 73 (1.0%) | 162 (1.8%) |
| 35 to 64 Years | 709 (6.8%) | 357 (2.9%) |
| 65 to 74 Years | 410 (13.9%) | 223 (6.3%) |
| 75 Years and over | 391 (23.1%) | 381 (17.7%) |
Disability Class: Vision Difficulty
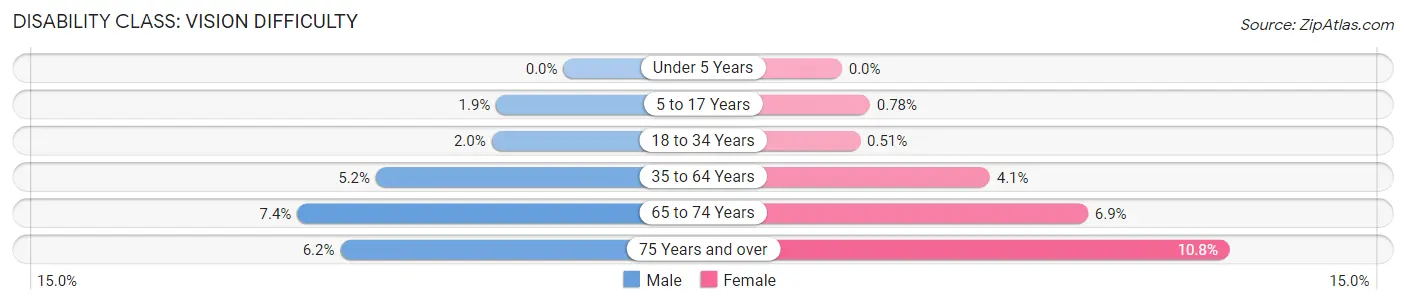
| Age Bracket | Male | Female |
| Under 5 Years | 0 (0.0%) | 0 (0.0%) |
| 5 to 17 Years | 103 (1.9%) | 38 (0.8%) |
| 18 to 34 Years | 144 (2.0%) | 45 (0.5%) |
| 35 to 64 Years | 544 (5.2%) | 505 (4.1%) |
| 65 to 74 Years | 219 (7.4%) | 242 (6.9%) |
| 75 Years and over | 105 (6.2%) | 233 (10.8%) |
Disability Class: Cognitive Difficulty
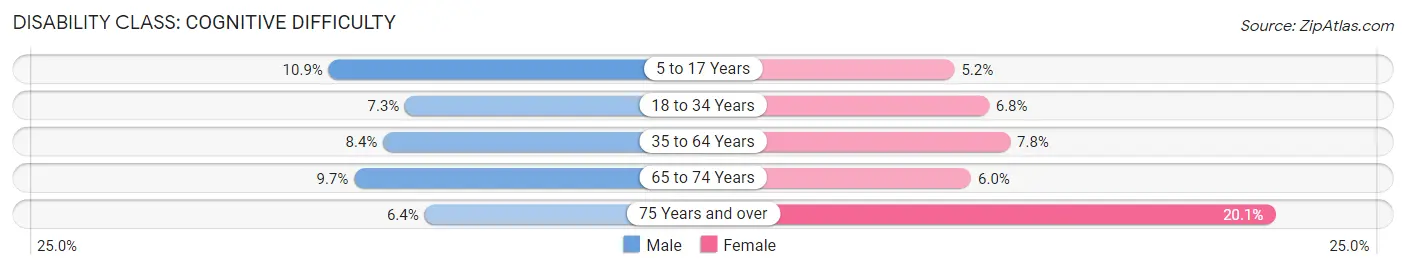
| Age Bracket | Male | Female |
| 5 to 17 Years | 600 (10.9%) | 255 (5.2%) |
| 18 to 34 Years | 529 (7.3%) | 597 (6.8%) |
| 35 to 64 Years | 871 (8.4%) | 956 (7.8%) |
| 65 to 74 Years | 287 (9.7%) | 212 (6.0%) |
| 75 Years and over | 109 (6.4%) | 434 (20.1%) |
Disability Class: Ambulatory Difficulty
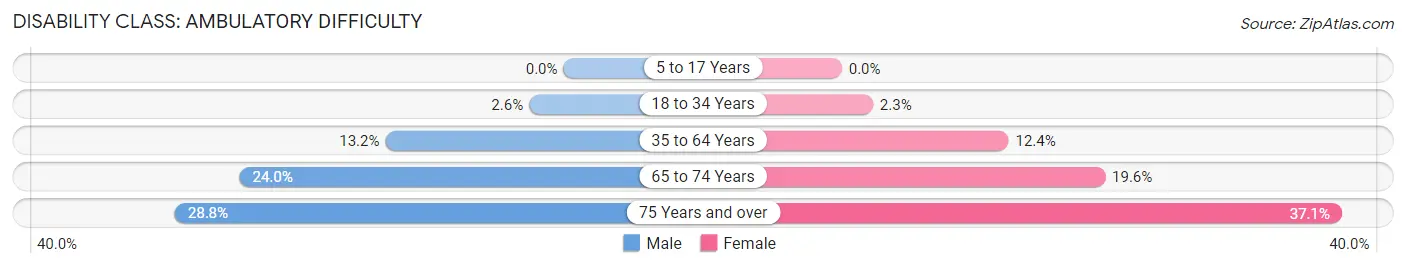
| Age Bracket | Male | Female |
| 5 to 17 Years | 0 (0.0%) | 0 (0.0%) |
| 18 to 34 Years | 184 (2.5%) | 202 (2.3%) |
| 35 to 64 Years | 1,377 (13.2%) | 1,516 (12.4%) |
| 65 to 74 Years | 711 (24.0%) | 691 (19.6%) |
| 75 Years and over | 488 (28.8%) | 801 (37.1%) |
Disability Class: Self-Care Difficulty
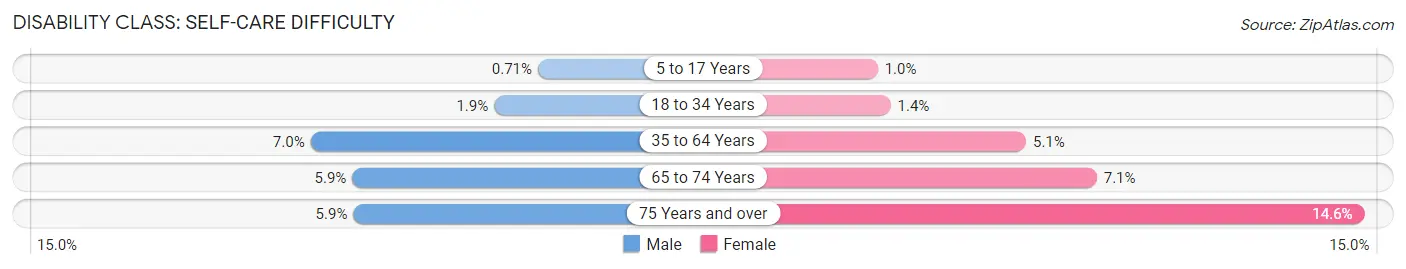
| Age Bracket | Male | Female |
| 5 to 17 Years | 39 (0.7%) | 49 (1.0%) |
| 18 to 34 Years | 139 (1.9%) | 119 (1.4%) |
| 35 to 64 Years | 733 (7.0%) | 628 (5.1%) |
| 65 to 74 Years | 174 (5.9%) | 251 (7.1%) |
| 75 Years and over | 99 (5.9%) | 314 (14.5%) |
Technology Access in North Little Rock
Computing Device Access in North Little Rock
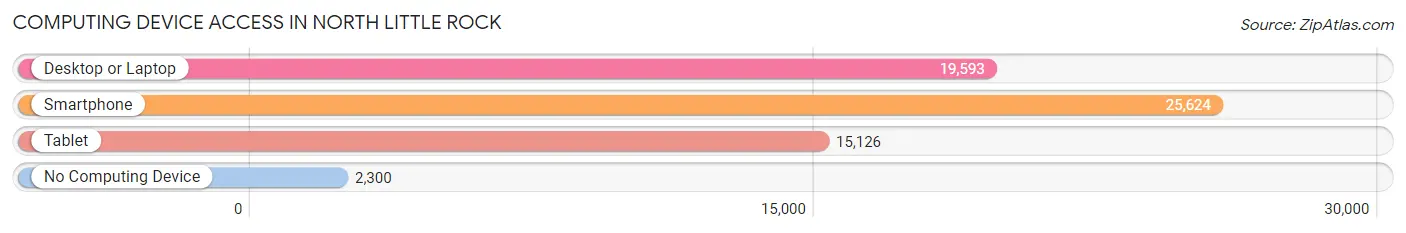
| Device Type | # Households | % Households |
| Desktop or Laptop | 19,593 | 67.3% |
| Smartphone | 25,624 | 88.0% |
| Tablet | 15,126 | 51.9% |
| No Computing Device | 2,300 | 7.9% |
| Total | 29,127 | 100.0% |
Internet Access in North Little Rock
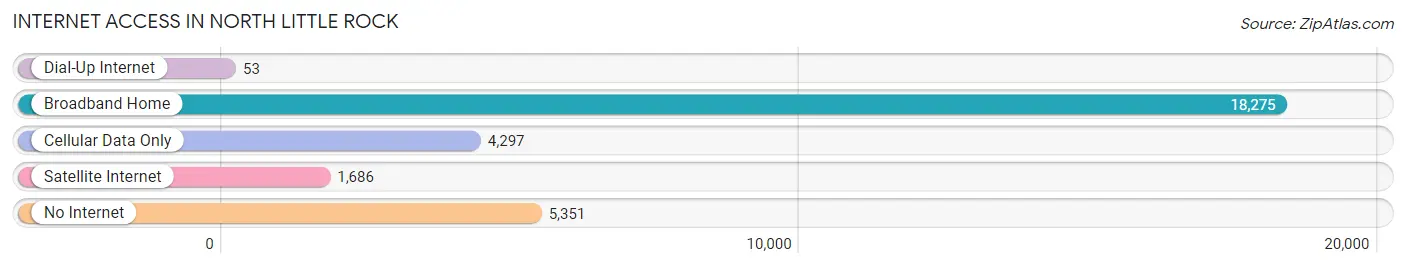
| Internet Type | # Households | % Households |
| Dial-Up Internet | 53 | 0.2% |
| Broadband Home | 18,275 | 62.7% |
| Cellular Data Only | 4,297 | 14.7% |
| Satellite Internet | 1,686 | 5.8% |
| No Internet | 5,351 | 18.4% |
| Total | 29,127 | 100.0% |
North Little Rock Summary
Little Rock, Arkansas is the capital and most populous city of the state of Arkansas. It is located in the central part of the state, on the Arkansas River, and is the county seat of Pulaski County. Little Rock is the cultural, economic, and governmental center of the state, and is home to a population of approximately 197,000 people.
History
Little Rock was first settled in 1812 by a group of French-Canadian fur traders. The city was named after a small rock formation on the south bank of the Arkansas River, which was used as a landmark by the traders. The city was incorporated in 1831, and was chosen as the state capital in 1836.
Little Rock was the site of several important events during the Civil War. In 1861, the city was the site of the Battle of Little Rock, in which Confederate forces defeated Union forces. In 1863, the city was occupied by Union forces, and in 1864, the Union army established a military post in the city.
In the late 19th century, Little Rock became an important center for the cotton industry, and the city's population grew rapidly. In the early 20th century, the city was the site of several important civil rights events, including the desegregation of Little Rock Central High School in 1957.
Geography
Little Rock is located in the central part of the state, on the Arkansas River. The city is situated in the foothills of the Ouachita Mountains, and is surrounded by several lakes and reservoirs. The city has a total area of 116.8 square miles, of which 115.2 square miles is land and 1.6 square miles is water.
Little Rock has a humid subtropical climate, with hot, humid summers and mild winters. The average annual temperature is 63.2°F, and the average annual precipitation is 48.3 inches.
Economy
Little Rock's economy is largely based on government, healthcare, and finance. The city is home to several major corporations, including Dillard's, Windstream Communications, and Acxiom. The city is also home to the University of Arkansas at Little Rock, which is the state's second-largest university.
Little Rock is also a major tourist destination, with attractions such as the Arkansas State Capitol, the William J. Clinton Presidential Library, and the Little Rock Zoo. The city is also home to several museums, including the Arkansas Arts Center and the Old State House Museum.
Demographics
As of the 2010 census, Little Rock had a population of 193,524 people. The racial makeup of the city was 57.2% White, 35.2% African American, 2.2% Asian, 0.7% Native American, 0.1% Pacific Islander, and 4.6% from other races. The median household income was $41,945, and the median family income was $50,935.
Little Rock is home to a diverse population, with a variety of religious and ethnic backgrounds. The city is home to a large Jewish community, as well as a large Muslim community. The city also has a large Hispanic population, with a majority of the population being of Mexican descent.
Common Questions
What is Per Capita Income in North Little Rock?
Per Capita income in North Little Rock is $31,941.
What is the Median Family Income in North Little Rock?
Median Family Income in North Little Rock is $63,522.
What is the Median Household income in North Little Rock?
Median Household Income in North Little Rock is $49,166.
What is Income or Wage Gap in North Little Rock?
Income or Wage Gap in North Little Rock is 21.0%.
Women in North Little Rock earn 79.0 cents for every dollar earned by a man.
What is Family Income Deficit in North Little Rock?
Family Income Deficit in North Little Rock is $11,366.
Families that are below poverty line in North Little Rock earn $11,366 less on average than the poverty threshold level.
What is Inequality or Gini Index in North Little Rock?
Inequality or Gini Index in North Little Rock is 0.48.
What is the Total Population of North Little Rock?
Total Population of North Little Rock is 64,454.
What is the Total Male Population of North Little Rock?
Total Male Population of North Little Rock is 30,734.
What is the Total Female Population of North Little Rock?
Total Female Population of North Little Rock is 33,720.
What is the Ratio of Males per 100 Females in North Little Rock?
There are 91.14 Males per 100 Females in North Little Rock.
What is the Ratio of Females per 100 Males in North Little Rock?
There are 109.72 Females per 100 Males in North Little Rock.
What is the Median Population Age in North Little Rock?
Median Population Age in North Little Rock is 36.7 Years.
What is the Average Family Size in North Little Rock
Average Family Size in North Little Rock is 3.0 People.
What is the Average Household Size in North Little Rock
Average Household Size in North Little Rock is 2.2 People.
How Large is the Labor Force in North Little Rock?
There are 33,208 People in the Labor Forcein in North Little Rock.
What is the Percentage of People in the Labor Force in North Little Rock?
65.0% of People are in the Labor Force in North Little Rock.
What is the Unemployment Rate in North Little Rock?
Unemployment Rate in North Little Rock is 6.6%.