Columbia, SC Map & Demographics
Columbia Map
Columbia Overview
$36,422
PER CAPITA INCOME
$78,454
AVG FAMILY INCOME
$54,095
AVG HOUSEHOLD INCOME
11.1%
WAGE / INCOME GAP [ % ]
88.9¢/ $1
WAGE / INCOME GAP [ $ ]
$12,922
FAMILY INCOME DEFICIT
0.56
INEQUALITY / GINI INDEX
136,754
TOTAL POPULATION
68,093
MALE POPULATION
68,661
FEMALE POPULATION
99.17
MALES / 100 FEMALES
100.83
FEMALES / 100 MALES
28.3
MEDIAN AGE
3.0
AVG FAMILY SIZE
2.2
AVG HOUSEHOLD SIZE
75,668
LABOR FORCE [ PEOPLE ]
65.0%
PERCENT IN LABOR FORCE
7.9%
UNEMPLOYMENT RATE
Columbia Zip Codes
Columbia Area Codes
Income in Columbia
Income Overview in Columbia
Per Capita Income in Columbia is $36,422, while median incomes of families and households are $78,454 and $54,095 respectively.
| Characteristic | Number | Measure |
| Per Capita Income | 136,754 | $36,422 |
| Median Family Income | 24,046 | $78,454 |
| Mean Family Income | 24,046 | $123,790 |
| Median Household Income | 50,223 | $54,095 |
| Mean Household Income | 50,223 | $88,116 |
| Income Deficit | 24,046 | $12,922 |
| Wage / Income Gap (%) | 136,754 | 11.09% |
| Wage / Income Gap ($) | 136,754 | 88.91¢ per $1 |
| Gini / Inequality Index | 136,754 | 0.56 |
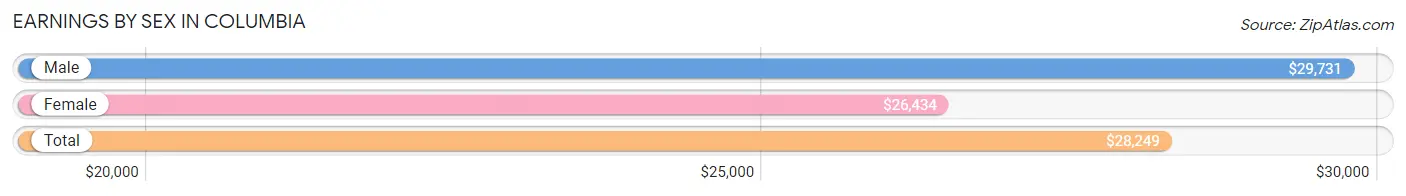
Earnings by Sex in Columbia
Average Earnings in Columbia are $28,249, $29,731 for men and $26,434 for women, a difference of 11.1%.
| Sex | Number | Average Earnings |
| Male | 41,792 (50.8%) | $29,731 |
| Female | 40,485 (49.2%) | $26,434 |
| Total | 82,277 (100.0%) | $28,249 |
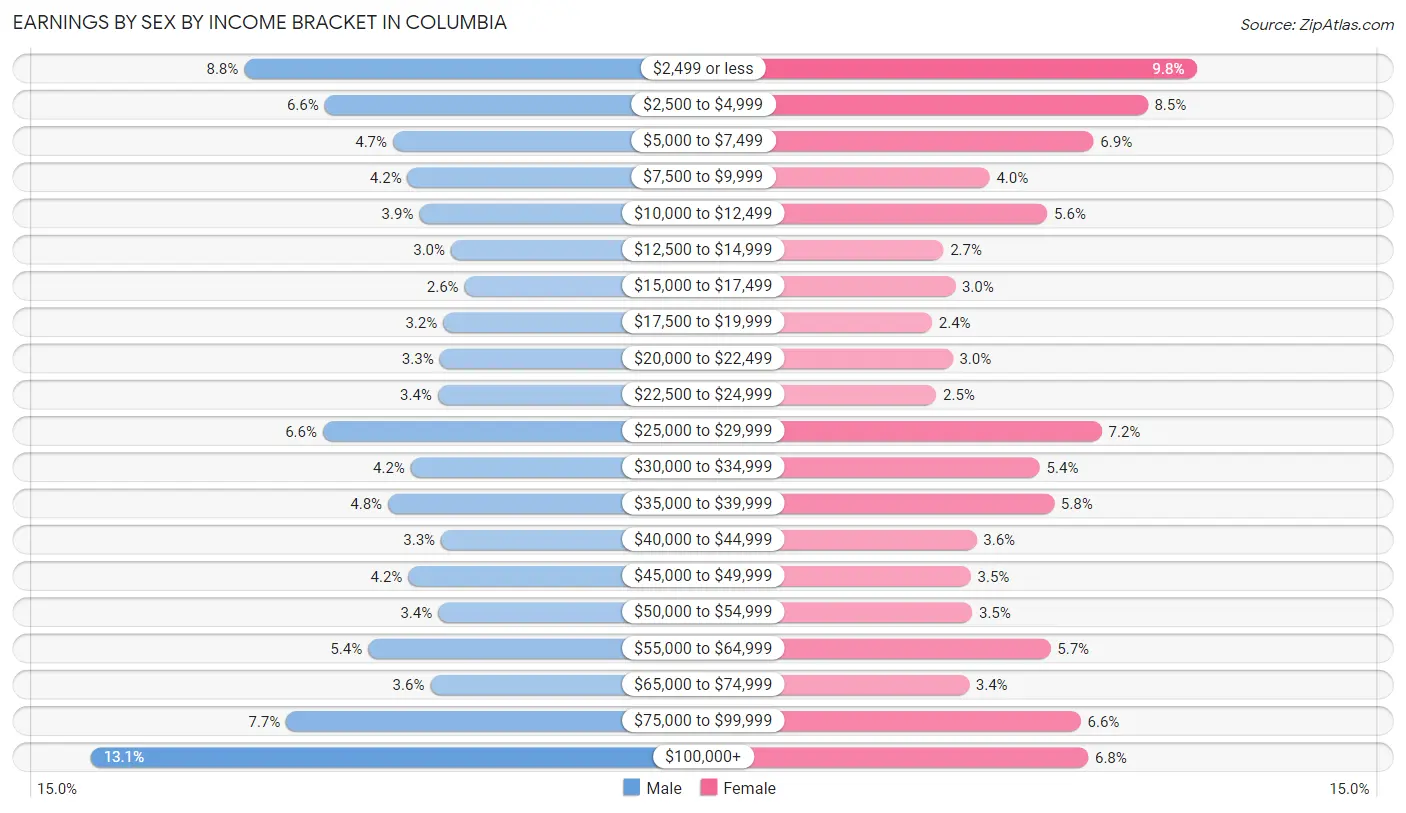
Earnings by Sex by Income Bracket in Columbia
The most common earnings brackets in Columbia are $100,000+ for men (5,490 | 13.1%) and $2,499 or less for women (3,977 | 9.8%).
| Income | Male | Female |
| $2,499 or less | 3,691 (8.8%) | 3,977 (9.8%) |
| $2,500 to $4,999 | 2,746 (6.6%) | 3,420 (8.5%) |
| $5,000 to $7,499 | 1,943 (4.6%) | 2,806 (6.9%) |
| $7,500 to $9,999 | 1,772 (4.2%) | 1,625 (4.0%) |
| $10,000 to $12,499 | 1,632 (3.9%) | 2,281 (5.6%) |
| $12,500 to $14,999 | 1,261 (3.0%) | 1,097 (2.7%) |
| $15,000 to $17,499 | 1,103 (2.6%) | 1,229 (3.0%) |
| $17,500 to $19,999 | 1,353 (3.2%) | 968 (2.4%) |
| $20,000 to $22,499 | 1,395 (3.3%) | 1,204 (3.0%) |
| $22,500 to $24,999 | 1,416 (3.4%) | 1,017 (2.5%) |
| $25,000 to $29,999 | 2,766 (6.6%) | 2,897 (7.2%) |
| $30,000 to $34,999 | 1,733 (4.2%) | 2,194 (5.4%) |
| $35,000 to $39,999 | 2,002 (4.8%) | 2,356 (5.8%) |
| $40,000 to $44,999 | 1,379 (3.3%) | 1,472 (3.6%) |
| $45,000 to $49,999 | 1,762 (4.2%) | 1,407 (3.5%) |
| $50,000 to $54,999 | 1,411 (3.4%) | 1,427 (3.5%) |
| $55,000 to $64,999 | 2,237 (5.3%) | 2,316 (5.7%) |
| $65,000 to $74,999 | 1,503 (3.6%) | 1,389 (3.4%) |
| $75,000 to $99,999 | 3,197 (7.6%) | 2,658 (6.6%) |
| $100,000+ | 5,490 (13.1%) | 2,745 (6.8%) |
| Total | 41,792 (100.0%) | 40,485 (100.0%) |
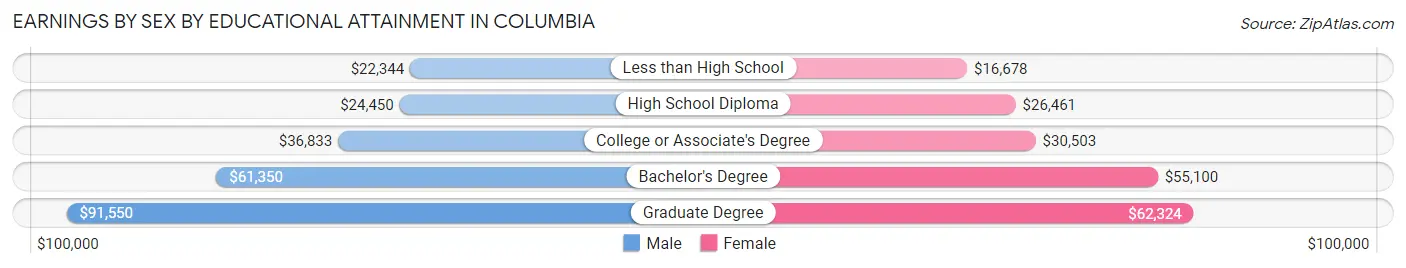
Earnings by Sex by Educational Attainment in Columbia
Average earnings in Columbia are $47,990 for men and $40,314 for women, a difference of 16.0%. Men with an educational attainment of graduate degree enjoy the highest average annual earnings of $91,550, while those with less than high school education earn the least with $22,344. Women with an educational attainment of graduate degree earn the most with the average annual earnings of $62,324, while those with less than high school education have the smallest earnings of $16,678.
| Educational Attainment | Male Income | Female Income |
| Less than High School | $22,344 | $16,678 |
| High School Diploma | $24,450 | $26,461 |
| College or Associate's Degree | $36,833 | $30,503 |
| Bachelor's Degree | $61,350 | $55,100 |
| Graduate Degree | $91,550 | $62,324 |
| Total | $47,990 | $40,314 |
Family Income in Columbia
Family Income Brackets in Columbia
According to the Columbia family income data, there are 3,823 families falling into the $200,000+ income range, which is the most common income bracket and makes up 15.9% of all families. Conversely, the $10,000 to $14,999 income bracket is the least frequent group with only 745 families (3.1%) belonging to this category.
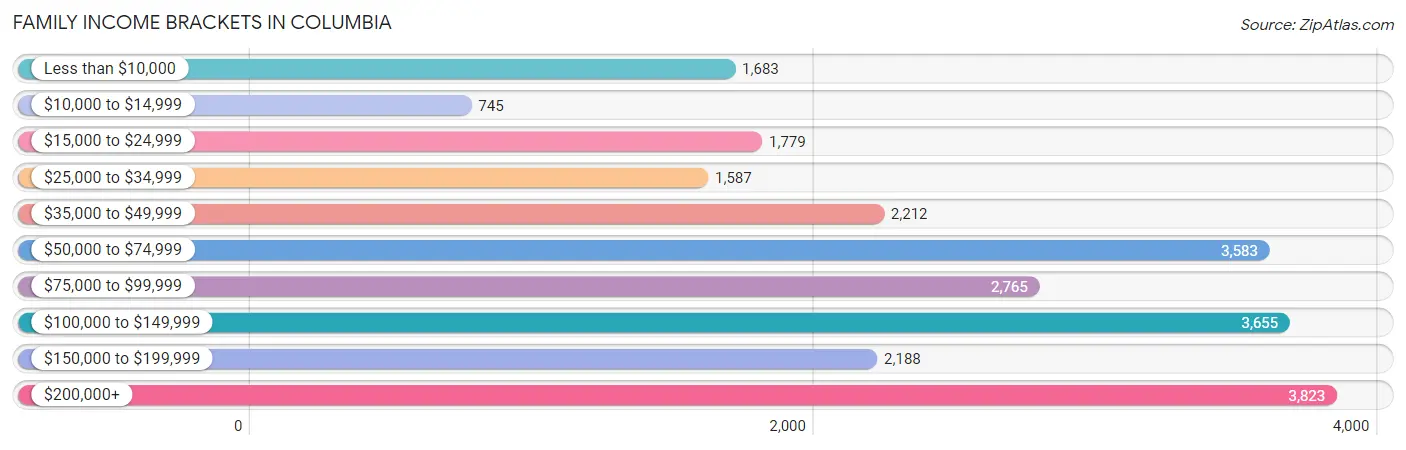
| Income Bracket | # Families | % Families |
| Less than $10,000 | 1,683 | 7.0% |
| $10,000 to $14,999 | 745 | 3.1% |
| $15,000 to $24,999 | 1,779 | 7.4% |
| $25,000 to $34,999 | 1,587 | 6.6% |
| $35,000 to $49,999 | 2,212 | 9.2% |
| $50,000 to $74,999 | 3,583 | 14.9% |
| $75,000 to $99,999 | 2,765 | 11.5% |
| $100,000 to $149,999 | 3,655 | 15.2% |
| $150,000 to $199,999 | 2,188 | 9.1% |
| $200,000+ | 3,823 | 15.9% |
Family Income by Famaliy Size in Columbia
6-person families (698 | 2.9%) account for the highest median family income in Columbia with $103,311 per family, while 2-person families (12,170 | 50.6%) have the highest median income of $39,704 per family member.
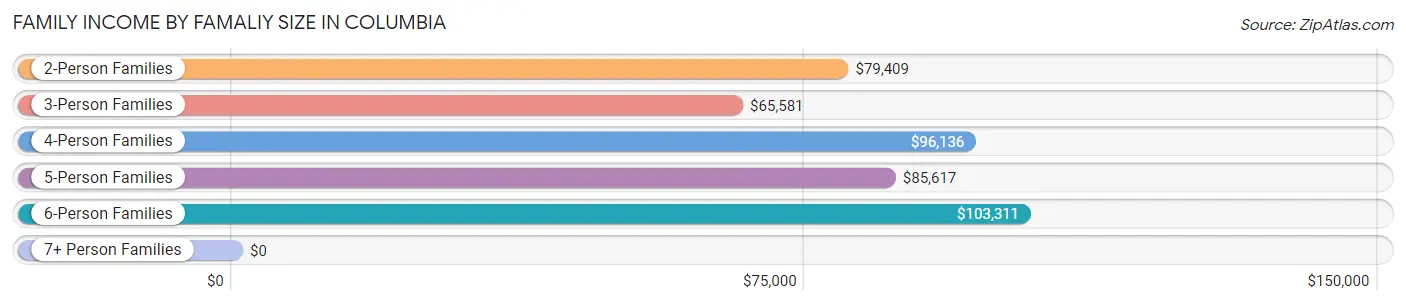
| Income Bracket | # Families | Median Income |
| 2-Person Families | 12,170 (50.6%) | $79,409 |
| 3-Person Families | 5,349 (22.2%) | $65,581 |
| 4-Person Families | 3,894 (16.2%) | $96,136 |
| 5-Person Families | 1,776 (7.4%) | $85,617 |
| 6-Person Families | 698 (2.9%) | $103,311 |
| 7+ Person Families | 159 (0.7%) | $0 |
| Total | 24,046 (100.0%) | $78,454 |
Family Income by Number of Earners in Columbia
The median family income in Columbia is $78,454, with families comprising 3+ earners (1,412) having the highest median family income of $140,272, while families with no earners (3,248) have the lowest median family income of $37,841, accounting for 5.9% and 13.5% of families, respectively.
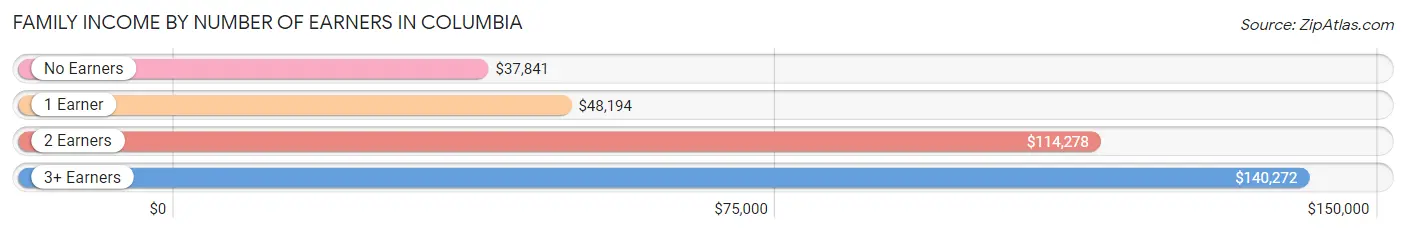
| Number of Earners | # Families | Median Income |
| No Earners | 3,248 (13.5%) | $37,841 |
| 1 Earner | 8,913 (37.1%) | $48,194 |
| 2 Earners | 10,473 (43.5%) | $114,278 |
| 3+ Earners | 1,412 (5.9%) | $140,272 |
| Total | 24,046 (100.0%) | $78,454 |
Household Income in Columbia
Household Income Brackets in Columbia
With 8,638 households falling in the category, the $50,000 to $74,999 income range is the most frequent in Columbia, accounting for 17.2% of all households. In contrast, only 2,812 households (5.6%) fall into the $10,000 to $14,999 income bracket, making it the least populous group.
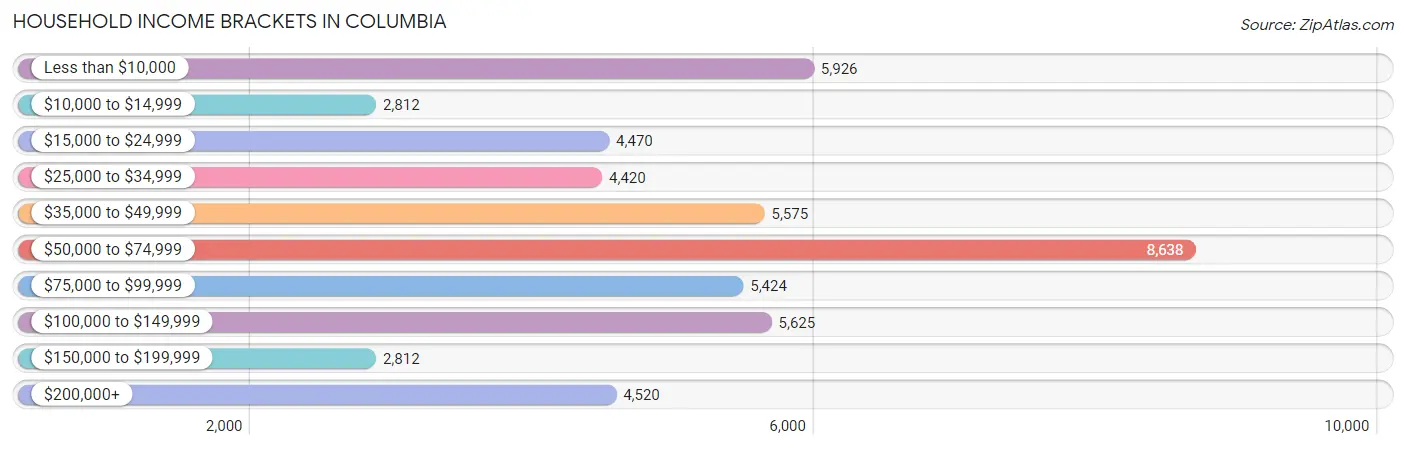
| Income Bracket | # Households | % Households |
| Less than $10,000 | 5,926 | 11.8% |
| $10,000 to $14,999 | 2,812 | 5.6% |
| $15,000 to $24,999 | 4,470 | 8.9% |
| $25,000 to $34,999 | 4,420 | 8.8% |
| $35,000 to $49,999 | 5,575 | 11.1% |
| $50,000 to $74,999 | 8,638 | 17.2% |
| $75,000 to $99,999 | 5,424 | 10.8% |
| $100,000 to $149,999 | 5,625 | 11.2% |
| $150,000 to $199,999 | 2,812 | 5.6% |
| $200,000+ | 4,520 | 9.0% |
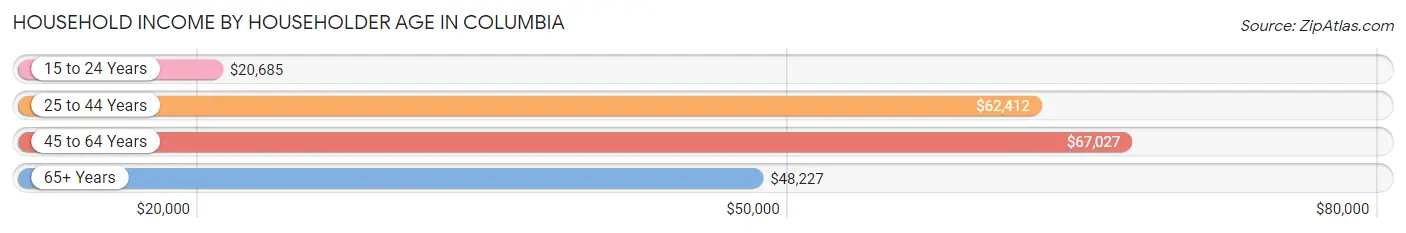
Household Income by Householder Age in Columbia
The median household income in Columbia is $54,095, with the highest median household income of $67,027 found in the 45 to 64 years age bracket for the primary householder. A total of 14,204 households (28.3%) fall into this category. Meanwhile, the 15 to 24 years age bracket for the primary householder has the lowest median household income of $20,685, with 6,698 households (13.3%) in this group.
| Income Bracket | # Households | Median Income |
| 15 to 24 Years | 6,698 (13.3%) | $20,685 |
| 25 to 44 Years | 19,360 (38.6%) | $62,412 |
| 45 to 64 Years | 14,204 (28.3%) | $67,027 |
| 65+ Years | 9,961 (19.8%) | $48,227 |
| Total | 50,223 (100.0%) | $54,095 |
Poverty in Columbia
Income Below Poverty by Sex and Age in Columbia
With 23.5% poverty level for males and 24.9% for females among the residents of Columbia, 18 to 24 year old males and 18 to 24 year old females are the most vulnerable to poverty, with 4,027 males (48.3%) and 5,099 females (55.5%) in their respective age groups living below the poverty level.
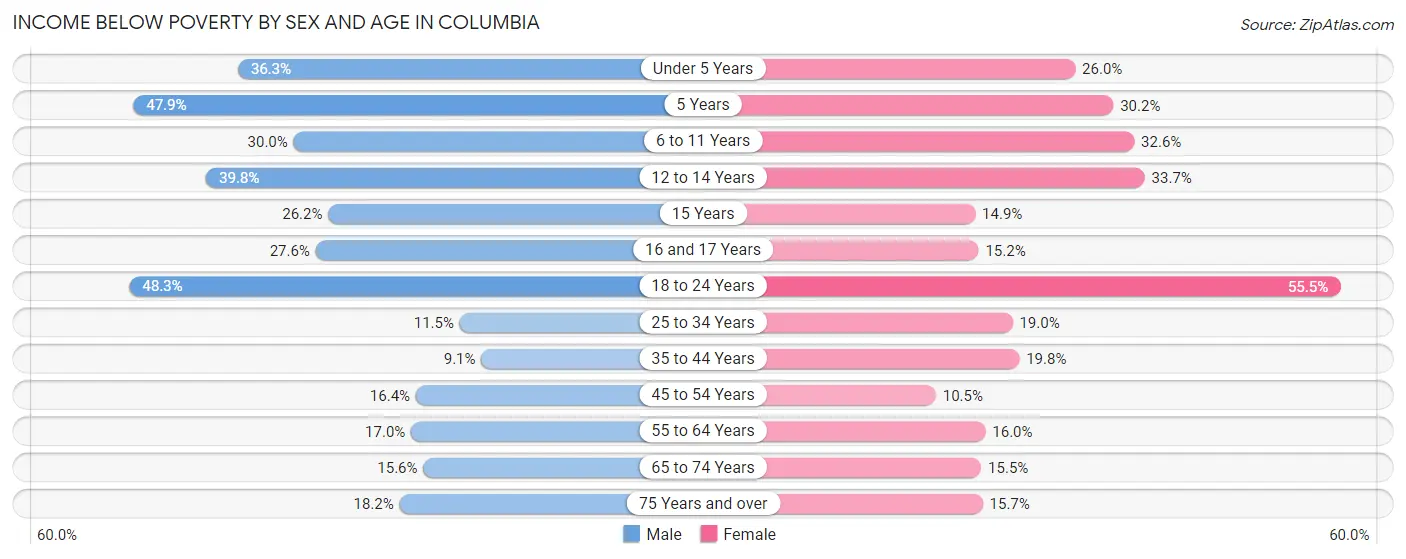
| Age Bracket | Male | Female |
| Under 5 Years | 1,374 (36.2%) | 889 (26.0%) |
| 5 Years | 341 (47.9%) | 185 (30.2%) |
| 6 to 11 Years | 981 (30.0%) | 1,193 (32.6%) |
| 12 to 14 Years | 611 (39.8%) | 566 (33.7%) |
| 15 Years | 128 (26.2%) | 106 (14.8%) |
| 16 and 17 Years | 396 (27.6%) | 167 (15.2%) |
| 18 to 24 Years | 4,027 (48.3%) | 5,099 (55.5%) |
| 25 to 34 Years | 1,190 (11.5%) | 2,047 (19.0%) |
| 35 to 44 Years | 522 (9.1%) | 1,317 (19.8%) |
| 45 to 54 Years | 1,030 (16.4%) | 646 (10.5%) |
| 55 to 64 Years | 850 (17.0%) | 941 (16.0%) |
| 65 to 74 Years | 647 (15.6%) | 689 (15.5%) |
| 75 Years and over | 341 (18.2%) | 523 (15.7%) |
| Total | 12,438 (23.5%) | 14,368 (24.9%) |
Income Above Poverty by Sex and Age in Columbia
According to the poverty statistics in Columbia, males aged 35 to 44 years and females aged 45 to 54 years are the age groups that are most secure financially, with 90.9% of males and 89.5% of females in these age groups living above the poverty line.
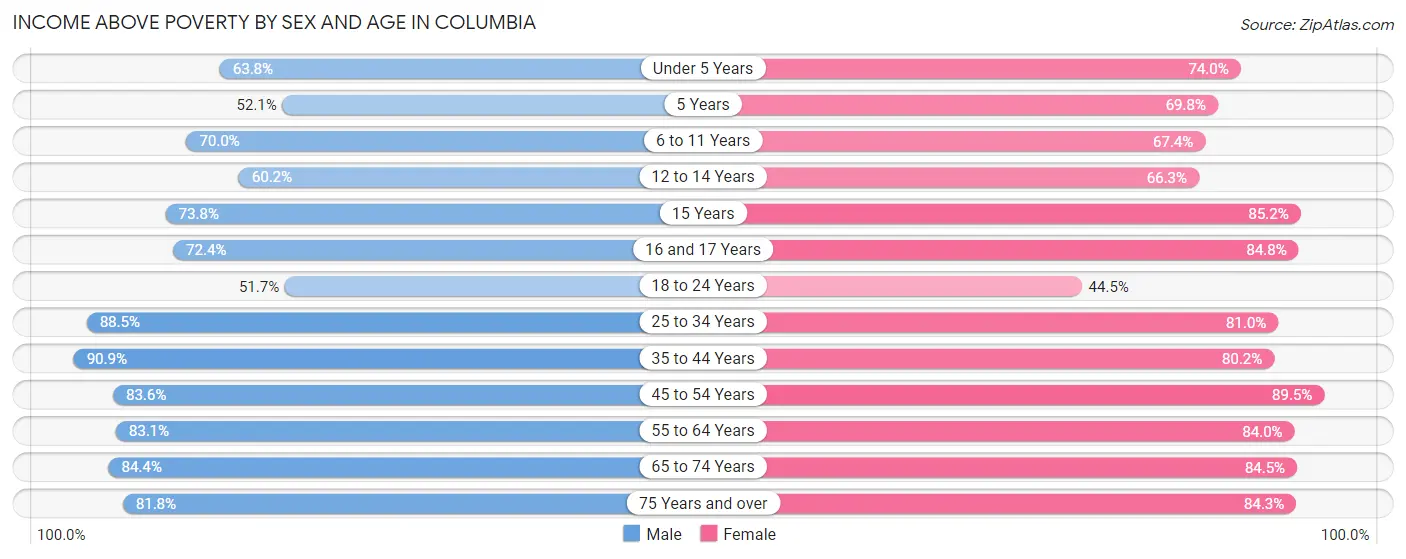
| Age Bracket | Male | Female |
| Under 5 Years | 2,416 (63.7%) | 2,531 (74.0%) |
| 5 Years | 371 (52.1%) | 427 (69.8%) |
| 6 to 11 Years | 2,285 (70.0%) | 2,471 (67.4%) |
| 12 to 14 Years | 925 (60.2%) | 1,112 (66.3%) |
| 15 Years | 361 (73.8%) | 608 (85.2%) |
| 16 and 17 Years | 1,040 (72.4%) | 930 (84.8%) |
| 18 to 24 Years | 4,306 (51.7%) | 4,091 (44.5%) |
| 25 to 34 Years | 9,130 (88.5%) | 8,719 (81.0%) |
| 35 to 44 Years | 5,198 (90.9%) | 5,349 (80.2%) |
| 45 to 54 Years | 5,242 (83.6%) | 5,524 (89.5%) |
| 55 to 64 Years | 4,164 (83.1%) | 4,944 (84.0%) |
| 65 to 74 Years | 3,503 (84.4%) | 3,750 (84.5%) |
| 75 Years and over | 1,529 (81.8%) | 2,813 (84.3%) |
| Total | 40,470 (76.5%) | 43,269 (75.1%) |
Income Below Poverty Among Married-Couple Families in Columbia
The poverty statistics for married-couple families in Columbia show that 3.5% or 531 of the total 15,062 families live below the poverty line. Families with 3 or 4 children have the highest poverty rate of 5.8%, comprising of 87 families. On the other hand, families with no children have the lowest poverty rate of 2.8%, which includes 253 families.
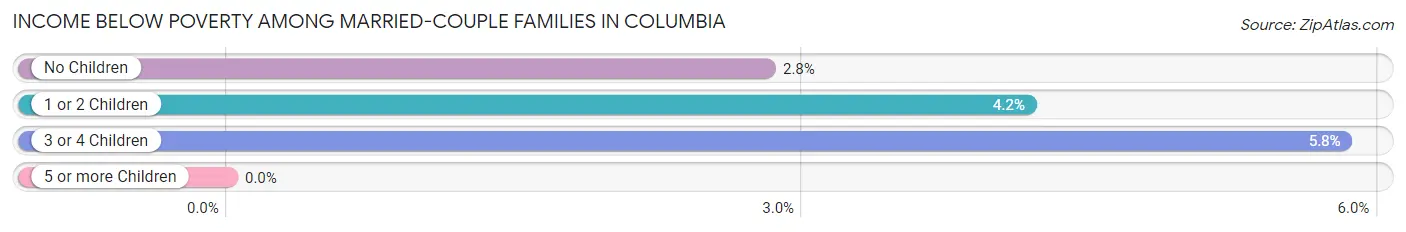
| Children | Above Poverty | Below Poverty |
| No Children | 8,739 (97.2%) | 253 (2.8%) |
| 1 or 2 Children | 4,384 (95.8%) | 191 (4.2%) |
| 3 or 4 Children | 1,408 (94.2%) | 87 (5.8%) |
| 5 or more Children | 0 (0.0%) | 0 (0.0%) |
| Total | 14,531 (96.5%) | 531 (3.5%) |
Income Below Poverty Among Single-Parent Households in Columbia
According to the poverty data in Columbia, 19.2% or 298 single-father households and 39.7% or 2,952 single-mother households are living below the poverty line. Among single-father households, those with 1 or 2 children have the highest poverty rate, with 125 households (20.9%) experiencing poverty. Likewise, among single-mother households, those with 5 or more children have the highest poverty rate, with 186 households (100.0%) falling below the poverty line.
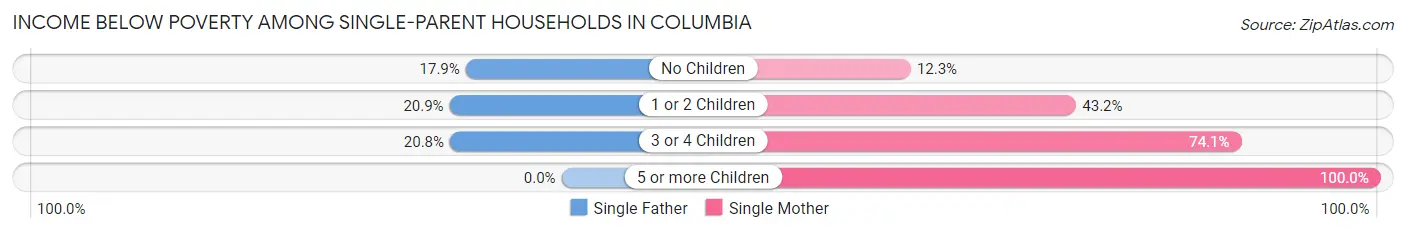
| Children | Single Father | Single Mother |
| No Children | 152 (17.9%) | 288 (12.3%) |
| 1 or 2 Children | 125 (20.9%) | 1,621 (43.2%) |
| 3 or 4 Children | 21 (20.8%) | 857 (74.1%) |
| 5 or more Children | 0 (0.0%) | 186 (100.0%) |
| Total | 298 (19.2%) | 2,952 (39.7%) |
Income Below Poverty Among Married-Couple vs Single-Parent Households in Columbia
The poverty data for Columbia shows that 531 of the married-couple family households (3.5%) and 3,250 of the single-parent households (36.2%) are living below the poverty level. Within the married-couple family households, those with 3 or 4 children have the highest poverty rate, with 87 households (5.8%) falling below the poverty line. Among the single-parent households, those with 5 or more children have the highest poverty rate, with 186 household (100.0%) living below poverty.
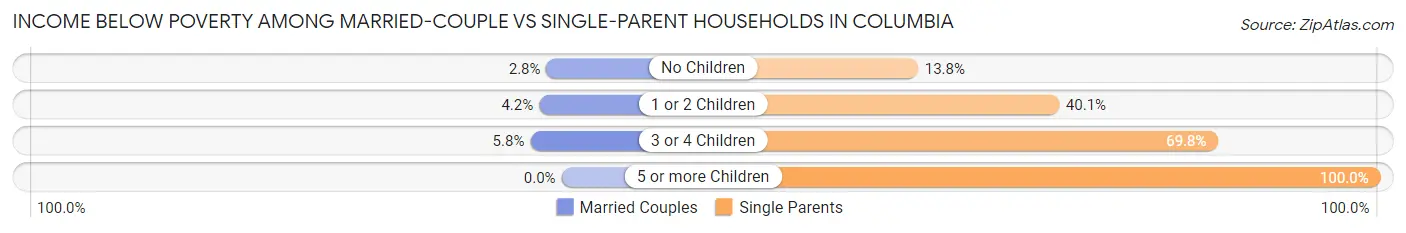
| Children | Married-Couple Families | Single-Parent Households |
| No Children | 253 (2.8%) | 440 (13.8%) |
| 1 or 2 Children | 191 (4.2%) | 1,746 (40.1%) |
| 3 or 4 Children | 87 (5.8%) | 878 (69.8%) |
| 5 or more Children | 0 (0.0%) | 186 (100.0%) |
| Total | 531 (3.5%) | 3,250 (36.2%) |
Race in Columbia
The most populous races in Columbia are White / Caucasian (68,552 | 50.1%), Black / African American (55,616 | 40.7%), and Hispanic or Latino (7,065 | 5.2%).
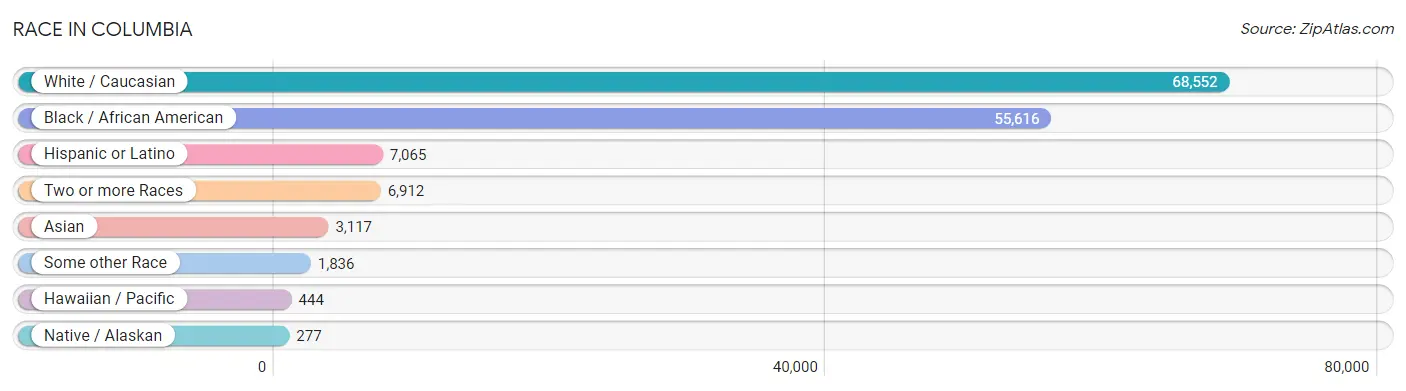
| Race | # Population | % Population |
| Asian | 3,117 | 2.3% |
| Black / African American | 55,616 | 40.7% |
| Hawaiian / Pacific | 444 | 0.3% |
| Hispanic or Latino | 7,065 | 5.2% |
| Native / Alaskan | 277 | 0.2% |
| White / Caucasian | 68,552 | 50.1% |
| Two or more Races | 6,912 | 5.1% |
| Some other Race | 1,836 | 1.3% |
| Total | 136,754 | 100.0% |
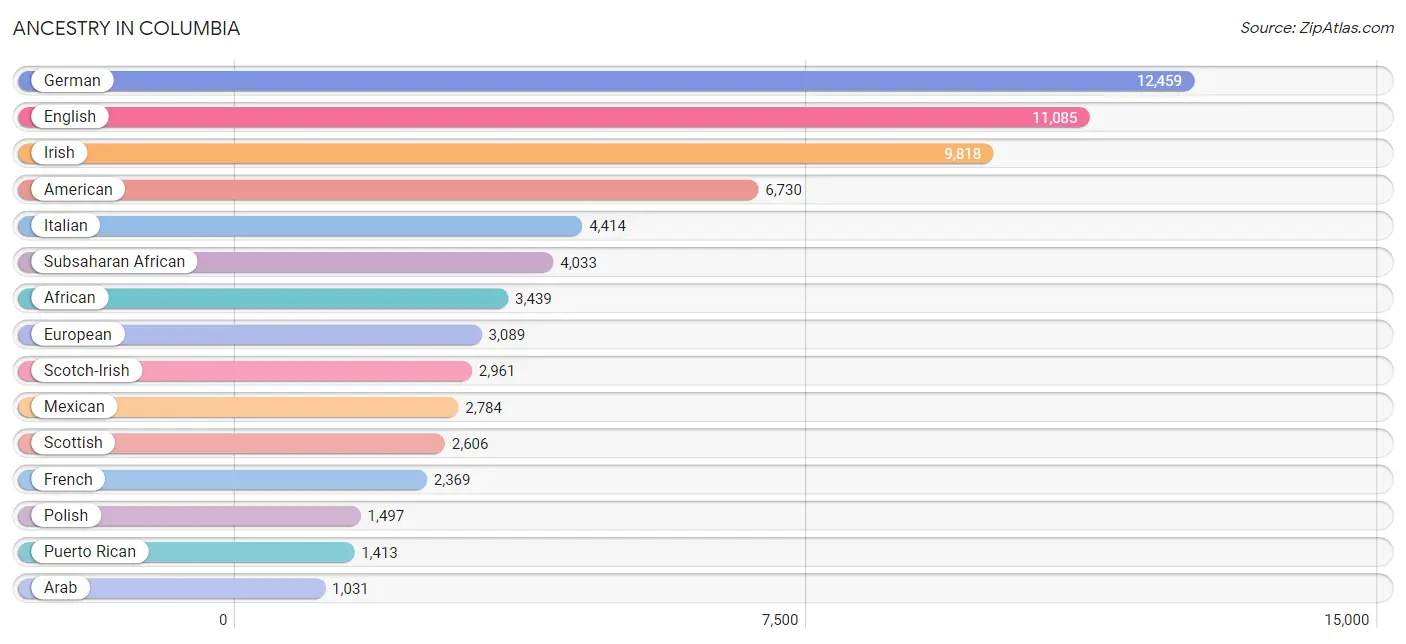
Ancestry in Columbia
The most populous ancestries reported in Columbia are German (12,459 | 9.1%), English (11,085 | 8.1%), Irish (9,818 | 7.2%), American (6,730 | 4.9%), and Italian (4,414 | 3.2%), together accounting for 32.6% of all Columbia residents.
| Ancestry | # Population | % Population |
| African | 3,439 | 2.5% |
| Albanian | 15 | 0.0% |
| American | 6,730 | 4.9% |
| Apache | 7 | 0.0% |
| Arab | 1,031 | 0.7% |
| Argentinean | 21 | 0.0% |
| Armenian | 155 | 0.1% |
| Assyrian / Chaldean / Syriac | 1 | 0.0% |
| Australian | 16 | 0.0% |
| Austrian | 78 | 0.1% |
| Bahamian | 129 | 0.1% |
| Bangladeshi | 125 | 0.1% |
| Barbadian | 4 | 0.0% |
| Belgian | 50 | 0.0% |
| Belizean | 7 | 0.0% |
| Bhutanese | 560 | 0.4% |
| Blackfeet | 1 | 0.0% |
| British | 766 | 0.6% |
| British West Indian | 84 | 0.1% |
| Bulgarian | 15 | 0.0% |
| Burmese | 398 | 0.3% |
| Cajun | 31 | 0.0% |
| Cambodian | 5 | 0.0% |
| Canadian | 152 | 0.1% |
| Cape Verdean | 24 | 0.0% |
| Celtic | 106 | 0.1% |
| Central American | 558 | 0.4% |
| Cherokee | 585 | 0.4% |
| Chickasaw | 16 | 0.0% |
| Chilean | 21 | 0.0% |
| Chippewa | 17 | 0.0% |
| Choctaw | 7 | 0.0% |
| Colombian | 533 | 0.4% |
| Costa Rican | 40 | 0.0% |
| Creek | 10 | 0.0% |
| Croatian | 97 | 0.1% |
| Cuban | 207 | 0.2% |
| Czech | 436 | 0.3% |
| Czechoslovakian | 105 | 0.1% |
| Danish | 172 | 0.1% |
| Dominican | 246 | 0.2% |
| Dutch | 702 | 0.5% |
| Eastern European | 286 | 0.2% |
| Ecuadorian | 49 | 0.0% |
| Egyptian | 60 | 0.0% |
| English | 11,085 | 8.1% |
| Ethiopian | 43 | 0.0% |
| European | 3,089 | 2.3% |
| Filipino | 67 | 0.1% |
| Finnish | 111 | 0.1% |
| French | 2,369 | 1.7% |
| French American Indian | 42 | 0.0% |
| French Canadian | 275 | 0.2% |
| German | 12,459 | 9.1% |
| Ghanaian | 26 | 0.0% |
| Greek | 609 | 0.4% |
| Guamanian / Chamorro | 352 | 0.3% |
| Guatemalan | 153 | 0.1% |
| Haitian | 58 | 0.0% |
| Honduran | 166 | 0.1% |
| Hungarian | 286 | 0.2% |
| Indian (Asian) | 886 | 0.6% |
| Indonesian | 33 | 0.0% |
| Iranian | 201 | 0.2% |
| Iraqi | 10 | 0.0% |
| Irish | 9,818 | 7.2% |
| Israeli | 38 | 0.0% |
| Italian | 4,414 | 3.2% |
| Jamaican | 810 | 0.6% |
| Japanese | 76 | 0.1% |
| Kiowa | 6 | 0.0% |
| Korean | 976 | 0.7% |
| Laotian | 289 | 0.2% |
| Latvian | 42 | 0.0% |
| Lebanese | 221 | 0.2% |
| Lithuanian | 163 | 0.1% |
| Lumbee | 147 | 0.1% |
| Luxembourger | 26 | 0.0% |
| Malaysian | 86 | 0.1% |
| Maltese | 13 | 0.0% |
| Mexican | 2,784 | 2.0% |
| Mexican American Indian | 23 | 0.0% |
| Moroccan | 15 | 0.0% |
| Native Hawaiian | 44 | 0.0% |
| Navajo | 36 | 0.0% |
| Nicaraguan | 26 | 0.0% |
| Nigerian | 330 | 0.2% |
| Northern European | 98 | 0.1% |
| Norwegian | 741 | 0.5% |
| Pakistani | 70 | 0.1% |
| Palestinian | 102 | 0.1% |
| Panamanian | 24 | 0.0% |
| Peruvian | 128 | 0.1% |
| Polish | 1,497 | 1.1% |
| Portuguese | 95 | 0.1% |
| Puerto Rican | 1,413 | 1.0% |
| Romanian | 61 | 0.0% |
| Russian | 480 | 0.4% |
| Salvadoran | 120 | 0.1% |
| Samoan | 319 | 0.2% |
| Scandinavian | 166 | 0.1% |
| Scotch-Irish | 2,961 | 2.2% |
| Scottish | 2,606 | 1.9% |
| Seminole | 16 | 0.0% |
| Serbian | 36 | 0.0% |
| Shoshone | 33 | 0.0% |
| Sioux | 53 | 0.0% |
| Slovak | 113 | 0.1% |
| Slovene | 54 | 0.0% |
| South African | 25 | 0.0% |
| South American | 845 | 0.6% |
| Spaniard | 611 | 0.4% |
| Spanish | 174 | 0.1% |
| Sri Lankan | 485 | 0.4% |
| Subsaharan African | 4,033 | 2.9% |
| Sudanese | 33 | 0.0% |
| Swedish | 458 | 0.3% |
| Swiss | 231 | 0.2% |
| Syrian | 49 | 0.0% |
| Thai | 837 | 0.6% |
| Trinidadian and Tobagonian | 199 | 0.2% |
| Turkish | 22 | 0.0% |
| Ugandan | 72 | 0.1% |
| Ukrainian | 273 | 0.2% |
| Ute | 16 | 0.0% |
| Venezuelan | 93 | 0.1% |
| Vietnamese | 64 | 0.1% |
| Welsh | 523 | 0.4% |
| West Indian | 115 | 0.1% |
| Yugoslavian | 46 | 0.0% | View All 130 Rows |
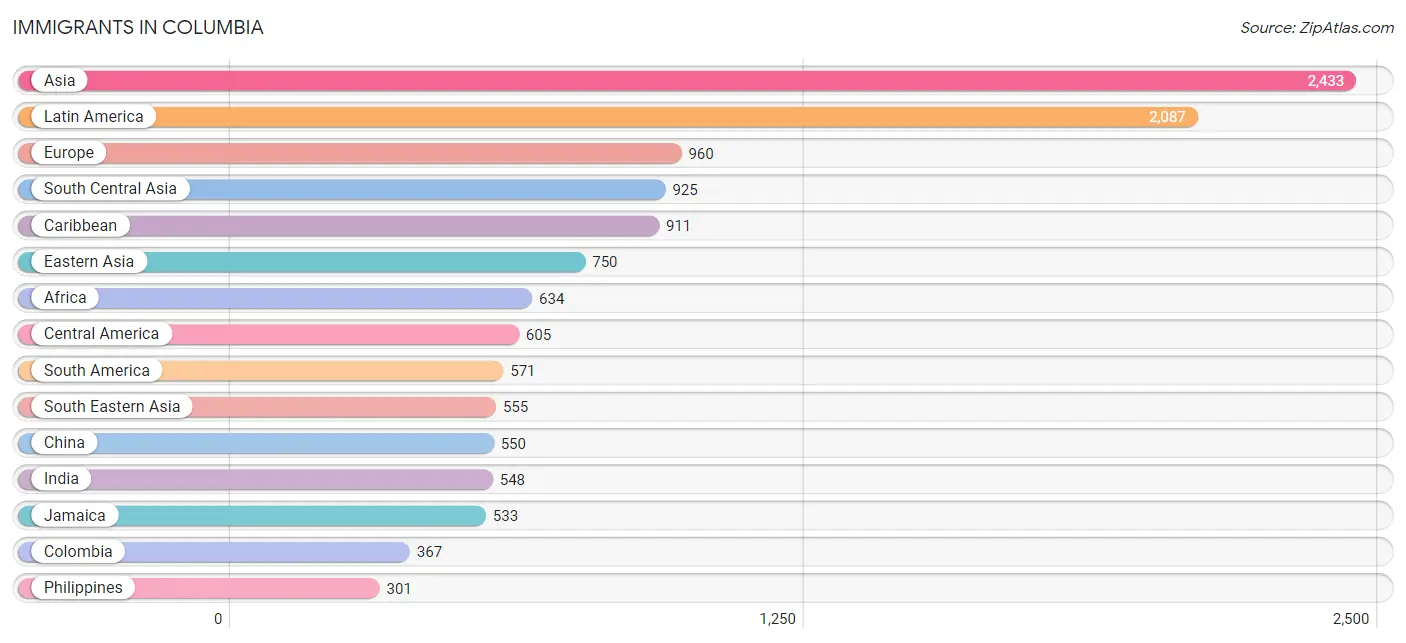
Immigrants in Columbia
The most numerous immigrant groups reported in Columbia came from Asia (2,433 | 1.8%), Latin America (2,087 | 1.5%), Europe (960 | 0.7%), South Central Asia (925 | 0.7%), and Caribbean (911 | 0.7%), together accounting for 5.4% of all Columbia residents.
| Immigration Origin | # Population | % Population |
| Africa | 634 | 0.5% |
| Albania | 5 | 0.0% |
| Armenia | 25 | 0.0% |
| Asia | 2,433 | 1.8% |
| Australia | 6 | 0.0% |
| Bahamas | 92 | 0.1% |
| Bangladesh | 84 | 0.1% |
| Belarus | 27 | 0.0% |
| Belgium | 7 | 0.0% |
| Belize | 26 | 0.0% |
| Bosnia and Herzegovina | 22 | 0.0% |
| Brazil | 29 | 0.0% |
| Bulgaria | 15 | 0.0% |
| Cabo Verde | 16 | 0.0% |
| Cambodia | 21 | 0.0% |
| Cameroon | 2 | 0.0% |
| Canada | 215 | 0.2% |
| Caribbean | 911 | 0.7% |
| Central America | 605 | 0.4% |
| Chile | 4 | 0.0% |
| China | 550 | 0.4% |
| Colombia | 367 | 0.3% |
| Congo | 20 | 0.0% |
| Costa Rica | 46 | 0.0% |
| Cuba | 60 | 0.0% |
| Dominica | 55 | 0.0% |
| Dominican Republic | 106 | 0.1% |
| Eastern Africa | 113 | 0.1% |
| Eastern Asia | 750 | 0.5% |
| Eastern Europe | 252 | 0.2% |
| Ecuador | 42 | 0.0% |
| Egypt | 34 | 0.0% |
| El Salvador | 17 | 0.0% |
| England | 76 | 0.1% |
| Eritrea | 20 | 0.0% |
| Ethiopia | 23 | 0.0% |
| Europe | 960 | 0.7% |
| France | 17 | 0.0% |
| Germany | 133 | 0.1% |
| Greece | 37 | 0.0% |
| Grenada | 27 | 0.0% |
| Guatemala | 99 | 0.1% |
| Honduras | 82 | 0.1% |
| Hong Kong | 11 | 0.0% |
| Hungary | 5 | 0.0% |
| India | 548 | 0.4% |
| Iran | 199 | 0.2% |
| Iraq | 26 | 0.0% |
| Ireland | 62 | 0.1% |
| Italy | 58 | 0.0% |
| Jamaica | 533 | 0.4% |
| Japan | 88 | 0.1% |
| Korea | 112 | 0.1% |
| Laos | 53 | 0.0% |
| Latin America | 2,087 | 1.5% |
| Liberia | 1 | 0.0% |
| Mexico | 296 | 0.2% |
| Middle Africa | 43 | 0.0% |
| Moldova | 12 | 0.0% |
| Nepal | 22 | 0.0% |
| Netherlands | 41 | 0.0% |
| Nicaragua | 22 | 0.0% |
| Nigeria | 108 | 0.1% |
| Northern Africa | 281 | 0.2% |
| Northern Europe | 253 | 0.2% |
| Norway | 1 | 0.0% |
| Oceania | 20 | 0.0% |
| Pakistan | 43 | 0.0% |
| Panama | 17 | 0.0% |
| Peru | 110 | 0.1% |
| Philippines | 301 | 0.2% |
| Poland | 39 | 0.0% |
| Russia | 67 | 0.1% |
| Saudi Arabia | 33 | 0.0% |
| Somalia | 27 | 0.0% |
| South Africa | 21 | 0.0% |
| South America | 571 | 0.4% |
| South Central Asia | 925 | 0.7% |
| South Eastern Asia | 555 | 0.4% |
| Southern Europe | 199 | 0.2% |
| Spain | 104 | 0.1% |
| Sri Lanka | 29 | 0.0% |
| Sudan | 33 | 0.0% |
| Switzerland | 58 | 0.0% |
| Taiwan | 49 | 0.0% |
| Thailand | 12 | 0.0% |
| Turkey | 18 | 0.0% |
| Uganda | 21 | 0.0% |
| Ukraine | 42 | 0.0% |
| Venezuela | 19 | 0.0% |
| Vietnam | 135 | 0.1% |
| Western Africa | 176 | 0.1% |
| Western Asia | 139 | 0.1% |
| Western Europe | 256 | 0.2% |
| Zaire | 21 | 0.0% | View All 95 Rows |
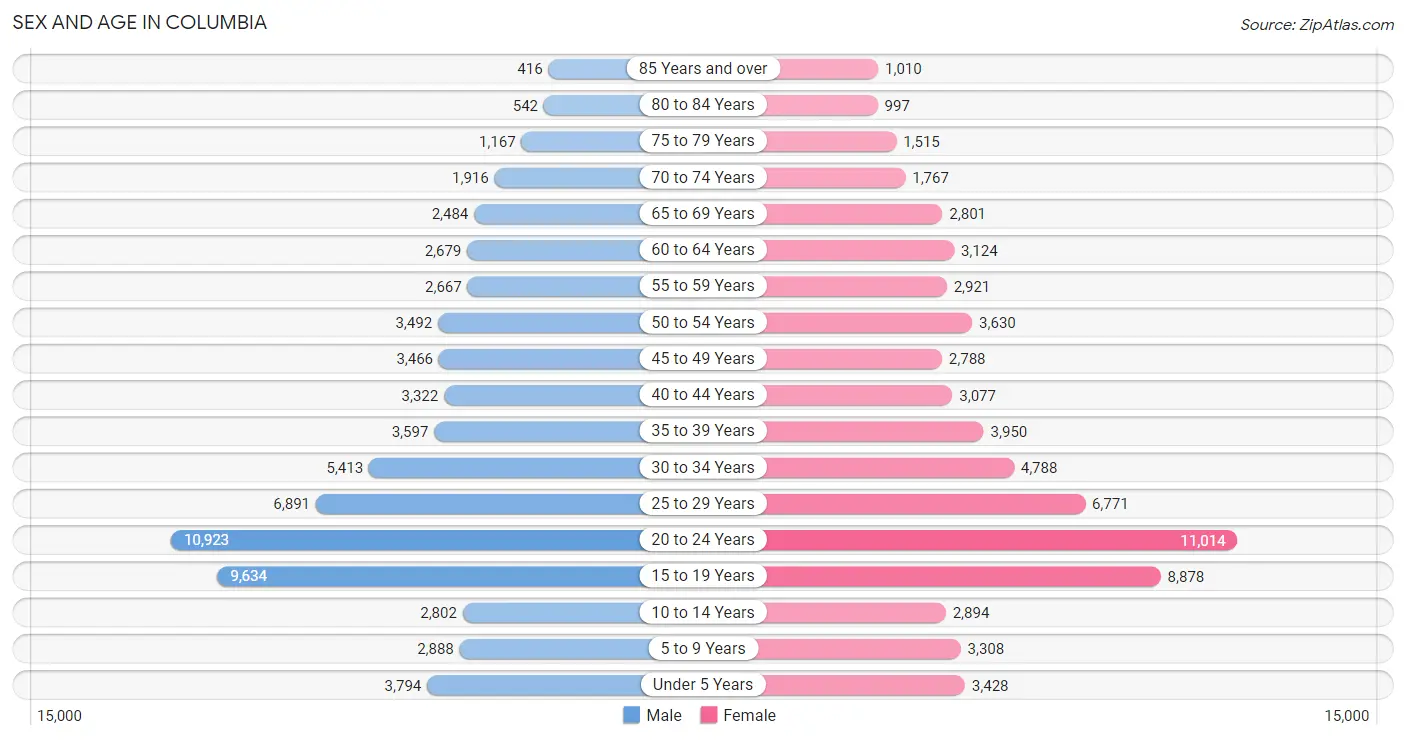
Sex and Age in Columbia
Sex and Age in Columbia
The most populous age groups in Columbia are 20 to 24 Years (10,923 | 16.0%) for men and 20 to 24 Years (11,014 | 16.0%) for women.
| Age Bracket | Male | Female |
| Under 5 Years | 3,794 (5.6%) | 3,428 (5.0%) |
| 5 to 9 Years | 2,888 (4.2%) | 3,308 (4.8%) |
| 10 to 14 Years | 2,802 (4.1%) | 2,894 (4.2%) |
| 15 to 19 Years | 9,634 (14.1%) | 8,878 (12.9%) |
| 20 to 24 Years | 10,923 (16.0%) | 11,014 (16.0%) |
| 25 to 29 Years | 6,891 (10.1%) | 6,771 (9.9%) |
| 30 to 34 Years | 5,413 (8.0%) | 4,788 (7.0%) |
| 35 to 39 Years | 3,597 (5.3%) | 3,950 (5.8%) |
| 40 to 44 Years | 3,322 (4.9%) | 3,077 (4.5%) |
| 45 to 49 Years | 3,466 (5.1%) | 2,788 (4.1%) |
| 50 to 54 Years | 3,492 (5.1%) | 3,630 (5.3%) |
| 55 to 59 Years | 2,667 (3.9%) | 2,921 (4.3%) |
| 60 to 64 Years | 2,679 (3.9%) | 3,124 (4.5%) |
| 65 to 69 Years | 2,484 (3.6%) | 2,801 (4.1%) |
| 70 to 74 Years | 1,916 (2.8%) | 1,767 (2.6%) |
| 75 to 79 Years | 1,167 (1.7%) | 1,515 (2.2%) |
| 80 to 84 Years | 542 (0.8%) | 997 (1.5%) |
| 85 Years and over | 416 (0.6%) | 1,010 (1.5%) |
| Total | 68,093 (100.0%) | 68,661 (100.0%) |
Families and Households in Columbia
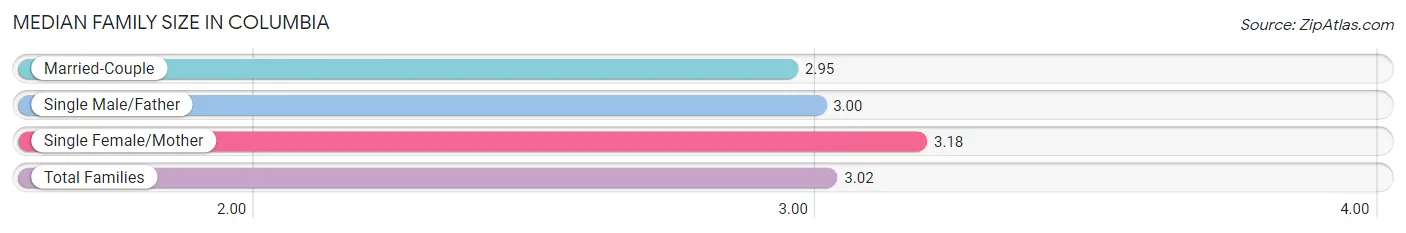
Median Family Size in Columbia
The median family size in Columbia is 3.02 persons per family, with single female/mother families (7,433 | 30.9%) accounting for the largest median family size of 3.18 persons per family. On the other hand, married-couple families (15,062 | 62.6%) represent the smallest median family size with 2.95 persons per family.
| Family Type | # Families | Family Size |
| Married-Couple | 15,062 (62.6%) | 2.95 |
| Single Male/Father | 1,551 (6.5%) | 3.00 |
| Single Female/Mother | 7,433 (30.9%) | 3.18 |
| Total Families | 24,046 (100.0%) | 3.02 |
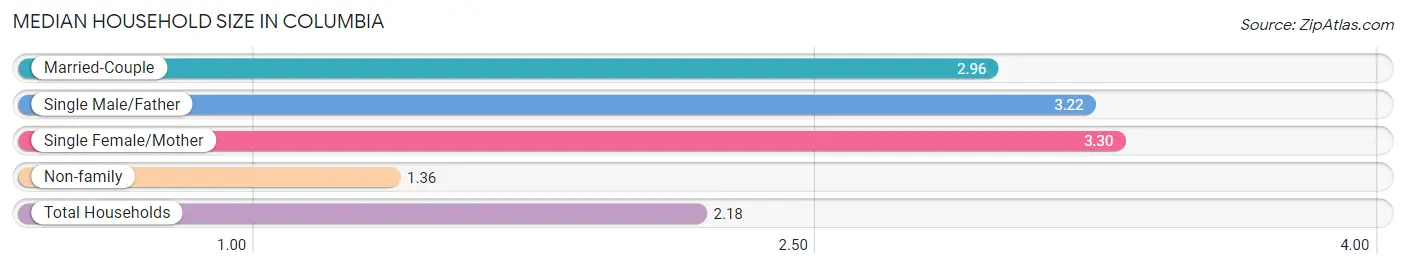
Median Household Size in Columbia
The median household size in Columbia is 2.18 persons per household, with single female/mother households (7,433 | 14.8%) accounting for the largest median household size of 3.3 persons per household. non-family households (26,177 | 52.1%) represent the smallest median household size with 1.36 persons per household.
| Household Type | # Households | Household Size |
| Married-Couple | 15,062 (30.0%) | 2.96 |
| Single Male/Father | 1,551 (3.1%) | 3.22 |
| Single Female/Mother | 7,433 (14.8%) | 3.30 |
| Non-family | 26,177 (52.1%) | 1.36 |
| Total Households | 50,223 (100.0%) | 2.18 |
Household Size by Marriage Status in Columbia
Out of a total of 50,223 households in Columbia, 24,046 (47.9%) are family households, while 26,177 (52.1%) are nonfamily households. The most numerous type of family households are 2-person households, comprising 11,652, and the most common type of nonfamily households are 1-person households, comprising 19,645.
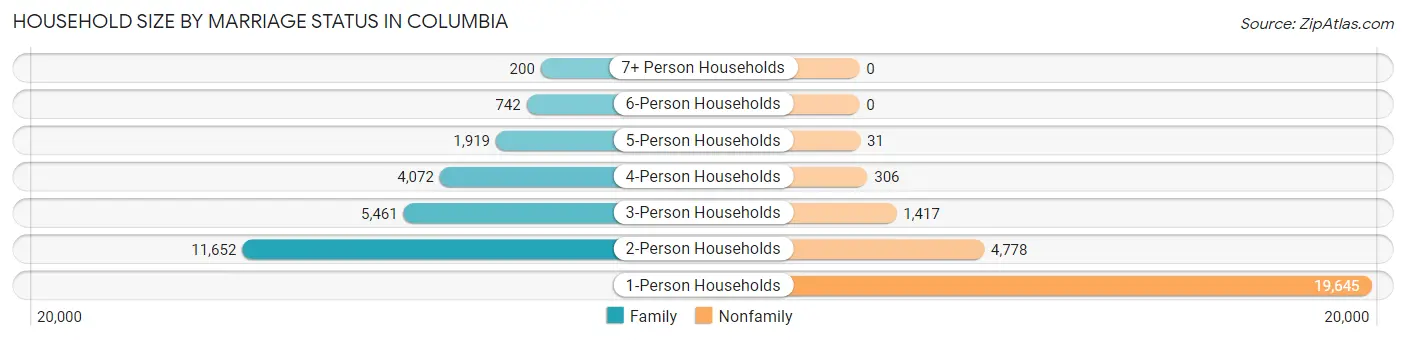
| Household Size | Family Households | Nonfamily Households |
| 1-Person Households | - | 19,645 (39.1%) |
| 2-Person Households | 11,652 (23.2%) | 4,778 (9.5%) |
| 3-Person Households | 5,461 (10.9%) | 1,417 (2.8%) |
| 4-Person Households | 4,072 (8.1%) | 306 (0.6%) |
| 5-Person Households | 1,919 (3.8%) | 31 (0.1%) |
| 6-Person Households | 742 (1.5%) | 0 (0.0%) |
| 7+ Person Households | 200 (0.4%) | 0 (0.0%) |
| Total | 24,046 (47.9%) | 26,177 (52.1%) |
Female Fertility in Columbia
Fertility by Age in Columbia
Average fertility rate in Columbia is 41.0 births per 1,000 women. Women in the age bracket of 20 to 34 years have the highest fertility rate with 52.0 births per 1,000 women. Women in the age bracket of 20 to 34 years acount for 68.0% of all women with births.
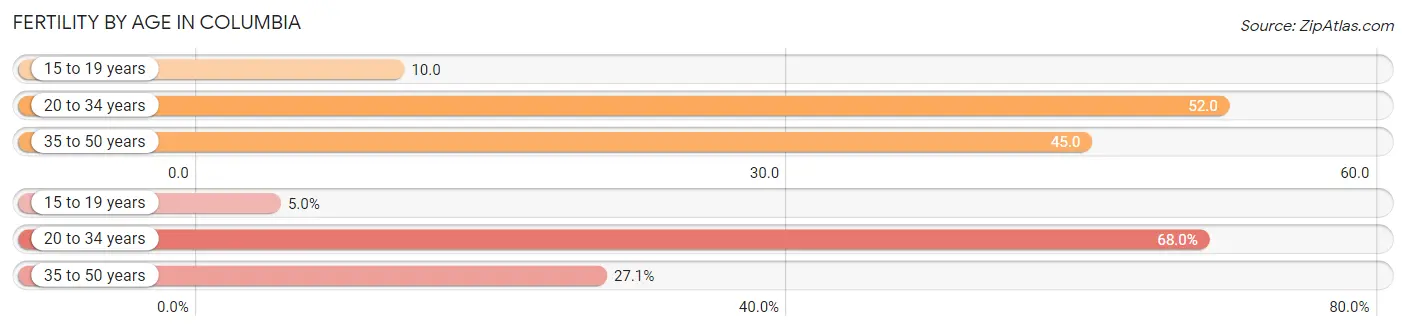
| Age Bracket | Women with Births | Births / 1,000 Women |
| 15 to 19 years | 86 (5.0%) | 10.0 |
| 20 to 34 years | 1,182 (68.0%) | 52.0 |
| 35 to 50 years | 471 (27.1%) | 45.0 |
| Total | 1,739 (100.0%) | 41.0 |
Fertility by Age by Marriage Status in Columbia
63.7% of women with births (1,739) in Columbia are married. The highest percentage of unmarried women with births falls into 15 to 19 years age bracket with 100.0% of them unmarried at the time of birth, while the lowest percentage of unmarried women with births belong to 35 to 50 years age bracket with 18.0% of them unmarried.
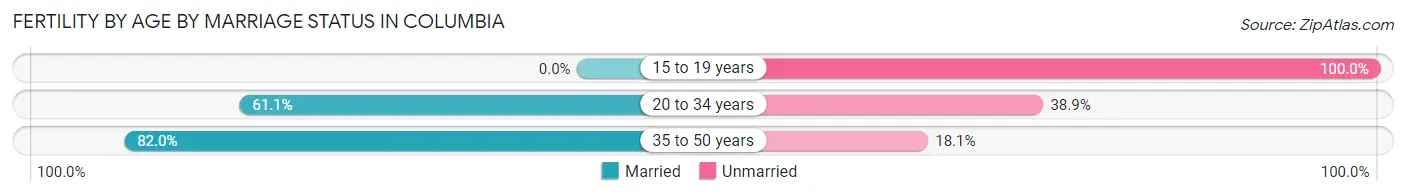
| Age Bracket | Married | Unmarried |
| 15 to 19 years | 0 (0.0%) | 86 (100.0%) |
| 20 to 34 years | 722 (61.1%) | 460 (38.9%) |
| 35 to 50 years | 386 (82.0%) | 85 (18.0%) |
| Total | 1,108 (63.7%) | 631 (36.3%) |
Fertility by Education in Columbia
Average fertility rate in Columbia is 41.0 births per 1,000 women. Women with the education attainment of graduate degree have the highest fertility rate of 56.0 births per 1,000 women, while women with the education attainment of college or associate's degree have the lowest fertility at 34.0 births per 1,000 women. Women with the education attainment of college or associate's degree represent 34.8% of all women with births.
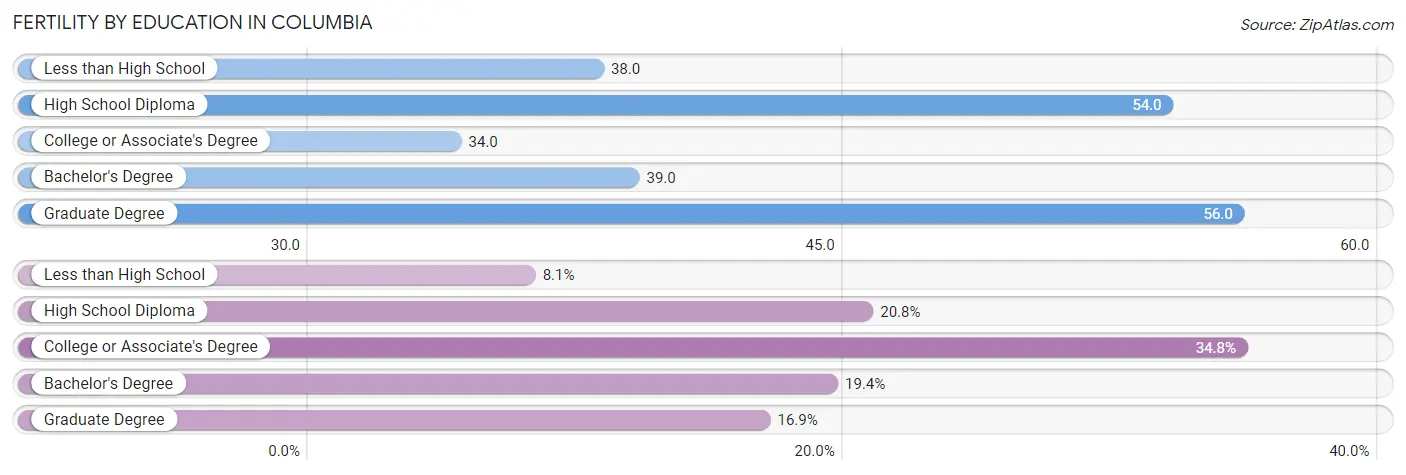
| Educational Attainment | Women with Births | Births / 1,000 Women |
| Less than High School | 141 (8.1%) | 38.0 |
| High School Diploma | 361 (20.8%) | 54.0 |
| College or Associate's Degree | 605 (34.8%) | 34.0 |
| Bachelor's Degree | 338 (19.4%) | 39.0 |
| Graduate Degree | 294 (16.9%) | 56.0 |
| Total | 1,739 (100.0%) | 41.0 |
Fertility by Education by Marriage Status in Columbia
36.3% of women with births in Columbia are unmarried. Women with the educational attainment of bachelor's degree are most likely to be married with 97.6% of them married at childbirth, while women with the educational attainment of less than high school are least likely to be married with 84.4% of them unmarried at childbirth.
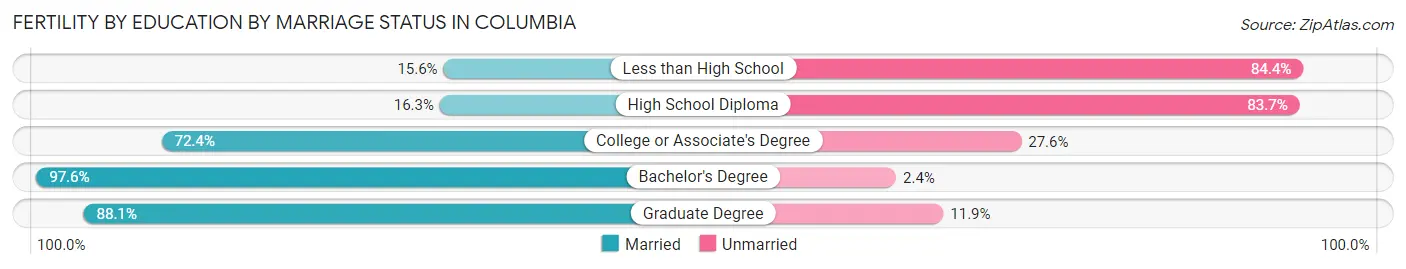
| Educational Attainment | Married | Unmarried |
| Less than High School | 22 (15.6%) | 119 (84.4%) |
| High School Diploma | 59 (16.3%) | 302 (83.7%) |
| College or Associate's Degree | 438 (72.4%) | 167 (27.6%) |
| Bachelor's Degree | 330 (97.6%) | 8 (2.4%) |
| Graduate Degree | 259 (88.1%) | 35 (11.9%) |
| Total | 1,108 (63.7%) | 631 (36.3%) |
Employment Characteristics in Columbia
Employment by Class of Employer in Columbia
Among the 68,867 employed individuals in Columbia, private company employees (37,863 | 55.0%), federal government employees (10,139 | 14.7%), and state government employees (7,345 | 10.7%) make up the most common classes of employment.
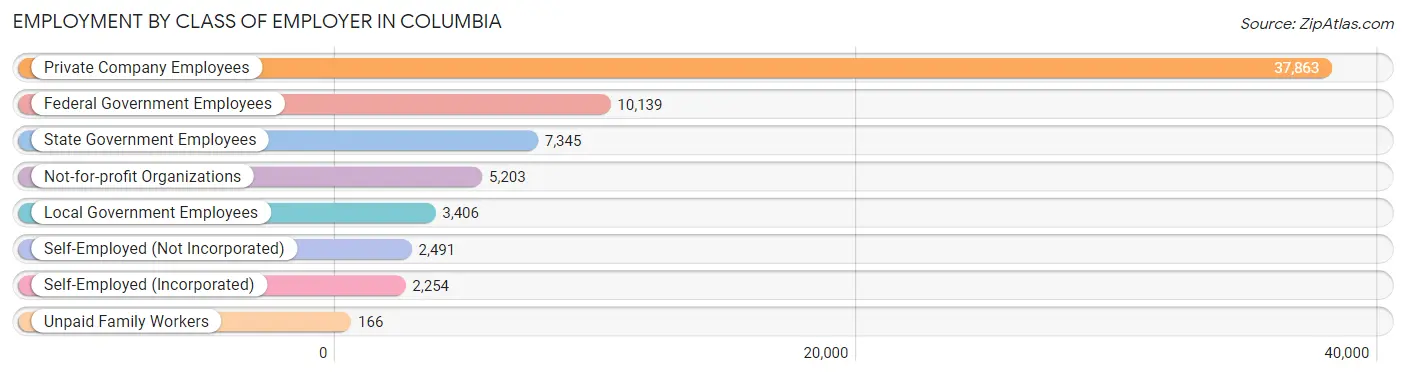
| Employer Class | # Employees | % Employees |
| Private Company Employees | 37,863 | 55.0% |
| Self-Employed (Incorporated) | 2,254 | 3.3% |
| Self-Employed (Not Incorporated) | 2,491 | 3.6% |
| Not-for-profit Organizations | 5,203 | 7.6% |
| Local Government Employees | 3,406 | 5.0% |
| State Government Employees | 7,345 | 10.7% |
| Federal Government Employees | 10,139 | 14.7% |
| Unpaid Family Workers | 166 | 0.2% |
| Total | 68,867 | 100.0% |
Employment Status by Age in Columbia
According to the labor force statistics for Columbia, out of the total population over 16 years of age (116,412), 65.0% or 75,668 individuals are in the labor force, with 7.9% or 5,978 of them unemployed. The age group with the highest labor force participation rate is 25 to 29 years, with 84.0% or 11,476 individuals in the labor force. Within the labor force, the 16 to 19 years age range has the highest percentage of unemployed individuals, with 15.4% or 1,294 of them being unemployed.
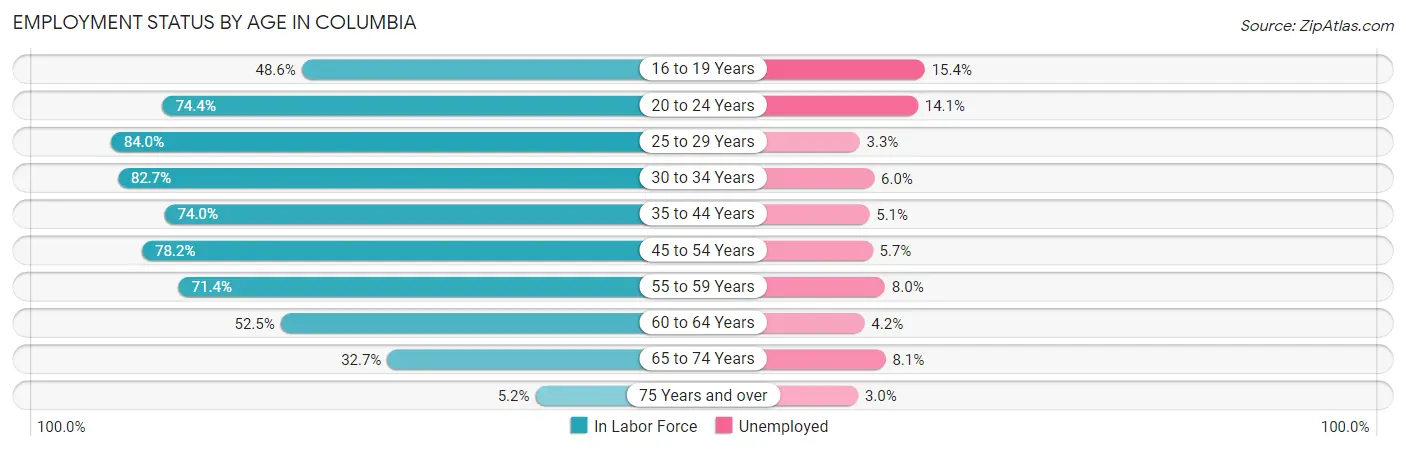
| Age Bracket | In Labor Force | Unemployed |
| 16 to 19 Years | 8,400 (48.6%) | 1,294 (15.4%) |
| 20 to 24 Years | 16,321 (74.4%) | 2,301 (14.1%) |
| 25 to 29 Years | 11,476 (84.0%) | 379 (3.3%) |
| 30 to 34 Years | 8,436 (82.7%) | 506 (6.0%) |
| 35 to 44 Years | 10,320 (74.0%) | 526 (5.1%) |
| 45 to 54 Years | 10,460 (78.2%) | 596 (5.7%) |
| 55 to 59 Years | 3,990 (71.4%) | 319 (8.0%) |
| 60 to 64 Years | 3,047 (52.5%) | 128 (4.2%) |
| 65 to 74 Years | 2,933 (32.7%) | 238 (8.1%) |
| 75 Years and over | 294 (5.2%) | 9 (3.0%) |
| Total | 75,668 (65.0%) | 5,978 (7.9%) |
Employment Status by Educational Attainment in Columbia
According to labor force statistics for Columbia, 76.3% of individuals (47,745) out of the total population between 25 and 64 years of age (62,576) are in the labor force, with 5.2% or 2,483 of them being unemployed. The group with the highest labor force participation rate are those with the educational attainment of bachelor's degree or higher, with 87.4% or 25,121 individuals in the labor force. Within the labor force, individuals with high school diploma education have the highest percentage of unemployment, with 12.5% or 893 of them being unemployed.
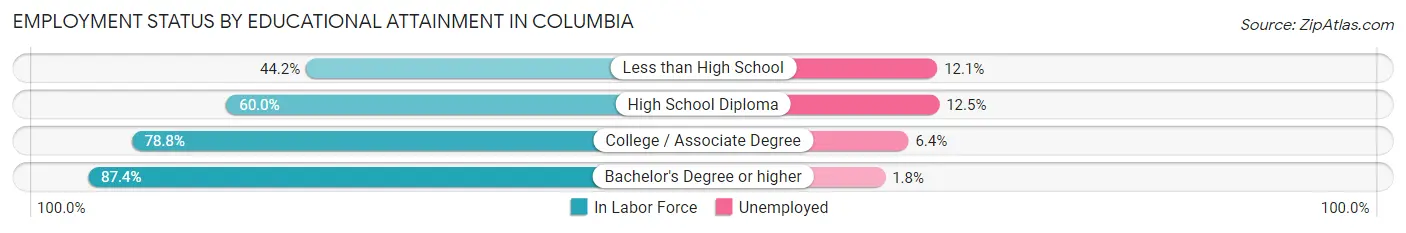
| Educational Attainment | In Labor Force | Unemployed |
| Less than High School | 2,314 (44.2%) | 634 (12.1%) |
| High School Diploma | 7,145 (60.0%) | 1,489 (12.5%) |
| College / Associate Degree | 13,151 (78.8%) | 1,068 (6.4%) |
| Bachelor's Degree or higher | 25,121 (87.4%) | 517 (1.8%) |
| Total | 47,745 (76.3%) | 3,254 (5.2%) |
Employment Occupations by Sex in Columbia
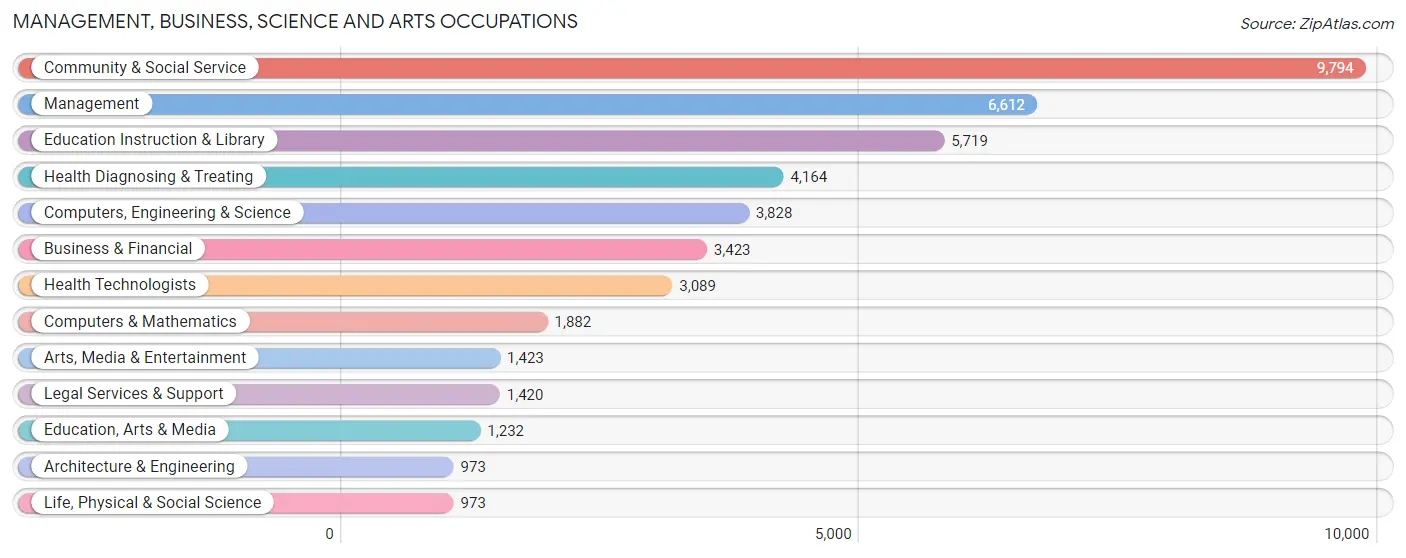
Management, Business, Science and Arts Occupations
The most common Management, Business, Science and Arts occupations in Columbia are Community & Social Service (9,794 | 15.7%), Management (6,612 | 10.6%), Education Instruction & Library (5,719 | 9.1%), Health Diagnosing & Treating (4,164 | 6.7%), and Computers, Engineering & Science (3,828 | 6.1%).
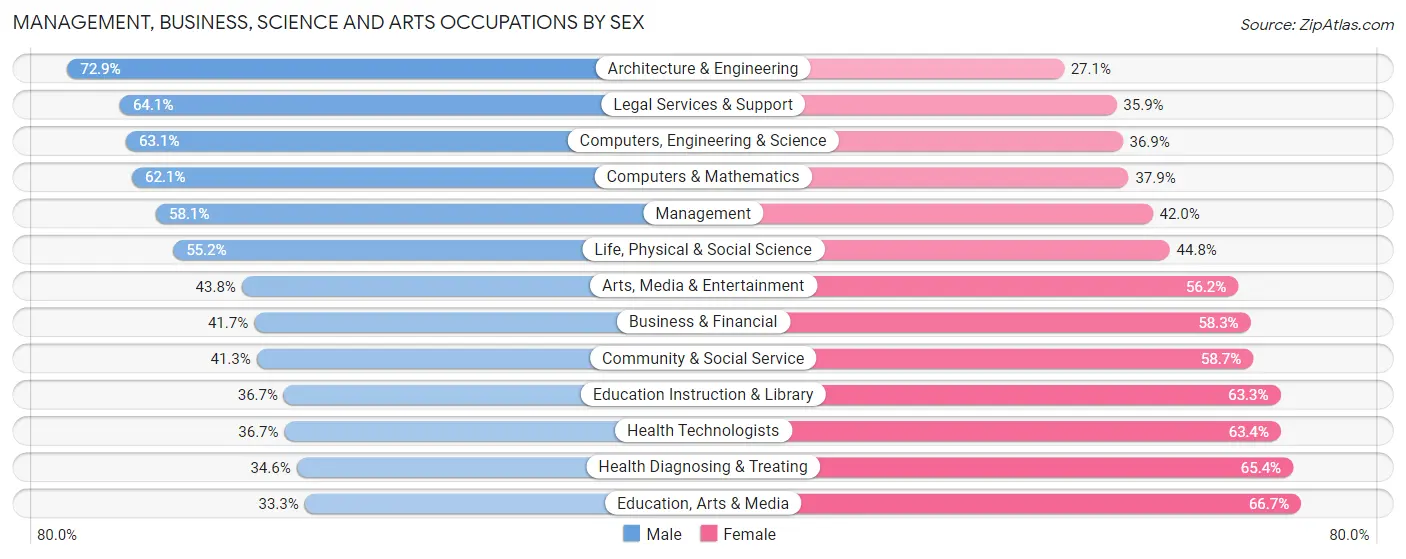
Management, Business, Science and Arts Occupations by Sex
Within the Management, Business, Science and Arts occupations in Columbia, the most male-oriented occupations are Architecture & Engineering (72.9%), Legal Services & Support (64.1%), and Computers, Engineering & Science (63.1%), while the most female-oriented occupations are Education, Arts & Media (66.7%), Health Diagnosing & Treating (65.4%), and Health Technologists (63.3%).
| Occupation | Male | Female |
| Management | 3,838 (58.1%) | 2,774 (41.9%) |
| Business & Financial | 1,428 (41.7%) | 1,995 (58.3%) |
| Computers, Engineering & Science | 2,414 (63.1%) | 1,414 (36.9%) |
| Computers & Mathematics | 1,168 (62.1%) | 714 (37.9%) |
| Architecture & Engineering | 709 (72.9%) | 264 (27.1%) |
| Life, Physical & Social Science | 537 (55.2%) | 436 (44.8%) |
| Community & Social Service | 4,044 (41.3%) | 5,750 (58.7%) |
| Education, Arts & Media | 410 (33.3%) | 822 (66.7%) |
| Legal Services & Support | 910 (64.1%) | 510 (35.9%) |
| Education Instruction & Library | 2,101 (36.7%) | 3,618 (63.3%) |
| Arts, Media & Entertainment | 623 (43.8%) | 800 (56.2%) |
| Health Diagnosing & Treating | 1,442 (34.6%) | 2,722 (65.4%) |
| Health Technologists | 1,132 (36.6%) | 1,957 (63.3%) |
| Total (Category) | 13,166 (47.3%) | 14,655 (52.7%) |
| Total (Overall) | 31,209 (49.9%) | 31,348 (50.1%) |
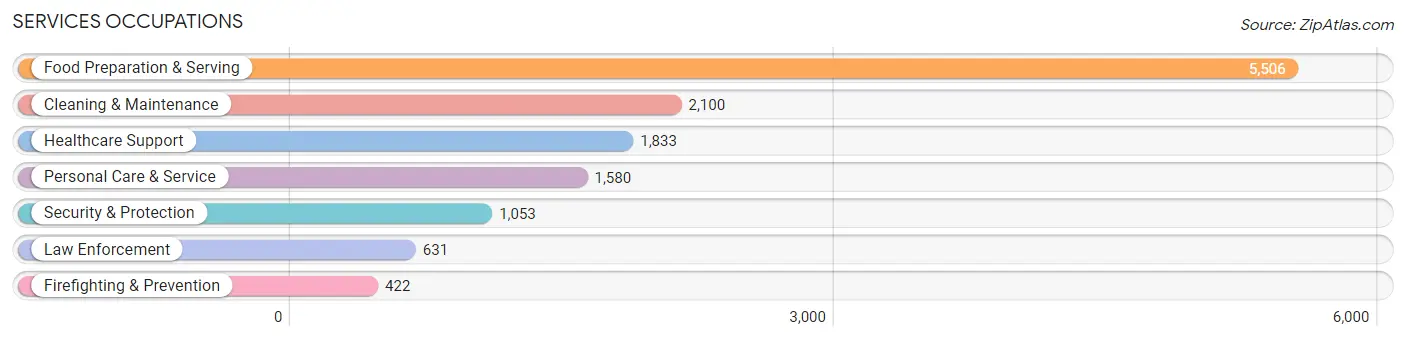
Services Occupations
The most common Services occupations in Columbia are Food Preparation & Serving (5,506 | 8.8%), Cleaning & Maintenance (2,100 | 3.4%), Healthcare Support (1,833 | 2.9%), Personal Care & Service (1,580 | 2.5%), and Security & Protection (1,053 | 1.7%).
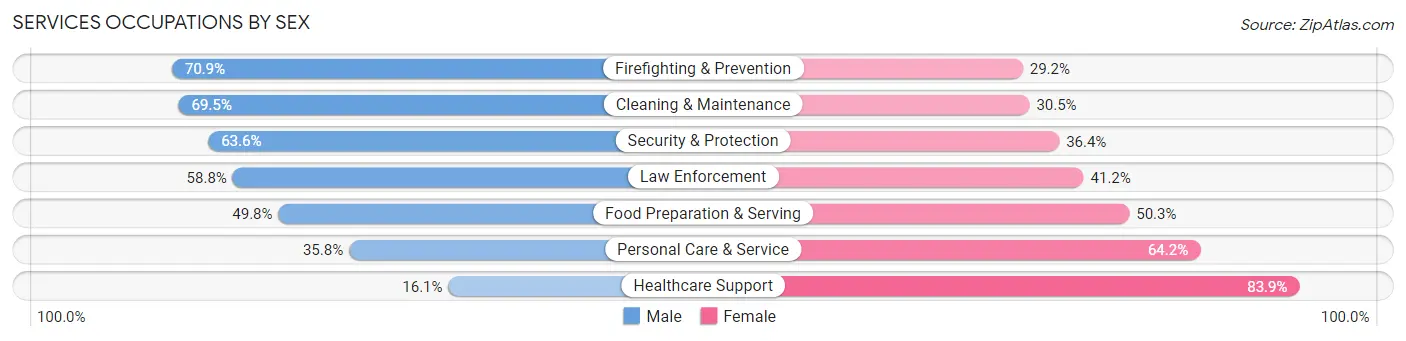
Services Occupations by Sex
Within the Services occupations in Columbia, the most male-oriented occupations are Firefighting & Prevention (70.9%), Cleaning & Maintenance (69.5%), and Security & Protection (63.6%), while the most female-oriented occupations are Healthcare Support (83.9%), Personal Care & Service (64.2%), and Food Preparation & Serving (50.2%).
| Occupation | Male | Female |
| Healthcare Support | 295 (16.1%) | 1,538 (83.9%) |
| Security & Protection | 670 (63.6%) | 383 (36.4%) |
| Firefighting & Prevention | 299 (70.9%) | 123 (29.1%) |
| Law Enforcement | 371 (58.8%) | 260 (41.2%) |
| Food Preparation & Serving | 2,739 (49.7%) | 2,767 (50.2%) |
| Cleaning & Maintenance | 1,460 (69.5%) | 640 (30.5%) |
| Personal Care & Service | 565 (35.8%) | 1,015 (64.2%) |
| Total (Category) | 5,729 (47.5%) | 6,343 (52.5%) |
| Total (Overall) | 31,209 (49.9%) | 31,348 (50.1%) |
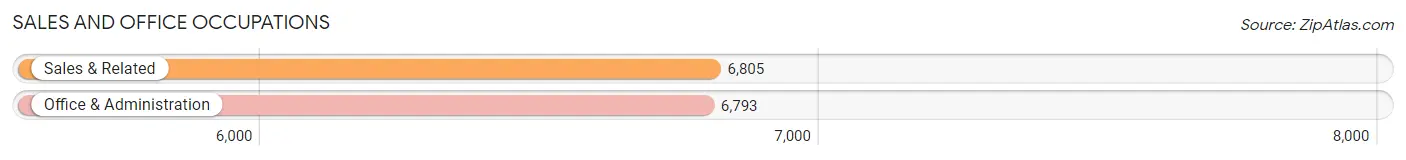
Sales and Office Occupations
The most common Sales and Office occupations in Columbia are Sales & Related (6,805 | 10.9%), and Office & Administration (6,793 | 10.9%).
Sales and Office Occupations by Sex
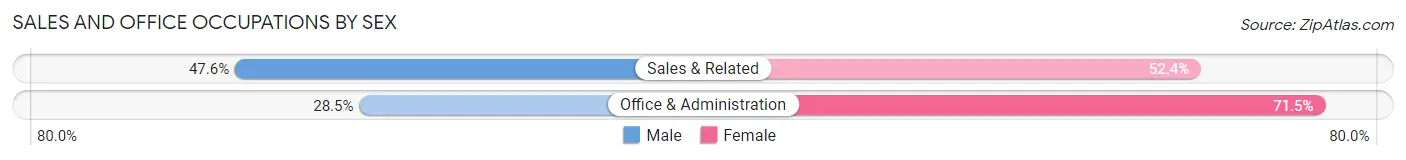
| Occupation | Male | Female |
| Sales & Related | 3,241 (47.6%) | 3,564 (52.4%) |
| Office & Administration | 1,937 (28.5%) | 4,856 (71.5%) |
| Total (Category) | 5,178 (38.1%) | 8,420 (61.9%) |
| Total (Overall) | 31,209 (49.9%) | 31,348 (50.1%) |
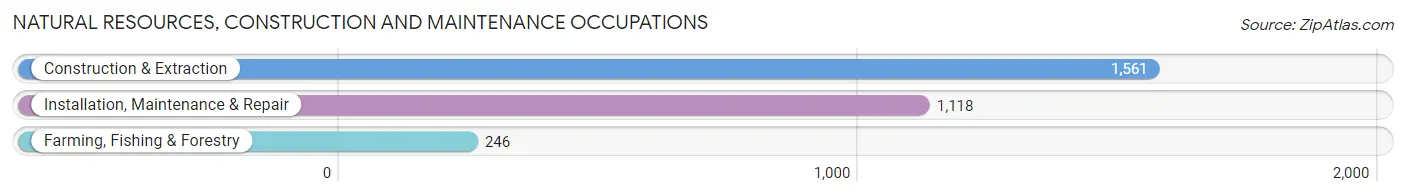
Natural Resources, Construction and Maintenance Occupations
The most common Natural Resources, Construction and Maintenance occupations in Columbia are Construction & Extraction (1,561 | 2.5%), Installation, Maintenance & Repair (1,118 | 1.8%), and Farming, Fishing & Forestry (246 | 0.4%).
Natural Resources, Construction and Maintenance Occupations by Sex
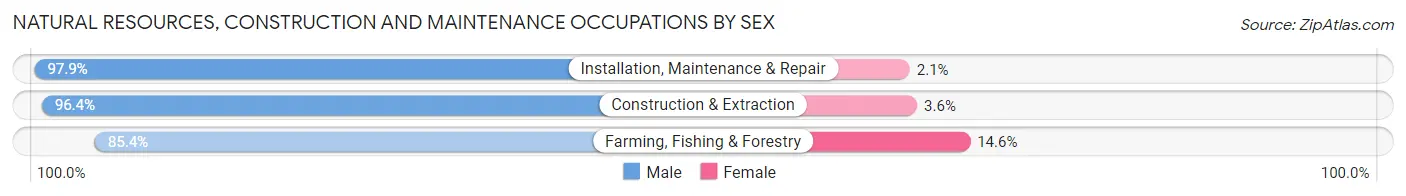
| Occupation | Male | Female |
| Farming, Fishing & Forestry | 210 (85.4%) | 36 (14.6%) |
| Construction & Extraction | 1,505 (96.4%) | 56 (3.6%) |
| Installation, Maintenance & Repair | 1,095 (97.9%) | 23 (2.1%) |
| Total (Category) | 2,810 (96.1%) | 115 (3.9%) |
| Total (Overall) | 31,209 (49.9%) | 31,348 (50.1%) |
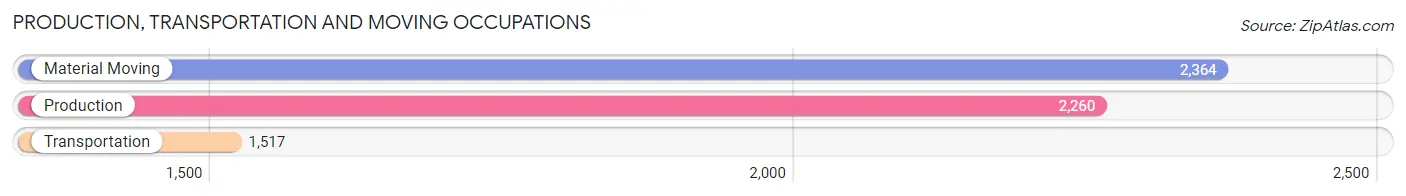
Production, Transportation and Moving Occupations
The most common Production, Transportation and Moving occupations in Columbia are Material Moving (2,364 | 3.8%), Production (2,260 | 3.6%), and Transportation (1,517 | 2.4%).
Production, Transportation and Moving Occupations by Sex
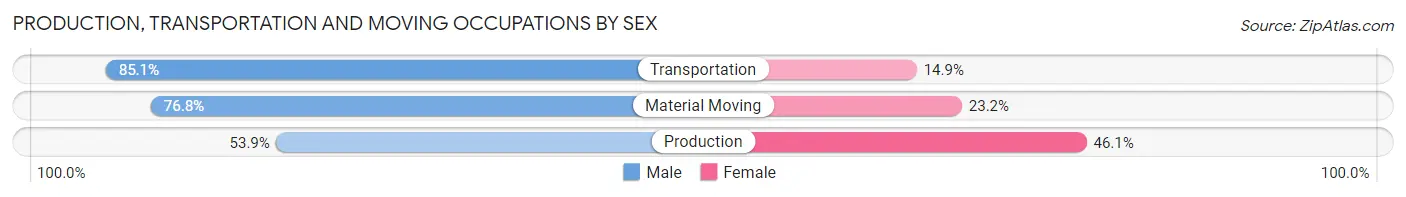
| Occupation | Male | Female |
| Production | 1,219 (53.9%) | 1,041 (46.1%) |
| Transportation | 1,291 (85.1%) | 226 (14.9%) |
| Material Moving | 1,816 (76.8%) | 548 (23.2%) |
| Total (Category) | 4,326 (70.4%) | 1,815 (29.6%) |
| Total (Overall) | 31,209 (49.9%) | 31,348 (50.1%) |
Employment Industries by Sex in Columbia
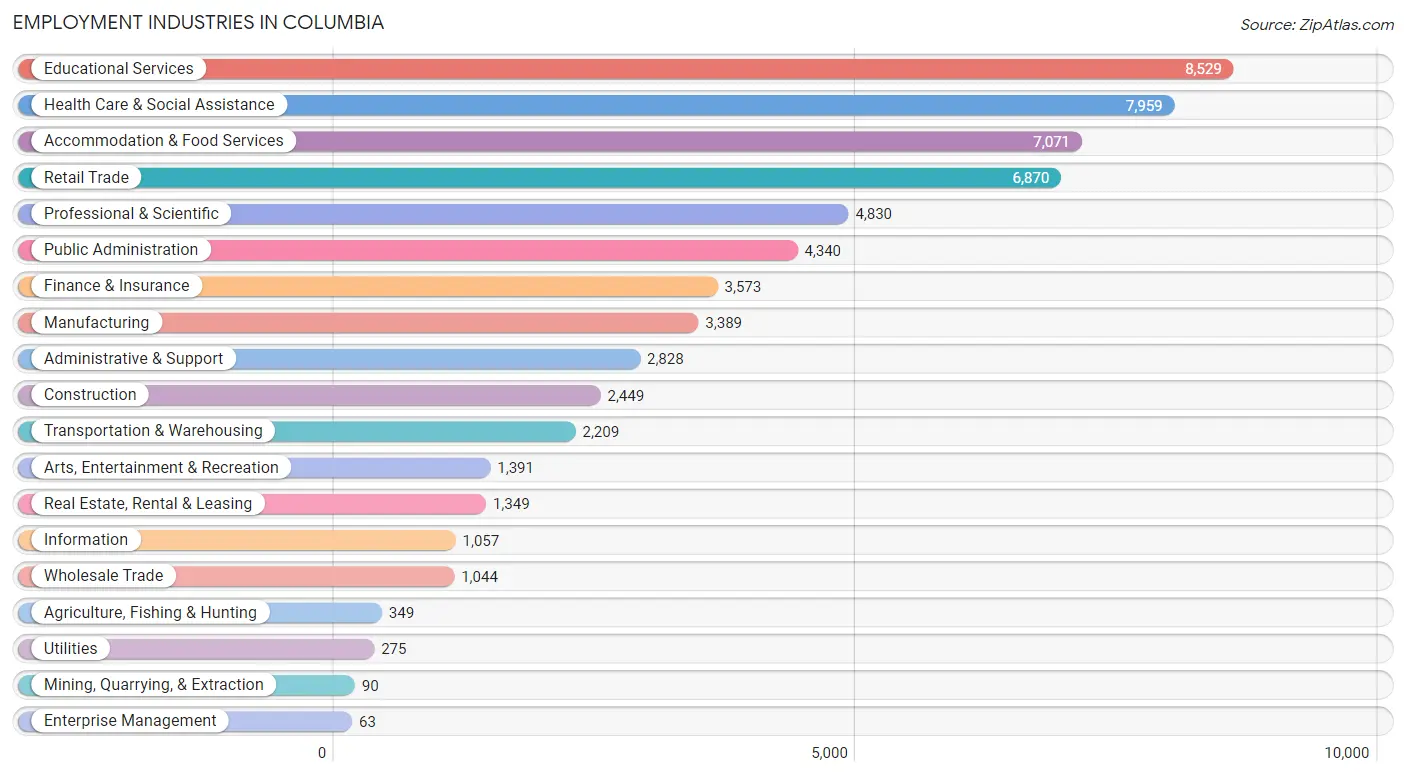
Employment Industries in Columbia
The major employment industries in Columbia include Educational Services (8,529 | 13.6%), Health Care & Social Assistance (7,959 | 12.7%), Accommodation & Food Services (7,071 | 11.3%), Retail Trade (6,870 | 11.0%), and Professional & Scientific (4,830 | 7.7%).
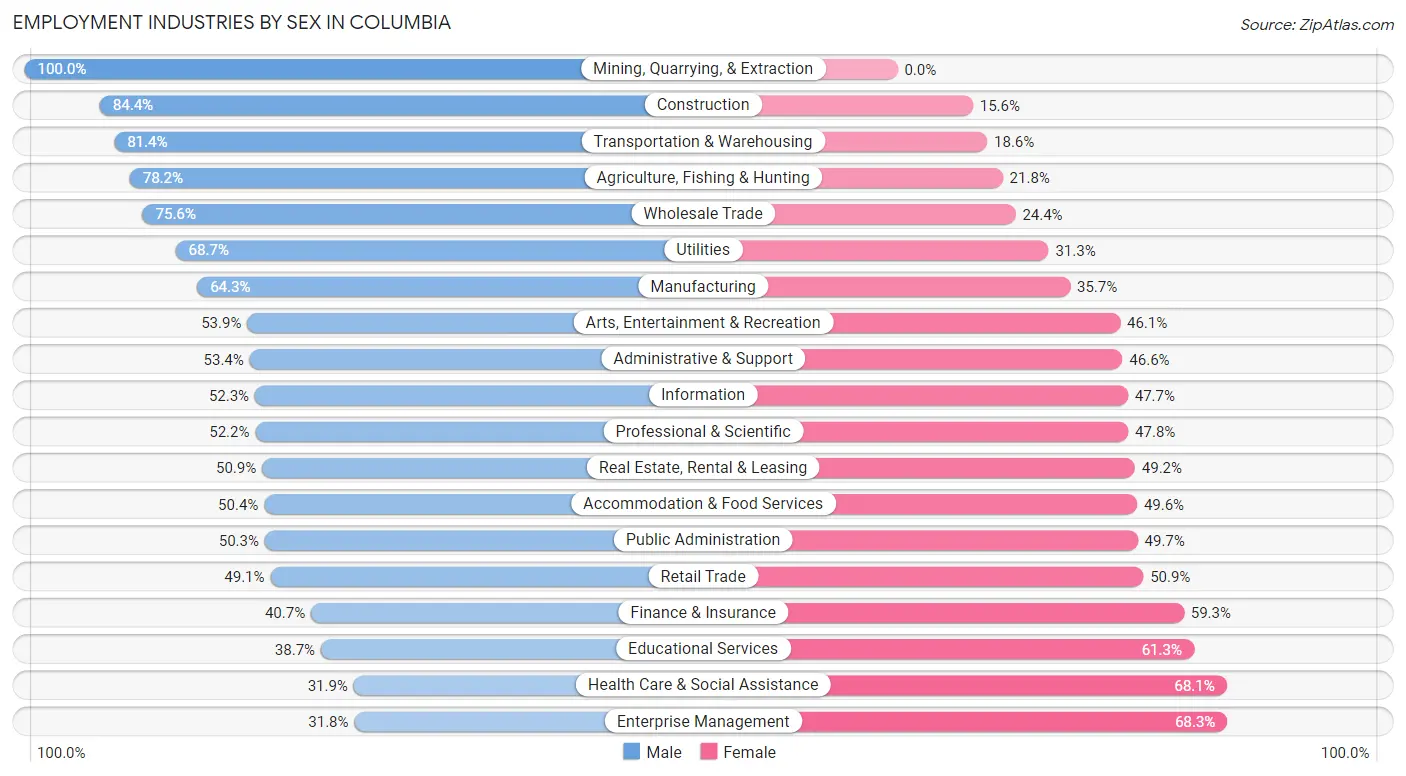
Employment Industries by Sex in Columbia
The Columbia industries that see more men than women are Mining, Quarrying, & Extraction (100.0%), Construction (84.4%), and Transportation & Warehousing (81.4%), whereas the industries that tend to have a higher number of women are Enterprise Management (68.2%), Health Care & Social Assistance (68.1%), and Educational Services (61.3%).
| Industry | Male | Female |
| Agriculture, Fishing & Hunting | 273 (78.2%) | 76 (21.8%) |
| Mining, Quarrying, & Extraction | 90 (100.0%) | 0 (0.0%) |
| Construction | 2,067 (84.4%) | 382 (15.6%) |
| Manufacturing | 2,178 (64.3%) | 1,211 (35.7%) |
| Wholesale Trade | 789 (75.6%) | 255 (24.4%) |
| Retail Trade | 3,375 (49.1%) | 3,495 (50.9%) |
| Transportation & Warehousing | 1,799 (81.4%) | 410 (18.6%) |
| Utilities | 189 (68.7%) | 86 (31.3%) |
| Information | 553 (52.3%) | 504 (47.7%) |
| Finance & Insurance | 1,455 (40.7%) | 2,118 (59.3%) |
| Real Estate, Rental & Leasing | 686 (50.8%) | 663 (49.1%) |
| Professional & Scientific | 2,523 (52.2%) | 2,307 (47.8%) |
| Enterprise Management | 20 (31.8%) | 43 (68.2%) |
| Administrative & Support | 1,511 (53.4%) | 1,317 (46.6%) |
| Educational Services | 3,298 (38.7%) | 5,231 (61.3%) |
| Health Care & Social Assistance | 2,537 (31.9%) | 5,422 (68.1%) |
| Arts, Entertainment & Recreation | 750 (53.9%) | 641 (46.1%) |
| Accommodation & Food Services | 3,565 (50.4%) | 3,506 (49.6%) |
| Public Administration | 2,182 (50.3%) | 2,158 (49.7%) |
| Total | 31,209 (49.9%) | 31,348 (50.1%) |
Education in Columbia
School Enrollment in Columbia
The most common levels of schooling among the 42,481 students in Columbia are college / undergraduate (20,948 | 49.3%), high school (5,224 | 12.3%), and elementary school (4,560 | 10.7%).
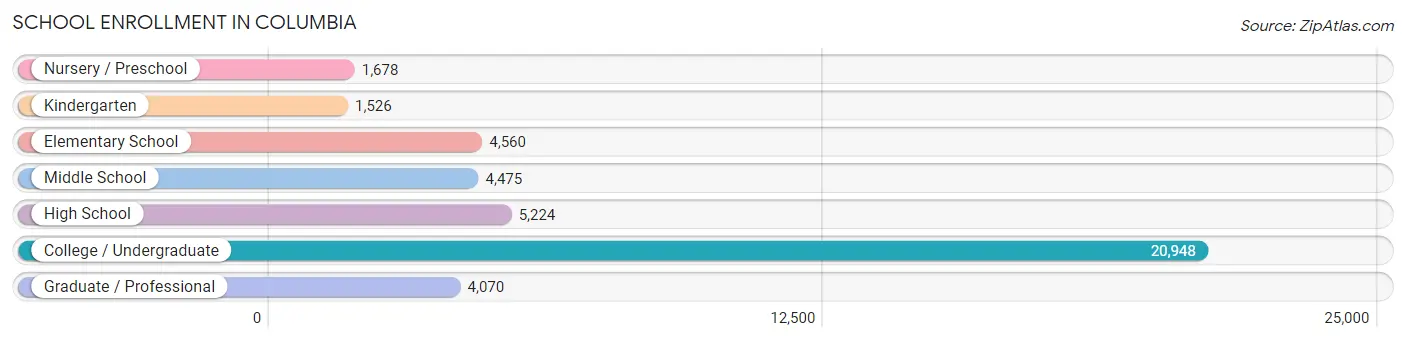
| School Level | # Students | % Students |
| Nursery / Preschool | 1,678 | 4.0% |
| Kindergarten | 1,526 | 3.6% |
| Elementary School | 4,560 | 10.7% |
| Middle School | 4,475 | 10.5% |
| High School | 5,224 | 12.3% |
| College / Undergraduate | 20,948 | 49.3% |
| Graduate / Professional | 4,070 | 9.6% |
| Total | 42,481 | 100.0% |
School Enrollment by Age by Funding Source in Columbia
Out of a total of 42,481 students who are enrolled in schools in Columbia, 5,692 (13.4%) attend a private institution, while the remaining 36,789 (86.6%) are enrolled in public schools. The age group of 3 to 4 year olds has the highest likelihood of being enrolled in private schools, with 707 (52.4% in the age bracket) enrolled. Conversely, the age group of 18 to 19 year olds has the lowest likelihood of being enrolled in a private school, with 8,947 (93.3% in the age bracket) attending a public institution.
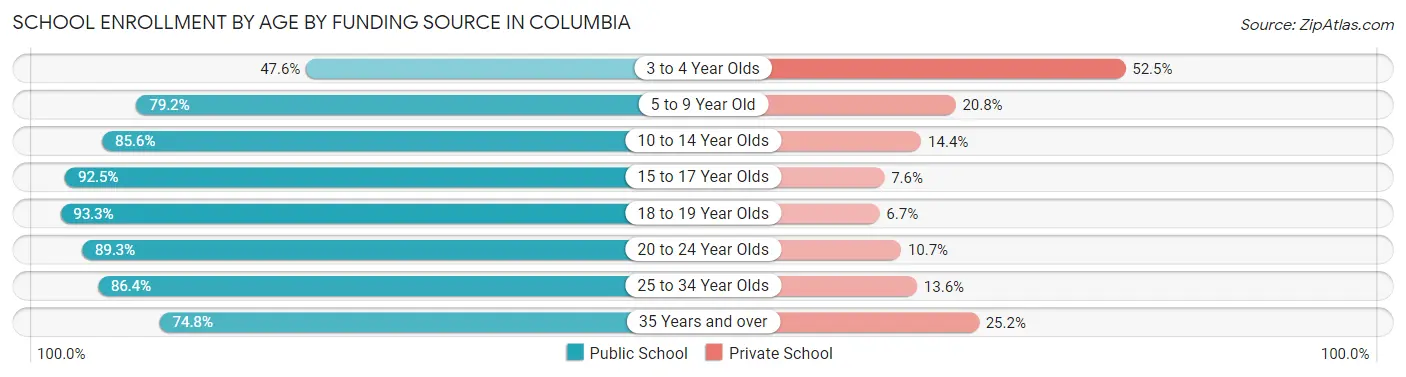
| Age Bracket | Public School | Private School |
| 3 to 4 Year Olds | 641 (47.5%) | 707 (52.4%) |
| 5 to 9 Year Old | 4,640 (79.2%) | 1,220 (20.8%) |
| 10 to 14 Year Olds | 4,773 (85.6%) | 805 (14.4%) |
| 15 to 17 Year Olds | 3,452 (92.4%) | 282 (7.5%) |
| 18 to 19 Year Olds | 8,947 (93.3%) | 638 (6.7%) |
| 20 to 24 Year Olds | 10,451 (89.3%) | 1,248 (10.7%) |
| 25 to 34 Year Olds | 2,975 (86.4%) | 470 (13.6%) |
| 35 Years and over | 922 (74.8%) | 310 (25.2%) |
| Total | 36,789 (86.6%) | 5,692 (13.4%) |
Educational Attainment by Field of Study in Columbia
Business (8,135 | 21.9%), social sciences (3,790 | 10.2%), education (3,359 | 9.0%), bio, nature & agricultural (2,761 | 7.4%), and science & technology (2,481 | 6.7%) are the most common fields of study among 37,111 individuals in Columbia who have obtained a bachelor's degree or higher.
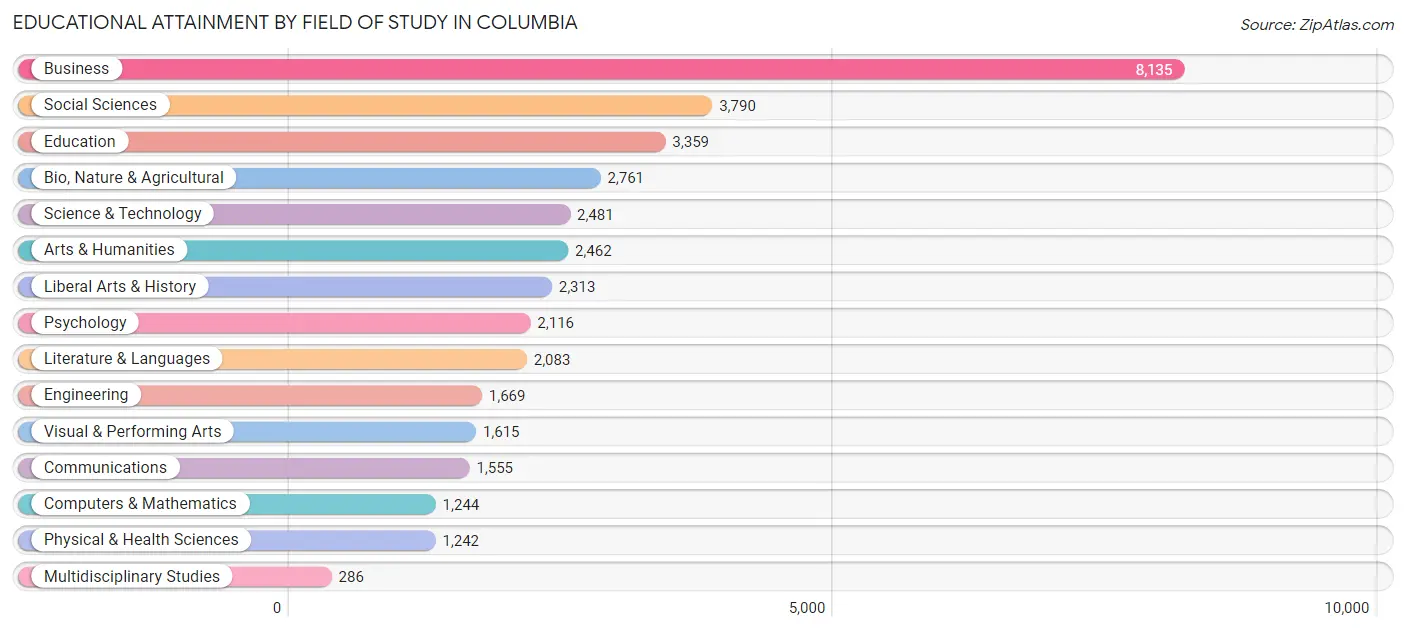
| Field of Study | # Graduates | % Graduates |
| Computers & Mathematics | 1,244 | 3.4% |
| Bio, Nature & Agricultural | 2,761 | 7.4% |
| Physical & Health Sciences | 1,242 | 3.4% |
| Psychology | 2,116 | 5.7% |
| Social Sciences | 3,790 | 10.2% |
| Engineering | 1,669 | 4.5% |
| Multidisciplinary Studies | 286 | 0.8% |
| Science & Technology | 2,481 | 6.7% |
| Business | 8,135 | 21.9% |
| Education | 3,359 | 9.0% |
| Literature & Languages | 2,083 | 5.6% |
| Liberal Arts & History | 2,313 | 6.2% |
| Visual & Performing Arts | 1,615 | 4.3% |
| Communications | 1,555 | 4.2% |
| Arts & Humanities | 2,462 | 6.6% |
| Total | 37,111 | 100.0% |
Transportation & Commute in Columbia
Vehicle Availability by Sex in Columbia
The most prevalent vehicle ownership categories in Columbia are males with 2 vehicles (13,220, accounting for 48.0%) and females with 2 vehicles (11,173, making up 47.2%).
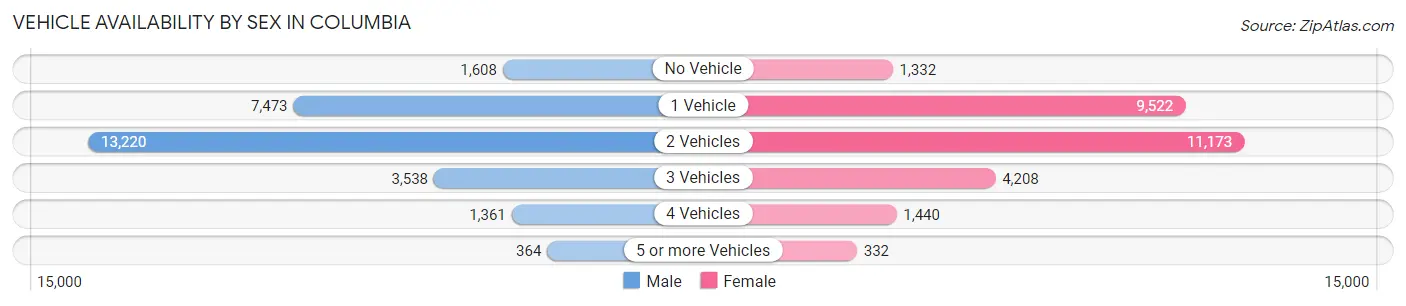
| Vehicles Available | Male | Female |
| No Vehicle | 1,608 (5.8%) | 1,332 (4.8%) |
| 1 Vehicle | 7,473 (27.1%) | 9,522 (34.0%) |
| 2 Vehicles | 13,220 (48.0%) | 11,173 (39.9%) |
| 3 Vehicles | 3,538 (12.8%) | 4,208 (15.0%) |
| 4 Vehicles | 1,361 (4.9%) | 1,440 (5.1%) |
| 5 or more Vehicles | 364 (1.3%) | 332 (1.2%) |
| Total | 27,564 (100.0%) | 28,007 (100.0%) |
Commute Time in Columbia
The most frequently occuring commute durations in Columbia are 15 to 19 minutes (11,602 commuters, 18.4%), 10 to 14 minutes (11,058 commuters, 17.5%), and less than 5 minutes (10,510 commuters, 16.6%).
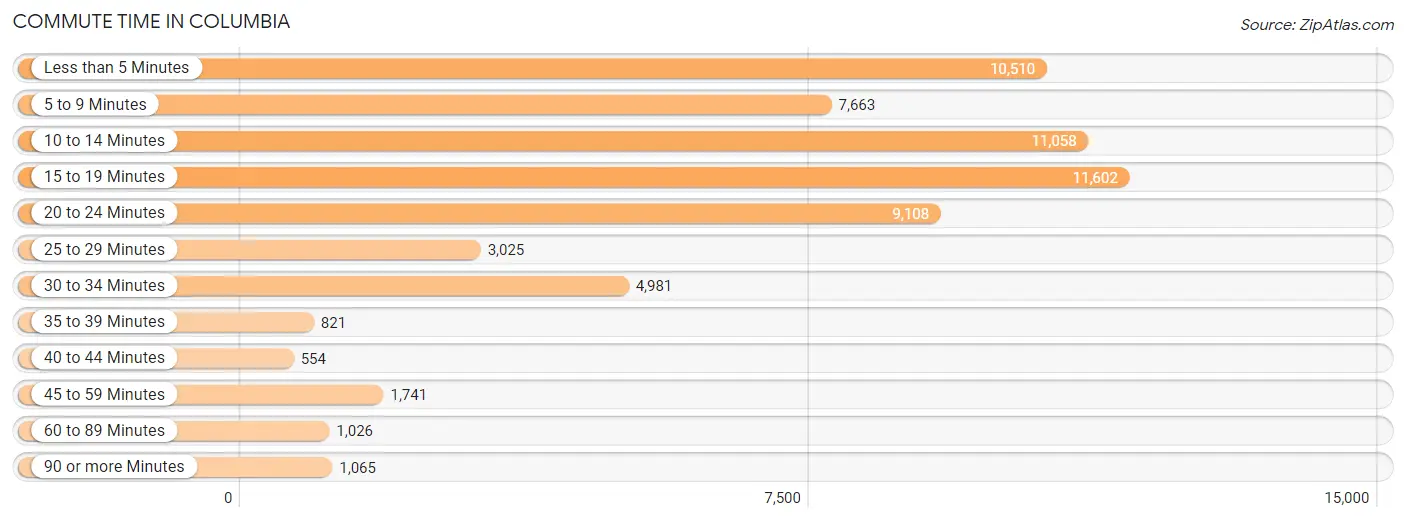
| Commute Time | # Commuters | % Commuters |
| Less than 5 Minutes | 10,510 | 16.6% |
| 5 to 9 Minutes | 7,663 | 12.1% |
| 10 to 14 Minutes | 11,058 | 17.5% |
| 15 to 19 Minutes | 11,602 | 18.4% |
| 20 to 24 Minutes | 9,108 | 14.4% |
| 25 to 29 Minutes | 3,025 | 4.8% |
| 30 to 34 Minutes | 4,981 | 7.9% |
| 35 to 39 Minutes | 821 | 1.3% |
| 40 to 44 Minutes | 554 | 0.9% |
| 45 to 59 Minutes | 1,741 | 2.8% |
| 60 to 89 Minutes | 1,026 | 1.6% |
| 90 or more Minutes | 1,065 | 1.7% |
Commute Time by Sex in Columbia
The most common commute times in Columbia are less than 5 minutes (6,845 commuters, 20.7%) for males and 15 to 19 minutes (6,562 commuters, 21.8%) for females.
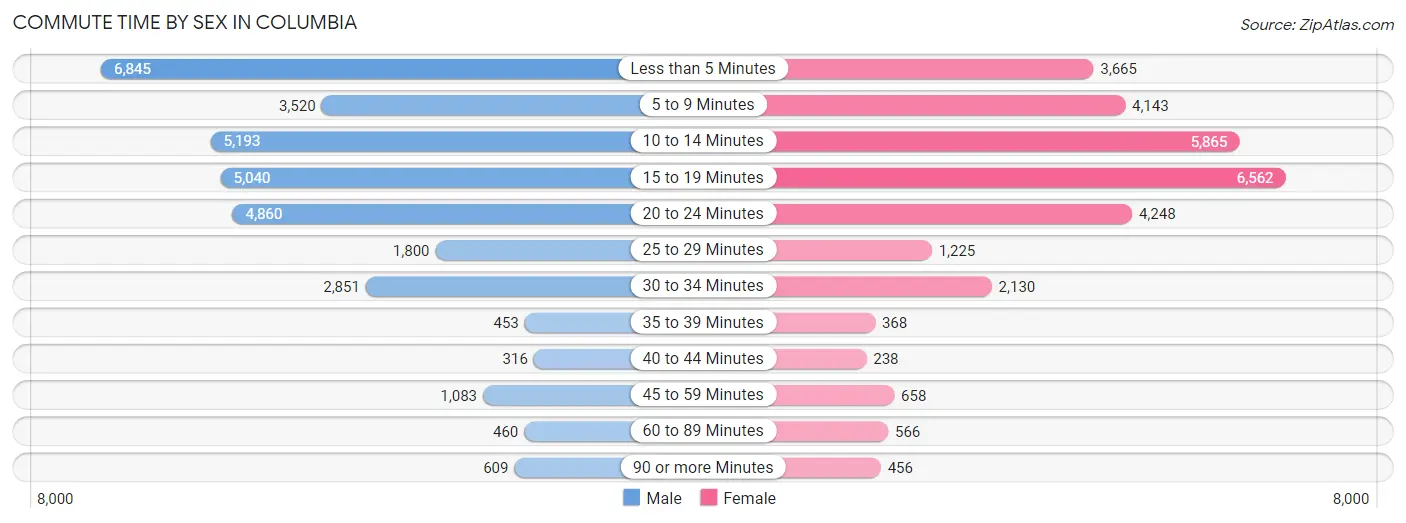
| Commute Time | Male | Female |
| Less than 5 Minutes | 6,845 (20.7%) | 3,665 (12.2%) |
| 5 to 9 Minutes | 3,520 (10.7%) | 4,143 (13.8%) |
| 10 to 14 Minutes | 5,193 (15.7%) | 5,865 (19.5%) |
| 15 to 19 Minutes | 5,040 (15.3%) | 6,562 (21.8%) |
| 20 to 24 Minutes | 4,860 (14.7%) | 4,248 (14.1%) |
| 25 to 29 Minutes | 1,800 (5.4%) | 1,225 (4.1%) |
| 30 to 34 Minutes | 2,851 (8.6%) | 2,130 (7.1%) |
| 35 to 39 Minutes | 453 (1.4%) | 368 (1.2%) |
| 40 to 44 Minutes | 316 (1.0%) | 238 (0.8%) |
| 45 to 59 Minutes | 1,083 (3.3%) | 658 (2.2%) |
| 60 to 89 Minutes | 460 (1.4%) | 566 (1.9%) |
| 90 or more Minutes | 609 (1.8%) | 456 (1.5%) |
Time of Departure to Work by Sex in Columbia
The most frequent times of departure to work in Columbia are 5:00 AM to 5:29 AM (5,642, 17.1%) for males and 8:00 AM to 8:29 AM (4,141, 13.8%) for females.
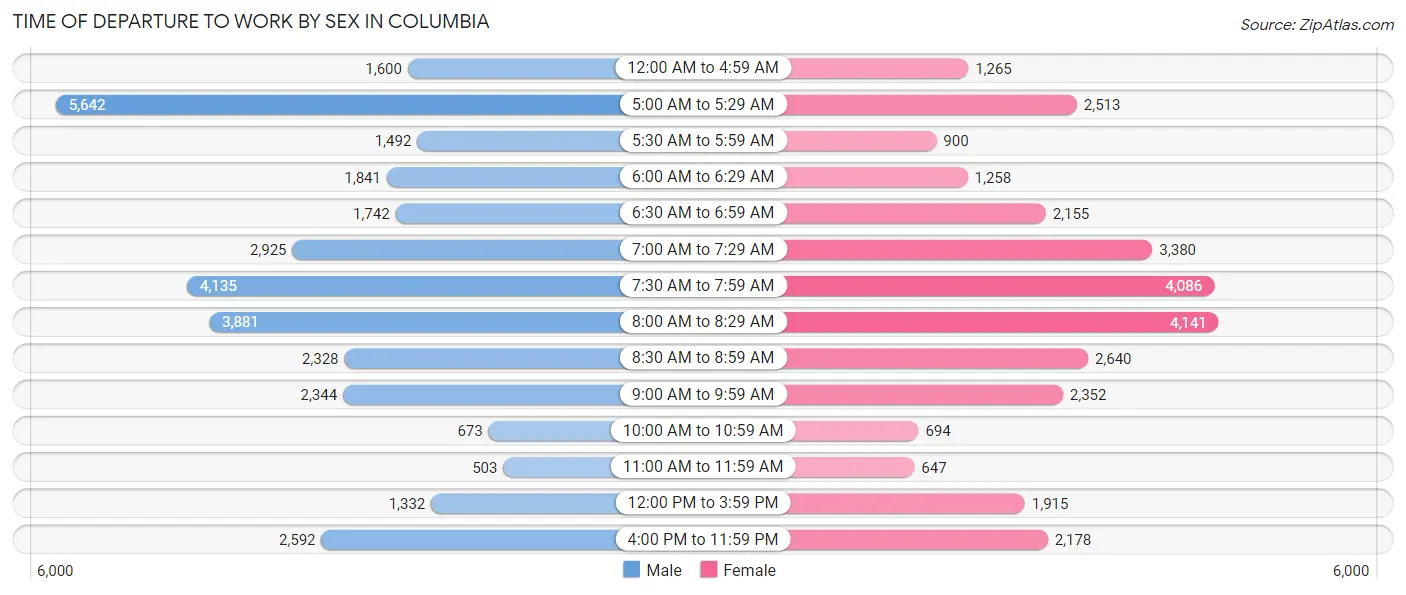
| Time of Departure | Male | Female |
| 12:00 AM to 4:59 AM | 1,600 (4.8%) | 1,265 (4.2%) |
| 5:00 AM to 5:29 AM | 5,642 (17.1%) | 2,513 (8.3%) |
| 5:30 AM to 5:59 AM | 1,492 (4.5%) | 900 (3.0%) |
| 6:00 AM to 6:29 AM | 1,841 (5.6%) | 1,258 (4.2%) |
| 6:30 AM to 6:59 AM | 1,742 (5.3%) | 2,155 (7.1%) |
| 7:00 AM to 7:29 AM | 2,925 (8.9%) | 3,380 (11.2%) |
| 7:30 AM to 7:59 AM | 4,135 (12.5%) | 4,086 (13.6%) |
| 8:00 AM to 8:29 AM | 3,881 (11.7%) | 4,141 (13.8%) |
| 8:30 AM to 8:59 AM | 2,328 (7.0%) | 2,640 (8.8%) |
| 9:00 AM to 9:59 AM | 2,344 (7.1%) | 2,352 (7.8%) |
| 10:00 AM to 10:59 AM | 673 (2.0%) | 694 (2.3%) |
| 11:00 AM to 11:59 AM | 503 (1.5%) | 647 (2.1%) |
| 12:00 PM to 3:59 PM | 1,332 (4.0%) | 1,915 (6.4%) |
| 4:00 PM to 11:59 PM | 2,592 (7.9%) | 2,178 (7.2%) |
| Total | 33,030 (100.0%) | 30,124 (100.0%) |
Housing Occupancy in Columbia
Occupancy by Ownership in Columbia
Of the total 50,223 dwellings in Columbia, owner-occupied units account for 23,612 (47.0%), while renter-occupied units make up 26,611 (53.0%).
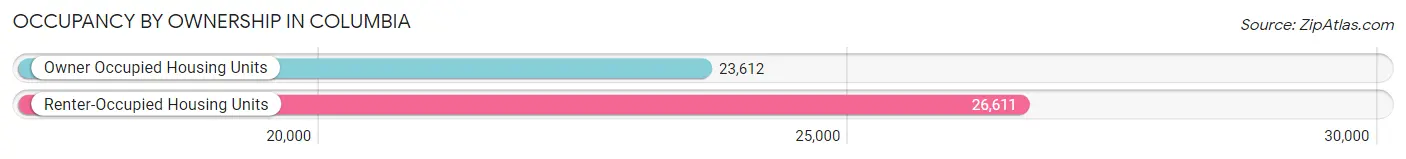
| Occupancy | # Housing Units | % Housing Units |
| Owner Occupied Housing Units | 23,612 | 47.0% |
| Renter-Occupied Housing Units | 26,611 | 53.0% |
| Total Occupied Housing Units | 50,223 | 100.0% |
Occupancy by Household Size in Columbia
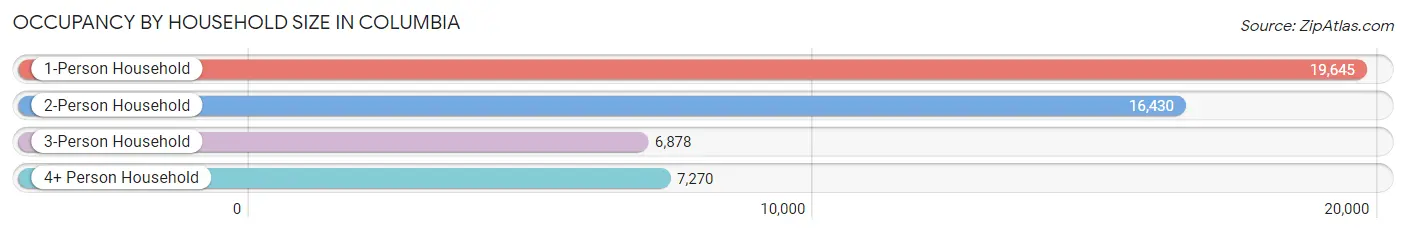
| Household Size | # Housing Units | % Housing Units |
| 1-Person Household | 19,645 | 39.1% |
| 2-Person Household | 16,430 | 32.7% |
| 3-Person Household | 6,878 | 13.7% |
| 4+ Person Household | 7,270 | 14.5% |
| Total Housing Units | 50,223 | 100.0% |
Occupancy by Ownership by Household Size in Columbia
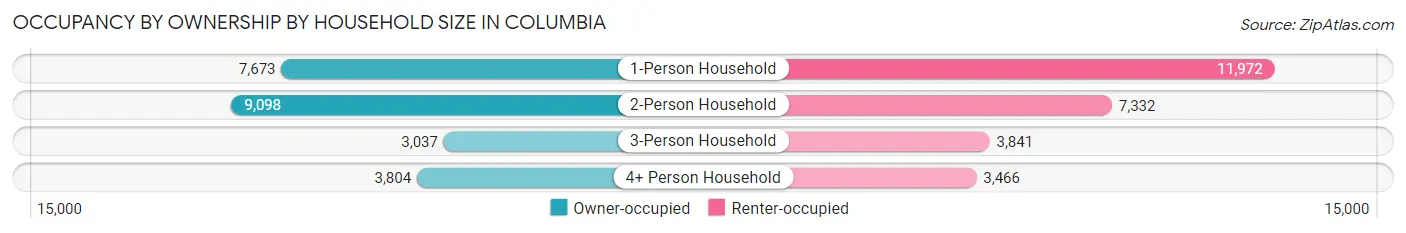
| Household Size | Owner-occupied | Renter-occupied |
| 1-Person Household | 7,673 (39.1%) | 11,972 (60.9%) |
| 2-Person Household | 9,098 (55.4%) | 7,332 (44.6%) |
| 3-Person Household | 3,037 (44.2%) | 3,841 (55.8%) |
| 4+ Person Household | 3,804 (52.3%) | 3,466 (47.7%) |
| Total Housing Units | 23,612 (47.0%) | 26,611 (53.0%) |
Occupancy by Educational Attainment in Columbia
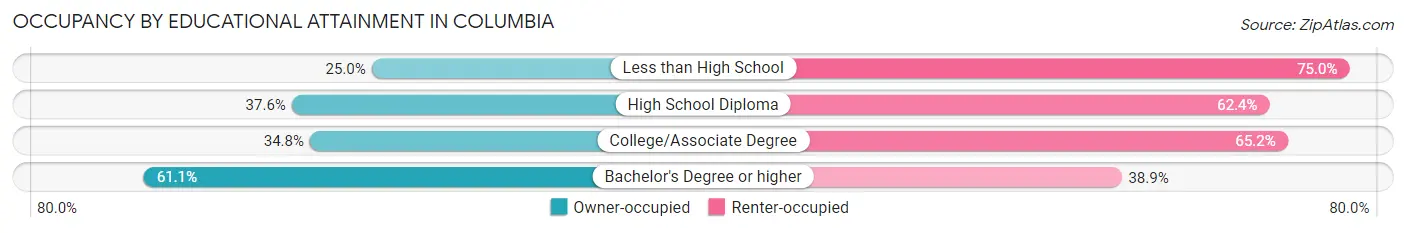
| Household Size | Owner-occupied | Renter-occupied |
| Less than High School | 721 (25.0%) | 2,166 (75.0%) |
| High School Diploma | 2,744 (37.6%) | 4,546 (62.4%) |
| College/Associate Degree | 5,699 (34.8%) | 10,695 (65.2%) |
| Bachelor's Degree or higher | 14,448 (61.1%) | 9,204 (38.9%) |
Occupancy by Age of Householder in Columbia
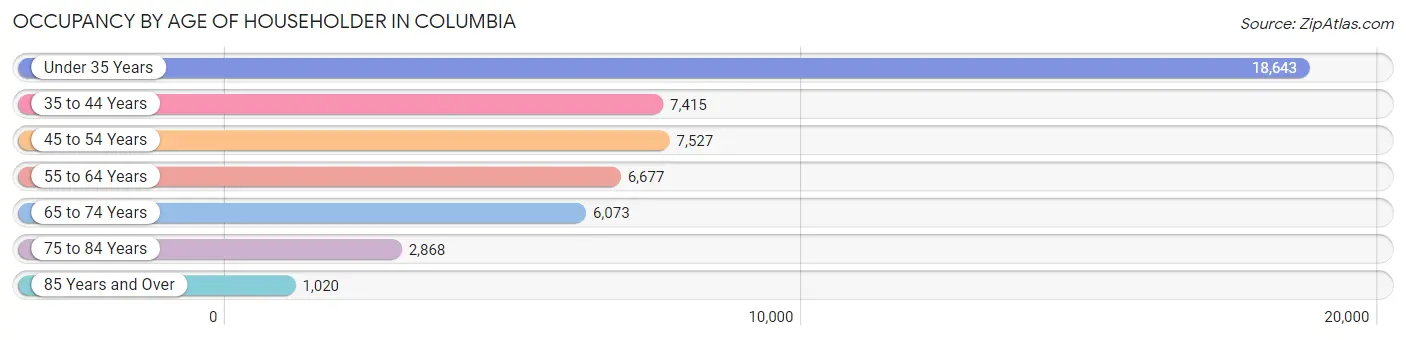
| Age Bracket | # Households | % Households |
| Under 35 Years | 18,643 | 37.1% |
| 35 to 44 Years | 7,415 | 14.8% |
| 45 to 54 Years | 7,527 | 15.0% |
| 55 to 64 Years | 6,677 | 13.3% |
| 65 to 74 Years | 6,073 | 12.1% |
| 75 to 84 Years | 2,868 | 5.7% |
| 85 Years and Over | 1,020 | 2.0% |
| Total | 50,223 | 100.0% |
Housing Finances in Columbia
Median Income by Occupancy in Columbia
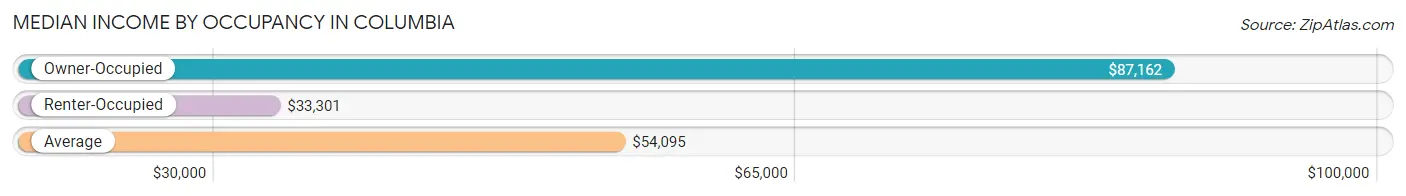
| Occupancy Type | # Households | Median Income |
| Owner-Occupied | 23,612 (47.0%) | $87,162 |
| Renter-Occupied | 26,611 (53.0%) | $33,301 |
| Average | 50,223 (100.0%) | $54,095 |
Occupancy by Householder Income Bracket in Columbia
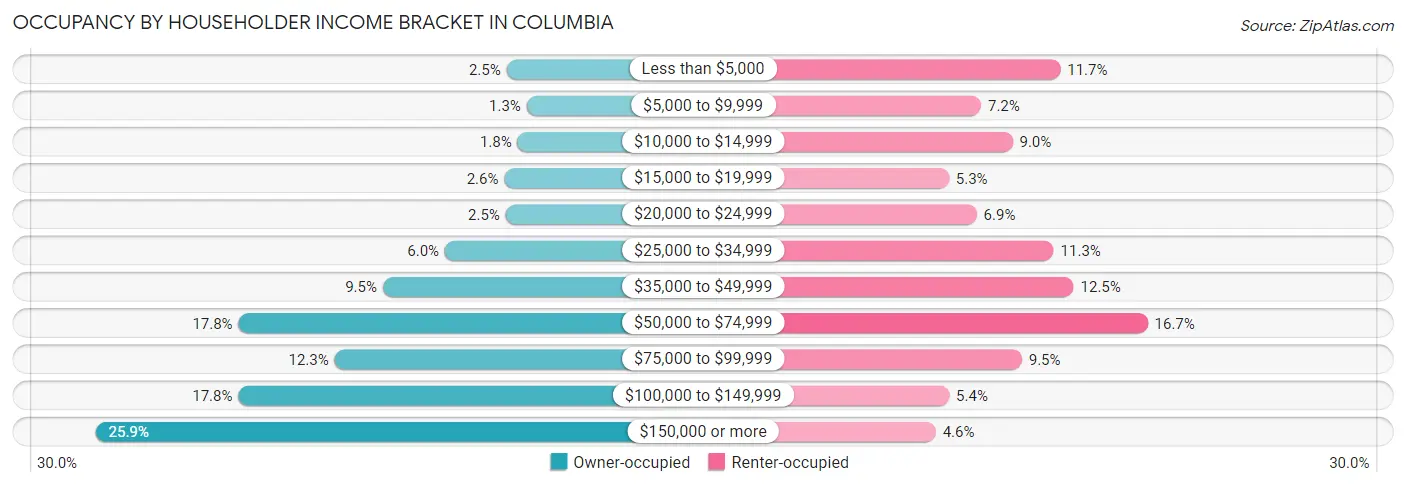
| Income Bracket | Owner-occupied | Renter-occupied |
| Less than $5,000 | 581 (2.5%) | 3,113 (11.7%) |
| $5,000 to $9,999 | 310 (1.3%) | 1,909 (7.2%) |
| $10,000 to $14,999 | 431 (1.8%) | 2,387 (9.0%) |
| $15,000 to $19,999 | 612 (2.6%) | 1,418 (5.3%) |
| $20,000 to $24,999 | 592 (2.5%) | 1,842 (6.9%) |
| $25,000 to $34,999 | 1,411 (6.0%) | 3,013 (11.3%) |
| $35,000 to $49,999 | 2,250 (9.5%) | 3,316 (12.5%) |
| $50,000 to $74,999 | 4,199 (17.8%) | 4,441 (16.7%) |
| $75,000 to $99,999 | 2,901 (12.3%) | 2,529 (9.5%) |
| $100,000 to $149,999 | 4,200 (17.8%) | 1,423 (5.3%) |
| $150,000 or more | 6,125 (25.9%) | 1,220 (4.6%) |
| Total | 23,612 (100.0%) | 26,611 (100.0%) |
Monthly Housing Cost Tiers in Columbia
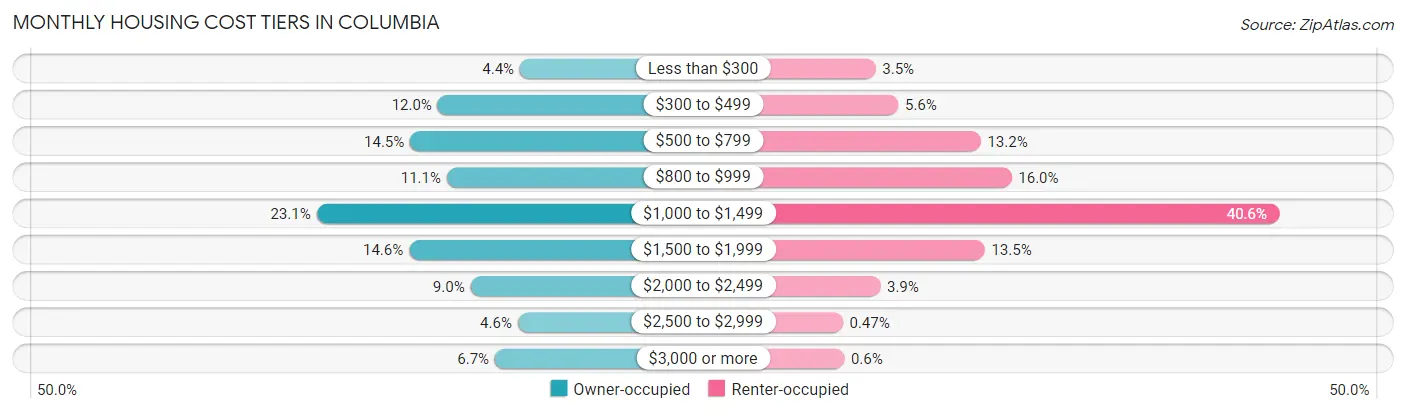
| Monthly Cost | Owner-occupied | Renter-occupied |
| Less than $300 | 1,040 (4.4%) | 930 (3.5%) |
| $300 to $499 | 2,827 (12.0%) | 1,485 (5.6%) |
| $500 to $799 | 3,425 (14.5%) | 3,505 (13.2%) |
| $800 to $999 | 2,628 (11.1%) | 4,261 (16.0%) |
| $1,000 to $1,499 | 5,461 (23.1%) | 10,812 (40.6%) |
| $1,500 to $1,999 | 3,449 (14.6%) | 3,602 (13.5%) |
| $2,000 to $2,499 | 2,113 (8.9%) | 1,042 (3.9%) |
| $2,500 to $2,999 | 1,086 (4.6%) | 126 (0.5%) |
| $3,000 or more | 1,583 (6.7%) | 159 (0.6%) |
| Total | 23,612 (100.0%) | 26,611 (100.0%) |
Physical Housing Characteristics in Columbia
Housing Structures in Columbia
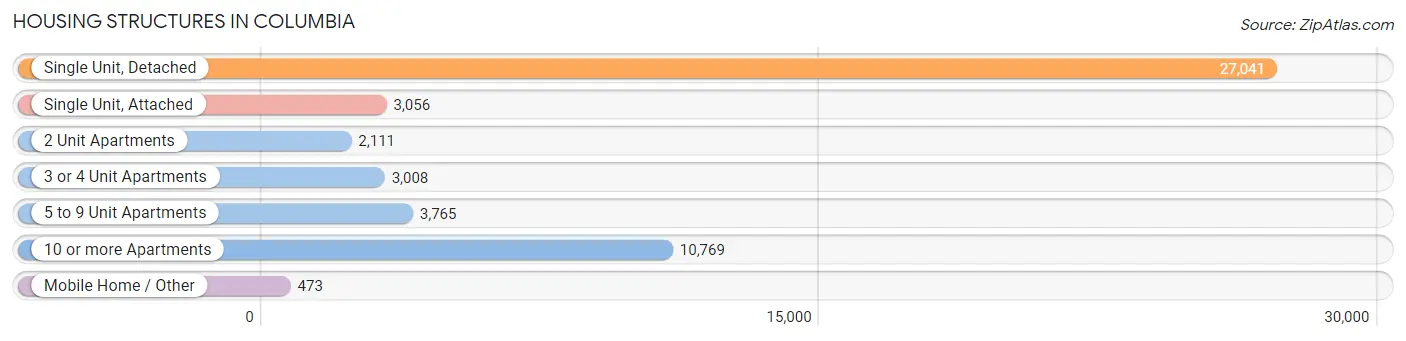
| Structure Type | # Housing Units | % Housing Units |
| Single Unit, Detached | 27,041 | 53.8% |
| Single Unit, Attached | 3,056 | 6.1% |
| 2 Unit Apartments | 2,111 | 4.2% |
| 3 or 4 Unit Apartments | 3,008 | 6.0% |
| 5 to 9 Unit Apartments | 3,765 | 7.5% |
| 10 or more Apartments | 10,769 | 21.4% |
| Mobile Home / Other | 473 | 0.9% |
| Total | 50,223 | 100.0% |
Housing Structures by Occupancy in Columbia
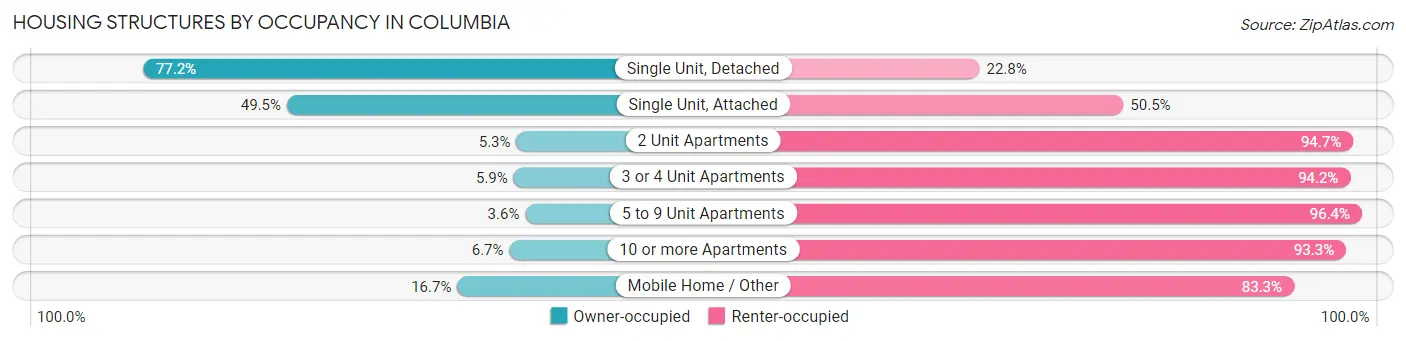
| Structure Type | Owner-occupied | Renter-occupied |
| Single Unit, Detached | 20,879 (77.2%) | 6,162 (22.8%) |
| Single Unit, Attached | 1,513 (49.5%) | 1,543 (50.5%) |
| 2 Unit Apartments | 112 (5.3%) | 1,999 (94.7%) |
| 3 or 4 Unit Apartments | 176 (5.9%) | 2,832 (94.2%) |
| 5 to 9 Unit Apartments | 136 (3.6%) | 3,629 (96.4%) |
| 10 or more Apartments | 717 (6.7%) | 10,052 (93.3%) |
| Mobile Home / Other | 79 (16.7%) | 394 (83.3%) |
| Total | 23,612 (47.0%) | 26,611 (53.0%) |
Housing Structures by Number of Rooms in Columbia
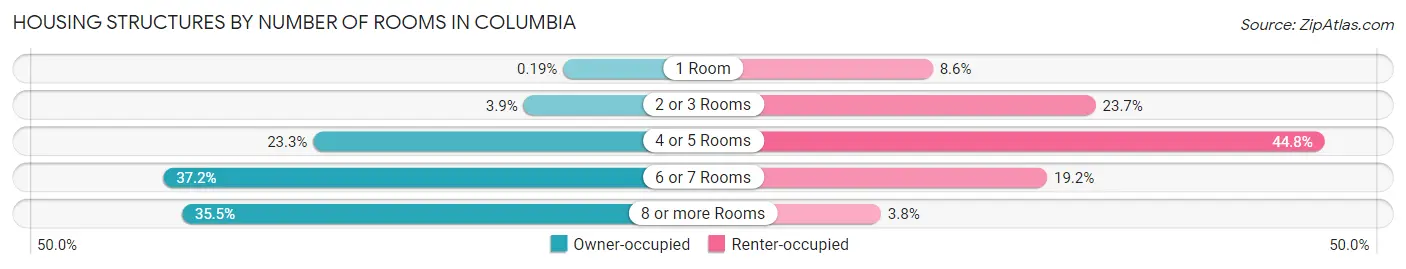
| Number of Rooms | Owner-occupied | Renter-occupied |
| 1 Room | 45 (0.2%) | 2,283 (8.6%) |
| 2 or 3 Rooms | 911 (3.9%) | 6,294 (23.6%) |
| 4 or 5 Rooms | 5,504 (23.3%) | 11,927 (44.8%) |
| 6 or 7 Rooms | 8,780 (37.2%) | 5,098 (19.2%) |
| 8 or more Rooms | 8,372 (35.5%) | 1,009 (3.8%) |
| Total | 23,612 (100.0%) | 26,611 (100.0%) |
Housing Structure by Heating Type in Columbia
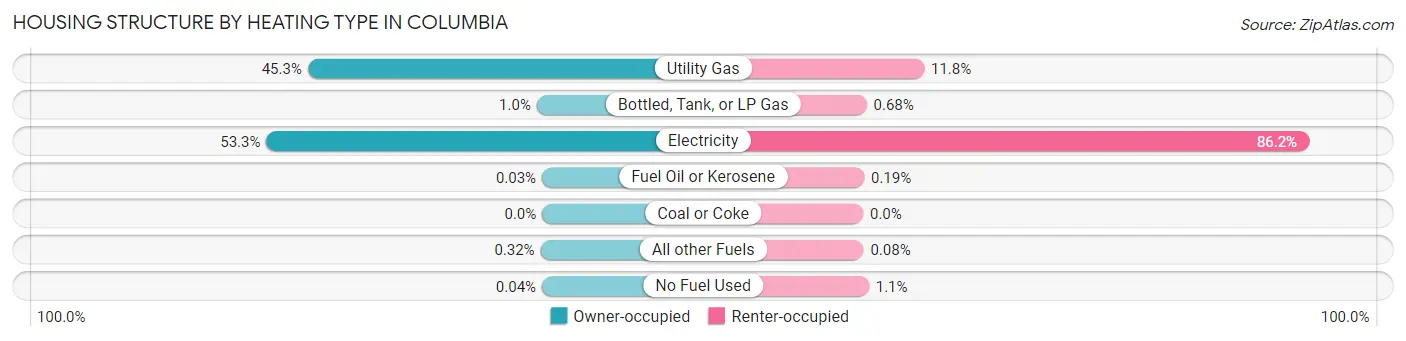
| Heating Type | Owner-occupied | Renter-occupied |
| Utility Gas | 10,693 (45.3%) | 3,135 (11.8%) |
| Bottled, Tank, or LP Gas | 245 (1.0%) | 181 (0.7%) |
| Electricity | 12,582 (53.3%) | 22,928 (86.2%) |
| Fuel Oil or Kerosene | 7 (0.0%) | 51 (0.2%) |
| Coal or Coke | 0 (0.0%) | 0 (0.0%) |
| All other Fuels | 75 (0.3%) | 20 (0.1%) |
| No Fuel Used | 10 (0.0%) | 296 (1.1%) |
| Total | 23,612 (100.0%) | 26,611 (100.0%) |
Household Vehicle Usage in Columbia
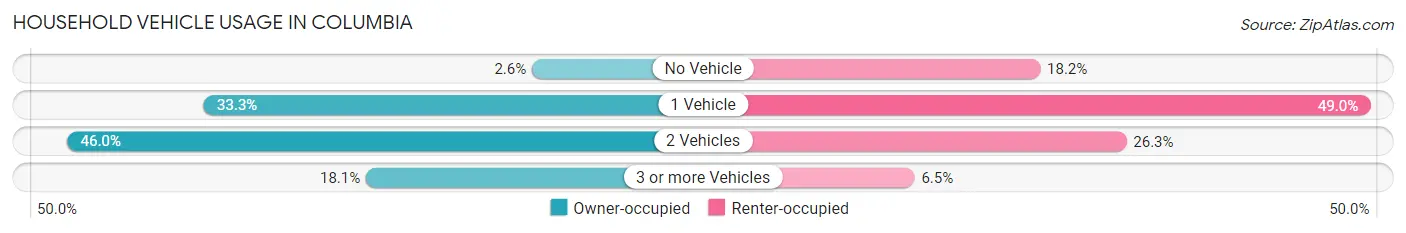
| Vehicles per Household | Owner-occupied | Renter-occupied |
| No Vehicle | 621 (2.6%) | 4,849 (18.2%) |
| 1 Vehicle | 7,854 (33.3%) | 13,045 (49.0%) |
| 2 Vehicles | 10,857 (46.0%) | 6,991 (26.3%) |
| 3 or more Vehicles | 4,280 (18.1%) | 1,726 (6.5%) |
| Total | 23,612 (100.0%) | 26,611 (100.0%) |
Real Estate & Mortgages in Columbia
Real Estate and Mortgage Overview in Columbia
| Characteristic | Without Mortgage | With Mortgage |
| Housing Units | 7,386 | 16,226 |
| Median Property Value | $199,300 | $236,500 |
| Median Household Income | $61,410 | $4,476 |
| Monthly Housing Costs | $500 | $1,575 |
| Real Estate Taxes | $1,290 | $573 |
Property Value by Mortgage Status in Columbia
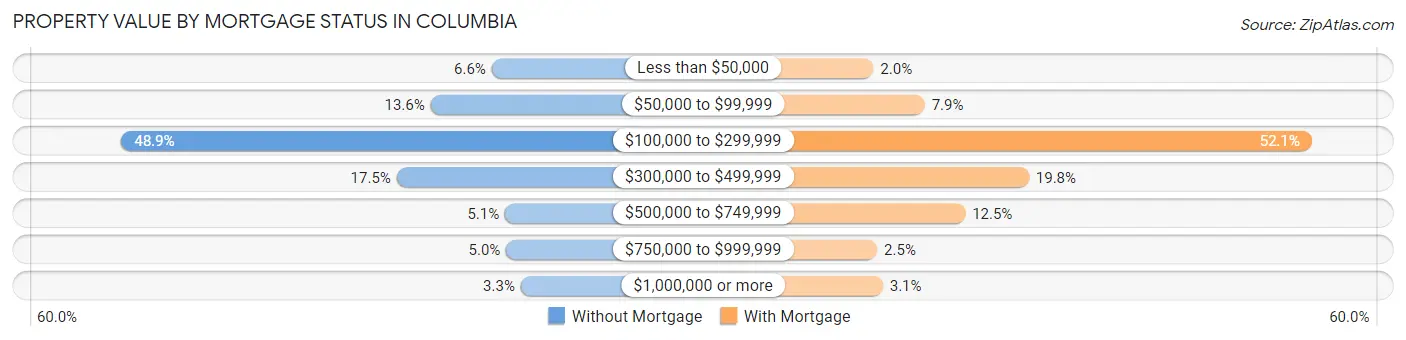
| Property Value | Without Mortgage | With Mortgage |
| Less than $50,000 | 489 (6.6%) | 331 (2.0%) |
| $50,000 to $99,999 | 1,005 (13.6%) | 1,284 (7.9%) |
| $100,000 to $299,999 | 3,615 (48.9%) | 8,460 (52.1%) |
| $300,000 to $499,999 | 1,291 (17.5%) | 3,214 (19.8%) |
| $500,000 to $749,999 | 376 (5.1%) | 2,033 (12.5%) |
| $750,000 to $999,999 | 366 (5.0%) | 400 (2.5%) |
| $1,000,000 or more | 244 (3.3%) | 504 (3.1%) |
| Total | 7,386 (100.0%) | 16,226 (100.0%) |
Household Income by Mortgage Status in Columbia
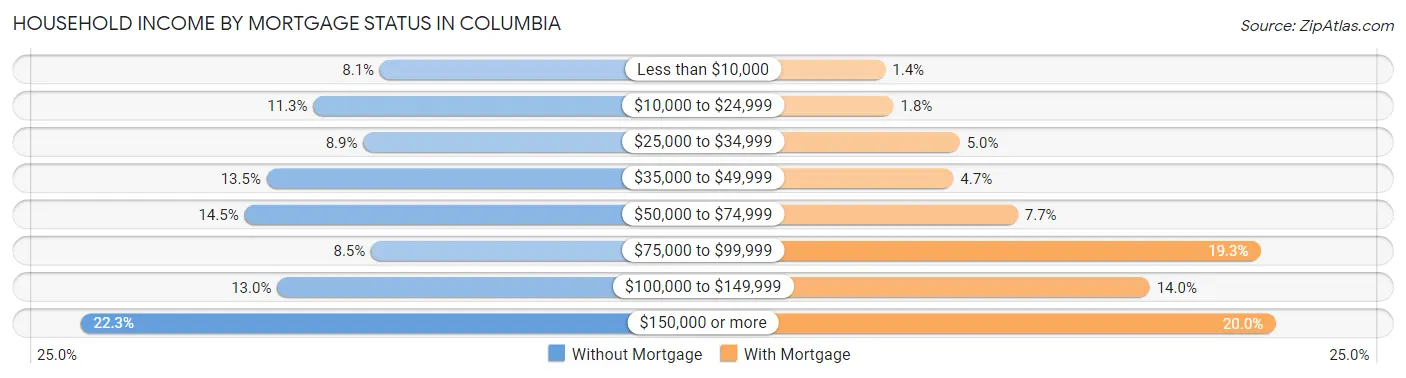
| Household Income | Without Mortgage | With Mortgage |
| Less than $10,000 | 597 (8.1%) | 231 (1.4%) |
| $10,000 to $24,999 | 831 (11.3%) | 294 (1.8%) |
| $25,000 to $34,999 | 655 (8.9%) | 804 (5.0%) |
| $35,000 to $49,999 | 995 (13.5%) | 756 (4.7%) |
| $50,000 to $74,999 | 1,073 (14.5%) | 1,255 (7.7%) |
| $75,000 to $99,999 | 628 (8.5%) | 3,126 (19.3%) |
| $100,000 to $149,999 | 958 (13.0%) | 2,273 (14.0%) |
| $150,000 or more | 1,649 (22.3%) | 3,242 (20.0%) |
| Total | 7,386 (100.0%) | 16,226 (100.0%) |
Property Value to Household Income Ratio in Columbia
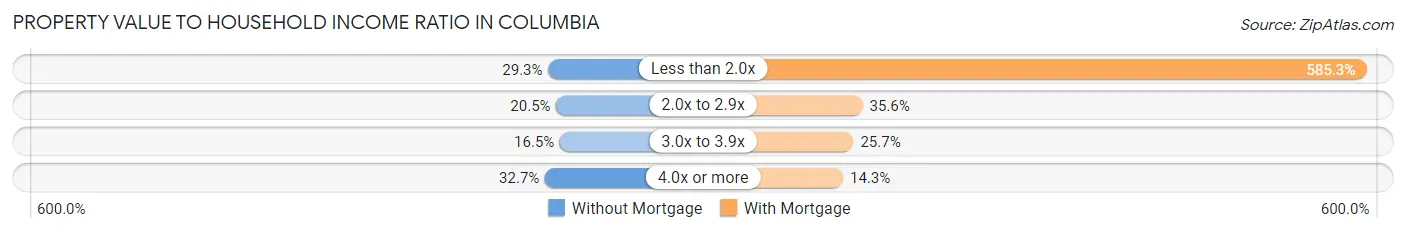
| Value-to-Income Ratio | Without Mortgage | With Mortgage |
| Less than 2.0x | 2,161 (29.3%) | 94,964 (585.3%) |
| 2.0x to 2.9x | 1,514 (20.5%) | 5,776 (35.6%) |
| 3.0x to 3.9x | 1,215 (16.5%) | 4,166 (25.7%) |
| 4.0x or more | 2,418 (32.7%) | 2,316 (14.3%) |
| Total | 7,386 (100.0%) | 16,226 (100.0%) |
Real Estate Taxes by Mortgage Status in Columbia
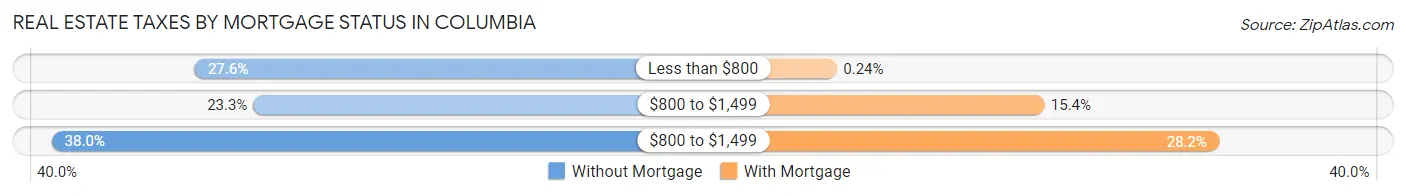
| Property Taxes | Without Mortgage | With Mortgage |
| Less than $800 | 2,035 (27.6%) | 39 (0.2%) |
| $800 to $1,499 | 1,721 (23.3%) | 2,498 (15.4%) |
| $800 to $1,499 | 2,808 (38.0%) | 4,572 (28.2%) |
| Total | 7,386 (100.0%) | 16,226 (100.0%) |
Health & Disability in Columbia
Health Insurance Coverage by Age in Columbia
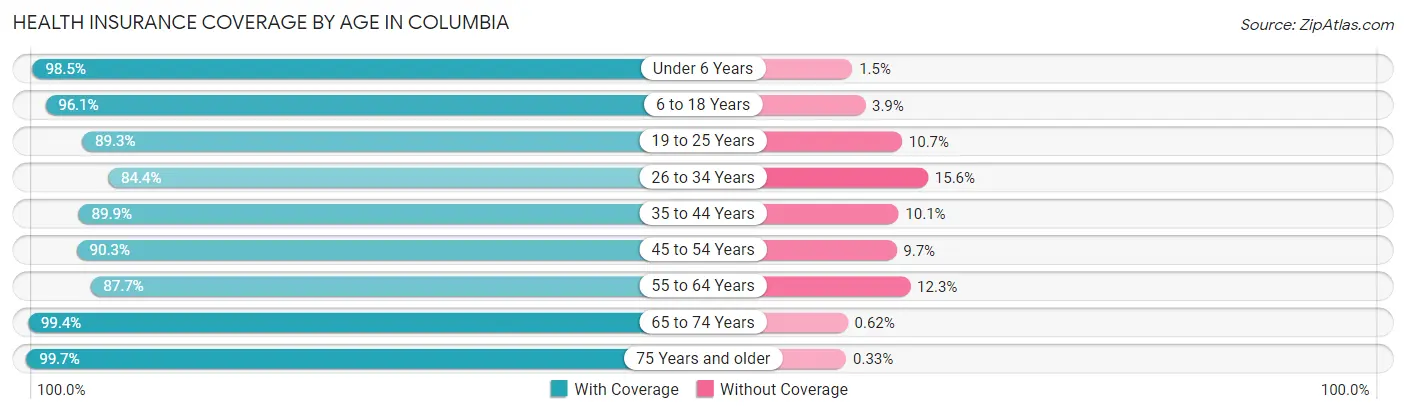
| Age Bracket | With Coverage | Without Coverage |
| Under 6 Years | 8,477 (98.5%) | 127 (1.5%) |
| 6 to 18 Years | 19,278 (96.1%) | 776 (3.9%) |
| 19 to 25 Years | 21,403 (89.3%) | 2,572 (10.7%) |
| 26 to 34 Years | 14,775 (84.4%) | 2,726 (15.6%) |
| 35 to 44 Years | 10,866 (89.9%) | 1,220 (10.1%) |
| 45 to 54 Years | 11,177 (90.3%) | 1,201 (9.7%) |
| 55 to 64 Years | 9,557 (87.7%) | 1,338 (12.3%) |
| 65 to 74 Years | 8,536 (99.4%) | 53 (0.6%) |
| 75 Years and older | 5,189 (99.7%) | 17 (0.3%) |
| Total | 109,258 (91.6%) | 10,030 (8.4%) |
Health Insurance Coverage by Citizenship Status in Columbia
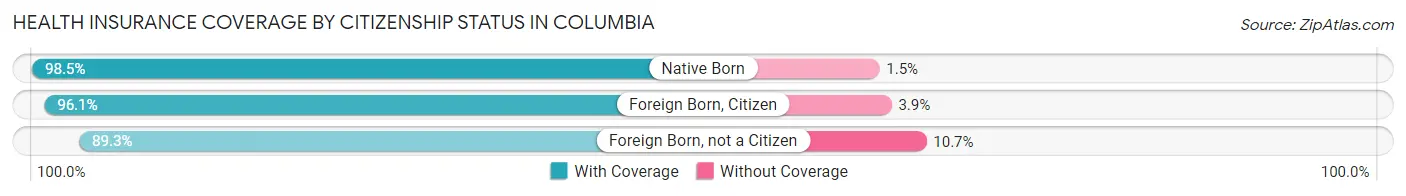
| Citizenship Status | With Coverage | Without Coverage |
| Native Born | 8,477 (98.5%) | 127 (1.5%) |
| Foreign Born, Citizen | 19,278 (96.1%) | 776 (3.9%) |
| Foreign Born, not a Citizen | 21,403 (89.3%) | 2,572 (10.7%) |
Health Insurance Coverage by Household Income in Columbia
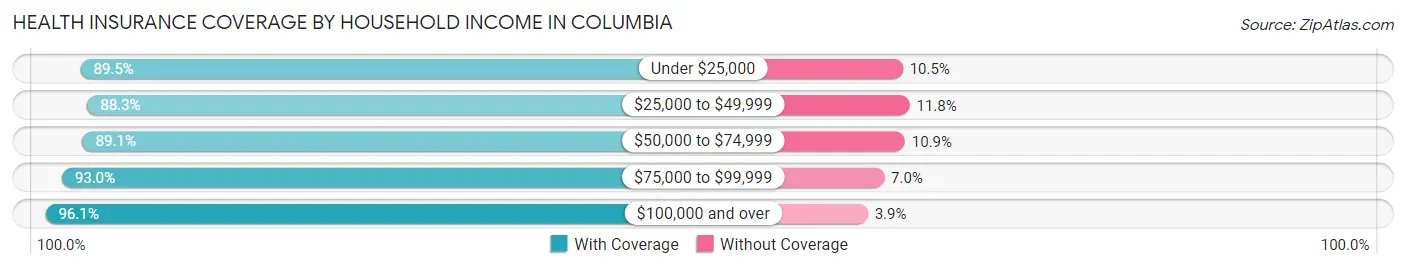
| Household Income | With Coverage | Without Coverage |
| Under $25,000 | 21,450 (89.5%) | 2,508 (10.5%) |
| $25,000 to $49,999 | 17,118 (88.2%) | 2,279 (11.7%) |
| $50,000 to $74,999 | 16,398 (89.1%) | 2,001 (10.9%) |
| $75,000 to $99,999 | 11,325 (93.0%) | 851 (7.0%) |
| $100,000 and over | 32,984 (96.1%) | 1,346 (3.9%) |
Public vs Private Health Insurance Coverage by Age in Columbia
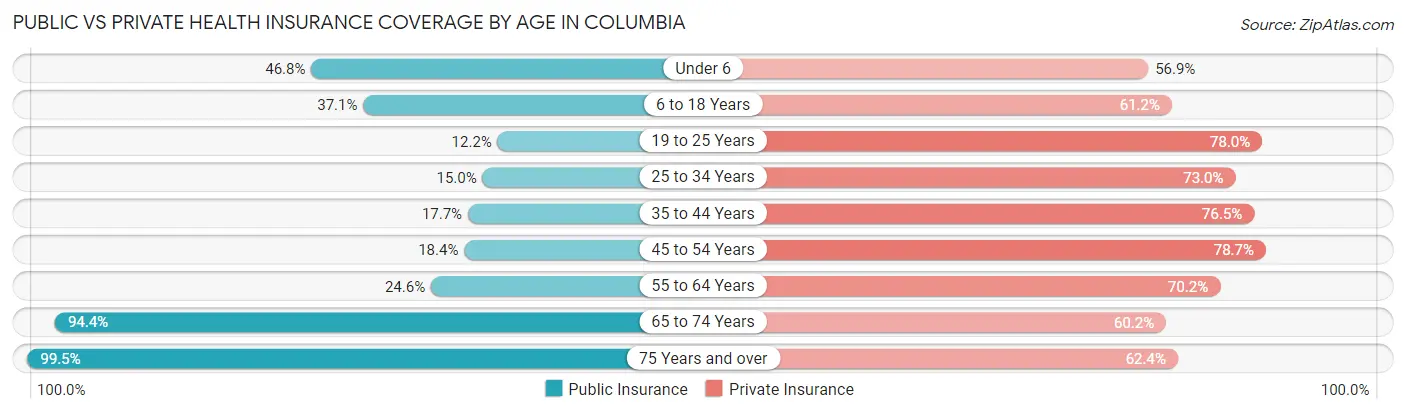
| Age Bracket | Public Insurance | Private Insurance |
| Under 6 | 4,026 (46.8%) | 4,893 (56.9%) |
| 6 to 18 Years | 7,446 (37.1%) | 12,281 (61.2%) |
| 19 to 25 Years | 2,922 (12.2%) | 18,702 (78.0%) |
| 25 to 34 Years | 2,626 (15.0%) | 12,783 (73.0%) |
| 35 to 44 Years | 2,140 (17.7%) | 9,249 (76.5%) |
| 45 to 54 Years | 2,277 (18.4%) | 9,742 (78.7%) |
| 55 to 64 Years | 2,677 (24.6%) | 7,649 (70.2%) |
| 65 to 74 Years | 8,105 (94.4%) | 5,169 (60.2%) |
| 75 Years and over | 5,179 (99.5%) | 3,246 (62.4%) |
| Total | 37,398 (31.4%) | 83,714 (70.2%) |
Disability Status by Sex by Age in Columbia
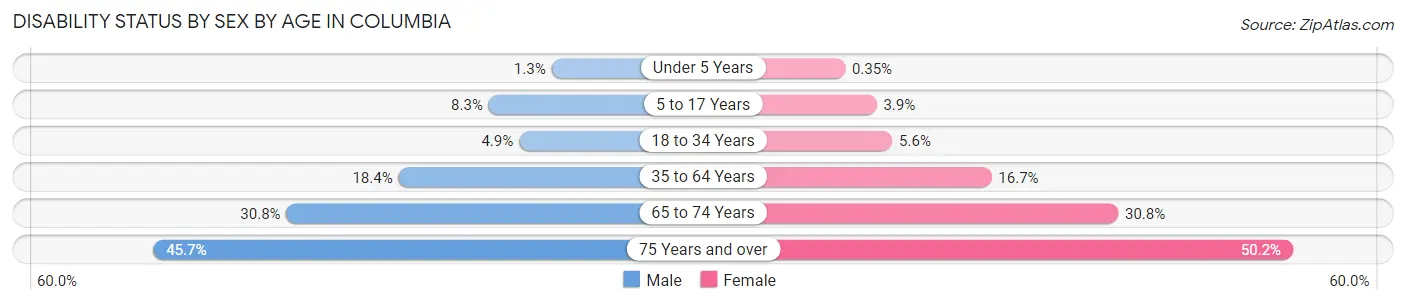
| Age Bracket | Male | Female |
| Under 5 Years | 50 (1.3%) | 12 (0.4%) |
| 5 to 17 Years | 626 (8.3%) | 310 (3.9%) |
| 18 to 34 Years | 1,090 (4.9%) | 1,416 (5.6%) |
| 35 to 64 Years | 3,065 (18.4%) | 3,109 (16.7%) |
| 65 to 74 Years | 1,280 (30.8%) | 1,366 (30.8%) |
| 75 Years and over | 854 (45.7%) | 1,676 (50.2%) |
Disability Class by Sex by Age in Columbia
Disability Class: Hearing Difficulty
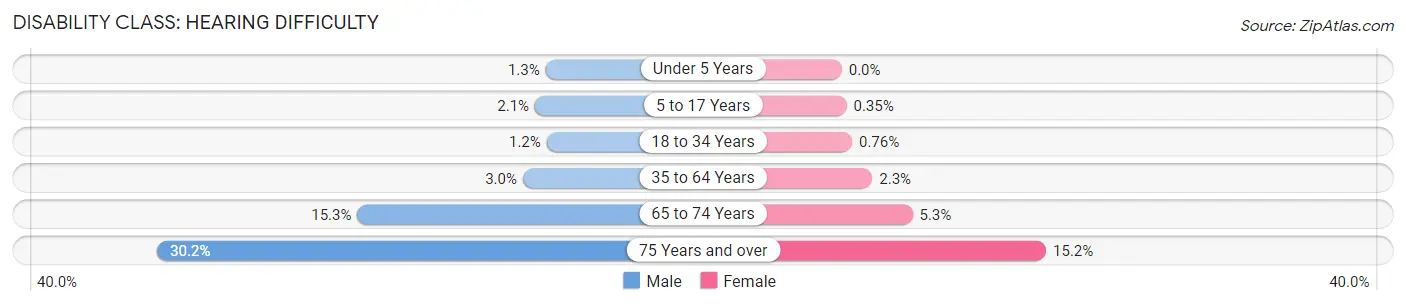
| Age Bracket | Male | Female |
| Under 5 Years | 50 (1.3%) | 0 (0.0%) |
| 5 to 17 Years | 159 (2.1%) | 28 (0.4%) |
| 18 to 34 Years | 273 (1.2%) | 193 (0.8%) |
| 35 to 64 Years | 503 (3.0%) | 423 (2.3%) |
| 65 to 74 Years | 635 (15.3%) | 233 (5.2%) |
| 75 Years and over | 564 (30.2%) | 506 (15.2%) |
Disability Class: Vision Difficulty
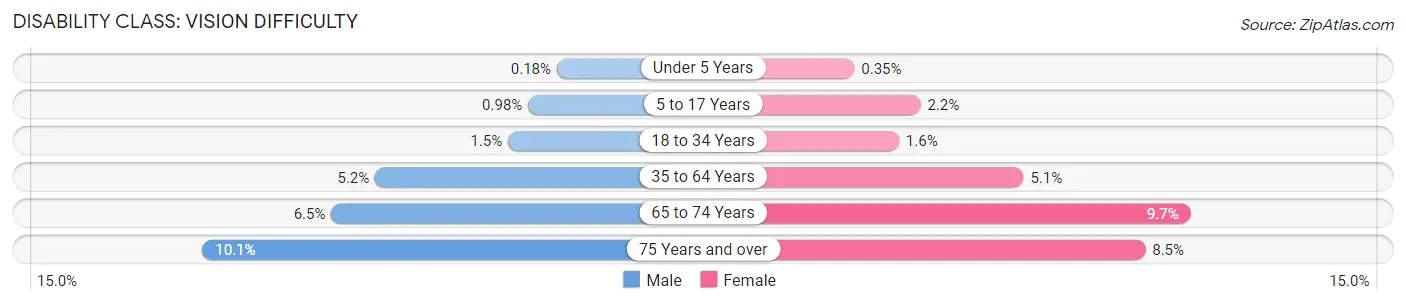
| Age Bracket | Male | Female |
| Under 5 Years | 7 (0.2%) | 12 (0.4%) |
| 5 to 17 Years | 74 (1.0%) | 176 (2.2%) |
| 18 to 34 Years | 341 (1.5%) | 402 (1.6%) |
| 35 to 64 Years | 874 (5.2%) | 944 (5.1%) |
| 65 to 74 Years | 268 (6.5%) | 431 (9.7%) |
| 75 Years and over | 188 (10.1%) | 282 (8.5%) |
Disability Class: Cognitive Difficulty
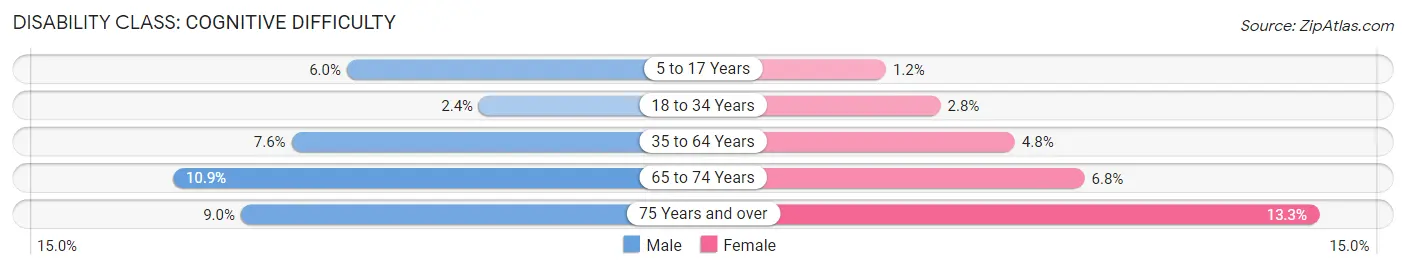
| Age Bracket | Male | Female |
| 5 to 17 Years | 454 (6.0%) | 99 (1.2%) |
| 18 to 34 Years | 519 (2.4%) | 694 (2.8%) |
| 35 to 64 Years | 1,263 (7.6%) | 899 (4.8%) |
| 65 to 74 Years | 451 (10.9%) | 300 (6.8%) |
| 75 Years and over | 168 (9.0%) | 443 (13.3%) |
Disability Class: Ambulatory Difficulty
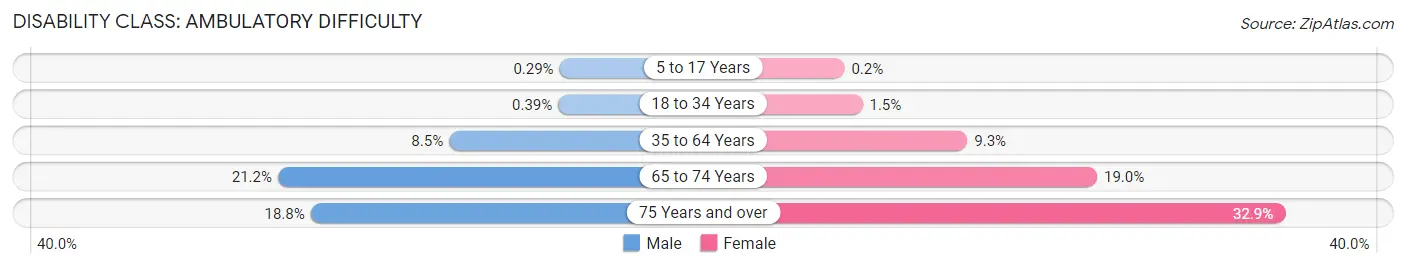
| Age Bracket | Male | Female |
| 5 to 17 Years | 22 (0.3%) | 16 (0.2%) |
| 18 to 34 Years | 87 (0.4%) | 388 (1.5%) |
| 35 to 64 Years | 1,417 (8.5%) | 1,739 (9.3%) |
| 65 to 74 Years | 880 (21.2%) | 841 (19.0%) |
| 75 Years and over | 351 (18.8%) | 1,098 (32.9%) |
Disability Class: Self-Care Difficulty
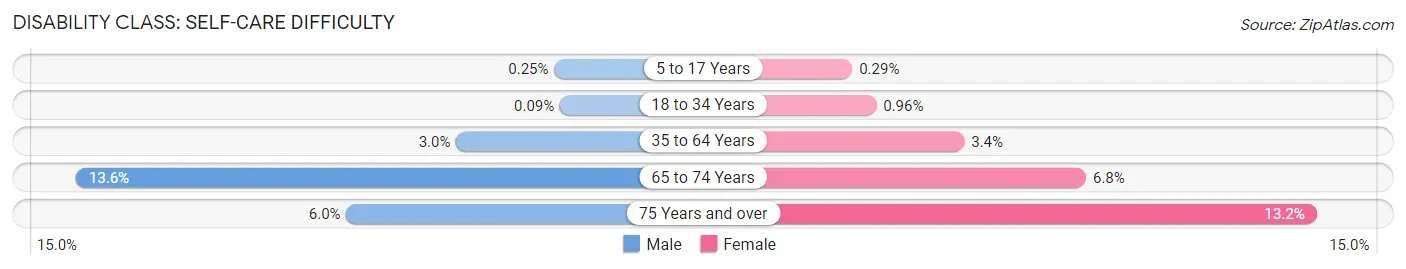
| Age Bracket | Male | Female |
| 5 to 17 Years | 19 (0.3%) | 23 (0.3%) |
| 18 to 34 Years | 19 (0.1%) | 242 (1.0%) |
| 35 to 64 Years | 498 (3.0%) | 637 (3.4%) |
| 65 to 74 Years | 563 (13.6%) | 302 (6.8%) |
| 75 Years and over | 113 (6.0%) | 441 (13.2%) |
Technology Access in Columbia
Computing Device Access in Columbia
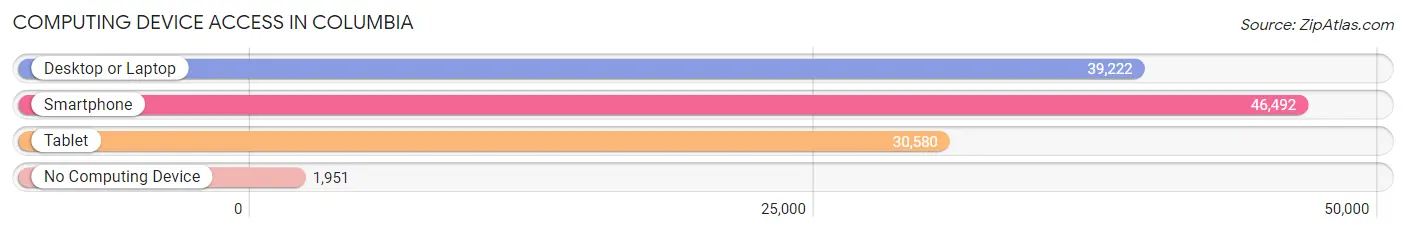
| Device Type | # Households | % Households |
| Desktop or Laptop | 39,222 | 78.1% |
| Smartphone | 46,492 | 92.6% |
| Tablet | 30,580 | 60.9% |
| No Computing Device | 1,951 | 3.9% |
| Total | 50,223 | 100.0% |
Internet Access in Columbia
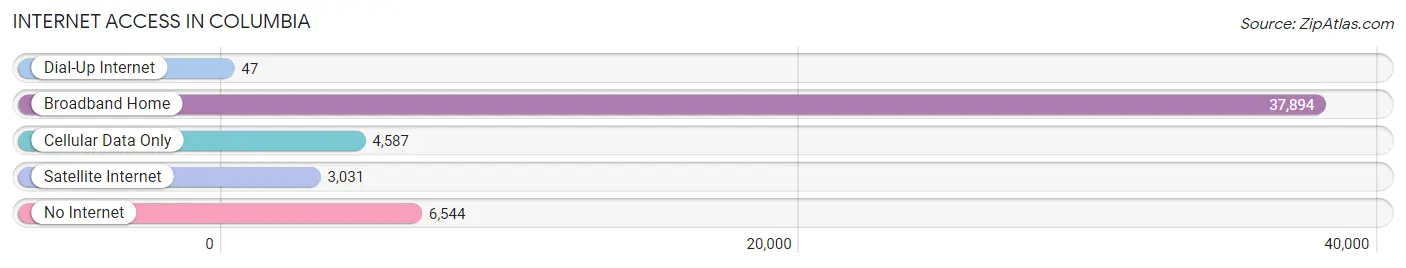
| Internet Type | # Households | % Households |
| Dial-Up Internet | 47 | 0.1% |
| Broadband Home | 37,894 | 75.4% |
| Cellular Data Only | 4,587 | 9.1% |
| Satellite Internet | 3,031 | 6.0% |
| No Internet | 6,544 | 13.0% |
| Total | 50,223 | 100.0% |
Columbia Summary
Columbia, South Carolina is the capital of the state and the largest city in the Midlands region. It is located in the center of the state, along the banks of the Congaree River. The city is home to the University of South Carolina, the state’s flagship university, and is a major center for business, culture, and education.
History
Columbia was founded in 1786 as the new state capital of South Carolina. The city was named for Christopher Columbus, and was laid out in a grid pattern with four quadrants. The city was designed to be a center of government and commerce, and it quickly became a hub of activity. In the 19th century, Columbia was a major center of the cotton trade, and the city was home to several large cotton mills.
The city was also a major center of the Civil War. In 1865, Union forces under General William Tecumseh Sherman burned much of the city, leaving only a few buildings standing. After the war, the city was rebuilt and continued to grow. In the late 19th and early 20th centuries, Columbia became a major center of industry, with several large factories and mills.
Geography
Columbia is located in the Midlands region of South Carolina, in the center of the state. The city is situated along the banks of the Congaree River, and is surrounded by several lakes and reservoirs. The city is located in a hilly area, with several small hills and ridges. The city is also located near several major highways, including Interstate 20 and Interstate 26.
Economy
Columbia is a major center of business and industry in South Carolina. The city is home to several large corporations, including Blue Cross Blue Shield of South Carolina, SCANA Corporation, and Palmetto Health. The city is also home to several major universities, including the University of South Carolina, Columbia College, and Benedict College.
The city is also a major center of tourism, with several popular attractions, including the South Carolina State House, the Riverbanks Zoo and Garden, and the Columbia Museum of Art. The city is also home to several major sports teams, including the Columbia Fireflies minor league baseball team and the South Carolina Gamecocks college football team.
Demographics
As of the 2010 census, the population of Columbia was 129,272. The city is racially diverse, with a population that is 54.2% White, 37.2% African American, 4.2% Hispanic or Latino, 2.2% Asian, and 2.2% from other races. The median household income in the city is $41,945, and the median home value is $133,400. The city has a poverty rate of 22.2%.
Columbia is a major center of education, with several major universities and colleges located in the city. The city is also home to several major hospitals, including Palmetto Health Richland and Palmetto Health Baptist. The city is served by several major airports, including Columbia Metropolitan Airport and Charleston International Airport.
Common Questions
What is Per Capita Income in Columbia?
Per Capita income in Columbia is $36,422.
What is the Median Family Income in Columbia?
Median Family Income in Columbia is $78,454.
What is the Median Household income in Columbia?
Median Household Income in Columbia is $54,095.
What is Income or Wage Gap in Columbia?
Income or Wage Gap in Columbia is 11.1%.
Women in Columbia earn 88.9 cents for every dollar earned by a man.
What is Family Income Deficit in Columbia?
Family Income Deficit in Columbia is $12,922.
Families that are below poverty line in Columbia earn $12,922 less on average than the poverty threshold level.
What is Inequality or Gini Index in Columbia?
Inequality or Gini Index in Columbia is 0.56.
What is the Total Population of Columbia?
Total Population of Columbia is 136,754.
What is the Total Male Population of Columbia?
Total Male Population of Columbia is 68,093.
What is the Total Female Population of Columbia?
Total Female Population of Columbia is 68,661.
What is the Ratio of Males per 100 Females in Columbia?
There are 99.17 Males per 100 Females in Columbia.
What is the Ratio of Females per 100 Males in Columbia?
There are 100.83 Females per 100 Males in Columbia.
What is the Median Population Age in Columbia?
Median Population Age in Columbia is 28.3 Years.
What is the Average Family Size in Columbia
Average Family Size in Columbia is 3.0 People.
What is the Average Household Size in Columbia
Average Household Size in Columbia is 2.2 People.
How Large is the Labor Force in Columbia?
There are 75,668 People in the Labor Forcein in Columbia.
What is the Percentage of People in the Labor Force in Columbia?
65.0% of People are in the Labor Force in Columbia.
What is the Unemployment Rate in Columbia?
Unemployment Rate in Columbia is 7.9%.