Cities with the Highest Percentage of Hawaiian / Pacific Population in Virginia
RELATED REPORTS & OPTIONS
Hawaiian / Pacific
Virginia
Compare Cities
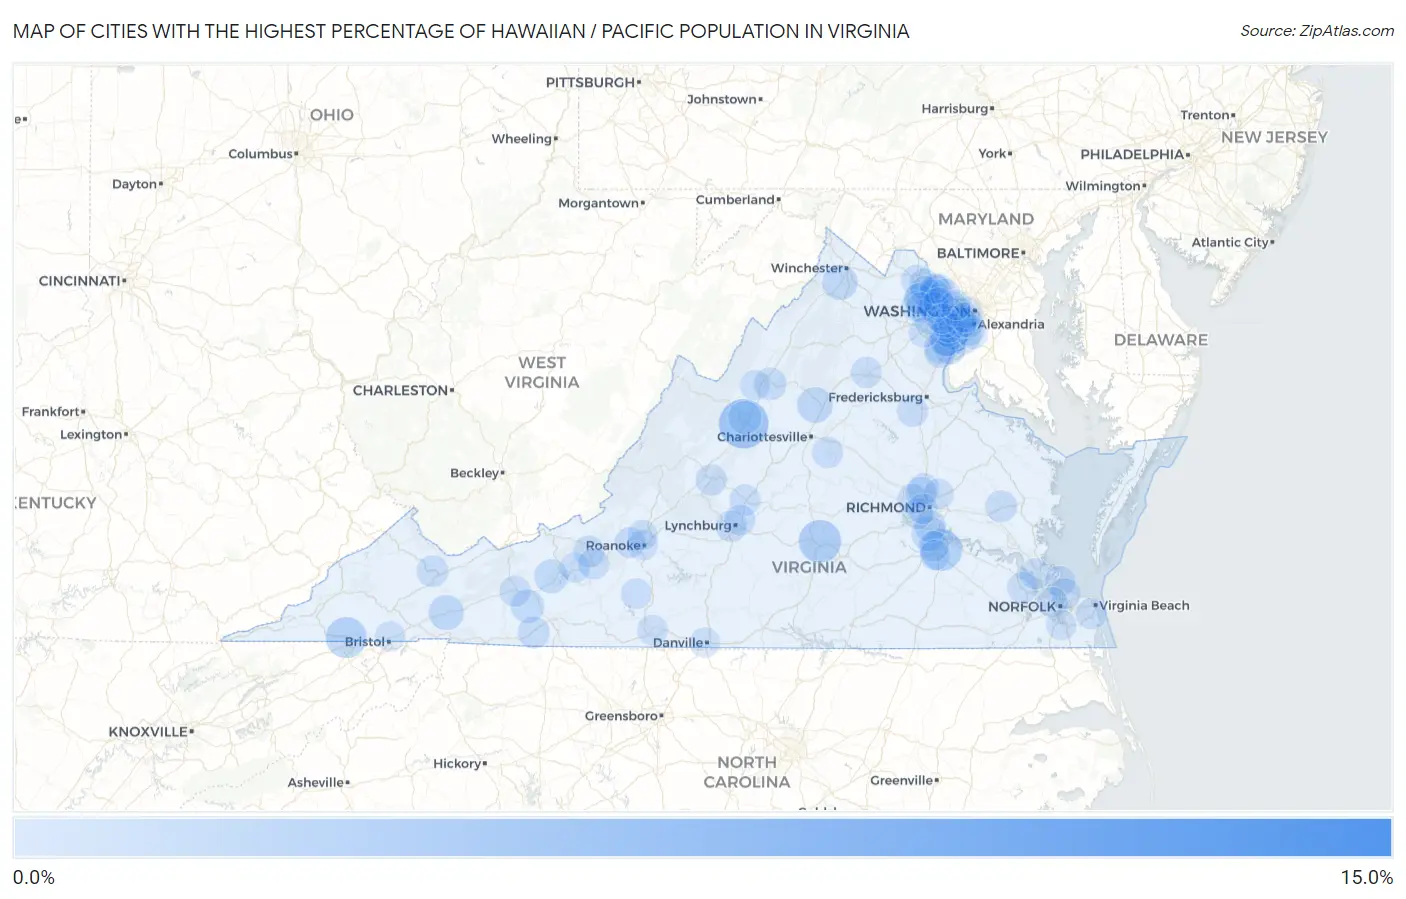
Map of Cities with the Highest Percentage of Hawaiian / Pacific Population in Virginia
0.0%
15.0%
Cities with the Highest Percentage of Hawaiian / Pacific Population in Virginia
| City | Hawaiian / Pacific | vs State | vs National | |
| 1. | Brandy Station | 12.2% | 0.072%(+12.2)#1 | 0.19%(+12.0)#73 |
| 2. | Jolivue | 3.8% | 0.072%(+3.71)#2 | 0.19%(+3.60)#246 |
| 3. | Farmville | 2.4% | 0.072%(+2.35)#3 | 0.19%(+2.23)#367 |
| 4. | Fort Lee | 2.3% | 0.072%(+2.20)#4 | 0.19%(+2.08)#387 |
| 5. | Weber City | 2.1% | 0.072%(+2.00)#5 | 0.19%(+1.89)#416 |
| 6. | Crosspointe | 1.7% | 0.072%(+1.61)#6 | 0.19%(+1.49)#510 |
| 7. | Twin Lakes | 1.1% | 0.072%(+1.02)#7 | 0.19%(+0.903)#698 |
| 8. | Stephens City | 1.00% | 0.072%(+0.925)#8 | 0.19%(+0.808)#742 |
| 9. | Chilhowie | 0.97% | 0.072%(+0.898)#9 | 0.19%(+0.781)#754 |
| 10. | Chester | 0.90% | 0.072%(+0.826)#10 | 0.19%(+0.709)#810 |
| 11. | Pulaski | 0.75% | 0.072%(+0.674)#11 | 0.19%(+0.557)#945 |
| 12. | Fort Belvoir | 0.70% | 0.072%(+0.632)#12 | 0.19%(+0.515)#993 |
| 13. | Ivanhoe | 0.66% | 0.072%(+0.586)#13 | 0.19%(+0.469)#1,056 |
| 14. | Staunton | 0.61% | 0.072%(+0.538)#14 | 0.19%(+0.421)#1,105 |
| 15. | Mcnair | 0.54% | 0.072%(+0.465)#15 | 0.19%(+0.348)#1,197 |
| 16. | Massanetta Springs | 0.48% | 0.072%(+0.408)#16 | 0.19%(+0.291)#1,287 |
| 17. | Loudoun Valley Estates | 0.45% | 0.072%(+0.375)#17 | 0.19%(+0.258)#1,344 |
| 18. | Galax | 0.36% | 0.072%(+0.287)#18 | 0.19%(+0.170)#1,558 |
| 19. | Dale City | 0.35% | 0.072%(+0.281)#19 | 0.19%(+0.164)#1,570 |
| 20. | Richlands | 0.34% | 0.072%(+0.270)#20 | 0.19%(+0.153)#1,608 |
| 21. | West Point | 0.32% | 0.072%(+0.252)#21 | 0.19%(+0.135)#1,652 |
| 22. | Newington Forest | 0.31% | 0.072%(+0.237)#22 | 0.19%(+0.120)#1,701 |
| 23. | Bellwood | 0.31% | 0.072%(+0.237)#23 | 0.19%(+0.120)#1,702 |
| 24. | Lowes Island | 0.30% | 0.072%(+0.230)#24 | 0.19%(+0.113)#1,723 |
| 25. | Annandale | 0.23% | 0.072%(+0.157)#25 | 0.19%(+0.040)#2,010 |
| 26. | Spotsylvania Courthouse | 0.23% | 0.072%(+0.155)#26 | 0.19%(+0.038)#2,013 |
| 27. | Sugarland Run | 0.23% | 0.072%(+0.155)#27 | 0.19%(+0.038)#2,015 |
| 28. | Buena Vista | 0.23% | 0.072%(+0.154)#28 | 0.19%(+0.037)#2,016 |
| 29. | Blacksburg | 0.22% | 0.072%(+0.150)#29 | 0.19%(+0.033)#2,029 |
| 30. | Amherst | 0.22% | 0.072%(+0.146)#30 | 0.19%(+0.029)#2,055 |
| 31. | Glen Allen | 0.22% | 0.072%(+0.144)#31 | 0.19%(+0.027)#2,066 |
| 32. | Lake Monticello | 0.21% | 0.072%(+0.141)#32 | 0.19%(+0.024)#2,077 |
| 33. | Woodbridge | 0.20% | 0.072%(+0.132)#33 | 0.19%(+0.015)#2,111 |
| 34. | Wytheville | 0.19% | 0.072%(+0.123)#34 | 0.19%(+0.006)#2,158 |
| 35. | Lynchburg | 0.19% | 0.072%(+0.119)#35 | 0.19%(+0.002)#2,176 |
| 36. | Culpeper | 0.19% | 0.072%(+0.117)#36 | 0.19%(+0.000)#2,183 |
| 37. | South Run | 0.19% | 0.072%(+0.116)#37 | 0.19%(-0.001)#2,189 |
| 38. | Christiansburg | 0.18% | 0.072%(+0.111)#38 | 0.19%(-0.006)#2,210 |
| 39. | Groveton | 0.18% | 0.072%(+0.106)#39 | 0.19%(-0.011)#2,237 |
| 40. | Norfolk | 0.17% | 0.072%(+0.101)#40 | 0.19%(-0.016)#2,265 |
| 41. | Madison Heights | 0.16% | 0.072%(+0.087)#41 | 0.19%(-0.030)#2,350 |
| 42. | Laurel | 0.15% | 0.072%(+0.074)#42 | 0.19%(-0.043)#2,424 |
| 43. | Manchester | 0.14% | 0.072%(+0.071)#43 | 0.19%(-0.046)#2,447 |
| 44. | Smithfield | 0.14% | 0.072%(+0.067)#44 | 0.19%(-0.050)#2,468 |
| 45. | Floris | 0.13% | 0.072%(+0.063)#45 | 0.19%(-0.054)#2,492 |
| 46. | Virginia Beach | 0.13% | 0.072%(+0.061)#46 | 0.19%(-0.056)#2,503 |
| 47. | Sterling | 0.13% | 0.072%(+0.060)#47 | 0.19%(-0.057)#2,506 |
| 48. | Newport News | 0.13% | 0.072%(+0.058)#48 | 0.19%(-0.059)#2,527 |
| 49. | Rose Hill Cdp Fairfax County | 0.13% | 0.072%(+0.056)#49 | 0.19%(-0.061)#2,545 |
| 50. | Montclair | 0.13% | 0.072%(+0.055)#50 | 0.19%(-0.062)#2,549 |
| 51. | Fair Oaks | 0.13% | 0.072%(+0.054)#51 | 0.19%(-0.063)#2,556 |
| 52. | Salem | 0.12% | 0.072%(+0.050)#52 | 0.19%(-0.067)#2,578 |
| 53. | Ferrum | 0.12% | 0.072%(+0.045)#53 | 0.19%(-0.072)#2,625 |
| 54. | Arlington | 0.10% | 0.072%(+0.031)#54 | 0.19%(-0.086)#2,721 |
| 55. | Leesylvania | 0.099% | 0.072%(+0.028)#55 | 0.19%(-0.089)#2,738 |
| 56. | Roanoke | 0.099% | 0.072%(+0.027)#56 | 0.19%(-0.090)#2,744 |
| 57. | Centreville | 0.094% | 0.072%(+0.022)#57 | 0.19%(-0.095)#2,792 |
| 58. | Lake Ridge | 0.089% | 0.072%(+0.018)#58 | 0.19%(-0.099)#2,820 |
| 59. | Colonial Heights | 0.088% | 0.072%(+0.016)#59 | 0.19%(-0.101)#2,835 |
| 60. | Leesburg | 0.085% | 0.072%(+0.013)#60 | 0.19%(-0.104)#2,862 |
| 61. | Hampton | 0.085% | 0.072%(+0.013)#61 | 0.19%(-0.104)#2,863 |
| 62. | Fort Hunt | 0.081% | 0.072%(+0.009)#62 | 0.19%(-0.108)#2,890 |
| 63. | Lansdowne | 0.078% | 0.072%(+0.006)#63 | 0.19%(-0.111)#2,918 |
| 64. | Bridgewater | 0.076% | 0.072%(+0.004)#64 | 0.19%(-0.113)#2,932 |
| 65. | Tysons | 0.076% | 0.072%(+0.004)#65 | 0.19%(-0.113)#2,933 |
| 66. | Stone Ridge | 0.075% | 0.072%(+0.003)#66 | 0.19%(-0.114)#2,943 |
| 67. | Ashburn | 0.070% | 0.072%(-0.001)#67 | 0.19%(-0.118)#2,985 |
| 68. | Brambleton | 0.070% | 0.072%(-0.002)#68 | 0.19%(-0.119)#2,988 |
| 69. | Martinsville | 0.066% | 0.072%(-0.005)#69 | 0.19%(-0.122)#3,034 |
| 70. | Portsmouth | 0.064% | 0.072%(-0.008)#70 | 0.19%(-0.125)#3,060 |
| 71. | Lincolnia | 0.061% | 0.072%(-0.011)#71 | 0.19%(-0.128)#3,094 |
| 72. | Franklin Farm | 0.058% | 0.072%(-0.014)#72 | 0.19%(-0.131)#3,123 |
| 73. | Chesapeake | 0.058% | 0.072%(-0.014)#73 | 0.19%(-0.131)#3,128 |
| 74. | Petersburg | 0.057% | 0.072%(-0.015)#74 | 0.19%(-0.132)#3,133 |
| 75. | Tuckahoe | 0.056% | 0.072%(-0.016)#75 | 0.19%(-0.133)#3,143 |
| 76. | Cascades | 0.056% | 0.072%(-0.016)#76 | 0.19%(-0.133)#3,148 |
| 77. | Kings Park West | 0.053% | 0.072%(-0.019)#77 | 0.19%(-0.136)#3,174 |
| 78. | Mechanicsville | 0.050% | 0.072%(-0.022)#78 | 0.19%(-0.139)#3,207 |
| 79. | Richmond | 0.048% | 0.072%(-0.024)#79 | 0.19%(-0.141)#3,232 |
| 80. | Hollins | 0.043% | 0.072%(-0.029)#80 | 0.19%(-0.146)#3,292 |
| 81. | Idylwood | 0.034% | 0.072%(-0.038)#81 | 0.19%(-0.155)#3,395 |
| 82. | South Riding | 0.030% | 0.072%(-0.042)#82 | 0.19%(-0.159)#3,445 |
| 83. | Burke | 0.027% | 0.072%(-0.045)#83 | 0.19%(-0.162)#3,486 |
| 84. | Great Falls | 0.027% | 0.072%(-0.045)#84 | 0.19%(-0.162)#3,493 |
| 85. | Manassas | 0.026% | 0.072%(-0.046)#85 | 0.19%(-0.163)#3,507 |
| 86. | Radford | 0.024% | 0.072%(-0.047)#86 | 0.19%(-0.164)#3,527 |
| 87. | Alexandria | 0.023% | 0.072%(-0.048)#87 | 0.19%(-0.165)#3,543 |
| 88. | Bailey S Crossroads | 0.020% | 0.072%(-0.052)#88 | 0.19%(-0.169)#3,586 |
| 89. | George Mason | 0.020% | 0.072%(-0.052)#89 | 0.19%(-0.169)#3,588 |
| 90. | Mclean | 0.018% | 0.072%(-0.054)#90 | 0.19%(-0.171)#3,620 |
| 91. | Danville | 0.014% | 0.072%(-0.058)#91 | 0.19%(-0.175)#3,667 |
| 92. | Bristol | 0.0059% | 0.072%(-0.066)#92 | 0.19%(-0.183)#3,759 |
| 93. | Reston | 0.0032% | 0.072%(-0.069)#93 | 0.19%(-0.186)#3,790 |
Common Questions
What are the Top 10 Cities with the Highest Percentage of Hawaiian / Pacific Population in Virginia?
Top 10 Cities with the Highest Percentage of Hawaiian / Pacific Population in Virginia are:
#1
3.8%
#2
2.4%
#3
2.3%
#4
2.1%
#5
1.7%
#6
1.1%
#7
1.00%
#8
0.97%
#9
0.90%
#10
0.75%
What city has the Highest Percentage of Hawaiian / Pacific Population in Virginia?
Jolivue has the Highest Percentage of Hawaiian / Pacific Population in Virginia with 3.8%.
What is the Percentage of Hawaiian / Pacific Population in the State of Virginia?
Percentage of Hawaiian / Pacific Population in Virginia is 0.072%.
What is the Percentage of Hawaiian / Pacific Population in the United States?
Percentage of Hawaiian / Pacific Population in the United States is 0.19%.