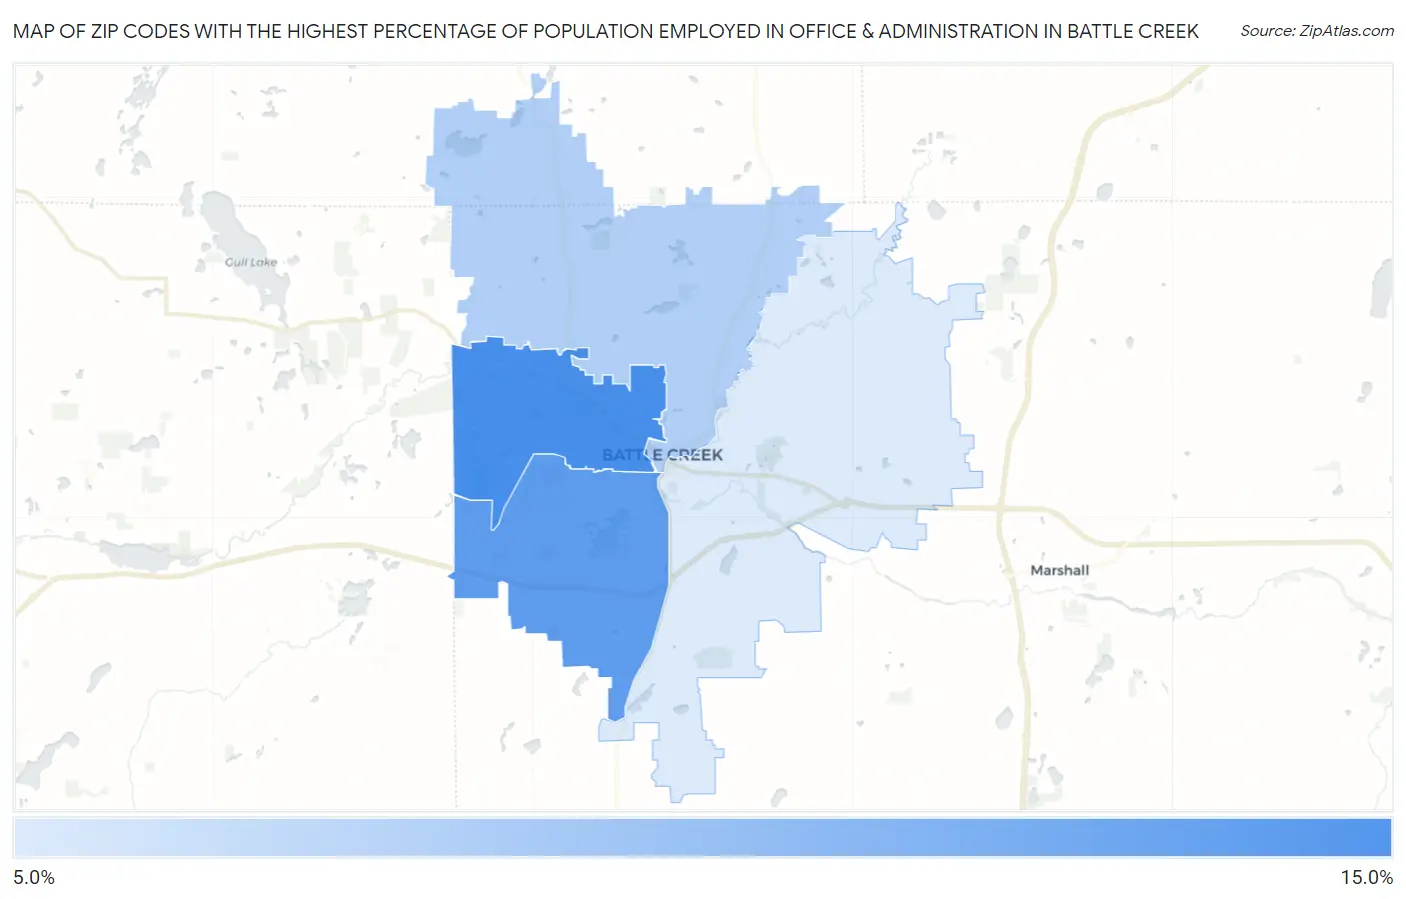
Zip Codes with the Highest Percentage of Population Employed in Office & Administration in Battle Creek, MI
RELATED REPORTS & OPTIONS
Office & Administration
Battle Creek
Compare Zip Codes
Map of Zip Codes with the Highest Percentage of Population Employed in Office & Administration in Battle Creek
8.1%
11.1%
Zip Codes with the Highest Percentage of Population Employed in Office & Administration in Battle Creek, MI
| Zip Code | % Employed | vs State | vs National | |
| 1. | 49037 | 11.1% | 10.8%(+0.298)#401 | 10.9%(+0.249)#13,518 |
| 2. | 49015 | 10.7% | 10.8%(-0.149)#457 | 10.9%(-0.198)#14,947 |
| 3. | 49017 | 9.0% | 10.8%(-1.83)#652 | 10.9%(-1.88)#20,317 |
| 4. | 49014 | 8.1% | 10.8%(-2.72)#749 | 10.9%(-2.77)#22,816 |
1
Common Questions
What are the Top 3 Zip Codes with the Highest Percentage of Population Employed in Office & Administration in Battle Creek, MI?
Top 3 Zip Codes with the Highest Percentage of Population Employed in Office & Administration in Battle Creek, MI are:
What zip code has the Highest Percentage of Population Employed in Office & Administration in Battle Creek, MI?
49037 has the Highest Percentage of Population Employed in Office & Administration in Battle Creek, MI with 11.1%.
What is the Percentage of Population Employed in Office & Administration in Battle Creek, MI?
Percentage of Population Employed in Office & Administration in Battle Creek is 9.0%.
What is the Percentage of Population Employed in Office & Administration in Michigan?
Percentage of Population Employed in Office & Administration in Michigan is 10.8%.
What is the Percentage of Population Employed in Office & Administration in the United States?
Percentage of Population Employed in Office & Administration in the United States is 10.9%.