Zip Codes with the Highest Percentage of Population Employed in Office & Administration in Livonia, MI
RELATED REPORTS & OPTIONS
Office & Administration
Livonia
Compare Zip Codes
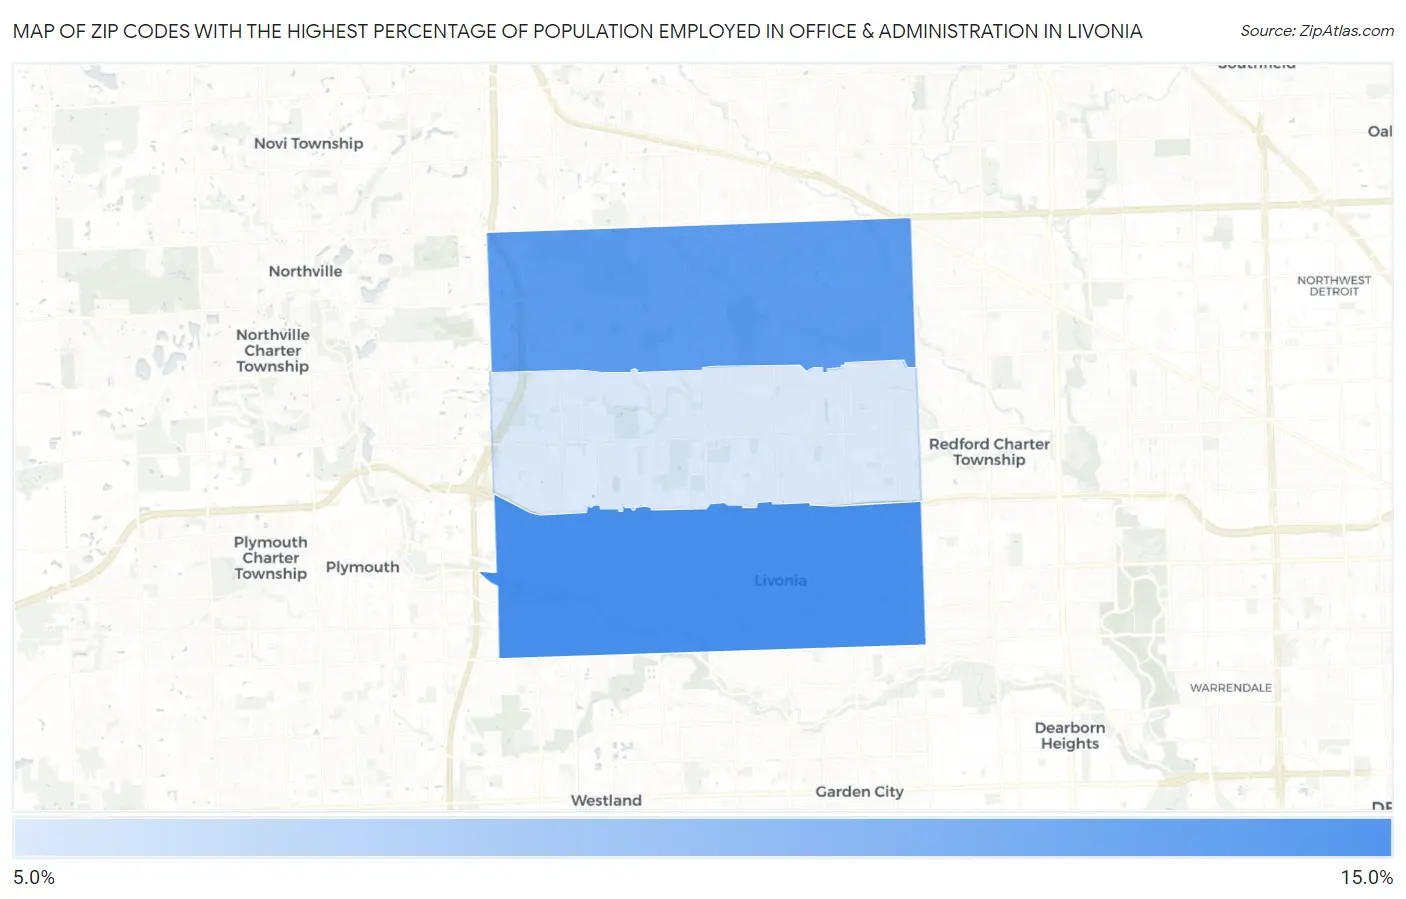
Map of Zip Codes with the Highest Percentage of Population Employed in Office & Administration in Livonia
11.4%
13.1%
Zip Codes with the Highest Percentage of Population Employed in Office & Administration in Livonia, MI
| Zip Code | % Employed | vs State | vs National | |
| 1. | 48150 | 13.1% | 10.8%(+2.28)#181 | 10.9%(+2.23)#7,847 |
| 2. | 48152 | 12.9% | 10.8%(+2.06)#197 | 10.9%(+2.01)#8,383 |
| 3. | 48154 | 11.4% | 10.8%(+0.594)#356 | 10.9%(+0.545)#12,540 |
1
Common Questions
What are the Top Zip Codes with the Highest Percentage of Population Employed in Office & Administration in Livonia, MI?
Top Zip Codes with the Highest Percentage of Population Employed in Office & Administration in Livonia, MI are:
What zip code has the Highest Percentage of Population Employed in Office & Administration in Livonia, MI?
48150 has the Highest Percentage of Population Employed in Office & Administration in Livonia, MI with 13.1%.
What is the Percentage of Population Employed in Office & Administration in Livonia, MI?
Percentage of Population Employed in Office & Administration in Livonia is 12.4%.
What is the Percentage of Population Employed in Office & Administration in Michigan?
Percentage of Population Employed in Office & Administration in Michigan is 10.8%.
What is the Percentage of Population Employed in Office & Administration in the United States?
Percentage of Population Employed in Office & Administration in the United States is 10.9%.