Jennings, MI Map & Demographics
Jennings Map
Jennings Overview
$16,790
PER CAPITA INCOME
$31,771
AVG FAMILY INCOME
$39,000
AVG HOUSEHOLD INCOME
0.28
INEQUALITY / GINI INDEX
202
TOTAL POPULATION
76
MALE POPULATION
126
FEMALE POPULATION
60.32
MALES / 100 FEMALES
165.79
FEMALES / 100 MALES
44.9
MEDIAN AGE
3.1
AVG FAMILY SIZE
2.6
AVG HOUSEHOLD SIZE
85
LABOR FORCE [ PEOPLE ]
48.0%
PERCENT IN LABOR FORCE
Income in Jennings
Income Overview in Jennings
Per Capita Income in Jennings is $16,790, while median incomes of families and households are $31,771 and $39,000 respectively.
| Characteristic | Number | Measure |
| Per Capita Income | 202 | $16,790 |
| Median Family Income | 53 | $31,771 |
| Mean Family Income | 53 | $31,298 |
| Median Household Income | 78 | $39,000 |
| Mean Household Income | 78 | $42,933 |
| Income Deficit | 53 | $0 |
| Wage / Income Gap (%) | 202 | 0.00% |
| Wage / Income Gap ($) | 202 | 100.00¢ per $1 |
| Gini / Inequality Index | 202 | 0.28 |
Earnings by Sex in Jennings
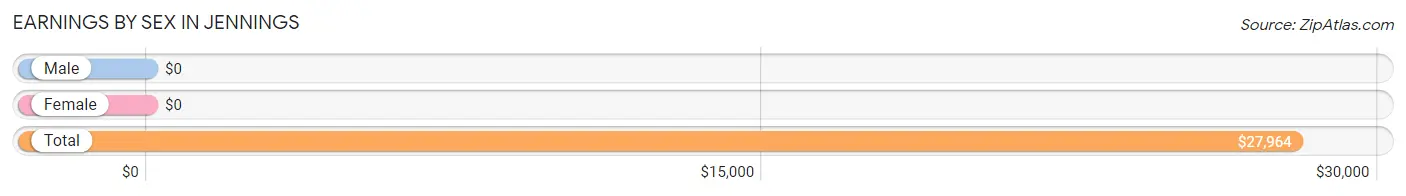
| Sex | Number | Average Earnings |
| Male | 24 (28.2%) | $0 |
| Female | 61 (71.8%) | $0 |
| Total | 85 (100.0%) | $27,964 |
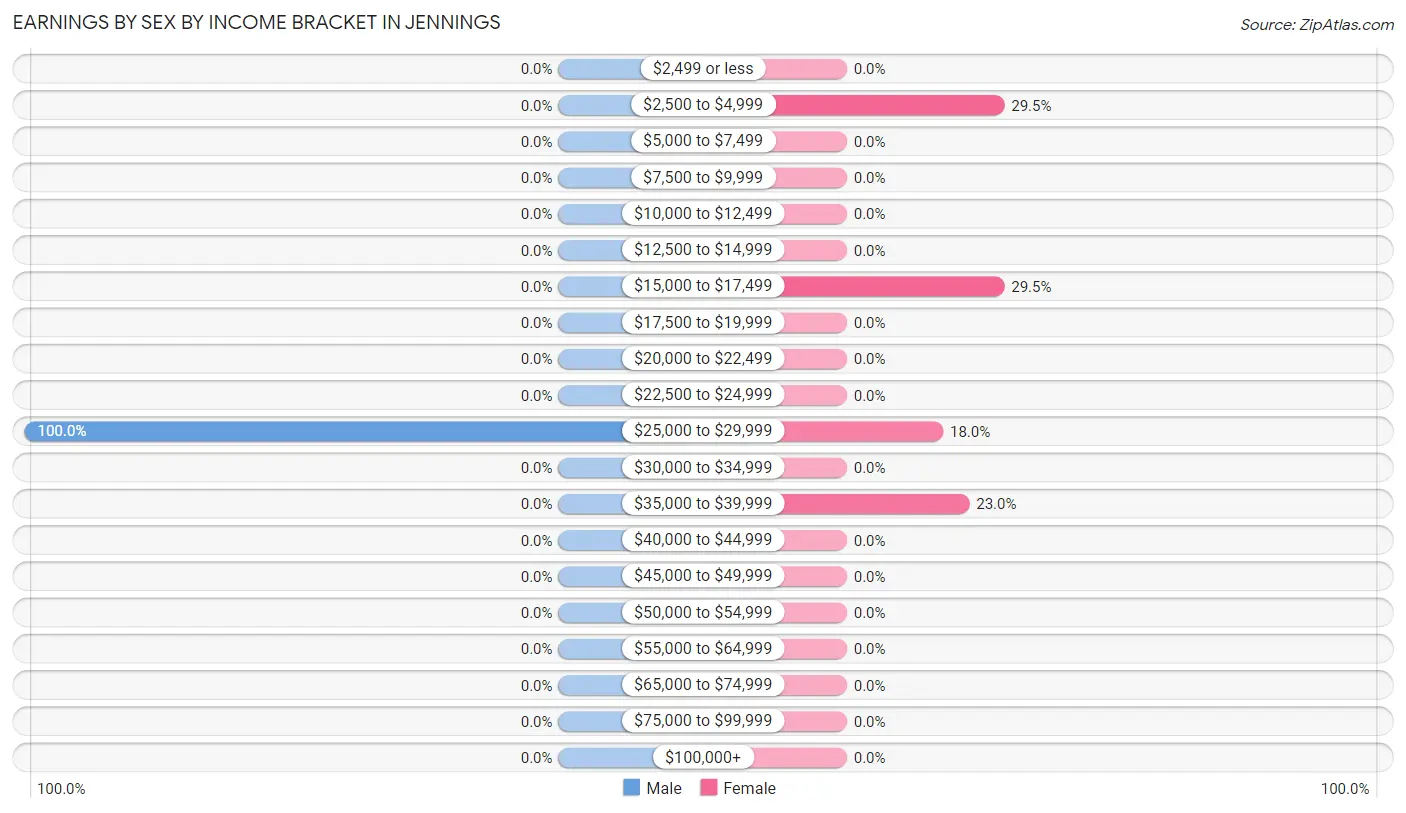
Earnings by Sex by Income Bracket in Jennings
The most common earnings brackets in Jennings are $25,000 to $29,999 for men (24 | 100.0%) and $2,500 to $4,999 for women (18 | 29.5%).
| Income | Male | Female |
| $2,499 or less | 0 (0.0%) | 0 (0.0%) |
| $2,500 to $4,999 | 0 (0.0%) | 18 (29.5%) |
| $5,000 to $7,499 | 0 (0.0%) | 0 (0.0%) |
| $7,500 to $9,999 | 0 (0.0%) | 0 (0.0%) |
| $10,000 to $12,499 | 0 (0.0%) | 0 (0.0%) |
| $12,500 to $14,999 | 0 (0.0%) | 0 (0.0%) |
| $15,000 to $17,499 | 0 (0.0%) | 18 (29.5%) |
| $17,500 to $19,999 | 0 (0.0%) | 0 (0.0%) |
| $20,000 to $22,499 | 0 (0.0%) | 0 (0.0%) |
| $22,500 to $24,999 | 0 (0.0%) | 0 (0.0%) |
| $25,000 to $29,999 | 24 (100.0%) | 11 (18.0%) |
| $30,000 to $34,999 | 0 (0.0%) | 0 (0.0%) |
| $35,000 to $39,999 | 0 (0.0%) | 14 (23.0%) |
| $40,000 to $44,999 | 0 (0.0%) | 0 (0.0%) |
| $45,000 to $49,999 | 0 (0.0%) | 0 (0.0%) |
| $50,000 to $54,999 | 0 (0.0%) | 0 (0.0%) |
| $55,000 to $64,999 | 0 (0.0%) | 0 (0.0%) |
| $65,000 to $74,999 | 0 (0.0%) | 0 (0.0%) |
| $75,000 to $99,999 | 0 (0.0%) | 0 (0.0%) |
| $100,000+ | 0 (0.0%) | 0 (0.0%) |
| Total | 24 (100.0%) | 61 (100.0%) |
Earnings by Sex by Educational Attainment in Jennings
| Educational Attainment | Male Income | Female Income |
| Less than High School | - | - |
| High School Diploma | - | - |
| College or Associate's Degree | - | - |
| Bachelor's Degree | - | - |
| Graduate Degree | - | - |
| Total | - | - |
Family Income in Jennings
Family Income Brackets in Jennings
According to the Jennings family income data, there are 18 families falling into the $15,000 to $24,999 income range, which is the most common income bracket and makes up 34.0% of all families.
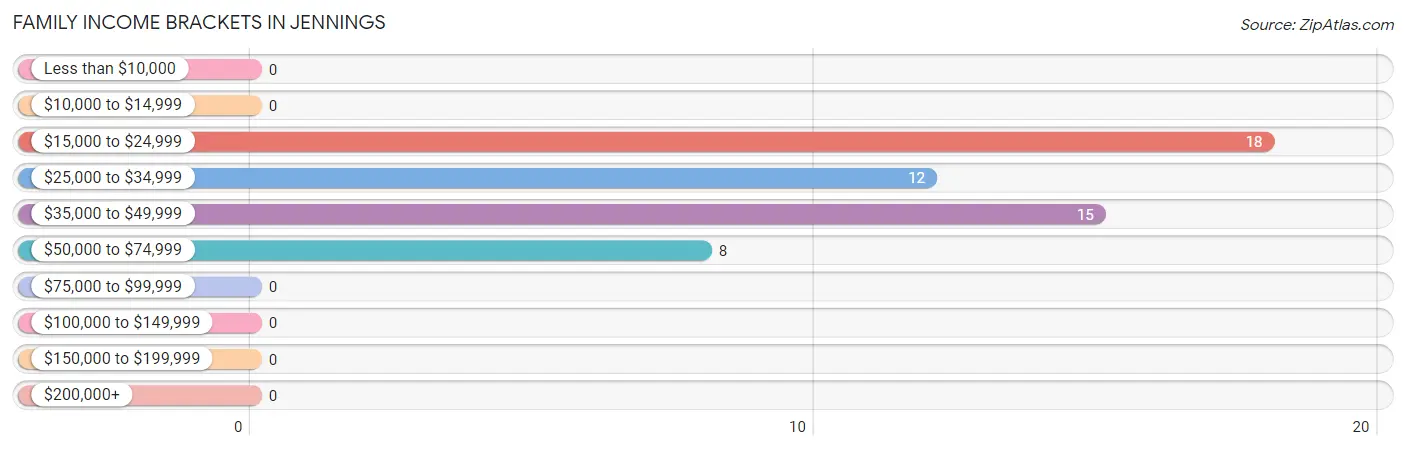
| Income Bracket | # Families | % Families |
| Less than $10,000 | 0 | 0.0% |
| $10,000 to $14,999 | 0 | 0.0% |
| $15,000 to $24,999 | 18 | 34.0% |
| $25,000 to $34,999 | 12 | 22.6% |
| $35,000 to $49,999 | 15 | 28.3% |
| $50,000 to $74,999 | 8 | 15.1% |
| $75,000 to $99,999 | 0 | 0.0% |
| $100,000 to $149,999 | 0 | 0.0% |
| $150,000 to $199,999 | 0 | 0.0% |
| $200,000+ | 0 | 0.0% |
Family Income by Famaliy Size in Jennings
| Income Bracket | # Families | Median Income |
| 2-Person Families | 20 (37.7%) | $0 |
| 3-Person Families | 18 (34.0%) | $0 |
| 4-Person Families | 15 (28.3%) | $0 |
| 5-Person Families | 0 (0.0%) | $0 |
| 6-Person Families | 0 (0.0%) | $0 |
| 7+ Person Families | 0 (0.0%) | $0 |
| Total | 53 (100.0%) | $31,771 |
Family Income by Number of Earners in Jennings
| Number of Earners | # Families | Median Income |
| No Earners | 12 (22.6%) | $0 |
| 1 Earner | 26 (49.1%) | $0 |
| 2 Earners | 15 (28.3%) | $0 |
| 3+ Earners | 0 (0.0%) | $0 |
| Total | 53 (100.0%) | $31,771 |
Household Income in Jennings
Household Income Brackets in Jennings
With 22 households falling in the category, the $50,000 to $74,999 income range is the most frequent in Jennings, accounting for 28.2% of all households.
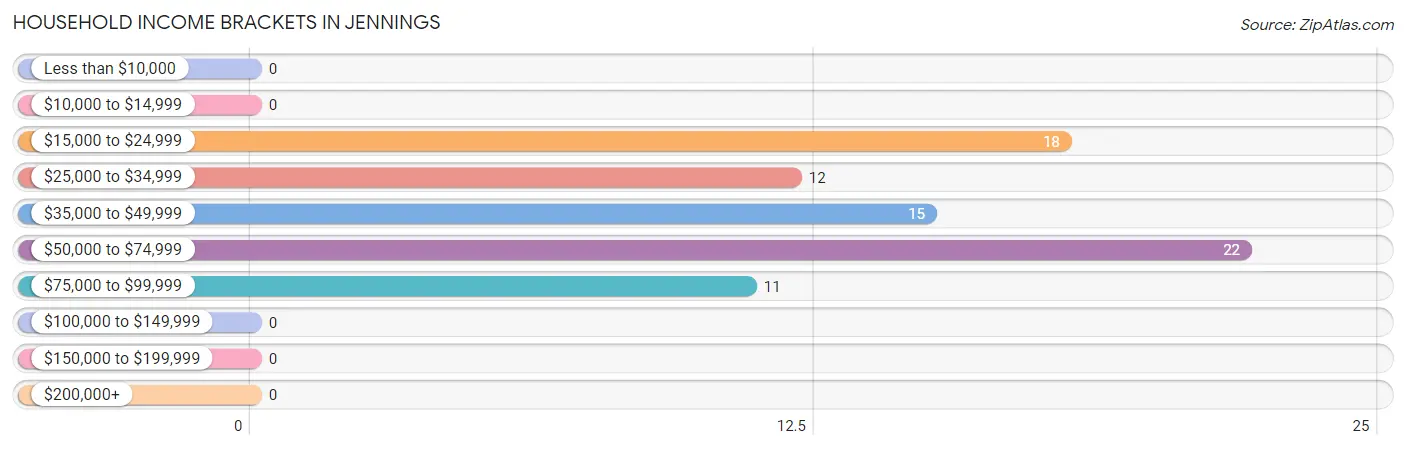
| Income Bracket | # Households | % Households |
| Less than $10,000 | 0 | 0.0% |
| $10,000 to $14,999 | 0 | 0.0% |
| $15,000 to $24,999 | 18 | 23.1% |
| $25,000 to $34,999 | 12 | 15.4% |
| $35,000 to $49,999 | 15 | 19.2% |
| $50,000 to $74,999 | 22 | 28.2% |
| $75,000 to $99,999 | 11 | 14.1% |
| $100,000 to $149,999 | 0 | 0.0% |
| $150,000 to $199,999 | 0 | 0.0% |
| $200,000+ | 0 | 0.0% |
Household Income by Householder Age in Jennings
The median household income in Jennings is $39,000, with the highest median household income of $51,023 found in the 45 to 64 years age bracket for the primary householder. A total of 48 households (61.5%) fall into this category.
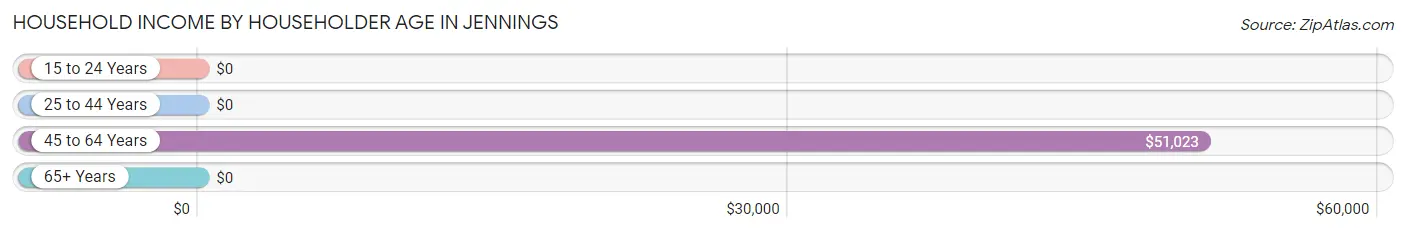
| Income Bracket | # Households | Median Income |
| 15 to 24 Years | 0 (0.0%) | $0 |
| 25 to 44 Years | 18 (23.1%) | $0 |
| 45 to 64 Years | 48 (61.5%) | $51,023 |
| 65+ Years | 12 (15.4%) | $0 |
| Total | 78 (100.0%) | $39,000 |
Poverty in Jennings
Income Below Poverty by Sex and Age in Jennings
With 28.9% poverty level for males and 30.2% for females among the residents of Jennings, 18 to 24 year old males and 18 to 24 year old females are the most vulnerable to poverty, with 22 males (100.0%) and 20 females (100.0%) in their respective age groups living below the poverty level.
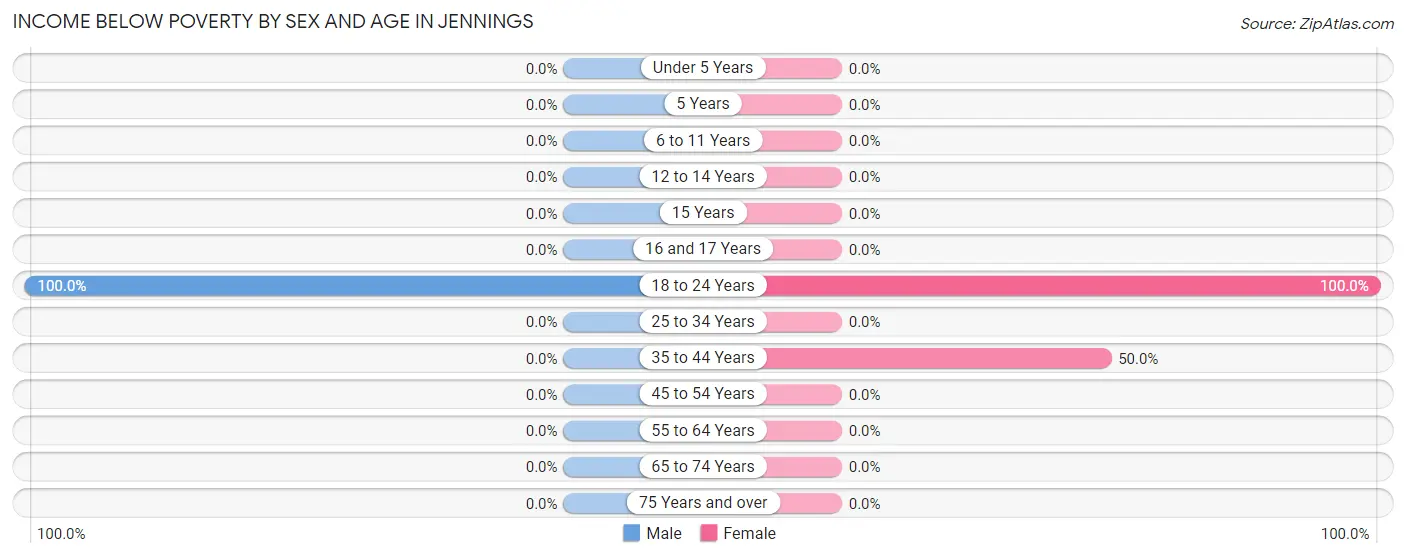
| Age Bracket | Male | Female |
| Under 5 Years | 0 (0.0%) | 0 (0.0%) |
| 5 Years | 0 (0.0%) | 0 (0.0%) |
| 6 to 11 Years | 0 (0.0%) | 0 (0.0%) |
| 12 to 14 Years | 0 (0.0%) | 0 (0.0%) |
| 15 Years | 0 (0.0%) | 0 (0.0%) |
| 16 and 17 Years | 0 (0.0%) | 0 (0.0%) |
| 18 to 24 Years | 22 (100.0%) | 20 (100.0%) |
| 25 to 34 Years | 0 (0.0%) | 0 (0.0%) |
| 35 to 44 Years | 0 (0.0%) | 18 (50.0%) |
| 45 to 54 Years | 0 (0.0%) | 0 (0.0%) |
| 55 to 64 Years | 0 (0.0%) | 0 (0.0%) |
| 65 to 74 Years | 0 (0.0%) | 0 (0.0%) |
| 75 Years and over | 0 (0.0%) | 0 (0.0%) |
| Total | 22 (28.9%) | 38 (30.2%) |
Income Above Poverty by Sex and Age in Jennings
According to the poverty statistics in Jennings, males aged 15 years and females aged 6 to 11 years are the age groups that are most secure financially, with 100.0% of males and 100.0% of females in these age groups living above the poverty line.
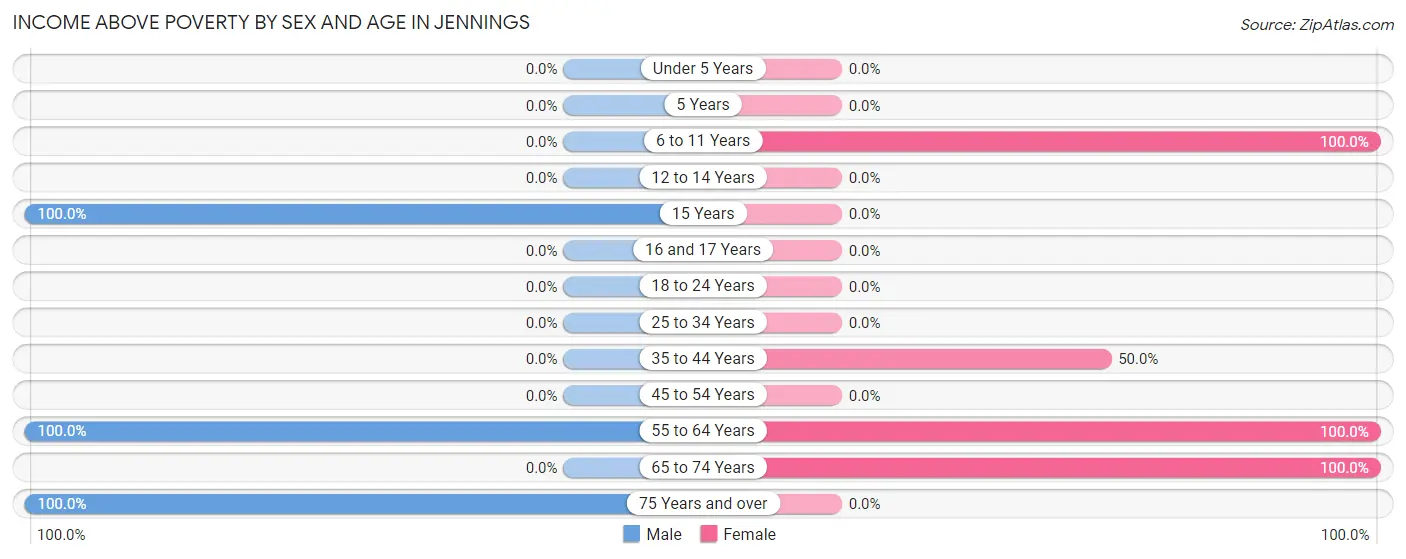
| Age Bracket | Male | Female |
| Under 5 Years | 0 (0.0%) | 0 (0.0%) |
| 5 Years | 0 (0.0%) | 0 (0.0%) |
| 6 to 11 Years | 0 (0.0%) | 18 (100.0%) |
| 12 to 14 Years | 0 (0.0%) | 0 (0.0%) |
| 15 Years | 7 (100.0%) | 0 (0.0%) |
| 16 and 17 Years | 0 (0.0%) | 0 (0.0%) |
| 18 to 24 Years | 0 (0.0%) | 0 (0.0%) |
| 25 to 34 Years | 0 (0.0%) | 0 (0.0%) |
| 35 to 44 Years | 0 (0.0%) | 18 (50.0%) |
| 45 to 54 Years | 0 (0.0%) | 0 (0.0%) |
| 55 to 64 Years | 24 (100.0%) | 40 (100.0%) |
| 65 to 74 Years | 0 (0.0%) | 12 (100.0%) |
| 75 Years and over | 23 (100.0%) | 0 (0.0%) |
| Total | 54 (71.1%) | 88 (69.8%) |
Income Below Poverty Among Married-Couple Families in Jennings
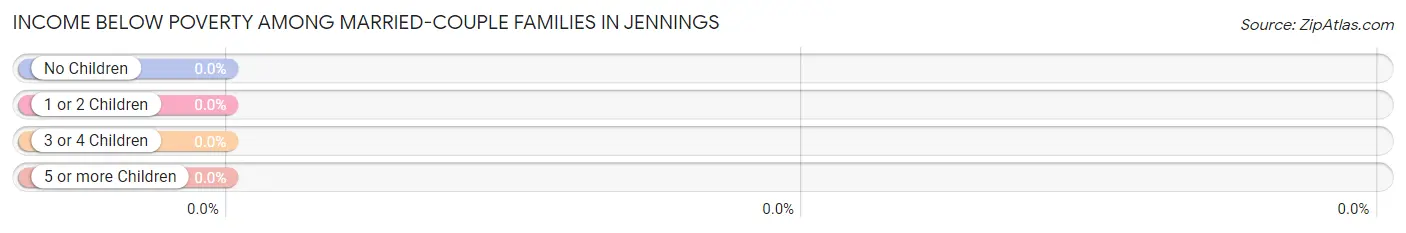
| Children | Above Poverty | Below Poverty |
| No Children | 12 (100.0%) | 0 (0.0%) |
| 1 or 2 Children | 15 (100.0%) | 0 (0.0%) |
| 3 or 4 Children | 0 (0.0%) | 0 (0.0%) |
| 5 or more Children | 0 (0.0%) | 0 (0.0%) |
| Total | 27 (100.0%) | 0 (0.0%) |
Income Below Poverty Among Single-Parent Households in Jennings
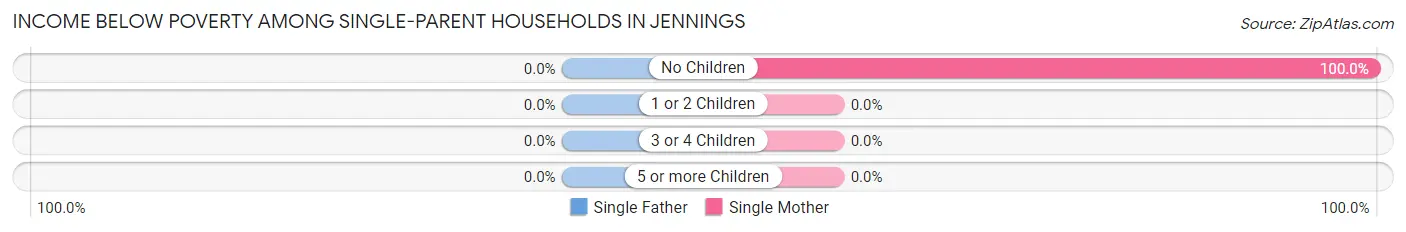
| Children | Single Father | Single Mother |
| No Children | 0 (0.0%) | 18 (100.0%) |
| 1 or 2 Children | 0 (0.0%) | 0 (0.0%) |
| 3 or 4 Children | 0 (0.0%) | 0 (0.0%) |
| 5 or more Children | 0 (0.0%) | 0 (0.0%) |
| Total | 0 (0.0%) | 18 (100.0%) |
Income Below Poverty Among Married-Couple vs Single-Parent Households in Jennings
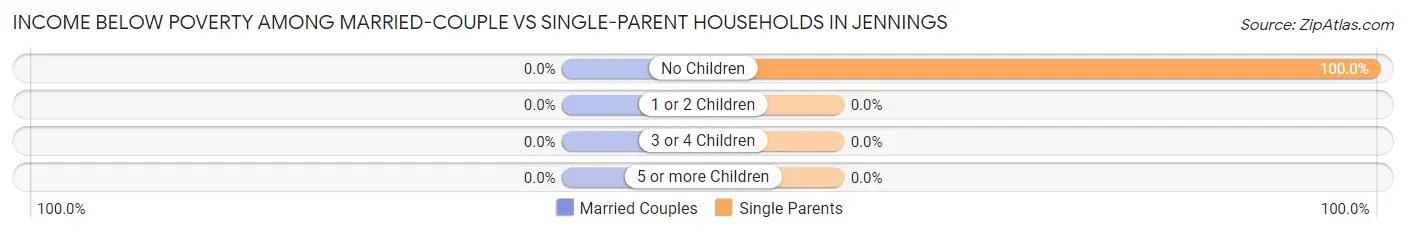
| Children | Married-Couple Families | Single-Parent Households |
| No Children | 0 (0.0%) | 18 (100.0%) |
| 1 or 2 Children | 0 (0.0%) | 0 (0.0%) |
| 3 or 4 Children | 0 (0.0%) | 0 (0.0%) |
| 5 or more Children | 0 (0.0%) | 0 (0.0%) |
| Total | 0 (0.0%) | 18 (69.2%) |
Race in Jennings
The most populous races in Jennings are White / Caucasian (151 | 74.8%), and Two or more Races (51 | 25.3%).
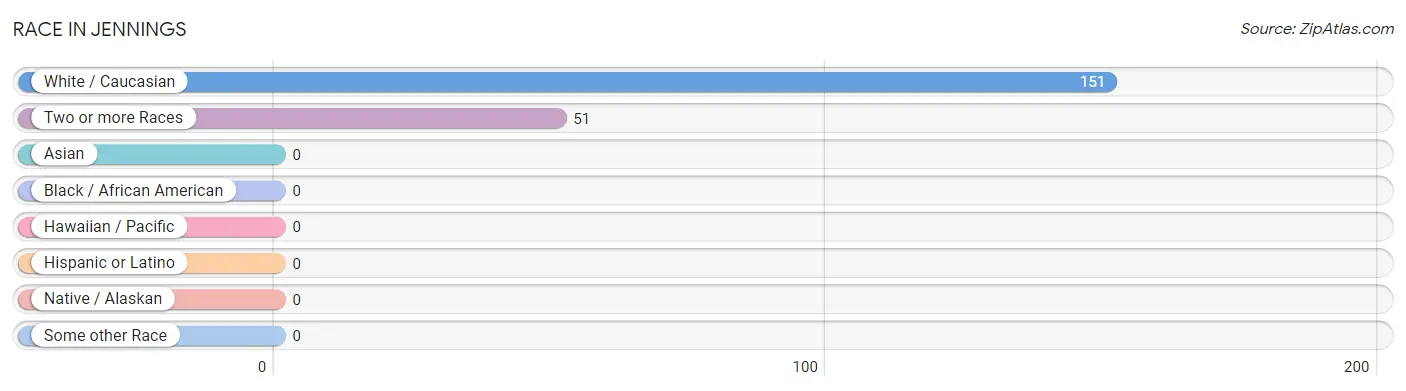
| Race | # Population | % Population |
| Asian | 0 | 0.0% |
| Black / African American | 0 | 0.0% |
| Hawaiian / Pacific | 0 | 0.0% |
| Hispanic or Latino | 0 | 0.0% |
| Native / Alaskan | 0 | 0.0% |
| White / Caucasian | 151 | 74.8% |
| Two or more Races | 51 | 25.3% |
| Some other Race | 0 | 0.0% |
| Total | 202 | 100.0% |
Ancestry in Jennings
The most populous ancestries reported in Jennings are German (65 | 32.2%), Italian (40 | 19.8%), American (39 | 19.3%), Finnish (24 | 11.9%), and English (22 | 10.9%), together accounting for 94.1% of all Jennings residents.
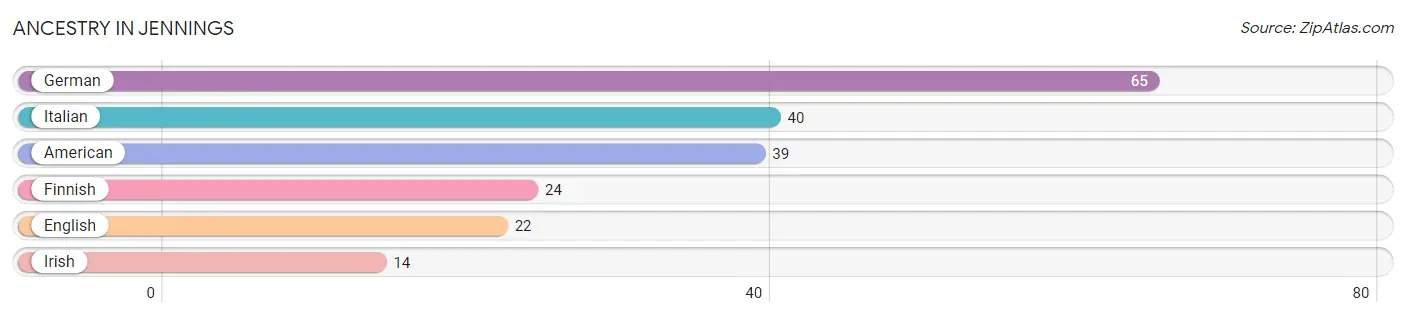
| Ancestry | # Population | % Population |
| American | 39 | 19.3% |
| English | 22 | 10.9% |
| Finnish | 24 | 11.9% |
| German | 65 | 32.2% |
| Irish | 14 | 6.9% |
| Italian | 40 | 19.8% | View All 6 Rows |
Immigrants in Jennings

| Immigration Origin | # Population | % Population | View All 0 Rows |
Sex and Age in Jennings
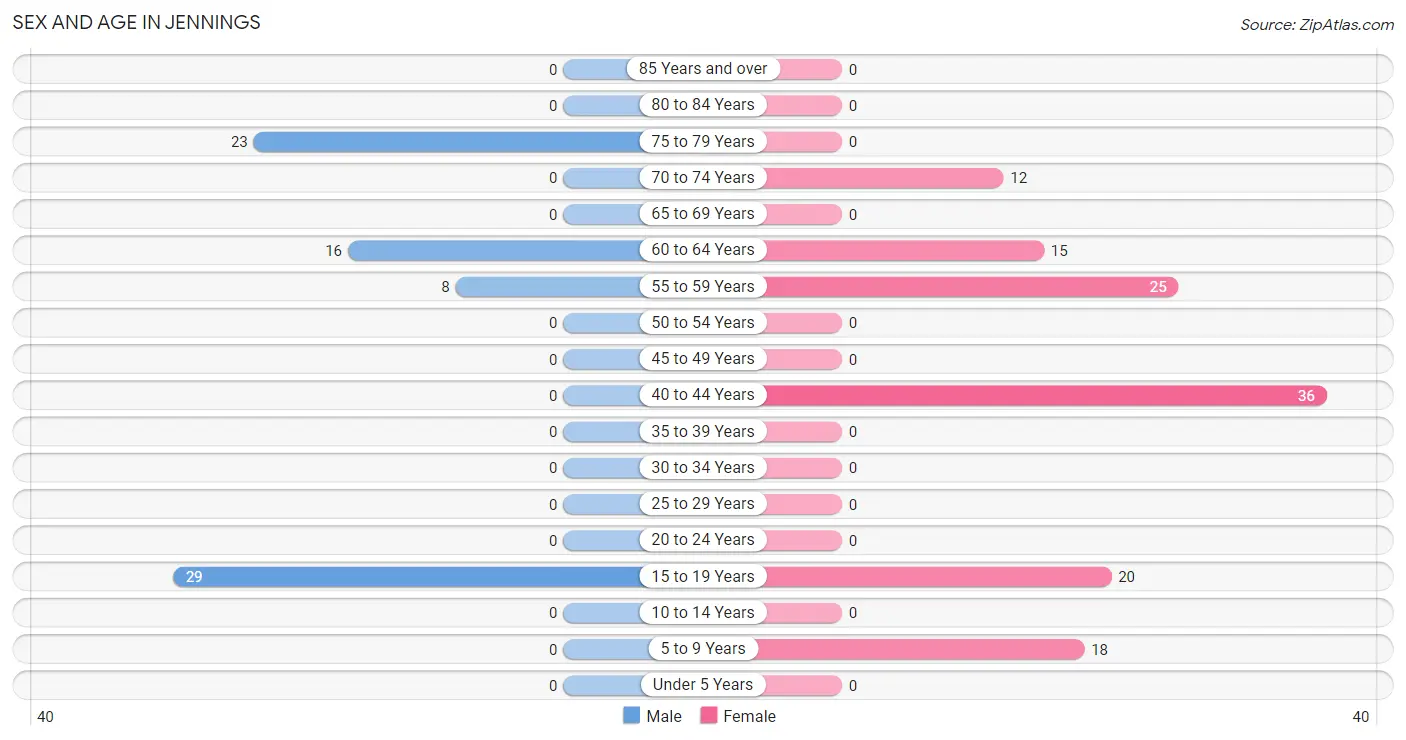
Sex and Age in Jennings
The most populous age groups in Jennings are 15 to 19 Years (29 | 38.2%) for men and 40 to 44 Years (36 | 28.6%) for women.
| Age Bracket | Male | Female |
| Under 5 Years | 0 (0.0%) | 0 (0.0%) |
| 5 to 9 Years | 0 (0.0%) | 18 (14.3%) |
| 10 to 14 Years | 0 (0.0%) | 0 (0.0%) |
| 15 to 19 Years | 29 (38.2%) | 20 (15.9%) |
| 20 to 24 Years | 0 (0.0%) | 0 (0.0%) |
| 25 to 29 Years | 0 (0.0%) | 0 (0.0%) |
| 30 to 34 Years | 0 (0.0%) | 0 (0.0%) |
| 35 to 39 Years | 0 (0.0%) | 0 (0.0%) |
| 40 to 44 Years | 0 (0.0%) | 36 (28.6%) |
| 45 to 49 Years | 0 (0.0%) | 0 (0.0%) |
| 50 to 54 Years | 0 (0.0%) | 0 (0.0%) |
| 55 to 59 Years | 8 (10.5%) | 25 (19.8%) |
| 60 to 64 Years | 16 (21.0%) | 15 (11.9%) |
| 65 to 69 Years | 0 (0.0%) | 0 (0.0%) |
| 70 to 74 Years | 0 (0.0%) | 12 (9.5%) |
| 75 to 79 Years | 23 (30.3%) | 0 (0.0%) |
| 80 to 84 Years | 0 (0.0%) | 0 (0.0%) |
| 85 Years and over | 0 (0.0%) | 0 (0.0%) |
| Total | 76 (100.0%) | 126 (100.0%) |
Families and Households in Jennings
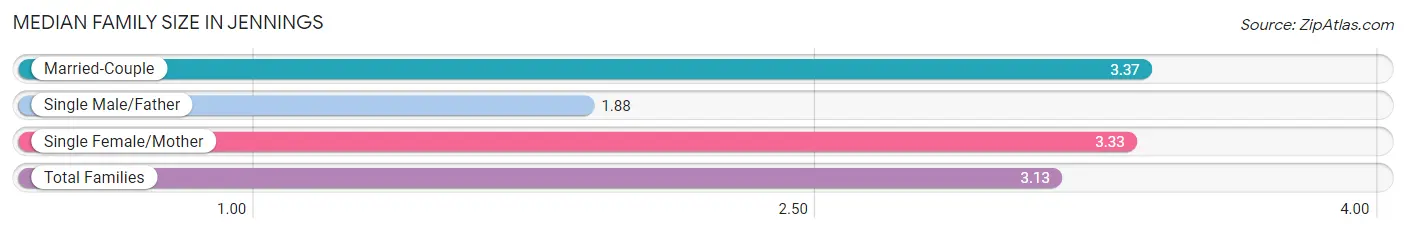
Median Family Size in Jennings
The median family size in Jennings is 3.13 persons per family, with married-couple families (27 | 50.9%) accounting for the largest median family size of 3.37 persons per family. On the other hand, single male/father families (8 | 15.1%) represent the smallest median family size with 1.88 persons per family.
| Family Type | # Families | Family Size |
| Married-Couple | 27 (50.9%) | 3.37 |
| Single Male/Father | 8 (15.1%) | 1.88 |
| Single Female/Mother | 18 (34.0%) | 3.33 |
| Total Families | 53 (100.0%) | 3.13 |
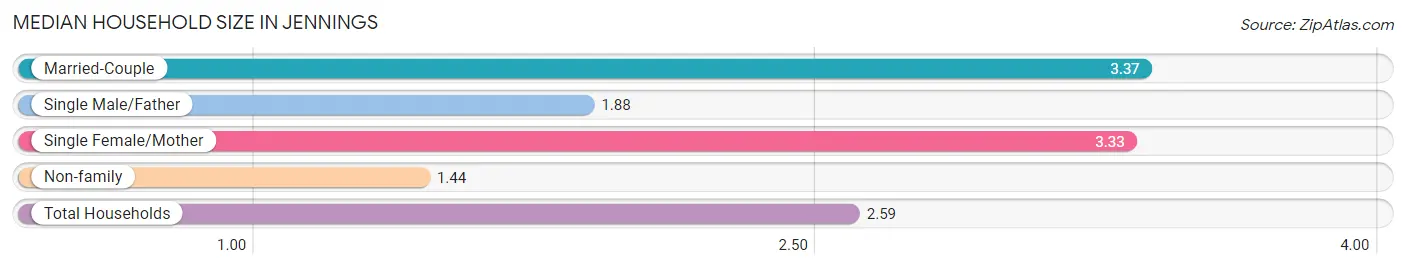
Median Household Size in Jennings
The median household size in Jennings is 2.59 persons per household, with married-couple households (27 | 34.6%) accounting for the largest median household size of 3.37 persons per household. non-family households (25 | 32.1%) represent the smallest median household size with 1.44 persons per household.
| Household Type | # Households | Household Size |
| Married-Couple | 27 (34.6%) | 3.37 |
| Single Male/Father | 8 (10.3%) | 1.88 |
| Single Female/Mother | 18 (23.1%) | 3.33 |
| Non-family | 25 (32.1%) | 1.44 |
| Total Households | 78 (100.0%) | 2.59 |
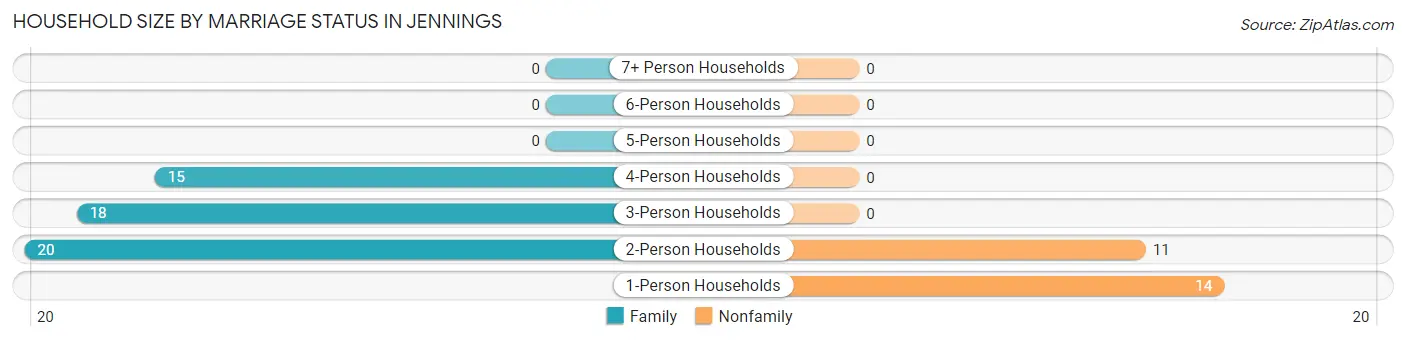
Household Size by Marriage Status in Jennings
Out of a total of 78 households in Jennings, 53 (67.9%) are family households, while 25 (32.1%) are nonfamily households. The most numerous type of family households are 2-person households, comprising 20, and the most common type of nonfamily households are 1-person households, comprising 14.
| Household Size | Family Households | Nonfamily Households |
| 1-Person Households | - | 14 (17.9%) |
| 2-Person Households | 20 (25.6%) | 11 (14.1%) |
| 3-Person Households | 18 (23.1%) | 0 (0.0%) |
| 4-Person Households | 15 (19.2%) | 0 (0.0%) |
| 5-Person Households | 0 (0.0%) | 0 (0.0%) |
| 6-Person Households | 0 (0.0%) | 0 (0.0%) |
| 7+ Person Households | 0 (0.0%) | 0 (0.0%) |
| Total | 53 (67.9%) | 25 (32.1%) |
Female Fertility in Jennings
Fertility by Age in Jennings
| Age Bracket | Women with Births | Births / 1,000 Women |
| 15 to 19 years | 0 (0.0%) | 0.0 |
| 20 to 34 years | 0 (0.0%) | 0.0 |
| 35 to 50 years | 0 (0.0%) | 0.0 |
| Total | 0 (0.0%) | 0.0 |
Fertility by Age by Marriage Status in Jennings
| Age Bracket | Married | Unmarried |
| 15 to 19 years | 0 (0.0%) | 0 (0.0%) |
| 20 to 34 years | 0 (0.0%) | 0 (0.0%) |
| 35 to 50 years | 0 (0.0%) | 0 (0.0%) |
| Total | 0 (0.0%) | 0 (0.0%) |
Fertility by Education in Jennings
| Educational Attainment | Women with Births | Births / 1,000 Women |
| Less than High School | 0 (0.0%) | 0.0 |
| High School Diploma | 0 (0.0%) | 0.0 |
| College or Associate's Degree | 0 (0.0%) | 0.0 |
| Bachelor's Degree | 0 (0.0%) | 0.0 |
| Graduate Degree | 0 (0.0%) | 0.0 |
| Total | 0 (0.0%) | 0.0 |
Fertility by Education by Marriage Status in Jennings
| Educational Attainment | Married | Unmarried |
| Less than High School | 0 (0.0%) | 0 (0.0%) |
| High School Diploma | 0 (0.0%) | 0 (0.0%) |
| College or Associate's Degree | 0 (0.0%) | 0 (0.0%) |
| Bachelor's Degree | 0 (0.0%) | 0 (0.0%) |
| Graduate Degree | 0 (0.0%) | 0 (0.0%) |
| Total | 0 (0.0%) | 0 (0.0%) |
Employment Characteristics in Jennings
Employment by Class of Employer in Jennings
Among the 85 employed individuals in Jennings, private company employees (77 | 90.6%), and not-for-profit organizations (8 | 9.4%) make up the most common classes of employment.
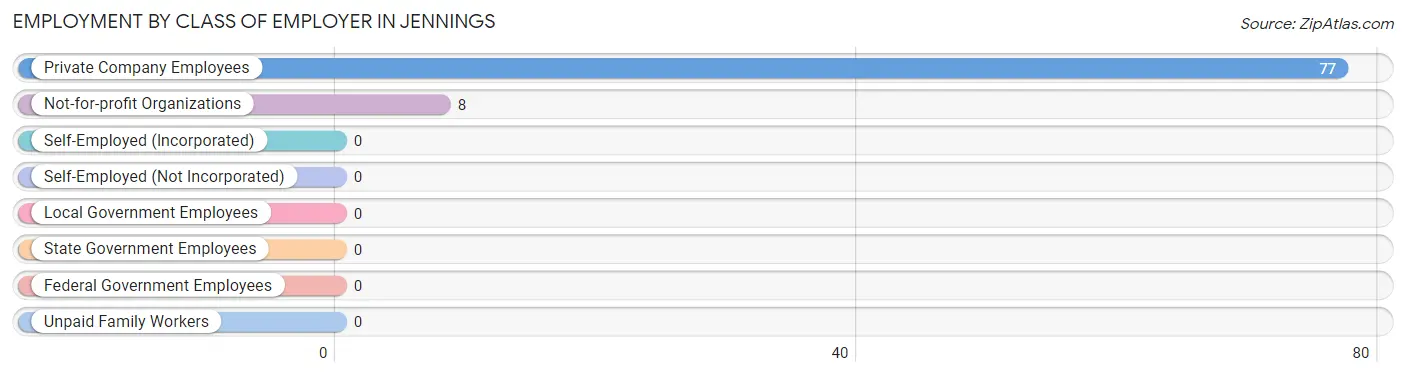
| Employer Class | # Employees | % Employees |
| Private Company Employees | 77 | 90.6% |
| Self-Employed (Incorporated) | 0 | 0.0% |
| Self-Employed (Not Incorporated) | 0 | 0.0% |
| Not-for-profit Organizations | 8 | 9.4% |
| Local Government Employees | 0 | 0.0% |
| State Government Employees | 0 | 0.0% |
| Federal Government Employees | 0 | 0.0% |
| Unpaid Family Workers | 0 | 0.0% |
| Total | 85 | 100.0% |
Employment Status by Age in Jennings
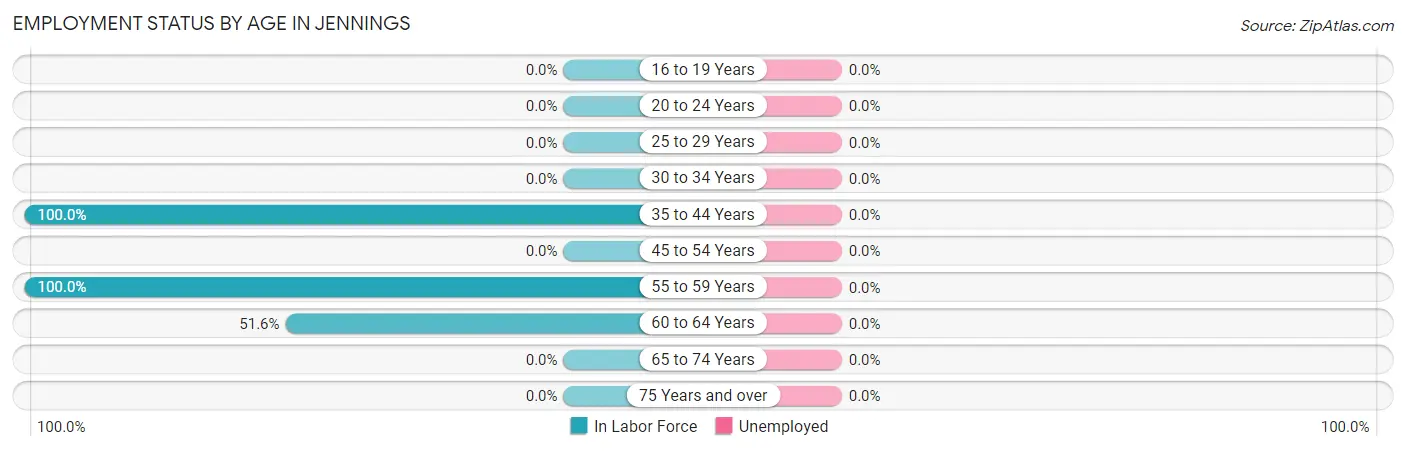
| Age Bracket | In Labor Force | Unemployed |
| 16 to 19 Years | 0 (0.0%) | 0 (0.0%) |
| 20 to 24 Years | 0 (0.0%) | 0 (0.0%) |
| 25 to 29 Years | 0 (0.0%) | 0 (0.0%) |
| 30 to 34 Years | 0 (0.0%) | 0 (0.0%) |
| 35 to 44 Years | 36 (100.0%) | 0 (0.0%) |
| 45 to 54 Years | 0 (0.0%) | 0 (0.0%) |
| 55 to 59 Years | 33 (100.0%) | 0 (0.0%) |
| 60 to 64 Years | 16 (51.6%) | 0 (0.0%) |
| 65 to 74 Years | 0 (0.0%) | 0 (0.0%) |
| 75 Years and over | 0 (0.0%) | 0 (0.0%) |
| Total | 85 (48.0%) | 0 (0.0%) |
Employment Status by Educational Attainment in Jennings
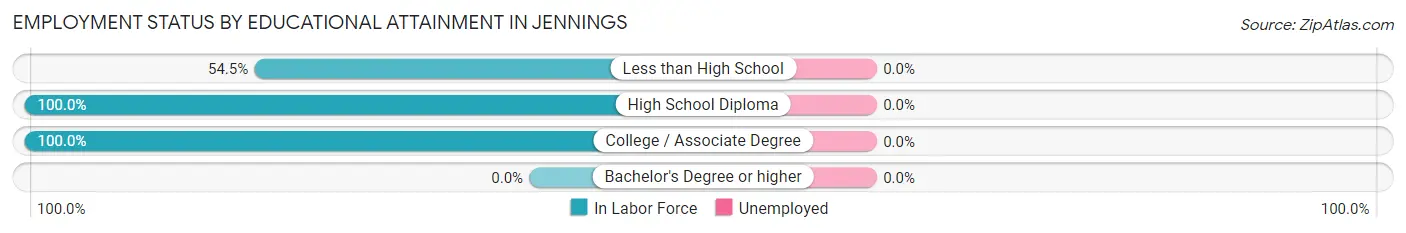
| Educational Attainment | In Labor Force | Unemployed |
| Less than High School | 18 (54.5%) | 0 (0.0%) |
| High School Diploma | 56 (100.0%) | 0 (0.0%) |
| College / Associate Degree | 11 (100.0%) | 0 (0.0%) |
| Bachelor's Degree or higher | 0 (0.0%) | 0 (0.0%) |
| Total | 85 (85.0%) | 0 (0.0%) |
Employment Occupations by Sex in Jennings
Management, Business, Science and Arts Occupations
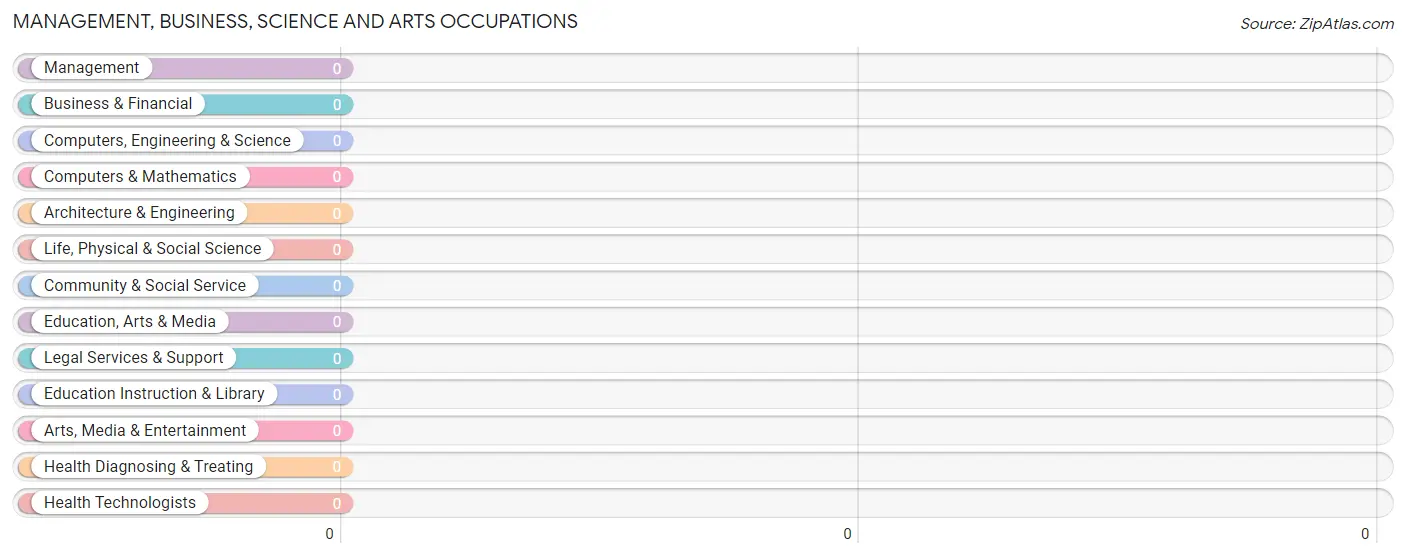
Management, Business, Science and Arts Occupations by Sex
| Occupation | Male | Female |
| Management | 0 (0.0%) | 0 (0.0%) |
| Business & Financial | 0 (0.0%) | 0 (0.0%) |
| Computers, Engineering & Science | 0 (0.0%) | 0 (0.0%) |
| Computers & Mathematics | 0 (0.0%) | 0 (0.0%) |
| Architecture & Engineering | 0 (0.0%) | 0 (0.0%) |
| Life, Physical & Social Science | 0 (0.0%) | 0 (0.0%) |
| Community & Social Service | 0 (0.0%) | 0 (0.0%) |
| Education, Arts & Media | 0 (0.0%) | 0 (0.0%) |
| Legal Services & Support | 0 (0.0%) | 0 (0.0%) |
| Education Instruction & Library | 0 (0.0%) | 0 (0.0%) |
| Arts, Media & Entertainment | 0 (0.0%) | 0 (0.0%) |
| Health Diagnosing & Treating | 0 (0.0%) | 0 (0.0%) |
| Health Technologists | 0 (0.0%) | 0 (0.0%) |
| Total (Category) | 0 (0.0%) | 0 (0.0%) |
| Total (Overall) | 24 (28.2%) | 61 (71.8%) |
Services Occupations
The most common Services occupations in Jennings are Healthcare Support (18 | 21.2%), and Cleaning & Maintenance (8 | 9.4%).
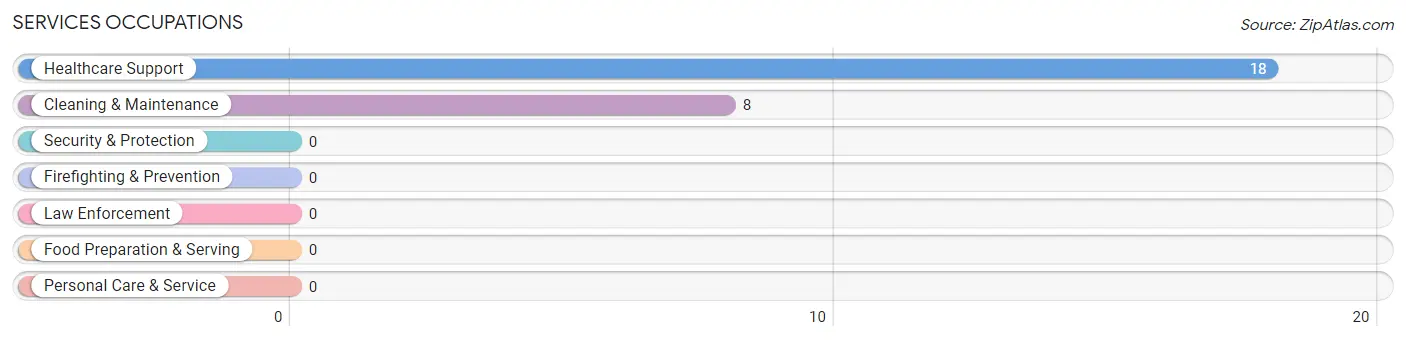
Services Occupations by Sex
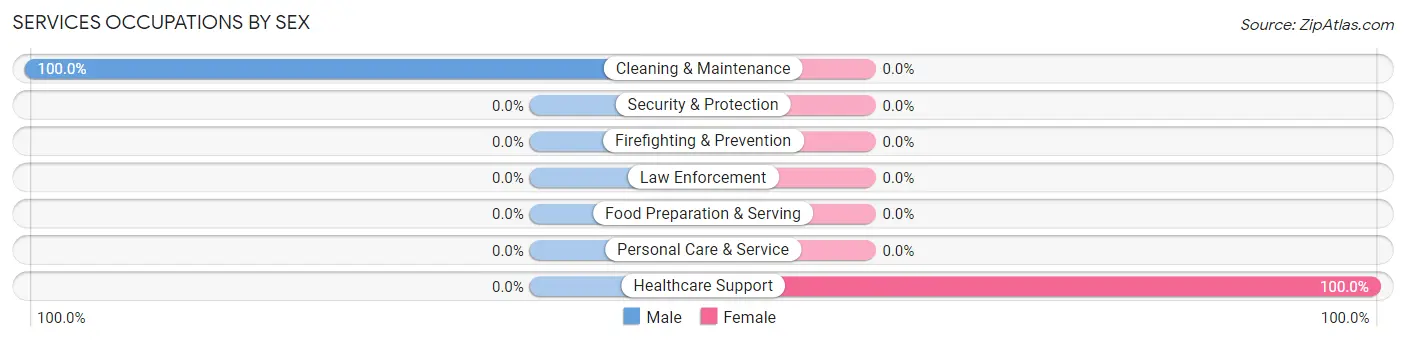
| Occupation | Male | Female |
| Healthcare Support | 0 (0.0%) | 18 (100.0%) |
| Security & Protection | 0 (0.0%) | 0 (0.0%) |
| Firefighting & Prevention | 0 (0.0%) | 0 (0.0%) |
| Law Enforcement | 0 (0.0%) | 0 (0.0%) |
| Food Preparation & Serving | 0 (0.0%) | 0 (0.0%) |
| Cleaning & Maintenance | 8 (100.0%) | 0 (0.0%) |
| Personal Care & Service | 0 (0.0%) | 0 (0.0%) |
| Total (Category) | 8 (30.8%) | 18 (69.2%) |
| Total (Overall) | 24 (28.2%) | 61 (71.8%) |
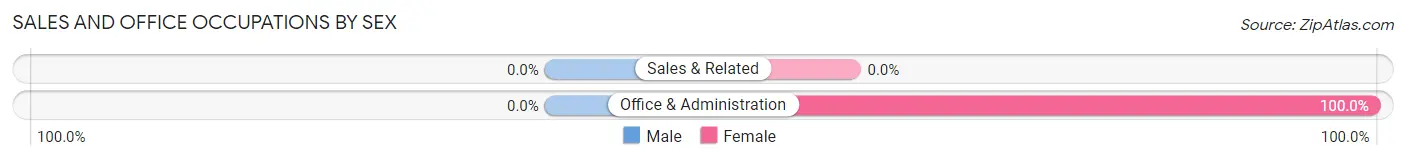
Sales and Office Occupations
The most common Sales and Office occupations in Jennings are , and Office & Administration (18 | 21.2%).
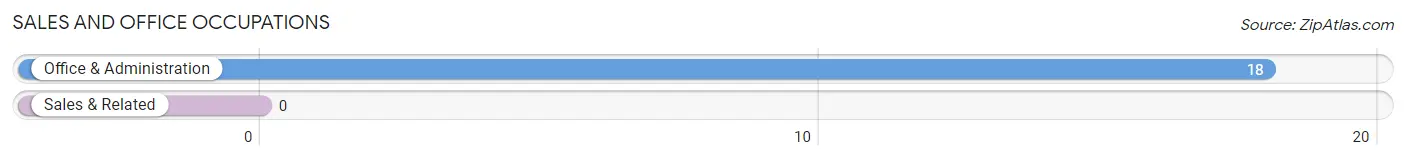
Sales and Office Occupations by Sex
| Occupation | Male | Female |
| Sales & Related | 0 (0.0%) | 0 (0.0%) |
| Office & Administration | 0 (0.0%) | 18 (100.0%) |
| Total (Category) | 0 (0.0%) | 18 (100.0%) |
| Total (Overall) | 24 (28.2%) | 61 (71.8%) |
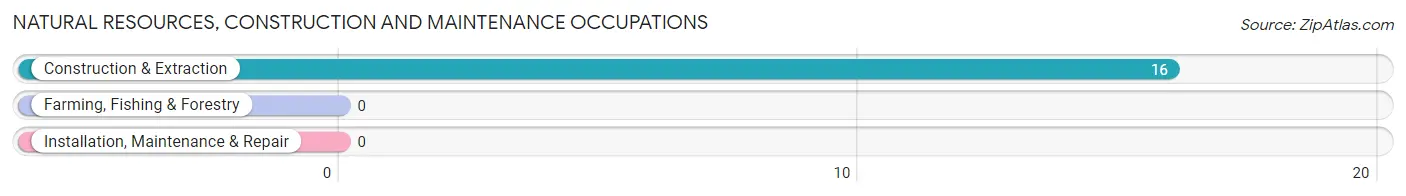
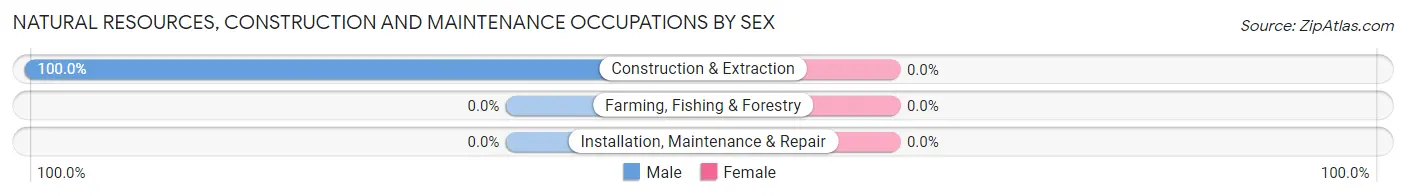
Natural Resources, Construction and Maintenance Occupations
The most common Natural Resources, Construction and Maintenance occupations in Jennings are , and Construction & Extraction (16 | 18.8%).
Natural Resources, Construction and Maintenance Occupations by Sex
| Occupation | Male | Female |
| Farming, Fishing & Forestry | 0 (0.0%) | 0 (0.0%) |
| Construction & Extraction | 16 (100.0%) | 0 (0.0%) |
| Installation, Maintenance & Repair | 0 (0.0%) | 0 (0.0%) |
| Total (Category) | 16 (100.0%) | 0 (0.0%) |
| Total (Overall) | 24 (28.2%) | 61 (71.8%) |
Production, Transportation and Moving Occupations
The most common Production, Transportation and Moving occupations in Jennings are Production (14 | 16.5%), and Material Moving (11 | 12.9%).
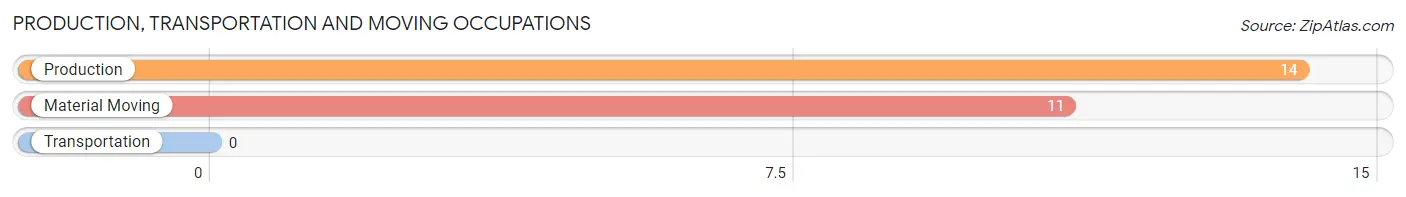
Production, Transportation and Moving Occupations by Sex
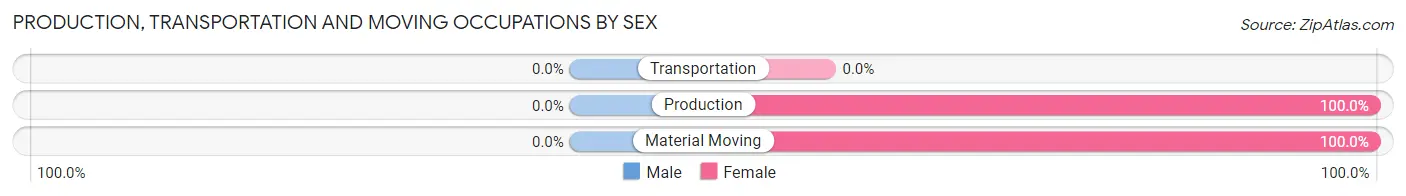
| Occupation | Male | Female |
| Production | 0 (0.0%) | 14 (100.0%) |
| Transportation | 0 (0.0%) | 0 (0.0%) |
| Material Moving | 0 (0.0%) | 11 (100.0%) |
| Total (Category) | 0 (0.0%) | 25 (100.0%) |
| Total (Overall) | 24 (28.2%) | 61 (71.8%) |
Employment Industries by Sex in Jennings
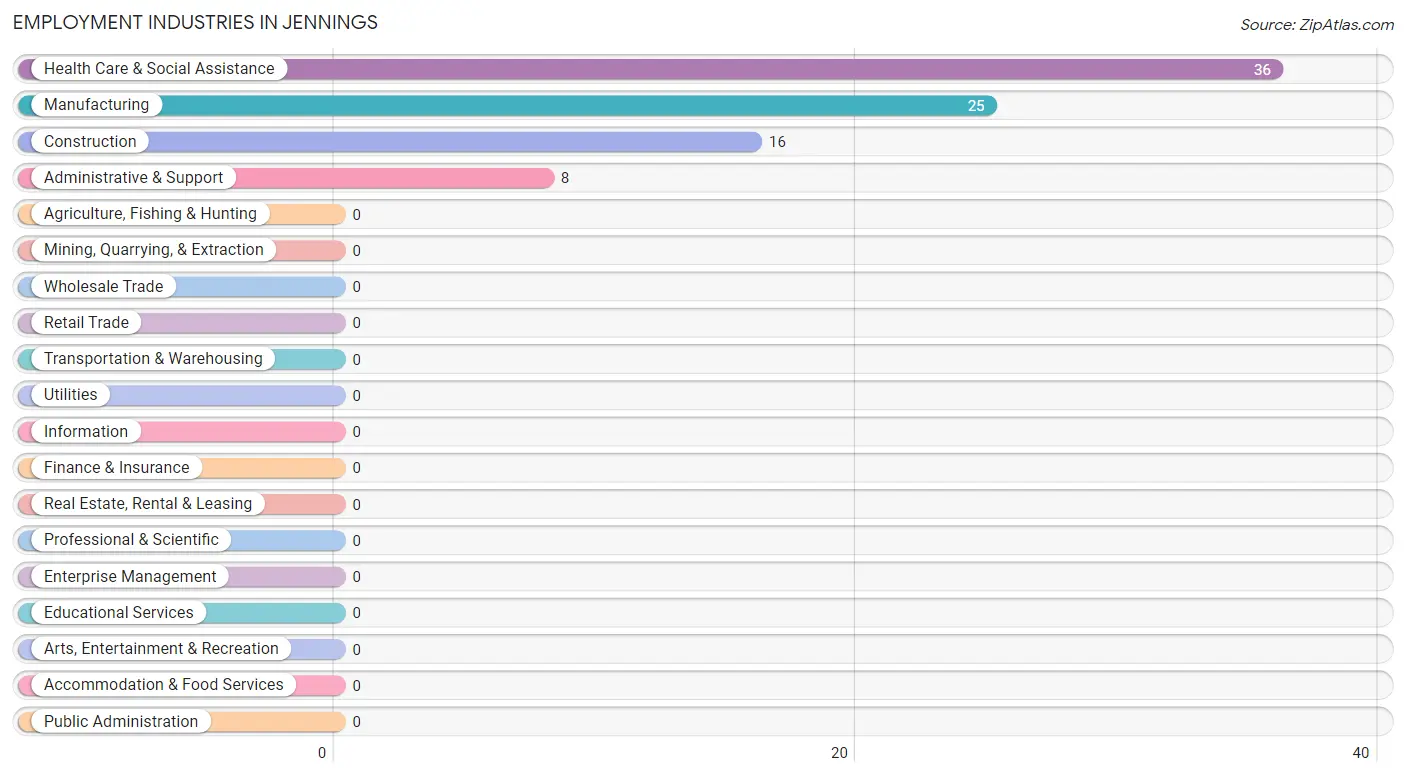
Employment Industries in Jennings
The major employment industries in Jennings include Health Care & Social Assistance (36 | 42.3%), Manufacturing (25 | 29.4%), Construction (16 | 18.8%), and Administrative & Support (8 | 9.4%).
Employment Industries by Sex in Jennings
The Jennings industries that see more men than women are Construction (100.0%), and Administrative & Support (100.0%), whereas the industries that tend to have a higher number of women are Manufacturing (100.0%), and Health Care & Social Assistance (100.0%).
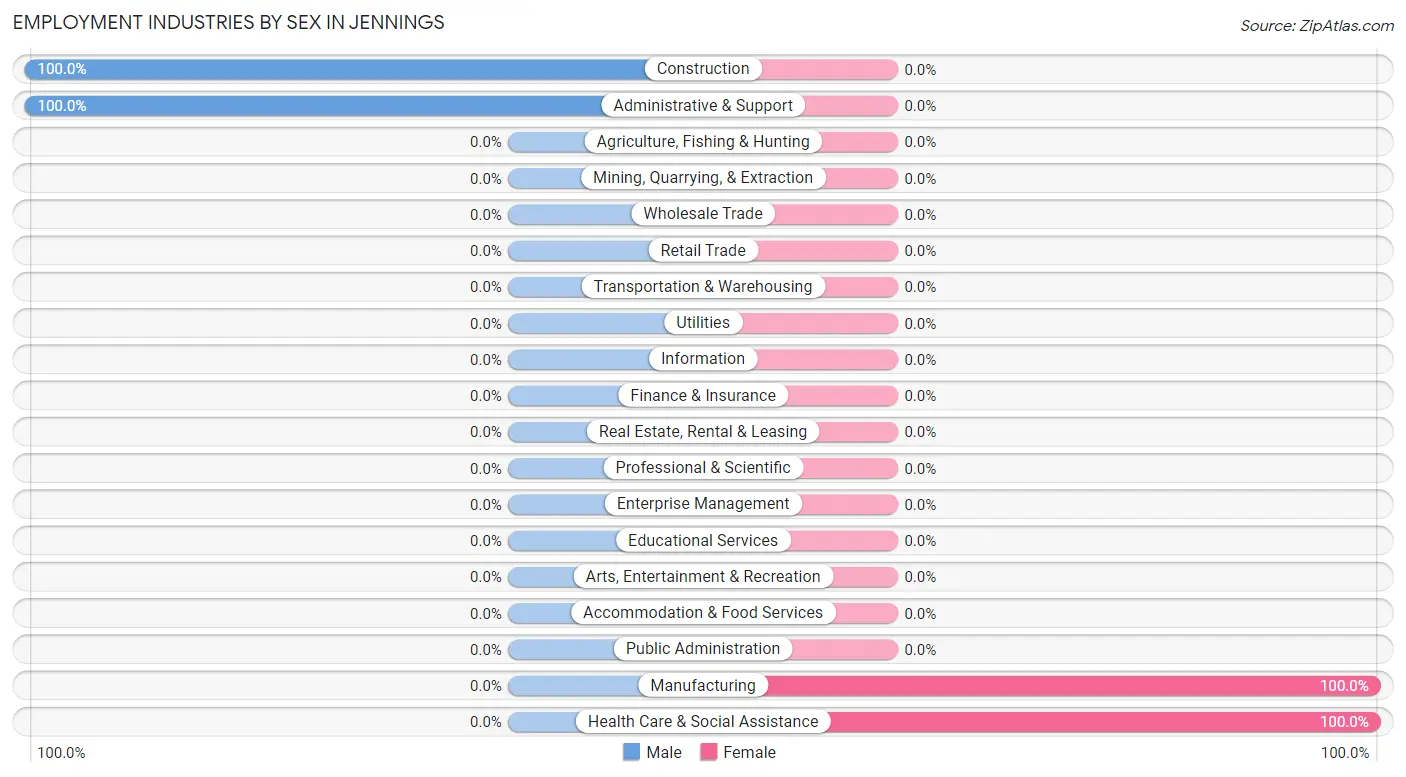
| Industry | Male | Female |
| Agriculture, Fishing & Hunting | 0 (0.0%) | 0 (0.0%) |
| Mining, Quarrying, & Extraction | 0 (0.0%) | 0 (0.0%) |
| Construction | 16 (100.0%) | 0 (0.0%) |
| Manufacturing | 0 (0.0%) | 25 (100.0%) |
| Wholesale Trade | 0 (0.0%) | 0 (0.0%) |
| Retail Trade | 0 (0.0%) | 0 (0.0%) |
| Transportation & Warehousing | 0 (0.0%) | 0 (0.0%) |
| Utilities | 0 (0.0%) | 0 (0.0%) |
| Information | 0 (0.0%) | 0 (0.0%) |
| Finance & Insurance | 0 (0.0%) | 0 (0.0%) |
| Real Estate, Rental & Leasing | 0 (0.0%) | 0 (0.0%) |
| Professional & Scientific | 0 (0.0%) | 0 (0.0%) |
| Enterprise Management | 0 (0.0%) | 0 (0.0%) |
| Administrative & Support | 8 (100.0%) | 0 (0.0%) |
| Educational Services | 0 (0.0%) | 0 (0.0%) |
| Health Care & Social Assistance | 0 (0.0%) | 36 (100.0%) |
| Arts, Entertainment & Recreation | 0 (0.0%) | 0 (0.0%) |
| Accommodation & Food Services | 0 (0.0%) | 0 (0.0%) |
| Public Administration | 0 (0.0%) | 0 (0.0%) |
| Total | 24 (28.2%) | 61 (71.8%) |
Education in Jennings
School Enrollment in Jennings
The most common levels of schooling among the 25 students in Jennings are elementary school (18 | 72.0%), and high school (7 | 28.0%).
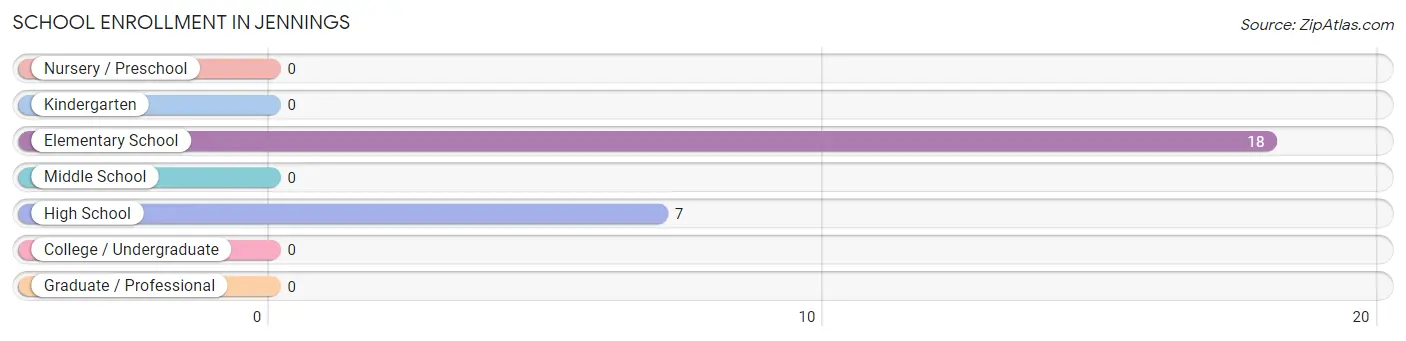
| School Level | # Students | % Students |
| Nursery / Preschool | 0 | 0.0% |
| Kindergarten | 0 | 0.0% |
| Elementary School | 18 | 72.0% |
| Middle School | 0 | 0.0% |
| High School | 7 | 28.0% |
| College / Undergraduate | 0 | 0.0% |
| Graduate / Professional | 0 | 0.0% |
| Total | 25 | 100.0% |
School Enrollment by Age by Funding Source in Jennings
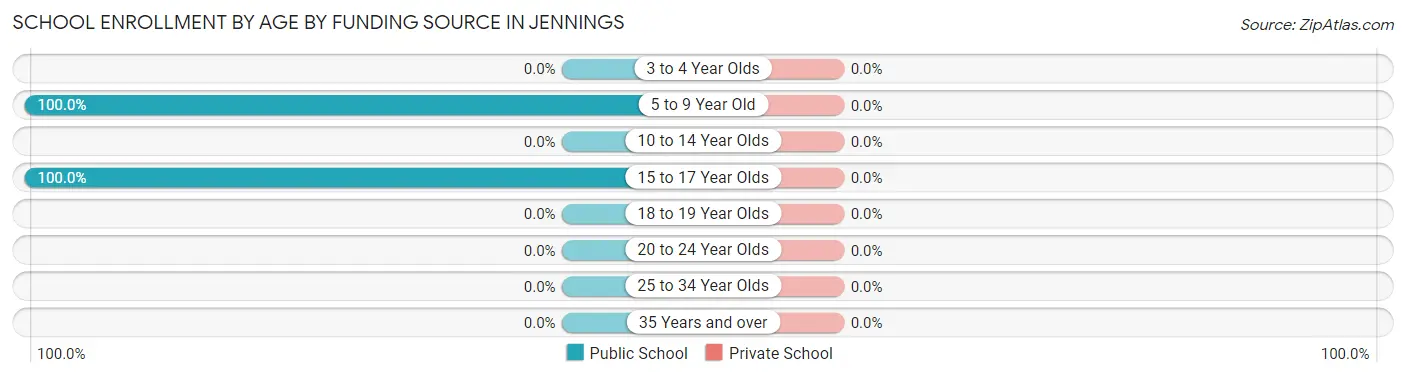
| Age Bracket | Public School | Private School |
| 3 to 4 Year Olds | 0 (0.0%) | 0 (0.0%) |
| 5 to 9 Year Old | 18 (100.0%) | 0 (0.0%) |
| 10 to 14 Year Olds | 0 (0.0%) | 0 (0.0%) |
| 15 to 17 Year Olds | 7 (100.0%) | 0 (0.0%) |
| 18 to 19 Year Olds | 0 (0.0%) | 0 (0.0%) |
| 20 to 24 Year Olds | 0 (0.0%) | 0 (0.0%) |
| 25 to 34 Year Olds | 0 (0.0%) | 0 (0.0%) |
| 35 Years and over | 0 (0.0%) | 0 (0.0%) |
| Total | 25 (100.0%) | 0 (0.0%) |
Educational Attainment by Field of Study in Jennings
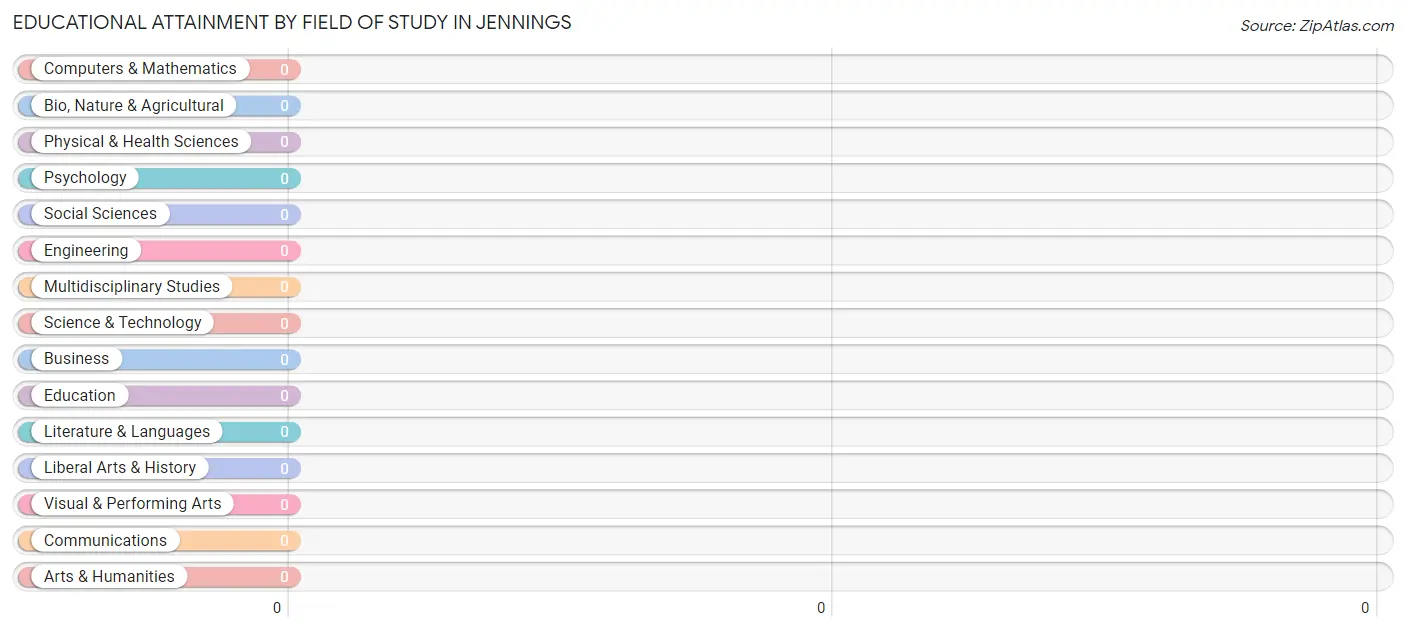
| Field of Study | # Graduates | % Graduates |
| Computers & Mathematics | 0 | 0.0% |
| Bio, Nature & Agricultural | 0 | 0.0% |
| Physical & Health Sciences | 0 | 0.0% |
| Psychology | 0 | 0.0% |
| Social Sciences | 0 | 0.0% |
| Engineering | 0 | 0.0% |
| Multidisciplinary Studies | 0 | 0.0% |
| Science & Technology | 0 | 0.0% |
| Business | 0 | 0.0% |
| Education | 0 | 0.0% |
| Literature & Languages | 0 | 0.0% |
| Liberal Arts & History | 0 | 0.0% |
| Visual & Performing Arts | 0 | 0.0% |
| Communications | 0 | 0.0% |
| Arts & Humanities | 0 | 0.0% |
| Total | 0 | 0.0% |
Transportation & Commute in Jennings
Vehicle Availability by Sex in Jennings
The most prevalent vehicle ownership categories in Jennings are males with 3 vehicles (16, accounting for 66.7%) and females with 3 vehicles (18, making up 26.2%).
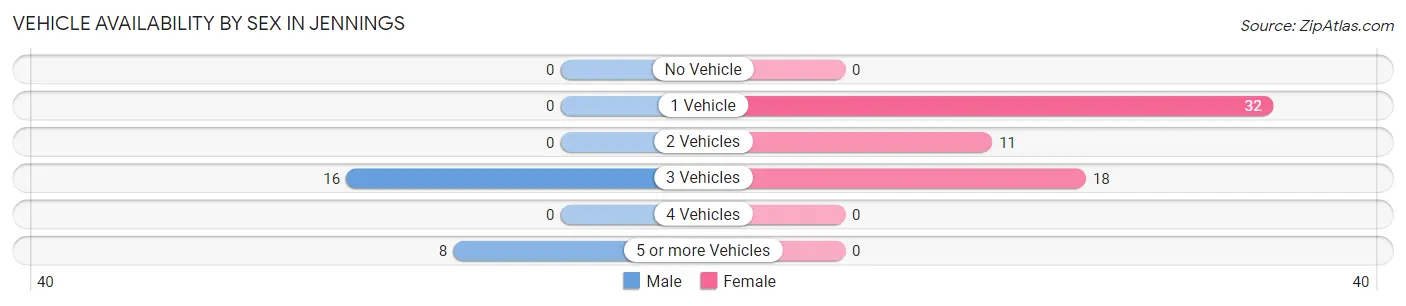
| Vehicles Available | Male | Female |
| No Vehicle | 0 (0.0%) | 0 (0.0%) |
| 1 Vehicle | 0 (0.0%) | 32 (52.5%) |
| 2 Vehicles | 0 (0.0%) | 11 (18.0%) |
| 3 Vehicles | 16 (66.7%) | 18 (29.5%) |
| 4 Vehicles | 0 (0.0%) | 0 (0.0%) |
| 5 or more Vehicles | 8 (33.3%) | 0 (0.0%) |
| Total | 24 (100.0%) | 61 (100.0%) |
Commute Time in Jennings
The most frequently occuring commute durations in Jennings are 15 to 19 minutes (26 commuters, 30.6%), 30 to 34 minutes (18 commuters, 21.2%), and 60 to 89 minutes (16 commuters, 18.8%).
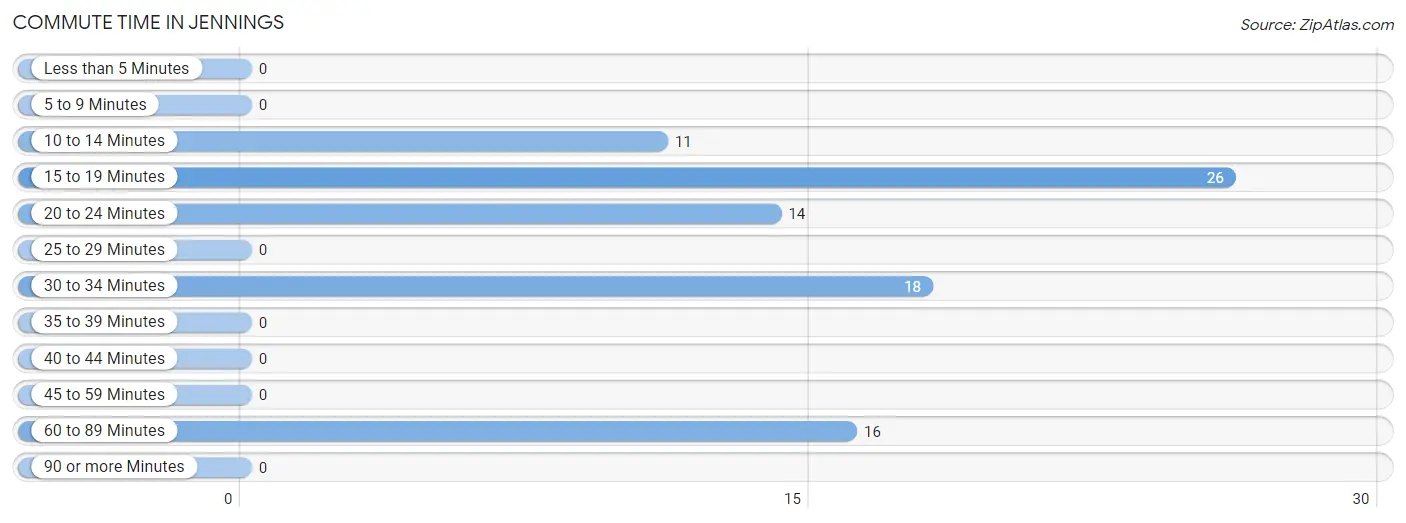
| Commute Time | # Commuters | % Commuters |
| Less than 5 Minutes | 0 | 0.0% |
| 5 to 9 Minutes | 0 | 0.0% |
| 10 to 14 Minutes | 11 | 12.9% |
| 15 to 19 Minutes | 26 | 30.6% |
| 20 to 24 Minutes | 14 | 16.5% |
| 25 to 29 Minutes | 0 | 0.0% |
| 30 to 34 Minutes | 18 | 21.2% |
| 35 to 39 Minutes | 0 | 0.0% |
| 40 to 44 Minutes | 0 | 0.0% |
| 45 to 59 Minutes | 0 | 0.0% |
| 60 to 89 Minutes | 16 | 18.8% |
| 90 or more Minutes | 0 | 0.0% |
Commute Time by Sex in Jennings
The most common commute times in Jennings are 60 to 89 minutes (16 commuters, 66.7%) for males and 15 to 19 minutes (18 commuters, 29.5%) for females.
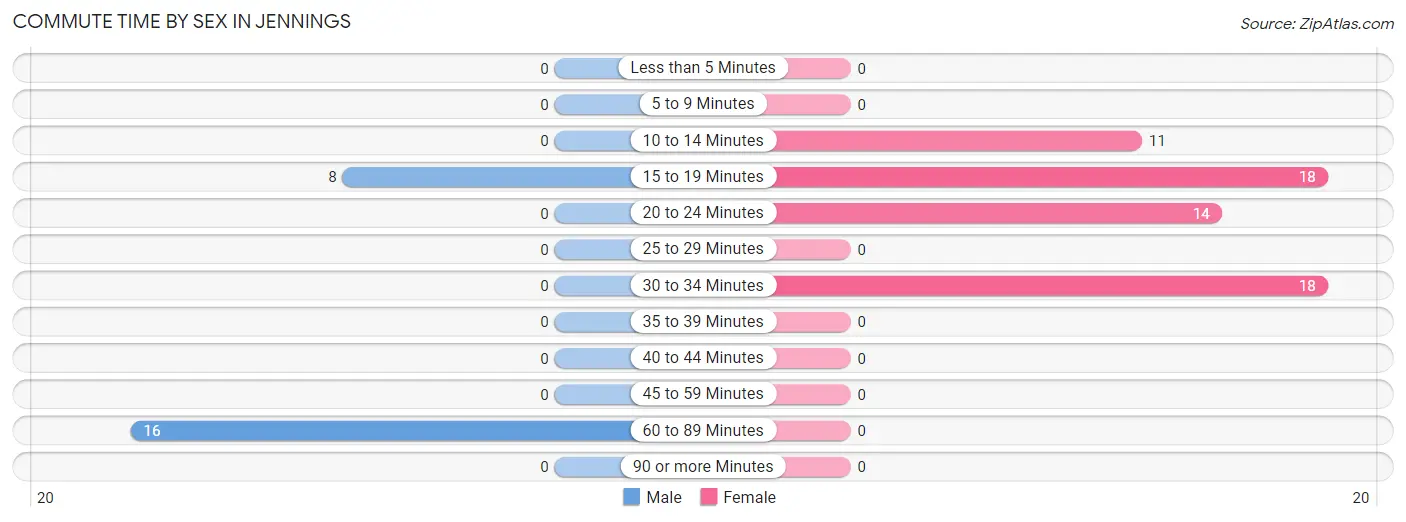
| Commute Time | Male | Female |
| Less than 5 Minutes | 0 (0.0%) | 0 (0.0%) |
| 5 to 9 Minutes | 0 (0.0%) | 0 (0.0%) |
| 10 to 14 Minutes | 0 (0.0%) | 11 (18.0%) |
| 15 to 19 Minutes | 8 (33.3%) | 18 (29.5%) |
| 20 to 24 Minutes | 0 (0.0%) | 14 (23.0%) |
| 25 to 29 Minutes | 0 (0.0%) | 0 (0.0%) |
| 30 to 34 Minutes | 0 (0.0%) | 18 (29.5%) |
| 35 to 39 Minutes | 0 (0.0%) | 0 (0.0%) |
| 40 to 44 Minutes | 0 (0.0%) | 0 (0.0%) |
| 45 to 59 Minutes | 0 (0.0%) | 0 (0.0%) |
| 60 to 89 Minutes | 16 (66.7%) | 0 (0.0%) |
| 90 or more Minutes | 0 (0.0%) | 0 (0.0%) |
Time of Departure to Work by Sex in Jennings
The most frequent times of departure to work in Jennings are 7:00 AM to 7:29 AM (16, 66.7%) for males and 12:00 AM to 4:59 AM (25, 41.0%) for females.
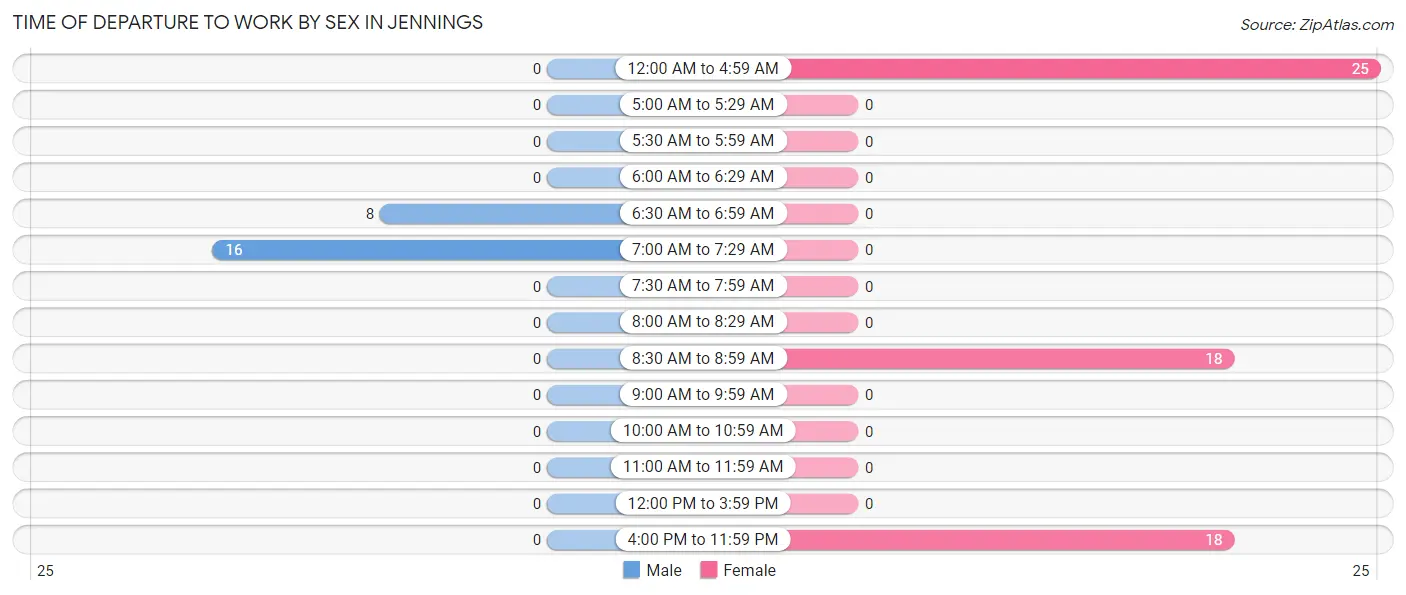
| Time of Departure | Male | Female |
| 12:00 AM to 4:59 AM | 0 (0.0%) | 25 (41.0%) |
| 5:00 AM to 5:29 AM | 0 (0.0%) | 0 (0.0%) |
| 5:30 AM to 5:59 AM | 0 (0.0%) | 0 (0.0%) |
| 6:00 AM to 6:29 AM | 0 (0.0%) | 0 (0.0%) |
| 6:30 AM to 6:59 AM | 8 (33.3%) | 0 (0.0%) |
| 7:00 AM to 7:29 AM | 16 (66.7%) | 0 (0.0%) |
| 7:30 AM to 7:59 AM | 0 (0.0%) | 0 (0.0%) |
| 8:00 AM to 8:29 AM | 0 (0.0%) | 0 (0.0%) |
| 8:30 AM to 8:59 AM | 0 (0.0%) | 18 (29.5%) |
| 9:00 AM to 9:59 AM | 0 (0.0%) | 0 (0.0%) |
| 10:00 AM to 10:59 AM | 0 (0.0%) | 0 (0.0%) |
| 11:00 AM to 11:59 AM | 0 (0.0%) | 0 (0.0%) |
| 12:00 PM to 3:59 PM | 0 (0.0%) | 0 (0.0%) |
| 4:00 PM to 11:59 PM | 0 (0.0%) | 18 (29.5%) |
| Total | 24 (100.0%) | 61 (100.0%) |
Housing Occupancy in Jennings
Occupancy by Ownership in Jennings
Of the total 78 dwellings in Jennings, owner-occupied units account for 60 (76.9%), while renter-occupied units make up 18 (23.1%).
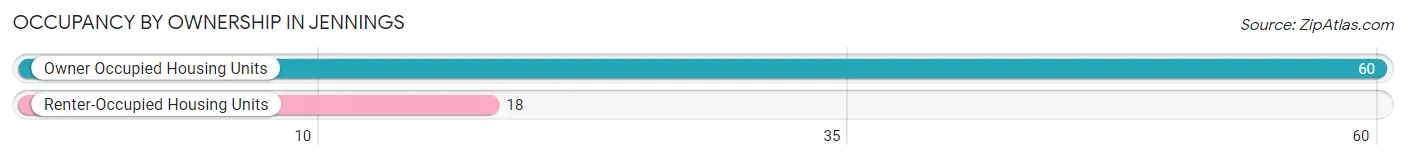
| Occupancy | # Housing Units | % Housing Units |
| Owner Occupied Housing Units | 60 | 76.9% |
| Renter-Occupied Housing Units | 18 | 23.1% |
| Total Occupied Housing Units | 78 | 100.0% |
Occupancy by Household Size in Jennings
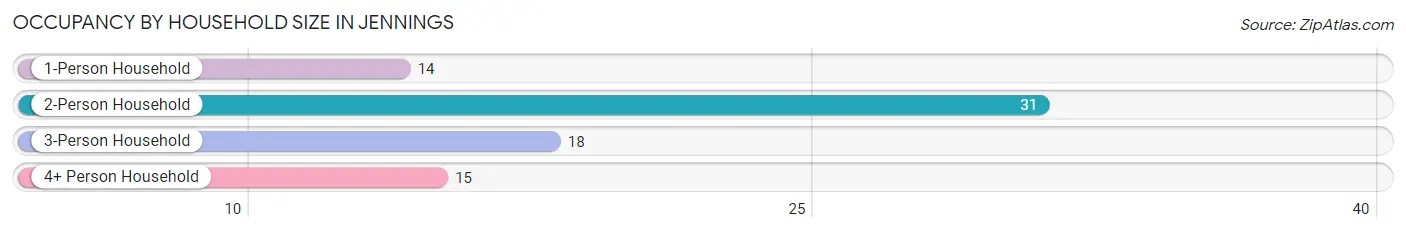
| Household Size | # Housing Units | % Housing Units |
| 1-Person Household | 14 | 17.9% |
| 2-Person Household | 31 | 39.7% |
| 3-Person Household | 18 | 23.1% |
| 4+ Person Household | 15 | 19.2% |
| Total Housing Units | 78 | 100.0% |
Occupancy by Ownership by Household Size in Jennings
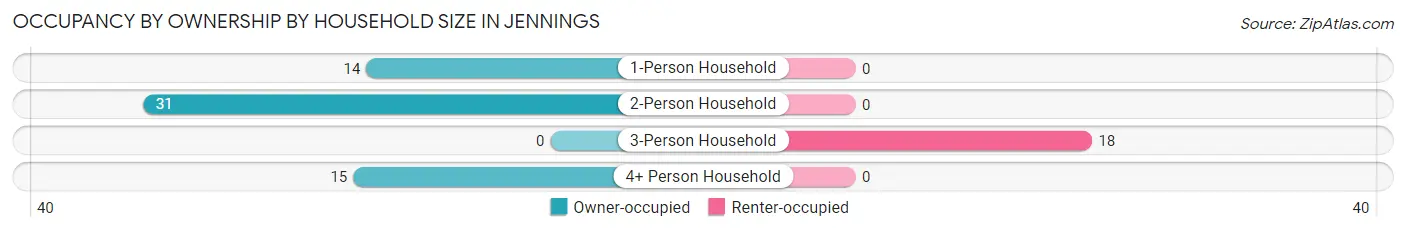
| Household Size | Owner-occupied | Renter-occupied |
| 1-Person Household | 14 (100.0%) | 0 (0.0%) |
| 2-Person Household | 31 (100.0%) | 0 (0.0%) |
| 3-Person Household | 0 (0.0%) | 18 (100.0%) |
| 4+ Person Household | 15 (100.0%) | 0 (0.0%) |
| Total Housing Units | 60 (76.9%) | 18 (23.1%) |
Occupancy by Educational Attainment in Jennings
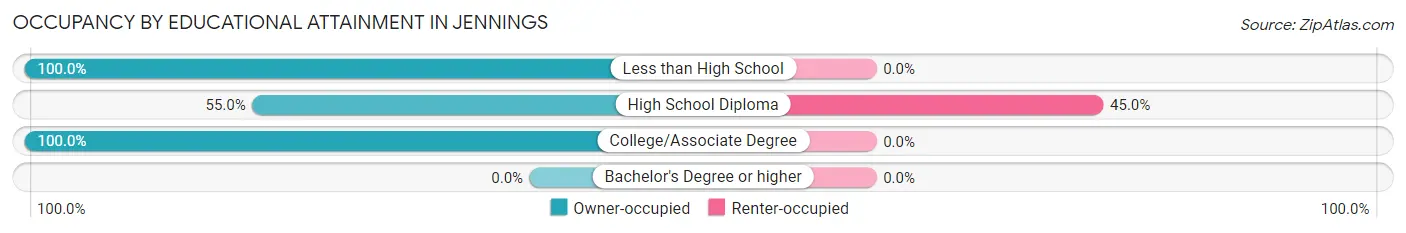
| Household Size | Owner-occupied | Renter-occupied |
| Less than High School | 15 (100.0%) | 0 (0.0%) |
| High School Diploma | 22 (55.0%) | 18 (45.0%) |
| College/Associate Degree | 23 (100.0%) | 0 (0.0%) |
| Bachelor's Degree or higher | 0 (0.0%) | 0 (0.0%) |
Occupancy by Age of Householder in Jennings
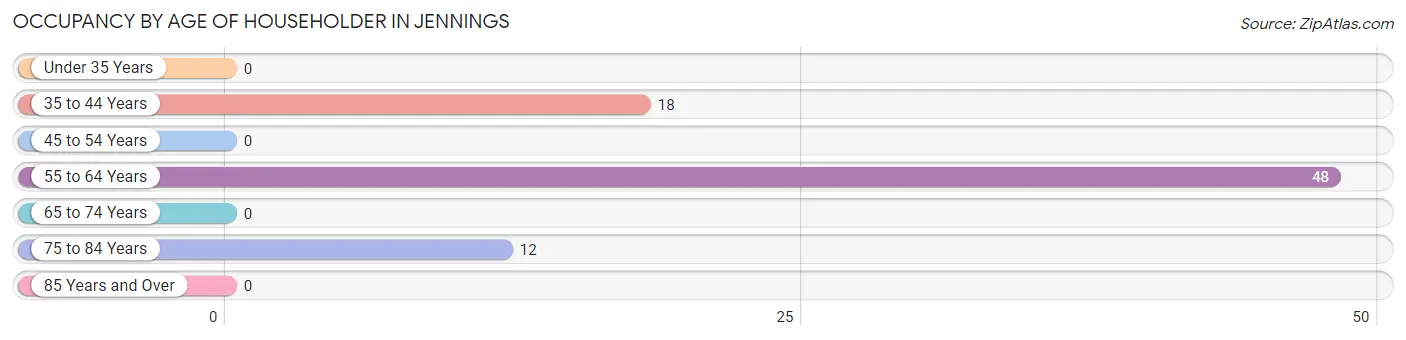
| Age Bracket | # Households | % Households |
| Under 35 Years | 0 | 0.0% |
| 35 to 44 Years | 18 | 23.1% |
| 45 to 54 Years | 0 | 0.0% |
| 55 to 64 Years | 48 | 61.5% |
| 65 to 74 Years | 0 | 0.0% |
| 75 to 84 Years | 12 | 15.4% |
| 85 Years and Over | 0 | 0.0% |
| Total | 78 | 100.0% |
Housing Finances in Jennings
Median Income by Occupancy in Jennings
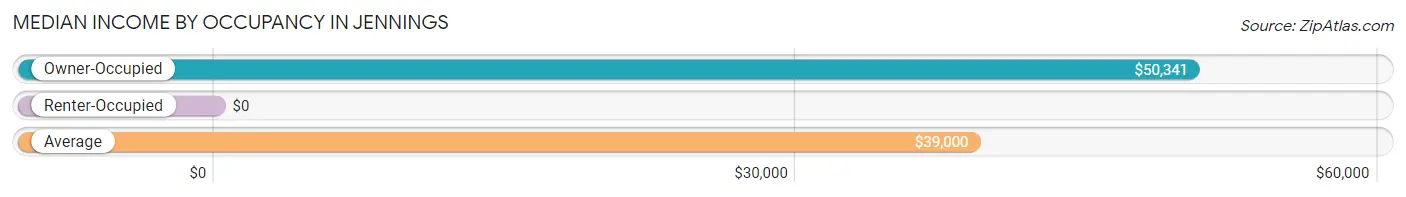
| Occupancy Type | # Households | Median Income |
| Owner-Occupied | 60 (76.9%) | $50,341 |
| Renter-Occupied | 18 (23.1%) | $0 |
| Average | 78 (100.0%) | $39,000 |
Occupancy by Householder Income Bracket in Jennings
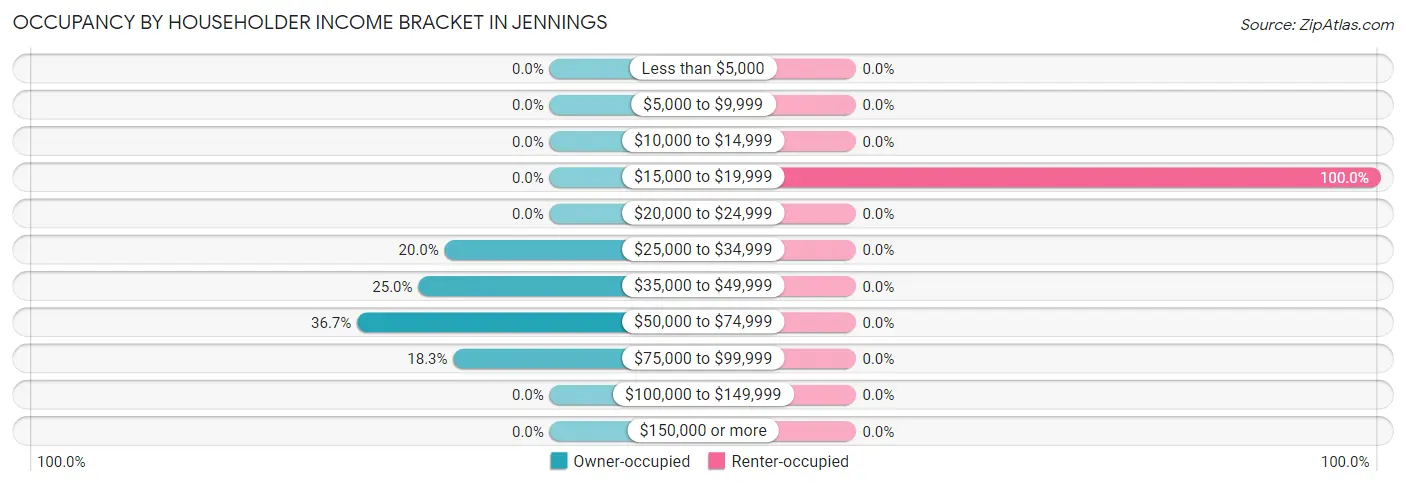
| Income Bracket | Owner-occupied | Renter-occupied |
| Less than $5,000 | 0 (0.0%) | 0 (0.0%) |
| $5,000 to $9,999 | 0 (0.0%) | 0 (0.0%) |
| $10,000 to $14,999 | 0 (0.0%) | 0 (0.0%) |
| $15,000 to $19,999 | 0 (0.0%) | 18 (100.0%) |
| $20,000 to $24,999 | 0 (0.0%) | 0 (0.0%) |
| $25,000 to $34,999 | 12 (20.0%) | 0 (0.0%) |
| $35,000 to $49,999 | 15 (25.0%) | 0 (0.0%) |
| $50,000 to $74,999 | 22 (36.7%) | 0 (0.0%) |
| $75,000 to $99,999 | 11 (18.3%) | 0 (0.0%) |
| $100,000 to $149,999 | 0 (0.0%) | 0 (0.0%) |
| $150,000 or more | 0 (0.0%) | 0 (0.0%) |
| Total | 60 (100.0%) | 18 (100.0%) |
Monthly Housing Cost Tiers in Jennings
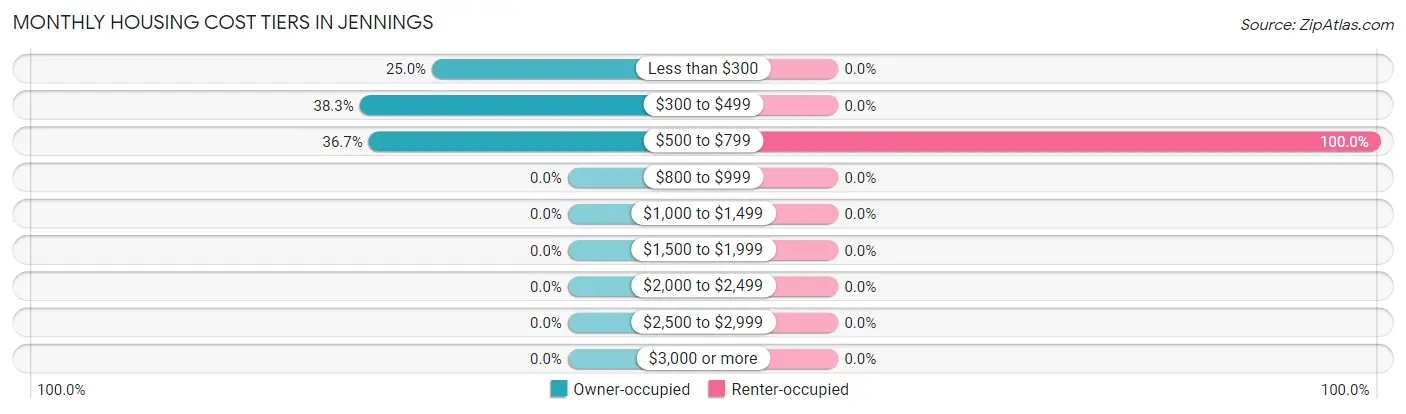
| Monthly Cost | Owner-occupied | Renter-occupied |
| Less than $300 | 15 (25.0%) | 0 (0.0%) |
| $300 to $499 | 23 (38.3%) | 0 (0.0%) |
| $500 to $799 | 22 (36.7%) | 18 (100.0%) |
| $800 to $999 | 0 (0.0%) | 0 (0.0%) |
| $1,000 to $1,499 | 0 (0.0%) | 0 (0.0%) |
| $1,500 to $1,999 | 0 (0.0%) | 0 (0.0%) |
| $2,000 to $2,499 | 0 (0.0%) | 0 (0.0%) |
| $2,500 to $2,999 | 0 (0.0%) | 0 (0.0%) |
| $3,000 or more | 0 (0.0%) | 0 (0.0%) |
| Total | 60 (100.0%) | 18 (100.0%) |
Physical Housing Characteristics in Jennings
Housing Structures in Jennings
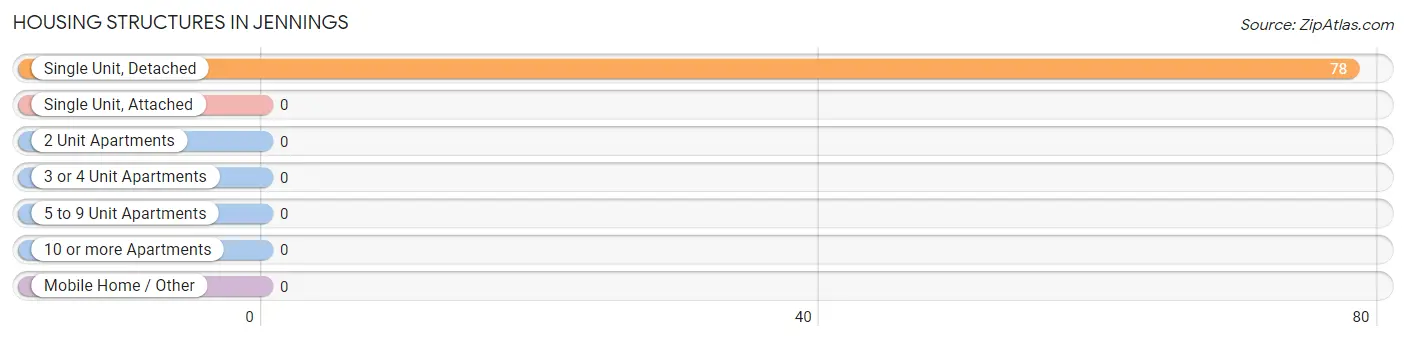
| Structure Type | # Housing Units | % Housing Units |
| Single Unit, Detached | 78 | 100.0% |
| Single Unit, Attached | 0 | 0.0% |
| 2 Unit Apartments | 0 | 0.0% |
| 3 or 4 Unit Apartments | 0 | 0.0% |
| 5 to 9 Unit Apartments | 0 | 0.0% |
| 10 or more Apartments | 0 | 0.0% |
| Mobile Home / Other | 0 | 0.0% |
| Total | 78 | 100.0% |
Housing Structures by Occupancy in Jennings
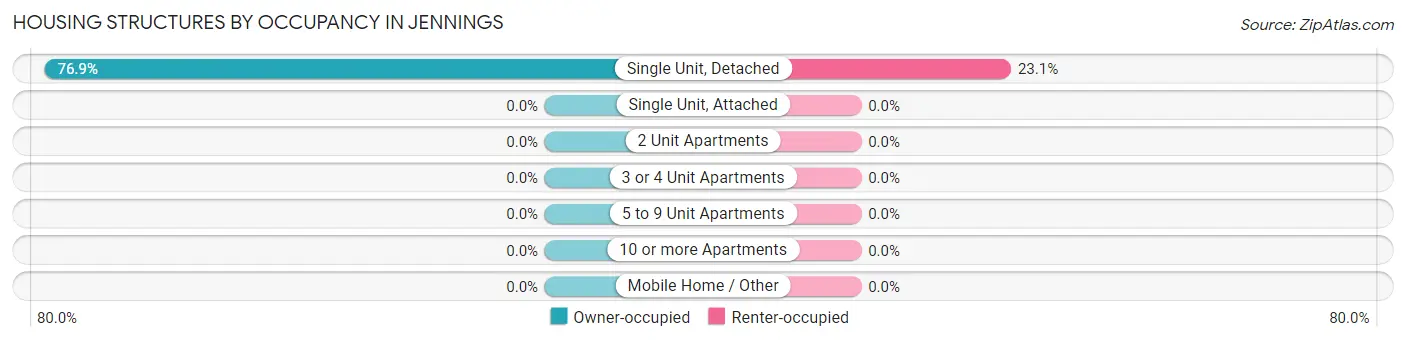
| Structure Type | Owner-occupied | Renter-occupied |
| Single Unit, Detached | 60 (76.9%) | 18 (23.1%) |
| Single Unit, Attached | 0 (0.0%) | 0 (0.0%) |
| 2 Unit Apartments | 0 (0.0%) | 0 (0.0%) |
| 3 or 4 Unit Apartments | 0 (0.0%) | 0 (0.0%) |
| 5 to 9 Unit Apartments | 0 (0.0%) | 0 (0.0%) |
| 10 or more Apartments | 0 (0.0%) | 0 (0.0%) |
| Mobile Home / Other | 0 (0.0%) | 0 (0.0%) |
| Total | 60 (76.9%) | 18 (23.1%) |
Housing Structures by Number of Rooms in Jennings
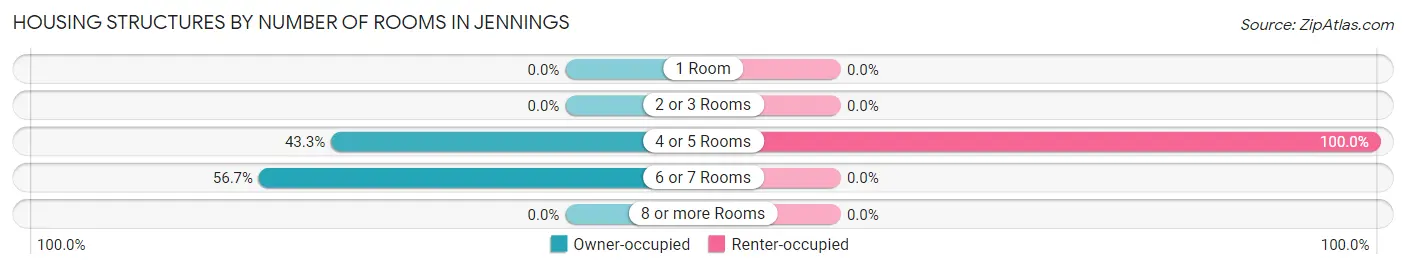
| Number of Rooms | Owner-occupied | Renter-occupied |
| 1 Room | 0 (0.0%) | 0 (0.0%) |
| 2 or 3 Rooms | 0 (0.0%) | 0 (0.0%) |
| 4 or 5 Rooms | 26 (43.3%) | 18 (100.0%) |
| 6 or 7 Rooms | 34 (56.7%) | 0 (0.0%) |
| 8 or more Rooms | 0 (0.0%) | 0 (0.0%) |
| Total | 60 (100.0%) | 18 (100.0%) |
Housing Structure by Heating Type in Jennings
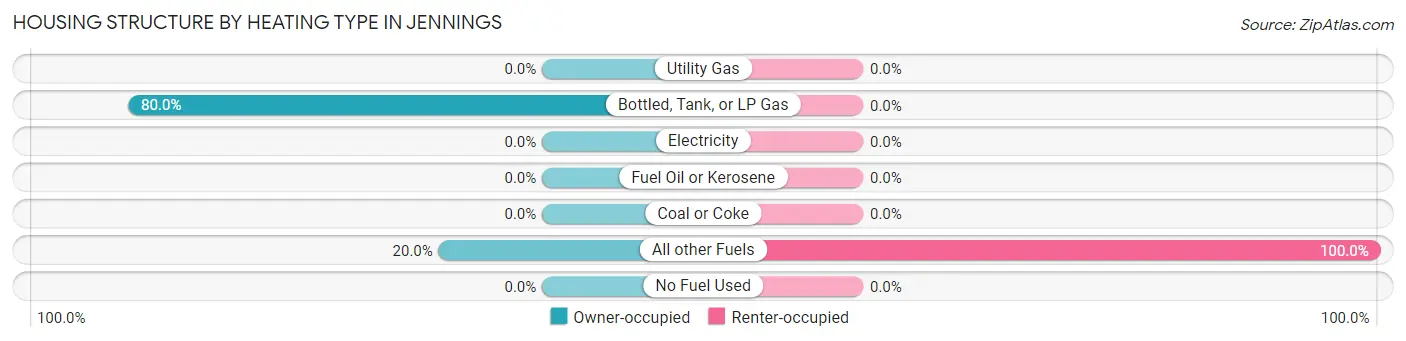
| Heating Type | Owner-occupied | Renter-occupied |
| Utility Gas | 0 (0.0%) | 0 (0.0%) |
| Bottled, Tank, or LP Gas | 48 (80.0%) | 0 (0.0%) |
| Electricity | 0 (0.0%) | 0 (0.0%) |
| Fuel Oil or Kerosene | 0 (0.0%) | 0 (0.0%) |
| Coal or Coke | 0 (0.0%) | 0 (0.0%) |
| All other Fuels | 12 (20.0%) | 18 (100.0%) |
| No Fuel Used | 0 (0.0%) | 0 (0.0%) |
| Total | 60 (100.0%) | 18 (100.0%) |
Household Vehicle Usage in Jennings
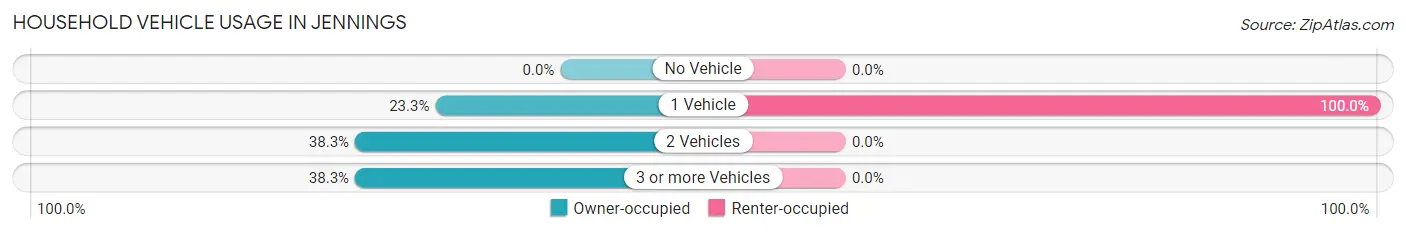
| Vehicles per Household | Owner-occupied | Renter-occupied |
| No Vehicle | 0 (0.0%) | 0 (0.0%) |
| 1 Vehicle | 14 (23.3%) | 18 (100.0%) |
| 2 Vehicles | 23 (38.3%) | 0 (0.0%) |
| 3 or more Vehicles | 23 (38.3%) | 0 (0.0%) |
| Total | 60 (100.0%) | 18 (100.0%) |
Real Estate & Mortgages in Jennings
Real Estate and Mortgage Overview in Jennings
| Characteristic | Without Mortgage | With Mortgage |
| Housing Units | 46 | 14 |
| Median Property Value | $95,000 | $0 |
| Median Household Income | $39,333 | $0 |
| Monthly Housing Costs | $333 | $0 |
| Real Estate Taxes | $1,000 | $0 |
Property Value by Mortgage Status in Jennings
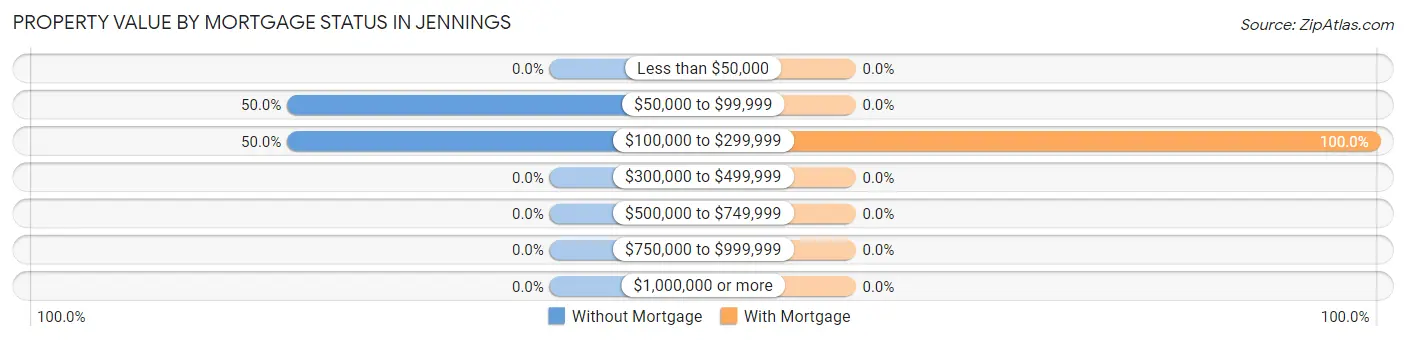
| Property Value | Without Mortgage | With Mortgage |
| Less than $50,000 | 0 (0.0%) | 0 (0.0%) |
| $50,000 to $99,999 | 23 (50.0%) | 0 (0.0%) |
| $100,000 to $299,999 | 23 (50.0%) | 14 (100.0%) |
| $300,000 to $499,999 | 0 (0.0%) | 0 (0.0%) |
| $500,000 to $749,999 | 0 (0.0%) | 0 (0.0%) |
| $750,000 to $999,999 | 0 (0.0%) | 0 (0.0%) |
| $1,000,000 or more | 0 (0.0%) | 0 (0.0%) |
| Total | 46 (100.0%) | 14 (100.0%) |
Household Income by Mortgage Status in Jennings
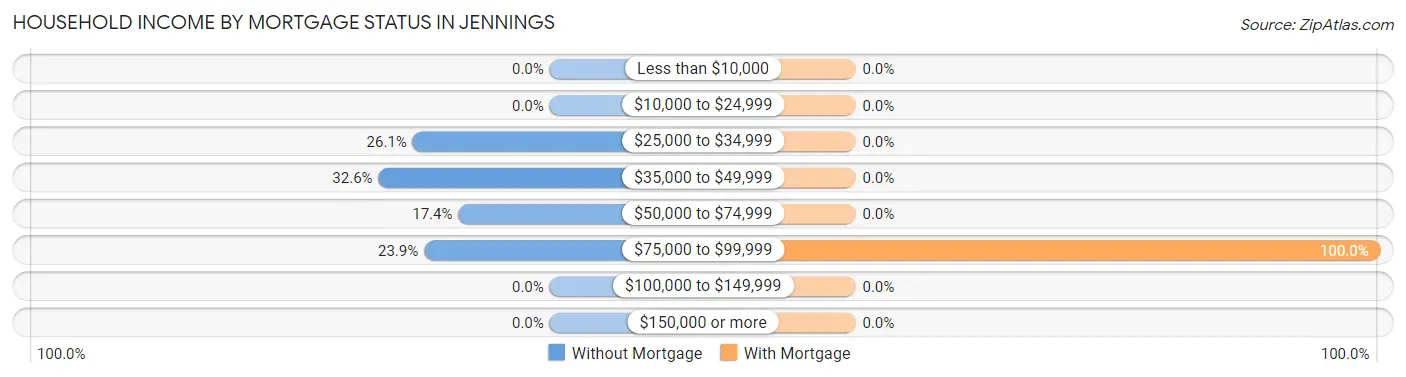
| Household Income | Without Mortgage | With Mortgage |
| Less than $10,000 | 0 (0.0%) | 0 (0.0%) |
| $10,000 to $24,999 | 0 (0.0%) | 0 (0.0%) |
| $25,000 to $34,999 | 12 (26.1%) | 0 (0.0%) |
| $35,000 to $49,999 | 15 (32.6%) | 0 (0.0%) |
| $50,000 to $74,999 | 8 (17.4%) | 0 (0.0%) |
| $75,000 to $99,999 | 11 (23.9%) | 14 (100.0%) |
| $100,000 to $149,999 | 0 (0.0%) | 0 (0.0%) |
| $150,000 or more | 0 (0.0%) | 0 (0.0%) |
| Total | 46 (100.0%) | 14 (100.0%) |
Property Value to Household Income Ratio in Jennings
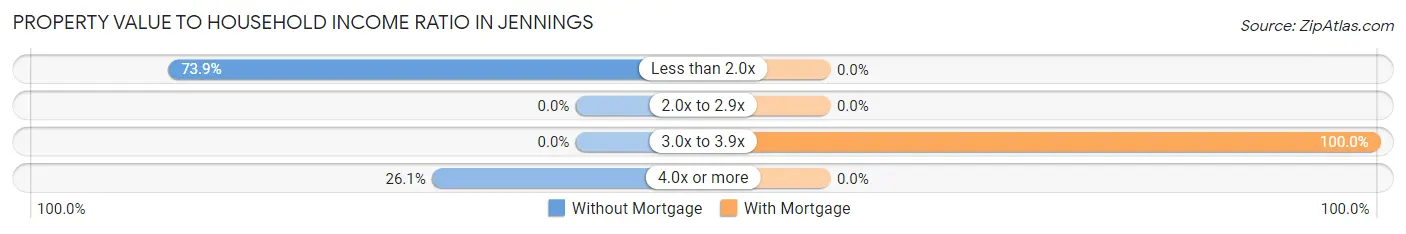
| Value-to-Income Ratio | Without Mortgage | With Mortgage |
| Less than 2.0x | 34 (73.9%) | 0 (0.0%) |
| 2.0x to 2.9x | 0 (0.0%) | 0 (0.0%) |
| 3.0x to 3.9x | 0 (0.0%) | 14 (100.0%) |
| 4.0x or more | 12 (26.1%) | 0 (0.0%) |
| Total | 46 (100.0%) | 14 (100.0%) |
Real Estate Taxes by Mortgage Status in Jennings
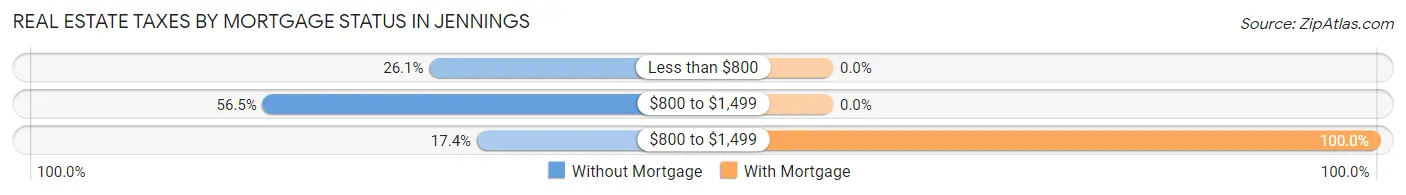
| Property Taxes | Without Mortgage | With Mortgage |
| Less than $800 | 12 (26.1%) | 0 (0.0%) |
| $800 to $1,499 | 26 (56.5%) | 0 (0.0%) |
| $800 to $1,499 | 8 (17.4%) | 14 (100.0%) |
| Total | 46 (100.0%) | 14 (100.0%) |
Health & Disability in Jennings
Health Insurance Coverage by Age in Jennings
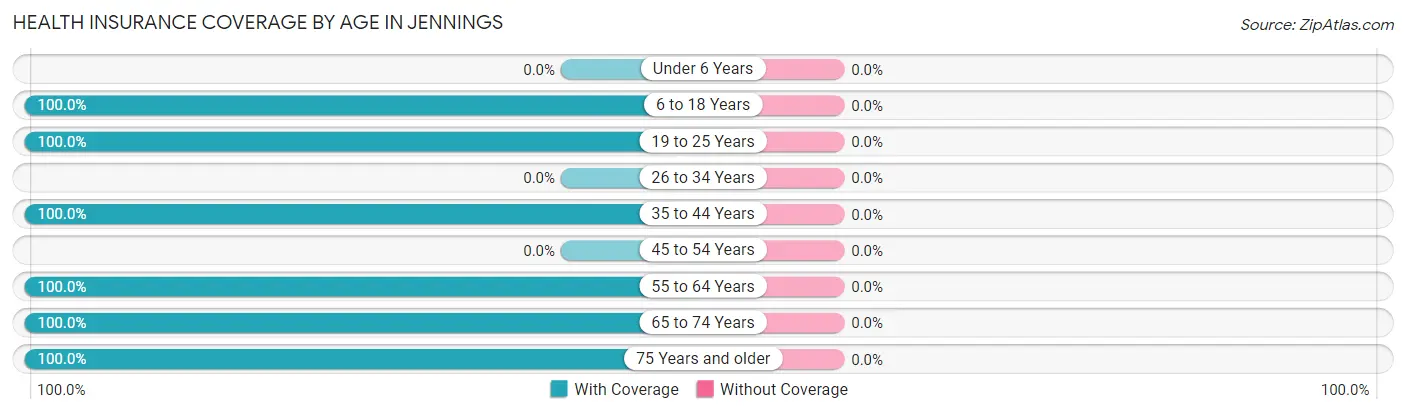
| Age Bracket | With Coverage | Without Coverage |
| Under 6 Years | 0 (0.0%) | 0 (0.0%) |
| 6 to 18 Years | 45 (100.0%) | 0 (0.0%) |
| 19 to 25 Years | 22 (100.0%) | 0 (0.0%) |
| 26 to 34 Years | 0 (0.0%) | 0 (0.0%) |
| 35 to 44 Years | 36 (100.0%) | 0 (0.0%) |
| 45 to 54 Years | 0 (0.0%) | 0 (0.0%) |
| 55 to 64 Years | 64 (100.0%) | 0 (0.0%) |
| 65 to 74 Years | 12 (100.0%) | 0 (0.0%) |
| 75 Years and older | 23 (100.0%) | 0 (0.0%) |
| Total | 202 (100.0%) | 0 (0.0%) |
Health Insurance Coverage by Citizenship Status in Jennings
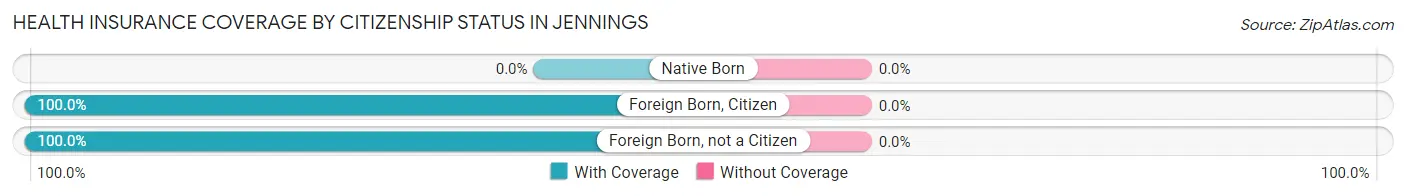
| Citizenship Status | With Coverage | Without Coverage |
| Native Born | 0 (0.0%) | 0 (0.0%) |
| Foreign Born, Citizen | 45 (100.0%) | 0 (0.0%) |
| Foreign Born, not a Citizen | 22 (100.0%) | 0 (0.0%) |
Health Insurance Coverage by Household Income in Jennings
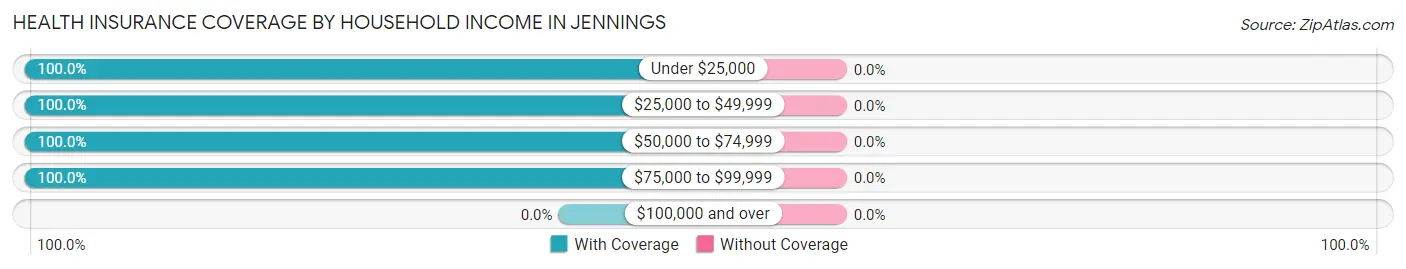
| Household Income | With Coverage | Without Coverage |
| Under $25,000 | 60 (100.0%) | 0 (0.0%) |
| $25,000 to $49,999 | 91 (100.0%) | 0 (0.0%) |
| $50,000 to $74,999 | 29 (100.0%) | 0 (0.0%) |
| $75,000 to $99,999 | 22 (100.0%) | 0 (0.0%) |
| $100,000 and over | 0 (0.0%) | 0 (0.0%) |
Public vs Private Health Insurance Coverage by Age in Jennings
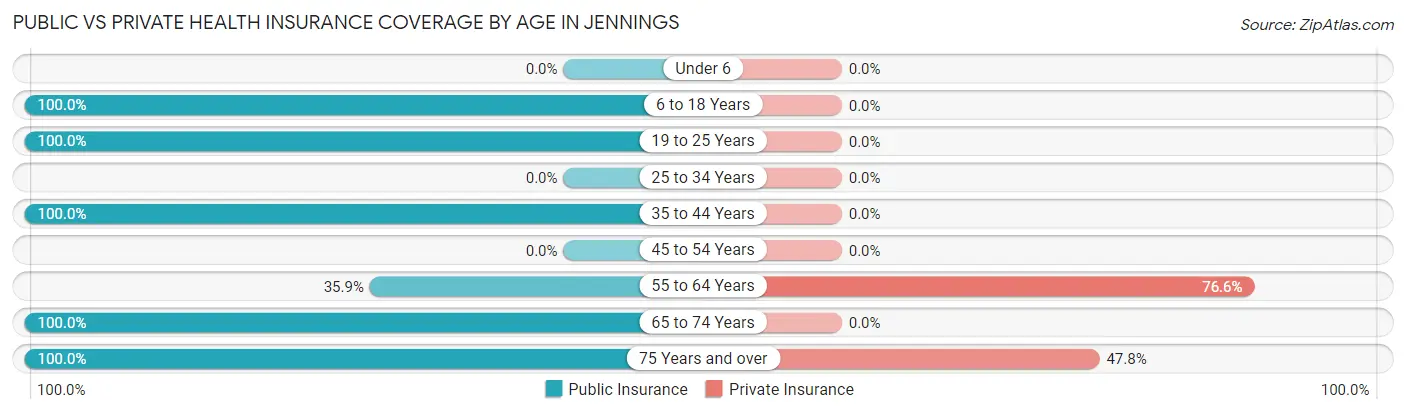
| Age Bracket | Public Insurance | Private Insurance |
| Under 6 | 0 (0.0%) | 0 (0.0%) |
| 6 to 18 Years | 45 (100.0%) | 0 (0.0%) |
| 19 to 25 Years | 22 (100.0%) | 0 (0.0%) |
| 25 to 34 Years | 0 (0.0%) | 0 (0.0%) |
| 35 to 44 Years | 36 (100.0%) | 0 (0.0%) |
| 45 to 54 Years | 0 (0.0%) | 0 (0.0%) |
| 55 to 64 Years | 23 (35.9%) | 49 (76.6%) |
| 65 to 74 Years | 12 (100.0%) | 0 (0.0%) |
| 75 Years and over | 23 (100.0%) | 11 (47.8%) |
| Total | 161 (79.7%) | 60 (29.7%) |
Disability Status by Sex by Age in Jennings
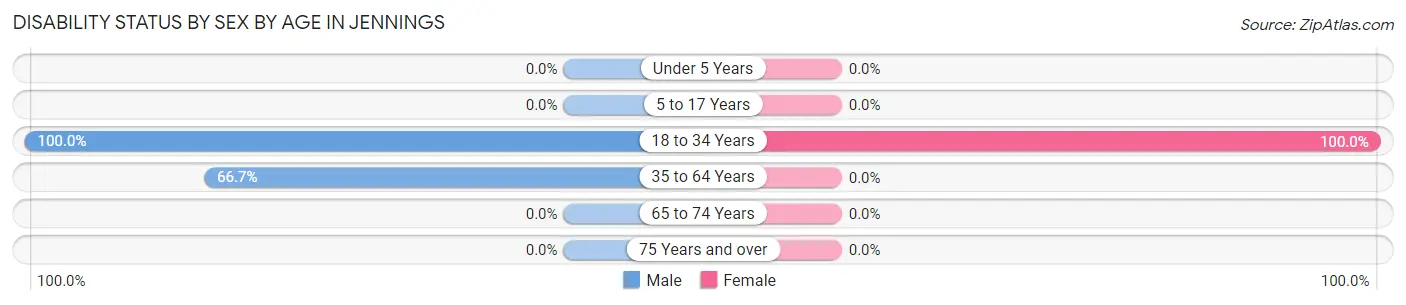
| Age Bracket | Male | Female |
| Under 5 Years | 0 (0.0%) | 0 (0.0%) |
| 5 to 17 Years | 0 (0.0%) | 0 (0.0%) |
| 18 to 34 Years | 22 (100.0%) | 20 (100.0%) |
| 35 to 64 Years | 16 (66.7%) | 0 (0.0%) |
| 65 to 74 Years | 0 (0.0%) | 0 (0.0%) |
| 75 Years and over | 0 (0.0%) | 0 (0.0%) |
Disability Class by Sex by Age in Jennings
Disability Class: Hearing Difficulty
| Age Bracket | Male | Female |
| Under 5 Years | 0 (0.0%) | 0 (0.0%) |
| 5 to 17 Years | 0 (0.0%) | 0 (0.0%) |
| 18 to 34 Years | 0 (0.0%) | 0 (0.0%) |
| 35 to 64 Years | 0 (0.0%) | 0 (0.0%) |
| 65 to 74 Years | 0 (0.0%) | 0 (0.0%) |
| 75 Years and over | 0 (0.0%) | 0 (0.0%) |
Disability Class: Vision Difficulty
| Age Bracket | Male | Female |
| Under 5 Years | 0 (0.0%) | 0 (0.0%) |
| 5 to 17 Years | 0 (0.0%) | 0 (0.0%) |
| 18 to 34 Years | 0 (0.0%) | 0 (0.0%) |
| 35 to 64 Years | 0 (0.0%) | 0 (0.0%) |
| 65 to 74 Years | 0 (0.0%) | 0 (0.0%) |
| 75 Years and over | 0 (0.0%) | 0 (0.0%) |
Disability Class: Cognitive Difficulty
| Age Bracket | Male | Female |
| 5 to 17 Years | 0 (0.0%) | 0 (0.0%) |
| 18 to 34 Years | 22 (100.0%) | 20 (100.0%) |
| 35 to 64 Years | 0 (0.0%) | 0 (0.0%) |
| 65 to 74 Years | 0 (0.0%) | 0 (0.0%) |
| 75 Years and over | 0 (0.0%) | 0 (0.0%) |
Disability Class: Ambulatory Difficulty
| Age Bracket | Male | Female |
| 5 to 17 Years | 0 (0.0%) | 0 (0.0%) |
| 18 to 34 Years | 0 (0.0%) | 0 (0.0%) |
| 35 to 64 Years | 16 (66.7%) | 0 (0.0%) |
| 65 to 74 Years | 0 (0.0%) | 0 (0.0%) |
| 75 Years and over | 0 (0.0%) | 0 (0.0%) |
Disability Class: Self-Care Difficulty
| Age Bracket | Male | Female |
| 5 to 17 Years | 0 (0.0%) | 0 (0.0%) |
| 18 to 34 Years | 0 (0.0%) | 0 (0.0%) |
| 35 to 64 Years | 0 (0.0%) | 0 (0.0%) |
| 65 to 74 Years | 0 (0.0%) | 0 (0.0%) |
| 75 Years and over | 0 (0.0%) | 0 (0.0%) |
Technology Access in Jennings
Computing Device Access in Jennings
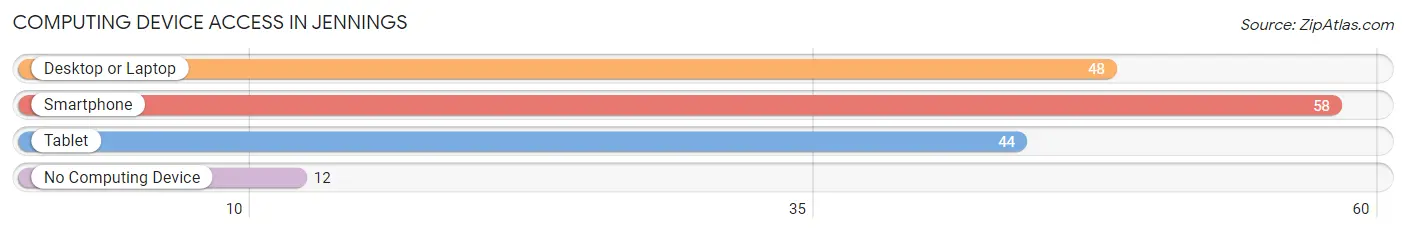
| Device Type | # Households | % Households |
| Desktop or Laptop | 48 | 61.5% |
| Smartphone | 58 | 74.4% |
| Tablet | 44 | 56.4% |
| No Computing Device | 12 | 15.4% |
| Total | 78 | 100.0% |
Internet Access in Jennings
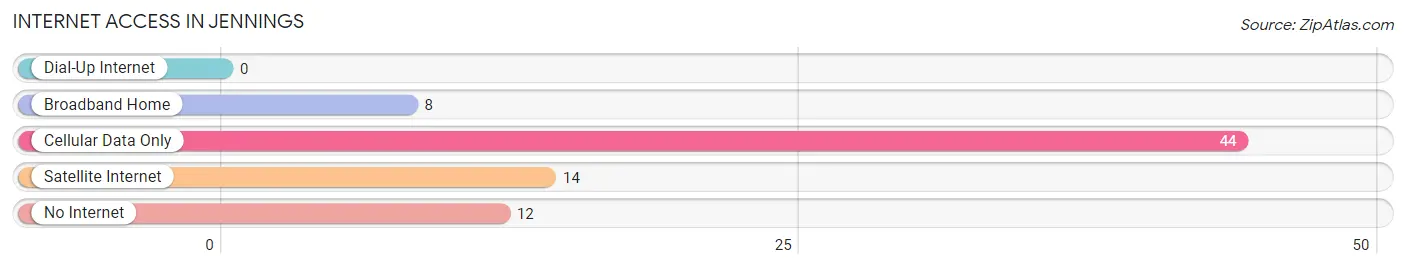
| Internet Type | # Households | % Households |
| Dial-Up Internet | 0 | 0.0% |
| Broadband Home | 8 | 10.3% |
| Cellular Data Only | 44 | 56.4% |
| Satellite Internet | 14 | 17.9% |
| No Internet | 12 | 15.4% |
| Total | 78 | 100.0% |
Jennings Summary
Jennings, Michigan is a small town located in the Upper Peninsula of Michigan. It is situated in the western part of the state, near the border of Wisconsin. The town was founded in 1871 and has a population of just over 1,000 people.
Jennings is located in the heart of the Upper Peninsula, surrounded by forests and lakes. The town is situated on the banks of the Menominee River, which is a major source of recreation for the area. The town is also home to several small lakes, including Lake Gogebic, which is the largest lake in the Upper Peninsula.
The economy of Jennings is largely based on tourism and outdoor recreation. The town is home to several resorts and campgrounds, as well as a variety of outdoor activities such as fishing, hunting, and snowmobiling. The town also has a few small businesses, including a grocery store, a hardware store, and a few restaurants.
The demographics of Jennings are largely white, with a small percentage of African Americans and Native Americans. The median household income is around $30,000, and the median age is around 40 years old. The town is also home to a large number of retirees, as well as a few younger families.
Jennings is a small town with a lot of charm and character. It is a great place to visit for outdoor recreation, and it is also a great place to live for those who enjoy the quiet life. The town is a great place to raise a family, and it is also a great place to retire. The town is a great place to get away from the hustle and bustle of the city, and it is a great place to enjoy the beauty of nature.
Common Questions
What is Per Capita Income in Jennings?
Per Capita income in Jennings is $16,790.
What is the Median Family Income in Jennings?
Median Family Income in Jennings is $31,771.
What is the Median Household income in Jennings?
Median Household Income in Jennings is $39,000.
What is Inequality or Gini Index in Jennings?
Inequality or Gini Index in Jennings is 0.28.
What is the Total Population of Jennings?
Total Population of Jennings is 202.
What is the Total Male Population of Jennings?
Total Male Population of Jennings is 76.
What is the Total Female Population of Jennings?
Total Female Population of Jennings is 126.
What is the Ratio of Males per 100 Females in Jennings?
There are 60.32 Males per 100 Females in Jennings.
What is the Ratio of Females per 100 Males in Jennings?
There are 165.79 Females per 100 Males in Jennings.
What is the Median Population Age in Jennings?
Median Population Age in Jennings is 44.9 Years.
What is the Average Family Size in Jennings
Average Family Size in Jennings is 3.1 People.
What is the Average Household Size in Jennings
Average Household Size in Jennings is 2.6 People.
How Large is the Labor Force in Jennings?
There are 85 People in the Labor Forcein in Jennings.
What is the Percentage of People in the Labor Force in Jennings?
48.0% of People are in the Labor Force in Jennings.