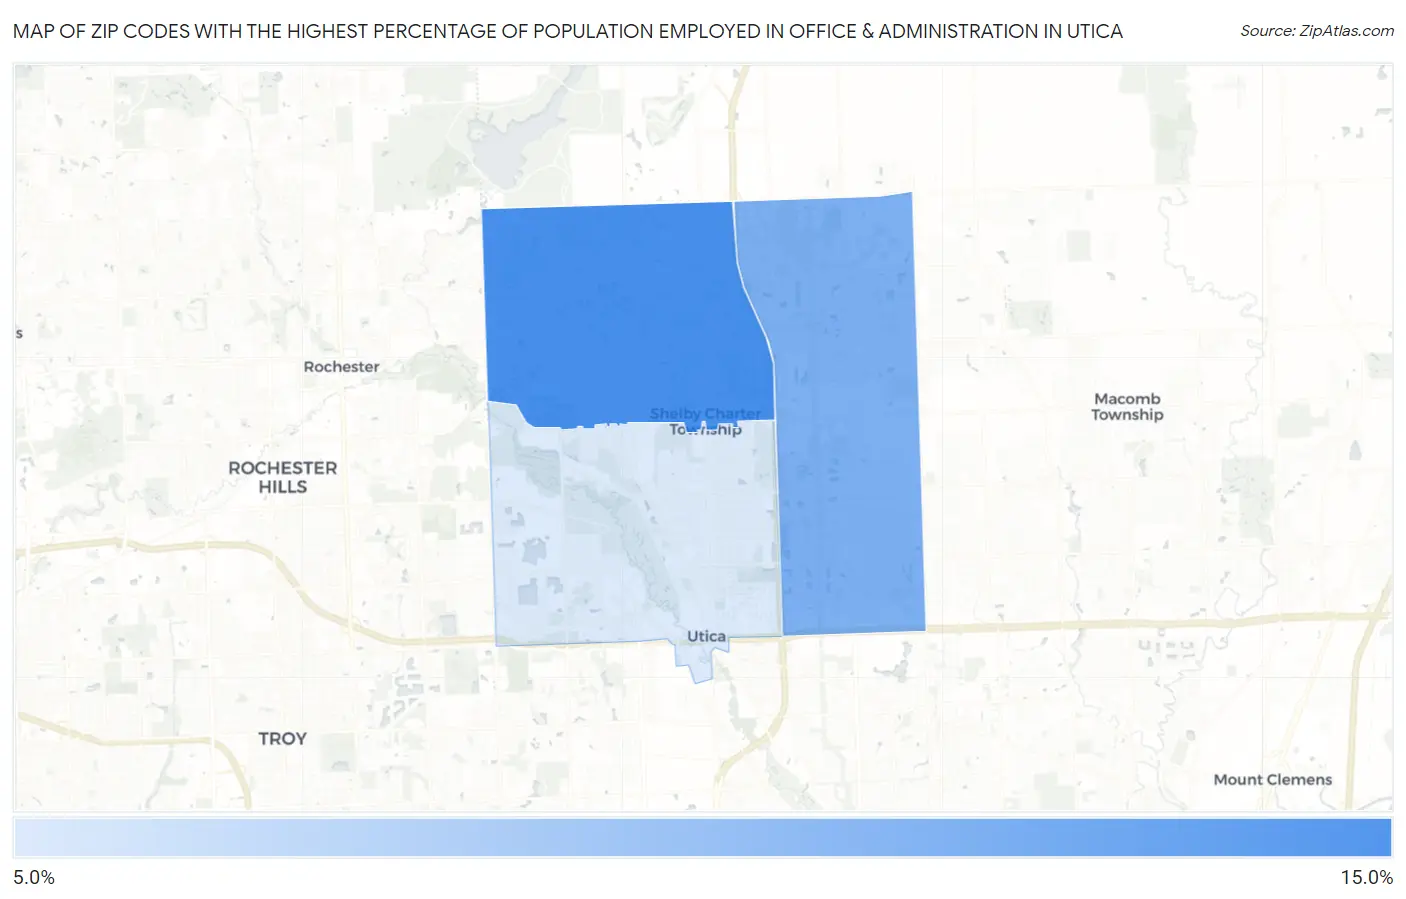
Zip Codes with the Highest Percentage of Population Employed in Office & Administration in Utica, MI
RELATED REPORTS & OPTIONS
Office & Administration
Utica
Compare Zip Codes
Map of Zip Codes with the Highest Percentage of Population Employed in Office & Administration in Utica
9.1%
12.3%
Zip Codes with the Highest Percentage of Population Employed in Office & Administration in Utica, MI
| Zip Code | % Employed | vs State | vs National | |
| 1. | 48316 | 12.3% | 10.8%(+1.49)#252 | 10.9%(+1.44)#9,854 |
| 2. | 48315 | 11.1% | 10.8%(+0.332)#392 | 10.9%(+0.283)#13,398 |
| 3. | 48317 | 9.1% | 10.8%(-1.71)#639 | 10.9%(-1.76)#19,966 |
1
Common Questions
What are the Top Zip Codes with the Highest Percentage of Population Employed in Office & Administration in Utica, MI?
Top Zip Codes with the Highest Percentage of Population Employed in Office & Administration in Utica, MI are:
What zip code has the Highest Percentage of Population Employed in Office & Administration in Utica, MI?
48316 has the Highest Percentage of Population Employed in Office & Administration in Utica, MI with 12.3%.
What is the Percentage of Population Employed in Office & Administration in Utica, MI?
Percentage of Population Employed in Office & Administration in Utica is 17.3%.
What is the Percentage of Population Employed in Office & Administration in Michigan?
Percentage of Population Employed in Office & Administration in Michigan is 10.8%.
What is the Percentage of Population Employed in Office & Administration in the United States?
Percentage of Population Employed in Office & Administration in the United States is 10.9%.