Zip Codes with the Highest Percentage of Population Employed in Office & Administration in Northville, MI
RELATED REPORTS & OPTIONS
Office & Administration
Northville
Compare Zip Codes
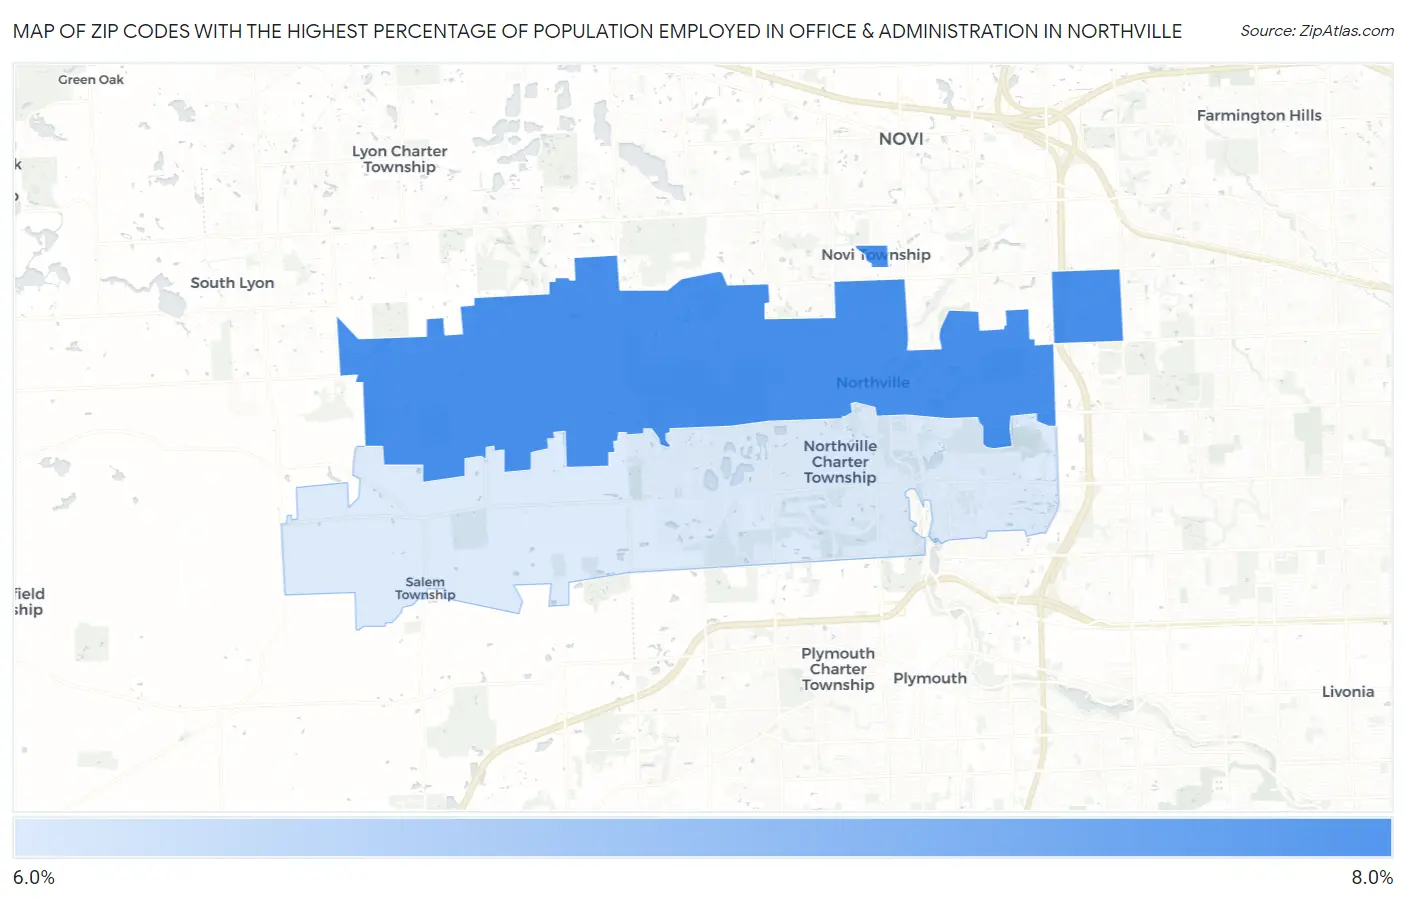
Map of Zip Codes with the Highest Percentage of Population Employed in Office & Administration in Northville
6.3%
7.7%
Zip Codes with the Highest Percentage of Population Employed in Office & Administration in Northville, MI
| Zip Code | % Employed | vs State | vs National | |
| 1. | 48167 | 7.7% | 10.8%(-3.10)#781 | 10.9%(-3.15)#23,685 |
| 2. | 48168 | 6.3% | 10.8%(-4.52)#865 | 10.9%(-4.57)#26,426 |
1
Common Questions
What are the Top Zip Codes with the Highest Percentage of Population Employed in Office & Administration in Northville, MI?
Top Zip Codes with the Highest Percentage of Population Employed in Office & Administration in Northville, MI are:
What zip code has the Highest Percentage of Population Employed in Office & Administration in Northville, MI?
48167 has the Highest Percentage of Population Employed in Office & Administration in Northville, MI with 7.7%.
What is the Percentage of Population Employed in Office & Administration in Northville, MI?
Percentage of Population Employed in Office & Administration in Northville is 6.8%.
What is the Percentage of Population Employed in Office & Administration in Michigan?
Percentage of Population Employed in Office & Administration in Michigan is 10.8%.
What is the Percentage of Population Employed in Office & Administration in the United States?
Percentage of Population Employed in Office & Administration in the United States is 10.9%.