Zip Codes with the Highest Percentage of Population Employed in Office & Administration in Berrien Springs, MI
RELATED REPORTS & OPTIONS
Office & Administration
Berrien Springs
Compare Zip Codes
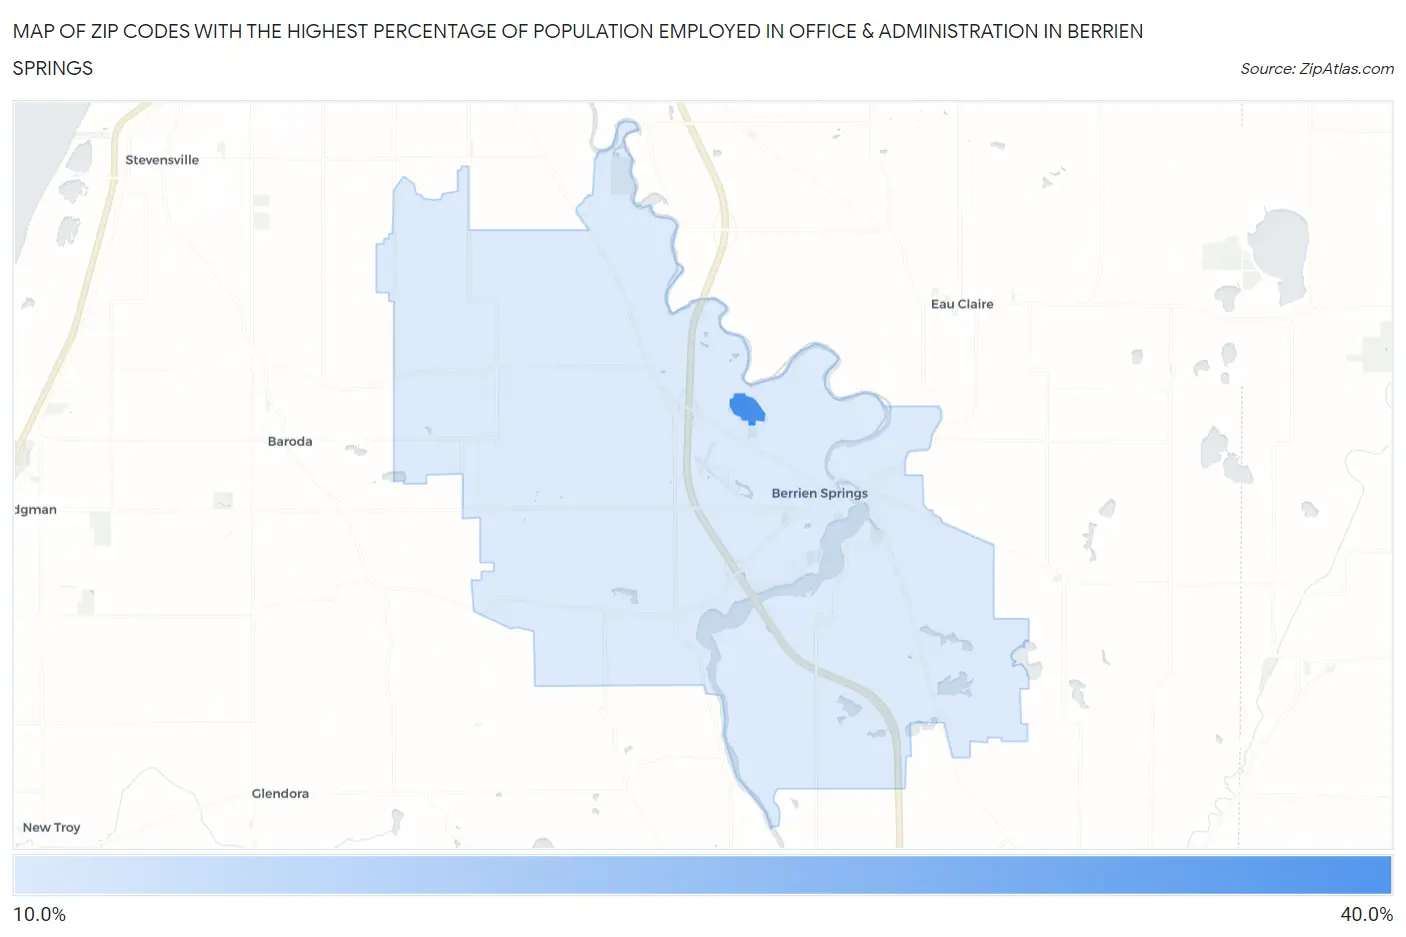
Map of Zip Codes with the Highest Percentage of Population Employed in Office & Administration in Berrien Springs
14.1%
37.0%
Zip Codes with the Highest Percentage of Population Employed in Office & Administration in Berrien Springs, MI
| Zip Code | % Employed | vs State | vs National | |
| 1. | 49104 | 37.0% | 10.8%(+26.2)#3 | 10.9%(+26.2)#326 |
| 2. | 49103 | 14.1% | 10.8%(+3.27)#118 | 10.9%(+3.22)#5,887 |
1
Common Questions
What are the Top Zip Codes with the Highest Percentage of Population Employed in Office & Administration in Berrien Springs, MI?
Top Zip Codes with the Highest Percentage of Population Employed in Office & Administration in Berrien Springs, MI are:
What zip code has the Highest Percentage of Population Employed in Office & Administration in Berrien Springs, MI?
49104 has the Highest Percentage of Population Employed in Office & Administration in Berrien Springs, MI with 37.0%.
What is the Percentage of Population Employed in Office & Administration in Berrien Springs, MI?
Percentage of Population Employed in Office & Administration in Berrien Springs is 11.1%.
What is the Percentage of Population Employed in Office & Administration in Michigan?
Percentage of Population Employed in Office & Administration in Michigan is 10.8%.
What is the Percentage of Population Employed in Office & Administration in the United States?
Percentage of Population Employed in Office & Administration in the United States is 10.9%.