Zip Codes with the Highest Percentage of Population Employed in Office & Administration in Sterling Heights, MI
RELATED REPORTS & OPTIONS
Office & Administration
Sterling Heights
Compare Zip Codes
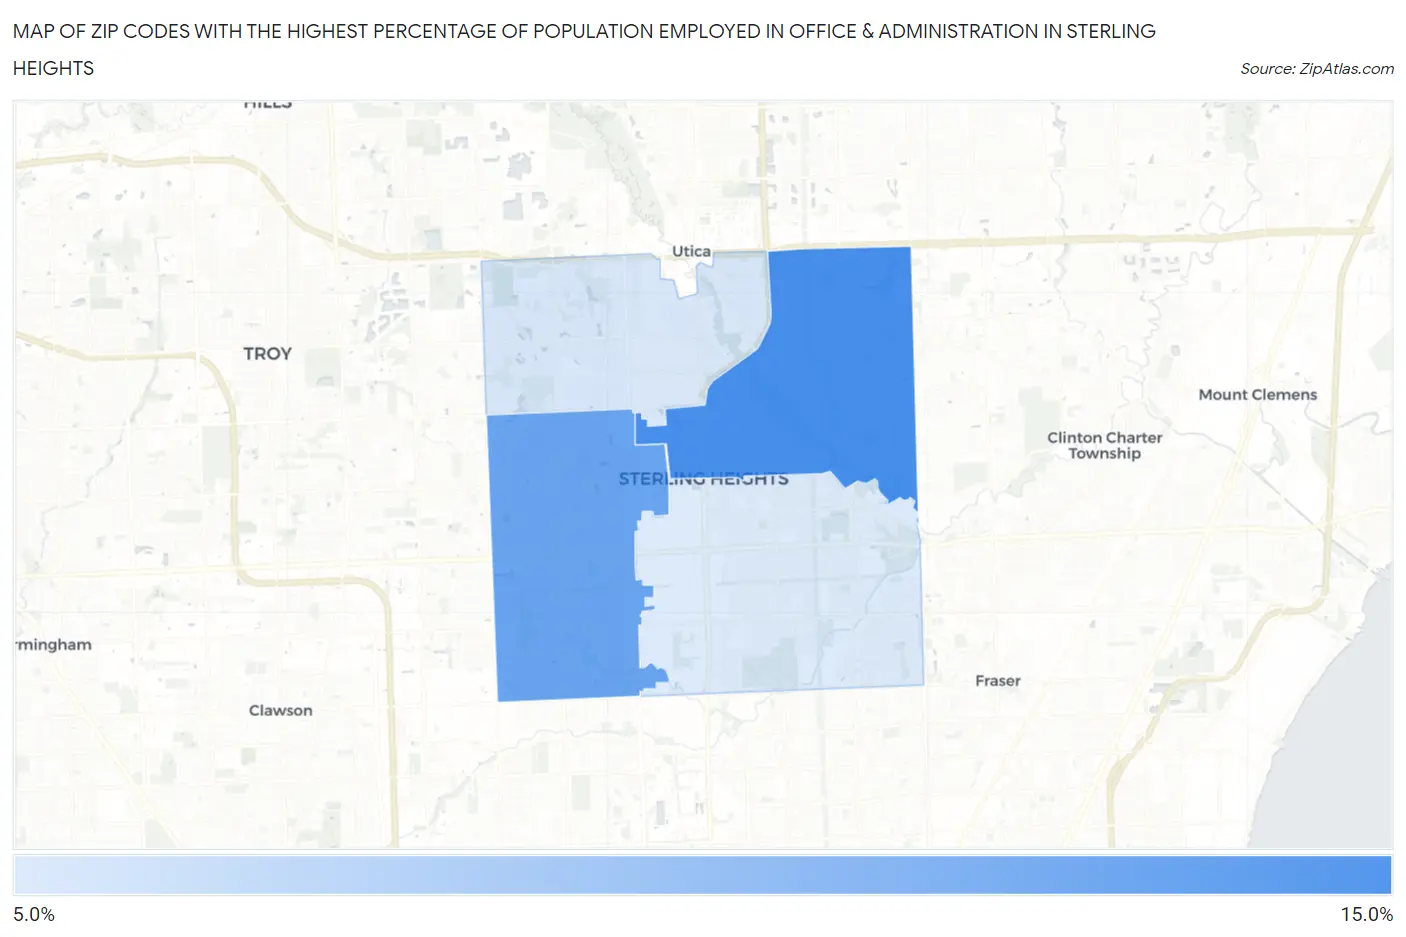
Map of Zip Codes with the Highest Percentage of Population Employed in Office & Administration in Sterling Heights
8.4%
13.7%
Zip Codes with the Highest Percentage of Population Employed in Office & Administration in Sterling Heights, MI
| Zip Code | % Employed | vs State | vs National | |
| 1. | 48313 | 13.7% | 10.8%(+2.87)#145 | 10.9%(+2.82)#6,582 |
| 2. | 48310 | 12.4% | 10.8%(+1.62)#242 | 10.9%(+1.57)#9,501 |
| 3. | 48314 | 8.5% | 10.8%(-2.27)#698 | 10.9%(-2.32)#21,585 |
| 4. | 48312 | 8.4% | 10.8%(-2.42)#713 | 10.9%(-2.47)#21,988 |
1
Common Questions
What are the Top 3 Zip Codes with the Highest Percentage of Population Employed in Office & Administration in Sterling Heights, MI?
Top 3 Zip Codes with the Highest Percentage of Population Employed in Office & Administration in Sterling Heights, MI are:
What zip code has the Highest Percentage of Population Employed in Office & Administration in Sterling Heights, MI?
48313 has the Highest Percentage of Population Employed in Office & Administration in Sterling Heights, MI with 13.7%.
What is the Percentage of Population Employed in Office & Administration in Sterling Heights, MI?
Percentage of Population Employed in Office & Administration in Sterling Heights is 11.0%.
What is the Percentage of Population Employed in Office & Administration in Michigan?
Percentage of Population Employed in Office & Administration in Michigan is 10.8%.
What is the Percentage of Population Employed in Office & Administration in the United States?
Percentage of Population Employed in Office & Administration in the United States is 10.9%.