Zip Codes with the Highest Percentage of Population Employed in Office & Administration in Howell, MI
RELATED REPORTS & OPTIONS
Office & Administration
Howell
Compare Zip Codes
Map of Zip Codes with the Highest Percentage of Population Employed in Office & Administration in Howell
8.2%
10.5%
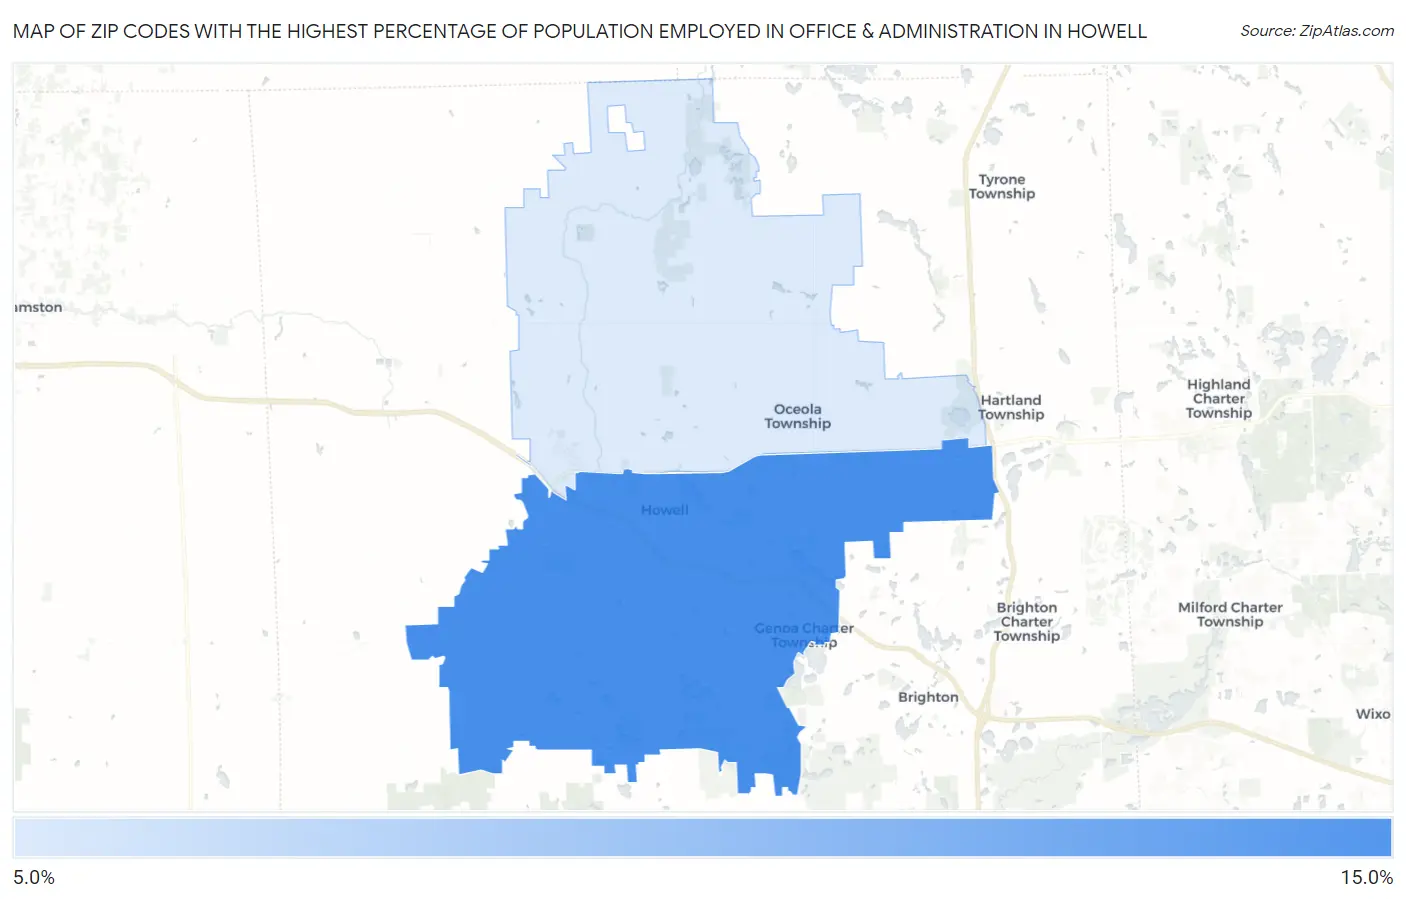
Zip Codes with the Highest Percentage of Population Employed in Office & Administration in Howell, MI
| Zip Code | % Employed | vs State | vs National | |
| 1. | 48843 | 10.5% | 10.8%(-0.344)#487 | 10.9%(-0.393)#15,617 |
| 2. | 48855 | 8.2% | 10.8%(-2.59)#736 | 10.9%(-2.63)#22,459 |
1
Common Questions
What are the Top Zip Codes with the Highest Percentage of Population Employed in Office & Administration in Howell, MI?
Top Zip Codes with the Highest Percentage of Population Employed in Office & Administration in Howell, MI are:
What zip code has the Highest Percentage of Population Employed in Office & Administration in Howell, MI?
48843 has the Highest Percentage of Population Employed in Office & Administration in Howell, MI with 10.5%.
What is the Percentage of Population Employed in Office & Administration in Howell, MI?
Percentage of Population Employed in Office & Administration in Howell is 11.8%.
What is the Percentage of Population Employed in Office & Administration in Michigan?
Percentage of Population Employed in Office & Administration in Michigan is 10.8%.
What is the Percentage of Population Employed in Office & Administration in the United States?
Percentage of Population Employed in Office & Administration in the United States is 10.9%.