Bowleys Quarters, MD Map & Demographics
Bowleys Quarters Map
Bowleys Quarters Overview
$51,997
PER CAPITA INCOME
$126,375
AVG FAMILY INCOME
$108,030
AVG HOUSEHOLD INCOME
15.5%
WAGE / INCOME GAP [ % ]
84.5¢/ $1
WAGE / INCOME GAP [ $ ]
0.42
INEQUALITY / GINI INDEX
6,746
TOTAL POPULATION
3,356
MALE POPULATION
3,390
FEMALE POPULATION
99.00
MALES / 100 FEMALES
101.01
FEMALES / 100 MALES
40.4
MEDIAN AGE
3.0
AVG FAMILY SIZE
2.6
AVG HOUSEHOLD SIZE
4,258
LABOR FORCE [ PEOPLE ]
76.3%
PERCENT IN LABOR FORCE
2.2%
UNEMPLOYMENT RATE
Income in Bowleys Quarters
Income Overview in Bowleys Quarters
Per Capita Income in Bowleys Quarters is $51,997, while median incomes of families and households are $126,375 and $108,030 respectively.
| Characteristic | Number | Measure |
| Per Capita Income | 6,746 | $51,997 |
| Median Family Income | 1,954 | $126,375 |
| Mean Family Income | 1,954 | $142,270 |
| Median Household Income | 2,548 | $108,030 |
| Mean Household Income | 2,548 | $124,049 |
| Income Deficit | 1,954 | $0 |
| Wage / Income Gap (%) | 6,746 | 15.48% |
| Wage / Income Gap ($) | 6,746 | 84.52¢ per $1 |
| Gini / Inequality Index | 6,746 | 0.42 |
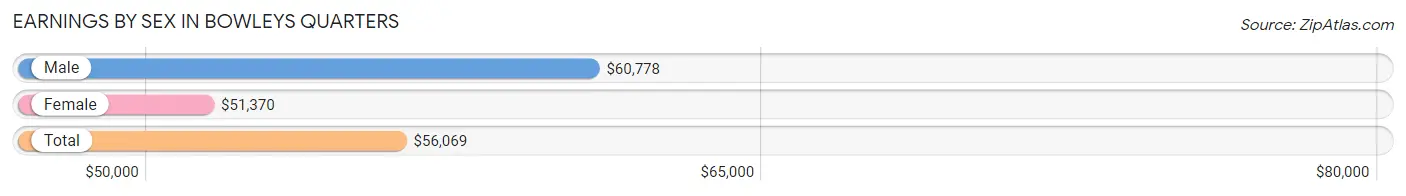
Earnings by Sex in Bowleys Quarters
Average Earnings in Bowleys Quarters are $56,069, $60,778 for men and $51,370 for women, a difference of 15.5%.
| Sex | Number | Average Earnings |
| Male | 2,147 (49.1%) | $60,778 |
| Female | 2,225 (50.9%) | $51,370 |
| Total | 4,372 (100.0%) | $56,069 |
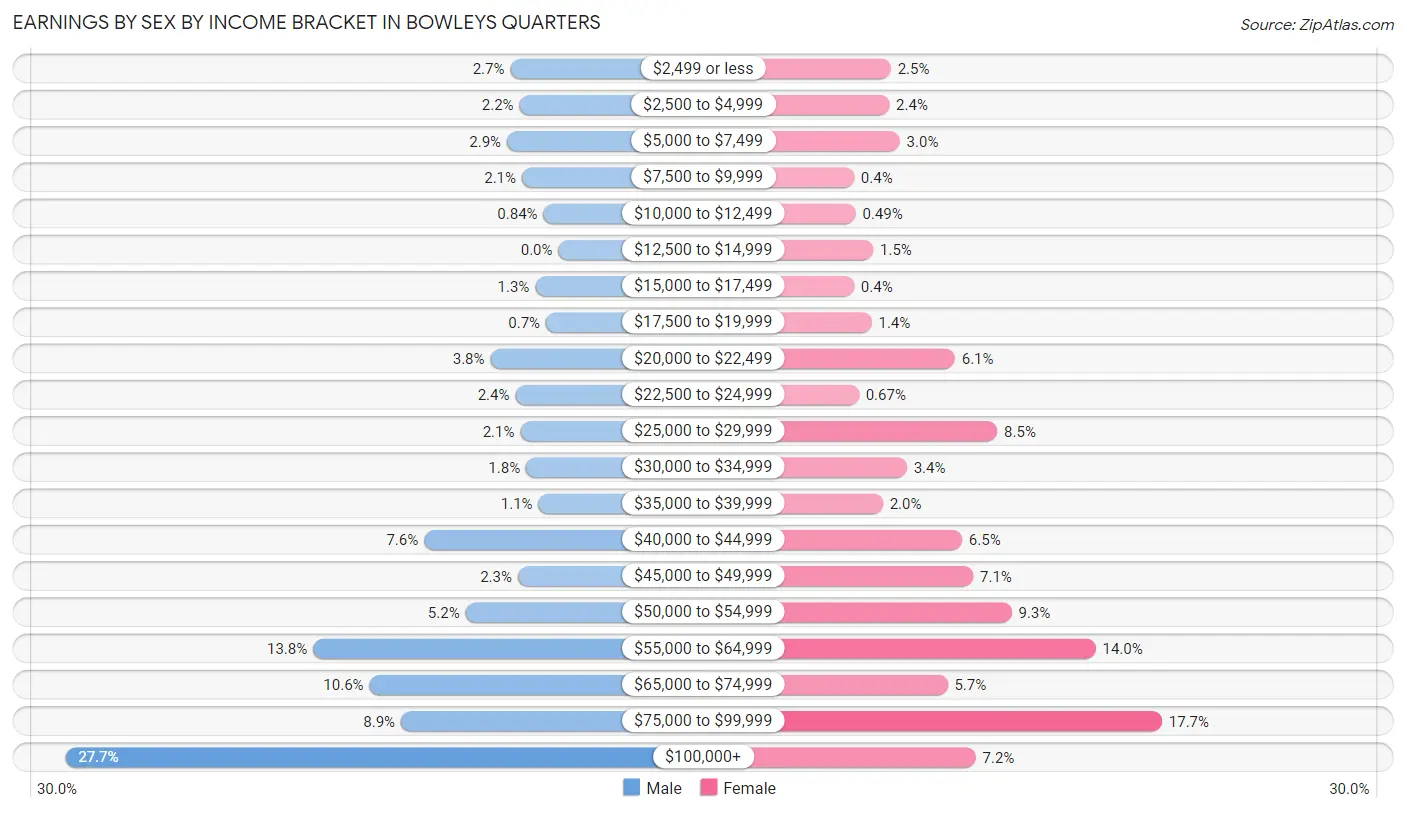
Earnings by Sex by Income Bracket in Bowleys Quarters
The most common earnings brackets in Bowleys Quarters are $100,000+ for men (595 | 27.7%) and $75,000 to $99,999 for women (394 | 17.7%).
| Income | Male | Female |
| $2,499 or less | 58 (2.7%) | 55 (2.5%) |
| $2,500 to $4,999 | 47 (2.2%) | 53 (2.4%) |
| $5,000 to $7,499 | 62 (2.9%) | 66 (3.0%) |
| $7,500 to $9,999 | 44 (2.1%) | 9 (0.4%) |
| $10,000 to $12,499 | 18 (0.8%) | 11 (0.5%) |
| $12,500 to $14,999 | 0 (0.0%) | 33 (1.5%) |
| $15,000 to $17,499 | 28 (1.3%) | 9 (0.4%) |
| $17,500 to $19,999 | 15 (0.7%) | 31 (1.4%) |
| $20,000 to $22,499 | 82 (3.8%) | 135 (6.1%) |
| $22,500 to $24,999 | 52 (2.4%) | 15 (0.7%) |
| $25,000 to $29,999 | 46 (2.1%) | 188 (8.5%) |
| $30,000 to $34,999 | 39 (1.8%) | 75 (3.4%) |
| $35,000 to $39,999 | 24 (1.1%) | 45 (2.0%) |
| $40,000 to $44,999 | 162 (7.5%) | 144 (6.5%) |
| $45,000 to $49,999 | 49 (2.3%) | 158 (7.1%) |
| $50,000 to $54,999 | 112 (5.2%) | 206 (9.3%) |
| $55,000 to $64,999 | 296 (13.8%) | 311 (14.0%) |
| $65,000 to $74,999 | 228 (10.6%) | 126 (5.7%) |
| $75,000 to $99,999 | 190 (8.8%) | 394 (17.7%) |
| $100,000+ | 595 (27.7%) | 161 (7.2%) |
| Total | 2,147 (100.0%) | 2,225 (100.0%) |
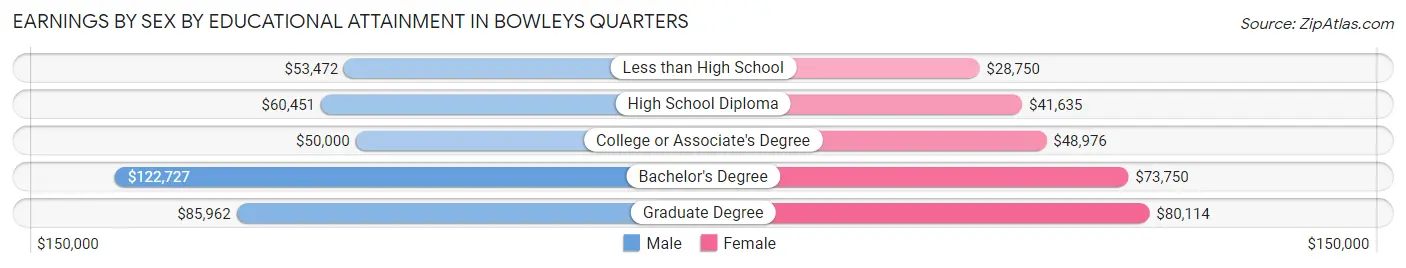
Earnings by Sex by Educational Attainment in Bowleys Quarters
Average earnings in Bowleys Quarters are $68,542 for men and $52,171 for women, a difference of 23.9%. Men with an educational attainment of bachelor's degree enjoy the highest average annual earnings of $122,727, while those with college or associate's degree education earn the least with $50,000. Women with an educational attainment of graduate degree earn the most with the average annual earnings of $80,114, while those with less than high school education have the smallest earnings of $28,750.
| Educational Attainment | Male Income | Female Income |
| Less than High School | $53,472 | $28,750 |
| High School Diploma | $60,451 | $41,635 |
| College or Associate's Degree | $50,000 | $48,976 |
| Bachelor's Degree | $122,727 | $73,750 |
| Graduate Degree | $85,962 | $80,114 |
| Total | $68,542 | $52,171 |
Family Income in Bowleys Quarters
Family Income Brackets in Bowleys Quarters
According to the Bowleys Quarters family income data, there are 625 families falling into the $100,000 to $149,999 income range, which is the most common income bracket and makes up 32.0% of all families. Conversely, the $10,000 to $14,999 income bracket is the least frequent group with only 21 families (1.1%) belonging to this category.
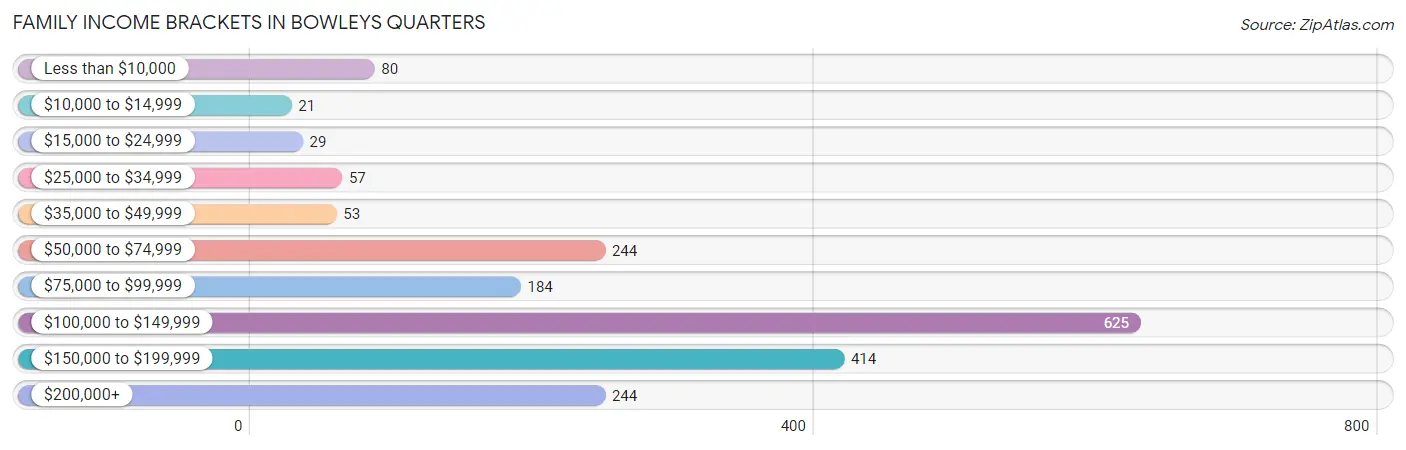
| Income Bracket | # Families | % Families |
| Less than $10,000 | 80 | 4.1% |
| $10,000 to $14,999 | 21 | 1.1% |
| $15,000 to $24,999 | 29 | 1.5% |
| $25,000 to $34,999 | 57 | 2.9% |
| $35,000 to $49,999 | 53 | 2.7% |
| $50,000 to $74,999 | 244 | 12.5% |
| $75,000 to $99,999 | 184 | 9.4% |
| $100,000 to $149,999 | 625 | 32.0% |
| $150,000 to $199,999 | 414 | 21.2% |
| $200,000+ | 244 | 12.5% |
Family Income by Famaliy Size in Bowleys Quarters
4-person families (312 | 16.0%) account for the highest median family income in Bowleys Quarters with $178,667 per family, while 2-person families (869 | 44.5%) have the highest median income of $47,590 per family member.
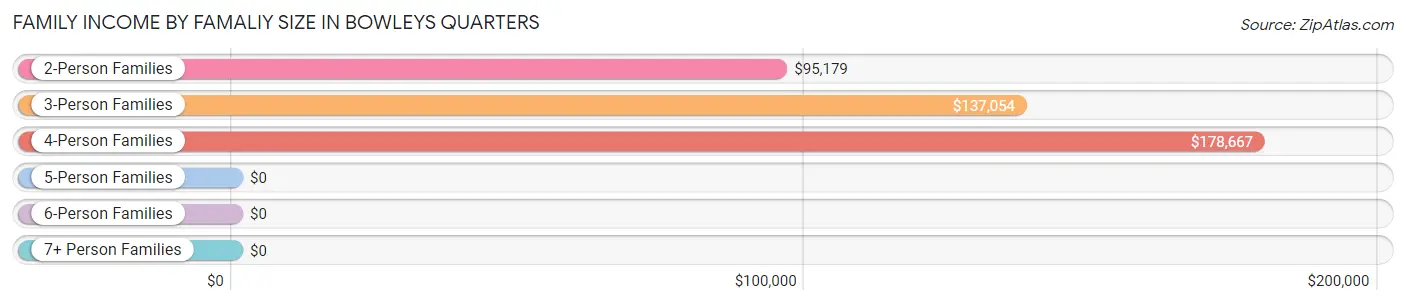
| Income Bracket | # Families | Median Income |
| 2-Person Families | 869 (44.5%) | $95,179 |
| 3-Person Families | 611 (31.3%) | $137,054 |
| 4-Person Families | 312 (16.0%) | $178,667 |
| 5-Person Families | 162 (8.3%) | $0 |
| 6-Person Families | 0 (0.0%) | $0 |
| 7+ Person Families | 0 (0.0%) | $0 |
| Total | 1,954 (100.0%) | $126,375 |
Family Income by Number of Earners in Bowleys Quarters
The median family income in Bowleys Quarters is $126,375, with families comprising 3+ earners (420) having the highest median family income of $179,056, while families with no earners (205) have the lowest median family income of $58,125, accounting for 21.5% and 10.5% of families, respectively.
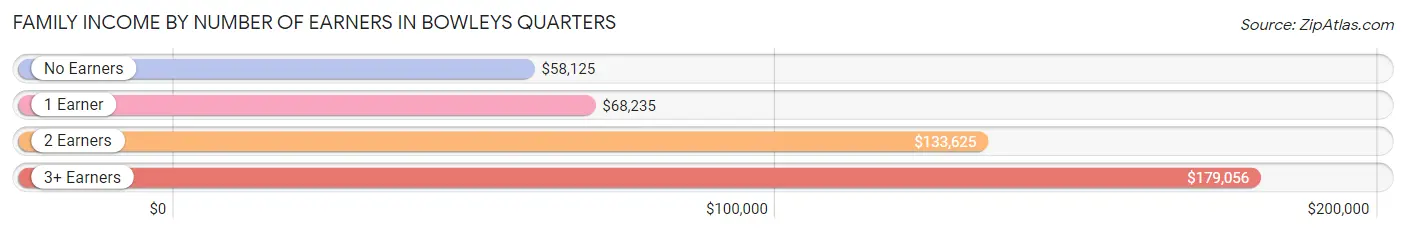
| Number of Earners | # Families | Median Income |
| No Earners | 205 (10.5%) | $58,125 |
| 1 Earner | 450 (23.0%) | $68,235 |
| 2 Earners | 879 (45.0%) | $133,625 |
| 3+ Earners | 420 (21.5%) | $179,056 |
| Total | 1,954 (100.0%) | $126,375 |
Household Income in Bowleys Quarters
Household Income Brackets in Bowleys Quarters
With 693 households falling in the category, the $100,000 to $149,999 income range is the most frequent in Bowleys Quarters, accounting for 27.2% of all households. In contrast, only 31 households (1.2%) fall into the $10,000 to $14,999 income bracket, making it the least populous group.
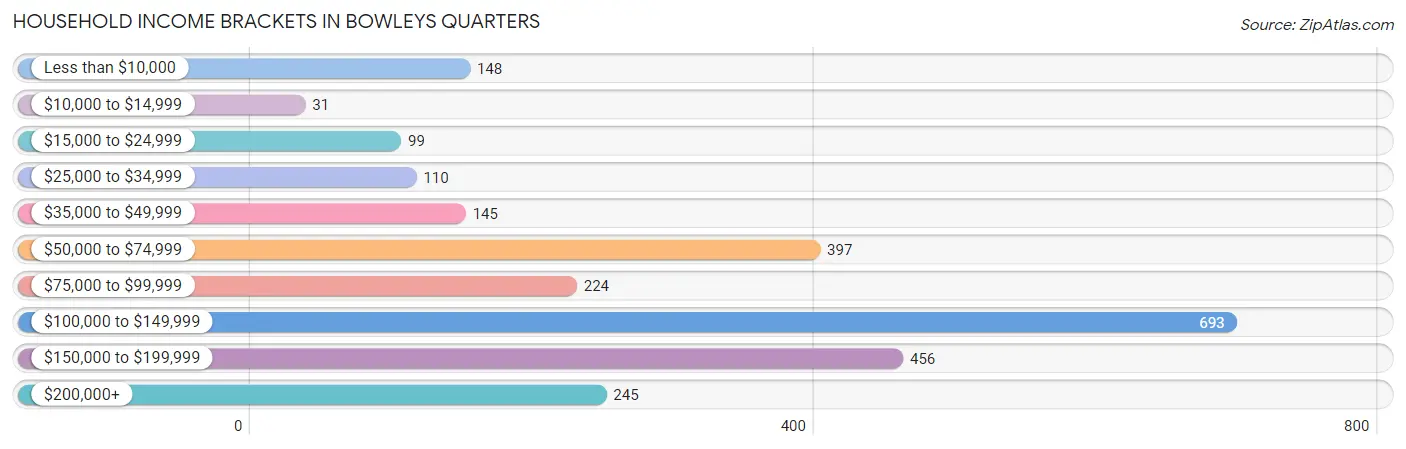
| Income Bracket | # Households | % Households |
| Less than $10,000 | 148 | 5.8% |
| $10,000 to $14,999 | 31 | 1.2% |
| $15,000 to $24,999 | 99 | 3.9% |
| $25,000 to $34,999 | 110 | 4.3% |
| $35,000 to $49,999 | 145 | 5.7% |
| $50,000 to $74,999 | 397 | 15.6% |
| $75,000 to $99,999 | 224 | 8.8% |
| $100,000 to $149,999 | 693 | 27.2% |
| $150,000 to $199,999 | 456 | 17.9% |
| $200,000+ | 245 | 9.6% |
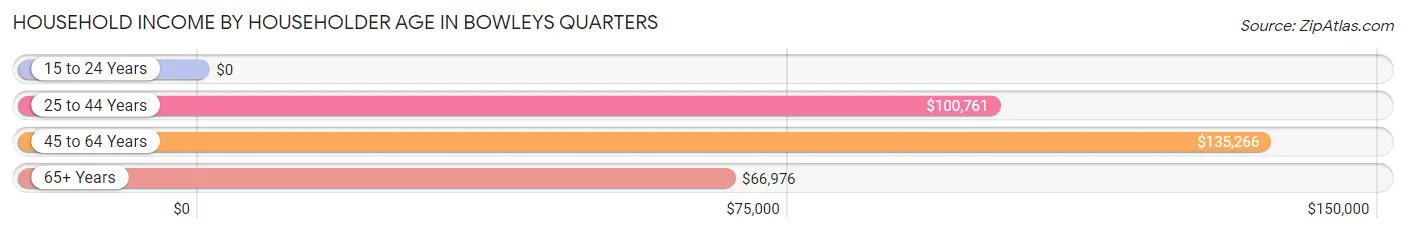
Household Income by Householder Age in Bowleys Quarters
The median household income in Bowleys Quarters is $108,030, with the highest median household income of $135,266 found in the 45 to 64 years age bracket for the primary householder. A total of 1,121 households (44.0%) fall into this category.
| Income Bracket | # Households | Median Income |
| 15 to 24 Years | 0 (0.0%) | $0 |
| 25 to 44 Years | 902 (35.4%) | $100,761 |
| 45 to 64 Years | 1,121 (44.0%) | $135,266 |
| 65+ Years | 525 (20.6%) | $66,976 |
| Total | 2,548 (100.0%) | $108,030 |
Poverty in Bowleys Quarters
Income Below Poverty by Sex and Age in Bowleys Quarters
With 8.9% poverty level for males and 8.3% for females among the residents of Bowleys Quarters, 5 year old males and 12 to 14 year old females are the most vulnerable to poverty, with 33 males (71.7%) and 36 females (32.7%) in their respective age groups living below the poverty level.
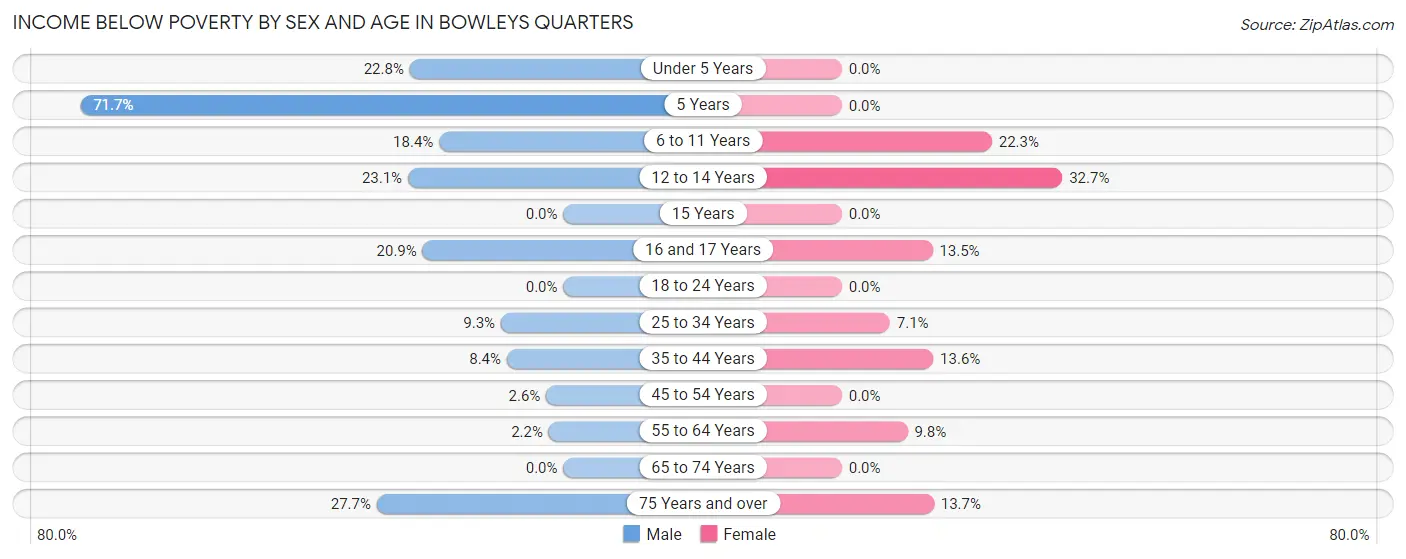
| Age Bracket | Male | Female |
| Under 5 Years | 52 (22.8%) | 0 (0.0%) |
| 5 Years | 33 (71.7%) | 0 (0.0%) |
| 6 to 11 Years | 33 (18.4%) | 57 (22.3%) |
| 12 to 14 Years | 21 (23.1%) | 36 (32.7%) |
| 15 Years | 0 (0.0%) | 0 (0.0%) |
| 16 and 17 Years | 14 (20.9%) | 14 (13.5%) |
| 18 to 24 Years | 0 (0.0%) | 0 (0.0%) |
| 25 to 34 Years | 43 (9.3%) | 42 (7.1%) |
| 35 to 44 Years | 36 (8.4%) | 60 (13.6%) |
| 45 to 54 Years | 13 (2.5%) | 0 (0.0%) |
| 55 to 64 Years | 13 (2.2%) | 47 (9.8%) |
| 65 to 74 Years | 0 (0.0%) | 0 (0.0%) |
| 75 Years and over | 41 (27.7%) | 25 (13.7%) |
| Total | 299 (8.9%) | 281 (8.3%) |
Income Above Poverty by Sex and Age in Bowleys Quarters
According to the poverty statistics in Bowleys Quarters, males aged 15 years and females aged under 5 years are the age groups that are most secure financially, with 100.0% of males and 100.0% of females in these age groups living above the poverty line.
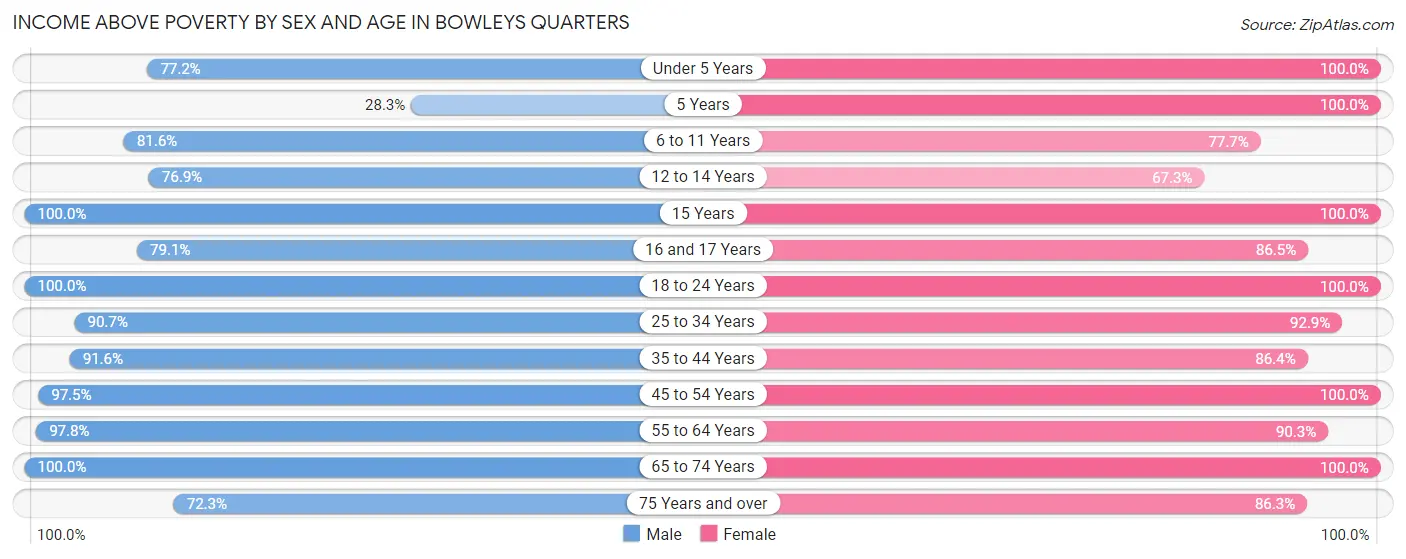
| Age Bracket | Male | Female |
| Under 5 Years | 176 (77.2%) | 85 (100.0%) |
| 5 Years | 13 (28.3%) | 45 (100.0%) |
| 6 to 11 Years | 146 (81.6%) | 199 (77.7%) |
| 12 to 14 Years | 70 (76.9%) | 74 (67.3%) |
| 15 Years | 111 (100.0%) | 15 (100.0%) |
| 16 and 17 Years | 53 (79.1%) | 90 (86.5%) |
| 18 to 24 Years | 201 (100.0%) | 231 (100.0%) |
| 25 to 34 Years | 421 (90.7%) | 546 (92.9%) |
| 35 to 44 Years | 393 (91.6%) | 382 (86.4%) |
| 45 to 54 Years | 497 (97.5%) | 639 (100.0%) |
| 55 to 64 Years | 588 (97.8%) | 435 (90.2%) |
| 65 to 74 Years | 281 (100.0%) | 210 (100.0%) |
| 75 Years and over | 107 (72.3%) | 158 (86.3%) |
| Total | 3,057 (91.1%) | 3,109 (91.7%) |
Income Below Poverty Among Married-Couple Families in Bowleys Quarters
The poverty statistics for married-couple families in Bowleys Quarters show that 3.0% or 47 of the total 1,554 families live below the poverty line. Families with 1 or 2 children have the highest poverty rate of 4.2%, comprising of 25 families. On the other hand, families with 3 or 4 children have the lowest poverty rate of 0.0%, which includes 0 families.
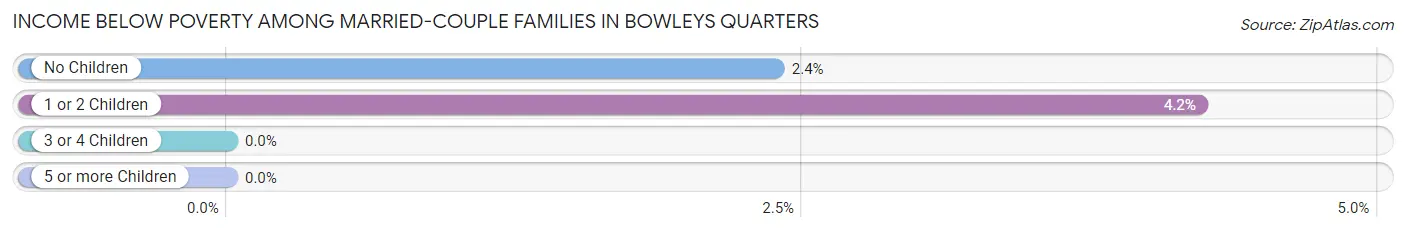
| Children | Above Poverty | Below Poverty |
| No Children | 902 (97.6%) | 22 (2.4%) |
| 1 or 2 Children | 568 (95.8%) | 25 (4.2%) |
| 3 or 4 Children | 37 (100.0%) | 0 (0.0%) |
| 5 or more Children | 0 (0.0%) | 0 (0.0%) |
| Total | 1,507 (97.0%) | 47 (3.0%) |
Income Below Poverty Among Single-Parent Households in Bowleys Quarters
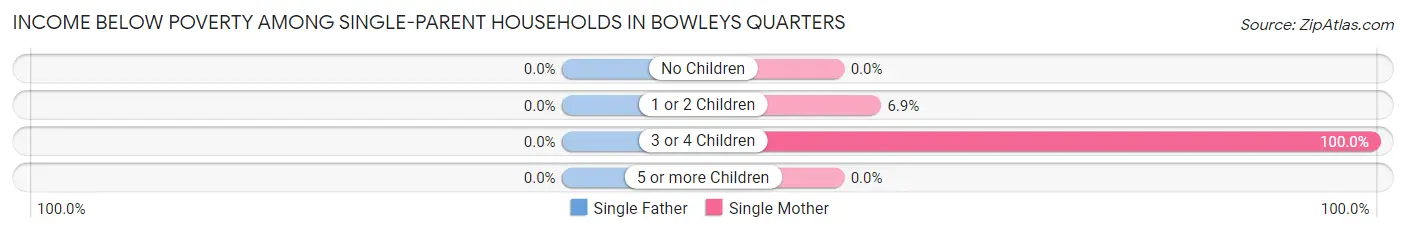
| Children | Single Father | Single Mother |
| No Children | 0 (0.0%) | 0 (0.0%) |
| 1 or 2 Children | 0 (0.0%) | 14 (6.9%) |
| 3 or 4 Children | 0 (0.0%) | 62 (100.0%) |
| 5 or more Children | 0 (0.0%) | 0 (0.0%) |
| Total | 0 (0.0%) | 76 (20.0%) |
Income Below Poverty Among Married-Couple vs Single-Parent Households in Bowleys Quarters
The poverty data for Bowleys Quarters shows that 47 of the married-couple family households (3.0%) and 76 of the single-parent households (19.0%) are living below the poverty level. Within the married-couple family households, those with 1 or 2 children have the highest poverty rate, with 25 households (4.2%) falling below the poverty line. Among the single-parent households, those with 3 or 4 children have the highest poverty rate, with 62 household (100.0%) living below poverty.
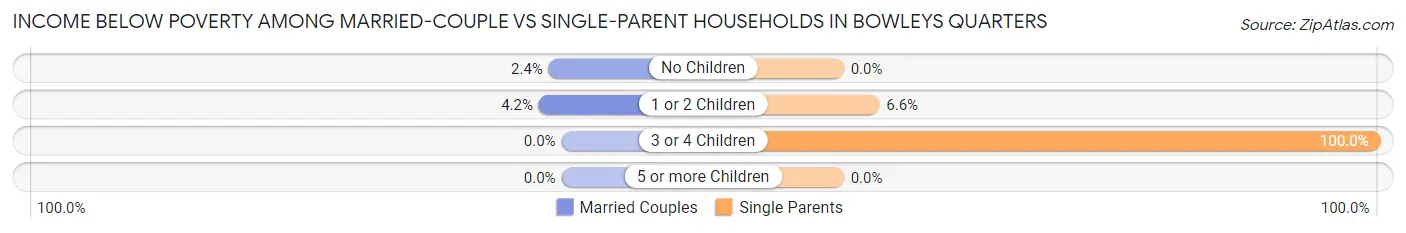
| Children | Married-Couple Families | Single-Parent Households |
| No Children | 22 (2.4%) | 0 (0.0%) |
| 1 or 2 Children | 25 (4.2%) | 14 (6.6%) |
| 3 or 4 Children | 0 (0.0%) | 62 (100.0%) |
| 5 or more Children | 0 (0.0%) | 0 (0.0%) |
| Total | 47 (3.0%) | 76 (19.0%) |
Race in Bowleys Quarters
The most populous races in Bowleys Quarters are White / Caucasian (4,931 | 73.1%), Black / African American (1,162 | 17.2%), and Asian (353 | 5.2%).
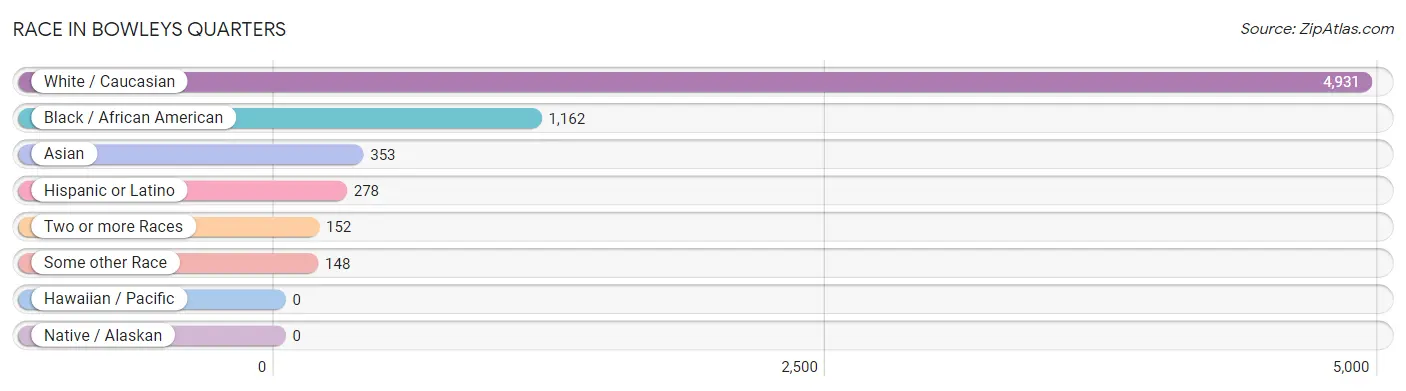
| Race | # Population | % Population |
| Asian | 353 | 5.2% |
| Black / African American | 1,162 | 17.2% |
| Hawaiian / Pacific | 0 | 0.0% |
| Hispanic or Latino | 278 | 4.1% |
| Native / Alaskan | 0 | 0.0% |
| White / Caucasian | 4,931 | 73.1% |
| Two or more Races | 152 | 2.2% |
| Some other Race | 148 | 2.2% |
| Total | 6,746 | 100.0% |
Ancestry in Bowleys Quarters
The most populous ancestries reported in Bowleys Quarters are German (1,491 | 22.1%), Irish (1,012 | 15.0%), English (612 | 9.1%), Italian (416 | 6.2%), and Polish (397 | 5.9%), together accounting for 58.2% of all Bowleys Quarters residents.
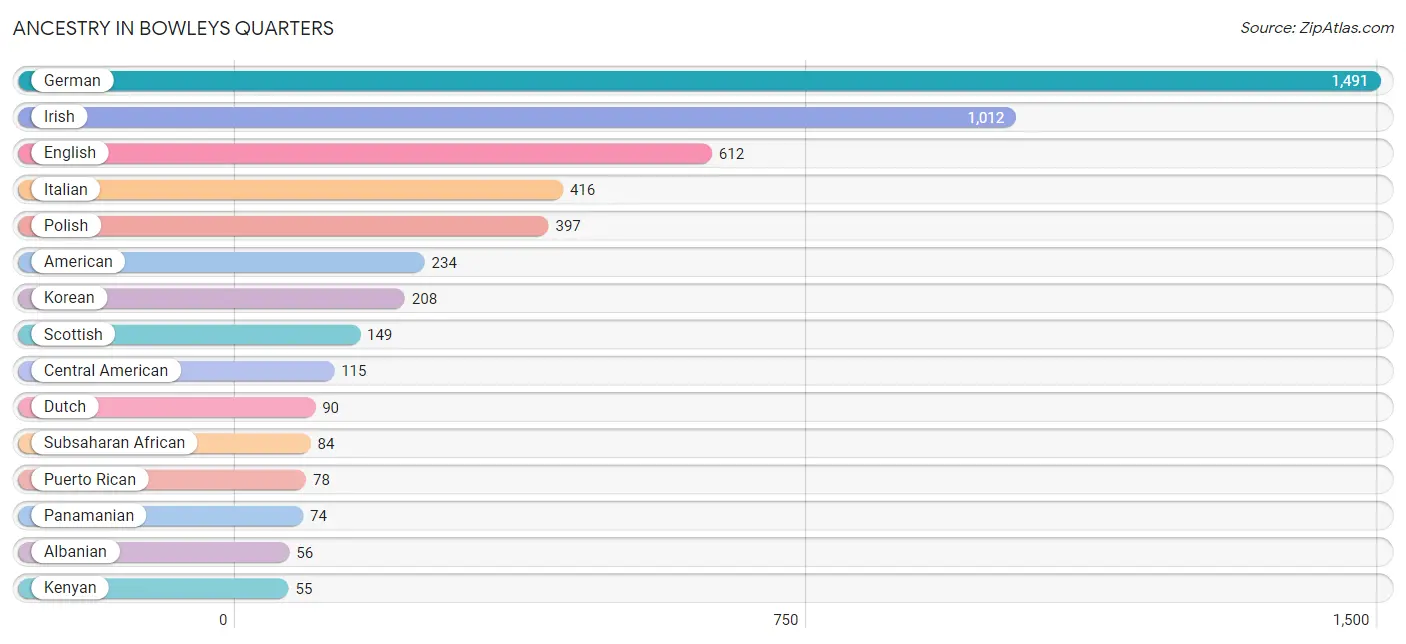
| Ancestry | # Population | % Population |
| African | 24 | 0.4% |
| Albanian | 56 | 0.8% |
| American | 234 | 3.5% |
| Blackfeet | 5 | 0.1% |
| Bolivian | 28 | 0.4% |
| British | 10 | 0.2% |
| Burmese | 19 | 0.3% |
| Central American | 115 | 1.7% |
| Cherokee | 11 | 0.2% |
| Colombian | 14 | 0.2% |
| Cuban | 21 | 0.3% |
| Czechoslovakian | 5 | 0.1% |
| Dutch | 90 | 1.3% |
| Eastern European | 5 | 0.1% |
| English | 612 | 9.1% |
| European | 19 | 0.3% |
| French | 25 | 0.4% |
| German | 1,491 | 22.1% |
| Greek | 52 | 0.8% |
| Honduran | 41 | 0.6% |
| Hungarian | 14 | 0.2% |
| Indian (Asian) | 16 | 0.2% |
| Irish | 1,012 | 15.0% |
| Italian | 416 | 6.2% |
| Jamaican | 6 | 0.1% |
| Kenyan | 55 | 0.8% |
| Korean | 208 | 3.1% |
| Lithuanian | 21 | 0.3% |
| Mexican | 22 | 0.3% |
| Native Hawaiian | 8 | 0.1% |
| Nigerian | 5 | 0.1% |
| Norwegian | 38 | 0.6% |
| Panamanian | 74 | 1.1% |
| Polish | 397 | 5.9% |
| Puerto Rican | 78 | 1.2% |
| Russian | 19 | 0.3% |
| Scotch-Irish | 22 | 0.3% |
| Scottish | 149 | 2.2% |
| Slovak | 13 | 0.2% |
| South American | 42 | 0.6% |
| Subsaharan African | 84 | 1.3% |
| Thai | 24 | 0.4% |
| Welsh | 45 | 0.7% | View All 43 Rows |
Immigrants in Bowleys Quarters
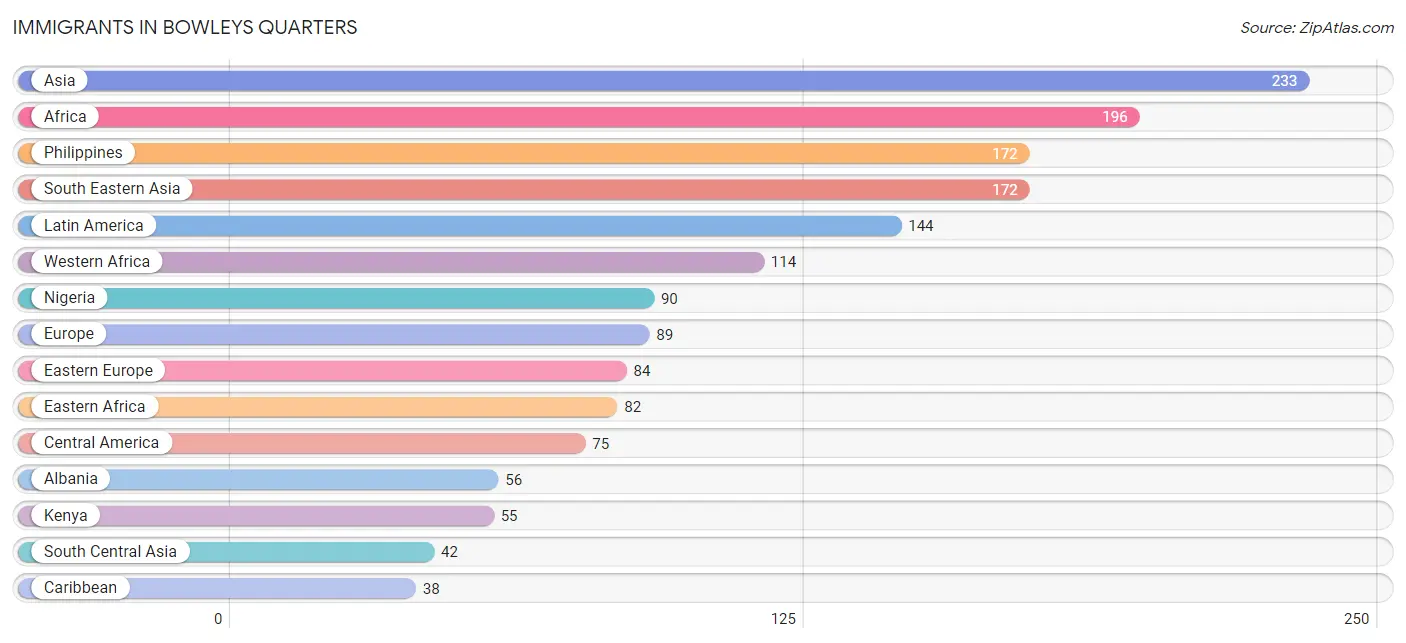
The most numerous immigrant groups reported in Bowleys Quarters came from Asia (233 | 3.5%), Africa (196 | 2.9%), Philippines (172 | 2.5%), South Eastern Asia (172 | 2.5%), and Latin America (144 | 2.1%), together accounting for 13.6% of all Bowleys Quarters residents.
| Immigration Origin | # Population | % Population |
| Africa | 196 | 2.9% |
| Albania | 56 | 0.8% |
| Asia | 233 | 3.5% |
| Caribbean | 38 | 0.6% |
| Central America | 75 | 1.1% |
| Colombia | 14 | 0.2% |
| Cuba | 10 | 0.2% |
| Czechoslovakia | 28 | 0.4% |
| Eastern Africa | 82 | 1.2% |
| Eastern Asia | 19 | 0.3% |
| Eastern Europe | 84 | 1.3% |
| Ecuador | 17 | 0.3% |
| El Salvador | 14 | 0.2% |
| Europe | 89 | 1.3% |
| Greece | 5 | 0.1% |
| Honduras | 27 | 0.4% |
| India | 22 | 0.3% |
| Jamaica | 28 | 0.4% |
| Japan | 7 | 0.1% |
| Kenya | 55 | 0.8% |
| Korea | 12 | 0.2% |
| Latin America | 144 | 2.1% |
| Nigeria | 90 | 1.3% |
| Pakistan | 20 | 0.3% |
| Panama | 34 | 0.5% |
| Philippines | 172 | 2.5% |
| South America | 31 | 0.5% |
| South Central Asia | 42 | 0.6% |
| South Eastern Asia | 172 | 2.5% |
| Southern Europe | 5 | 0.1% |
| Western Africa | 114 | 1.7% | View All 31 Rows |
Sex and Age in Bowleys Quarters
Sex and Age in Bowleys Quarters
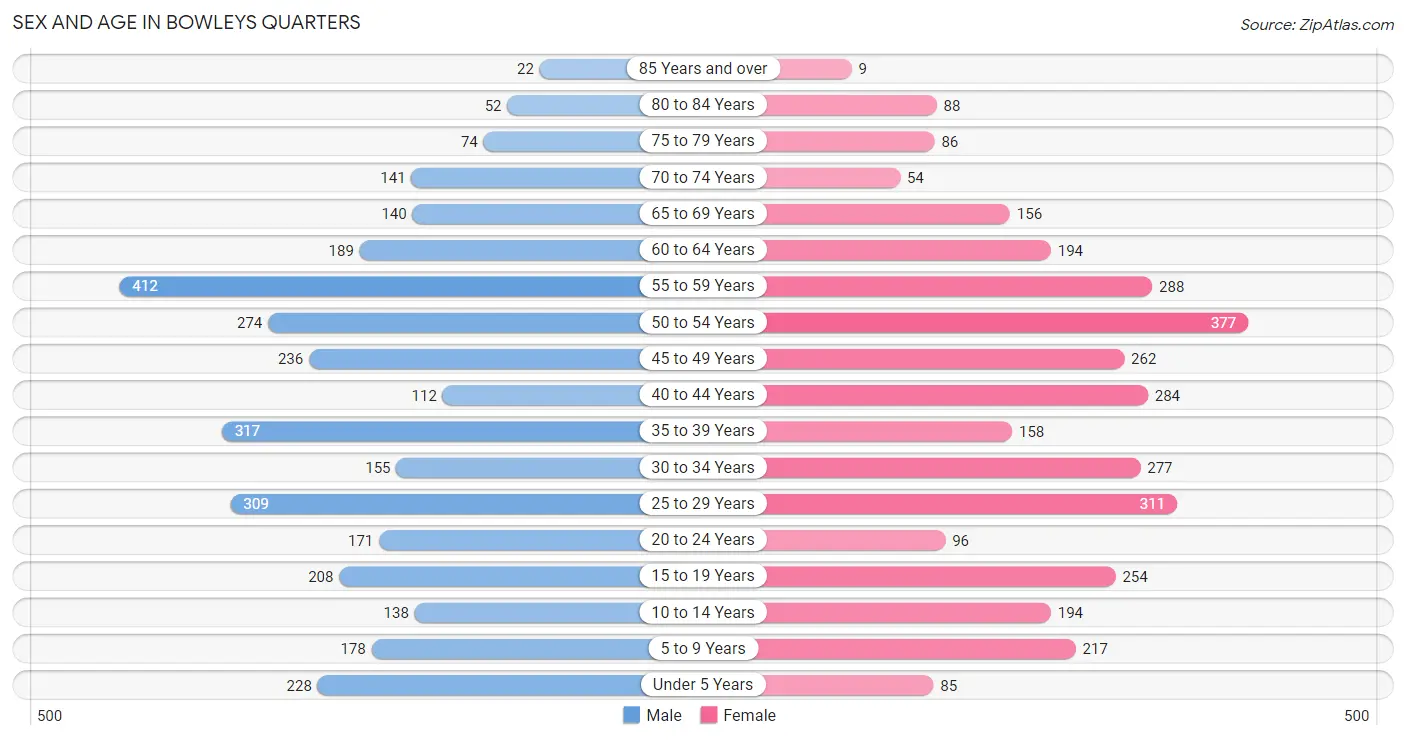
The most populous age groups in Bowleys Quarters are 55 to 59 Years (412 | 12.3%) for men and 50 to 54 Years (377 | 11.1%) for women.
| Age Bracket | Male | Female |
| Under 5 Years | 228 (6.8%) | 85 (2.5%) |
| 5 to 9 Years | 178 (5.3%) | 217 (6.4%) |
| 10 to 14 Years | 138 (4.1%) | 194 (5.7%) |
| 15 to 19 Years | 208 (6.2%) | 254 (7.5%) |
| 20 to 24 Years | 171 (5.1%) | 96 (2.8%) |
| 25 to 29 Years | 309 (9.2%) | 311 (9.2%) |
| 30 to 34 Years | 155 (4.6%) | 277 (8.2%) |
| 35 to 39 Years | 317 (9.5%) | 158 (4.7%) |
| 40 to 44 Years | 112 (3.3%) | 284 (8.4%) |
| 45 to 49 Years | 236 (7.0%) | 262 (7.7%) |
| 50 to 54 Years | 274 (8.2%) | 377 (11.1%) |
| 55 to 59 Years | 412 (12.3%) | 288 (8.5%) |
| 60 to 64 Years | 189 (5.6%) | 194 (5.7%) |
| 65 to 69 Years | 140 (4.2%) | 156 (4.6%) |
| 70 to 74 Years | 141 (4.2%) | 54 (1.6%) |
| 75 to 79 Years | 74 (2.2%) | 86 (2.5%) |
| 80 to 84 Years | 52 (1.5%) | 88 (2.6%) |
| 85 Years and over | 22 (0.7%) | 9 (0.3%) |
| Total | 3,356 (100.0%) | 3,390 (100.0%) |
Families and Households in Bowleys Quarters
Median Family Size in Bowleys Quarters
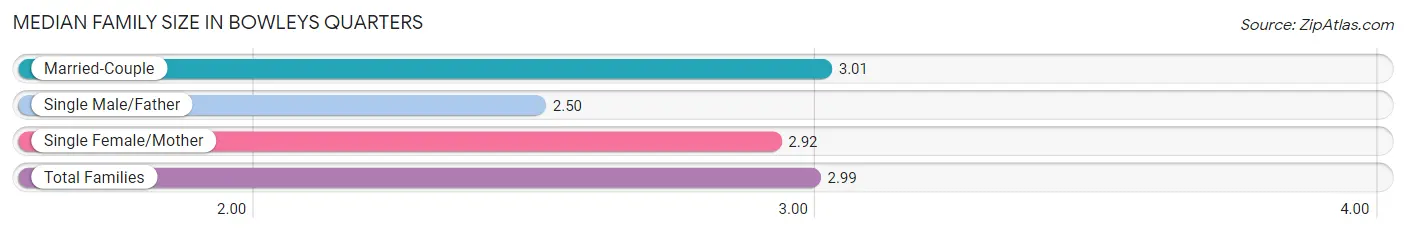
The median family size in Bowleys Quarters is 2.99 persons per family, with married-couple families (1,554 | 79.5%) accounting for the largest median family size of 3.01 persons per family. On the other hand, single male/father families (20 | 1.0%) represent the smallest median family size with 2.50 persons per family.
| Family Type | # Families | Family Size |
| Married-Couple | 1,554 (79.5%) | 3.01 |
| Single Male/Father | 20 (1.0%) | 2.50 |
| Single Female/Mother | 380 (19.5%) | 2.92 |
| Total Families | 1,954 (100.0%) | 2.99 |
Median Household Size in Bowleys Quarters
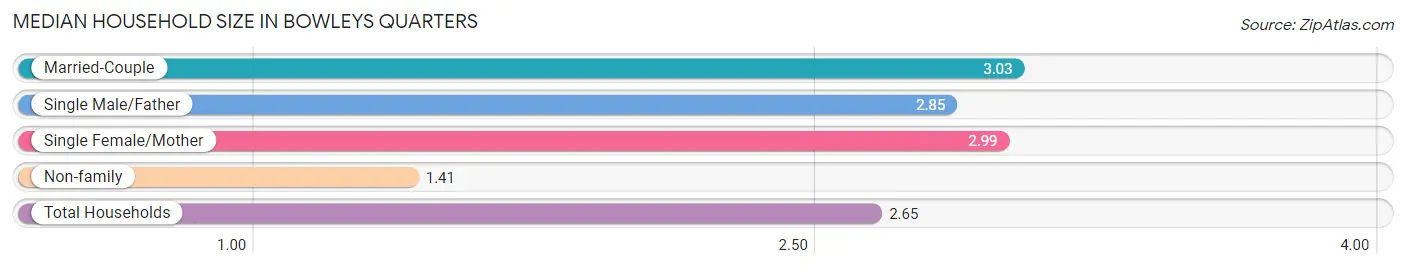
The median household size in Bowleys Quarters is 2.65 persons per household, with married-couple households (1,554 | 61.0%) accounting for the largest median household size of 3.03 persons per household. non-family households (594 | 23.3%) represent the smallest median household size with 1.41 persons per household.
| Household Type | # Households | Household Size |
| Married-Couple | 1,554 (61.0%) | 3.03 |
| Single Male/Father | 20 (0.8%) | 2.85 |
| Single Female/Mother | 380 (14.9%) | 2.99 |
| Non-family | 594 (23.3%) | 1.41 |
| Total Households | 2,548 (100.0%) | 2.65 |
Household Size by Marriage Status in Bowleys Quarters
Out of a total of 2,548 households in Bowleys Quarters, 1,954 (76.7%) are family households, while 594 (23.3%) are nonfamily households. The most numerous type of family households are 2-person households, comprising 847, and the most common type of nonfamily households are 1-person households, comprising 504.
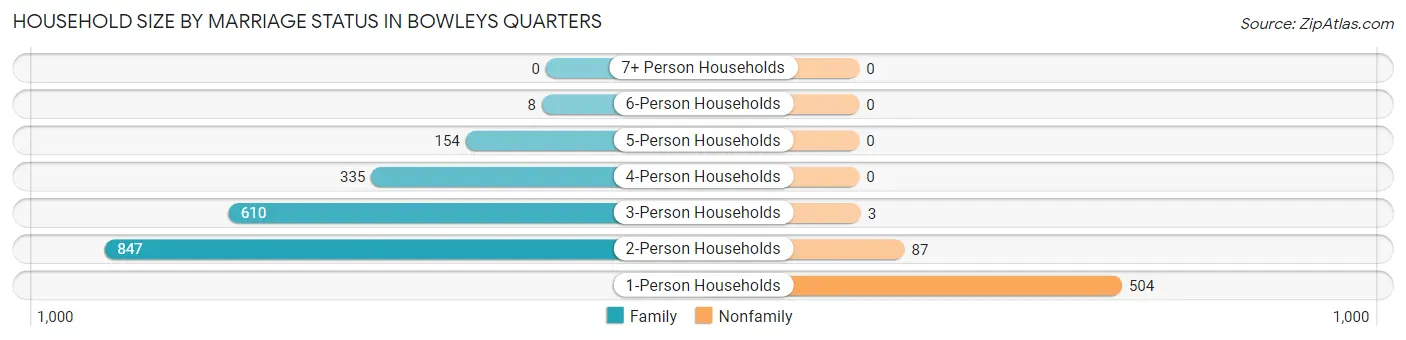
| Household Size | Family Households | Nonfamily Households |
| 1-Person Households | - | 504 (19.8%) |
| 2-Person Households | 847 (33.2%) | 87 (3.4%) |
| 3-Person Households | 610 (23.9%) | 3 (0.1%) |
| 4-Person Households | 335 (13.2%) | 0 (0.0%) |
| 5-Person Households | 154 (6.0%) | 0 (0.0%) |
| 6-Person Households | 8 (0.3%) | 0 (0.0%) |
| 7+ Person Households | 0 (0.0%) | 0 (0.0%) |
| Total | 1,954 (76.7%) | 594 (23.3%) |
Female Fertility in Bowleys Quarters
Fertility by Age in Bowleys Quarters
Average fertility rate in Bowleys Quarters is 68.0 births per 1,000 women. Women in the age bracket of 20 to 34 years have the highest fertility rate with 85.0 births per 1,000 women. Women in the age bracket of 20 to 34 years acount for 50.9% of all women with births.
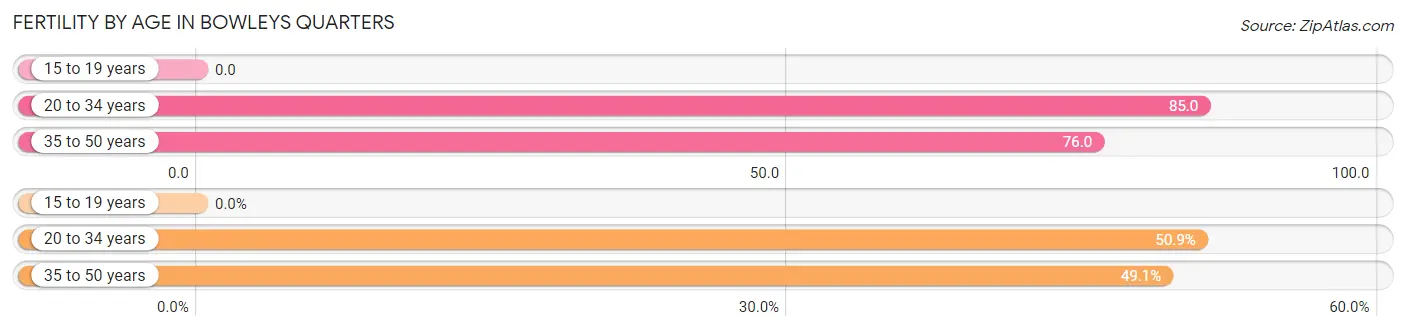
| Age Bracket | Women with Births | Births / 1,000 Women |
| 15 to 19 years | 0 (0.0%) | 0.0 |
| 20 to 34 years | 58 (50.9%) | 85.0 |
| 35 to 50 years | 56 (49.1%) | 76.0 |
| Total | 114 (100.0%) | 68.0 |
Fertility by Age by Marriage Status in Bowleys Quarters
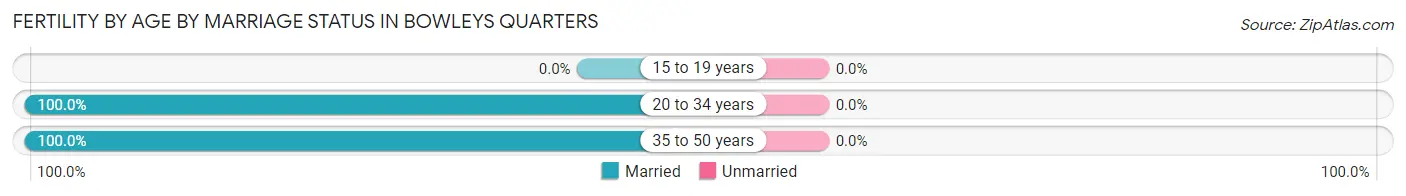
| Age Bracket | Married | Unmarried |
| 15 to 19 years | 0 (0.0%) | 0 (0.0%) |
| 20 to 34 years | 58 (100.0%) | 0 (0.0%) |
| 35 to 50 years | 56 (100.0%) | 0 (0.0%) |
| Total | 114 (100.0%) | 0 (0.0%) |
Fertility by Education in Bowleys Quarters
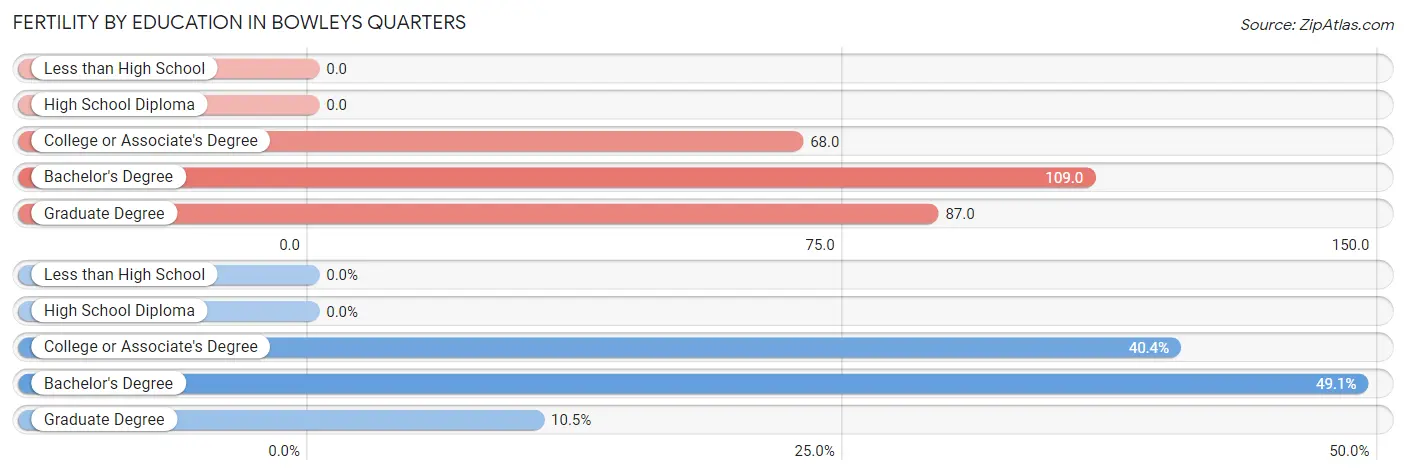
| Educational Attainment | Women with Births | Births / 1,000 Women |
| Less than High School | 0 (0.0%) | 0.0 |
| High School Diploma | 0 (0.0%) | 0.0 |
| College or Associate's Degree | 46 (40.4%) | 68.0 |
| Bachelor's Degree | 56 (49.1%) | 109.0 |
| Graduate Degree | 12 (10.5%) | 87.0 |
| Total | 114 (100.0%) | 68.0 |
Fertility by Education by Marriage Status in Bowleys Quarters
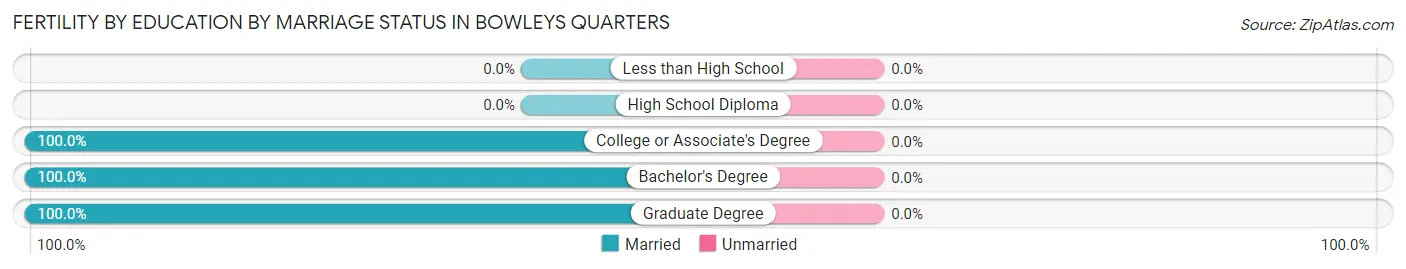
| Educational Attainment | Married | Unmarried |
| Less than High School | 0 (0.0%) | 0 (0.0%) |
| High School Diploma | 0 (0.0%) | 0 (0.0%) |
| College or Associate's Degree | 46 (100.0%) | 0 (0.0%) |
| Bachelor's Degree | 56 (100.0%) | 0 (0.0%) |
| Graduate Degree | 12 (100.0%) | 0 (0.0%) |
| Total | 114 (100.0%) | 0 (0.0%) |
Employment Characteristics in Bowleys Quarters
Employment by Class of Employer in Bowleys Quarters
Among the 4,154 employed individuals in Bowleys Quarters, private company employees (2,868 | 69.0%), not-for-profit organizations (494 | 11.9%), and local government employees (279 | 6.7%) make up the most common classes of employment.
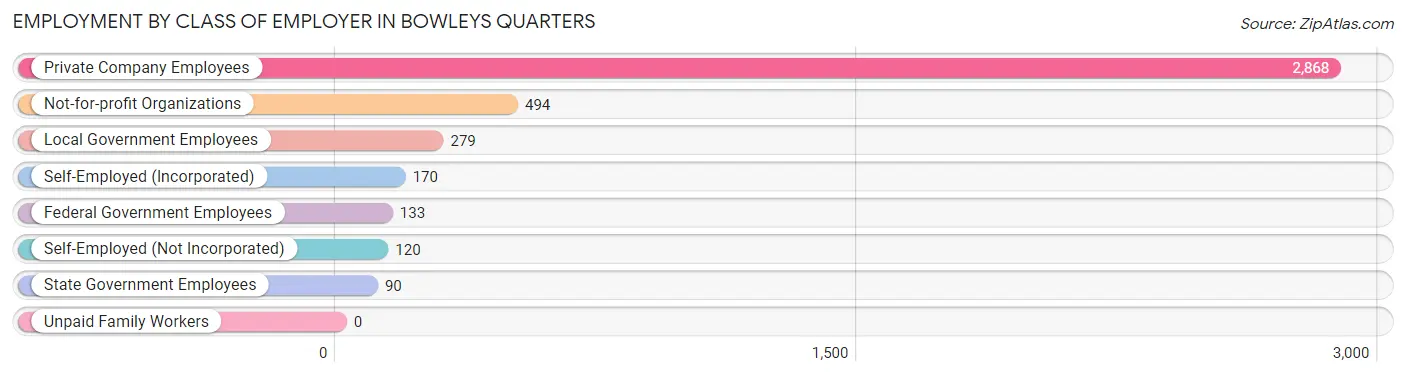
| Employer Class | # Employees | % Employees |
| Private Company Employees | 2,868 | 69.0% |
| Self-Employed (Incorporated) | 170 | 4.1% |
| Self-Employed (Not Incorporated) | 120 | 2.9% |
| Not-for-profit Organizations | 494 | 11.9% |
| Local Government Employees | 279 | 6.7% |
| State Government Employees | 90 | 2.2% |
| Federal Government Employees | 133 | 3.2% |
| Unpaid Family Workers | 0 | 0.0% |
| Total | 4,154 | 100.0% |
Employment Status by Age in Bowleys Quarters
According to the labor force statistics for Bowleys Quarters, out of the total population over 16 years of age (5,580), 76.3% or 4,258 individuals are in the labor force, with 2.2% or 94 of them unemployed. The age group with the highest labor force participation rate is 30 to 34 years, with 98.1% or 424 individuals in the labor force. Within the labor force, the 75 years and over age range has the highest percentage of unemployed individuals, with 48.4% or 15 of them being unemployed.
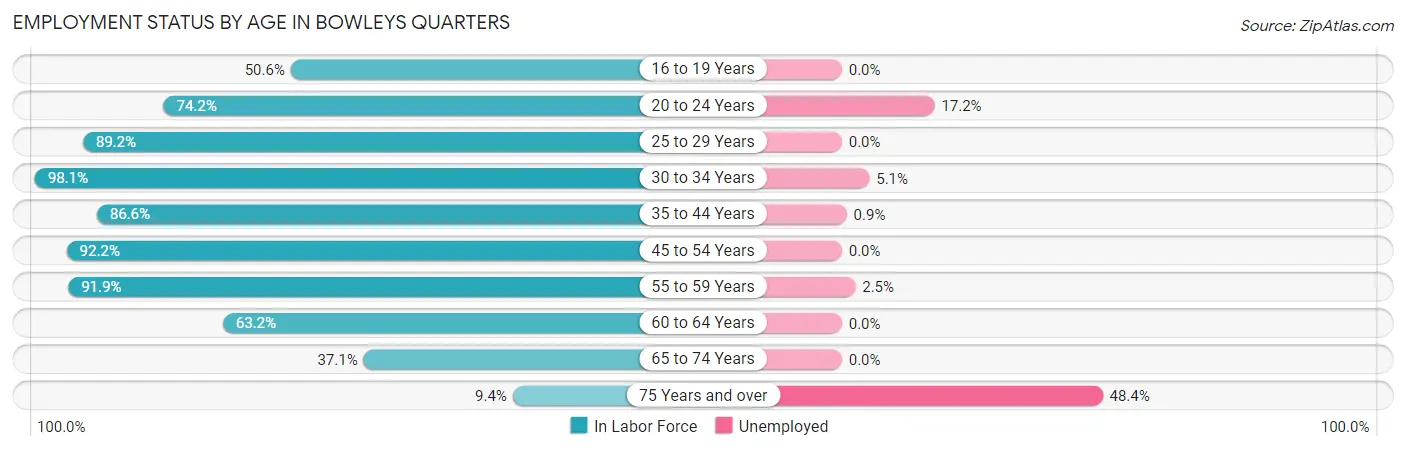
| Age Bracket | In Labor Force | Unemployed |
| 16 to 19 Years | 170 (50.6%) | 0 (0.0%) |
| 20 to 24 Years | 198 (74.2%) | 34 (17.2%) |
| 25 to 29 Years | 553 (89.2%) | 0 (0.0%) |
| 30 to 34 Years | 424 (98.1%) | 22 (5.1%) |
| 35 to 44 Years | 754 (86.6%) | 7 (0.9%) |
| 45 to 54 Years | 1,059 (92.2%) | 0 (0.0%) |
| 55 to 59 Years | 643 (91.9%) | 16 (2.5%) |
| 60 to 64 Years | 242 (63.2%) | 0 (0.0%) |
| 65 to 74 Years | 182 (37.1%) | 0 (0.0%) |
| 75 Years and over | 31 (9.4%) | 15 (48.4%) |
| Total | 4,258 (76.3%) | 94 (2.2%) |
Employment Status by Educational Attainment in Bowleys Quarters
According to labor force statistics for Bowleys Quarters, 88.4% of individuals (3,673) out of the total population between 25 and 64 years of age (4,155) are in the labor force, with 1.2% or 44 of them being unemployed. The group with the highest labor force participation rate are those with the educational attainment of bachelor's degree or higher, with 93.7% or 1,226 individuals in the labor force. Within the labor force, individuals with less than high school education have the highest percentage of unemployment, with 8.0% or 7 of them being unemployed.
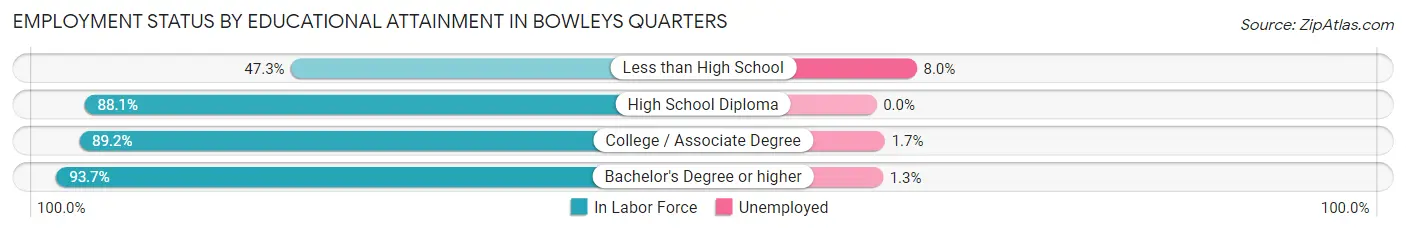
| Educational Attainment | In Labor Force | Unemployed |
| Less than High School | 87 (47.3%) | 15 (8.0%) |
| High School Diploma | 1,112 (88.1%) | 0 (0.0%) |
| College / Associate Degree | 1,250 (89.2%) | 24 (1.7%) |
| Bachelor's Degree or higher | 1,226 (93.7%) | 17 (1.3%) |
| Total | 3,673 (88.4%) | 50 (1.2%) |
Employment Occupations by Sex in Bowleys Quarters
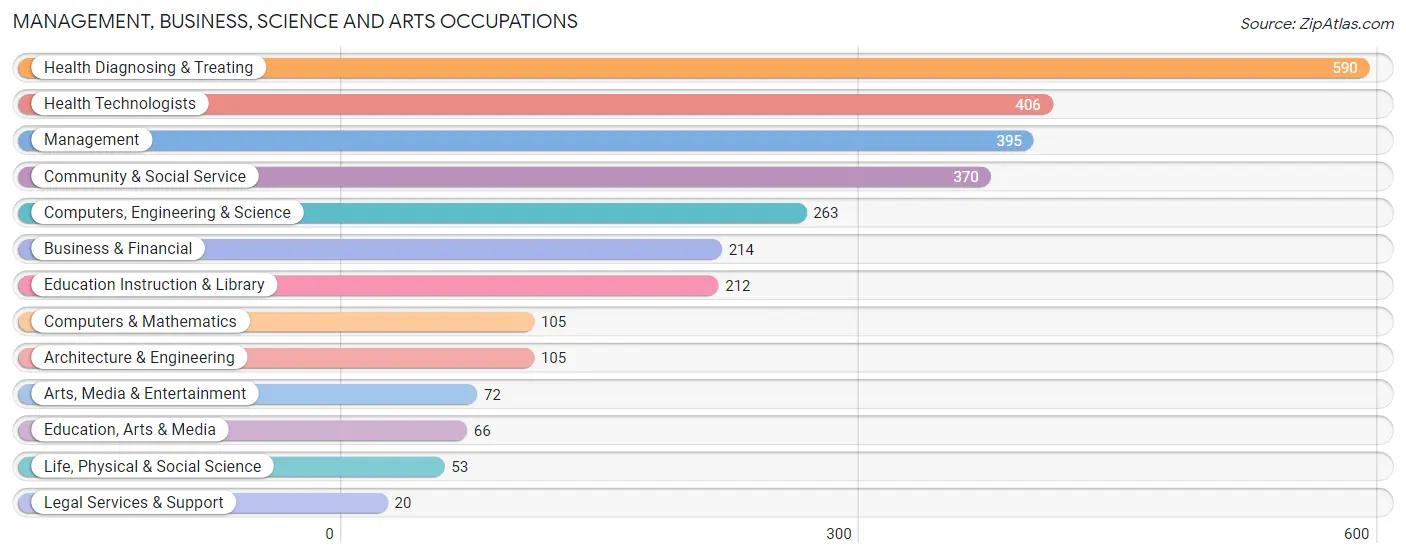
Management, Business, Science and Arts Occupations
The most common Management, Business, Science and Arts occupations in Bowleys Quarters are Health Diagnosing & Treating (590 | 14.2%), Health Technologists (406 | 9.8%), Management (395 | 9.5%), Community & Social Service (370 | 8.9%), and Computers, Engineering & Science (263 | 6.3%).
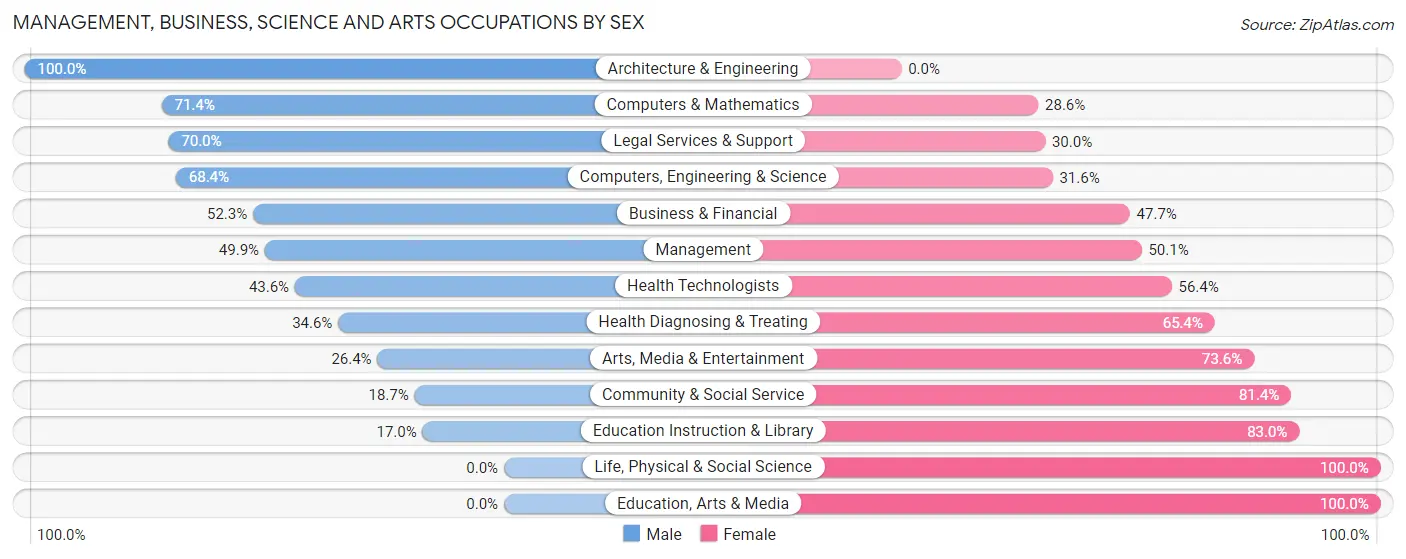
Management, Business, Science and Arts Occupations by Sex
Within the Management, Business, Science and Arts occupations in Bowleys Quarters, the most male-oriented occupations are Architecture & Engineering (100.0%), Computers & Mathematics (71.4%), and Legal Services & Support (70.0%), while the most female-oriented occupations are Life, Physical & Social Science (100.0%), Education, Arts & Media (100.0%), and Education Instruction & Library (83.0%).
| Occupation | Male | Female |
| Management | 197 (49.9%) | 198 (50.1%) |
| Business & Financial | 112 (52.3%) | 102 (47.7%) |
| Computers, Engineering & Science | 180 (68.4%) | 83 (31.6%) |
| Computers & Mathematics | 75 (71.4%) | 30 (28.6%) |
| Architecture & Engineering | 105 (100.0%) | 0 (0.0%) |
| Life, Physical & Social Science | 0 (0.0%) | 53 (100.0%) |
| Community & Social Service | 69 (18.6%) | 301 (81.4%) |
| Education, Arts & Media | 0 (0.0%) | 66 (100.0%) |
| Legal Services & Support | 14 (70.0%) | 6 (30.0%) |
| Education Instruction & Library | 36 (17.0%) | 176 (83.0%) |
| Arts, Media & Entertainment | 19 (26.4%) | 53 (73.6%) |
| Health Diagnosing & Treating | 204 (34.6%) | 386 (65.4%) |
| Health Technologists | 177 (43.6%) | 229 (56.4%) |
| Total (Category) | 762 (41.6%) | 1,070 (58.4%) |
| Total (Overall) | 2,040 (49.1%) | 2,112 (50.9%) |
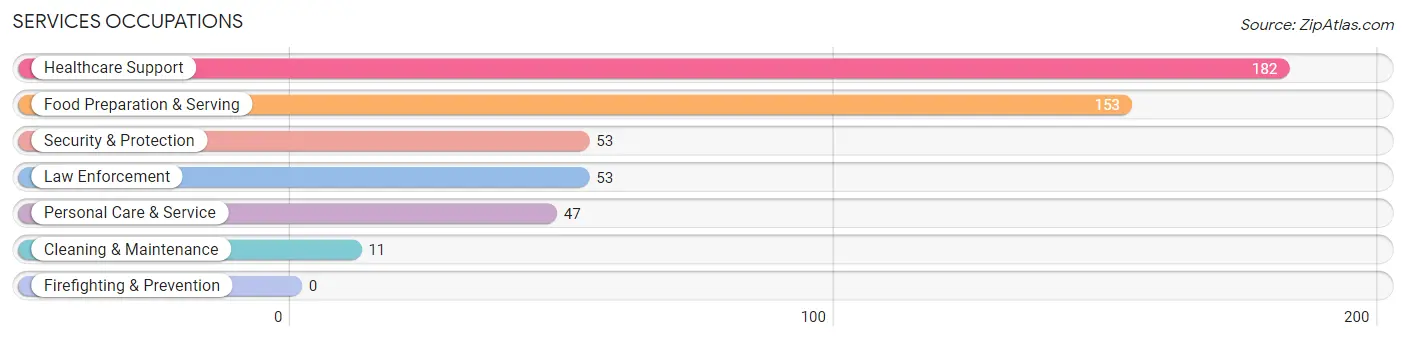
Services Occupations
The most common Services occupations in Bowleys Quarters are Healthcare Support (182 | 4.4%), Food Preparation & Serving (153 | 3.7%), Security & Protection (53 | 1.3%), Law Enforcement (53 | 1.3%), and Personal Care & Service (47 | 1.1%).
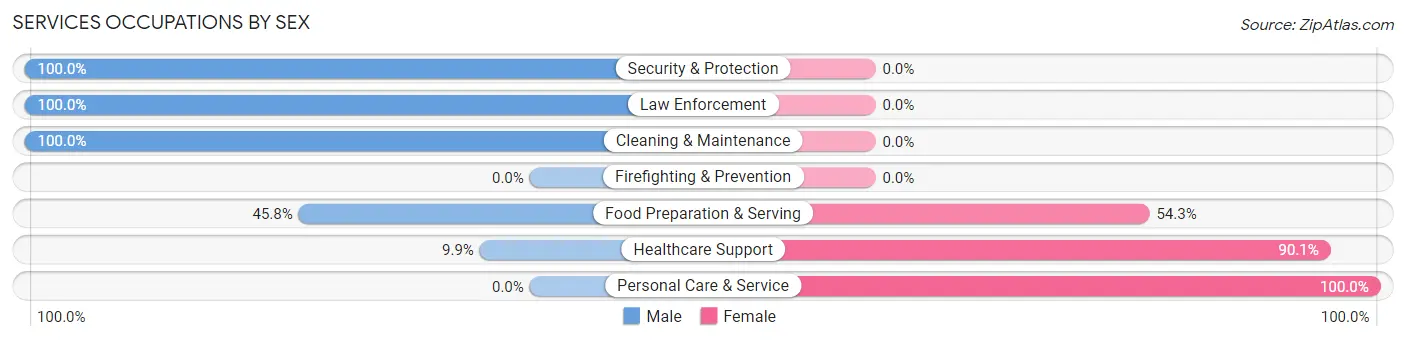
Services Occupations by Sex
Within the Services occupations in Bowleys Quarters, the most male-oriented occupations are Security & Protection (100.0%), Law Enforcement (100.0%), and Cleaning & Maintenance (100.0%), while the most female-oriented occupations are Personal Care & Service (100.0%), Healthcare Support (90.1%), and Food Preparation & Serving (54.2%).
| Occupation | Male | Female |
| Healthcare Support | 18 (9.9%) | 164 (90.1%) |
| Security & Protection | 53 (100.0%) | 0 (0.0%) |
| Firefighting & Prevention | 0 (0.0%) | 0 (0.0%) |
| Law Enforcement | 53 (100.0%) | 0 (0.0%) |
| Food Preparation & Serving | 70 (45.8%) | 83 (54.2%) |
| Cleaning & Maintenance | 11 (100.0%) | 0 (0.0%) |
| Personal Care & Service | 0 (0.0%) | 47 (100.0%) |
| Total (Category) | 152 (34.1%) | 294 (65.9%) |
| Total (Overall) | 2,040 (49.1%) | 2,112 (50.9%) |
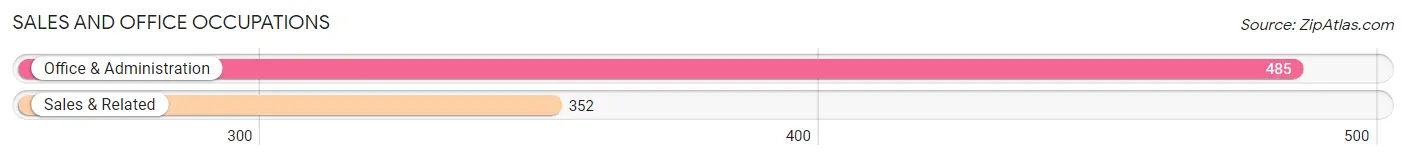
Sales and Office Occupations
The most common Sales and Office occupations in Bowleys Quarters are Office & Administration (485 | 11.7%), and Sales & Related (352 | 8.5%).
Sales and Office Occupations by Sex
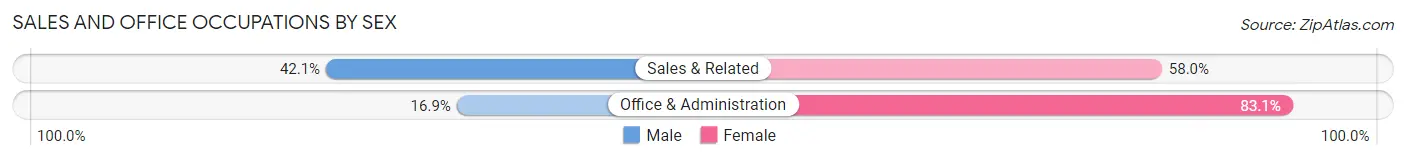
| Occupation | Male | Female |
| Sales & Related | 148 (42.0%) | 204 (58.0%) |
| Office & Administration | 82 (16.9%) | 403 (83.1%) |
| Total (Category) | 230 (27.5%) | 607 (72.5%) |
| Total (Overall) | 2,040 (49.1%) | 2,112 (50.9%) |
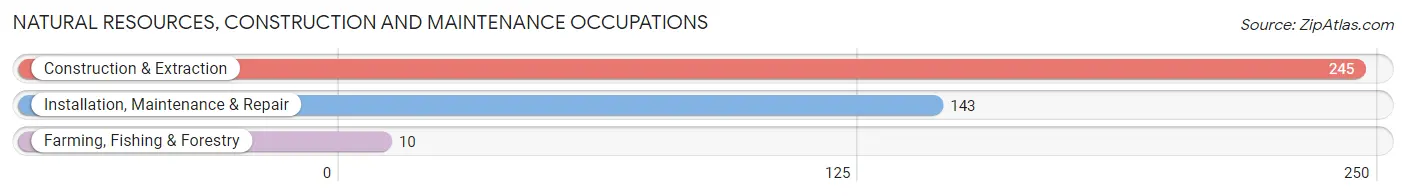
Natural Resources, Construction and Maintenance Occupations
The most common Natural Resources, Construction and Maintenance occupations in Bowleys Quarters are Construction & Extraction (245 | 5.9%), Installation, Maintenance & Repair (143 | 3.4%), and Farming, Fishing & Forestry (10 | 0.2%).
Natural Resources, Construction and Maintenance Occupations by Sex
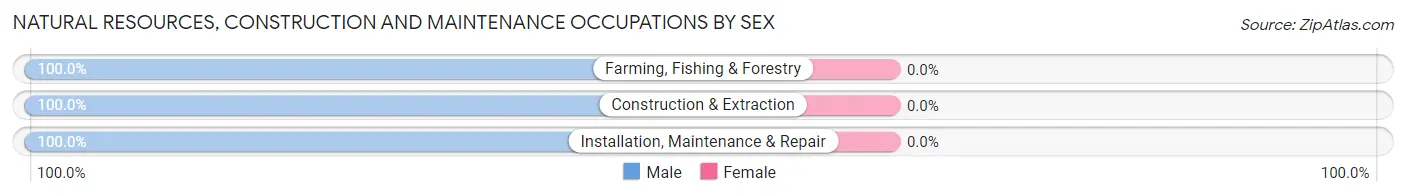
| Occupation | Male | Female |
| Farming, Fishing & Forestry | 10 (100.0%) | 0 (0.0%) |
| Construction & Extraction | 245 (100.0%) | 0 (0.0%) |
| Installation, Maintenance & Repair | 143 (100.0%) | 0 (0.0%) |
| Total (Category) | 398 (100.0%) | 0 (0.0%) |
| Total (Overall) | 2,040 (49.1%) | 2,112 (50.9%) |
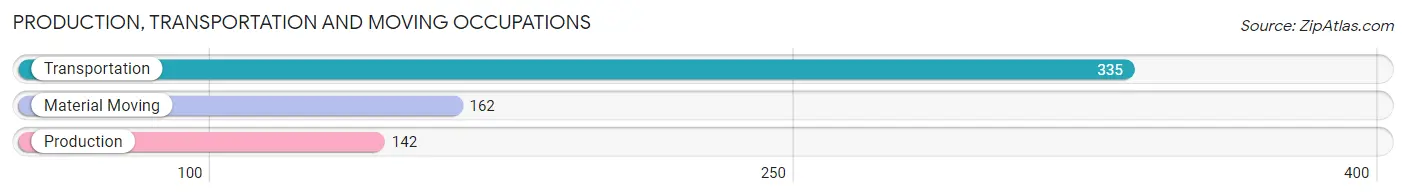
Production, Transportation and Moving Occupations
The most common Production, Transportation and Moving occupations in Bowleys Quarters are Transportation (335 | 8.1%), Material Moving (162 | 3.9%), and Production (142 | 3.4%).
Production, Transportation and Moving Occupations by Sex
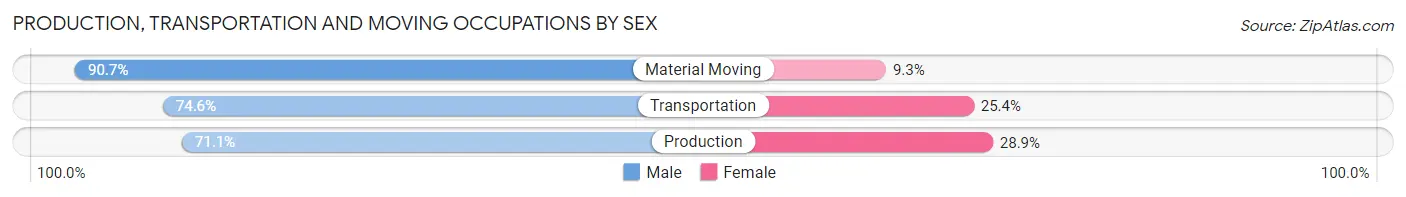
| Occupation | Male | Female |
| Production | 101 (71.1%) | 41 (28.9%) |
| Transportation | 250 (74.6%) | 85 (25.4%) |
| Material Moving | 147 (90.7%) | 15 (9.3%) |
| Total (Category) | 498 (77.9%) | 141 (22.1%) |
| Total (Overall) | 2,040 (49.1%) | 2,112 (50.9%) |
Employment Industries by Sex in Bowleys Quarters
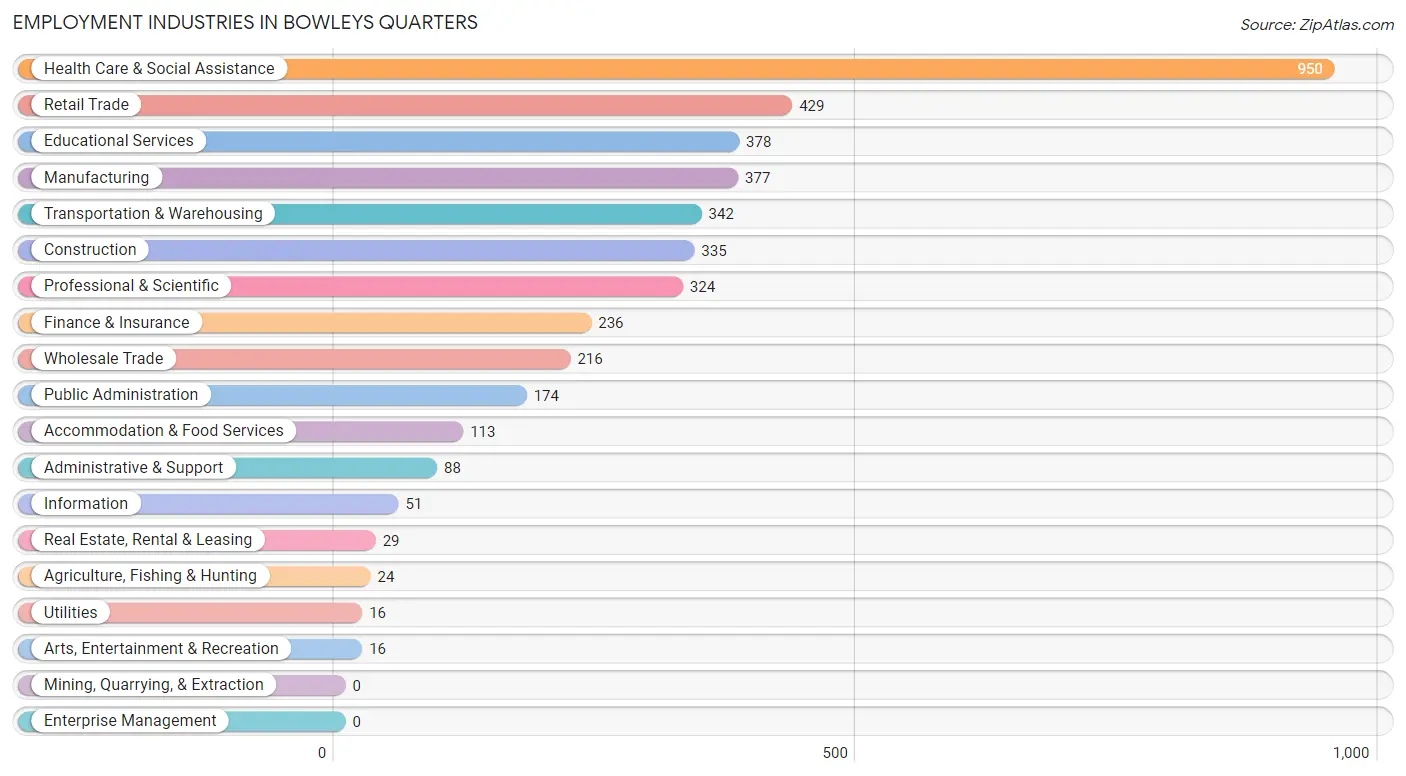
Employment Industries in Bowleys Quarters
The major employment industries in Bowleys Quarters include Health Care & Social Assistance (950 | 22.9%), Retail Trade (429 | 10.3%), Educational Services (378 | 9.1%), Manufacturing (377 | 9.1%), and Transportation & Warehousing (342 | 8.2%).
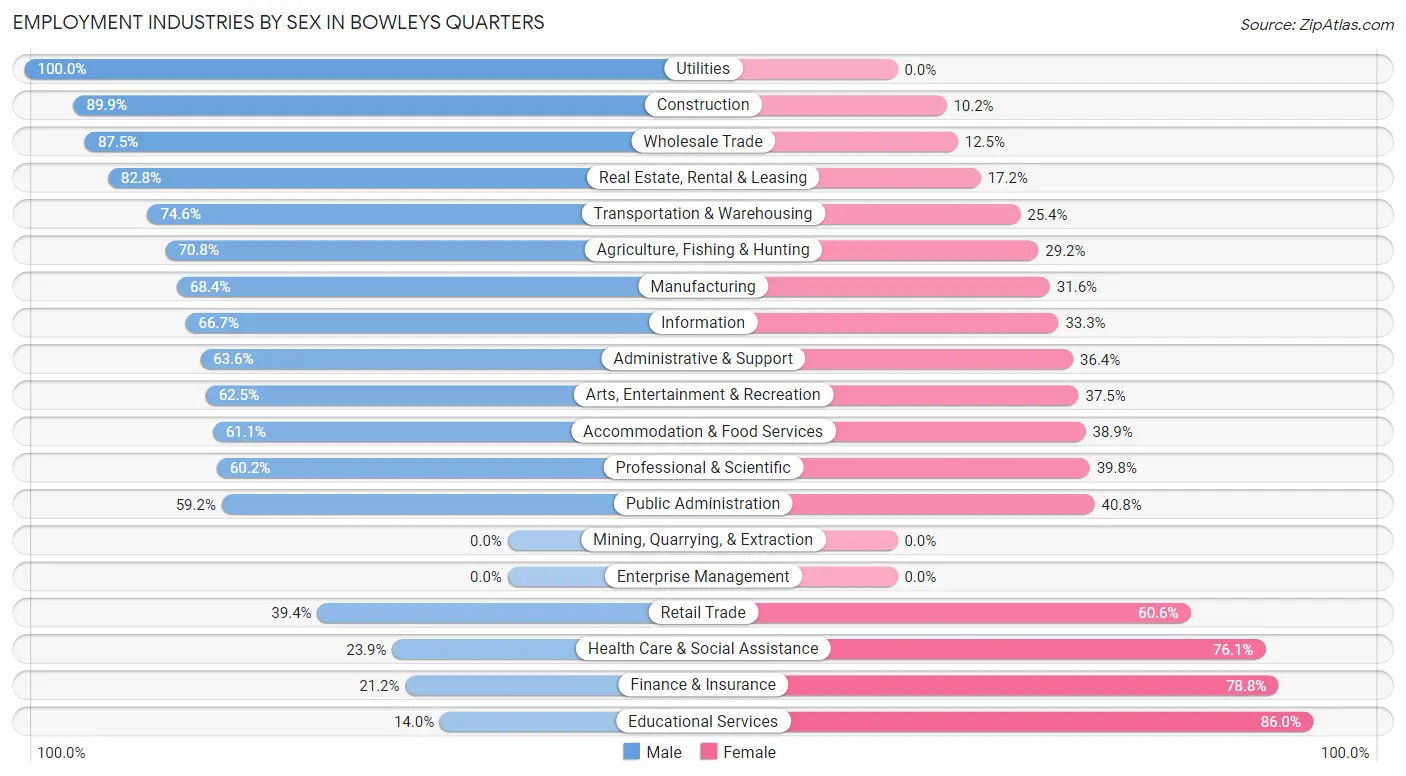
Employment Industries by Sex in Bowleys Quarters
The Bowleys Quarters industries that see more men than women are Utilities (100.0%), Construction (89.8%), and Wholesale Trade (87.5%), whereas the industries that tend to have a higher number of women are Educational Services (86.0%), Finance & Insurance (78.8%), and Health Care & Social Assistance (76.1%).
| Industry | Male | Female |
| Agriculture, Fishing & Hunting | 17 (70.8%) | 7 (29.2%) |
| Mining, Quarrying, & Extraction | 0 (0.0%) | 0 (0.0%) |
| Construction | 301 (89.8%) | 34 (10.2%) |
| Manufacturing | 258 (68.4%) | 119 (31.6%) |
| Wholesale Trade | 189 (87.5%) | 27 (12.5%) |
| Retail Trade | 169 (39.4%) | 260 (60.6%) |
| Transportation & Warehousing | 255 (74.6%) | 87 (25.4%) |
| Utilities | 16 (100.0%) | 0 (0.0%) |
| Information | 34 (66.7%) | 17 (33.3%) |
| Finance & Insurance | 50 (21.2%) | 186 (78.8%) |
| Real Estate, Rental & Leasing | 24 (82.8%) | 5 (17.2%) |
| Professional & Scientific | 195 (60.2%) | 129 (39.8%) |
| Enterprise Management | 0 (0.0%) | 0 (0.0%) |
| Administrative & Support | 56 (63.6%) | 32 (36.4%) |
| Educational Services | 53 (14.0%) | 325 (86.0%) |
| Health Care & Social Assistance | 227 (23.9%) | 723 (76.1%) |
| Arts, Entertainment & Recreation | 10 (62.5%) | 6 (37.5%) |
| Accommodation & Food Services | 69 (61.1%) | 44 (38.9%) |
| Public Administration | 103 (59.2%) | 71 (40.8%) |
| Total | 2,040 (49.1%) | 2,112 (50.9%) |
Education in Bowleys Quarters
School Enrollment in Bowleys Quarters
The most common levels of schooling among the 1,631 students in Bowleys Quarters are high school (369 | 22.6%), college / undergraduate (303 | 18.6%), and elementary school (292 | 17.9%).

| School Level | # Students | % Students |
| Nursery / Preschool | 114 | 7.0% |
| Kindergarten | 105 | 6.4% |
| Elementary School | 292 | 17.9% |
| Middle School | 269 | 16.5% |
| High School | 369 | 22.6% |
| College / Undergraduate | 303 | 18.6% |
| Graduate / Professional | 179 | 11.0% |
| Total | 1,631 | 100.0% |
School Enrollment by Age by Funding Source in Bowleys Quarters
Out of a total of 1,631 students who are enrolled in schools in Bowleys Quarters, 228 (14.0%) attend a private institution, while the remaining 1,403 (86.0%) are enrolled in public schools. The age group of 35 years and over has the highest likelihood of being enrolled in private schools, with 71 (43.6% in the age bracket) enrolled. Conversely, the age group of 3 to 4 year olds has the lowest likelihood of being enrolled in a private school, with 103 (100.0% in the age bracket) attending a public institution.
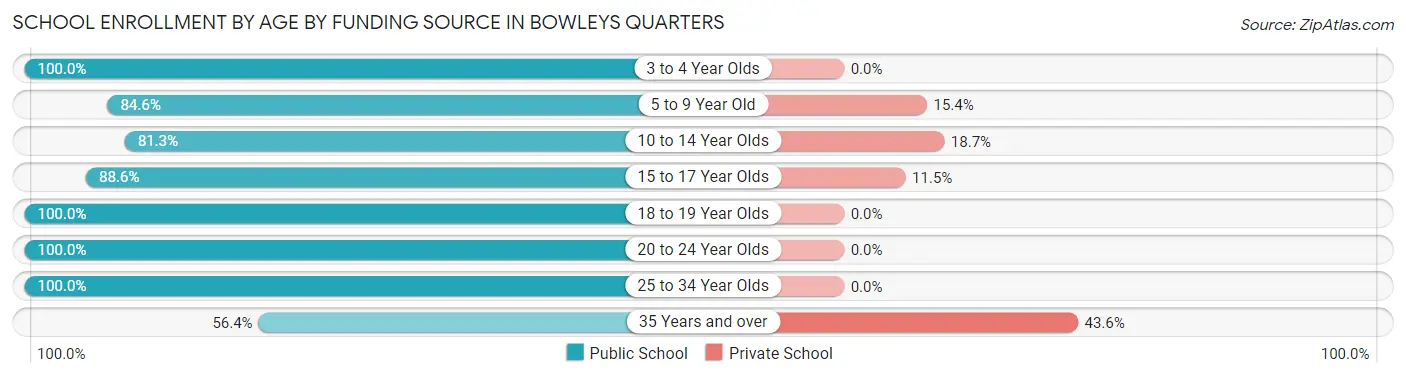
| Age Bracket | Public School | Private School |
| 3 to 4 Year Olds | 103 (100.0%) | 0 (0.0%) |
| 5 to 9 Year Old | 334 (84.6%) | 61 (15.4%) |
| 10 to 14 Year Olds | 270 (81.3%) | 62 (18.7%) |
| 15 to 17 Year Olds | 263 (88.5%) | 34 (11.5%) |
| 18 to 19 Year Olds | 145 (100.0%) | 0 (0.0%) |
| 20 to 24 Year Olds | 86 (100.0%) | 0 (0.0%) |
| 25 to 34 Year Olds | 110 (100.0%) | 0 (0.0%) |
| 35 Years and over | 92 (56.4%) | 71 (43.6%) |
| Total | 1,403 (86.0%) | 228 (14.0%) |
Educational Attainment by Field of Study in Bowleys Quarters
Science & technology (328 | 21.5%), education (272 | 17.8%), business (220 | 14.4%), liberal arts & history (143 | 9.4%), and arts & humanities (108 | 7.1%) are the most common fields of study among 1,524 individuals in Bowleys Quarters who have obtained a bachelor's degree or higher.
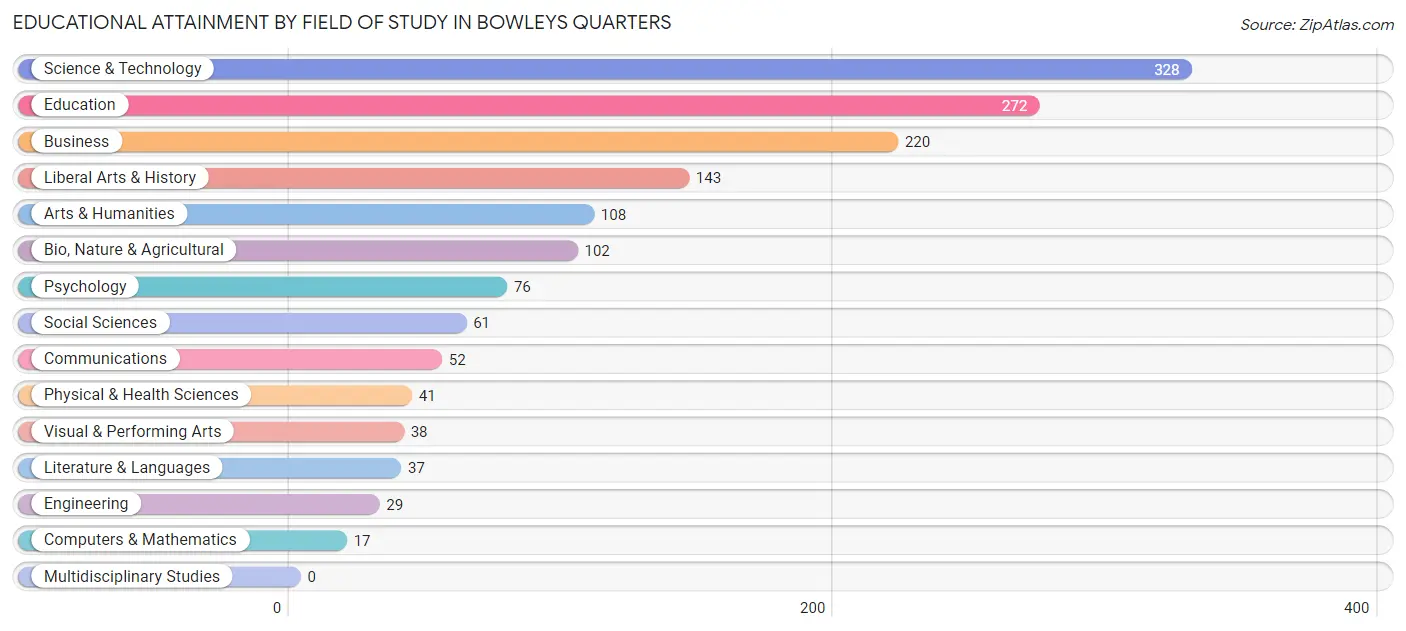
| Field of Study | # Graduates | % Graduates |
| Computers & Mathematics | 17 | 1.1% |
| Bio, Nature & Agricultural | 102 | 6.7% |
| Physical & Health Sciences | 41 | 2.7% |
| Psychology | 76 | 5.0% |
| Social Sciences | 61 | 4.0% |
| Engineering | 29 | 1.9% |
| Multidisciplinary Studies | 0 | 0.0% |
| Science & Technology | 328 | 21.5% |
| Business | 220 | 14.4% |
| Education | 272 | 17.8% |
| Literature & Languages | 37 | 2.4% |
| Liberal Arts & History | 143 | 9.4% |
| Visual & Performing Arts | 38 | 2.5% |
| Communications | 52 | 3.4% |
| Arts & Humanities | 108 | 7.1% |
| Total | 1,524 | 100.0% |
Transportation & Commute in Bowleys Quarters
Vehicle Availability by Sex in Bowleys Quarters
The most prevalent vehicle ownership categories in Bowleys Quarters are males with 2 vehicles (840, accounting for 41.2%) and females with 2 vehicles (776, making up 39.7%).
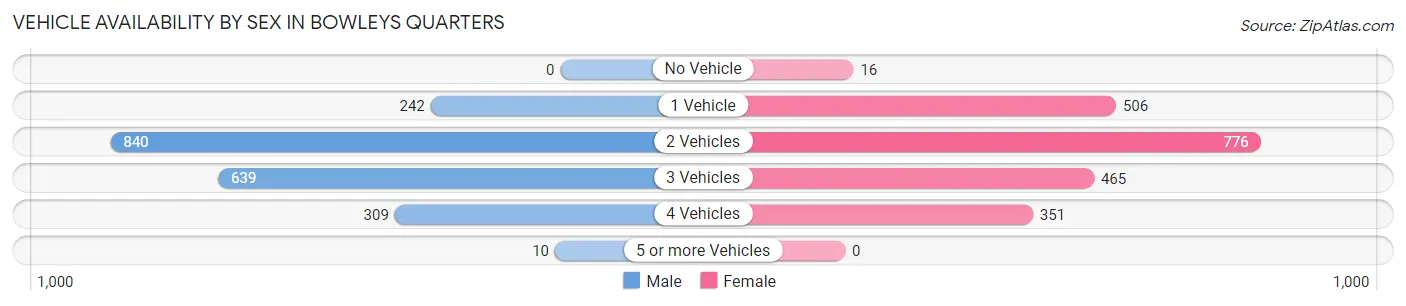
| Vehicles Available | Male | Female |
| No Vehicle | 0 (0.0%) | 16 (0.8%) |
| 1 Vehicle | 242 (11.9%) | 506 (23.9%) |
| 2 Vehicles | 840 (41.2%) | 776 (36.7%) |
| 3 Vehicles | 639 (31.3%) | 465 (22.0%) |
| 4 Vehicles | 309 (15.1%) | 351 (16.6%) |
| 5 or more Vehicles | 10 (0.5%) | 0 (0.0%) |
| Total | 2,040 (100.0%) | 2,114 (100.0%) |
Commute Time in Bowleys Quarters
The most frequently occuring commute durations in Bowleys Quarters are 30 to 34 minutes (691 commuters, 18.2%), 20 to 24 minutes (550 commuters, 14.5%), and 15 to 19 minutes (506 commuters, 13.3%).
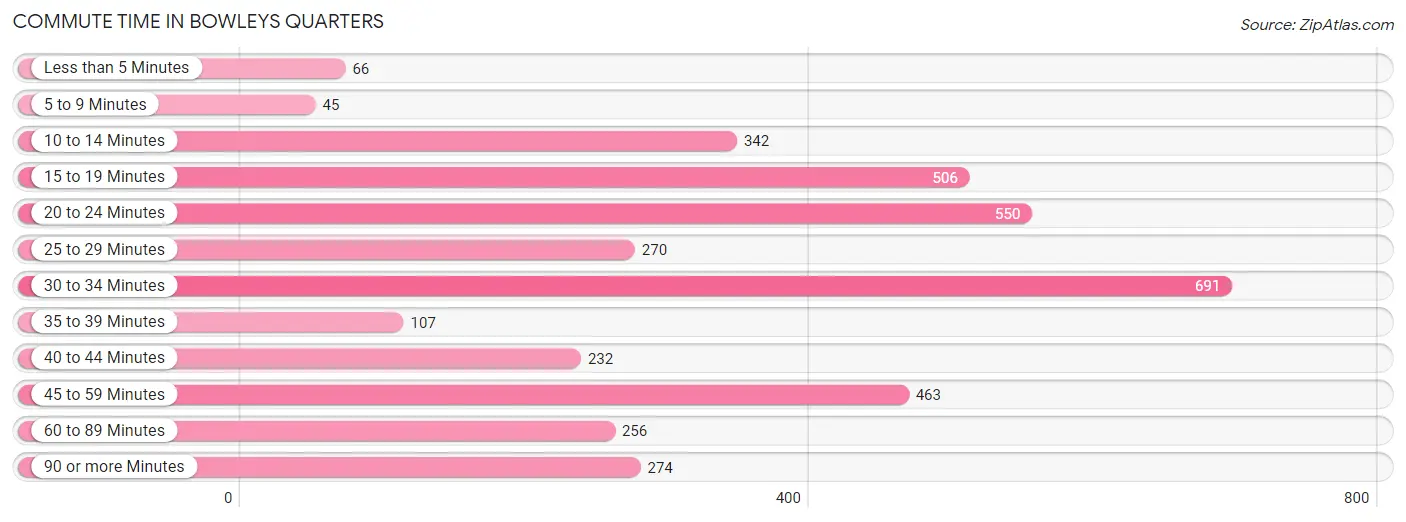
| Commute Time | # Commuters | % Commuters |
| Less than 5 Minutes | 66 | 1.7% |
| 5 to 9 Minutes | 45 | 1.2% |
| 10 to 14 Minutes | 342 | 9.0% |
| 15 to 19 Minutes | 506 | 13.3% |
| 20 to 24 Minutes | 550 | 14.5% |
| 25 to 29 Minutes | 270 | 7.1% |
| 30 to 34 Minutes | 691 | 18.2% |
| 35 to 39 Minutes | 107 | 2.8% |
| 40 to 44 Minutes | 232 | 6.1% |
| 45 to 59 Minutes | 463 | 12.2% |
| 60 to 89 Minutes | 256 | 6.7% |
| 90 or more Minutes | 274 | 7.2% |
Commute Time by Sex in Bowleys Quarters
The most common commute times in Bowleys Quarters are 20 to 24 minutes (286 commuters, 15.1%) for males and 30 to 34 minutes (426 commuters, 22.4%) for females.
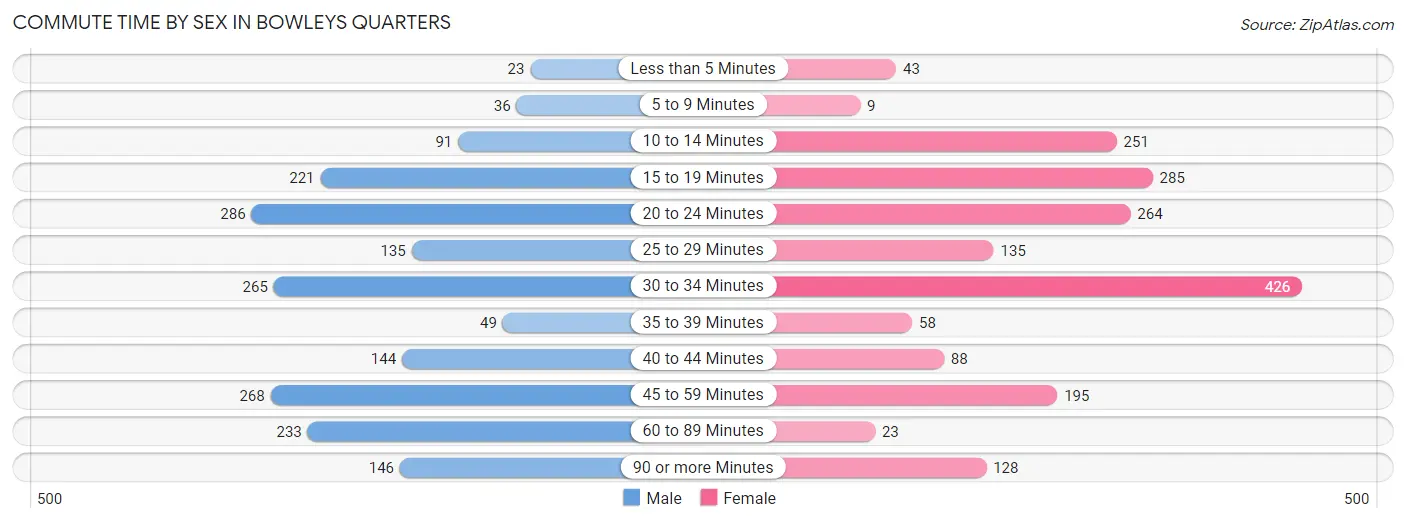
| Commute Time | Male | Female |
| Less than 5 Minutes | 23 (1.2%) | 43 (2.3%) |
| 5 to 9 Minutes | 36 (1.9%) | 9 (0.5%) |
| 10 to 14 Minutes | 91 (4.8%) | 251 (13.2%) |
| 15 to 19 Minutes | 221 (11.7%) | 285 (15.0%) |
| 20 to 24 Minutes | 286 (15.1%) | 264 (13.9%) |
| 25 to 29 Minutes | 135 (7.1%) | 135 (7.1%) |
| 30 to 34 Minutes | 265 (14.0%) | 426 (22.4%) |
| 35 to 39 Minutes | 49 (2.6%) | 58 (3.0%) |
| 40 to 44 Minutes | 144 (7.6%) | 88 (4.6%) |
| 45 to 59 Minutes | 268 (14.1%) | 195 (10.2%) |
| 60 to 89 Minutes | 233 (12.3%) | 23 (1.2%) |
| 90 or more Minutes | 146 (7.7%) | 128 (6.7%) |
Time of Departure to Work by Sex in Bowleys Quarters
The most frequent times of departure to work in Bowleys Quarters are 7:00 AM to 7:29 AM (260, 13.7%) for males and 8:30 AM to 8:59 AM (272, 14.3%) for females.
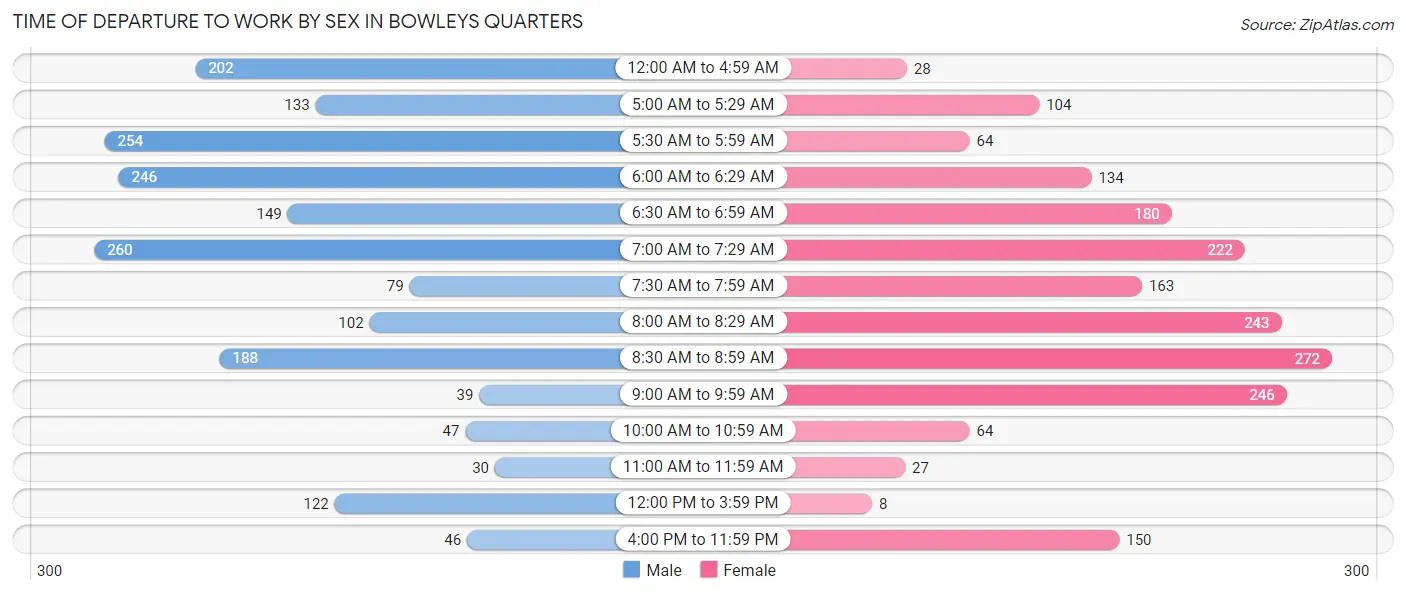
| Time of Departure | Male | Female |
| 12:00 AM to 4:59 AM | 202 (10.6%) | 28 (1.5%) |
| 5:00 AM to 5:29 AM | 133 (7.0%) | 104 (5.5%) |
| 5:30 AM to 5:59 AM | 254 (13.4%) | 64 (3.4%) |
| 6:00 AM to 6:29 AM | 246 (13.0%) | 134 (7.0%) |
| 6:30 AM to 6:59 AM | 149 (7.9%) | 180 (9.5%) |
| 7:00 AM to 7:29 AM | 260 (13.7%) | 222 (11.7%) |
| 7:30 AM to 7:59 AM | 79 (4.2%) | 163 (8.6%) |
| 8:00 AM to 8:29 AM | 102 (5.4%) | 243 (12.8%) |
| 8:30 AM to 8:59 AM | 188 (9.9%) | 272 (14.3%) |
| 9:00 AM to 9:59 AM | 39 (2.1%) | 246 (12.9%) |
| 10:00 AM to 10:59 AM | 47 (2.5%) | 64 (3.4%) |
| 11:00 AM to 11:59 AM | 30 (1.6%) | 27 (1.4%) |
| 12:00 PM to 3:59 PM | 122 (6.4%) | 8 (0.4%) |
| 4:00 PM to 11:59 PM | 46 (2.4%) | 150 (7.9%) |
| Total | 1,897 (100.0%) | 1,905 (100.0%) |
Housing Occupancy in Bowleys Quarters
Occupancy by Ownership in Bowleys Quarters
Of the total 2,548 dwellings in Bowleys Quarters, owner-occupied units account for 2,006 (78.7%), while renter-occupied units make up 542 (21.3%).
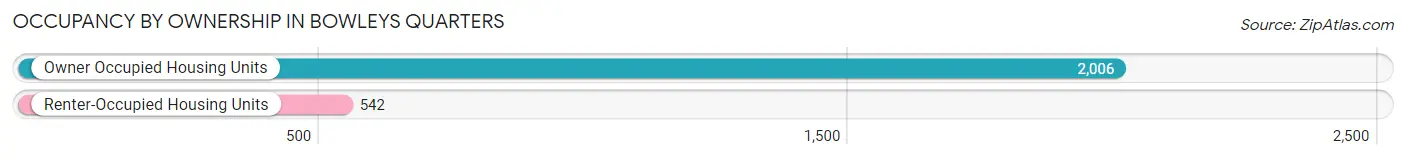
| Occupancy | # Housing Units | % Housing Units |
| Owner Occupied Housing Units | 2,006 | 78.7% |
| Renter-Occupied Housing Units | 542 | 21.3% |
| Total Occupied Housing Units | 2,548 | 100.0% |
Occupancy by Household Size in Bowleys Quarters
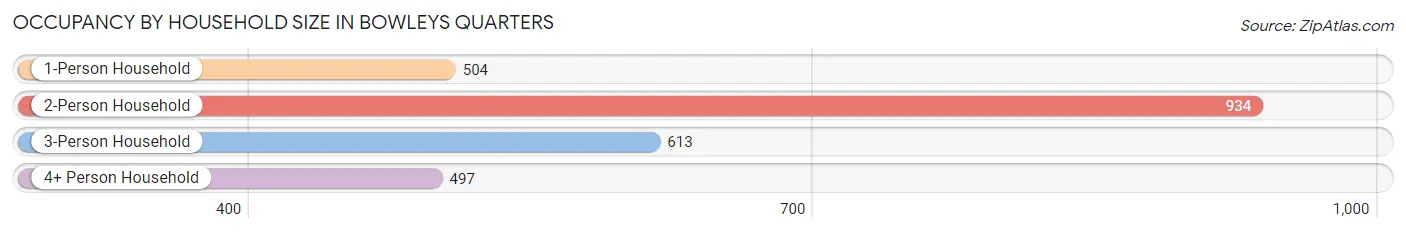
| Household Size | # Housing Units | % Housing Units |
| 1-Person Household | 504 | 19.8% |
| 2-Person Household | 934 | 36.7% |
| 3-Person Household | 613 | 24.1% |
| 4+ Person Household | 497 | 19.5% |
| Total Housing Units | 2,548 | 100.0% |
Occupancy by Ownership by Household Size in Bowleys Quarters
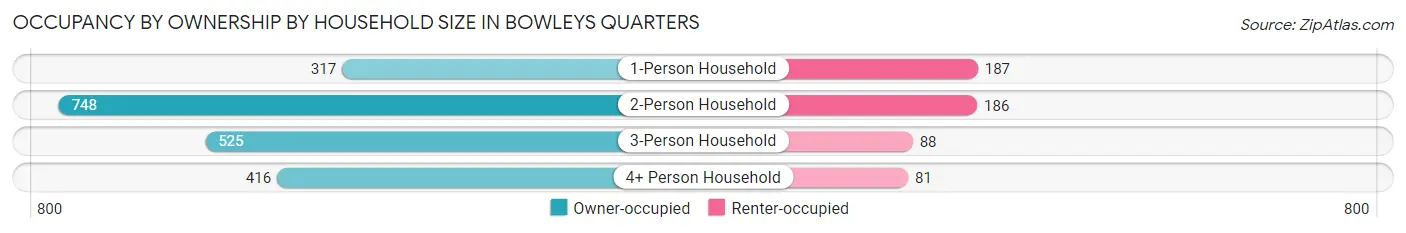
| Household Size | Owner-occupied | Renter-occupied |
| 1-Person Household | 317 (62.9%) | 187 (37.1%) |
| 2-Person Household | 748 (80.1%) | 186 (19.9%) |
| 3-Person Household | 525 (85.6%) | 88 (14.4%) |
| 4+ Person Household | 416 (83.7%) | 81 (16.3%) |
| Total Housing Units | 2,006 (78.7%) | 542 (21.3%) |
Occupancy by Educational Attainment in Bowleys Quarters
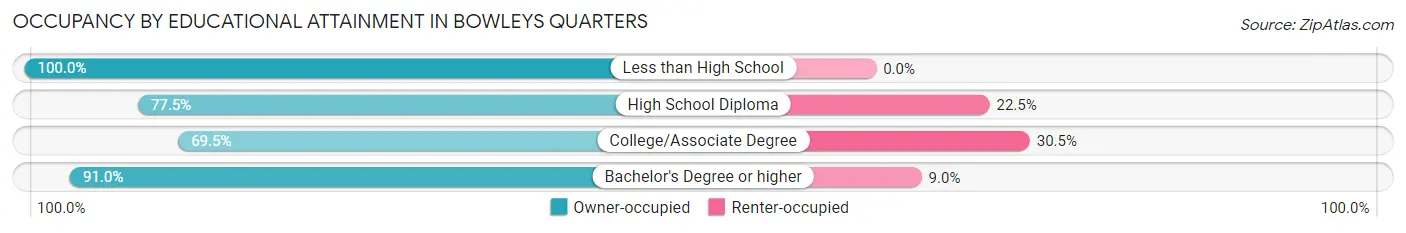
| Household Size | Owner-occupied | Renter-occupied |
| Less than High School | 80 (100.0%) | 0 (0.0%) |
| High School Diploma | 607 (77.5%) | 176 (22.5%) |
| College/Associate Degree | 694 (69.5%) | 304 (30.5%) |
| Bachelor's Degree or higher | 625 (91.0%) | 62 (9.0%) |
Occupancy by Age of Householder in Bowleys Quarters
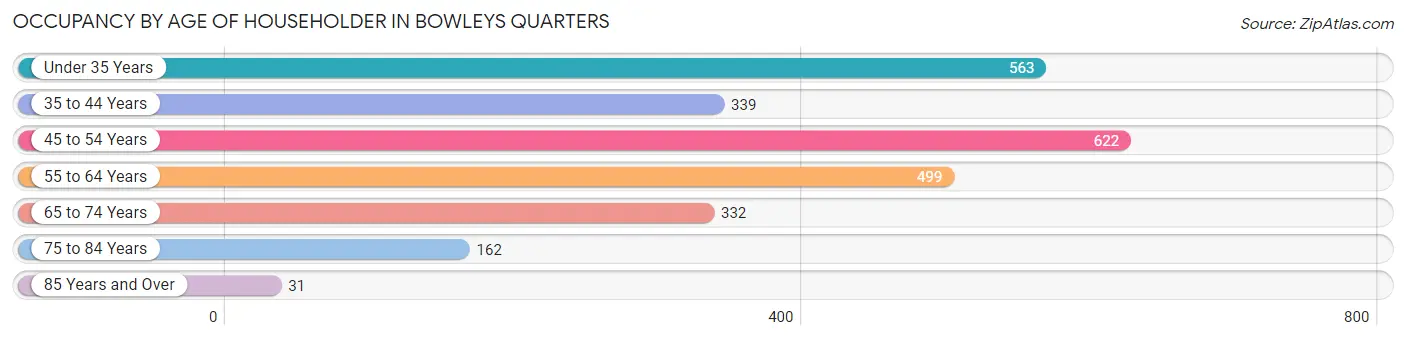
| Age Bracket | # Households | % Households |
| Under 35 Years | 563 | 22.1% |
| 35 to 44 Years | 339 | 13.3% |
| 45 to 54 Years | 622 | 24.4% |
| 55 to 64 Years | 499 | 19.6% |
| 65 to 74 Years | 332 | 13.0% |
| 75 to 84 Years | 162 | 6.4% |
| 85 Years and Over | 31 | 1.2% |
| Total | 2,548 | 100.0% |
Housing Finances in Bowleys Quarters
Median Income by Occupancy in Bowleys Quarters
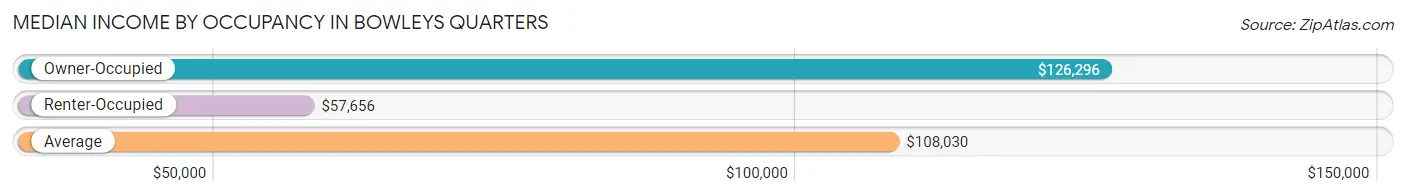
| Occupancy Type | # Households | Median Income |
| Owner-Occupied | 2,006 (78.7%) | $126,296 |
| Renter-Occupied | 542 (21.3%) | $57,656 |
| Average | 2,548 (100.0%) | $108,030 |
Occupancy by Householder Income Bracket in Bowleys Quarters
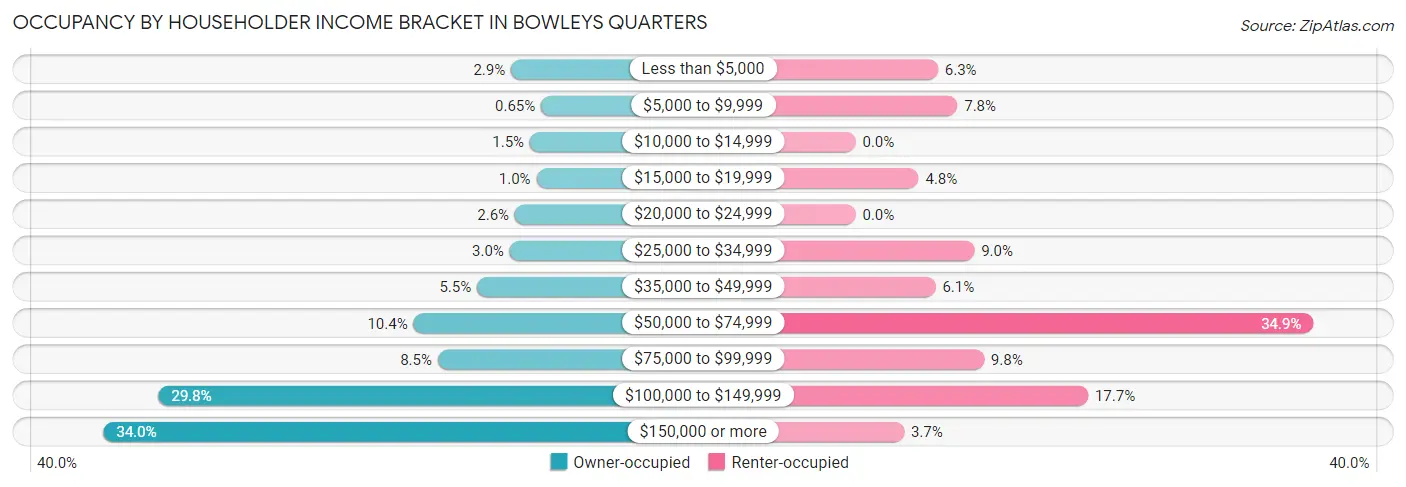
| Income Bracket | Owner-occupied | Renter-occupied |
| Less than $5,000 | 59 (2.9%) | 34 (6.3%) |
| $5,000 to $9,999 | 13 (0.6%) | 42 (7.7%) |
| $10,000 to $14,999 | 30 (1.5%) | 0 (0.0%) |
| $15,000 to $19,999 | 20 (1.0%) | 26 (4.8%) |
| $20,000 to $24,999 | 53 (2.6%) | 0 (0.0%) |
| $25,000 to $34,999 | 61 (3.0%) | 49 (9.0%) |
| $35,000 to $49,999 | 111 (5.5%) | 33 (6.1%) |
| $50,000 to $74,999 | 208 (10.4%) | 189 (34.9%) |
| $75,000 to $99,999 | 171 (8.5%) | 53 (9.8%) |
| $100,000 to $149,999 | 598 (29.8%) | 96 (17.7%) |
| $150,000 or more | 682 (34.0%) | 20 (3.7%) |
| Total | 2,006 (100.0%) | 542 (100.0%) |
Monthly Housing Cost Tiers in Bowleys Quarters
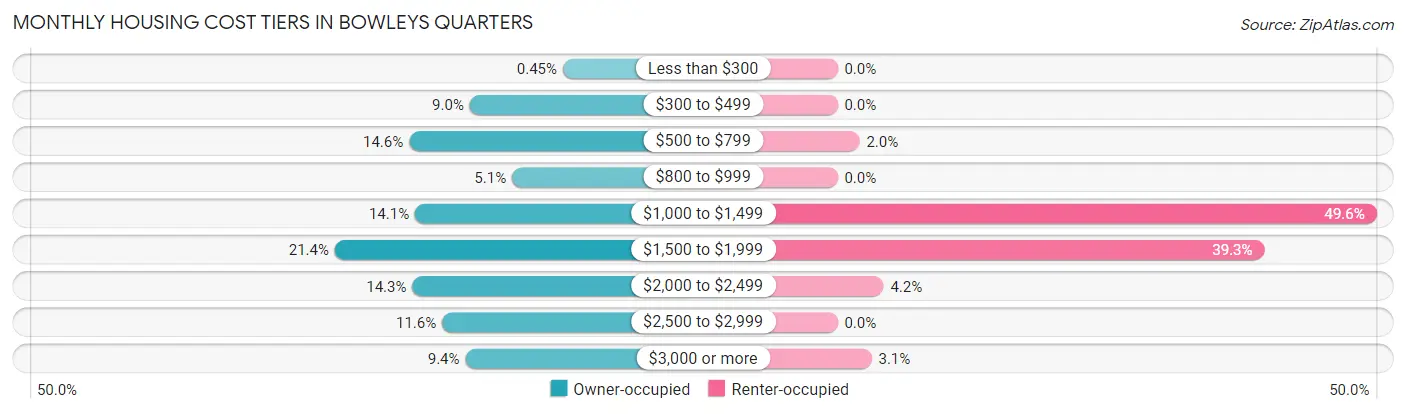
| Monthly Cost | Owner-occupied | Renter-occupied |
| Less than $300 | 9 (0.4%) | 0 (0.0%) |
| $300 to $499 | 181 (9.0%) | 0 (0.0%) |
| $500 to $799 | 293 (14.6%) | 11 (2.0%) |
| $800 to $999 | 103 (5.1%) | 0 (0.0%) |
| $1,000 to $1,499 | 282 (14.1%) | 269 (49.6%) |
| $1,500 to $1,999 | 430 (21.4%) | 213 (39.3%) |
| $2,000 to $2,499 | 287 (14.3%) | 23 (4.2%) |
| $2,500 to $2,999 | 232 (11.6%) | 0 (0.0%) |
| $3,000 or more | 189 (9.4%) | 17 (3.1%) |
| Total | 2,006 (100.0%) | 542 (100.0%) |
Physical Housing Characteristics in Bowleys Quarters
Housing Structures in Bowleys Quarters
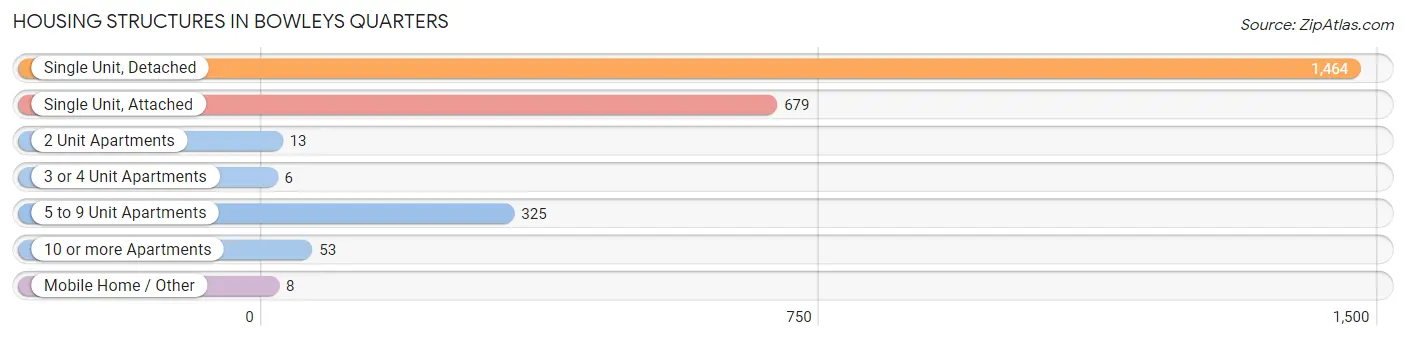
| Structure Type | # Housing Units | % Housing Units |
| Single Unit, Detached | 1,464 | 57.5% |
| Single Unit, Attached | 679 | 26.7% |
| 2 Unit Apartments | 13 | 0.5% |
| 3 or 4 Unit Apartments | 6 | 0.2% |
| 5 to 9 Unit Apartments | 325 | 12.8% |
| 10 or more Apartments | 53 | 2.1% |
| Mobile Home / Other | 8 | 0.3% |
| Total | 2,548 | 100.0% |
Housing Structures by Occupancy in Bowleys Quarters
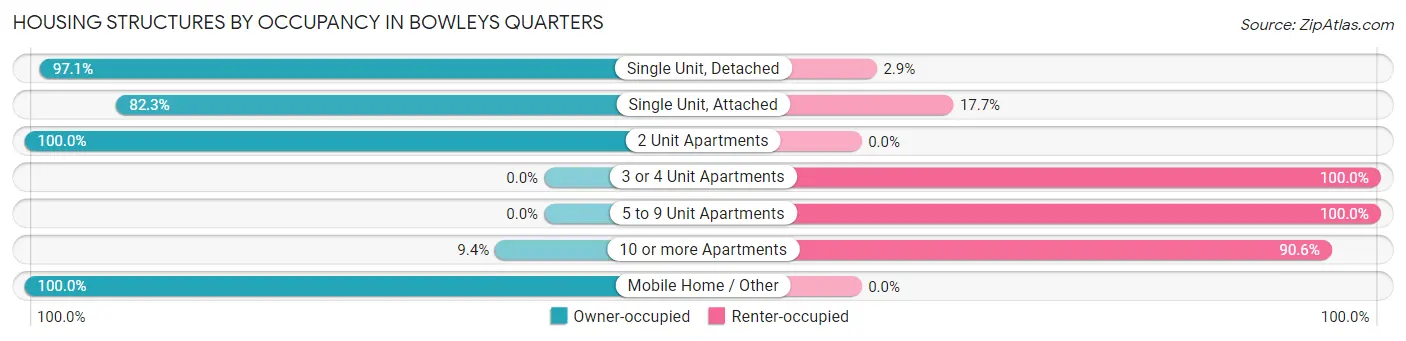
| Structure Type | Owner-occupied | Renter-occupied |
| Single Unit, Detached | 1,421 (97.1%) | 43 (2.9%) |
| Single Unit, Attached | 559 (82.3%) | 120 (17.7%) |
| 2 Unit Apartments | 13 (100.0%) | 0 (0.0%) |
| 3 or 4 Unit Apartments | 0 (0.0%) | 6 (100.0%) |
| 5 to 9 Unit Apartments | 0 (0.0%) | 325 (100.0%) |
| 10 or more Apartments | 5 (9.4%) | 48 (90.6%) |
| Mobile Home / Other | 8 (100.0%) | 0 (0.0%) |
| Total | 2,006 (78.7%) | 542 (21.3%) |
Housing Structures by Number of Rooms in Bowleys Quarters
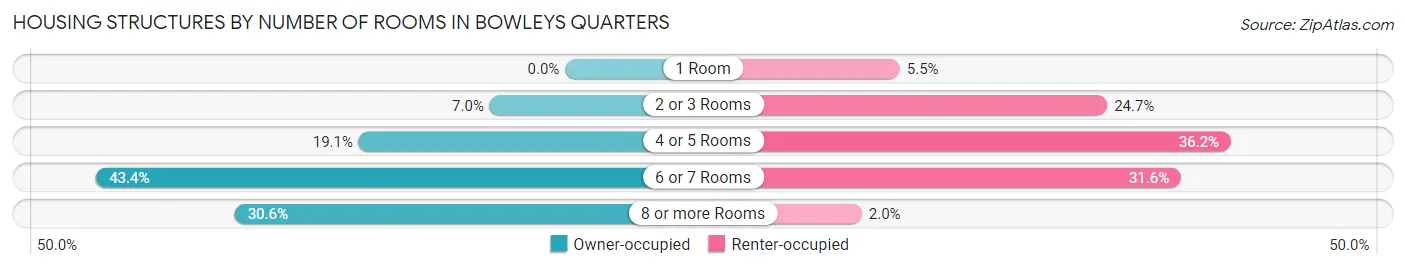
| Number of Rooms | Owner-occupied | Renter-occupied |
| 1 Room | 0 (0.0%) | 30 (5.5%) |
| 2 or 3 Rooms | 140 (7.0%) | 134 (24.7%) |
| 4 or 5 Rooms | 383 (19.1%) | 196 (36.2%) |
| 6 or 7 Rooms | 870 (43.4%) | 171 (31.6%) |
| 8 or more Rooms | 613 (30.6%) | 11 (2.0%) |
| Total | 2,006 (100.0%) | 542 (100.0%) |
Housing Structure by Heating Type in Bowleys Quarters
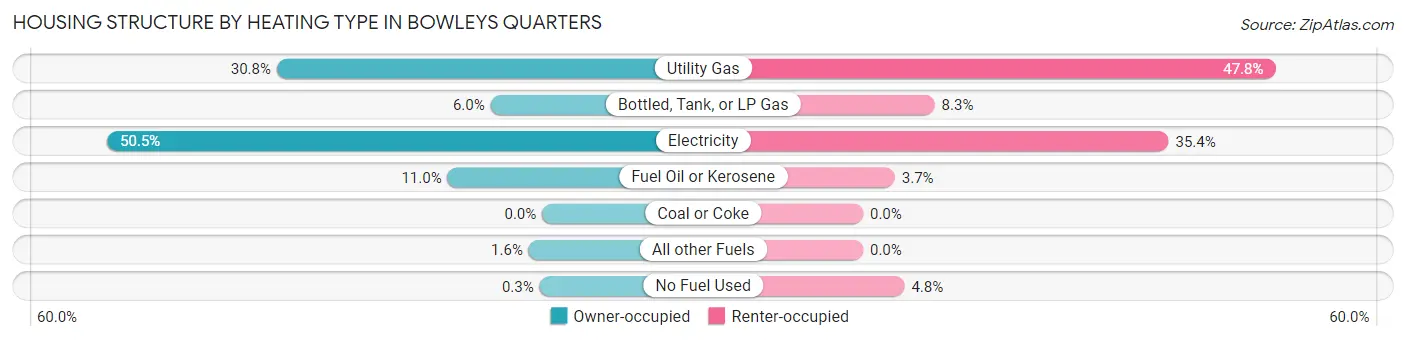
| Heating Type | Owner-occupied | Renter-occupied |
| Utility Gas | 617 (30.8%) | 259 (47.8%) |
| Bottled, Tank, or LP Gas | 120 (6.0%) | 45 (8.3%) |
| Electricity | 1,012 (50.4%) | 192 (35.4%) |
| Fuel Oil or Kerosene | 220 (11.0%) | 20 (3.7%) |
| Coal or Coke | 0 (0.0%) | 0 (0.0%) |
| All other Fuels | 31 (1.5%) | 0 (0.0%) |
| No Fuel Used | 6 (0.3%) | 26 (4.8%) |
| Total | 2,006 (100.0%) | 542 (100.0%) |
Household Vehicle Usage in Bowleys Quarters
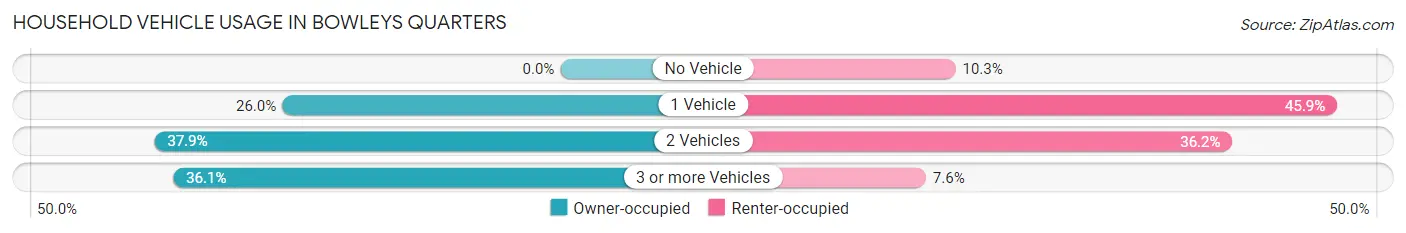
| Vehicles per Household | Owner-occupied | Renter-occupied |
| No Vehicle | 0 (0.0%) | 56 (10.3%) |
| 1 Vehicle | 521 (26.0%) | 249 (45.9%) |
| 2 Vehicles | 760 (37.9%) | 196 (36.2%) |
| 3 or more Vehicles | 725 (36.1%) | 41 (7.6%) |
| Total | 2,006 (100.0%) | 542 (100.0%) |
Real Estate & Mortgages in Bowleys Quarters
Real Estate and Mortgage Overview in Bowleys Quarters
| Characteristic | Without Mortgage | With Mortgage |
| Housing Units | 655 | 1,351 |
| Median Property Value | $325,000 | $326,200 |
| Median Household Income | $77,279 | $586 |
| Monthly Housing Costs | $636 | $189 |
| Real Estate Taxes | $4,183 | $75 |
Property Value by Mortgage Status in Bowleys Quarters
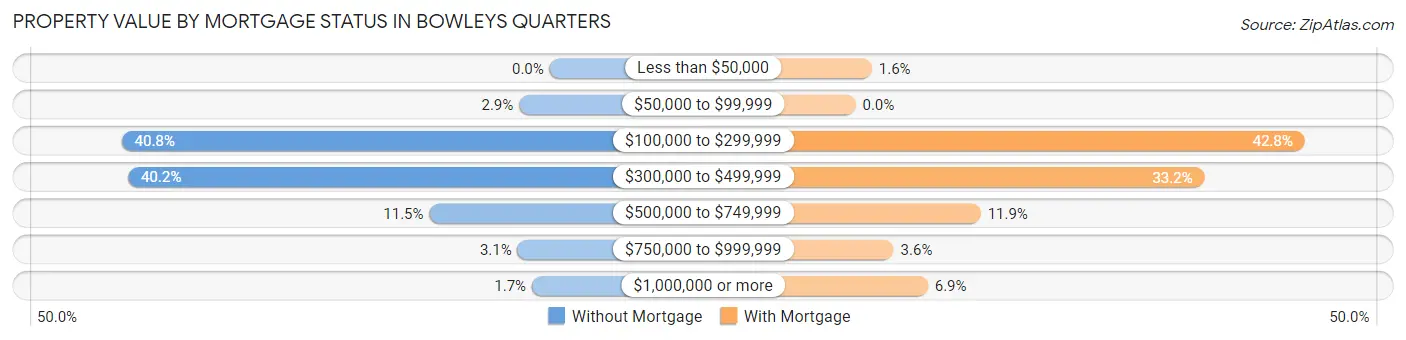
| Property Value | Without Mortgage | With Mortgage |
| Less than $50,000 | 0 (0.0%) | 21 (1.5%) |
| $50,000 to $99,999 | 19 (2.9%) | 0 (0.0%) |
| $100,000 to $299,999 | 267 (40.8%) | 578 (42.8%) |
| $300,000 to $499,999 | 263 (40.2%) | 449 (33.2%) |
| $500,000 to $749,999 | 75 (11.5%) | 161 (11.9%) |
| $750,000 to $999,999 | 20 (3.0%) | 49 (3.6%) |
| $1,000,000 or more | 11 (1.7%) | 93 (6.9%) |
| Total | 655 (100.0%) | 1,351 (100.0%) |
Household Income by Mortgage Status in Bowleys Quarters
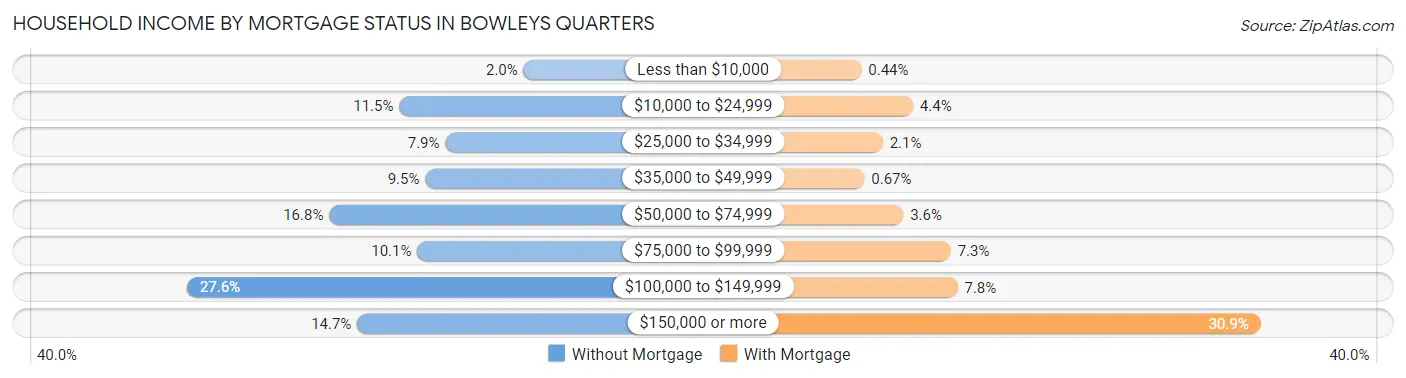
| Household Income | Without Mortgage | With Mortgage |
| Less than $10,000 | 13 (2.0%) | 6 (0.4%) |
| $10,000 to $24,999 | 75 (11.5%) | 59 (4.4%) |
| $25,000 to $34,999 | 52 (7.9%) | 28 (2.1%) |
| $35,000 to $49,999 | 62 (9.5%) | 9 (0.7%) |
| $50,000 to $74,999 | 110 (16.8%) | 49 (3.6%) |
| $75,000 to $99,999 | 66 (10.1%) | 98 (7.2%) |
| $100,000 to $149,999 | 181 (27.6%) | 105 (7.8%) |
| $150,000 or more | 96 (14.7%) | 417 (30.9%) |
| Total | 655 (100.0%) | 1,351 (100.0%) |
Property Value to Household Income Ratio in Bowleys Quarters
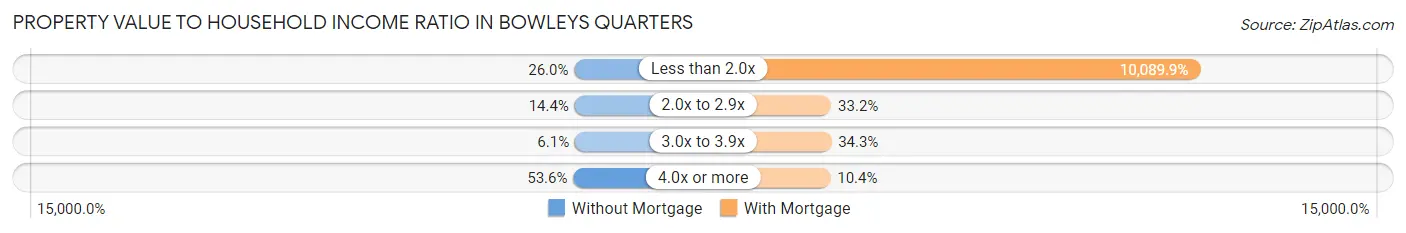
| Value-to-Income Ratio | Without Mortgage | With Mortgage |
| Less than 2.0x | 170 (26.0%) | 136,314 (10,089.9%) |
| 2.0x to 2.9x | 94 (14.3%) | 448 (33.2%) |
| 3.0x to 3.9x | 40 (6.1%) | 463 (34.3%) |
| 4.0x or more | 351 (53.6%) | 140 (10.4%) |
| Total | 655 (100.0%) | 1,351 (100.0%) |
Real Estate Taxes by Mortgage Status in Bowleys Quarters
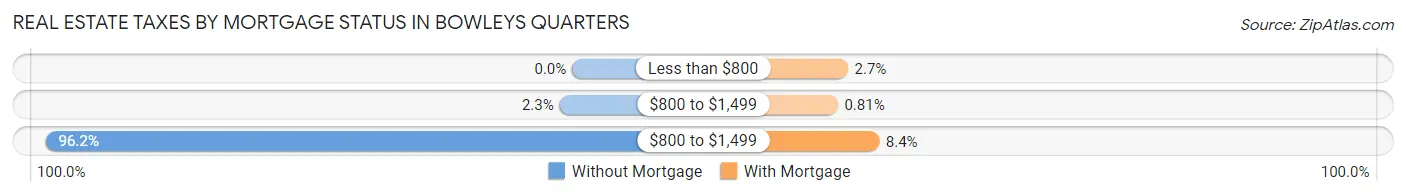
| Property Taxes | Without Mortgage | With Mortgage |
| Less than $800 | 0 (0.0%) | 36 (2.7%) |
| $800 to $1,499 | 15 (2.3%) | 11 (0.8%) |
| $800 to $1,499 | 630 (96.2%) | 113 (8.4%) |
| Total | 655 (100.0%) | 1,351 (100.0%) |
Health & Disability in Bowleys Quarters
Health Insurance Coverage by Age in Bowleys Quarters
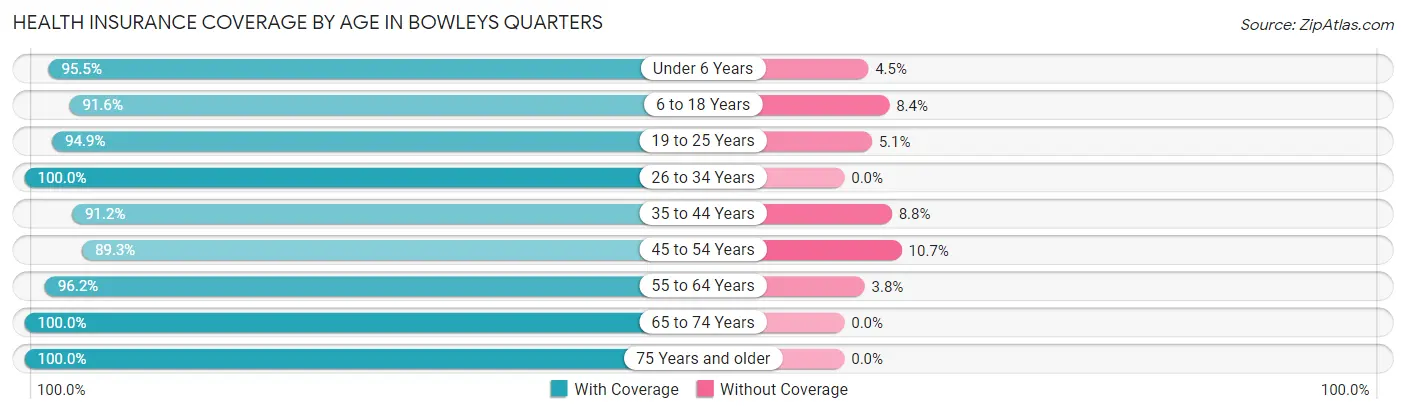
| Age Bracket | With Coverage | Without Coverage |
| Under 6 Years | 386 (95.5%) | 18 (4.5%) |
| 6 to 18 Years | 1,006 (91.6%) | 92 (8.4%) |
| 19 to 25 Years | 445 (94.9%) | 24 (5.1%) |
| 26 to 34 Years | 839 (100.0%) | 0 (0.0%) |
| 35 to 44 Years | 794 (91.2%) | 77 (8.8%) |
| 45 to 54 Years | 1,026 (89.3%) | 123 (10.7%) |
| 55 to 64 Years | 1,042 (96.2%) | 41 (3.8%) |
| 65 to 74 Years | 491 (100.0%) | 0 (0.0%) |
| 75 Years and older | 331 (100.0%) | 0 (0.0%) |
| Total | 6,360 (94.4%) | 375 (5.6%) |
Health Insurance Coverage by Citizenship Status in Bowleys Quarters
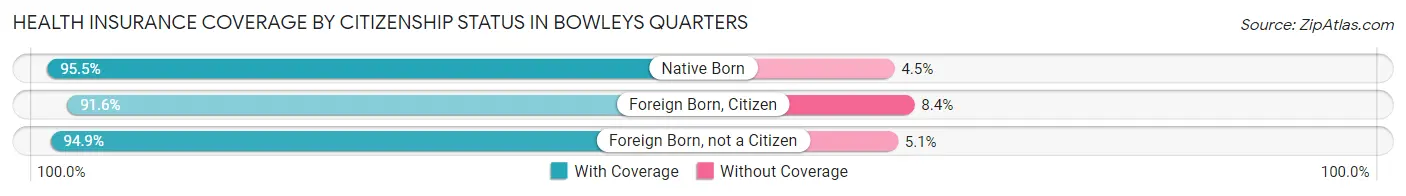
| Citizenship Status | With Coverage | Without Coverage |
| Native Born | 386 (95.5%) | 18 (4.5%) |
| Foreign Born, Citizen | 1,006 (91.6%) | 92 (8.4%) |
| Foreign Born, not a Citizen | 445 (94.9%) | 24 (5.1%) |
Health Insurance Coverage by Household Income in Bowleys Quarters
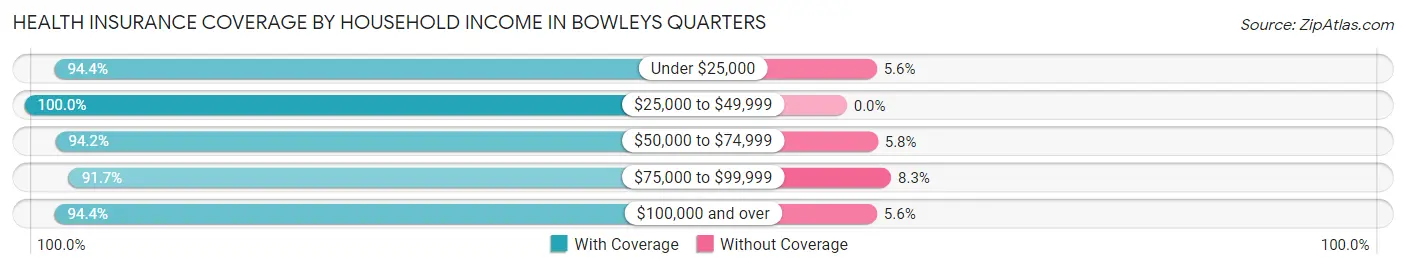
| Household Income | With Coverage | Without Coverage |
| Under $25,000 | 606 (94.4%) | 36 (5.6%) |
| $25,000 to $49,999 | 373 (100.0%) | 0 (0.0%) |
| $50,000 to $74,999 | 778 (94.2%) | 48 (5.8%) |
| $75,000 to $99,999 | 519 (91.7%) | 47 (8.3%) |
| $100,000 and over | 4,084 (94.4%) | 244 (5.6%) |
Public vs Private Health Insurance Coverage by Age in Bowleys Quarters
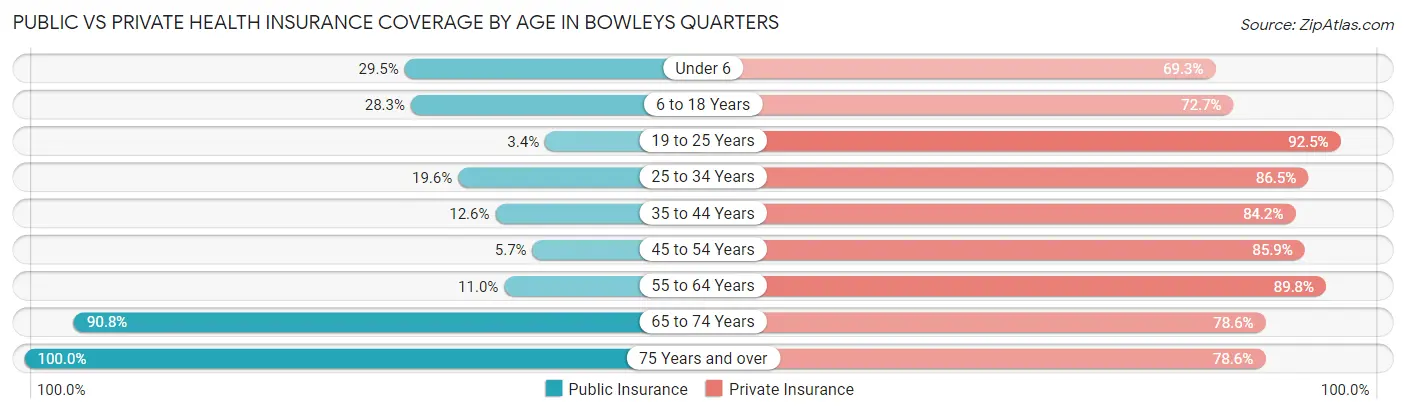
| Age Bracket | Public Insurance | Private Insurance |
| Under 6 | 119 (29.5%) | 280 (69.3%) |
| 6 to 18 Years | 311 (28.3%) | 798 (72.7%) |
| 19 to 25 Years | 16 (3.4%) | 434 (92.5%) |
| 25 to 34 Years | 164 (19.6%) | 726 (86.5%) |
| 35 to 44 Years | 110 (12.6%) | 733 (84.2%) |
| 45 to 54 Years | 66 (5.7%) | 987 (85.9%) |
| 55 to 64 Years | 119 (11.0%) | 973 (89.8%) |
| 65 to 74 Years | 446 (90.8%) | 386 (78.6%) |
| 75 Years and over | 331 (100.0%) | 260 (78.5%) |
| Total | 1,682 (25.0%) | 5,577 (82.8%) |
Disability Status by Sex by Age in Bowleys Quarters
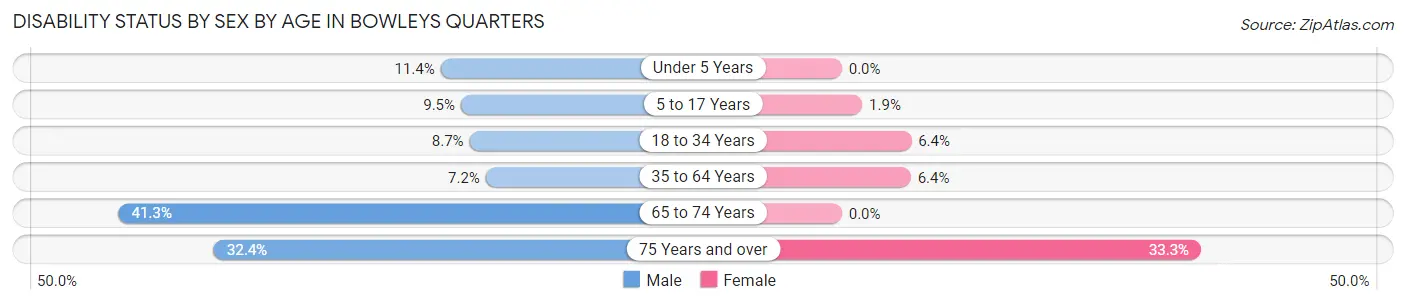
| Age Bracket | Male | Female |
| Under 5 Years | 26 (11.4%) | 0 (0.0%) |
| 5 to 17 Years | 47 (9.5%) | 10 (1.9%) |
| 18 to 34 Years | 58 (8.7%) | 52 (6.4%) |
| 35 to 64 Years | 111 (7.2%) | 100 (6.4%) |
| 65 to 74 Years | 116 (41.3%) | 0 (0.0%) |
| 75 Years and over | 48 (32.4%) | 61 (33.3%) |
Disability Class by Sex by Age in Bowleys Quarters
Disability Class: Hearing Difficulty
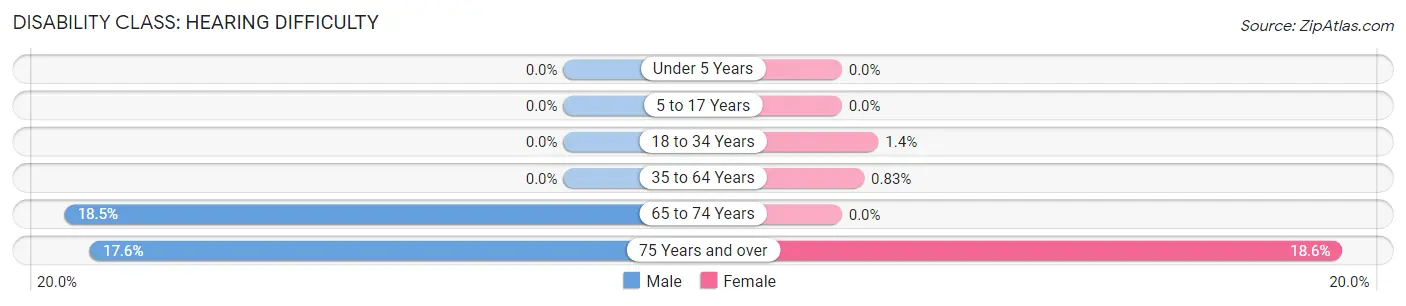
| Age Bracket | Male | Female |
| Under 5 Years | 0 (0.0%) | 0 (0.0%) |
| 5 to 17 Years | 0 (0.0%) | 0 (0.0%) |
| 18 to 34 Years | 0 (0.0%) | 11 (1.4%) |
| 35 to 64 Years | 0 (0.0%) | 13 (0.8%) |
| 65 to 74 Years | 52 (18.5%) | 0 (0.0%) |
| 75 Years and over | 26 (17.6%) | 34 (18.6%) |
Disability Class: Vision Difficulty
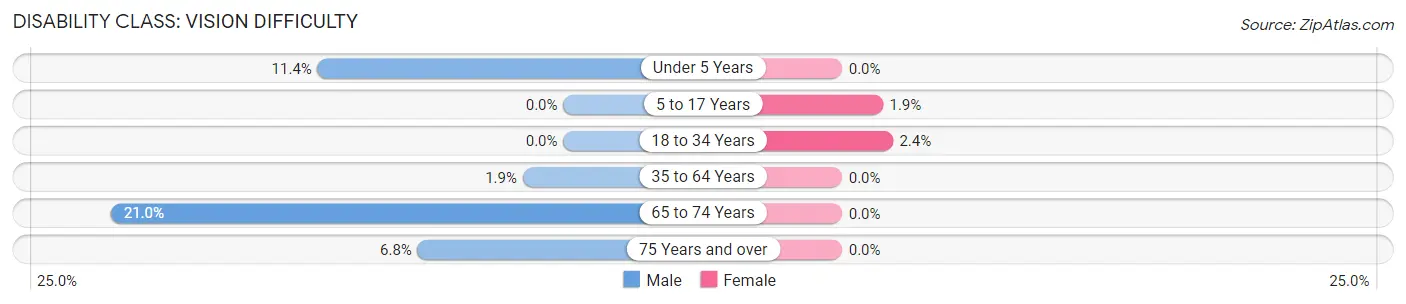
| Age Bracket | Male | Female |
| Under 5 Years | 26 (11.4%) | 0 (0.0%) |
| 5 to 17 Years | 0 (0.0%) | 10 (1.9%) |
| 18 to 34 Years | 0 (0.0%) | 19 (2.4%) |
| 35 to 64 Years | 29 (1.9%) | 0 (0.0%) |
| 65 to 74 Years | 59 (21.0%) | 0 (0.0%) |
| 75 Years and over | 10 (6.8%) | 0 (0.0%) |
Disability Class: Cognitive Difficulty
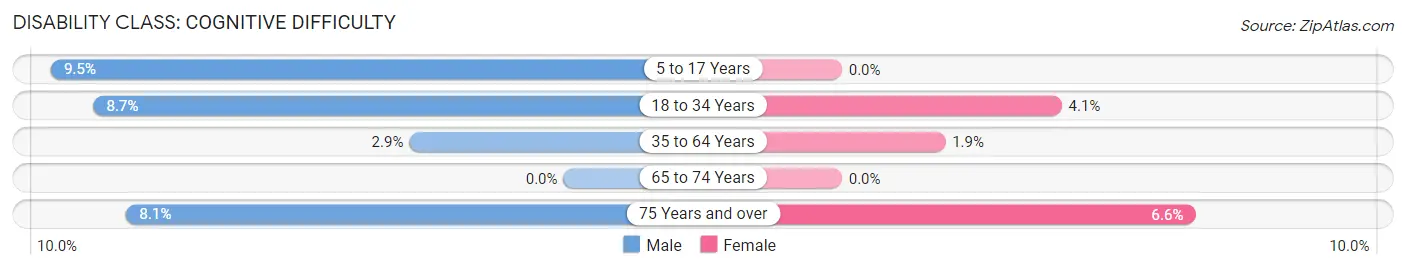
| Age Bracket | Male | Female |
| 5 to 17 Years | 47 (9.5%) | 0 (0.0%) |
| 18 to 34 Years | 58 (8.7%) | 33 (4.1%) |
| 35 to 64 Years | 44 (2.9%) | 30 (1.9%) |
| 65 to 74 Years | 0 (0.0%) | 0 (0.0%) |
| 75 Years and over | 12 (8.1%) | 12 (6.6%) |
Disability Class: Ambulatory Difficulty
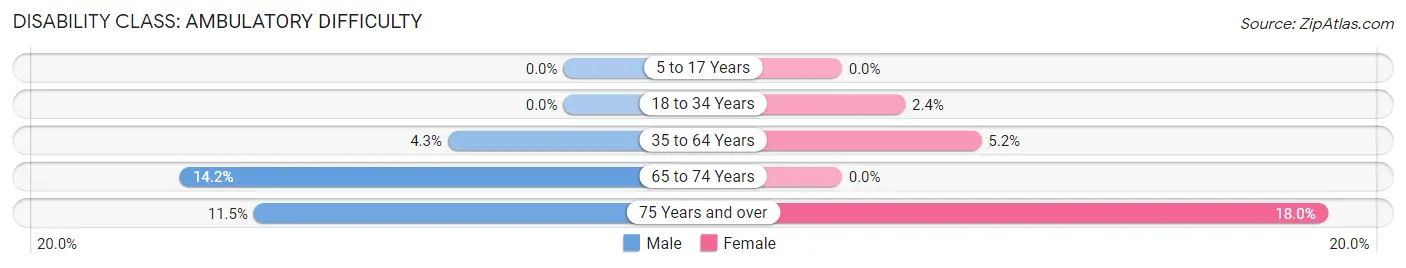
| Age Bracket | Male | Female |
| 5 to 17 Years | 0 (0.0%) | 0 (0.0%) |
| 18 to 34 Years | 0 (0.0%) | 19 (2.4%) |
| 35 to 64 Years | 66 (4.3%) | 81 (5.2%) |
| 65 to 74 Years | 40 (14.2%) | 0 (0.0%) |
| 75 Years and over | 17 (11.5%) | 33 (18.0%) |
Disability Class: Self-Care Difficulty
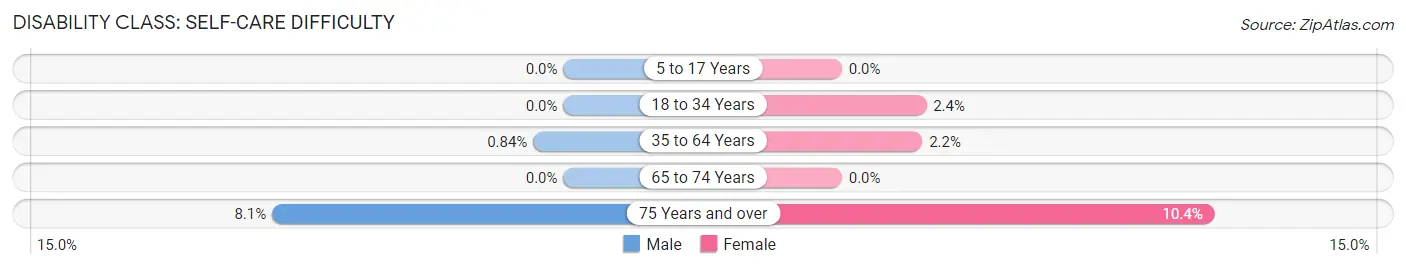
| Age Bracket | Male | Female |
| 5 to 17 Years | 0 (0.0%) | 0 (0.0%) |
| 18 to 34 Years | 0 (0.0%) | 19 (2.4%) |
| 35 to 64 Years | 13 (0.8%) | 35 (2.2%) |
| 65 to 74 Years | 0 (0.0%) | 0 (0.0%) |
| 75 Years and over | 12 (8.1%) | 19 (10.4%) |
Technology Access in Bowleys Quarters
Computing Device Access in Bowleys Quarters
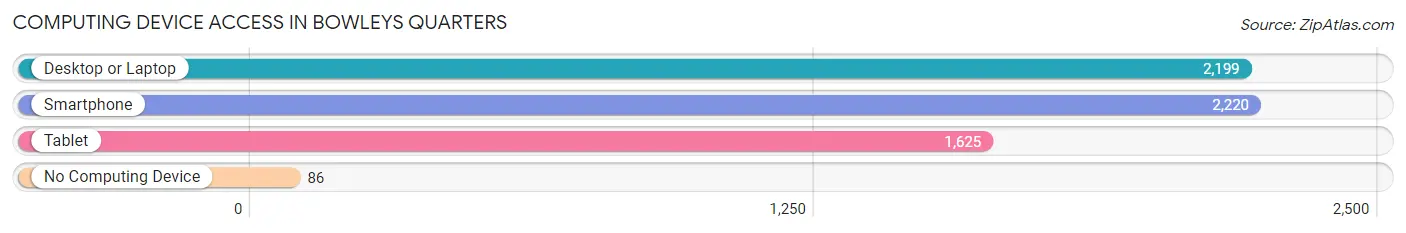
| Device Type | # Households | % Households |
| Desktop or Laptop | 2,199 | 86.3% |
| Smartphone | 2,220 | 87.1% |
| Tablet | 1,625 | 63.8% |
| No Computing Device | 86 | 3.4% |
| Total | 2,548 | 100.0% |
Internet Access in Bowleys Quarters
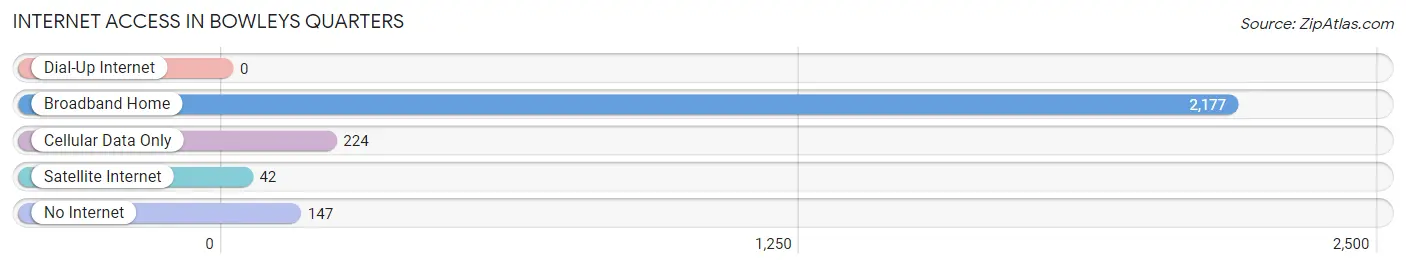
| Internet Type | # Households | % Households |
| Dial-Up Internet | 0 | 0.0% |
| Broadband Home | 2,177 | 85.4% |
| Cellular Data Only | 224 | 8.8% |
| Satellite Internet | 42 | 1.7% |
| No Internet | 147 | 5.8% |
| Total | 2,548 | 100.0% |
Bowleys Quarters Summary
History
Bowleys Quarters is an unincorporated community located in Baltimore County, Maryland. It is situated on the eastern shore of the Chesapeake Bay, approximately 15 miles east of downtown Baltimore. The community was first settled in the early 1700s by the Bowley family, who were among the first settlers in the area. The community was named after the family and has remained largely unchanged since its founding.
The area was primarily used for farming and fishing until the early 1900s, when the Chesapeake Bay Bridge was built. This allowed for easier access to Baltimore and other cities, and the area began to develop. In the 1950s, the area was developed into a residential community, with many of the original homes still standing today.
Geography
Bowleys Quarters is located in Baltimore County, Maryland, on the eastern shore of the Chesapeake Bay. It is approximately 15 miles east of downtown Baltimore. The community is bordered by Middle River to the north, Bear Creek to the east, and the Chesapeake Bay to the south and west. The area is mostly flat, with some rolling hills. The climate is humid subtropical, with hot, humid summers and mild winters.
Economy
The economy of Bowleys Quarters is largely based on tourism and recreation. The area is home to several marinas, boat ramps, and fishing piers, which attract visitors from all over the region. There are also several restaurants and bars in the area, as well as a few small shops. The area is also home to a few small businesses, such as boat repair shops and landscaping companies.
Demographics
As of the 2010 census, the population of Bowleys Quarters was 4,845. The population is mostly white (90.3%), with a small percentage of African Americans (7.2%) and other races (2.5%). The median household income is $63,917, and the median home value is $279,000. The area is mostly made up of families, with the majority of households (63.3%) being married couples.
Conclusion
Bowleys Quarters is an unincorporated community located in Baltimore County, Maryland. It is situated on the eastern shore of the Chesapeake Bay, approximately 15 miles east of downtown Baltimore. The area was first settled in the early 1700s by the Bowley family, and has remained largely unchanged since its founding. The economy of Bowleys Quarters is largely based on tourism and recreation, with several marinas, boat ramps, and fishing piers in the area. The population of Bowleys Quarters is mostly white (90.3%), with a small percentage of African Americans (7.2%) and other races (2.5%). The median household income is $63,917, and the median home value is $279,000.
Common Questions
What is Per Capita Income in Bowleys Quarters?
Per Capita income in Bowleys Quarters is $51,997.
What is the Median Family Income in Bowleys Quarters?
Median Family Income in Bowleys Quarters is $126,375.
What is the Median Household income in Bowleys Quarters?
Median Household Income in Bowleys Quarters is $108,030.
What is Income or Wage Gap in Bowleys Quarters?
Income or Wage Gap in Bowleys Quarters is 15.5%.
Women in Bowleys Quarters earn 84.5 cents for every dollar earned by a man.
What is Inequality or Gini Index in Bowleys Quarters?
Inequality or Gini Index in Bowleys Quarters is 0.42.
What is the Total Population of Bowleys Quarters?
Total Population of Bowleys Quarters is 6,746.
What is the Total Male Population of Bowleys Quarters?
Total Male Population of Bowleys Quarters is 3,356.
What is the Total Female Population of Bowleys Quarters?
Total Female Population of Bowleys Quarters is 3,390.
What is the Ratio of Males per 100 Females in Bowleys Quarters?
There are 99.00 Males per 100 Females in Bowleys Quarters.
What is the Ratio of Females per 100 Males in Bowleys Quarters?
There are 101.01 Females per 100 Males in Bowleys Quarters.
What is the Median Population Age in Bowleys Quarters?
Median Population Age in Bowleys Quarters is 40.4 Years.
What is the Average Family Size in Bowleys Quarters
Average Family Size in Bowleys Quarters is 3.0 People.
What is the Average Household Size in Bowleys Quarters
Average Household Size in Bowleys Quarters is 2.6 People.
How Large is the Labor Force in Bowleys Quarters?
There are 4,258 People in the Labor Forcein in Bowleys Quarters.
What is the Percentage of People in the Labor Force in Bowleys Quarters?
76.3% of People are in the Labor Force in Bowleys Quarters.
What is the Unemployment Rate in Bowleys Quarters?
Unemployment Rate in Bowleys Quarters is 2.2%.