Eagle Harbor, MD Map & Demographics
Eagle Harbor Map
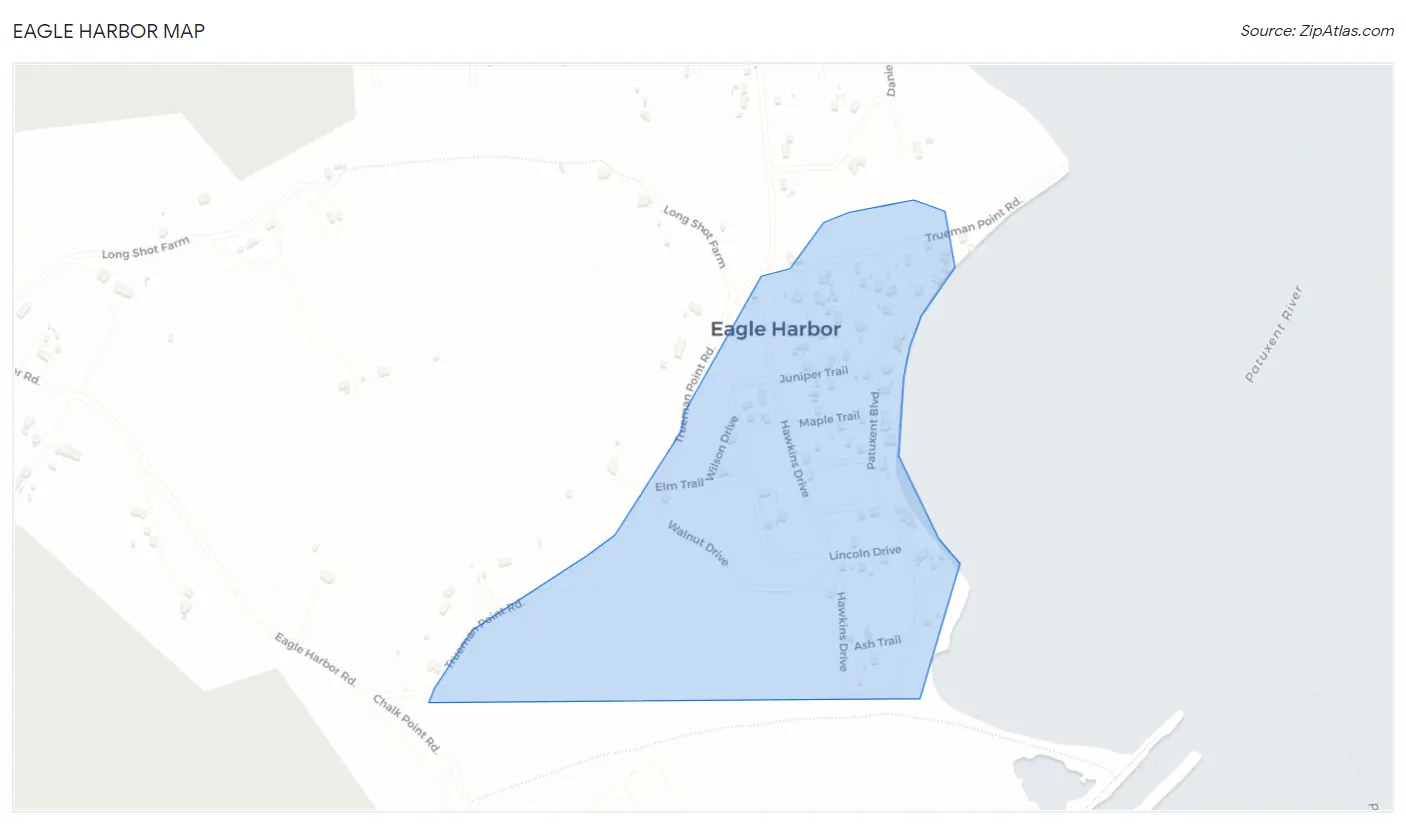
Eagle Harbor Overview
$60,986
PER CAPITA INCOME
$71,667
AVG FAMILY INCOME
$75,938
AVG HOUSEHOLD INCOME
7.6%
WAGE / INCOME GAP [ % ]
92.4¢/ $1
WAGE / INCOME GAP [ $ ]
0.16
INEQUALITY / GINI INDEX
42
TOTAL POPULATION
9
MALE POPULATION
33
FEMALE POPULATION
27.27
MALES / 100 FEMALES
366.67
FEMALES / 100 MALES
62.5
MEDIAN AGE
2.0
AVG FAMILY SIZE
1.2
AVG HOUSEHOLD SIZE
32
LABOR FORCE [ PEOPLE ]
82.1%
PERCENT IN LABOR FORCE
Eagle Harbor Area Codes
Income in Eagle Harbor
Income Overview in Eagle Harbor
Per Capita Income in Eagle Harbor is $60,986, while median incomes of families and households are $71,667 and $75,938 respectively.
| Characteristic | Number | Measure |
| Per Capita Income | 42 | $60,986 |
| Median Family Income | 6 | $71,667 |
| Mean Family Income | 6 | $93,583 |
| Median Household Income | 36 | $75,938 |
| Mean Household Income | 36 | $71,150 |
| Income Deficit | 6 | $0 |
| Wage / Income Gap (%) | 42 | 7.65% |
| Wage / Income Gap ($) | 42 | 92.35¢ per $1 |
| Gini / Inequality Index | 42 | 0.16 |
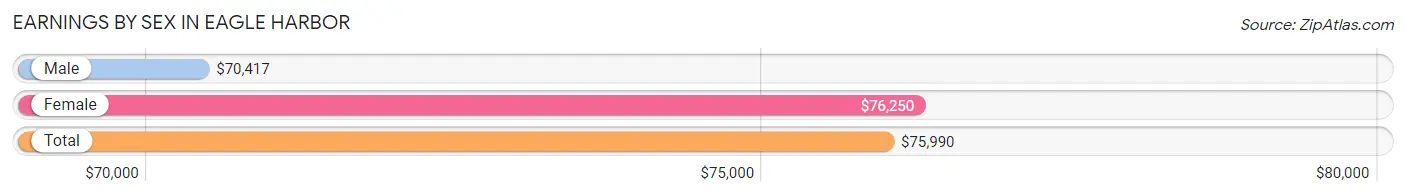
Earnings by Sex in Eagle Harbor
Average Earnings in Eagle Harbor are $75,990, $70,417 for men and $76,250 for women, a difference of 7.6%.
| Sex | Number | Average Earnings |
| Male | 5 (15.1%) | $70,417 |
| Female | 28 (84.9%) | $76,250 |
| Total | 33 (100.0%) | $75,990 |
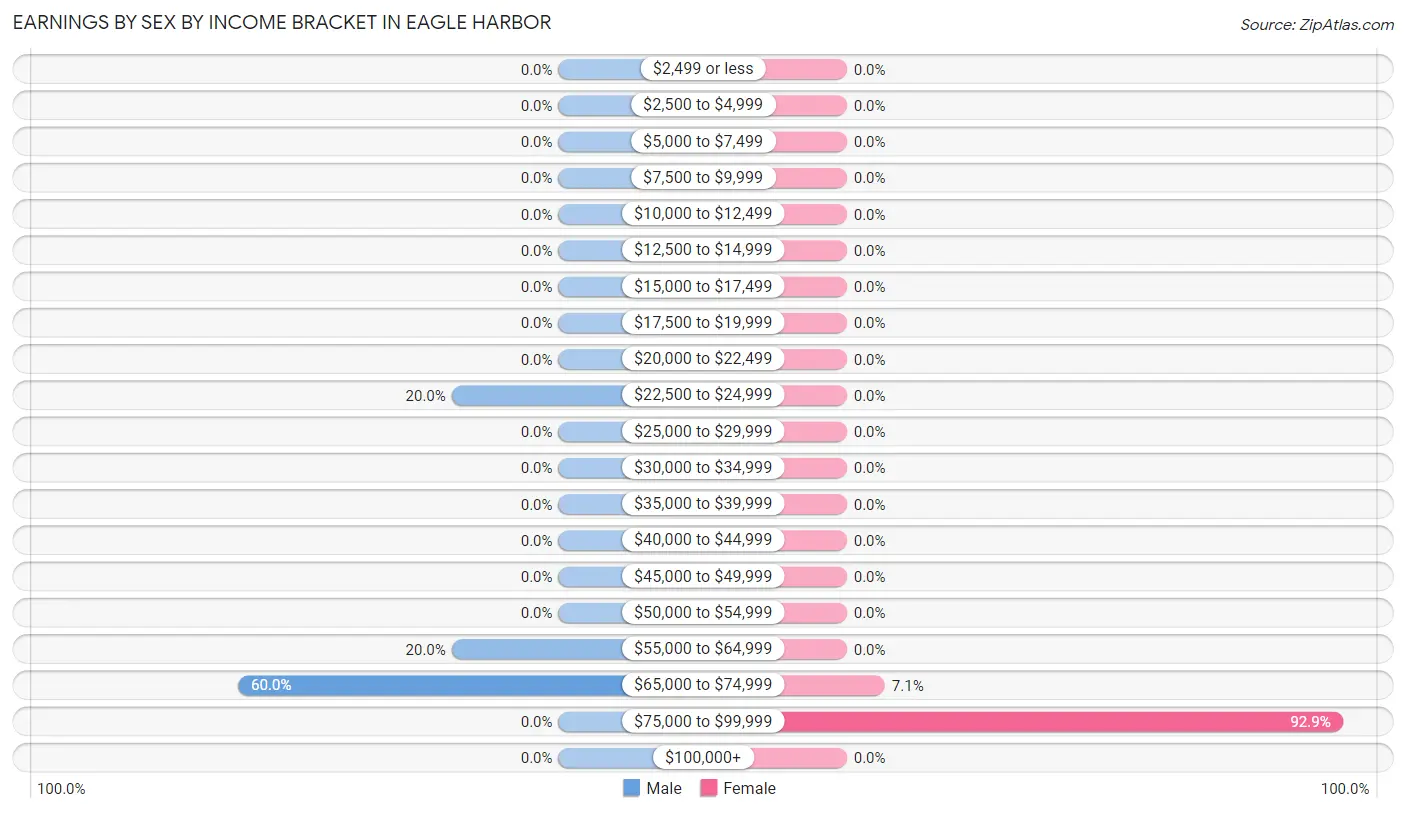
Earnings by Sex by Income Bracket in Eagle Harbor
The most common earnings brackets in Eagle Harbor are $65,000 to $74,999 for men (3 | 60.0%) and $75,000 to $99,999 for women (26 | 92.9%).
| Income | Male | Female |
| $2,499 or less | 0 (0.0%) | 0 (0.0%) |
| $2,500 to $4,999 | 0 (0.0%) | 0 (0.0%) |
| $5,000 to $7,499 | 0 (0.0%) | 0 (0.0%) |
| $7,500 to $9,999 | 0 (0.0%) | 0 (0.0%) |
| $10,000 to $12,499 | 0 (0.0%) | 0 (0.0%) |
| $12,500 to $14,999 | 0 (0.0%) | 0 (0.0%) |
| $15,000 to $17,499 | 0 (0.0%) | 0 (0.0%) |
| $17,500 to $19,999 | 0 (0.0%) | 0 (0.0%) |
| $20,000 to $22,499 | 0 (0.0%) | 0 (0.0%) |
| $22,500 to $24,999 | 1 (20.0%) | 0 (0.0%) |
| $25,000 to $29,999 | 0 (0.0%) | 0 (0.0%) |
| $30,000 to $34,999 | 0 (0.0%) | 0 (0.0%) |
| $35,000 to $39,999 | 0 (0.0%) | 0 (0.0%) |
| $40,000 to $44,999 | 0 (0.0%) | 0 (0.0%) |
| $45,000 to $49,999 | 0 (0.0%) | 0 (0.0%) |
| $50,000 to $54,999 | 0 (0.0%) | 0 (0.0%) |
| $55,000 to $64,999 | 1 (20.0%) | 0 (0.0%) |
| $65,000 to $74,999 | 3 (60.0%) | 2 (7.1%) |
| $75,000 to $99,999 | 0 (0.0%) | 26 (92.9%) |
| $100,000+ | 0 (0.0%) | 0 (0.0%) |
| Total | 5 (100.0%) | 28 (100.0%) |
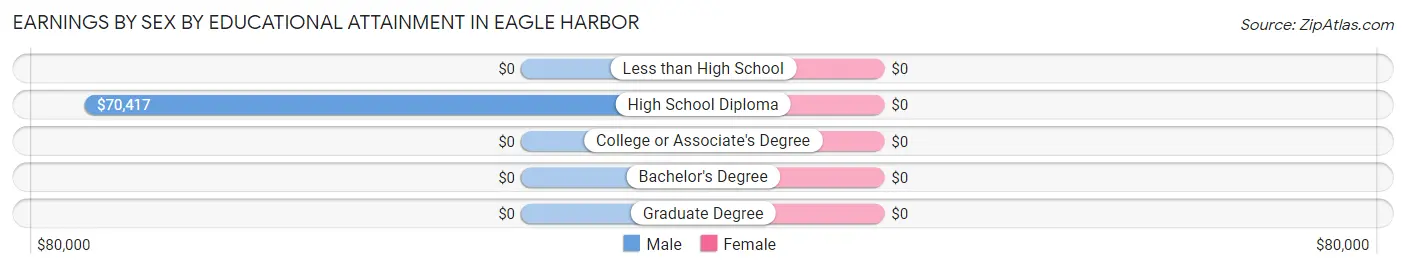
Earnings by Sex by Educational Attainment in Eagle Harbor
| Educational Attainment | Male Income | Female Income |
| Less than High School | - | - |
| High School Diploma | $70,417 | $0 |
| College or Associate's Degree | - | - |
| Bachelor's Degree | - | - |
| Graduate Degree | - | - |
| Total | $70,417 | $76,250 |
Family Income in Eagle Harbor
Family Income Brackets in Eagle Harbor
According to the Eagle Harbor family income data, there are 3 families falling into the $50,000 to $74,999 income range, which is the most common income bracket and makes up 50.0% of all families.
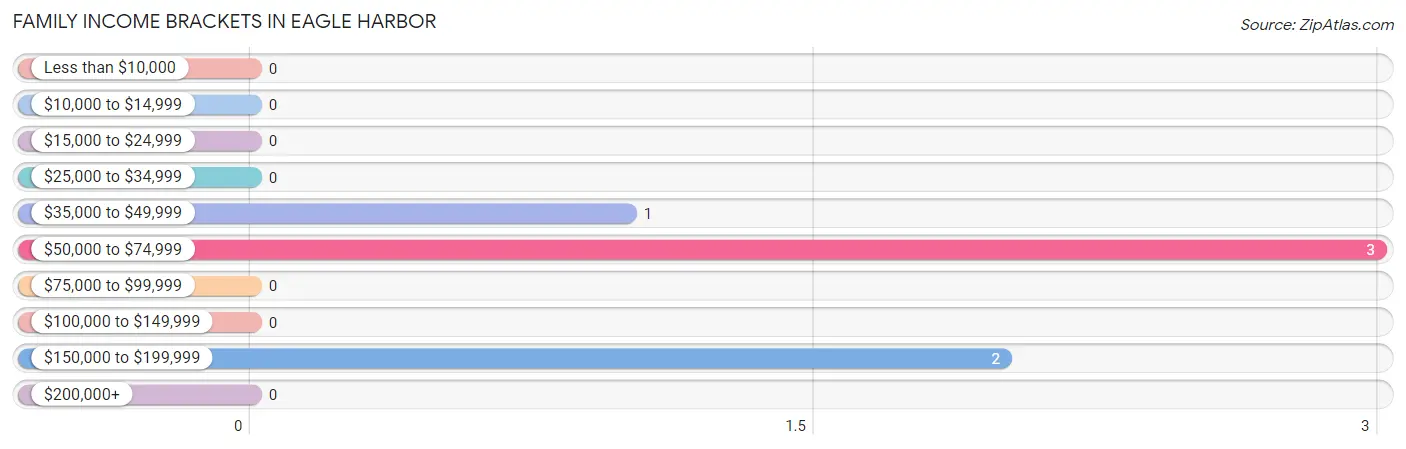
| Income Bracket | # Families | % Families |
| Less than $10,000 | 0 | 0.0% |
| $10,000 to $14,999 | 0 | 0.0% |
| $15,000 to $24,999 | 0 | 0.0% |
| $25,000 to $34,999 | 0 | 0.0% |
| $35,000 to $49,999 | 1 | 16.7% |
| $50,000 to $74,999 | 3 | 50.0% |
| $75,000 to $99,999 | 0 | 0.0% |
| $100,000 to $149,999 | 0 | 0.0% |
| $150,000 to $199,999 | 2 | 33.3% |
| $200,000+ | 0 | 0.0% |
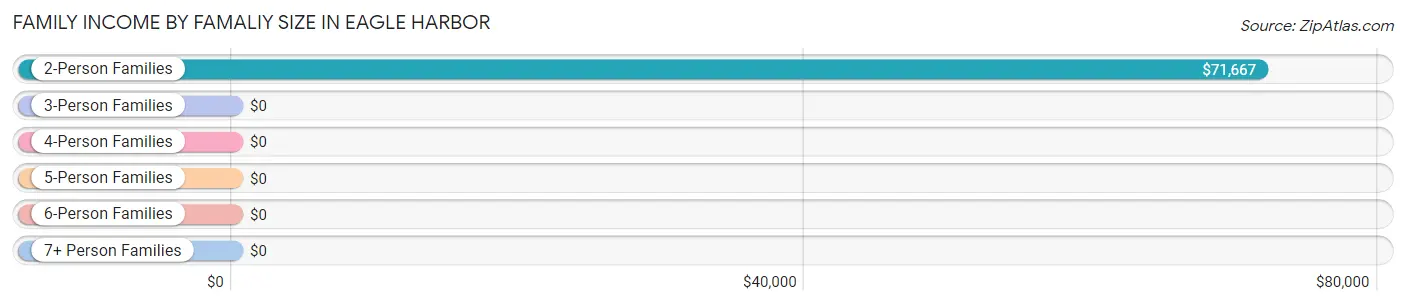
Family Income by Famaliy Size in Eagle Harbor
2-person families (6 | 100.0%) account for the highest median family income in Eagle Harbor with $71,667 per family, while 2-person families (6 | 100.0%) have the highest median income of $35,834 per family member.
| Income Bracket | # Families | Median Income |
| 2-Person Families | 6 (100.0%) | $71,667 |
| 3-Person Families | 0 (0.0%) | $0 |
| 4-Person Families | 0 (0.0%) | $0 |
| 5-Person Families | 0 (0.0%) | $0 |
| 6-Person Families | 0 (0.0%) | $0 |
| 7+ Person Families | 0 (0.0%) | $0 |
| Total | 6 (100.0%) | $71,667 |
Family Income by Number of Earners in Eagle Harbor
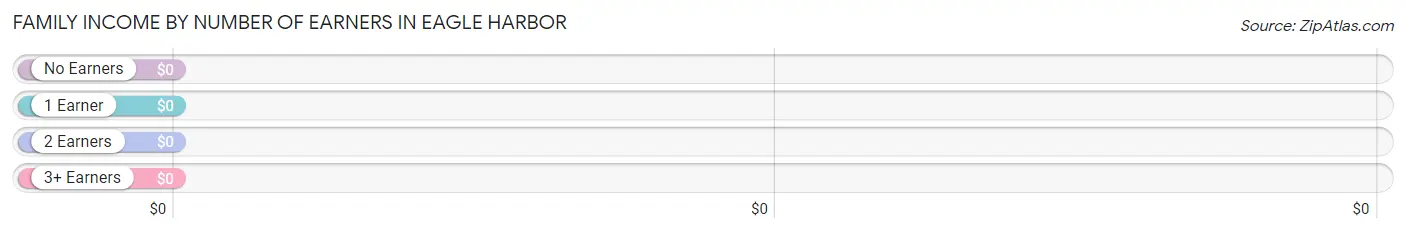
| Number of Earners | # Families | Median Income |
| No Earners | 0 (0.0%) | $0 |
| 1 Earner | 4 (66.7%) | $0 |
| 2 Earners | 2 (33.3%) | $0 |
| 3+ Earners | 0 (0.0%) | $0 |
| Total | 6 (100.0%) | $71,667 |
Household Income in Eagle Harbor
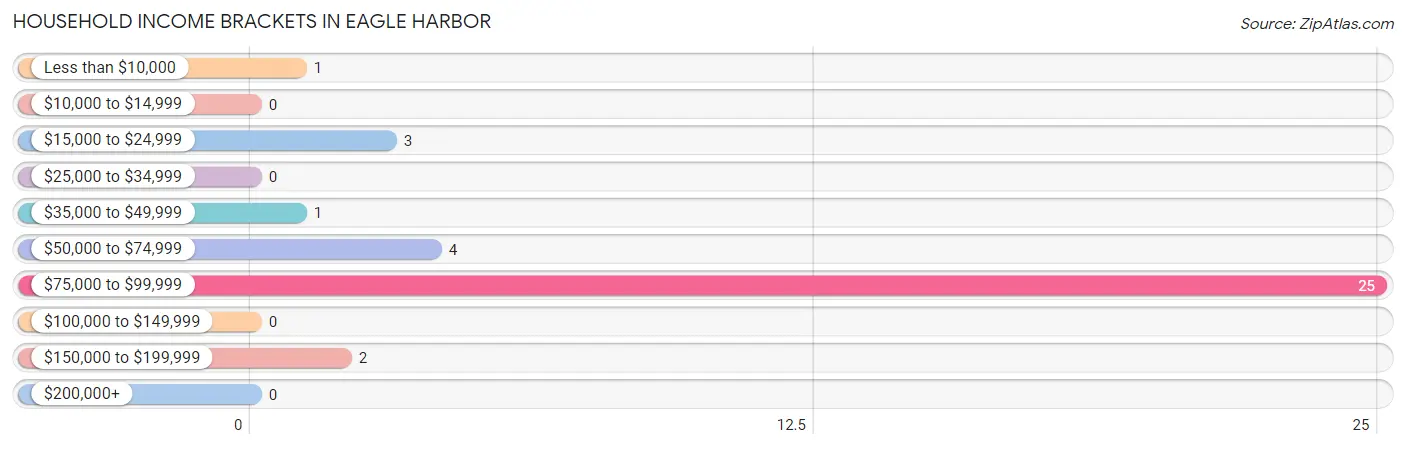
Household Income Brackets in Eagle Harbor
With 25 households falling in the category, the $75,000 to $99,999 income range is the most frequent in Eagle Harbor, accounting for 69.4% of all households.
| Income Bracket | # Households | % Households |
| Less than $10,000 | 1 | 2.8% |
| $10,000 to $14,999 | 0 | 0.0% |
| $15,000 to $24,999 | 3 | 8.3% |
| $25,000 to $34,999 | 0 | 0.0% |
| $35,000 to $49,999 | 1 | 2.8% |
| $50,000 to $74,999 | 4 | 11.1% |
| $75,000 to $99,999 | 25 | 69.4% |
| $100,000 to $149,999 | 0 | 0.0% |
| $150,000 to $199,999 | 2 | 5.6% |
| $200,000+ | 0 | 0.0% |
Household Income by Householder Age in Eagle Harbor
The median household income in Eagle Harbor is $75,938, with the highest median household income of $41,250 found in the 65+ years age bracket for the primary householder. A total of 9 households (25.0%) fall into this category.
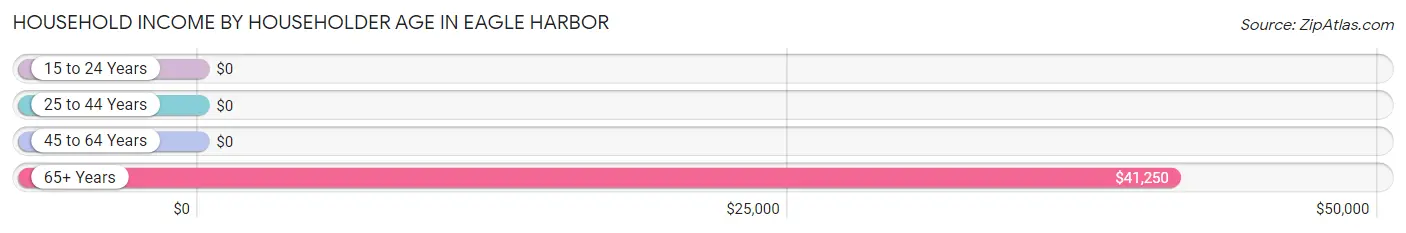
| Income Bracket | # Households | Median Income |
| 15 to 24 Years | 0 (0.0%) | $0 |
| 25 to 44 Years | 3 (8.3%) | $0 |
| 45 to 64 Years | 24 (66.7%) | $0 |
| 65+ Years | 9 (25.0%) | $41,250 |
| Total | 36 (100.0%) | $75,938 |
Poverty in Eagle Harbor
Income Below Poverty by Sex and Age in Eagle Harbor
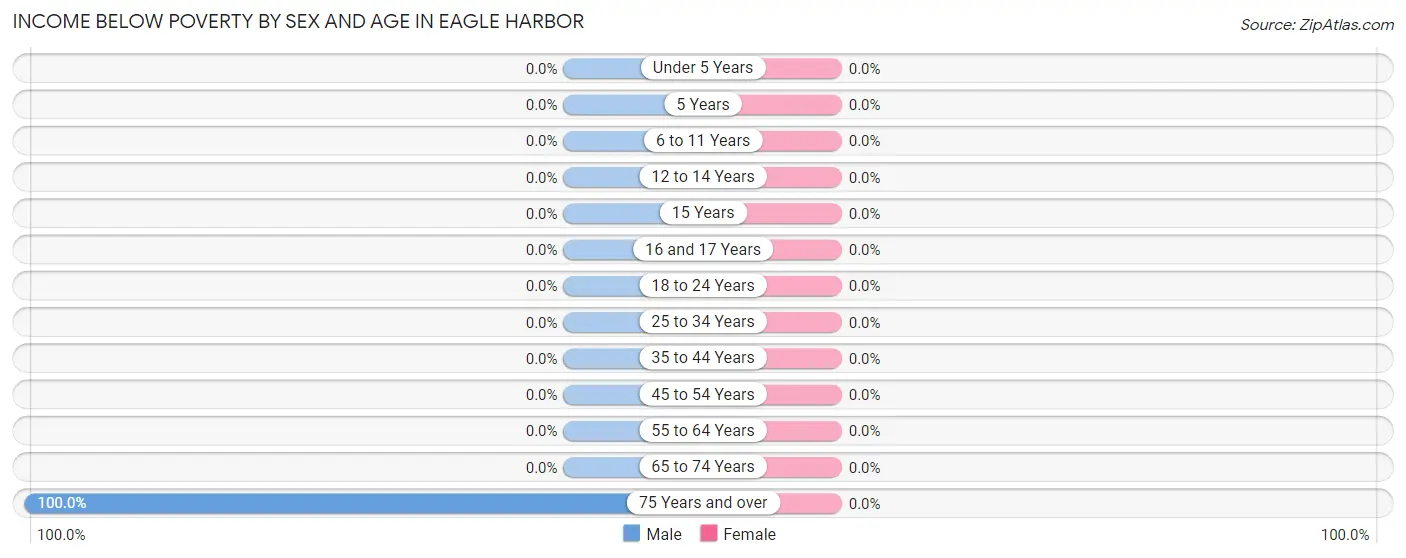
| Age Bracket | Male | Female |
| Under 5 Years | 0 (0.0%) | 0 (0.0%) |
| 5 Years | 0 (0.0%) | 0 (0.0%) |
| 6 to 11 Years | 0 (0.0%) | 0 (0.0%) |
| 12 to 14 Years | 0 (0.0%) | 0 (0.0%) |
| 15 Years | 0 (0.0%) | 0 (0.0%) |
| 16 and 17 Years | 0 (0.0%) | 0 (0.0%) |
| 18 to 24 Years | 0 (0.0%) | 0 (0.0%) |
| 25 to 34 Years | 0 (0.0%) | 0 (0.0%) |
| 35 to 44 Years | 0 (0.0%) | 0 (0.0%) |
| 45 to 54 Years | 0 (0.0%) | 0 (0.0%) |
| 55 to 64 Years | 0 (0.0%) | 0 (0.0%) |
| 65 to 74 Years | 0 (0.0%) | 0 (0.0%) |
| 75 Years and over | 1 (100.0%) | 0 (0.0%) |
| Total | 1 (11.1%) | 0 (0.0%) |
Income Above Poverty by Sex and Age in Eagle Harbor
According to the poverty statistics in Eagle Harbor, males aged 6 to 11 years and females aged 45 to 54 years are the age groups that are most secure financially, with 100.0% of males and 100.0% of females in these age groups living above the poverty line.
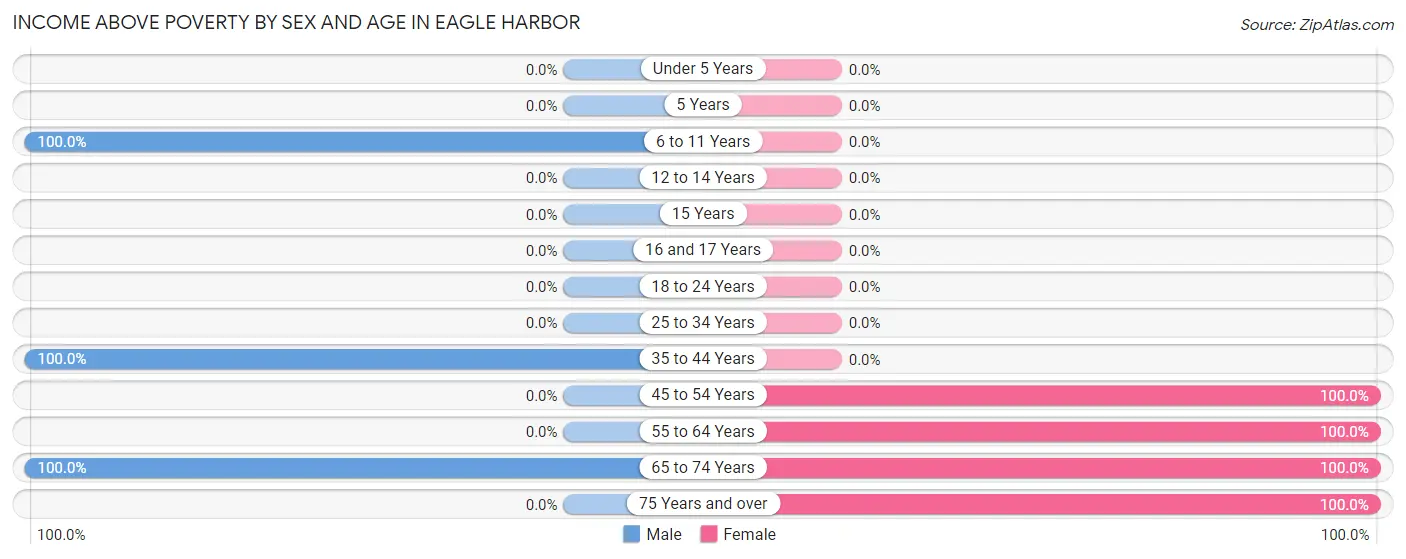
| Age Bracket | Male | Female |
| Under 5 Years | 0 (0.0%) | 0 (0.0%) |
| 5 Years | 0 (0.0%) | 0 (0.0%) |
| 6 to 11 Years | 3 (100.0%) | 0 (0.0%) |
| 12 to 14 Years | 0 (0.0%) | 0 (0.0%) |
| 15 Years | 0 (0.0%) | 0 (0.0%) |
| 16 and 17 Years | 0 (0.0%) | 0 (0.0%) |
| 18 to 24 Years | 0 (0.0%) | 0 (0.0%) |
| 25 to 34 Years | 0 (0.0%) | 0 (0.0%) |
| 35 to 44 Years | 3 (100.0%) | 0 (0.0%) |
| 45 to 54 Years | 0 (0.0%) | 2 (100.0%) |
| 55 to 64 Years | 0 (0.0%) | 24 (100.0%) |
| 65 to 74 Years | 2 (100.0%) | 4 (100.0%) |
| 75 Years and over | 0 (0.0%) | 3 (100.0%) |
| Total | 8 (88.9%) | 33 (100.0%) |
Income Below Poverty Among Married-Couple Families in Eagle Harbor
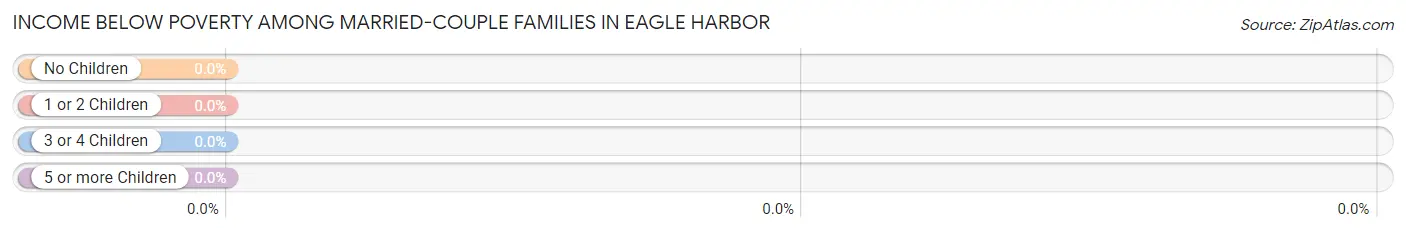
| Children | Above Poverty | Below Poverty |
| No Children | 1 (100.0%) | 0 (0.0%) |
| 1 or 2 Children | 0 (0.0%) | 0 (0.0%) |
| 3 or 4 Children | 0 (0.0%) | 0 (0.0%) |
| 5 or more Children | 0 (0.0%) | 0 (0.0%) |
| Total | 1 (100.0%) | 0 (0.0%) |
Income Below Poverty Among Single-Parent Households in Eagle Harbor
| Children | Single Father | Single Mother |
| No Children | 0 (0.0%) | 0 (0.0%) |
| 1 or 2 Children | 0 (0.0%) | 0 (0.0%) |
| 3 or 4 Children | 0 (0.0%) | 0 (0.0%) |
| 5 or more Children | 0 (0.0%) | 0 (0.0%) |
| Total | 0 (0.0%) | 0 (0.0%) |
Income Below Poverty Among Married-Couple vs Single-Parent Households in Eagle Harbor
| Children | Married-Couple Families | Single-Parent Households |
| No Children | 0 (0.0%) | 0 (0.0%) |
| 1 or 2 Children | 0 (0.0%) | 0 (0.0%) |
| 3 or 4 Children | 0 (0.0%) | 0 (0.0%) |
| 5 or more Children | 0 (0.0%) | 0 (0.0%) |
| Total | 0 (0.0%) | 0 (0.0%) |
Race in Eagle Harbor
The most populous races in Eagle Harbor are Black / African American (33 | 78.6%), White / Caucasian (9 | 21.4%), and Hispanic or Latino (3 | 7.1%).
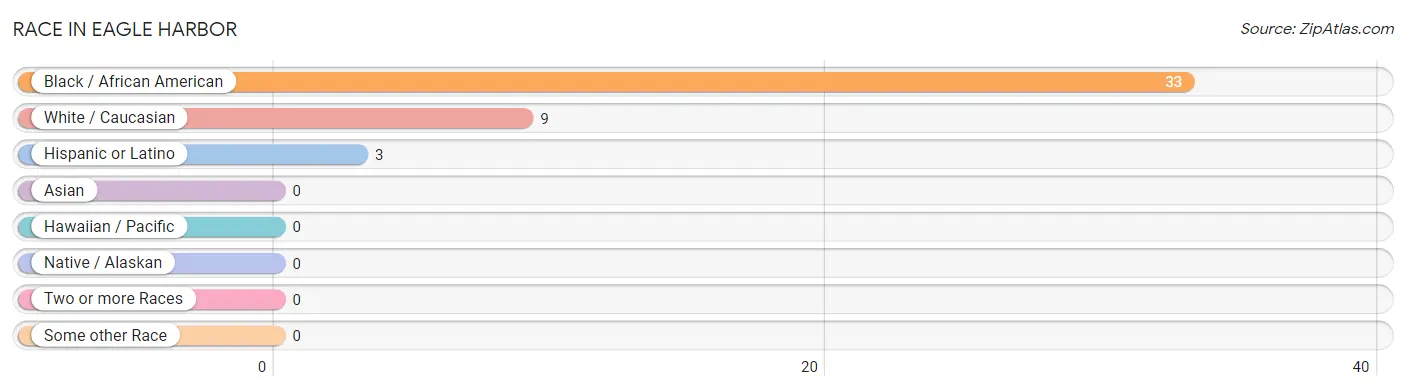
| Race | # Population | % Population |
| Asian | 0 | 0.0% |
| Black / African American | 33 | 78.6% |
| Hawaiian / Pacific | 0 | 0.0% |
| Hispanic or Latino | 3 | 7.1% |
| Native / Alaskan | 0 | 0.0% |
| White / Caucasian | 9 | 21.4% |
| Two or more Races | 0 | 0.0% |
| Some other Race | 0 | 0.0% |
| Total | 42 | 100.0% |
Ancestry in Eagle Harbor
The most populous ancestries reported in Eagle Harbor are English (3 | 7.1%), Puerto Rican (3 | 7.1%), and Welsh (3 | 7.1%), together accounting for 21.4% of all Eagle Harbor residents.
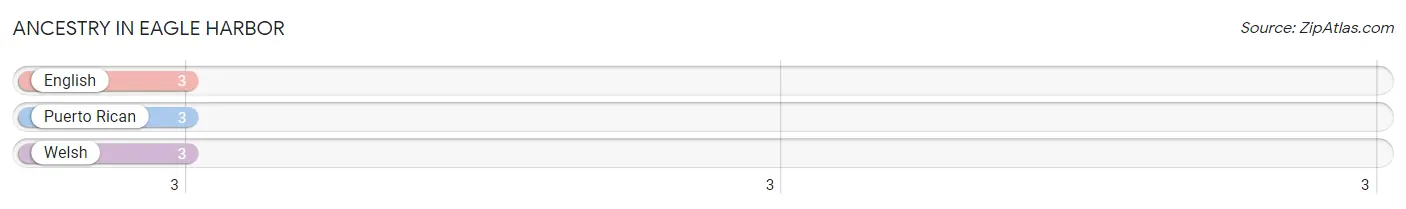
| Ancestry | # Population | % Population |
| English | 3 | 7.1% |
| Puerto Rican | 3 | 7.1% |
| Welsh | 3 | 7.1% | View All 3 Rows |
Immigrants in Eagle Harbor

| Immigration Origin | # Population | % Population | View All 0 Rows |
Sex and Age in Eagle Harbor
Sex and Age in Eagle Harbor
The most populous age groups in Eagle Harbor are 10 to 14 Years (3 | 33.3%) for men and 60 to 64 Years (24 | 72.7%) for women.
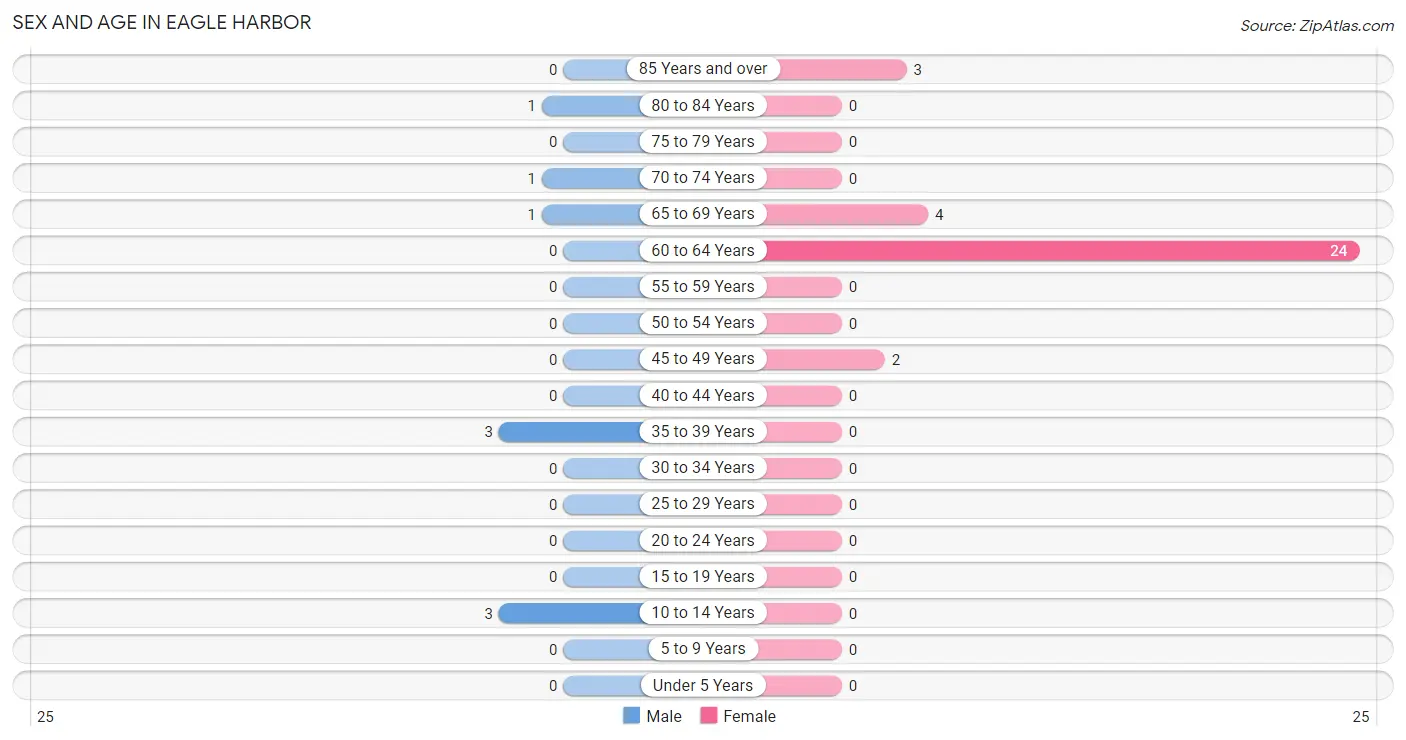
| Age Bracket | Male | Female |
| Under 5 Years | 0 (0.0%) | 0 (0.0%) |
| 5 to 9 Years | 0 (0.0%) | 0 (0.0%) |
| 10 to 14 Years | 3 (33.3%) | 0 (0.0%) |
| 15 to 19 Years | 0 (0.0%) | 0 (0.0%) |
| 20 to 24 Years | 0 (0.0%) | 0 (0.0%) |
| 25 to 29 Years | 0 (0.0%) | 0 (0.0%) |
| 30 to 34 Years | 0 (0.0%) | 0 (0.0%) |
| 35 to 39 Years | 3 (33.3%) | 0 (0.0%) |
| 40 to 44 Years | 0 (0.0%) | 0 (0.0%) |
| 45 to 49 Years | 0 (0.0%) | 2 (6.1%) |
| 50 to 54 Years | 0 (0.0%) | 0 (0.0%) |
| 55 to 59 Years | 0 (0.0%) | 0 (0.0%) |
| 60 to 64 Years | 0 (0.0%) | 24 (72.7%) |
| 65 to 69 Years | 1 (11.1%) | 4 (12.1%) |
| 70 to 74 Years | 1 (11.1%) | 0 (0.0%) |
| 75 to 79 Years | 0 (0.0%) | 0 (0.0%) |
| 80 to 84 Years | 1 (11.1%) | 0 (0.0%) |
| 85 Years and over | 0 (0.0%) | 3 (9.1%) |
| Total | 9 (100.0%) | 33 (100.0%) |
Families and Households in Eagle Harbor
Median Family Size in Eagle Harbor
The median family size in Eagle Harbor is 2.00 persons per family, with married-couple families (1 | 16.7%) accounting for the largest median family size of 2 persons per family. On the other hand, married-couple families (1 | 16.7%) represent the smallest median family size with 2.00 persons per family.
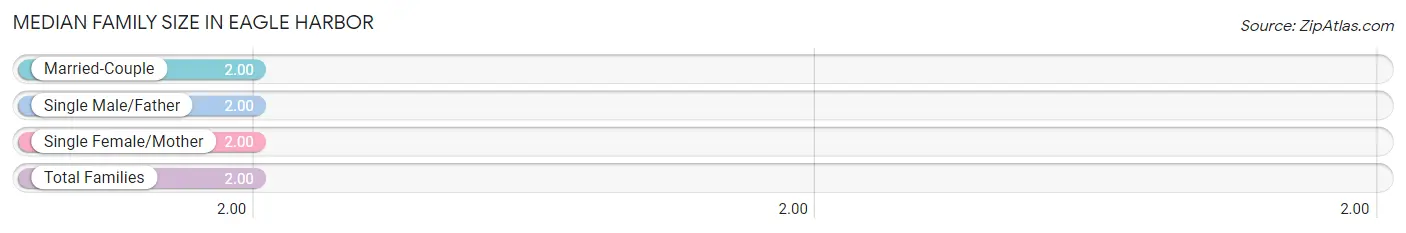
| Family Type | # Families | Family Size |
| Married-Couple | 1 (16.7%) | 2.00 |
| Single Male/Father | 3 (50.0%) | 2.00 |
| Single Female/Mother | 2 (33.3%) | 2.00 |
| Total Families | 6 (100.0%) | 2.00 |
Median Household Size in Eagle Harbor
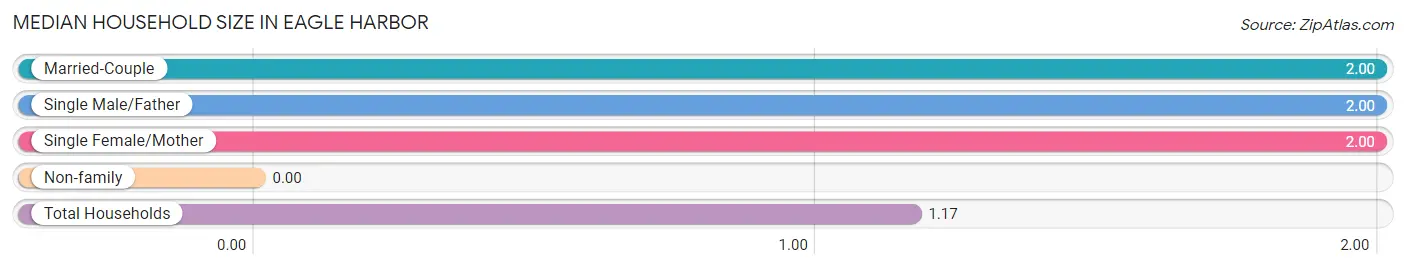
| Household Type | # Households | Household Size |
| Married-Couple | 1 (2.8%) | 2.00 |
| Single Male/Father | 3 (8.3%) | 2.00 |
| Single Female/Mother | 2 (5.6%) | 2.00 |
| Non-family | 30 (83.3%) | - |
| Total Households | 36 (100.0%) | 1.17 |
Household Size by Marriage Status in Eagle Harbor
Out of a total of 36 households in Eagle Harbor, 6 (16.7%) are family households, while 30 (83.3%) are nonfamily households. The most numerous type of family households are 2-person households, comprising 6, and the most common type of nonfamily households are 1-person households, comprising 30.
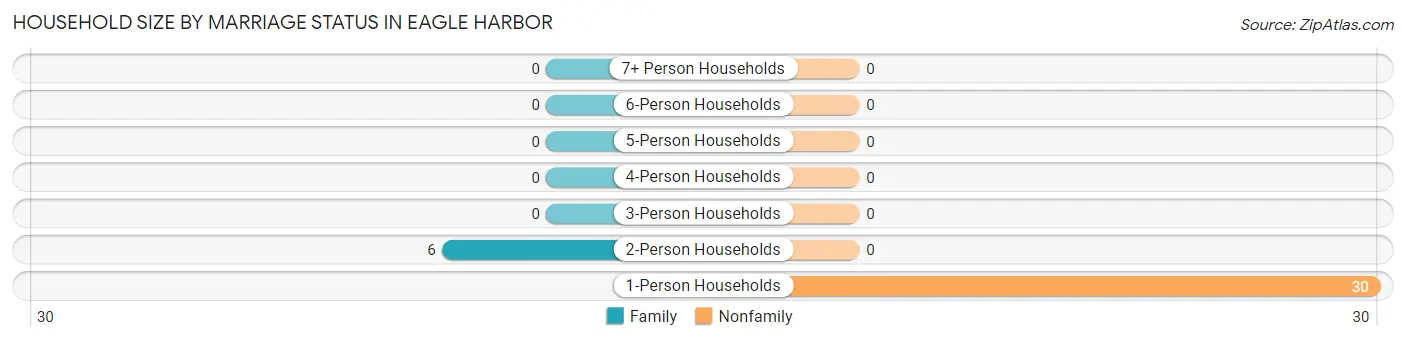
| Household Size | Family Households | Nonfamily Households |
| 1-Person Households | - | 30 (83.3%) |
| 2-Person Households | 6 (16.7%) | 0 (0.0%) |
| 3-Person Households | 0 (0.0%) | 0 (0.0%) |
| 4-Person Households | 0 (0.0%) | 0 (0.0%) |
| 5-Person Households | 0 (0.0%) | 0 (0.0%) |
| 6-Person Households | 0 (0.0%) | 0 (0.0%) |
| 7+ Person Households | 0 (0.0%) | 0 (0.0%) |
| Total | 6 (16.7%) | 30 (83.3%) |
Female Fertility in Eagle Harbor
Fertility by Age in Eagle Harbor
| Age Bracket | Women with Births | Births / 1,000 Women |
| 15 to 19 years | 0 (0.0%) | 0.0 |
| 20 to 34 years | 0 (0.0%) | 0.0 |
| 35 to 50 years | 0 (0.0%) | 0.0 |
| Total | 0 (0.0%) | 0.0 |
Fertility by Age by Marriage Status in Eagle Harbor
| Age Bracket | Married | Unmarried |
| 15 to 19 years | 0 (0.0%) | 0 (0.0%) |
| 20 to 34 years | 0 (0.0%) | 0 (0.0%) |
| 35 to 50 years | 0 (0.0%) | 0 (0.0%) |
| Total | 0 (0.0%) | 0 (0.0%) |
Fertility by Education in Eagle Harbor
| Educational Attainment | Women with Births | Births / 1,000 Women |
| Less than High School | 0 (0.0%) | 0.0 |
| High School Diploma | 0 (0.0%) | 0.0 |
| College or Associate's Degree | 0 (0.0%) | 0.0 |
| Bachelor's Degree | 0 (0.0%) | 0.0 |
| Graduate Degree | 0 (0.0%) | 0.0 |
| Total | 0 (0.0%) | 0.0 |
Fertility by Education by Marriage Status in Eagle Harbor
| Educational Attainment | Married | Unmarried |
| Less than High School | 0 (0.0%) | 0 (0.0%) |
| High School Diploma | 0 (0.0%) | 0 (0.0%) |
| College or Associate's Degree | 0 (0.0%) | 0 (0.0%) |
| Bachelor's Degree | 0 (0.0%) | 0 (0.0%) |
| Graduate Degree | 0 (0.0%) | 0 (0.0%) |
| Total | 0 (0.0%) | 0 (0.0%) |
Employment Characteristics in Eagle Harbor
Employment by Class of Employer in Eagle Harbor
Among the 32 employed individuals in Eagle Harbor, local government employees (26 | 81.2%), private company employees (4 | 12.5%), and federal government employees (2 | 6.2%) make up the most common classes of employment.
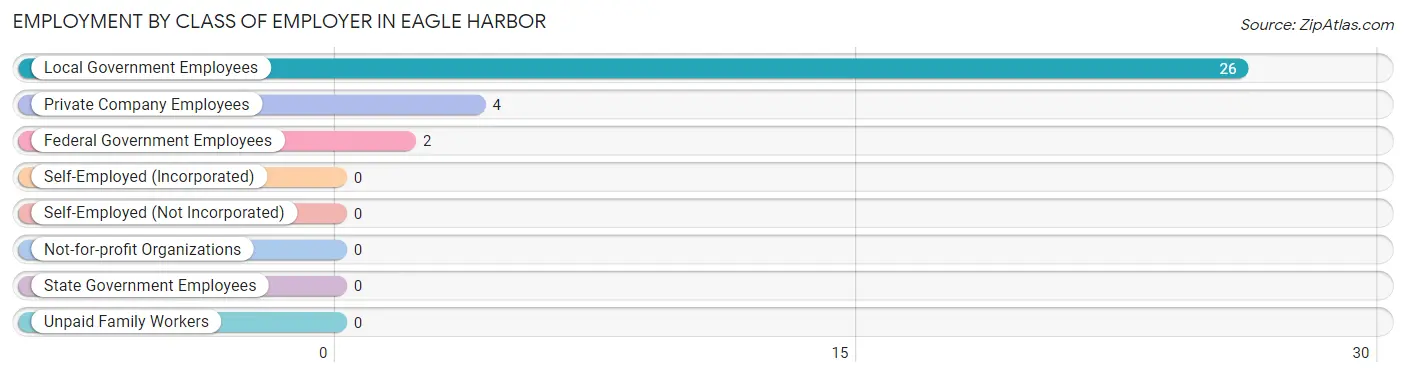
| Employer Class | # Employees | % Employees |
| Private Company Employees | 4 | 12.5% |
| Self-Employed (Incorporated) | 0 | 0.0% |
| Self-Employed (Not Incorporated) | 0 | 0.0% |
| Not-for-profit Organizations | 0 | 0.0% |
| Local Government Employees | 26 | 81.2% |
| State Government Employees | 0 | 0.0% |
| Federal Government Employees | 2 | 6.2% |
| Unpaid Family Workers | 0 | 0.0% |
| Total | 32 | 100.0% |
Employment Status by Age in Eagle Harbor
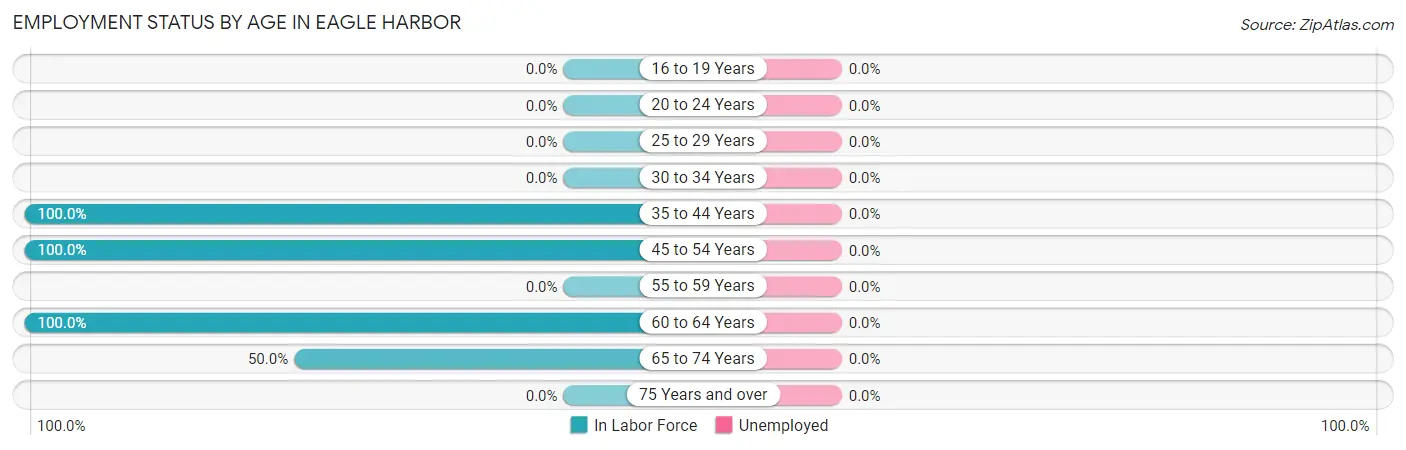
| Age Bracket | In Labor Force | Unemployed |
| 16 to 19 Years | 0 (0.0%) | 0 (0.0%) |
| 20 to 24 Years | 0 (0.0%) | 0 (0.0%) |
| 25 to 29 Years | 0 (0.0%) | 0 (0.0%) |
| 30 to 34 Years | 0 (0.0%) | 0 (0.0%) |
| 35 to 44 Years | 3 (100.0%) | 0 (0.0%) |
| 45 to 54 Years | 2 (100.0%) | 0 (0.0%) |
| 55 to 59 Years | 0 (0.0%) | 0 (0.0%) |
| 60 to 64 Years | 24 (100.0%) | 0 (0.0%) |
| 65 to 74 Years | 3 (50.0%) | 0 (0.0%) |
| 75 Years and over | 0 (0.0%) | 0 (0.0%) |
| Total | 32 (82.1%) | 0 (0.0%) |
Employment Status by Educational Attainment in Eagle Harbor
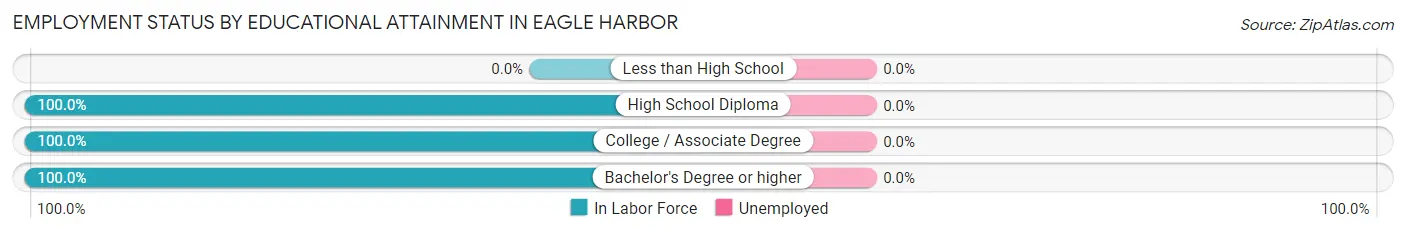
| Educational Attainment | In Labor Force | Unemployed |
| Less than High School | 0 (0.0%) | 0 (0.0%) |
| High School Diploma | 3 (100.0%) | 0 (0.0%) |
| College / Associate Degree | 24 (100.0%) | 0 (0.0%) |
| Bachelor's Degree or higher | 2 (100.0%) | 0 (0.0%) |
| Total | 29 (100.0%) | 0 (0.0%) |
Employment Occupations by Sex in Eagle Harbor
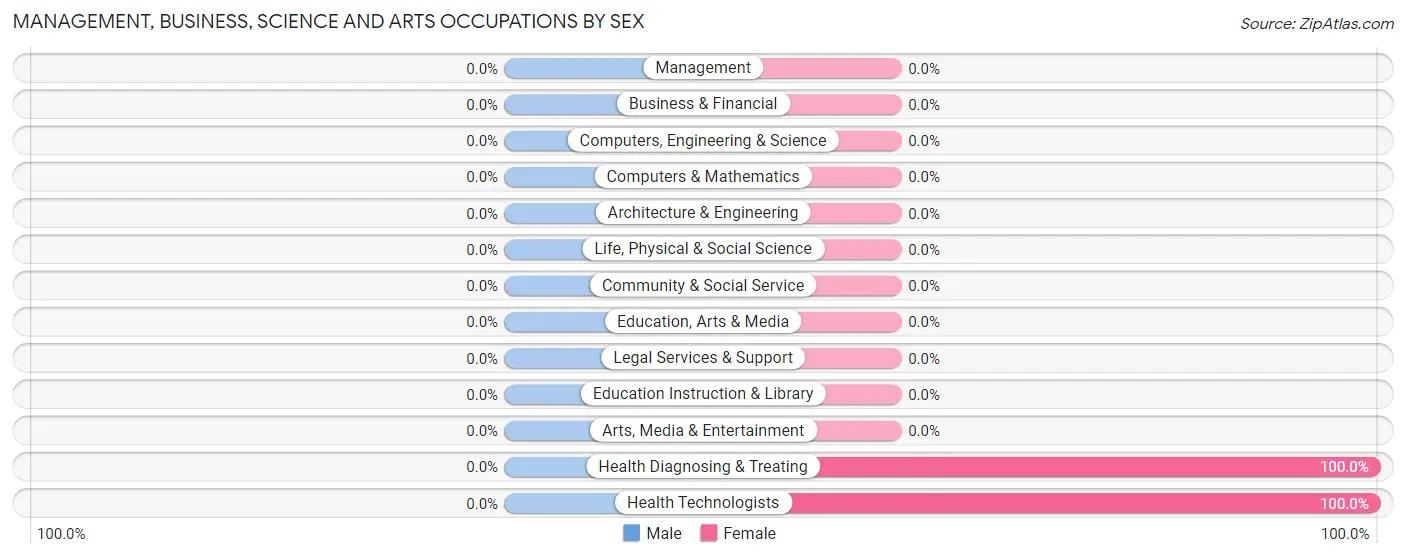
Management, Business, Science and Arts Occupations
The most common Management, Business, Science and Arts occupations in Eagle Harbor are Health Diagnosing & Treating (2 | 6.2%), and Health Technologists (2 | 6.2%).
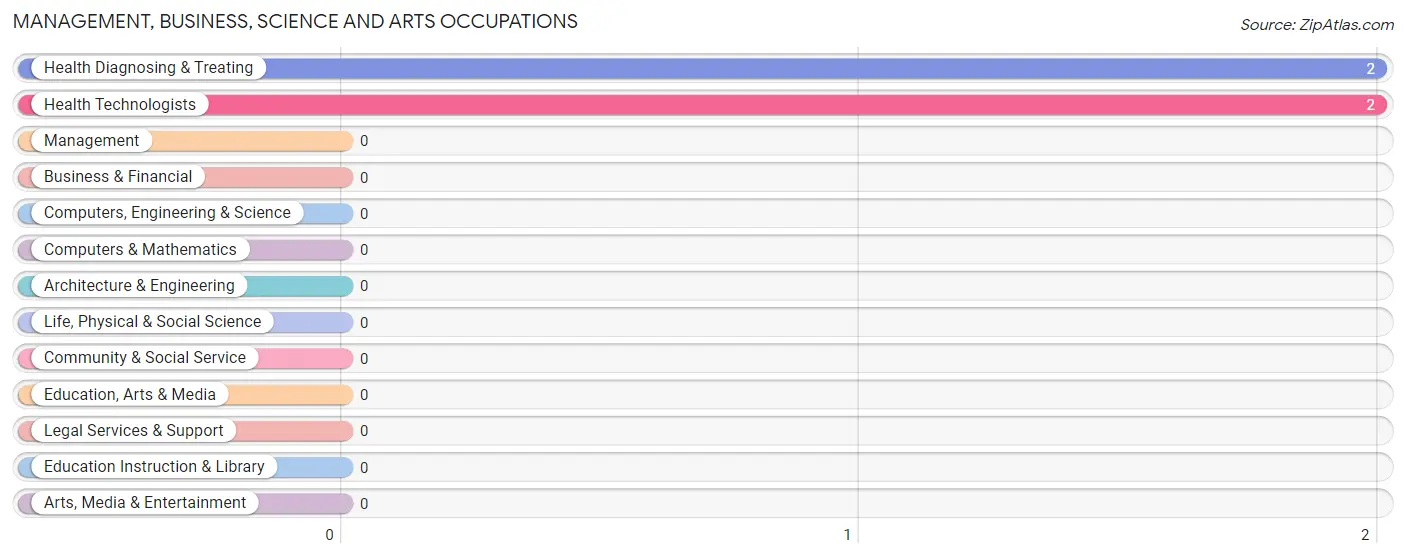
Management, Business, Science and Arts Occupations by Sex
| Occupation | Male | Female |
| Management | 0 (0.0%) | 0 (0.0%) |
| Business & Financial | 0 (0.0%) | 0 (0.0%) |
| Computers, Engineering & Science | 0 (0.0%) | 0 (0.0%) |
| Computers & Mathematics | 0 (0.0%) | 0 (0.0%) |
| Architecture & Engineering | 0 (0.0%) | 0 (0.0%) |
| Life, Physical & Social Science | 0 (0.0%) | 0 (0.0%) |
| Community & Social Service | 0 (0.0%) | 0 (0.0%) |
| Education, Arts & Media | 0 (0.0%) | 0 (0.0%) |
| Legal Services & Support | 0 (0.0%) | 0 (0.0%) |
| Education Instruction & Library | 0 (0.0%) | 0 (0.0%) |
| Arts, Media & Entertainment | 0 (0.0%) | 0 (0.0%) |
| Health Diagnosing & Treating | 0 (0.0%) | 2 (100.0%) |
| Health Technologists | 0 (0.0%) | 2 (100.0%) |
| Total (Category) | 0 (0.0%) | 2 (100.0%) |
| Total (Overall) | 4 (12.5%) | 28 (87.5%) |
Services Occupations
Services Occupations by Sex
| Occupation | Male | Female |
| Healthcare Support | 0 (0.0%) | 0 (0.0%) |
| Security & Protection | 0 (0.0%) | 0 (0.0%) |
| Firefighting & Prevention | 0 (0.0%) | 0 (0.0%) |
| Law Enforcement | 0 (0.0%) | 0 (0.0%) |
| Food Preparation & Serving | 0 (0.0%) | 0 (0.0%) |
| Cleaning & Maintenance | 0 (0.0%) | 0 (0.0%) |
| Personal Care & Service | 0 (0.0%) | 0 (0.0%) |
| Total (Category) | 0 (0.0%) | 0 (0.0%) |
| Total (Overall) | 4 (12.5%) | 28 (87.5%) |
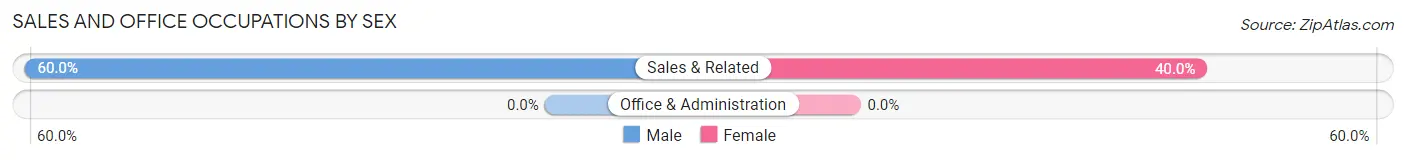
Sales and Office Occupations
The most common Sales and Office occupations in Eagle Harbor are , and Sales & Related (5 | 15.6%).
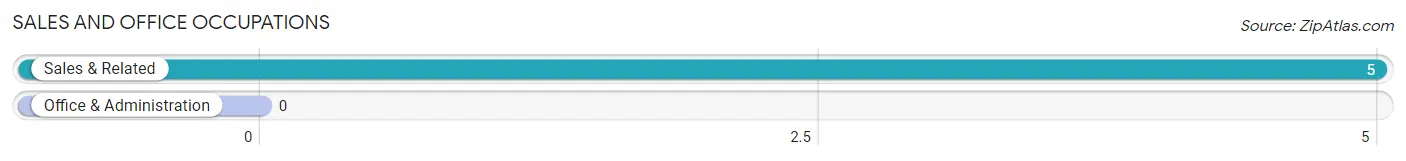
Sales and Office Occupations by Sex
| Occupation | Male | Female |
| Sales & Related | 3 (60.0%) | 2 (40.0%) |
| Office & Administration | 0 (0.0%) | 0 (0.0%) |
| Total (Category) | 3 (60.0%) | 2 (40.0%) |
| Total (Overall) | 4 (12.5%) | 28 (87.5%) |
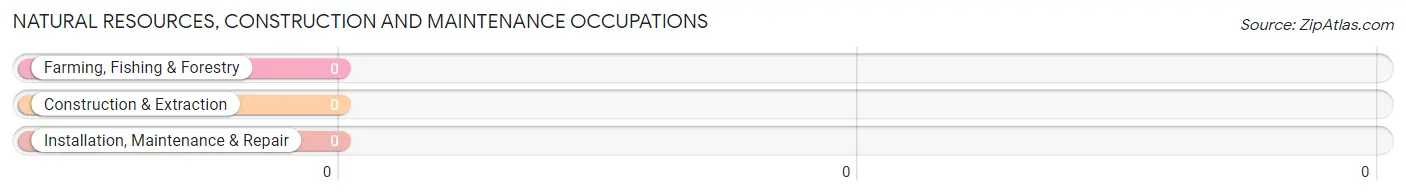
Natural Resources, Construction and Maintenance Occupations
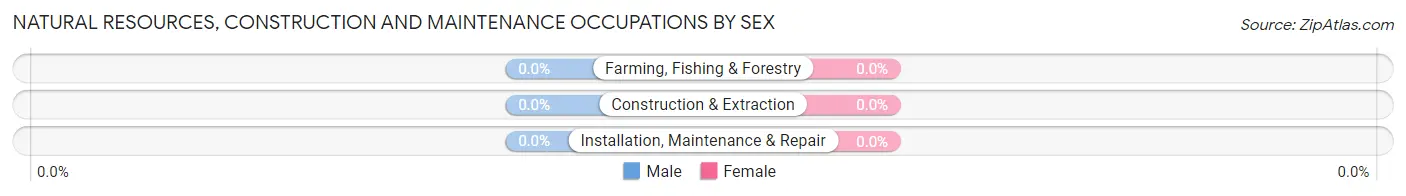
Natural Resources, Construction and Maintenance Occupations by Sex
| Occupation | Male | Female |
| Farming, Fishing & Forestry | 0 (0.0%) | 0 (0.0%) |
| Construction & Extraction | 0 (0.0%) | 0 (0.0%) |
| Installation, Maintenance & Repair | 0 (0.0%) | 0 (0.0%) |
| Total (Category) | 0 (0.0%) | 0 (0.0%) |
| Total (Overall) | 4 (12.5%) | 28 (87.5%) |
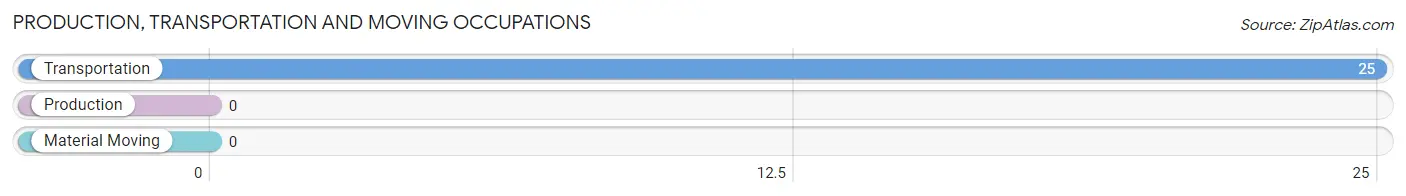
Production, Transportation and Moving Occupations
The most common Production, Transportation and Moving occupations in Eagle Harbor are , and Transportation (25 | 78.1%).
Production, Transportation and Moving Occupations by Sex
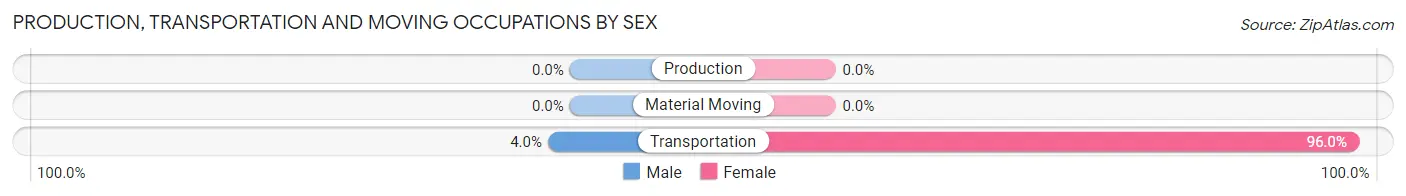
| Occupation | Male | Female |
| Production | 0 (0.0%) | 0 (0.0%) |
| Transportation | 1 (4.0%) | 24 (96.0%) |
| Material Moving | 0 (0.0%) | 0 (0.0%) |
| Total (Category) | 1 (4.0%) | 24 (96.0%) |
| Total (Overall) | 4 (12.5%) | 28 (87.5%) |
Employment Industries by Sex in Eagle Harbor
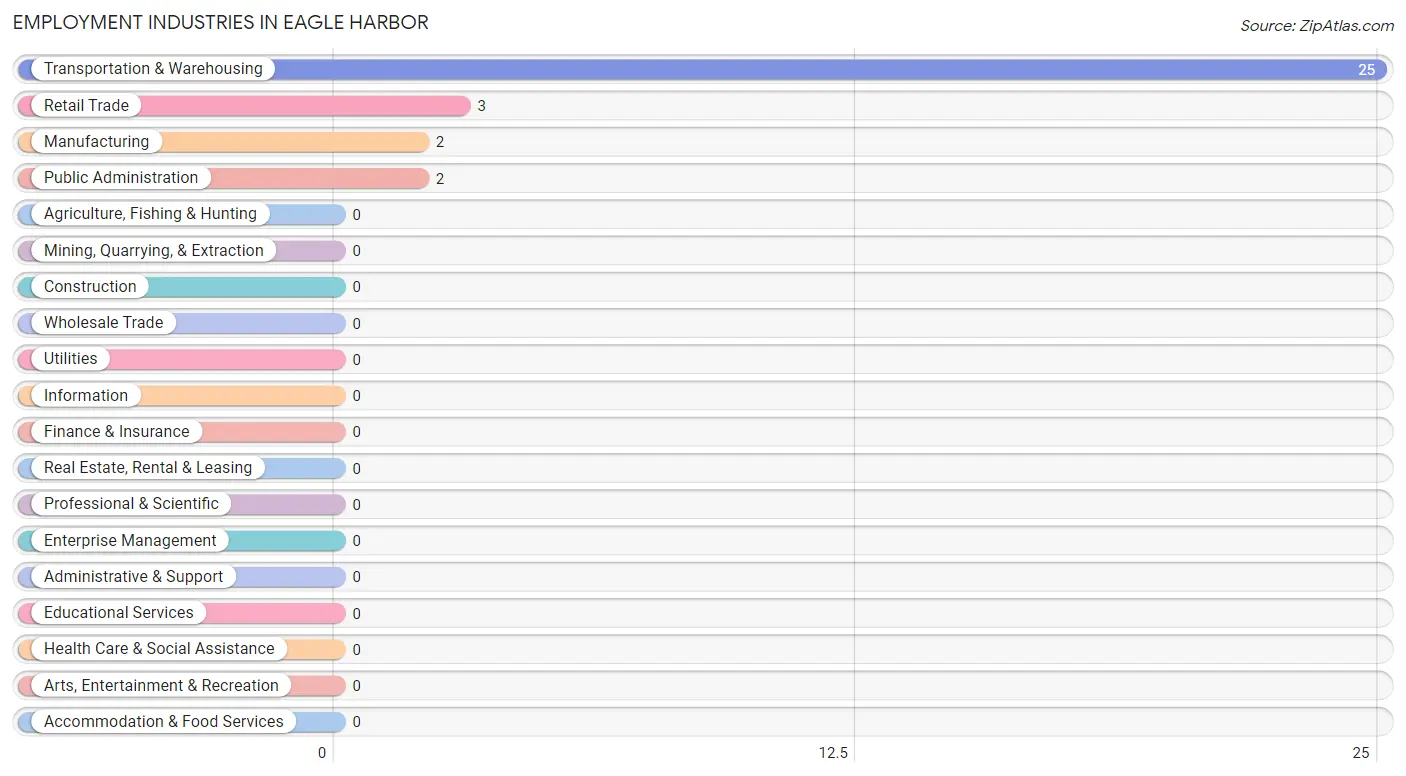
Employment Industries in Eagle Harbor
The major employment industries in Eagle Harbor include Transportation & Warehousing (25 | 78.1%), Retail Trade (3 | 9.4%), Manufacturing (2 | 6.2%), and Public Administration (2 | 6.2%).
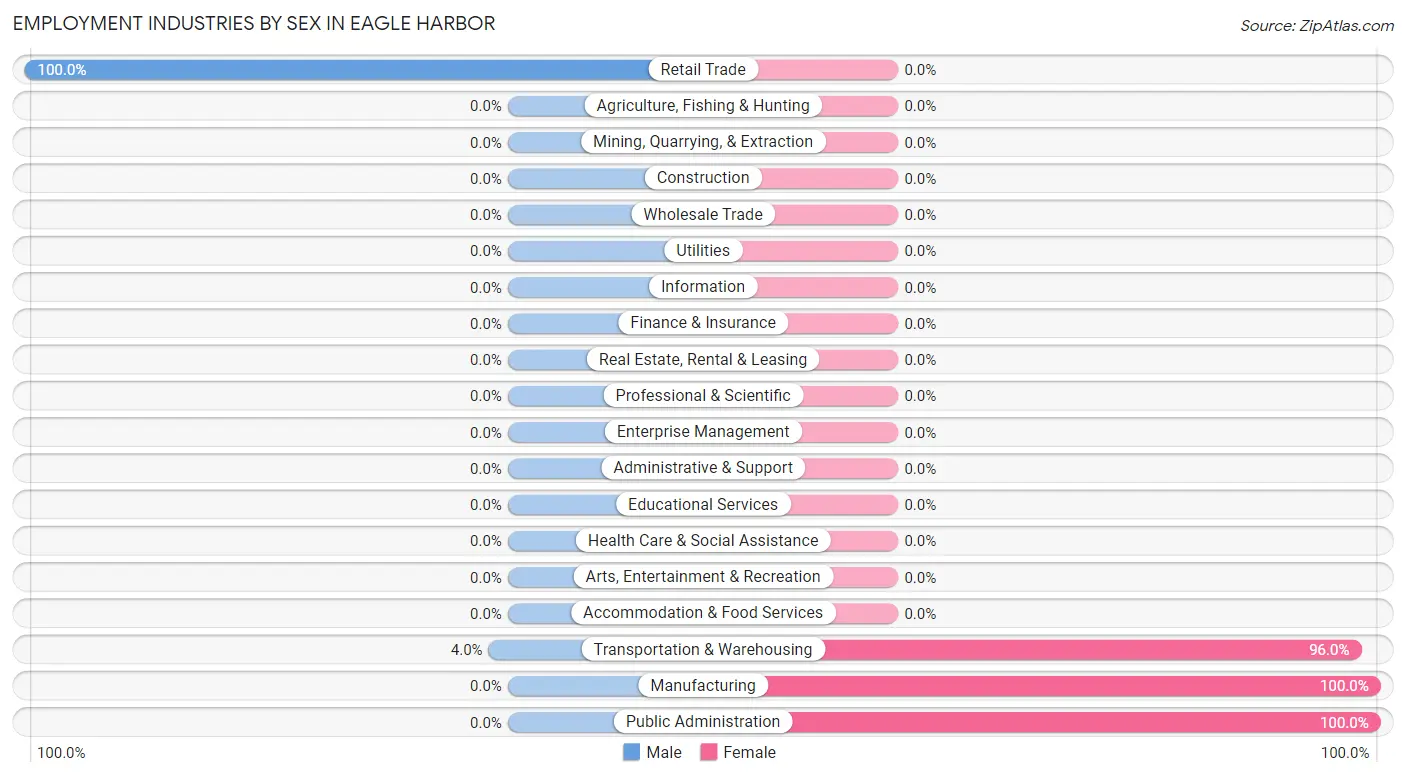
Employment Industries by Sex in Eagle Harbor
The Eagle Harbor industries that see more men than women are Retail Trade (100.0%), and Transportation & Warehousing (4.0%), whereas the industries that tend to have a higher number of women are Manufacturing (100.0%), Public Administration (100.0%), and Transportation & Warehousing (96.0%).
| Industry | Male | Female |
| Agriculture, Fishing & Hunting | 0 (0.0%) | 0 (0.0%) |
| Mining, Quarrying, & Extraction | 0 (0.0%) | 0 (0.0%) |
| Construction | 0 (0.0%) | 0 (0.0%) |
| Manufacturing | 0 (0.0%) | 2 (100.0%) |
| Wholesale Trade | 0 (0.0%) | 0 (0.0%) |
| Retail Trade | 3 (100.0%) | 0 (0.0%) |
| Transportation & Warehousing | 1 (4.0%) | 24 (96.0%) |
| Utilities | 0 (0.0%) | 0 (0.0%) |
| Information | 0 (0.0%) | 0 (0.0%) |
| Finance & Insurance | 0 (0.0%) | 0 (0.0%) |
| Real Estate, Rental & Leasing | 0 (0.0%) | 0 (0.0%) |
| Professional & Scientific | 0 (0.0%) | 0 (0.0%) |
| Enterprise Management | 0 (0.0%) | 0 (0.0%) |
| Administrative & Support | 0 (0.0%) | 0 (0.0%) |
| Educational Services | 0 (0.0%) | 0 (0.0%) |
| Health Care & Social Assistance | 0 (0.0%) | 0 (0.0%) |
| Arts, Entertainment & Recreation | 0 (0.0%) | 0 (0.0%) |
| Accommodation & Food Services | 0 (0.0%) | 0 (0.0%) |
| Public Administration | 0 (0.0%) | 2 (100.0%) |
| Total | 4 (12.5%) | 28 (87.5%) |
Education in Eagle Harbor
School Enrollment in Eagle Harbor
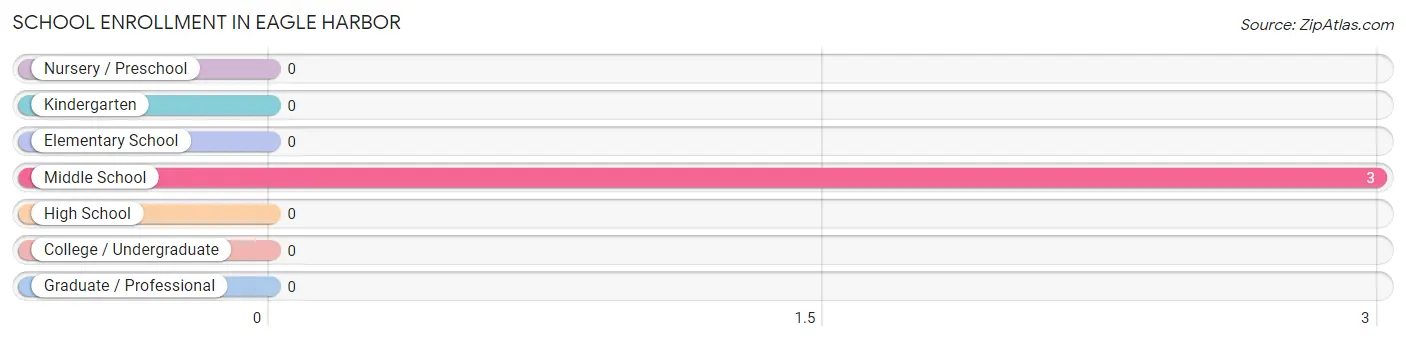
| School Level | # Students | % Students |
| Nursery / Preschool | 0 | 0.0% |
| Kindergarten | 0 | 0.0% |
| Elementary School | 0 | 0.0% |
| Middle School | 3 | 100.0% |
| High School | 0 | 0.0% |
| College / Undergraduate | 0 | 0.0% |
| Graduate / Professional | 0 | 0.0% |
| Total | 3 | 100.0% |
School Enrollment by Age by Funding Source in Eagle Harbor
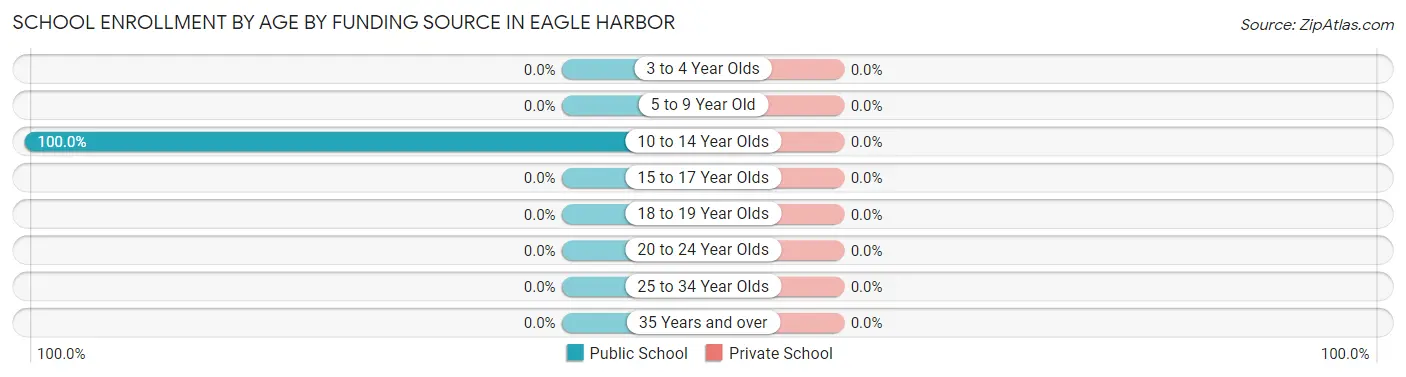
| Age Bracket | Public School | Private School |
| 3 to 4 Year Olds | 0 (0.0%) | 0 (0.0%) |
| 5 to 9 Year Old | 0 (0.0%) | 0 (0.0%) |
| 10 to 14 Year Olds | 3 (100.0%) | 0 (0.0%) |
| 15 to 17 Year Olds | 0 (0.0%) | 0 (0.0%) |
| 18 to 19 Year Olds | 0 (0.0%) | 0 (0.0%) |
| 20 to 24 Year Olds | 0 (0.0%) | 0 (0.0%) |
| 25 to 34 Year Olds | 0 (0.0%) | 0 (0.0%) |
| 35 Years and over | 0 (0.0%) | 0 (0.0%) |
| Total | 3 (100.0%) | 0 (0.0%) |
Educational Attainment by Field of Study in Eagle Harbor
, and science & technology (2 | 100.0%) are the most common fields of study among 2 individuals in Eagle Harbor who have obtained a bachelor's degree or higher.
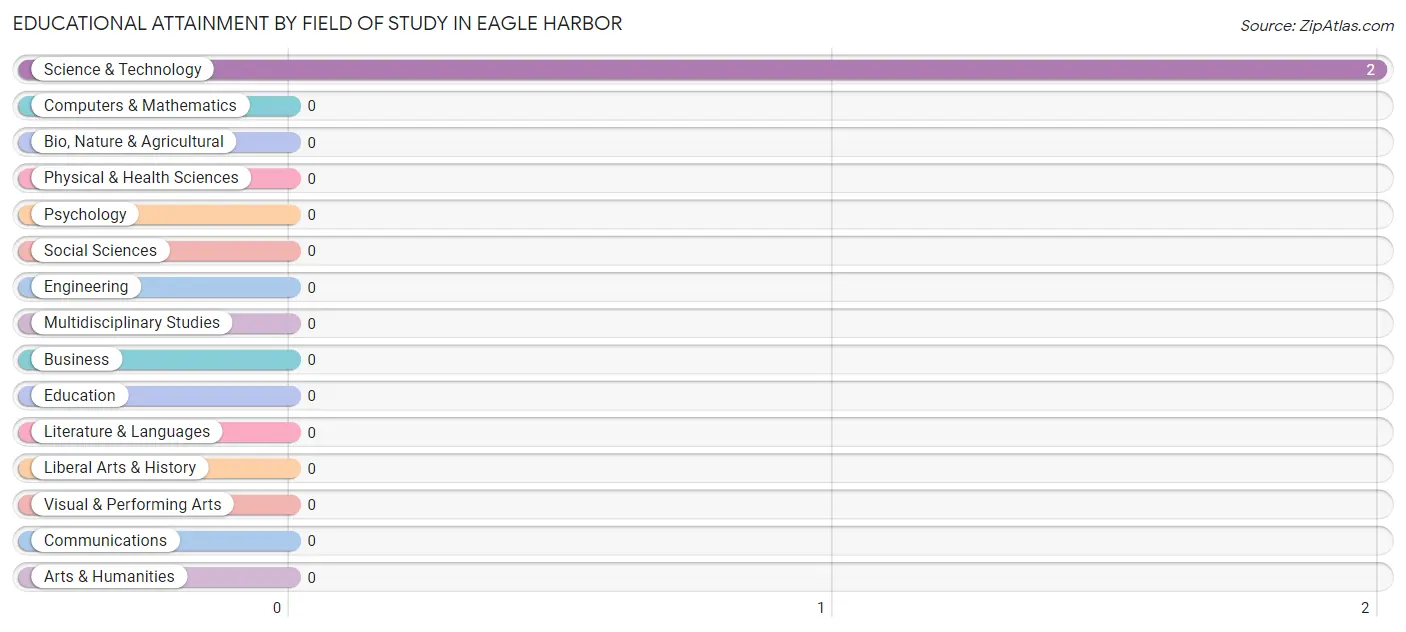
| Field of Study | # Graduates | % Graduates |
| Computers & Mathematics | 0 | 0.0% |
| Bio, Nature & Agricultural | 0 | 0.0% |
| Physical & Health Sciences | 0 | 0.0% |
| Psychology | 0 | 0.0% |
| Social Sciences | 0 | 0.0% |
| Engineering | 0 | 0.0% |
| Multidisciplinary Studies | 0 | 0.0% |
| Science & Technology | 2 | 100.0% |
| Business | 0 | 0.0% |
| Education | 0 | 0.0% |
| Literature & Languages | 0 | 0.0% |
| Liberal Arts & History | 0 | 0.0% |
| Visual & Performing Arts | 0 | 0.0% |
| Communications | 0 | 0.0% |
| Arts & Humanities | 0 | 0.0% |
| Total | 2 | 100.0% |
Transportation & Commute in Eagle Harbor
Vehicle Availability by Sex in Eagle Harbor
The most prevalent vehicle ownership categories in Eagle Harbor are males with 1 vehicle (3, accounting for 75.0%) and females with 1 vehicle (0, making up 10.7%).
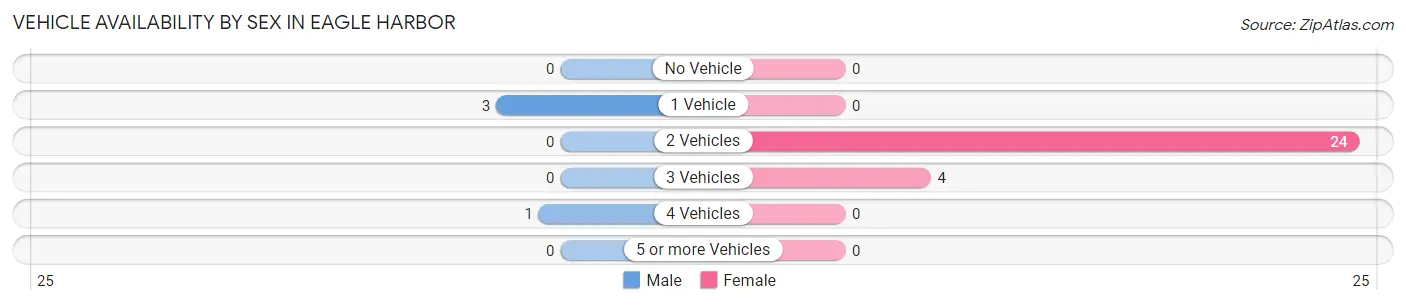
| Vehicles Available | Male | Female |
| No Vehicle | 0 (0.0%) | 0 (0.0%) |
| 1 Vehicle | 3 (75.0%) | 0 (0.0%) |
| 2 Vehicles | 0 (0.0%) | 24 (85.7%) |
| 3 Vehicles | 0 (0.0%) | 4 (14.3%) |
| 4 Vehicles | 1 (25.0%) | 0 (0.0%) |
| 5 or more Vehicles | 0 (0.0%) | 0 (0.0%) |
| Total | 4 (100.0%) | 28 (100.0%) |
Commute Time in Eagle Harbor
The most frequently occuring commute durations in Eagle Harbor are 35 to 39 minutes (3 commuters, 50.0%), 60 to 89 minutes (2 commuters, 33.3%), and 25 to 29 minutes (1 commuters, 16.7%).
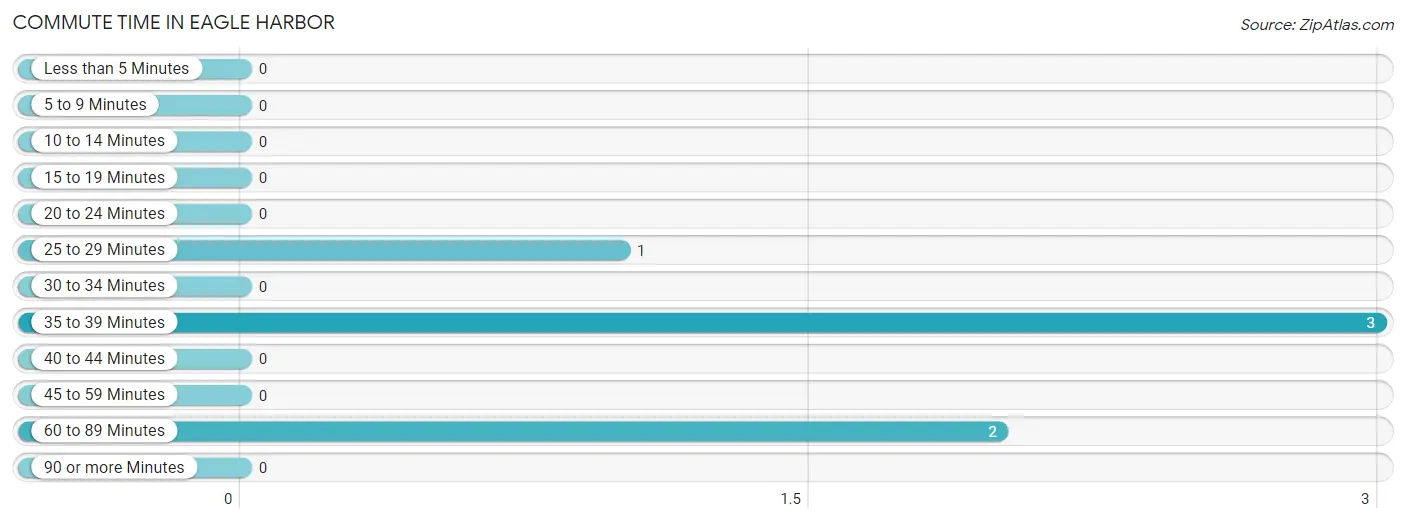
| Commute Time | # Commuters | % Commuters |
| Less than 5 Minutes | 0 | 0.0% |
| 5 to 9 Minutes | 0 | 0.0% |
| 10 to 14 Minutes | 0 | 0.0% |
| 15 to 19 Minutes | 0 | 0.0% |
| 20 to 24 Minutes | 0 | 0.0% |
| 25 to 29 Minutes | 1 | 16.7% |
| 30 to 34 Minutes | 0 | 0.0% |
| 35 to 39 Minutes | 3 | 50.0% |
| 40 to 44 Minutes | 0 | 0.0% |
| 45 to 59 Minutes | 0 | 0.0% |
| 60 to 89 Minutes | 2 | 33.3% |
| 90 or more Minutes | 0 | 0.0% |
Commute Time by Sex in Eagle Harbor
The most common commute times in Eagle Harbor are 35 to 39 minutes (3 commuters, 75.0%) for males and 60 to 89 minutes (2 commuters, 100.0%) for females.
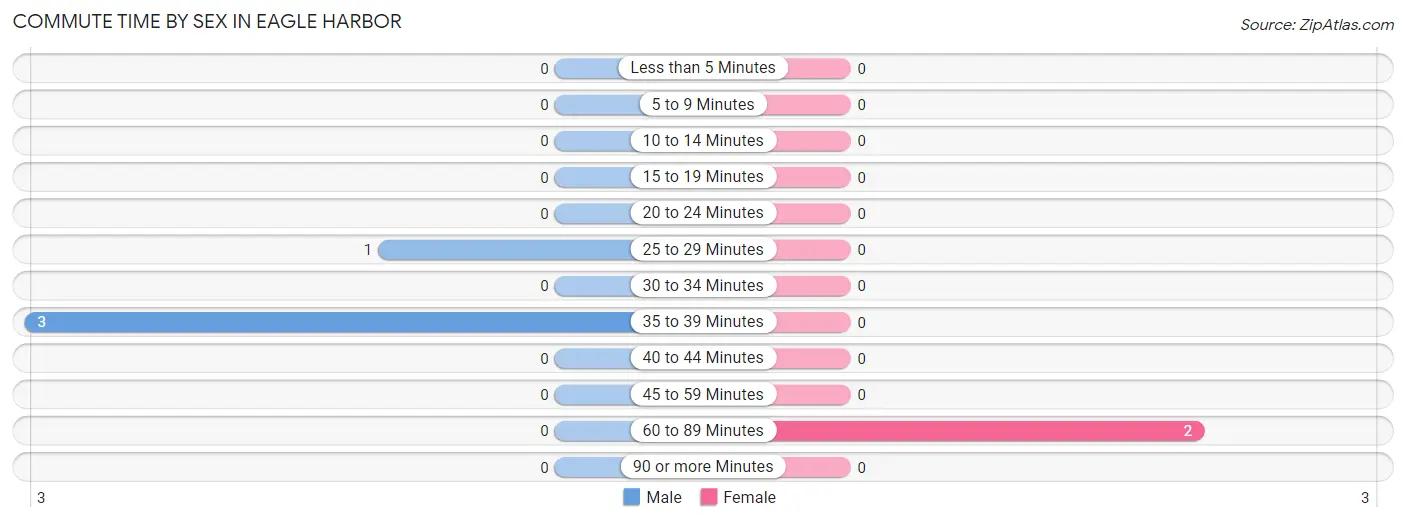
| Commute Time | Male | Female |
| Less than 5 Minutes | 0 (0.0%) | 0 (0.0%) |
| 5 to 9 Minutes | 0 (0.0%) | 0 (0.0%) |
| 10 to 14 Minutes | 0 (0.0%) | 0 (0.0%) |
| 15 to 19 Minutes | 0 (0.0%) | 0 (0.0%) |
| 20 to 24 Minutes | 0 (0.0%) | 0 (0.0%) |
| 25 to 29 Minutes | 1 (25.0%) | 0 (0.0%) |
| 30 to 34 Minutes | 0 (0.0%) | 0 (0.0%) |
| 35 to 39 Minutes | 3 (75.0%) | 0 (0.0%) |
| 40 to 44 Minutes | 0 (0.0%) | 0 (0.0%) |
| 45 to 59 Minutes | 0 (0.0%) | 0 (0.0%) |
| 60 to 89 Minutes | 0 (0.0%) | 2 (100.0%) |
| 90 or more Minutes | 0 (0.0%) | 0 (0.0%) |
Time of Departure to Work by Sex in Eagle Harbor
The most frequent times of departure to work in Eagle Harbor are 7:00 AM to 7:29 AM (3, 75.0%) for males and 12:00 AM to 4:59 AM (2, 100.0%) for females.
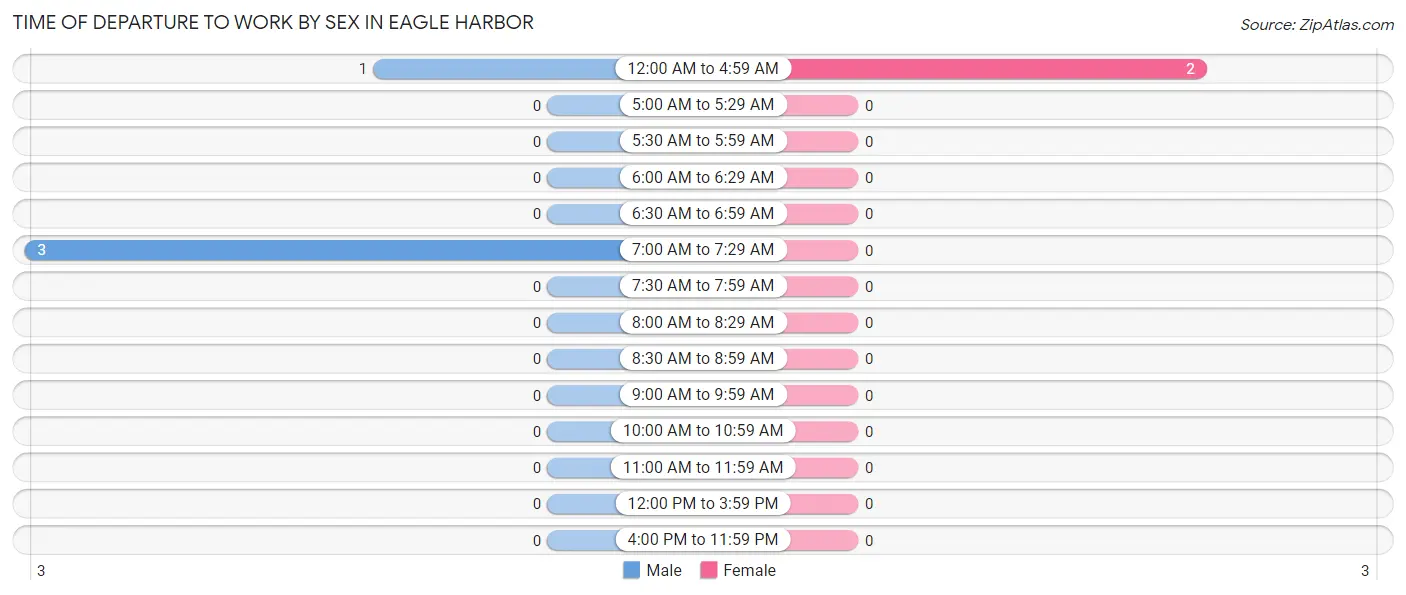
| Time of Departure | Male | Female |
| 12:00 AM to 4:59 AM | 1 (25.0%) | 2 (100.0%) |
| 5:00 AM to 5:29 AM | 0 (0.0%) | 0 (0.0%) |
| 5:30 AM to 5:59 AM | 0 (0.0%) | 0 (0.0%) |
| 6:00 AM to 6:29 AM | 0 (0.0%) | 0 (0.0%) |
| 6:30 AM to 6:59 AM | 0 (0.0%) | 0 (0.0%) |
| 7:00 AM to 7:29 AM | 3 (75.0%) | 0 (0.0%) |
| 7:30 AM to 7:59 AM | 0 (0.0%) | 0 (0.0%) |
| 8:00 AM to 8:29 AM | 0 (0.0%) | 0 (0.0%) |
| 8:30 AM to 8:59 AM | 0 (0.0%) | 0 (0.0%) |
| 9:00 AM to 9:59 AM | 0 (0.0%) | 0 (0.0%) |
| 10:00 AM to 10:59 AM | 0 (0.0%) | 0 (0.0%) |
| 11:00 AM to 11:59 AM | 0 (0.0%) | 0 (0.0%) |
| 12:00 PM to 3:59 PM | 0 (0.0%) | 0 (0.0%) |
| 4:00 PM to 11:59 PM | 0 (0.0%) | 0 (0.0%) |
| Total | 4 (100.0%) | 2 (100.0%) |
Housing Occupancy in Eagle Harbor
Occupancy by Ownership in Eagle Harbor
Of the total 36 dwellings in Eagle Harbor, owner-occupied units account for 32 (88.9%), while renter-occupied units make up 4 (11.1%).
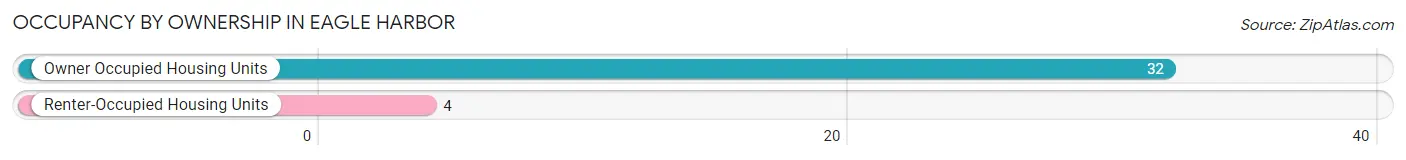
| Occupancy | # Housing Units | % Housing Units |
| Owner Occupied Housing Units | 32 | 88.9% |
| Renter-Occupied Housing Units | 4 | 11.1% |
| Total Occupied Housing Units | 36 | 100.0% |
Occupancy by Household Size in Eagle Harbor
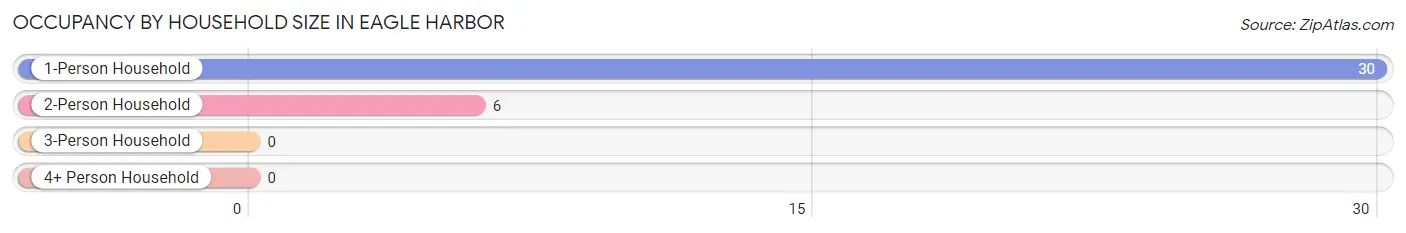
| Household Size | # Housing Units | % Housing Units |
| 1-Person Household | 30 | 83.3% |
| 2-Person Household | 6 | 16.7% |
| 3-Person Household | 0 | 0.0% |
| 4+ Person Household | 0 | 0.0% |
| Total Housing Units | 36 | 100.0% |
Occupancy by Ownership by Household Size in Eagle Harbor
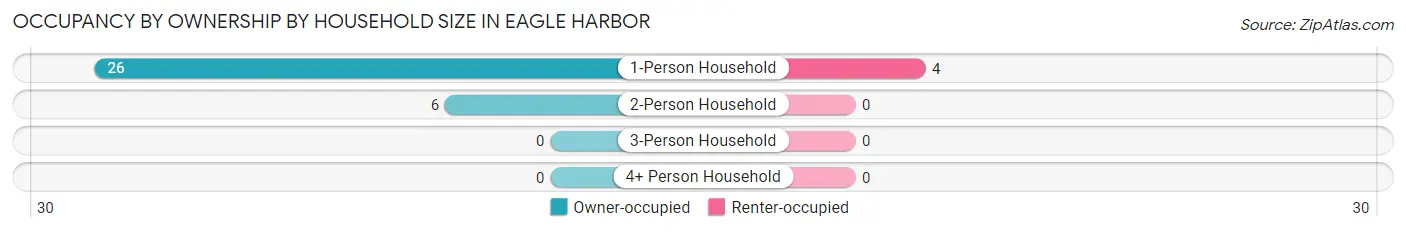
| Household Size | Owner-occupied | Renter-occupied |
| 1-Person Household | 26 (86.7%) | 4 (13.3%) |
| 2-Person Household | 6 (100.0%) | 0 (0.0%) |
| 3-Person Household | 0 (0.0%) | 0 (0.0%) |
| 4+ Person Household | 0 (0.0%) | 0 (0.0%) |
| Total Housing Units | 32 (88.9%) | 4 (11.1%) |
Occupancy by Educational Attainment in Eagle Harbor
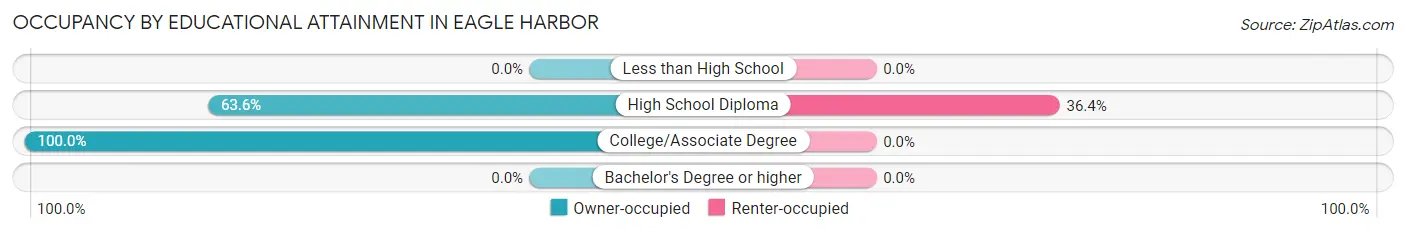
| Household Size | Owner-occupied | Renter-occupied |
| Less than High School | 0 (0.0%) | 0 (0.0%) |
| High School Diploma | 7 (63.6%) | 4 (36.4%) |
| College/Associate Degree | 25 (100.0%) | 0 (0.0%) |
| Bachelor's Degree or higher | 0 (0.0%) | 0 (0.0%) |
Occupancy by Age of Householder in Eagle Harbor
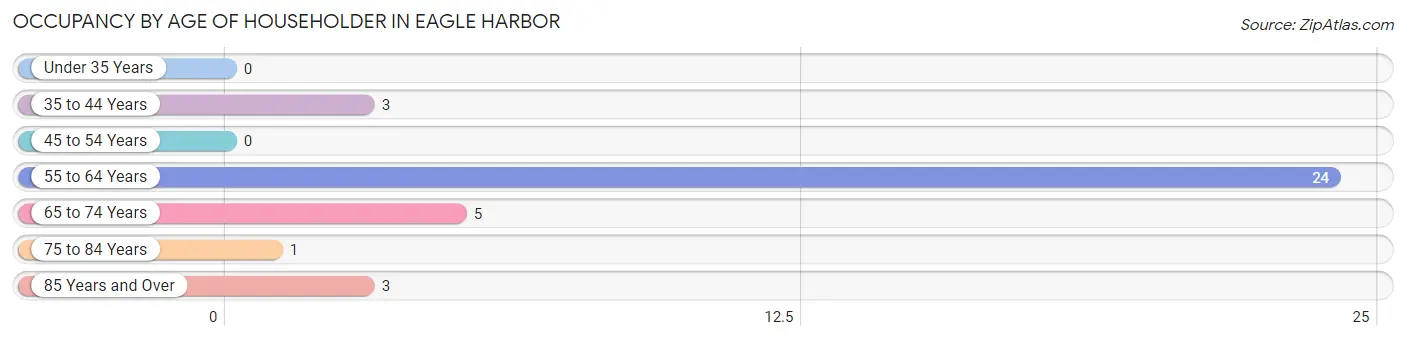
| Age Bracket | # Households | % Households |
| Under 35 Years | 0 | 0.0% |
| 35 to 44 Years | 3 | 8.3% |
| 45 to 54 Years | 0 | 0.0% |
| 55 to 64 Years | 24 | 66.7% |
| 65 to 74 Years | 5 | 13.9% |
| 75 to 84 Years | 1 | 2.8% |
| 85 Years and Over | 3 | 8.3% |
| Total | 36 | 100.0% |
Housing Finances in Eagle Harbor
Median Income by Occupancy in Eagle Harbor
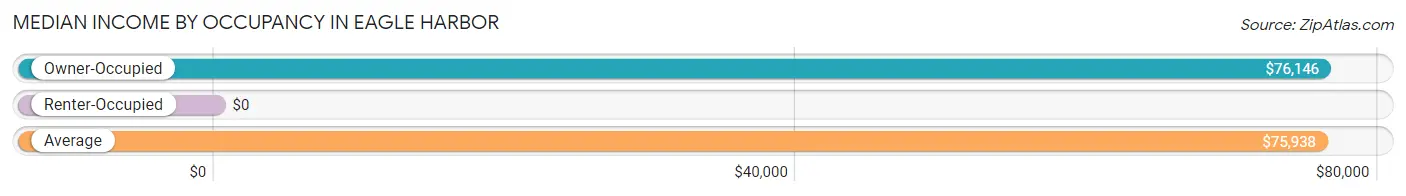
| Occupancy Type | # Households | Median Income |
| Owner-Occupied | 32 (88.9%) | $76,146 |
| Renter-Occupied | 4 (11.1%) | $0 |
| Average | 36 (100.0%) | $75,938 |
Occupancy by Householder Income Bracket in Eagle Harbor
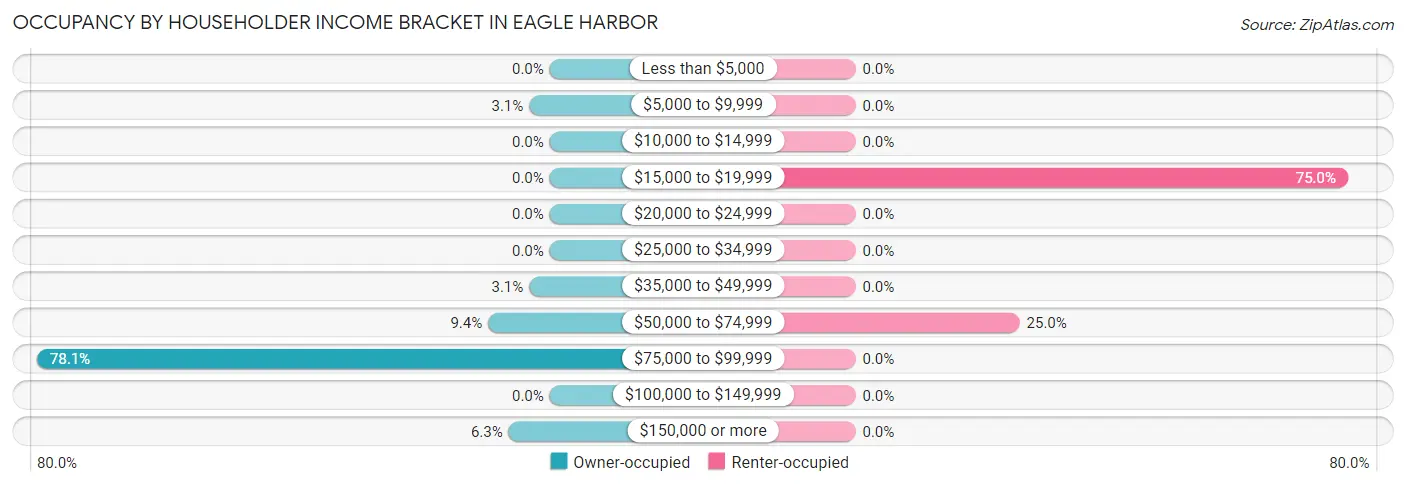
| Income Bracket | Owner-occupied | Renter-occupied |
| Less than $5,000 | 0 (0.0%) | 0 (0.0%) |
| $5,000 to $9,999 | 1 (3.1%) | 0 (0.0%) |
| $10,000 to $14,999 | 0 (0.0%) | 0 (0.0%) |
| $15,000 to $19,999 | 0 (0.0%) | 3 (75.0%) |
| $20,000 to $24,999 | 0 (0.0%) | 0 (0.0%) |
| $25,000 to $34,999 | 0 (0.0%) | 0 (0.0%) |
| $35,000 to $49,999 | 1 (3.1%) | 0 (0.0%) |
| $50,000 to $74,999 | 3 (9.4%) | 1 (25.0%) |
| $75,000 to $99,999 | 25 (78.1%) | 0 (0.0%) |
| $100,000 to $149,999 | 0 (0.0%) | 0 (0.0%) |
| $150,000 or more | 2 (6.2%) | 0 (0.0%) |
| Total | 32 (100.0%) | 4 (100.0%) |
Monthly Housing Cost Tiers in Eagle Harbor
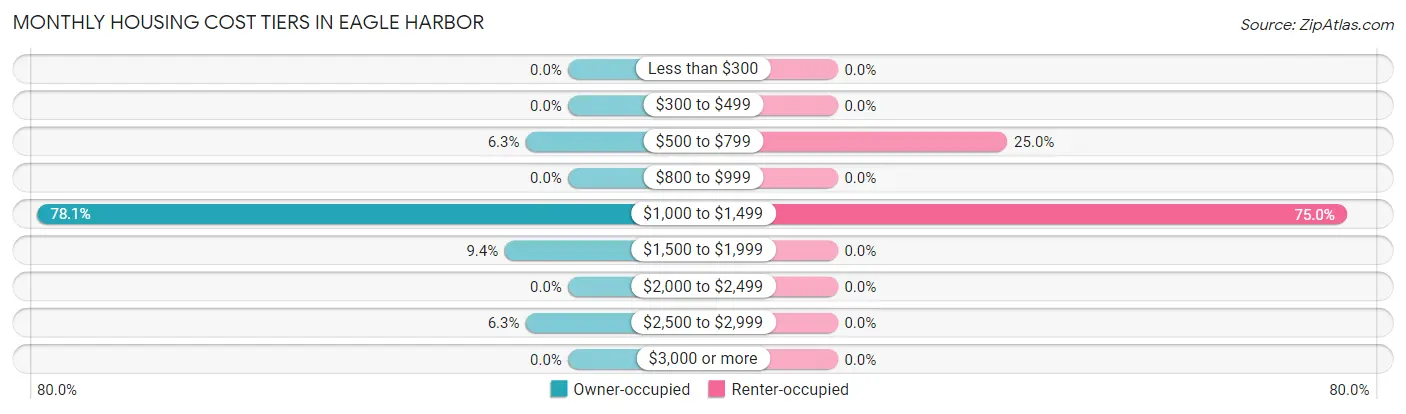
| Monthly Cost | Owner-occupied | Renter-occupied |
| Less than $300 | 0 (0.0%) | 0 (0.0%) |
| $300 to $499 | 0 (0.0%) | 0 (0.0%) |
| $500 to $799 | 2 (6.2%) | 1 (25.0%) |
| $800 to $999 | 0 (0.0%) | 0 (0.0%) |
| $1,000 to $1,499 | 25 (78.1%) | 3 (75.0%) |
| $1,500 to $1,999 | 3 (9.4%) | 0 (0.0%) |
| $2,000 to $2,499 | 0 (0.0%) | 0 (0.0%) |
| $2,500 to $2,999 | 2 (6.2%) | 0 (0.0%) |
| $3,000 or more | 0 (0.0%) | 0 (0.0%) |
| Total | 32 (100.0%) | 4 (100.0%) |
Physical Housing Characteristics in Eagle Harbor
Housing Structures in Eagle Harbor
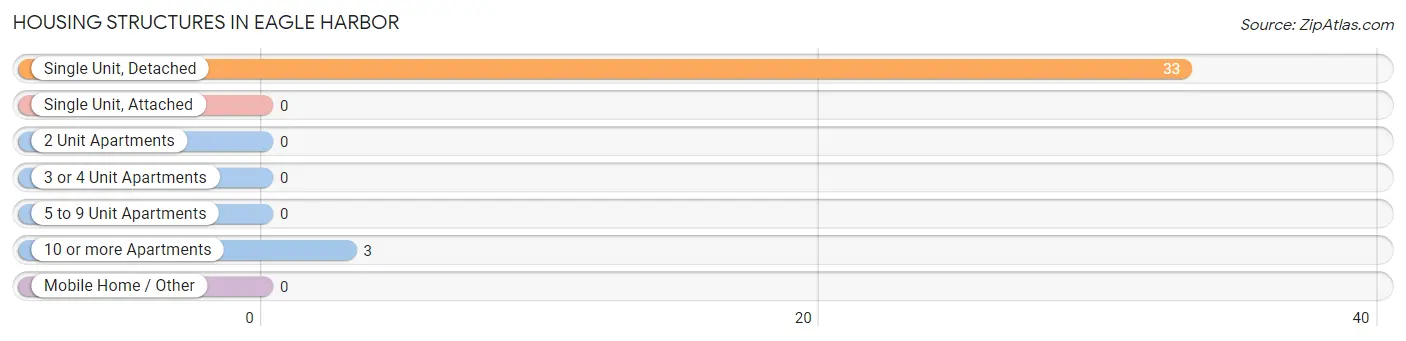
| Structure Type | # Housing Units | % Housing Units |
| Single Unit, Detached | 33 | 91.7% |
| Single Unit, Attached | 0 | 0.0% |
| 2 Unit Apartments | 0 | 0.0% |
| 3 or 4 Unit Apartments | 0 | 0.0% |
| 5 to 9 Unit Apartments | 0 | 0.0% |
| 10 or more Apartments | 3 | 8.3% |
| Mobile Home / Other | 0 | 0.0% |
| Total | 36 | 100.0% |
Housing Structures by Occupancy in Eagle Harbor
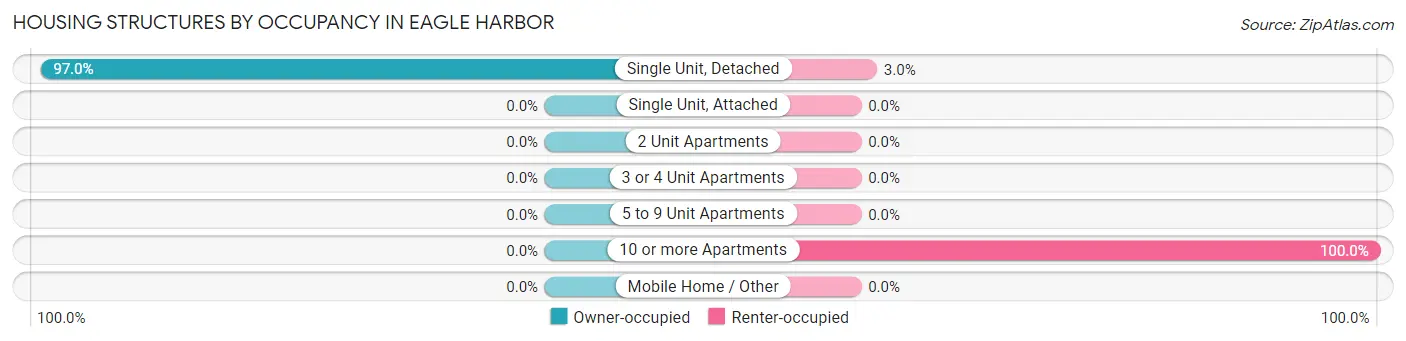
| Structure Type | Owner-occupied | Renter-occupied |
| Single Unit, Detached | 32 (97.0%) | 1 (3.0%) |
| Single Unit, Attached | 0 (0.0%) | 0 (0.0%) |
| 2 Unit Apartments | 0 (0.0%) | 0 (0.0%) |
| 3 or 4 Unit Apartments | 0 (0.0%) | 0 (0.0%) |
| 5 to 9 Unit Apartments | 0 (0.0%) | 0 (0.0%) |
| 10 or more Apartments | 0 (0.0%) | 3 (100.0%) |
| Mobile Home / Other | 0 (0.0%) | 0 (0.0%) |
| Total | 32 (88.9%) | 4 (11.1%) |
Housing Structures by Number of Rooms in Eagle Harbor
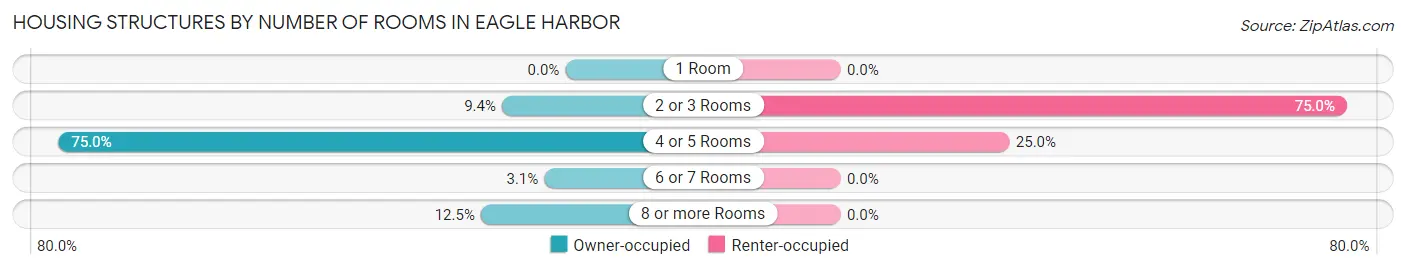
| Number of Rooms | Owner-occupied | Renter-occupied |
| 1 Room | 0 (0.0%) | 0 (0.0%) |
| 2 or 3 Rooms | 3 (9.4%) | 3 (75.0%) |
| 4 or 5 Rooms | 24 (75.0%) | 1 (25.0%) |
| 6 or 7 Rooms | 1 (3.1%) | 0 (0.0%) |
| 8 or more Rooms | 4 (12.5%) | 0 (0.0%) |
| Total | 32 (100.0%) | 4 (100.0%) |
Housing Structure by Heating Type in Eagle Harbor
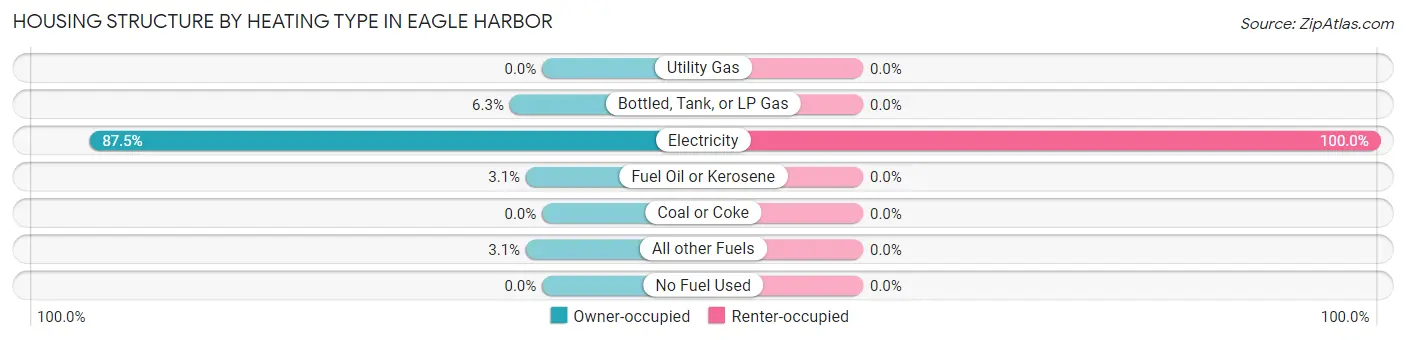
| Heating Type | Owner-occupied | Renter-occupied |
| Utility Gas | 0 (0.0%) | 0 (0.0%) |
| Bottled, Tank, or LP Gas | 2 (6.2%) | 0 (0.0%) |
| Electricity | 28 (87.5%) | 4 (100.0%) |
| Fuel Oil or Kerosene | 1 (3.1%) | 0 (0.0%) |
| Coal or Coke | 0 (0.0%) | 0 (0.0%) |
| All other Fuels | 1 (3.1%) | 0 (0.0%) |
| No Fuel Used | 0 (0.0%) | 0 (0.0%) |
| Total | 32 (100.0%) | 4 (100.0%) |
Household Vehicle Usage in Eagle Harbor
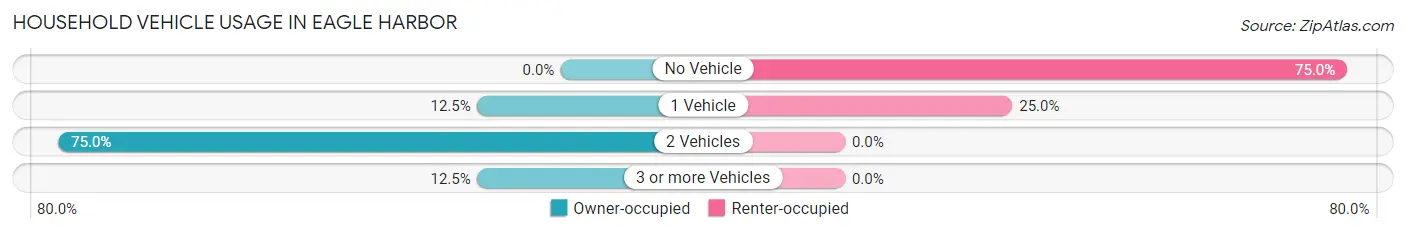
| Vehicles per Household | Owner-occupied | Renter-occupied |
| No Vehicle | 0 (0.0%) | 3 (75.0%) |
| 1 Vehicle | 4 (12.5%) | 1 (25.0%) |
| 2 Vehicles | 24 (75.0%) | 0 (0.0%) |
| 3 or more Vehicles | 4 (12.5%) | 0 (0.0%) |
| Total | 32 (100.0%) | 4 (100.0%) |
Real Estate & Mortgages in Eagle Harbor
Real Estate and Mortgage Overview in Eagle Harbor
| Characteristic | Without Mortgage | With Mortgage |
| Housing Units | 1 | 31 |
| Median Property Value | - | - |
| Median Household Income | - | - |
| Monthly Housing Costs | - | - |
| Real Estate Taxes | - | - |
Property Value by Mortgage Status in Eagle Harbor
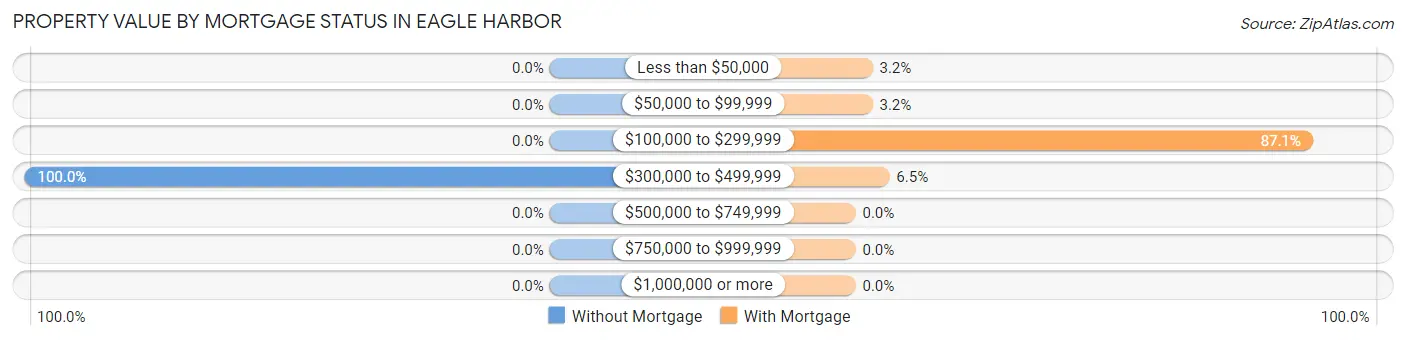
| Property Value | Without Mortgage | With Mortgage |
| Less than $50,000 | 0 (0.0%) | 1 (3.2%) |
| $50,000 to $99,999 | 0 (0.0%) | 1 (3.2%) |
| $100,000 to $299,999 | 0 (0.0%) | 27 (87.1%) |
| $300,000 to $499,999 | 1 (100.0%) | 2 (6.5%) |
| $500,000 to $749,999 | 0 (0.0%) | 0 (0.0%) |
| $750,000 to $999,999 | 0 (0.0%) | 0 (0.0%) |
| $1,000,000 or more | 0 (0.0%) | 0 (0.0%) |
| Total | 1 (100.0%) | 31 (100.0%) |
Household Income by Mortgage Status in Eagle Harbor
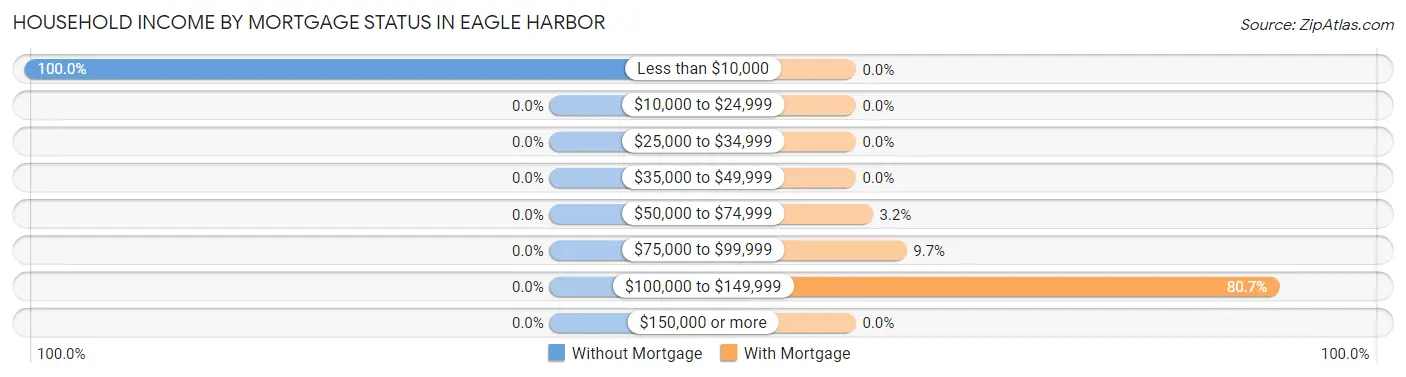
| Household Income | Without Mortgage | With Mortgage |
| Less than $10,000 | 1 (100.0%) | 0 (0.0%) |
| $10,000 to $24,999 | 0 (0.0%) | 0 (0.0%) |
| $25,000 to $34,999 | 0 (0.0%) | 0 (0.0%) |
| $35,000 to $49,999 | 0 (0.0%) | 0 (0.0%) |
| $50,000 to $74,999 | 0 (0.0%) | 1 (3.2%) |
| $75,000 to $99,999 | 0 (0.0%) | 3 (9.7%) |
| $100,000 to $149,999 | 0 (0.0%) | 25 (80.6%) |
| $150,000 or more | 0 (0.0%) | 0 (0.0%) |
| Total | 1 (100.0%) | 31 (100.0%) |
Property Value to Household Income Ratio in Eagle Harbor
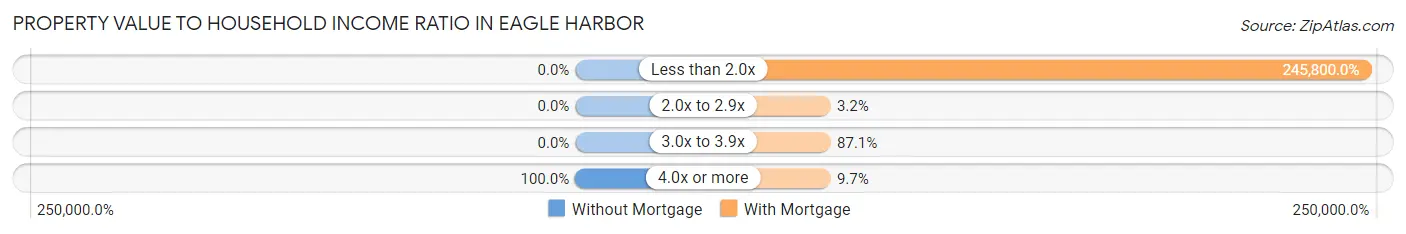
| Value-to-Income Ratio | Without Mortgage | With Mortgage |
| Less than 2.0x | 0 (0.0%) | 76,198 (245,800.0%) |
| 2.0x to 2.9x | 0 (0.0%) | 1 (3.2%) |
| 3.0x to 3.9x | 0 (0.0%) | 27 (87.1%) |
| 4.0x or more | 1 (100.0%) | 3 (9.7%) |
| Total | 1 (100.0%) | 31 (100.0%) |
Real Estate Taxes by Mortgage Status in Eagle Harbor
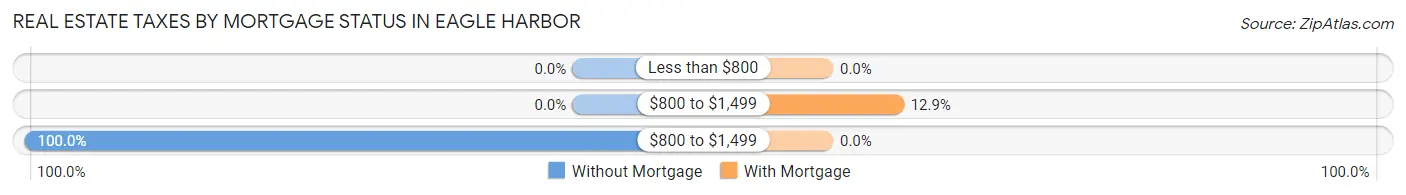
| Property Taxes | Without Mortgage | With Mortgage |
| Less than $800 | 0 (0.0%) | 0 (0.0%) |
| $800 to $1,499 | 0 (0.0%) | 4 (12.9%) |
| $800 to $1,499 | 1 (100.0%) | 0 (0.0%) |
| Total | 1 (100.0%) | 31 (100.0%) |
Health & Disability in Eagle Harbor
Health Insurance Coverage by Age in Eagle Harbor
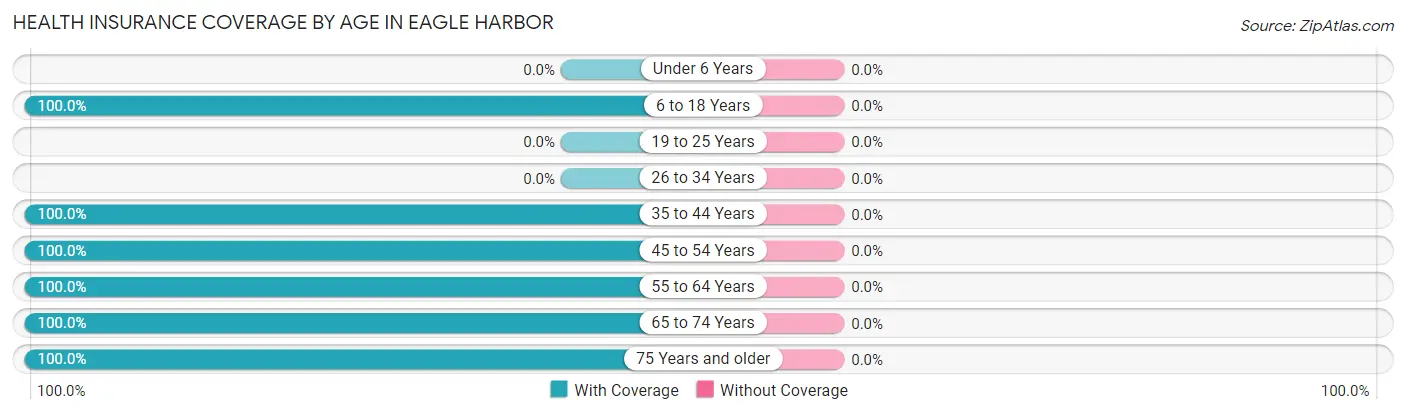
| Age Bracket | With Coverage | Without Coverage |
| Under 6 Years | 0 (0.0%) | 0 (0.0%) |
| 6 to 18 Years | 3 (100.0%) | 0 (0.0%) |
| 19 to 25 Years | 0 (0.0%) | 0 (0.0%) |
| 26 to 34 Years | 0 (0.0%) | 0 (0.0%) |
| 35 to 44 Years | 3 (100.0%) | 0 (0.0%) |
| 45 to 54 Years | 2 (100.0%) | 0 (0.0%) |
| 55 to 64 Years | 24 (100.0%) | 0 (0.0%) |
| 65 to 74 Years | 6 (100.0%) | 0 (0.0%) |
| 75 Years and older | 4 (100.0%) | 0 (0.0%) |
| Total | 42 (100.0%) | 0 (0.0%) |
Health Insurance Coverage by Citizenship Status in Eagle Harbor
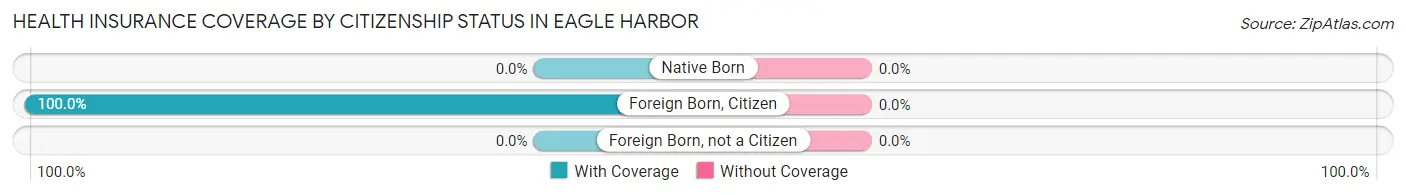
| Citizenship Status | With Coverage | Without Coverage |
| Native Born | 0 (0.0%) | 0 (0.0%) |
| Foreign Born, Citizen | 3 (100.0%) | 0 (0.0%) |
| Foreign Born, not a Citizen | 0 (0.0%) | 0 (0.0%) |
Health Insurance Coverage by Household Income in Eagle Harbor
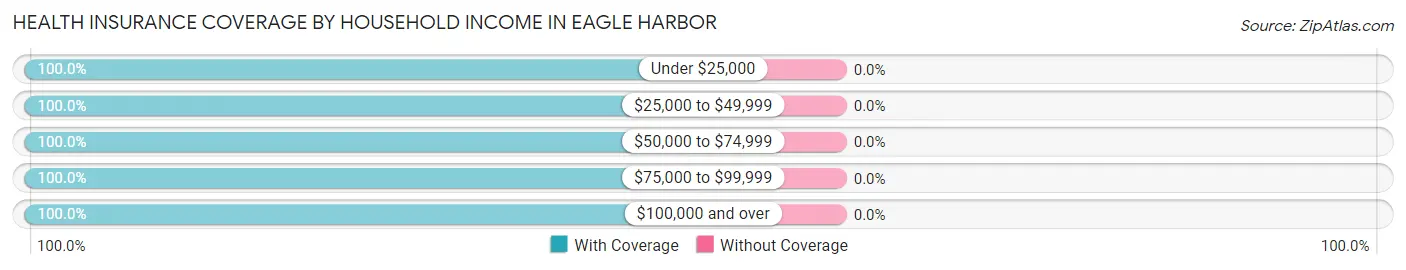
| Household Income | With Coverage | Without Coverage |
| Under $25,000 | 4 (100.0%) | 0 (0.0%) |
| $25,000 to $49,999 | 2 (100.0%) | 0 (0.0%) |
| $50,000 to $74,999 | 7 (100.0%) | 0 (0.0%) |
| $75,000 to $99,999 | 25 (100.0%) | 0 (0.0%) |
| $100,000 and over | 4 (100.0%) | 0 (0.0%) |
Public vs Private Health Insurance Coverage by Age in Eagle Harbor
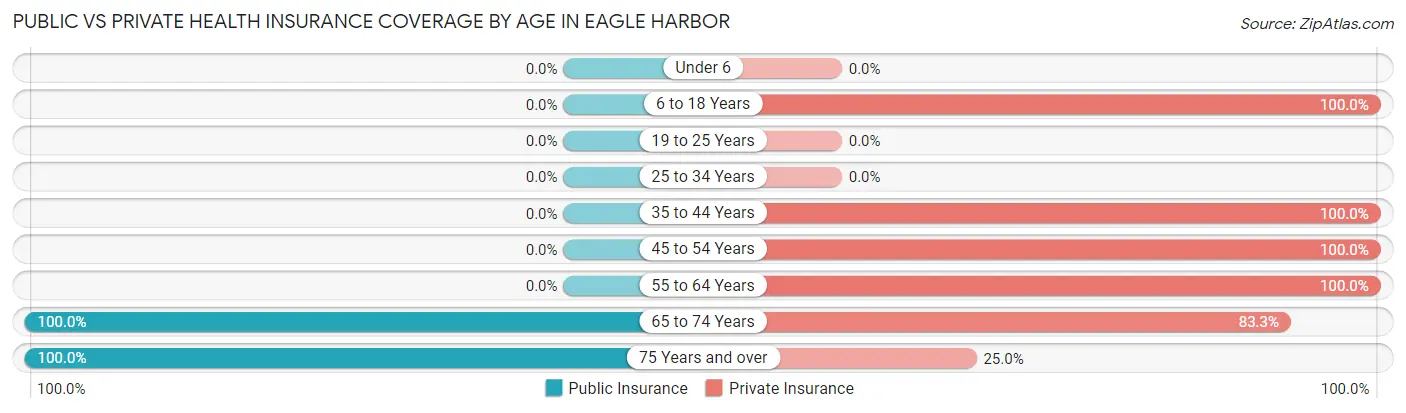
| Age Bracket | Public Insurance | Private Insurance |
| Under 6 | 0 (0.0%) | 0 (0.0%) |
| 6 to 18 Years | 0 (0.0%) | 3 (100.0%) |
| 19 to 25 Years | 0 (0.0%) | 0 (0.0%) |
| 25 to 34 Years | 0 (0.0%) | 0 (0.0%) |
| 35 to 44 Years | 0 (0.0%) | 3 (100.0%) |
| 45 to 54 Years | 0 (0.0%) | 2 (100.0%) |
| 55 to 64 Years | 0 (0.0%) | 24 (100.0%) |
| 65 to 74 Years | 6 (100.0%) | 5 (83.3%) |
| 75 Years and over | 4 (100.0%) | 1 (25.0%) |
| Total | 10 (23.8%) | 38 (90.5%) |
Disability Status by Sex by Age in Eagle Harbor
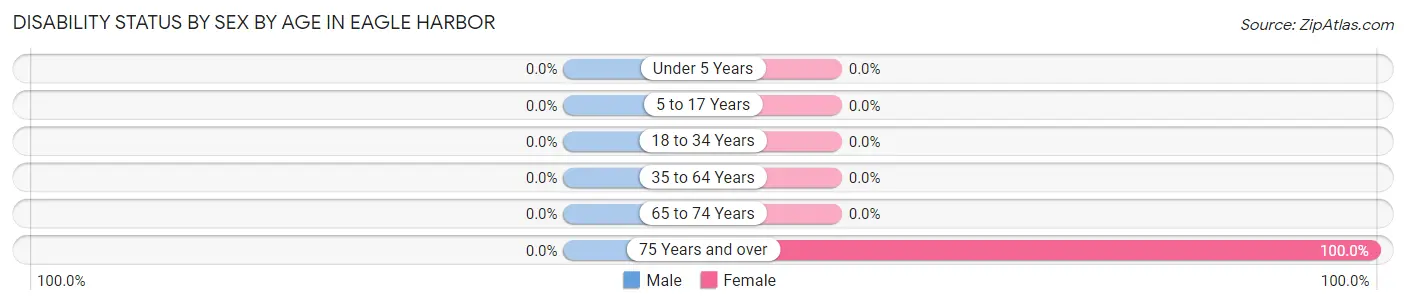
| Age Bracket | Male | Female |
| Under 5 Years | 0 (0.0%) | 0 (0.0%) |
| 5 to 17 Years | 0 (0.0%) | 0 (0.0%) |
| 18 to 34 Years | 0 (0.0%) | 0 (0.0%) |
| 35 to 64 Years | 0 (0.0%) | 0 (0.0%) |
| 65 to 74 Years | 0 (0.0%) | 0 (0.0%) |
| 75 Years and over | 0 (0.0%) | 3 (100.0%) |
Disability Class by Sex by Age in Eagle Harbor
Disability Class: Hearing Difficulty
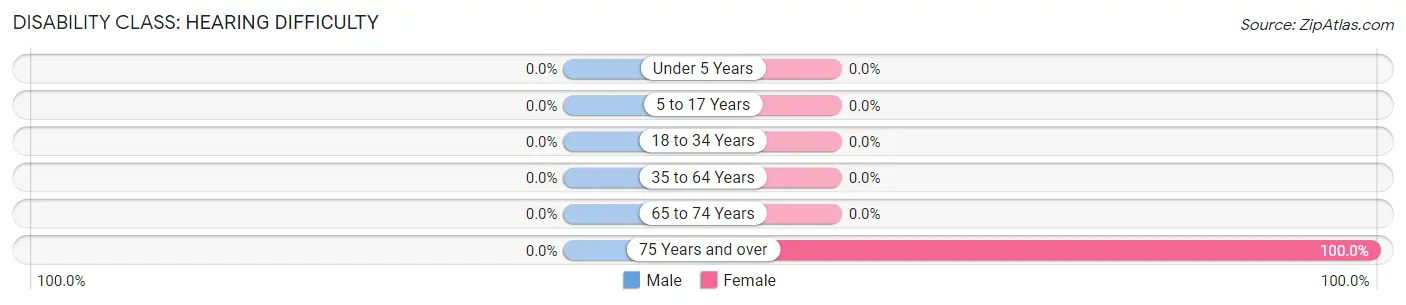
| Age Bracket | Male | Female |
| Under 5 Years | 0 (0.0%) | 0 (0.0%) |
| 5 to 17 Years | 0 (0.0%) | 0 (0.0%) |
| 18 to 34 Years | 0 (0.0%) | 0 (0.0%) |
| 35 to 64 Years | 0 (0.0%) | 0 (0.0%) |
| 65 to 74 Years | 0 (0.0%) | 0 (0.0%) |
| 75 Years and over | 0 (0.0%) | 3 (100.0%) |
Disability Class: Vision Difficulty
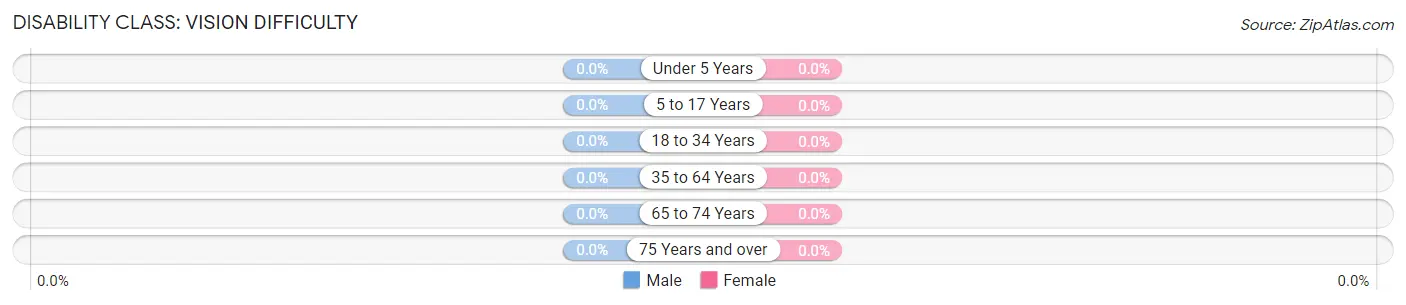
| Age Bracket | Male | Female |
| Under 5 Years | 0 (0.0%) | 0 (0.0%) |
| 5 to 17 Years | 0 (0.0%) | 0 (0.0%) |
| 18 to 34 Years | 0 (0.0%) | 0 (0.0%) |
| 35 to 64 Years | 0 (0.0%) | 0 (0.0%) |
| 65 to 74 Years | 0 (0.0%) | 0 (0.0%) |
| 75 Years and over | 0 (0.0%) | 0 (0.0%) |
Disability Class: Cognitive Difficulty
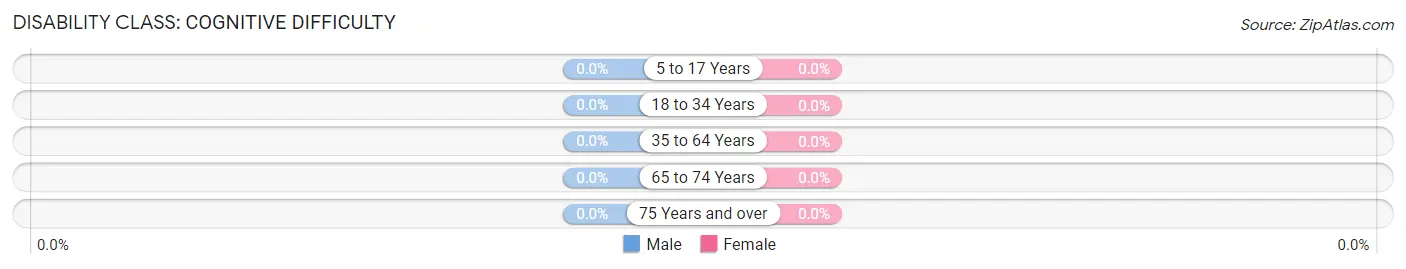
| Age Bracket | Male | Female |
| 5 to 17 Years | 0 (0.0%) | 0 (0.0%) |
| 18 to 34 Years | 0 (0.0%) | 0 (0.0%) |
| 35 to 64 Years | 0 (0.0%) | 0 (0.0%) |
| 65 to 74 Years | 0 (0.0%) | 0 (0.0%) |
| 75 Years and over | 0 (0.0%) | 0 (0.0%) |
Disability Class: Ambulatory Difficulty
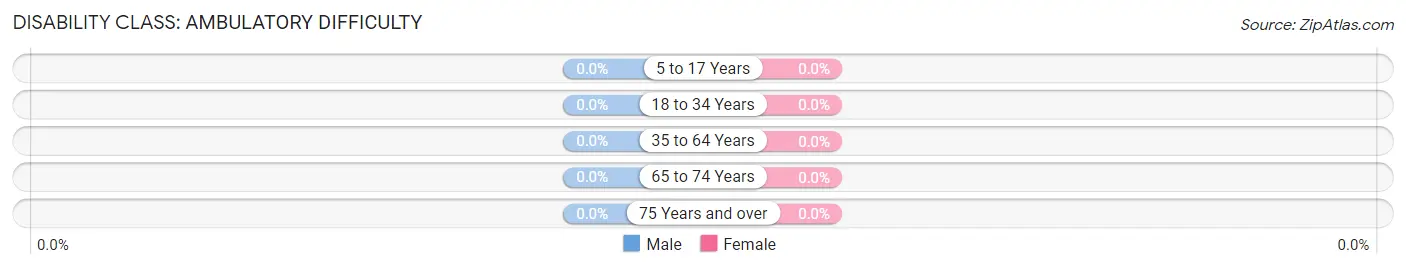
| Age Bracket | Male | Female |
| 5 to 17 Years | 0 (0.0%) | 0 (0.0%) |
| 18 to 34 Years | 0 (0.0%) | 0 (0.0%) |
| 35 to 64 Years | 0 (0.0%) | 0 (0.0%) |
| 65 to 74 Years | 0 (0.0%) | 0 (0.0%) |
| 75 Years and over | 0 (0.0%) | 0 (0.0%) |
Disability Class: Self-Care Difficulty
| Age Bracket | Male | Female |
| 5 to 17 Years | 0 (0.0%) | 0 (0.0%) |
| 18 to 34 Years | 0 (0.0%) | 0 (0.0%) |
| 35 to 64 Years | 0 (0.0%) | 0 (0.0%) |
| 65 to 74 Years | 0 (0.0%) | 0 (0.0%) |
| 75 Years and over | 0 (0.0%) | 0 (0.0%) |
Technology Access in Eagle Harbor
Computing Device Access in Eagle Harbor
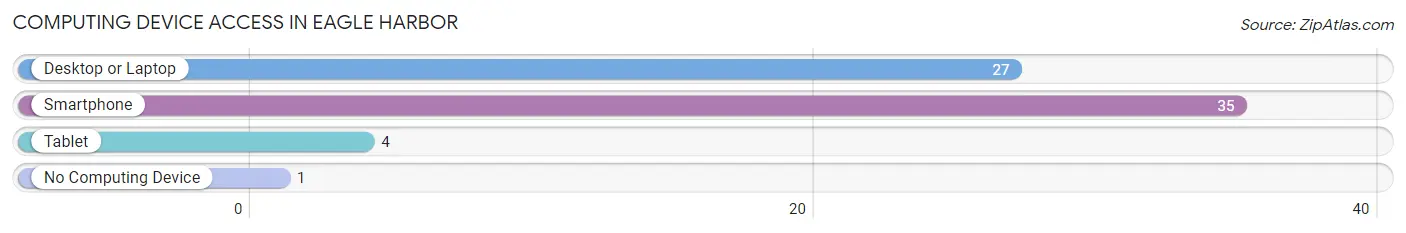
| Device Type | # Households | % Households |
| Desktop or Laptop | 27 | 75.0% |
| Smartphone | 35 | 97.2% |
| Tablet | 4 | 11.1% |
| No Computing Device | 1 | 2.8% |
| Total | 36 | 100.0% |
Internet Access in Eagle Harbor
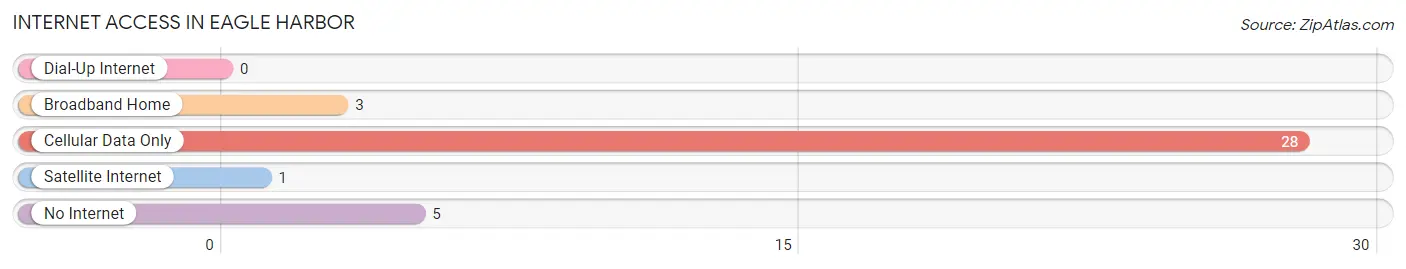
| Internet Type | # Households | % Households |
| Dial-Up Internet | 0 | 0.0% |
| Broadband Home | 3 | 8.3% |
| Cellular Data Only | 28 | 77.8% |
| Satellite Internet | 1 | 2.8% |
| No Internet | 5 | 13.9% |
| Total | 36 | 100.0% |
Eagle Harbor Summary
Eagle Harbor is a small unincorporated community located in Queen Anne’s County, Maryland. It is situated on the western shore of the Chesapeake Bay, approximately 25 miles south of Annapolis. The community is home to a population of approximately 500 people, and is known for its picturesque waterfront views and its rich history.
History
The area that is now Eagle Harbor was first settled in the early 1700s by English colonists. The community was originally known as “Eagle’s Nest”, and was named after the large number of bald eagles that inhabited the area. The community was officially established in 1790, and was incorporated as a town in 1802.
In the early 1800s, Eagle Harbor was a thriving port town, with a bustling fishing industry and a large number of ships coming and going from the harbor. The town was also home to a number of shipbuilding yards, and was a popular destination for travelers.
In the late 1800s, the town began to decline as the fishing industry moved elsewhere and the shipbuilding yards closed. By the early 1900s, the town had become a quiet, rural community.
Geography
Eagle Harbor is located on the western shore of the Chesapeake Bay, approximately 25 miles south of Annapolis. The town is situated on a peninsula, with the Chesapeake Bay to the east and the Chester River to the west. The town is surrounded by a number of small islands, including Kent Island, Tilghman Island, and Poplar Island.
The town is home to a number of small coves and inlets, as well as a number of small beaches. The town is also home to a number of parks and nature preserves, including the Eagle Harbor Wildlife Management Area and the Eagle Harbor State Park.
Economy
The economy of Eagle Harbor is largely based on tourism and recreation. The town is home to a number of small businesses, including restaurants, shops, and marinas. The town is also home to a number of bed and breakfasts, as well as a number of vacation rental properties.
The town is also home to a number of small farms, as well as a number of seafood processing plants. The town is also home to a number of boatyards, as well as a number of boat repair and maintenance businesses.
Demographics
As of the 2010 census, the population of Eagle Harbor was 498. The racial makeup of the town was 94.2% White, 2.2% African American, 0.4% Native American, 0.8% Asian, 0.2% Pacific Islander, and 2.2% from other races. The median household income was $50,000, and the median age was 44.
Conclusion
Eagle Harbor is a small unincorporated community located in Queen Anne’s County, Maryland. It is situated on the western shore of the Chesapeake Bay, approximately 25 miles south of Annapolis. The community is home to a population of approximately 500 people, and is known for its picturesque waterfront views and its rich history. The economy of Eagle Harbor is largely based on tourism and recreation, and the town is home to a number of small businesses, farms, and seafood processing plants. The racial makeup of the town is 94.2% White, 2.2% African American, 0.4% Native American, 0.8% Asian, 0.2% Pacific Islander, and 2.2% from other races. The median household income was $50,000, and the median age was 44.
Common Questions
What is Per Capita Income in Eagle Harbor?
Per Capita income in Eagle Harbor is $60,986.
What is the Median Family Income in Eagle Harbor?
Median Family Income in Eagle Harbor is $71,667.
What is the Median Household income in Eagle Harbor?
Median Household Income in Eagle Harbor is $75,938.
What is Income or Wage Gap in Eagle Harbor?
Income or Wage Gap in Eagle Harbor is 7.6%.
Women in Eagle Harbor earn 92.4 cents for every dollar earned by a man.
What is Inequality or Gini Index in Eagle Harbor?
Inequality or Gini Index in Eagle Harbor is 0.16.
What is the Total Population of Eagle Harbor?
Total Population of Eagle Harbor is 42.
What is the Total Male Population of Eagle Harbor?
Total Male Population of Eagle Harbor is 9.
What is the Total Female Population of Eagle Harbor?
Total Female Population of Eagle Harbor is 33.
What is the Ratio of Males per 100 Females in Eagle Harbor?
There are 27.27 Males per 100 Females in Eagle Harbor.
What is the Ratio of Females per 100 Males in Eagle Harbor?
There are 366.67 Females per 100 Males in Eagle Harbor.
What is the Median Population Age in Eagle Harbor?
Median Population Age in Eagle Harbor is 62.5 Years.
What is the Average Family Size in Eagle Harbor
Average Family Size in Eagle Harbor is 2.0 People.
What is the Average Household Size in Eagle Harbor
Average Household Size in Eagle Harbor is 1.2 People.
How Large is the Labor Force in Eagle Harbor?
There are 32 People in the Labor Forcein in Eagle Harbor.
What is the Percentage of People in the Labor Force in Eagle Harbor?
82.1% of People are in the Labor Force in Eagle Harbor.