Garrison, MD Map & Demographics
Garrison Map
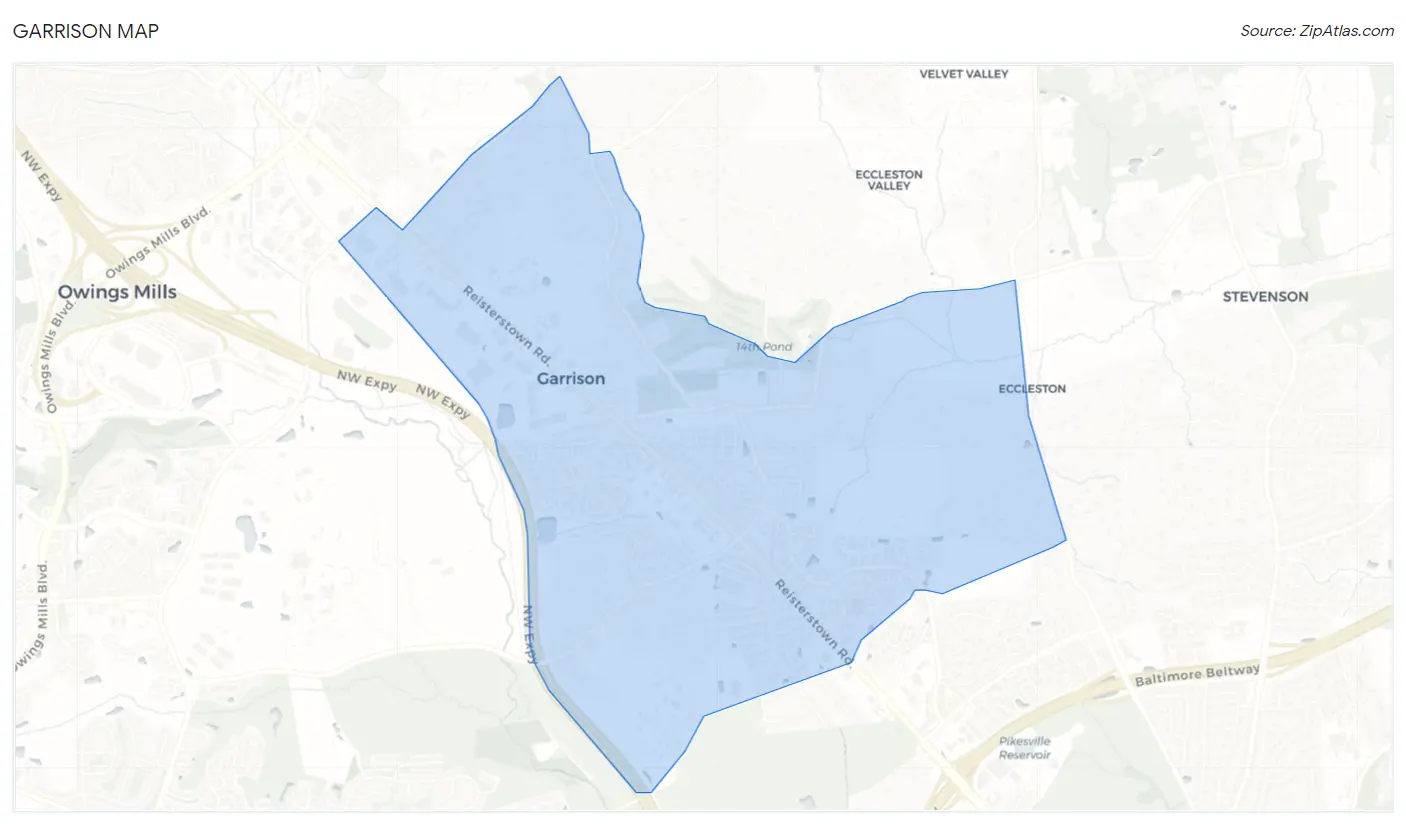
Garrison Overview
$50,008
PER CAPITA INCOME
$112,759
AVG FAMILY INCOME
$93,125
AVG HOUSEHOLD INCOME
12.0%
WAGE / INCOME GAP [ % ]
88.0¢/ $1
WAGE / INCOME GAP [ $ ]
0.47
INEQUALITY / GINI INDEX
9,764
TOTAL POPULATION
4,760
MALE POPULATION
5,004
FEMALE POPULATION
95.12
MALES / 100 FEMALES
105.13
FEMALES / 100 MALES
35.8
MEDIAN AGE
3.9
AVG FAMILY SIZE
2.7
AVG HOUSEHOLD SIZE
4,833
LABOR FORCE [ PEOPLE ]
63.1%
PERCENT IN LABOR FORCE
3.7%
UNEMPLOYMENT RATE
Garrison Area Codes
Income in Garrison
Income Overview in Garrison
Per Capita Income in Garrison is $50,008, while median incomes of families and households are $112,759 and $93,125 respectively.
| Characteristic | Number | Measure |
| Per Capita Income | 9,764 | $50,008 |
| Median Family Income | 1,902 | $112,759 |
| Mean Family Income | 1,902 | $160,515 |
| Median Household Income | 3,504 | $93,125 |
| Mean Household Income | 3,504 | $133,162 |
| Income Deficit | 1,902 | $0 |
| Wage / Income Gap (%) | 9,764 | 12.04% |
| Wage / Income Gap ($) | 9,764 | 87.96¢ per $1 |
| Gini / Inequality Index | 9,764 | 0.47 |
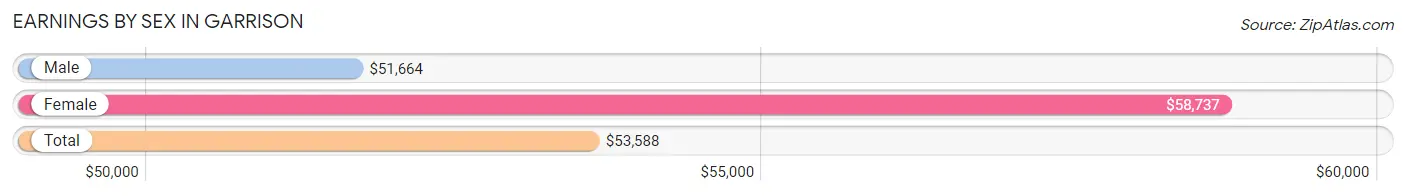
Earnings by Sex in Garrison
Average Earnings in Garrison are $53,588, $51,664 for men and $58,737 for women, a difference of 12.0%.
| Sex | Number | Average Earnings |
| Male | 2,545 (51.7%) | $51,664 |
| Female | 2,379 (48.3%) | $58,737 |
| Total | 4,924 (100.0%) | $53,588 |
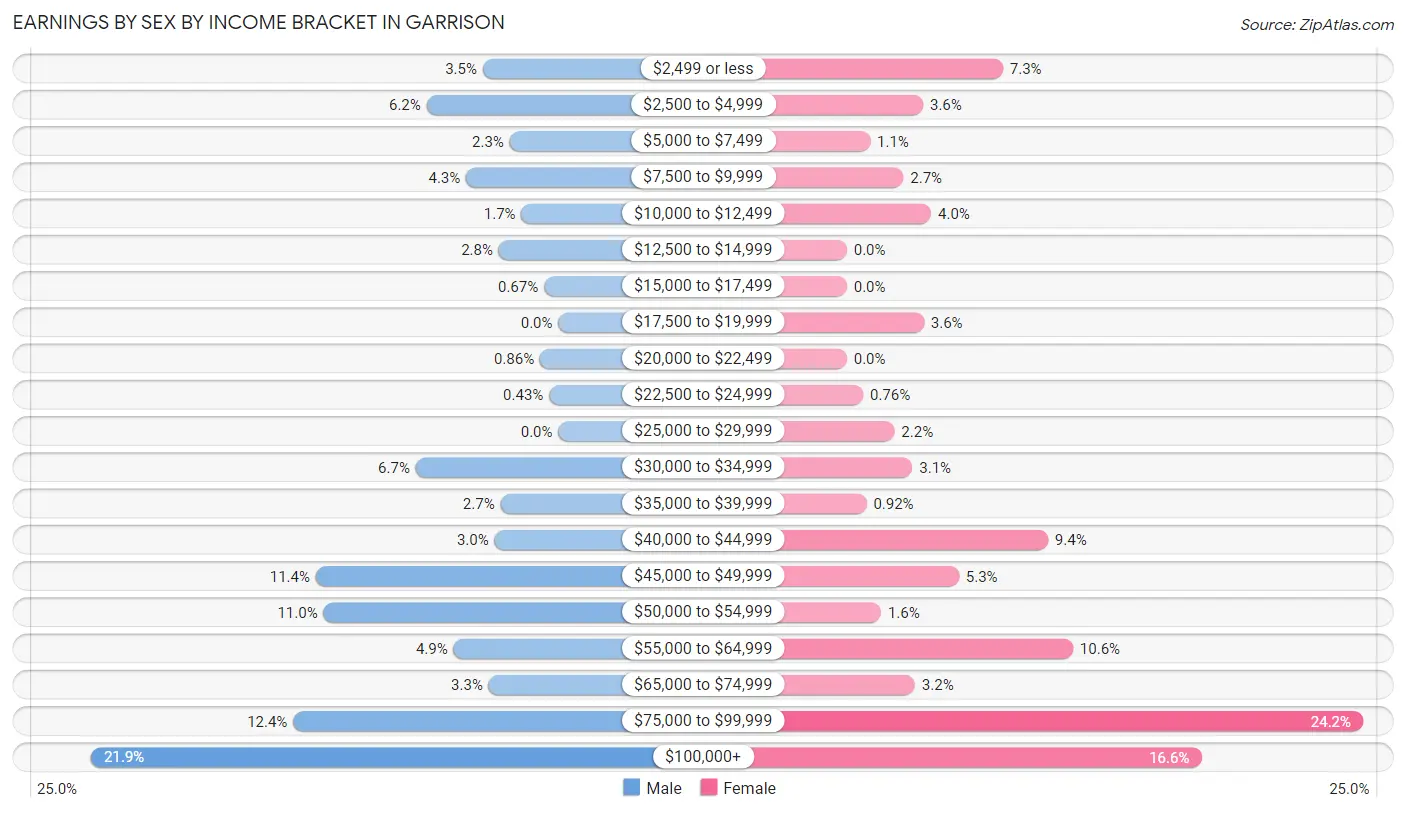
Earnings by Sex by Income Bracket in Garrison
The most common earnings brackets in Garrison are $100,000+ for men (557 | 21.9%) and $75,000 to $99,999 for women (575 | 24.2%).
| Income | Male | Female |
| $2,499 or less | 90 (3.5%) | 174 (7.3%) |
| $2,500 to $4,999 | 157 (6.2%) | 85 (3.6%) |
| $5,000 to $7,499 | 58 (2.3%) | 26 (1.1%) |
| $7,500 to $9,999 | 110 (4.3%) | 63 (2.6%) |
| $10,000 to $12,499 | 44 (1.7%) | 94 (4.0%) |
| $12,500 to $14,999 | 71 (2.8%) | 0 (0.0%) |
| $15,000 to $17,499 | 17 (0.7%) | 0 (0.0%) |
| $17,500 to $19,999 | 0 (0.0%) | 86 (3.6%) |
| $20,000 to $22,499 | 22 (0.9%) | 0 (0.0%) |
| $22,500 to $24,999 | 11 (0.4%) | 18 (0.8%) |
| $25,000 to $29,999 | 0 (0.0%) | 53 (2.2%) |
| $30,000 to $34,999 | 170 (6.7%) | 73 (3.1%) |
| $35,000 to $39,999 | 69 (2.7%) | 22 (0.9%) |
| $40,000 to $44,999 | 76 (3.0%) | 224 (9.4%) |
| $45,000 to $49,999 | 289 (11.4%) | 125 (5.2%) |
| $50,000 to $54,999 | 280 (11.0%) | 38 (1.6%) |
| $55,000 to $64,999 | 125 (4.9%) | 252 (10.6%) |
| $65,000 to $74,999 | 83 (3.3%) | 76 (3.2%) |
| $75,000 to $99,999 | 316 (12.4%) | 575 (24.2%) |
| $100,000+ | 557 (21.9%) | 395 (16.6%) |
| Total | 2,545 (100.0%) | 2,379 (100.0%) |
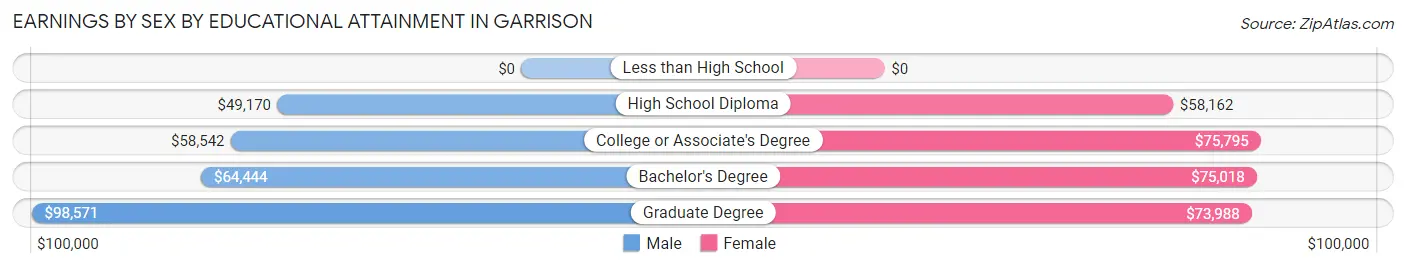
Earnings by Sex by Educational Attainment in Garrison
Average earnings in Garrison are $59,258 for men and $63,558 for women, a difference of 6.8%. Men with an educational attainment of graduate degree enjoy the highest average annual earnings of $98,571, while those with high school diploma education earn the least with $49,170. Women with an educational attainment of college or associate's degree earn the most with the average annual earnings of $75,795, while those with high school diploma education have the smallest earnings of $58,162.
| Educational Attainment | Male Income | Female Income |
| Less than High School | - | - |
| High School Diploma | $49,170 | $58,162 |
| College or Associate's Degree | $58,542 | $75,795 |
| Bachelor's Degree | $64,444 | $75,018 |
| Graduate Degree | $98,571 | $73,988 |
| Total | $59,258 | $63,558 |
Family Income in Garrison
Family Income Brackets in Garrison
According to the Garrison family income data, there are 424 families falling into the $200,000+ income range, which is the most common income bracket and makes up 22.3% of all families. Conversely, the $15,000 to $24,999 income bracket is the least frequent group with only 25 families (1.3%) belonging to this category.
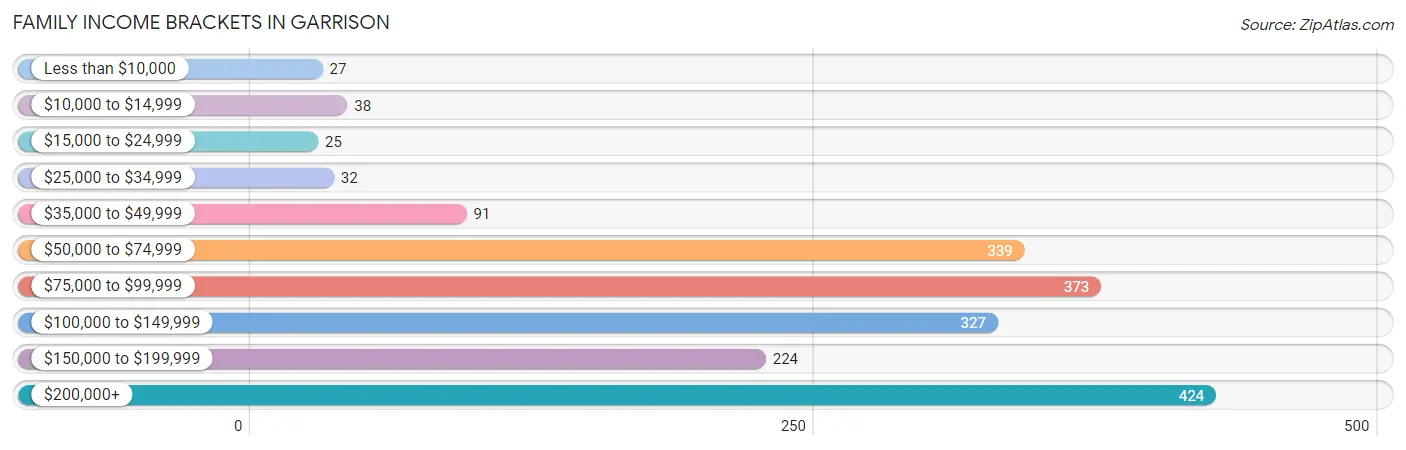
| Income Bracket | # Families | % Families |
| Less than $10,000 | 27 | 1.4% |
| $10,000 to $14,999 | 38 | 2.0% |
| $15,000 to $24,999 | 25 | 1.3% |
| $25,000 to $34,999 | 32 | 1.7% |
| $35,000 to $49,999 | 91 | 4.8% |
| $50,000 to $74,999 | 339 | 17.8% |
| $75,000 to $99,999 | 373 | 19.6% |
| $100,000 to $149,999 | 327 | 17.2% |
| $150,000 to $199,999 | 224 | 11.8% |
| $200,000+ | 424 | 22.3% |
Family Income by Famaliy Size in Garrison
3-person families (414 | 21.8%) account for the highest median family income in Garrison with $139,583 per family, while 2-person families (771 | 40.5%) have the highest median income of $56,557 per family member.
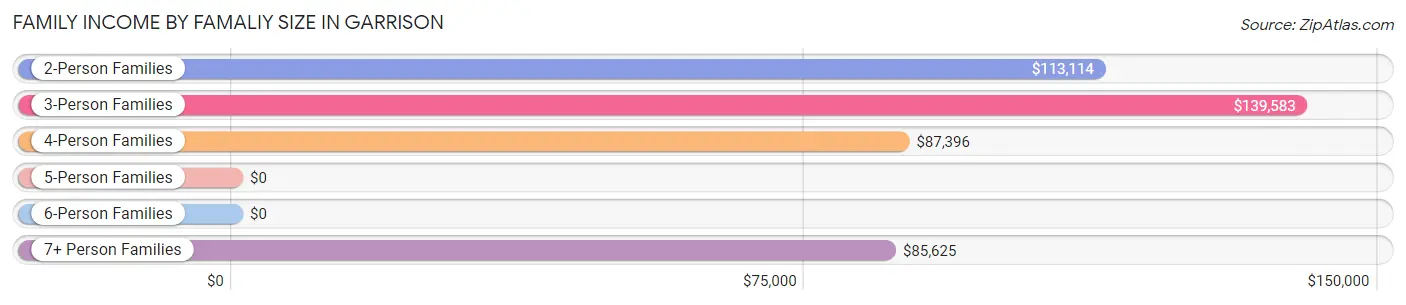
| Income Bracket | # Families | Median Income |
| 2-Person Families | 771 (40.5%) | $113,114 |
| 3-Person Families | 414 (21.8%) | $139,583 |
| 4-Person Families | 383 (20.1%) | $87,396 |
| 5-Person Families | 80 (4.2%) | $0 |
| 6-Person Families | 0 (0.0%) | $0 |
| 7+ Person Families | 254 (13.4%) | $85,625 |
| Total | 1,902 (100.0%) | $112,759 |
Family Income by Number of Earners in Garrison
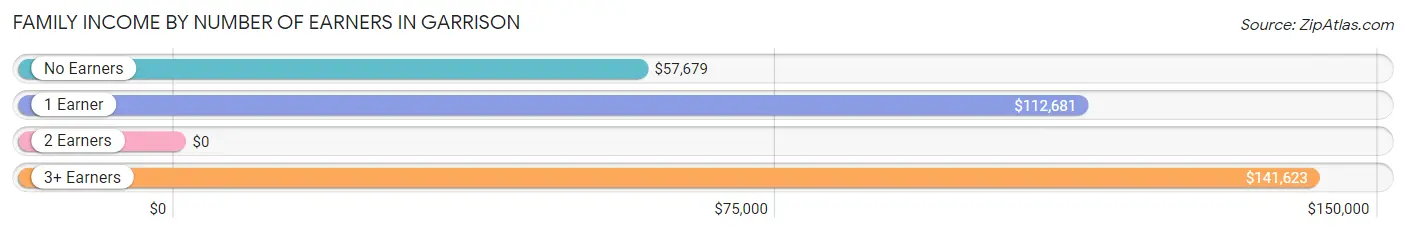
| Number of Earners | # Families | Median Income |
| No Earners | 156 (8.2%) | $57,679 |
| 1 Earner | 502 (26.4%) | $112,681 |
| 2 Earners | 1,105 (58.1%) | $0 |
| 3+ Earners | 139 (7.3%) | $141,623 |
| Total | 1,902 (100.0%) | $112,759 |
Household Income in Garrison
Household Income Brackets in Garrison
With 683 households falling in the category, the $100,000 to $149,999 income range is the most frequent in Garrison, accounting for 19.5% of all households. In contrast, only 39 households (1.1%) fall into the less than $10,000 income bracket, making it the least populous group.
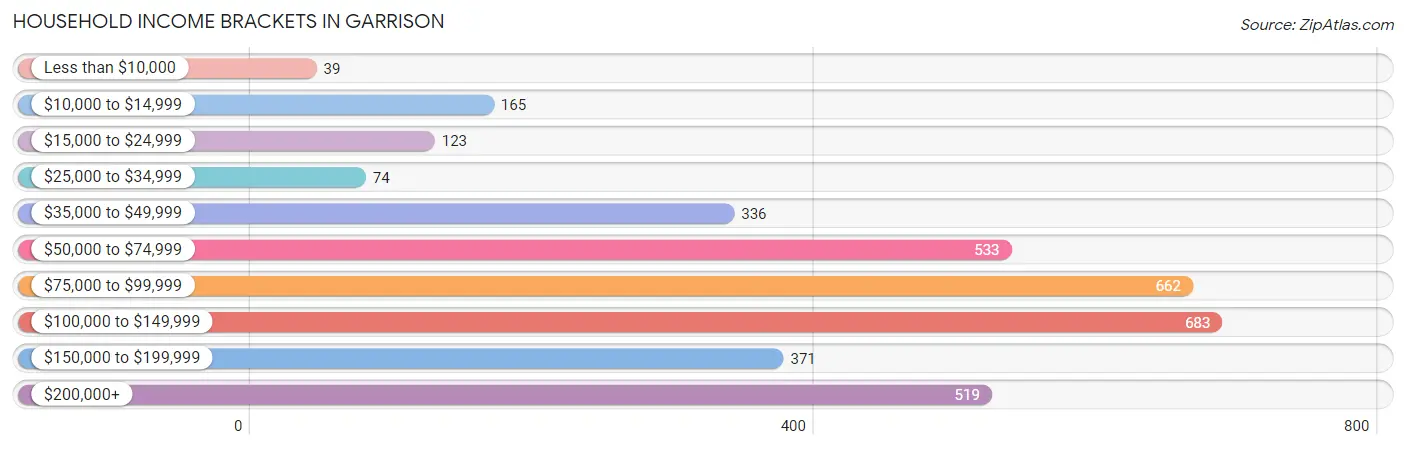
| Income Bracket | # Households | % Households |
| Less than $10,000 | 39 | 1.1% |
| $10,000 to $14,999 | 165 | 4.7% |
| $15,000 to $24,999 | 123 | 3.5% |
| $25,000 to $34,999 | 74 | 2.1% |
| $35,000 to $49,999 | 336 | 9.6% |
| $50,000 to $74,999 | 533 | 15.2% |
| $75,000 to $99,999 | 662 | 18.9% |
| $100,000 to $149,999 | 683 | 19.5% |
| $150,000 to $199,999 | 371 | 10.6% |
| $200,000+ | 519 | 14.8% |
Household Income by Householder Age in Garrison
The median household income in Garrison is $93,125, with the highest median household income of $121,778 found in the 45 to 64 years age bracket for the primary householder. A total of 1,134 households (32.4%) fall into this category. Meanwhile, the 15 to 24 years age bracket for the primary householder has the lowest median household income of $0, with 164 households (4.7%) in this group.
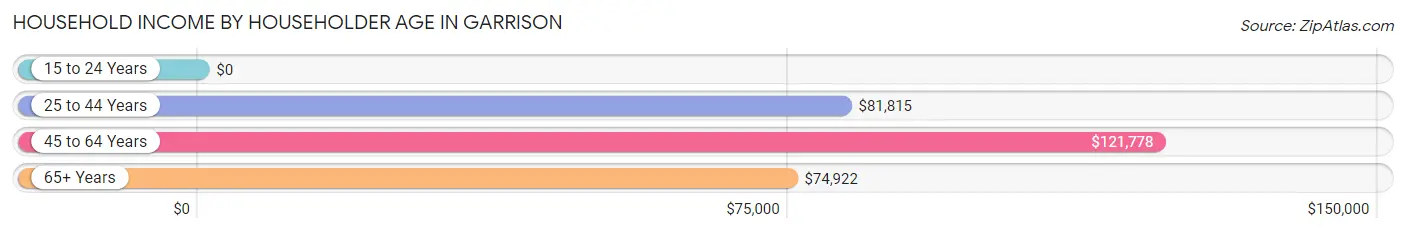
| Income Bracket | # Households | Median Income |
| 15 to 24 Years | 164 (4.7%) | $0 |
| 25 to 44 Years | 1,069 (30.5%) | $81,815 |
| 45 to 64 Years | 1,134 (32.4%) | $121,778 |
| 65+ Years | 1,137 (32.5%) | $74,922 |
| Total | 3,504 (100.0%) | $93,125 |
Poverty in Garrison
Income Below Poverty by Sex and Age in Garrison
With 17.9% poverty level for males and 15.8% for females among the residents of Garrison, 15 year old males and 12 to 14 year old females are the most vulnerable to poverty, with 107 males (65.2%) and 112 females (64.7%) in their respective age groups living below the poverty level.
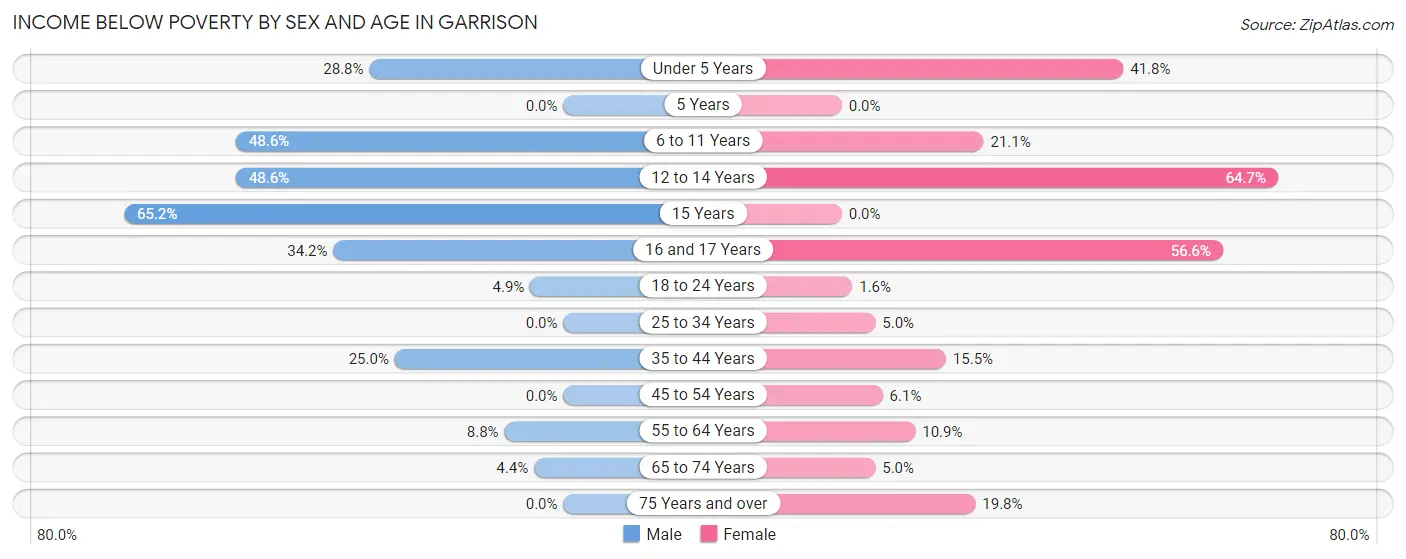
| Age Bracket | Male | Female |
| Under 5 Years | 119 (28.8%) | 135 (41.8%) |
| 5 Years | 0 (0.0%) | 0 (0.0%) |
| 6 to 11 Years | 210 (48.6%) | 44 (21.0%) |
| 12 to 14 Years | 105 (48.6%) | 112 (64.7%) |
| 15 Years | 107 (65.2%) | 0 (0.0%) |
| 16 and 17 Years | 14 (34.2%) | 129 (56.6%) |
| 18 to 24 Years | 29 (4.9%) | 8 (1.6%) |
| 25 to 34 Years | 0 (0.0%) | 26 (5.0%) |
| 35 to 44 Years | 141 (25.0%) | 107 (15.5%) |
| 45 to 54 Years | 0 (0.0%) | 32 (6.1%) |
| 55 to 64 Years | 40 (8.7%) | 77 (10.9%) |
| 65 to 74 Years | 25 (4.4%) | 26 (5.0%) |
| 75 Years and over | 0 (0.0%) | 92 (19.8%) |
| Total | 790 (17.9%) | 788 (15.8%) |
Income Above Poverty by Sex and Age in Garrison
According to the poverty statistics in Garrison, males aged 5 years and females aged 5 years are the age groups that are most secure financially, with 100.0% of males and 100.0% of females in these age groups living above the poverty line.
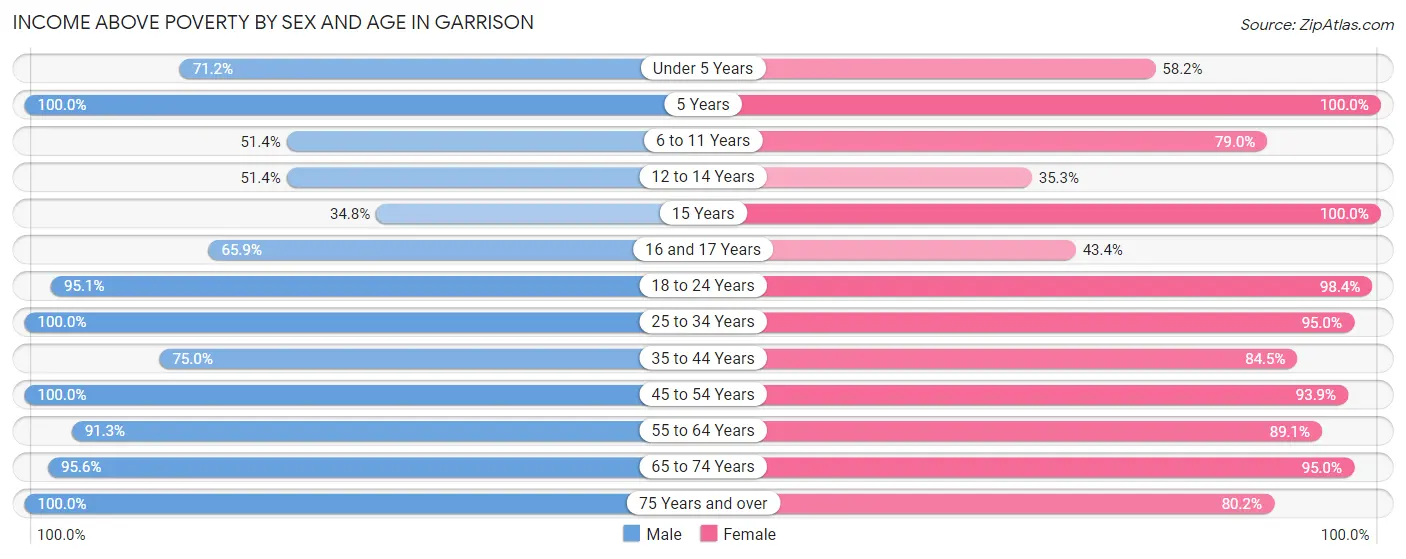
| Age Bracket | Male | Female |
| Under 5 Years | 294 (71.2%) | 188 (58.2%) |
| 5 Years | 8 (100.0%) | 46 (100.0%) |
| 6 to 11 Years | 222 (51.4%) | 165 (78.9%) |
| 12 to 14 Years | 111 (51.4%) | 61 (35.3%) |
| 15 Years | 57 (34.8%) | 79 (100.0%) |
| 16 and 17 Years | 27 (65.8%) | 99 (43.4%) |
| 18 to 24 Years | 559 (95.1%) | 504 (98.4%) |
| 25 to 34 Years | 447 (100.0%) | 496 (95.0%) |
| 35 to 44 Years | 422 (75.0%) | 585 (84.5%) |
| 45 to 54 Years | 334 (100.0%) | 495 (93.9%) |
| 55 to 64 Years | 417 (91.2%) | 629 (89.1%) |
| 65 to 74 Years | 549 (95.6%) | 497 (95.0%) |
| 75 Years and over | 181 (100.0%) | 372 (80.2%) |
| Total | 3,628 (82.1%) | 4,216 (84.3%) |
Income Below Poverty Among Married-Couple Families in Garrison
The poverty statistics for married-couple families in Garrison show that 13.7% or 176 of the total 1,289 families live below the poverty line. Families with 5 or more children have the highest poverty rate of 100.0%, comprising of 113 families. On the other hand, families with 1 or 2 children have the lowest poverty rate of 0.0%, which includes 0 families.
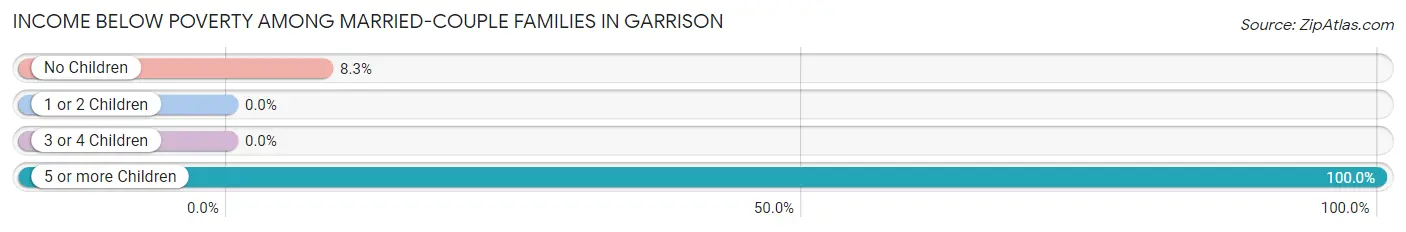
| Children | Above Poverty | Below Poverty |
| No Children | 698 (91.7%) | 63 (8.3%) |
| 1 or 2 Children | 415 (100.0%) | 0 (0.0%) |
| 3 or 4 Children | 0 (0.0%) | 0 (0.0%) |
| 5 or more Children | 0 (0.0%) | 113 (100.0%) |
| Total | 1,113 (86.4%) | 176 (13.7%) |
Income Below Poverty Among Single-Parent Households in Garrison
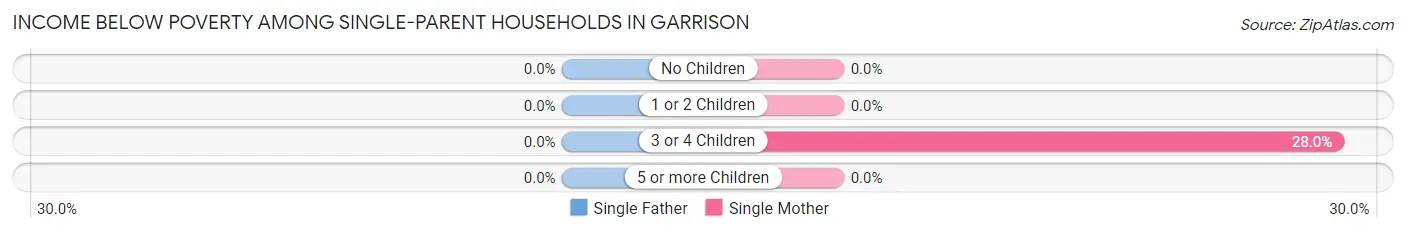
| Children | Single Father | Single Mother |
| No Children | 0 (0.0%) | 0 (0.0%) |
| 1 or 2 Children | 0 (0.0%) | 0 (0.0%) |
| 3 or 4 Children | 0 (0.0%) | 26 (28.0%) |
| 5 or more Children | 0 (0.0%) | 0 (0.0%) |
| Total | 0 (0.0%) | 26 (5.8%) |
Income Below Poverty Among Married-Couple vs Single-Parent Households in Garrison
The poverty data for Garrison shows that 176 of the married-couple family households (13.7%) and 26 of the single-parent households (4.2%) are living below the poverty level. Within the married-couple family households, those with 5 or more children have the highest poverty rate, with 113 households (100.0%) falling below the poverty line. Among the single-parent households, those with 3 or 4 children have the highest poverty rate, with 26 household (28.0%) living below poverty.
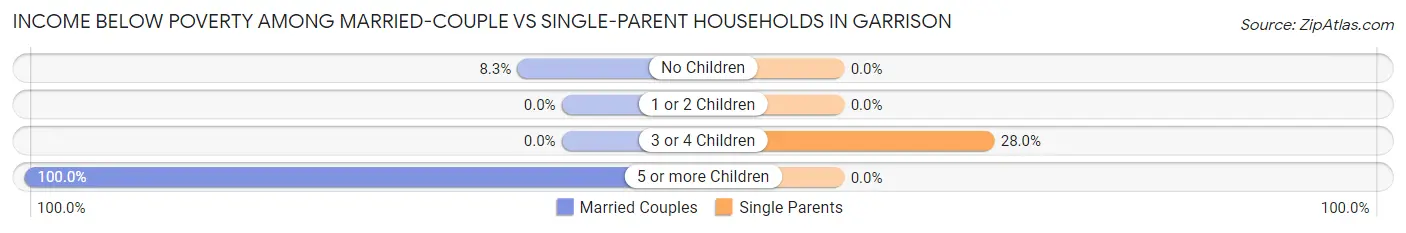
| Children | Married-Couple Families | Single-Parent Households |
| No Children | 63 (8.3%) | 0 (0.0%) |
| 1 or 2 Children | 0 (0.0%) | 0 (0.0%) |
| 3 or 4 Children | 0 (0.0%) | 26 (28.0%) |
| 5 or more Children | 113 (100.0%) | 0 (0.0%) |
| Total | 176 (13.7%) | 26 (4.2%) |
Race in Garrison
The most populous races in Garrison are White / Caucasian (5,403 | 55.3%), Black / African American (3,798 | 38.9%), and Two or more Races (351 | 3.6%).
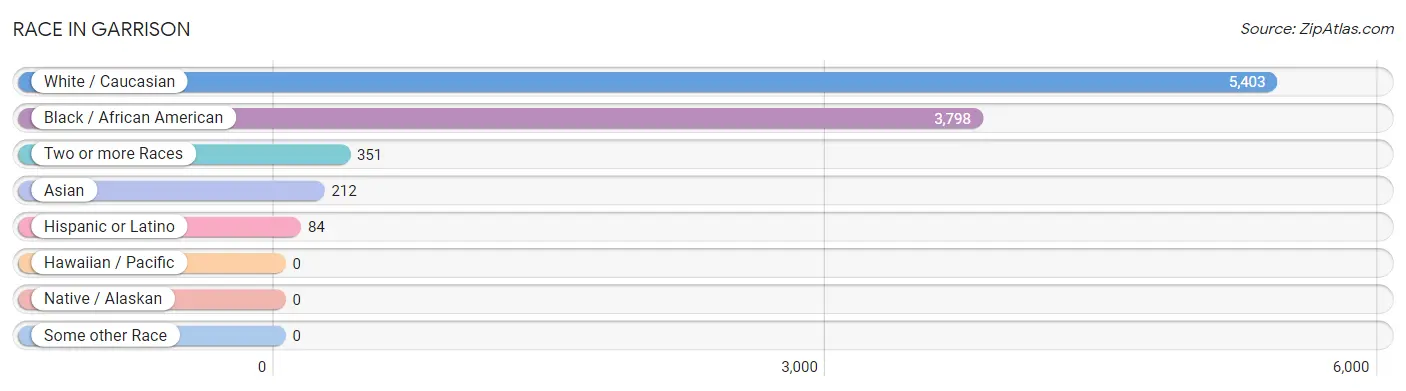
| Race | # Population | % Population |
| Asian | 212 | 2.2% |
| Black / African American | 3,798 | 38.9% |
| Hawaiian / Pacific | 0 | 0.0% |
| Hispanic or Latino | 84 | 0.9% |
| Native / Alaskan | 0 | 0.0% |
| White / Caucasian | 5,403 | 55.3% |
| Two or more Races | 351 | 3.6% |
| Some other Race | 0 | 0.0% |
| Total | 9,764 | 100.0% |
Ancestry in Garrison
The most populous ancestries reported in Garrison are German (476 | 4.9%), American (416 | 4.3%), Russian (383 | 3.9%), Irish (335 | 3.4%), and Polish (331 | 3.4%), together accounting for 19.9% of all Garrison residents.
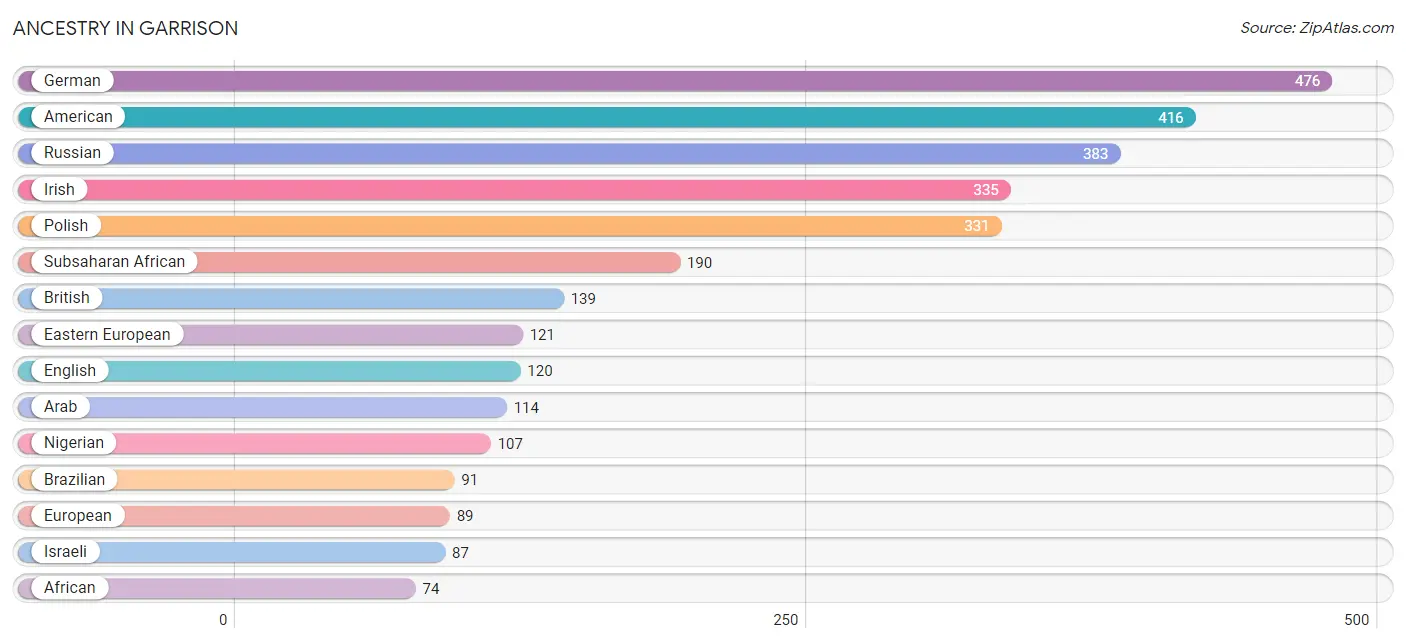
| Ancestry | # Population | % Population |
| African | 74 | 0.8% |
| American | 416 | 4.3% |
| Arab | 114 | 1.2% |
| Austrian | 46 | 0.5% |
| Brazilian | 91 | 0.9% |
| British | 139 | 1.4% |
| Burmese | 37 | 0.4% |
| Cherokee | 21 | 0.2% |
| Chilean | 2 | 0.0% |
| Cuban | 72 | 0.7% |
| Eastern European | 121 | 1.2% |
| English | 120 | 1.2% |
| Ethiopian | 8 | 0.1% |
| European | 89 | 0.9% |
| Finnish | 20 | 0.2% |
| French | 34 | 0.4% |
| German | 476 | 4.9% |
| Greek | 41 | 0.4% |
| Hungarian | 74 | 0.8% |
| Indian (Asian) | 42 | 0.4% |
| Irish | 335 | 3.4% |
| Israeli | 87 | 0.9% |
| Italian | 34 | 0.4% |
| Jamaican | 42 | 0.4% |
| Japanese | 67 | 0.7% |
| Korean | 32 | 0.3% |
| Lebanese | 14 | 0.1% |
| Mexican | 5 | 0.1% |
| Nigerian | 107 | 1.1% |
| Polish | 331 | 3.4% |
| Romanian | 9 | 0.1% |
| Russian | 383 | 3.9% |
| Scotch-Irish | 13 | 0.1% |
| Scottish | 33 | 0.3% |
| South American | 2 | 0.0% |
| Sri Lankan | 31 | 0.3% |
| Subsaharan African | 190 | 1.9% |
| Swedish | 37 | 0.4% |
| Thai | 45 | 0.5% |
| Ukrainian | 17 | 0.2% |
| Welsh | 27 | 0.3% | View All 41 Rows |
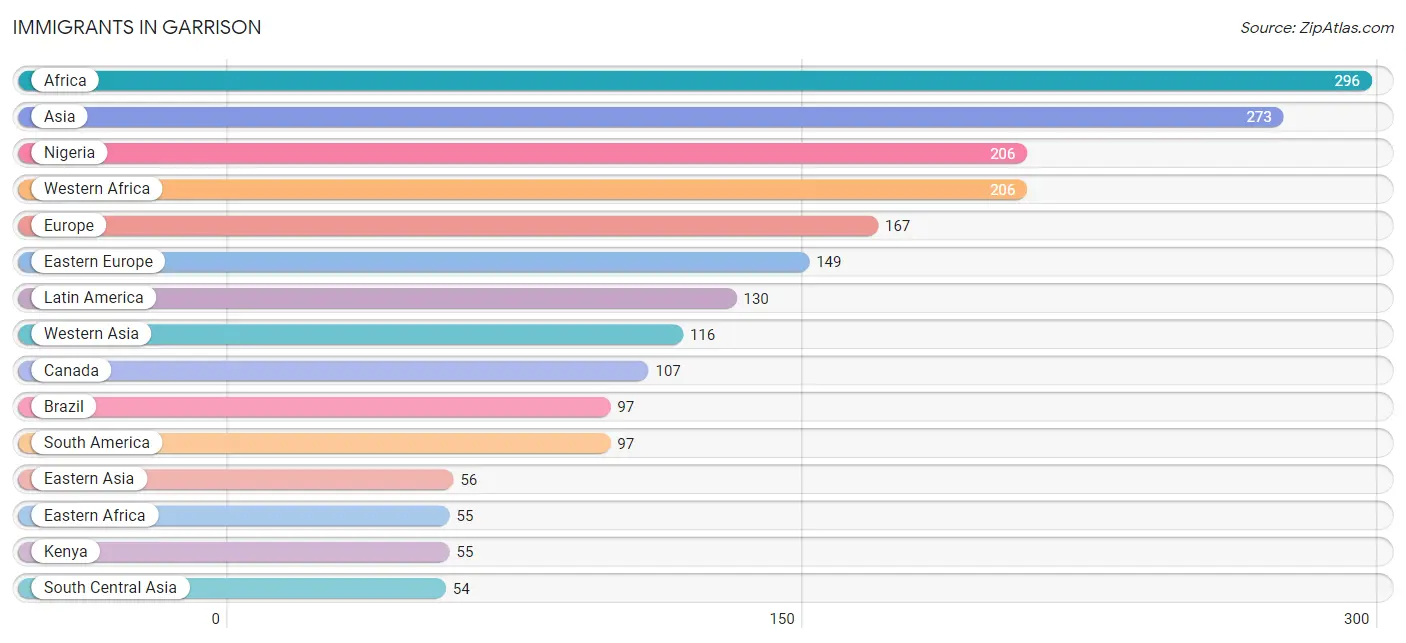
Immigrants in Garrison
The most numerous immigrant groups reported in Garrison came from Africa (296 | 3.0%), Asia (273 | 2.8%), Nigeria (206 | 2.1%), Western Africa (206 | 2.1%), and Europe (167 | 1.7%), together accounting for 11.8% of all Garrison residents.
| Immigration Origin | # Population | % Population |
| Africa | 296 | 3.0% |
| Asia | 273 | 2.8% |
| Belarus | 41 | 0.4% |
| Brazil | 97 | 1.0% |
| Cameroon | 1 | 0.0% |
| Canada | 107 | 1.1% |
| Caribbean | 27 | 0.3% |
| Central America | 6 | 0.1% |
| China | 8 | 0.1% |
| Cuba | 16 | 0.2% |
| Eastern Africa | 55 | 0.6% |
| Eastern Asia | 56 | 0.6% |
| Eastern Europe | 149 | 1.5% |
| Egypt | 34 | 0.4% |
| England | 14 | 0.1% |
| Europe | 167 | 1.7% |
| India | 29 | 0.3% |
| Iran | 10 | 0.1% |
| Israel | 30 | 0.3% |
| Italy | 4 | 0.0% |
| Jamaica | 11 | 0.1% |
| Kenya | 55 | 0.6% |
| Korea | 48 | 0.5% |
| Latin America | 130 | 1.3% |
| Mexico | 6 | 0.1% |
| Middle Africa | 1 | 0.0% |
| Moldova | 9 | 0.1% |
| Nigeria | 206 | 2.1% |
| Northern Africa | 34 | 0.4% |
| Northern Europe | 14 | 0.1% |
| Philippines | 32 | 0.3% |
| Romania | 14 | 0.1% |
| Russia | 15 | 0.2% |
| South America | 97 | 1.0% |
| South Central Asia | 54 | 0.5% |
| South Eastern Asia | 47 | 0.5% |
| Southern Europe | 4 | 0.0% |
| Ukraine | 10 | 0.1% |
| Uzbekistan | 15 | 0.2% |
| Vietnam | 15 | 0.2% |
| Western Africa | 206 | 2.1% |
| Western Asia | 116 | 1.2% | View All 42 Rows |
Sex and Age in Garrison
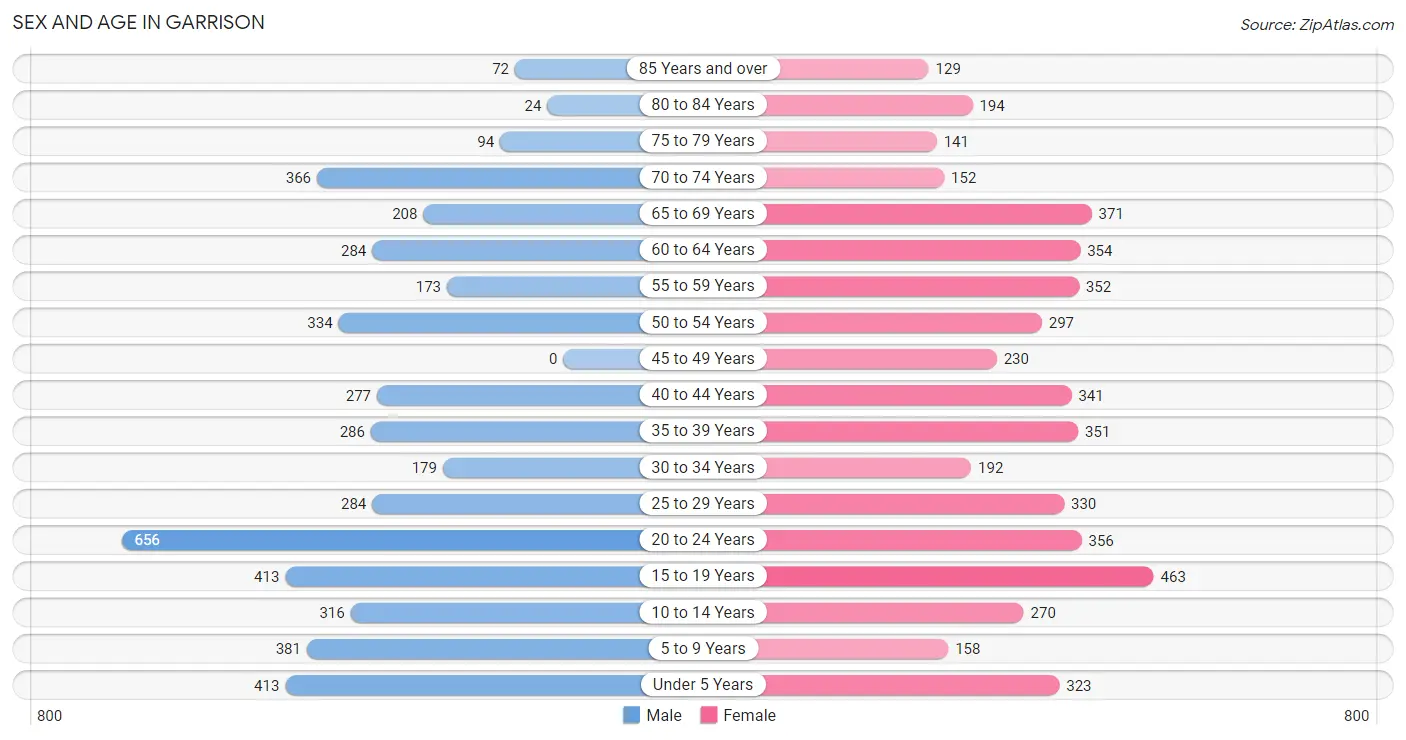
Sex and Age in Garrison
The most populous age groups in Garrison are 20 to 24 Years (656 | 13.8%) for men and 15 to 19 Years (463 | 9.2%) for women.
| Age Bracket | Male | Female |
| Under 5 Years | 413 (8.7%) | 323 (6.5%) |
| 5 to 9 Years | 381 (8.0%) | 158 (3.2%) |
| 10 to 14 Years | 316 (6.6%) | 270 (5.4%) |
| 15 to 19 Years | 413 (8.7%) | 463 (9.2%) |
| 20 to 24 Years | 656 (13.8%) | 356 (7.1%) |
| 25 to 29 Years | 284 (6.0%) | 330 (6.6%) |
| 30 to 34 Years | 179 (3.8%) | 192 (3.8%) |
| 35 to 39 Years | 286 (6.0%) | 351 (7.0%) |
| 40 to 44 Years | 277 (5.8%) | 341 (6.8%) |
| 45 to 49 Years | 0 (0.0%) | 230 (4.6%) |
| 50 to 54 Years | 334 (7.0%) | 297 (5.9%) |
| 55 to 59 Years | 173 (3.6%) | 352 (7.0%) |
| 60 to 64 Years | 284 (6.0%) | 354 (7.1%) |
| 65 to 69 Years | 208 (4.4%) | 371 (7.4%) |
| 70 to 74 Years | 366 (7.7%) | 152 (3.0%) |
| 75 to 79 Years | 94 (2.0%) | 141 (2.8%) |
| 80 to 84 Years | 24 (0.5%) | 194 (3.9%) |
| 85 Years and over | 72 (1.5%) | 129 (2.6%) |
| Total | 4,760 (100.0%) | 5,004 (100.0%) |
Families and Households in Garrison
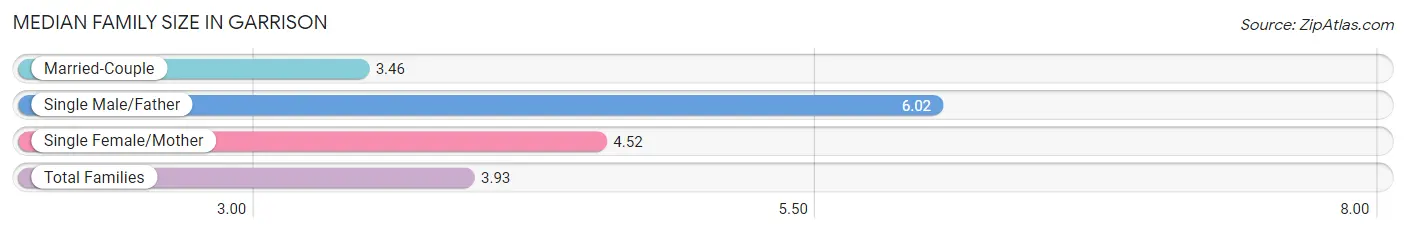
Median Family Size in Garrison
The median family size in Garrison is 3.93 persons per family, with single male/father families (164 | 8.6%) accounting for the largest median family size of 6.02 persons per family. On the other hand, married-couple families (1,289 | 67.8%) represent the smallest median family size with 3.46 persons per family.
| Family Type | # Families | Family Size |
| Married-Couple | 1,289 (67.8%) | 3.46 |
| Single Male/Father | 164 (8.6%) | 6.02 |
| Single Female/Mother | 449 (23.6%) | 4.52 |
| Total Families | 1,902 (100.0%) | 3.93 |
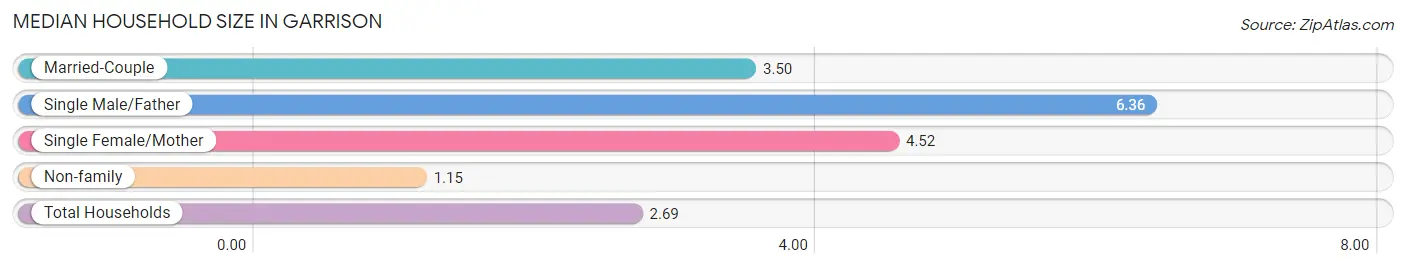
Median Household Size in Garrison
The median household size in Garrison is 2.69 persons per household, with single male/father households (164 | 4.7%) accounting for the largest median household size of 6.36 persons per household. non-family households (1,602 | 45.7%) represent the smallest median household size with 1.15 persons per household.
| Household Type | # Households | Household Size |
| Married-Couple | 1,289 (36.8%) | 3.50 |
| Single Male/Father | 164 (4.7%) | 6.36 |
| Single Female/Mother | 449 (12.8%) | 4.52 |
| Non-family | 1,602 (45.7%) | 1.15 |
| Total Households | 3,504 (100.0%) | 2.69 |
Household Size by Marriage Status in Garrison
Out of a total of 3,504 households in Garrison, 1,902 (54.3%) are family households, while 1,602 (45.7%) are nonfamily households. The most numerous type of family households are 2-person households, comprising 700, and the most common type of nonfamily households are 1-person households, comprising 1,386.
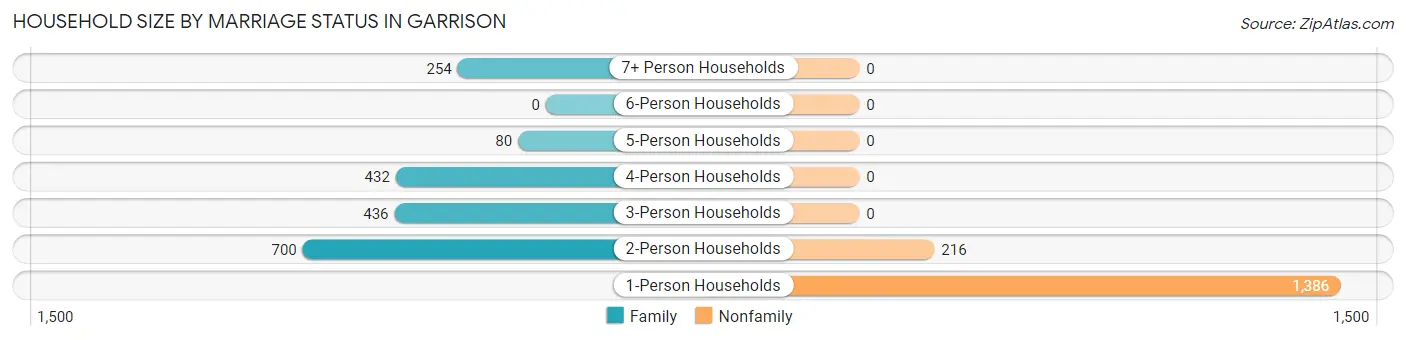
| Household Size | Family Households | Nonfamily Households |
| 1-Person Households | - | 1,386 (39.6%) |
| 2-Person Households | 700 (20.0%) | 216 (6.2%) |
| 3-Person Households | 436 (12.4%) | 0 (0.0%) |
| 4-Person Households | 432 (12.3%) | 0 (0.0%) |
| 5-Person Households | 80 (2.3%) | 0 (0.0%) |
| 6-Person Households | 0 (0.0%) | 0 (0.0%) |
| 7+ Person Households | 254 (7.2%) | 0 (0.0%) |
| Total | 1,902 (54.3%) | 1,602 (45.7%) |
Female Fertility in Garrison
Fertility by Age in Garrison
Average fertility rate in Garrison is 43.0 births per 1,000 women. Women in the age bracket of 20 to 34 years have the highest fertility rate with 82.0 births per 1,000 women. Women in the age bracket of 20 to 34 years acount for 69.9% of all women with births.
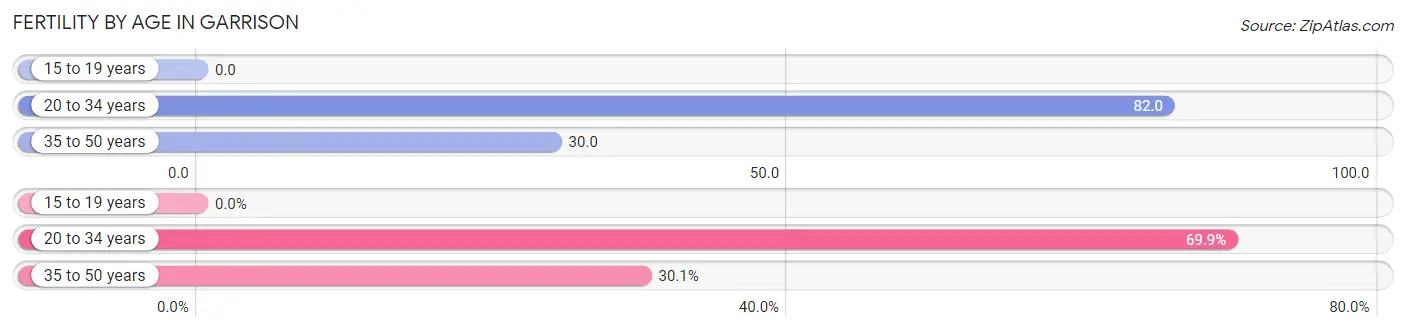
| Age Bracket | Women with Births | Births / 1,000 Women |
| 15 to 19 years | 0 (0.0%) | 0.0 |
| 20 to 34 years | 72 (69.9%) | 82.0 |
| 35 to 50 years | 31 (30.1%) | 30.0 |
| Total | 103 (100.0%) | 43.0 |
Fertility by Age by Marriage Status in Garrison
74.8% of women with births (103) in Garrison are married. The highest percentage of unmarried women with births falls into 20 to 34 years age bracket with 36.1% of them unmarried at the time of birth, while the lowest percentage of unmarried women with births belong to 35 to 50 years age bracket with 0.0% of them unmarried.
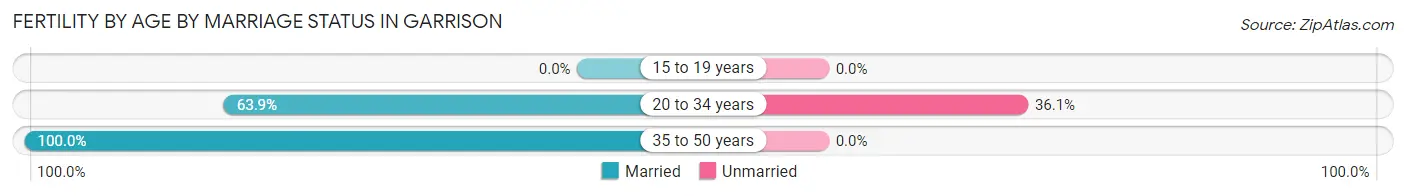
| Age Bracket | Married | Unmarried |
| 15 to 19 years | 0 (0.0%) | 0 (0.0%) |
| 20 to 34 years | 46 (63.9%) | 26 (36.1%) |
| 35 to 50 years | 31 (100.0%) | 0 (0.0%) |
| Total | 77 (74.8%) | 26 (25.2%) |
Fertility by Education in Garrison
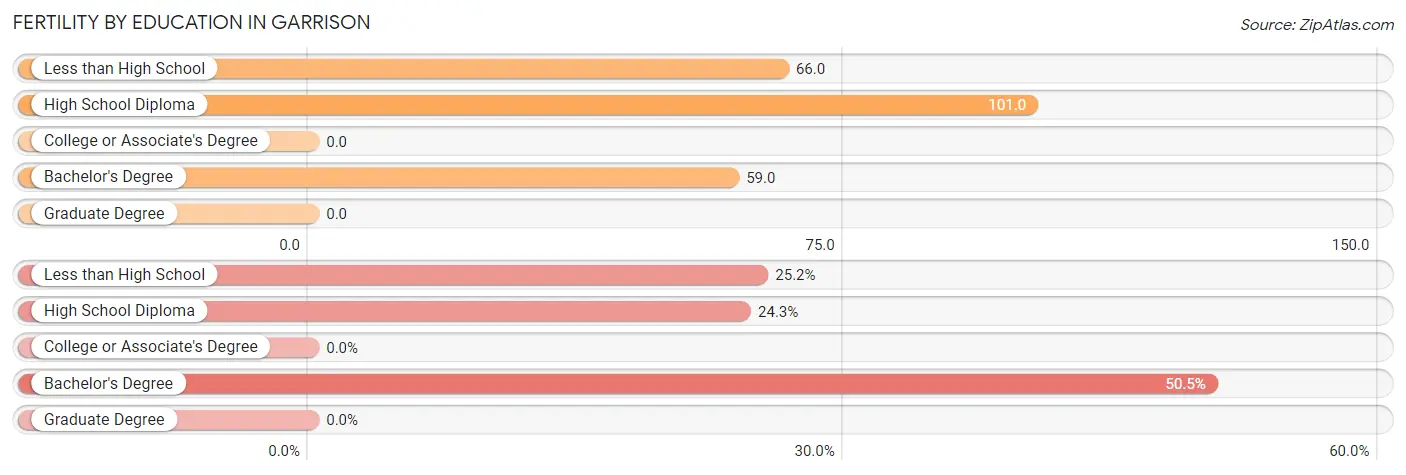
| Educational Attainment | Women with Births | Births / 1,000 Women |
| Less than High School | 26 (25.2%) | 66.0 |
| High School Diploma | 25 (24.3%) | 101.0 |
| College or Associate's Degree | 0 (0.0%) | 0.0 |
| Bachelor's Degree | 52 (50.5%) | 59.0 |
| Graduate Degree | 0 (0.0%) | 0.0 |
| Total | 103 (100.0%) | 43.0 |
Fertility by Education by Marriage Status in Garrison
25.2% of women with births in Garrison are unmarried. Women with the educational attainment of high school diploma are most likely to be married with 100.0% of them married at childbirth, while women with the educational attainment of less than high school are least likely to be married with 100.0% of them unmarried at childbirth.
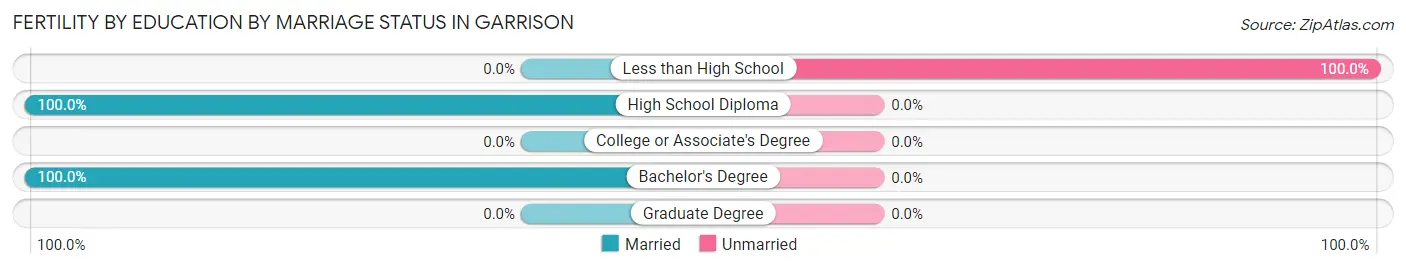
| Educational Attainment | Married | Unmarried |
| Less than High School | 0 (0.0%) | 26 (100.0%) |
| High School Diploma | 25 (100.0%) | 0 (0.0%) |
| College or Associate's Degree | 0 (0.0%) | 0 (0.0%) |
| Bachelor's Degree | 52 (100.0%) | 0 (0.0%) |
| Graduate Degree | 0 (0.0%) | 0 (0.0%) |
| Total | 77 (74.8%) | 26 (25.2%) |
Employment Characteristics in Garrison
Employment by Class of Employer in Garrison
Among the 4,611 employed individuals in Garrison, private company employees (2,520 | 54.6%), not-for-profit organizations (545 | 11.8%), and state government employees (381 | 8.3%) make up the most common classes of employment.
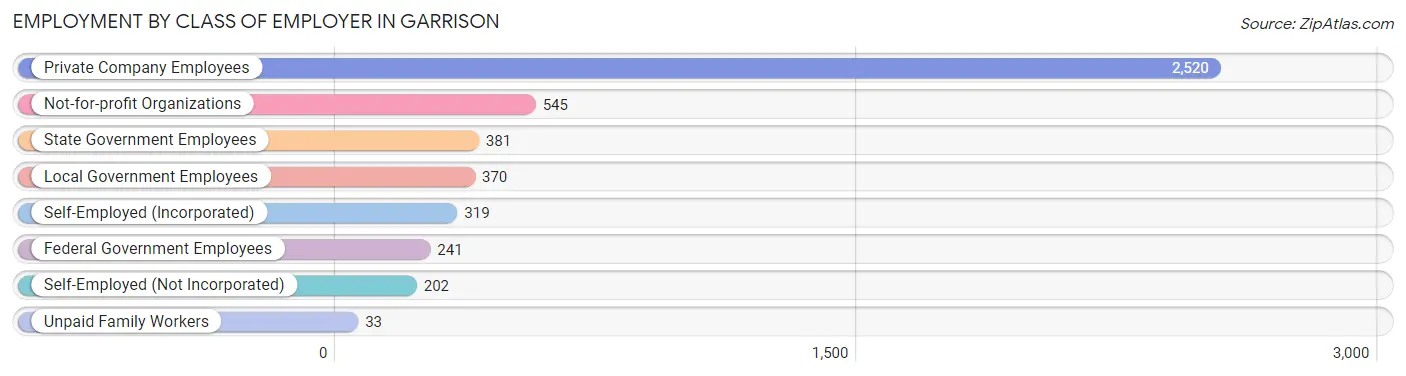
| Employer Class | # Employees | % Employees |
| Private Company Employees | 2,520 | 54.6% |
| Self-Employed (Incorporated) | 319 | 6.9% |
| Self-Employed (Not Incorporated) | 202 | 4.4% |
| Not-for-profit Organizations | 545 | 11.8% |
| Local Government Employees | 370 | 8.0% |
| State Government Employees | 381 | 8.3% |
| Federal Government Employees | 241 | 5.2% |
| Unpaid Family Workers | 33 | 0.7% |
| Total | 4,611 | 100.0% |
Employment Status by Age in Garrison
According to the labor force statistics for Garrison, out of the total population over 16 years of age (7,660), 63.1% or 4,833 individuals are in the labor force, with 3.7% or 179 of them unemployed. The age group with the highest labor force participation rate is 30 to 34 years, with 92.5% or 343 individuals in the labor force. Within the labor force, the 20 to 24 years age range has the highest percentage of unemployed individuals, with 14.5% or 105 of them being unemployed.
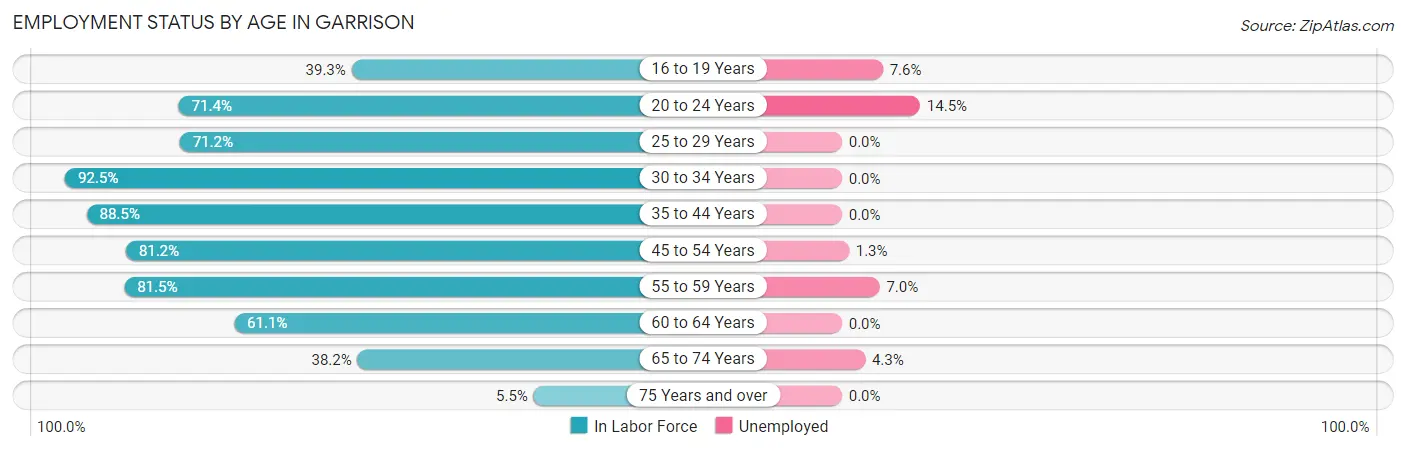
| Age Bracket | In Labor Force | Unemployed |
| 16 to 19 Years | 249 (39.3%) | 19 (7.6%) |
| 20 to 24 Years | 723 (71.4%) | 105 (14.5%) |
| 25 to 29 Years | 437 (71.2%) | 0 (0.0%) |
| 30 to 34 Years | 343 (92.5%) | 0 (0.0%) |
| 35 to 44 Years | 1,111 (88.5%) | 0 (0.0%) |
| 45 to 54 Years | 699 (81.2%) | 9 (1.3%) |
| 55 to 59 Years | 428 (81.5%) | 30 (7.0%) |
| 60 to 64 Years | 390 (61.1%) | 0 (0.0%) |
| 65 to 74 Years | 419 (38.2%) | 18 (4.3%) |
| 75 Years and over | 36 (5.5%) | 0 (0.0%) |
| Total | 4,833 (63.1%) | 179 (3.7%) |
Employment Status by Educational Attainment in Garrison
According to labor force statistics for Garrison, 79.9% of individuals (3,407) out of the total population between 25 and 64 years of age (4,264) are in the labor force, with 1.1% or 37 of them being unemployed. The group with the highest labor force participation rate are those with the educational attainment of high school diploma, with 87.4% or 612 individuals in the labor force. Within the labor force, individuals with college / associate degree education have the highest percentage of unemployment, with 4.4% or 30 of them being unemployed.
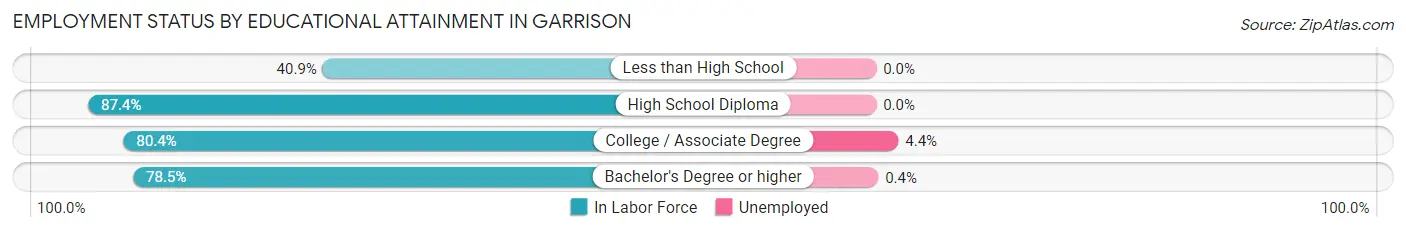
| Educational Attainment | In Labor Force | Unemployed |
| Less than High School | 18 (40.9%) | 0 (0.0%) |
| High School Diploma | 612 (87.4%) | 0 (0.0%) |
| College / Associate Degree | 687 (80.4%) | 38 (4.4%) |
| Bachelor's Degree or higher | 2,092 (78.5%) | 11 (0.4%) |
| Total | 3,407 (79.9%) | 47 (1.1%) |
Employment Occupations by Sex in Garrison
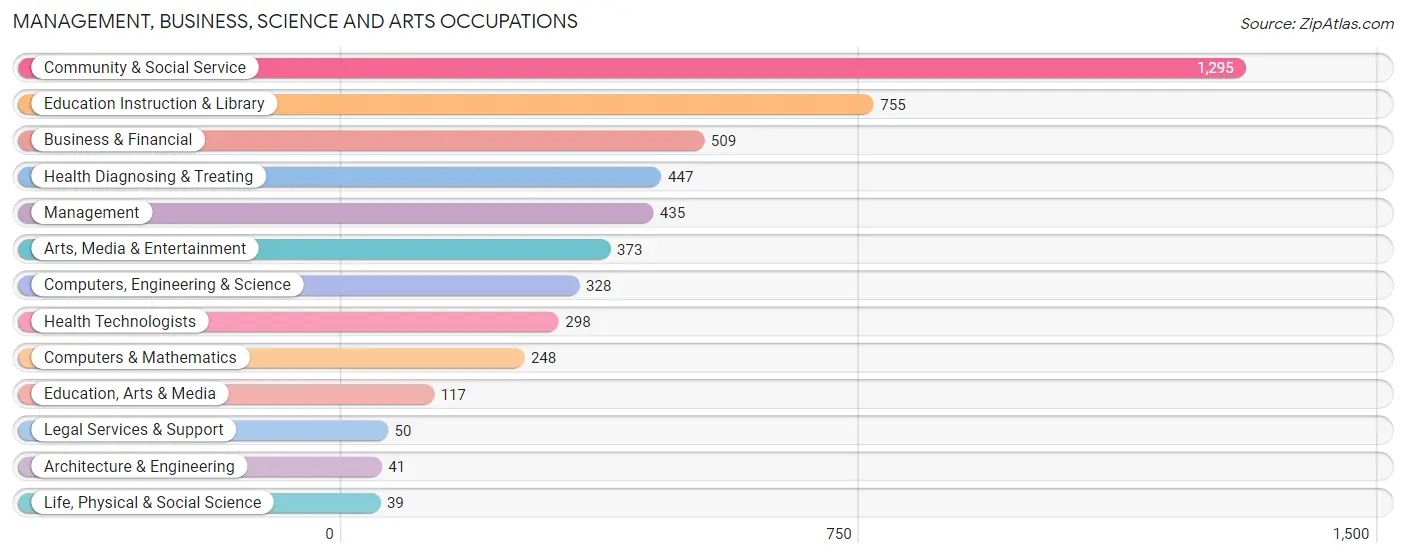
Management, Business, Science and Arts Occupations
The most common Management, Business, Science and Arts occupations in Garrison are Community & Social Service (1,295 | 27.8%), Education Instruction & Library (755 | 16.2%), Business & Financial (509 | 10.9%), Health Diagnosing & Treating (447 | 9.6%), and Management (435 | 9.3%).
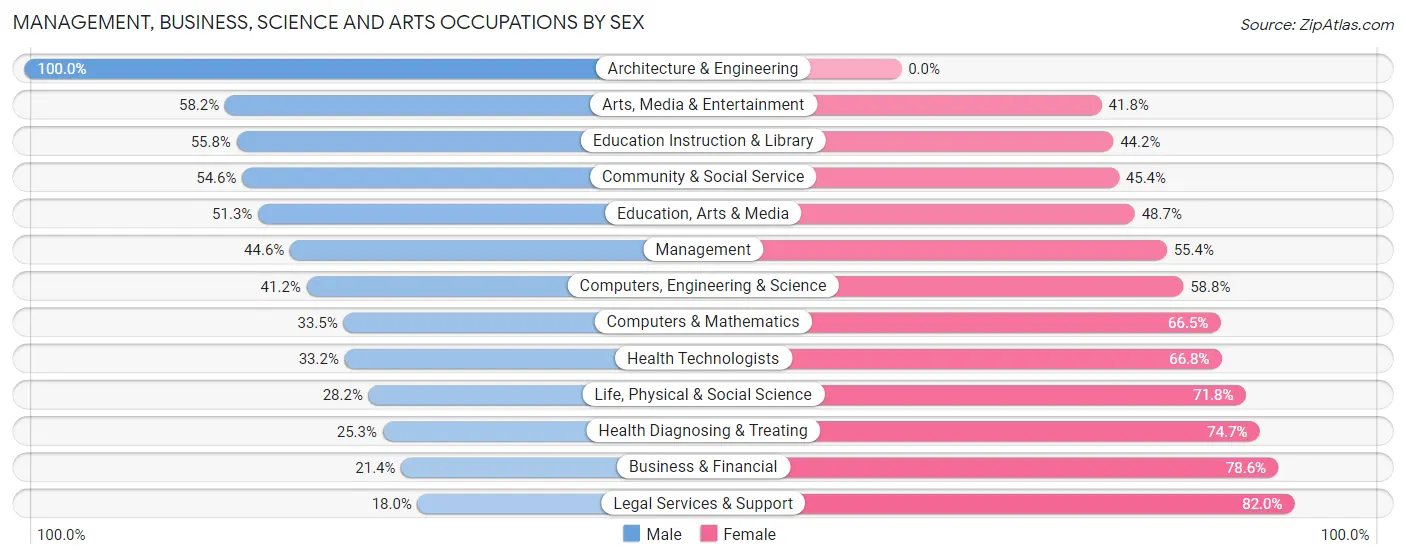
Management, Business, Science and Arts Occupations by Sex
Within the Management, Business, Science and Arts occupations in Garrison, the most male-oriented occupations are Architecture & Engineering (100.0%), Arts, Media & Entertainment (58.2%), and Education Instruction & Library (55.8%), while the most female-oriented occupations are Legal Services & Support (82.0%), Business & Financial (78.6%), and Health Diagnosing & Treating (74.7%).
| Occupation | Male | Female |
| Management | 194 (44.6%) | 241 (55.4%) |
| Business & Financial | 109 (21.4%) | 400 (78.6%) |
| Computers, Engineering & Science | 135 (41.2%) | 193 (58.8%) |
| Computers & Mathematics | 83 (33.5%) | 165 (66.5%) |
| Architecture & Engineering | 41 (100.0%) | 0 (0.0%) |
| Life, Physical & Social Science | 11 (28.2%) | 28 (71.8%) |
| Community & Social Service | 707 (54.6%) | 588 (45.4%) |
| Education, Arts & Media | 60 (51.3%) | 57 (48.7%) |
| Legal Services & Support | 9 (18.0%) | 41 (82.0%) |
| Education Instruction & Library | 421 (55.8%) | 334 (44.2%) |
| Arts, Media & Entertainment | 217 (58.2%) | 156 (41.8%) |
| Health Diagnosing & Treating | 113 (25.3%) | 334 (74.7%) |
| Health Technologists | 99 (33.2%) | 199 (66.8%) |
| Total (Category) | 1,258 (41.7%) | 1,756 (58.3%) |
| Total (Overall) | 2,373 (51.0%) | 2,281 (49.0%) |
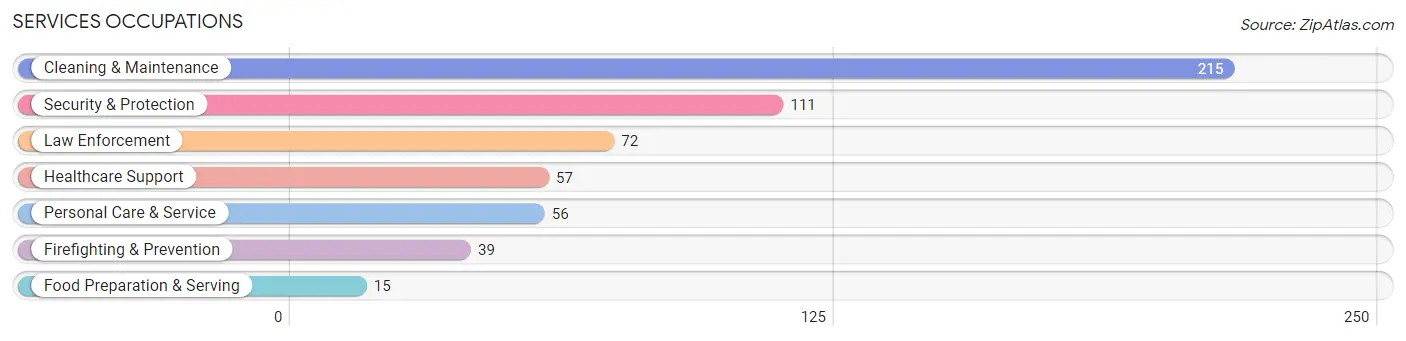
Services Occupations
The most common Services occupations in Garrison are Cleaning & Maintenance (215 | 4.6%), Security & Protection (111 | 2.4%), Law Enforcement (72 | 1.5%), Healthcare Support (57 | 1.2%), and Personal Care & Service (56 | 1.2%).
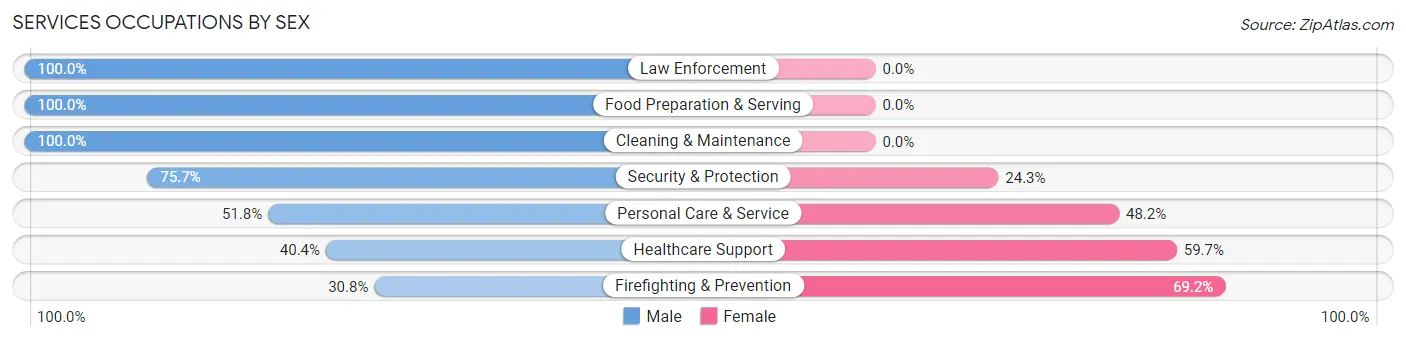
Services Occupations by Sex
Within the Services occupations in Garrison, the most male-oriented occupations are Law Enforcement (100.0%), Food Preparation & Serving (100.0%), and Cleaning & Maintenance (100.0%), while the most female-oriented occupations are Firefighting & Prevention (69.2%), Healthcare Support (59.7%), and Personal Care & Service (48.2%).
| Occupation | Male | Female |
| Healthcare Support | 23 (40.4%) | 34 (59.7%) |
| Security & Protection | 84 (75.7%) | 27 (24.3%) |
| Firefighting & Prevention | 12 (30.8%) | 27 (69.2%) |
| Law Enforcement | 72 (100.0%) | 0 (0.0%) |
| Food Preparation & Serving | 15 (100.0%) | 0 (0.0%) |
| Cleaning & Maintenance | 215 (100.0%) | 0 (0.0%) |
| Personal Care & Service | 29 (51.8%) | 27 (48.2%) |
| Total (Category) | 366 (80.6%) | 88 (19.4%) |
| Total (Overall) | 2,373 (51.0%) | 2,281 (49.0%) |
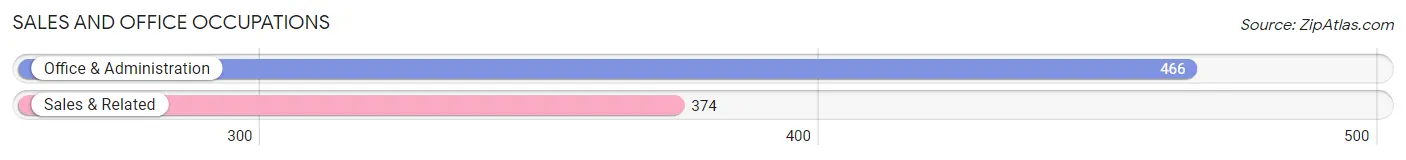
Sales and Office Occupations
The most common Sales and Office occupations in Garrison are Office & Administration (466 | 10.0%), and Sales & Related (374 | 8.0%).
Sales and Office Occupations by Sex
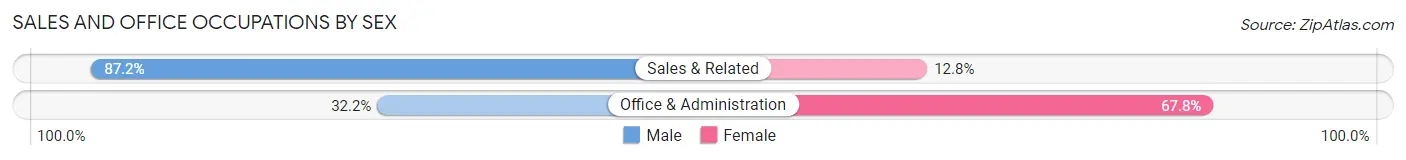
| Occupation | Male | Female |
| Sales & Related | 326 (87.2%) | 48 (12.8%) |
| Office & Administration | 150 (32.2%) | 316 (67.8%) |
| Total (Category) | 476 (56.7%) | 364 (43.3%) |
| Total (Overall) | 2,373 (51.0%) | 2,281 (49.0%) |
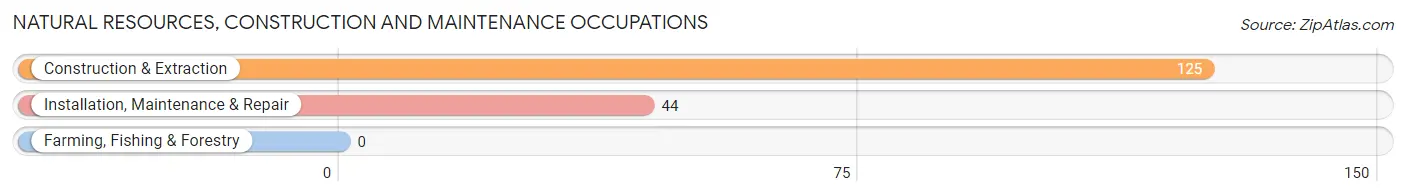
Natural Resources, Construction and Maintenance Occupations
The most common Natural Resources, Construction and Maintenance occupations in Garrison are Construction & Extraction (125 | 2.7%), and Installation, Maintenance & Repair (44 | 0.9%).
Natural Resources, Construction and Maintenance Occupations by Sex
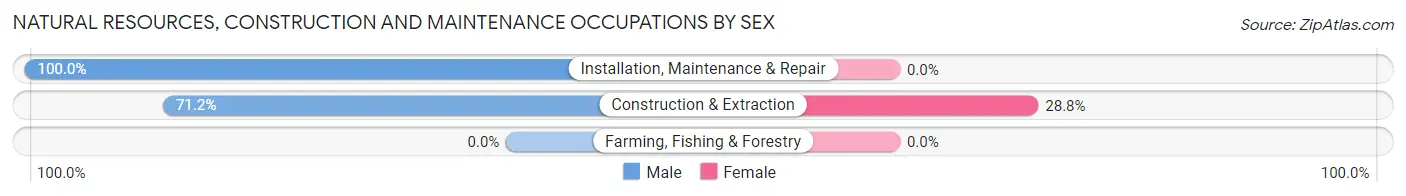
| Occupation | Male | Female |
| Farming, Fishing & Forestry | 0 (0.0%) | 0 (0.0%) |
| Construction & Extraction | 89 (71.2%) | 36 (28.8%) |
| Installation, Maintenance & Repair | 44 (100.0%) | 0 (0.0%) |
| Total (Category) | 133 (78.7%) | 36 (21.3%) |
| Total (Overall) | 2,373 (51.0%) | 2,281 (49.0%) |
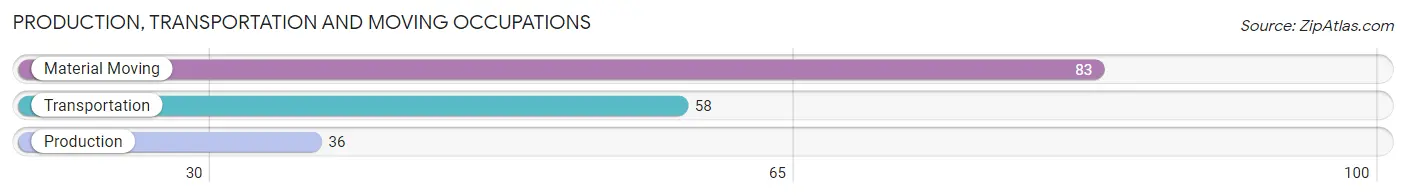
Production, Transportation and Moving Occupations
The most common Production, Transportation and Moving occupations in Garrison are Material Moving (83 | 1.8%), Transportation (58 | 1.3%), and Production (36 | 0.8%).
Production, Transportation and Moving Occupations by Sex
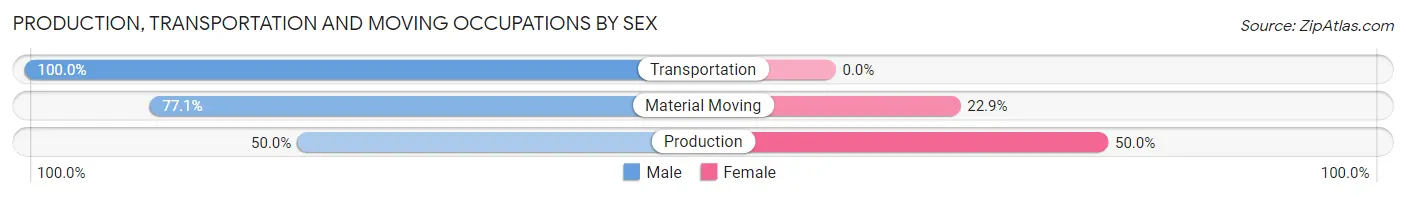
| Occupation | Male | Female |
| Production | 18 (50.0%) | 18 (50.0%) |
| Transportation | 58 (100.0%) | 0 (0.0%) |
| Material Moving | 64 (77.1%) | 19 (22.9%) |
| Total (Category) | 140 (79.1%) | 37 (20.9%) |
| Total (Overall) | 2,373 (51.0%) | 2,281 (49.0%) |
Employment Industries by Sex in Garrison
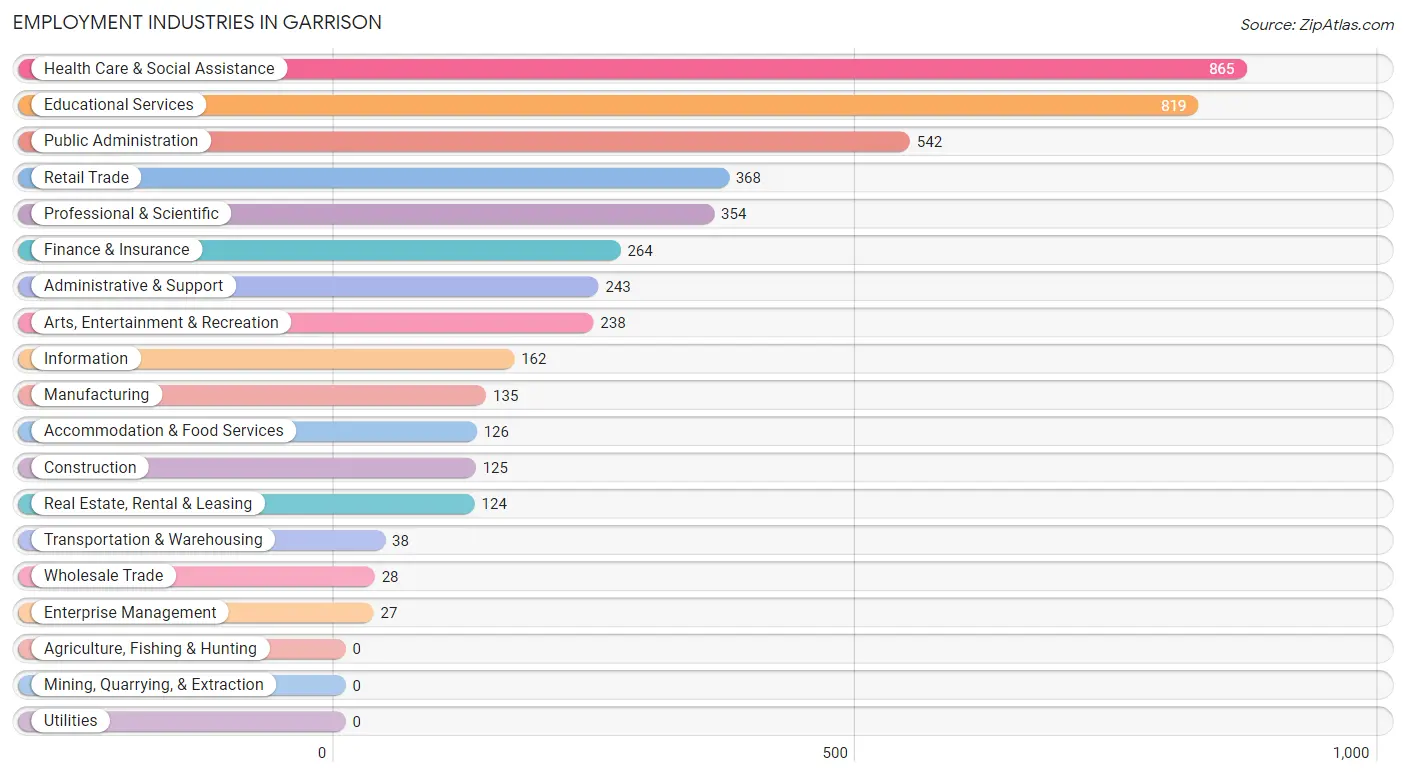
Employment Industries in Garrison
The major employment industries in Garrison include Health Care & Social Assistance (865 | 18.6%), Educational Services (819 | 17.6%), Public Administration (542 | 11.7%), Retail Trade (368 | 7.9%), and Professional & Scientific (354 | 7.6%).
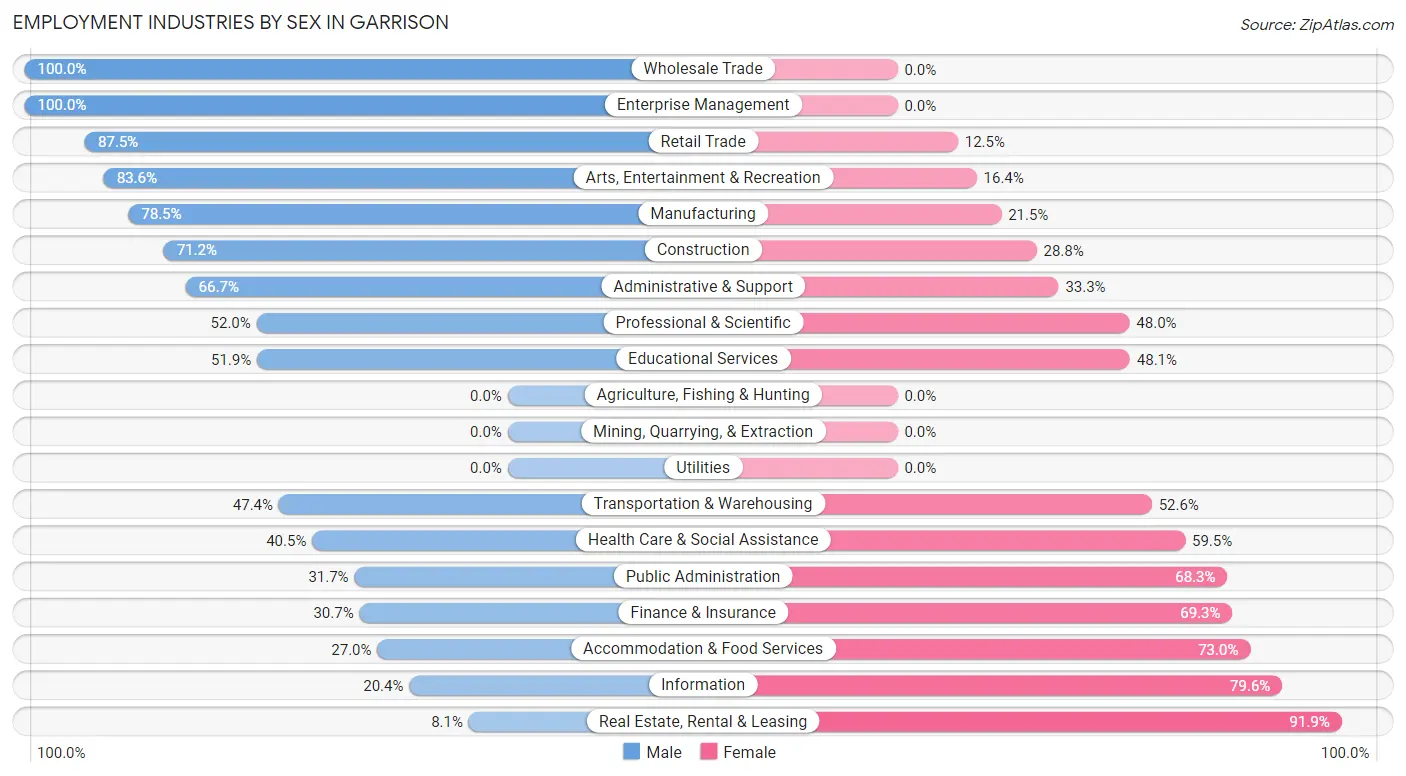
Employment Industries by Sex in Garrison
The Garrison industries that see more men than women are Wholesale Trade (100.0%), Enterprise Management (100.0%), and Retail Trade (87.5%), whereas the industries that tend to have a higher number of women are Real Estate, Rental & Leasing (91.9%), Information (79.6%), and Accommodation & Food Services (73.0%).
| Industry | Male | Female |
| Agriculture, Fishing & Hunting | 0 (0.0%) | 0 (0.0%) |
| Mining, Quarrying, & Extraction | 0 (0.0%) | 0 (0.0%) |
| Construction | 89 (71.2%) | 36 (28.8%) |
| Manufacturing | 106 (78.5%) | 29 (21.5%) |
| Wholesale Trade | 28 (100.0%) | 0 (0.0%) |
| Retail Trade | 322 (87.5%) | 46 (12.5%) |
| Transportation & Warehousing | 18 (47.4%) | 20 (52.6%) |
| Utilities | 0 (0.0%) | 0 (0.0%) |
| Information | 33 (20.4%) | 129 (79.6%) |
| Finance & Insurance | 81 (30.7%) | 183 (69.3%) |
| Real Estate, Rental & Leasing | 10 (8.1%) | 114 (91.9%) |
| Professional & Scientific | 184 (52.0%) | 170 (48.0%) |
| Enterprise Management | 27 (100.0%) | 0 (0.0%) |
| Administrative & Support | 162 (66.7%) | 81 (33.3%) |
| Educational Services | 425 (51.9%) | 394 (48.1%) |
| Health Care & Social Assistance | 350 (40.5%) | 515 (59.5%) |
| Arts, Entertainment & Recreation | 199 (83.6%) | 39 (16.4%) |
| Accommodation & Food Services | 34 (27.0%) | 92 (73.0%) |
| Public Administration | 172 (31.7%) | 370 (68.3%) |
| Total | 2,373 (51.0%) | 2,281 (49.0%) |
Education in Garrison
School Enrollment in Garrison
The most common levels of schooling among the 2,972 students in Garrison are college / undergraduate (714 | 24.0%), high school (597 | 20.1%), and elementary school (577 | 19.4%).
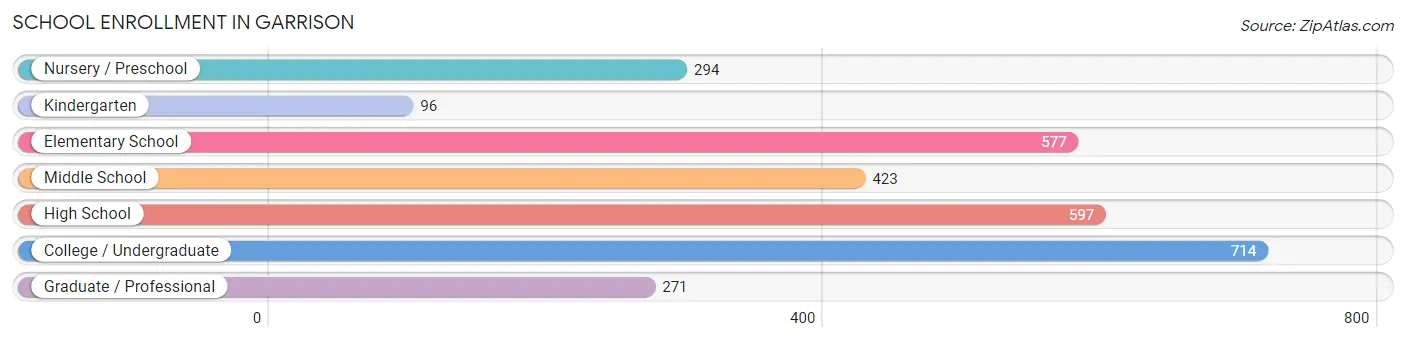
| School Level | # Students | % Students |
| Nursery / Preschool | 294 | 9.9% |
| Kindergarten | 96 | 3.2% |
| Elementary School | 577 | 19.4% |
| Middle School | 423 | 14.2% |
| High School | 597 | 20.1% |
| College / Undergraduate | 714 | 24.0% |
| Graduate / Professional | 271 | 9.1% |
| Total | 2,972 | 100.0% |
School Enrollment by Age by Funding Source in Garrison
Out of a total of 2,972 students who are enrolled in schools in Garrison, 1,768 (59.5%) attend a private institution, while the remaining 1,204 (40.5%) are enrolled in public schools. The age group of 10 to 14 year olds has the highest likelihood of being enrolled in private schools, with 445 (75.9% in the age bracket) enrolled. Conversely, the age group of 18 to 19 year olds has the lowest likelihood of being enrolled in a private school, with 111 (61.0% in the age bracket) attending a public institution.
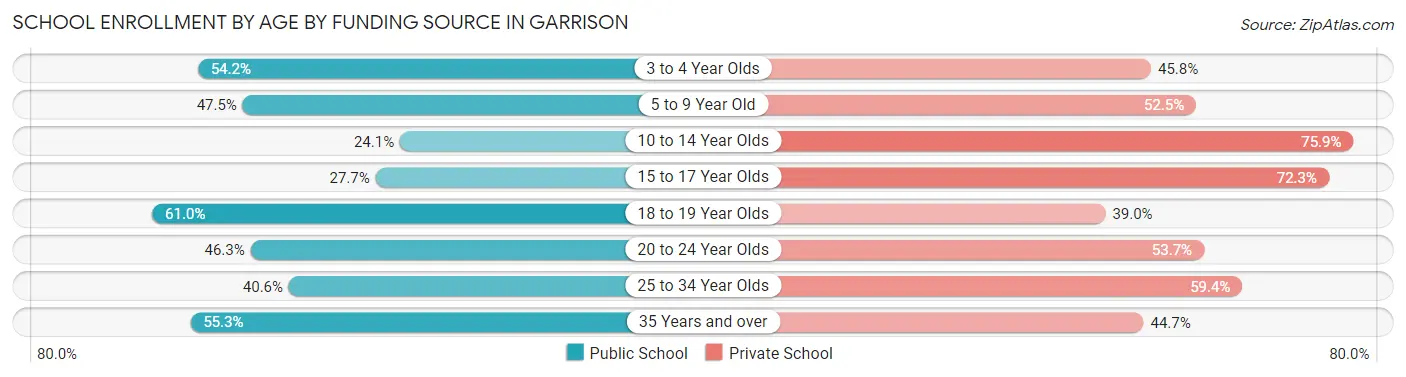
| Age Bracket | Public School | Private School |
| 3 to 4 Year Olds | 155 (54.2%) | 131 (45.8%) |
| 5 to 9 Year Old | 256 (47.5%) | 283 (52.5%) |
| 10 to 14 Year Olds | 141 (24.1%) | 445 (75.9%) |
| 15 to 17 Year Olds | 138 (27.7%) | 360 (72.3%) |
| 18 to 19 Year Olds | 111 (61.0%) | 71 (39.0%) |
| 20 to 24 Year Olds | 246 (46.3%) | 285 (53.7%) |
| 25 to 34 Year Olds | 104 (40.6%) | 152 (59.4%) |
| 35 Years and over | 52 (55.3%) | 42 (44.7%) |
| Total | 1,204 (40.5%) | 1,768 (59.5%) |
Educational Attainment by Field of Study in Garrison
Liberal arts & history (447 | 12.0%), education (441 | 11.9%), business (426 | 11.5%), social sciences (355 | 9.6%), and engineering (320 | 8.6%) are the most common fields of study among 3,710 individuals in Garrison who have obtained a bachelor's degree or higher.
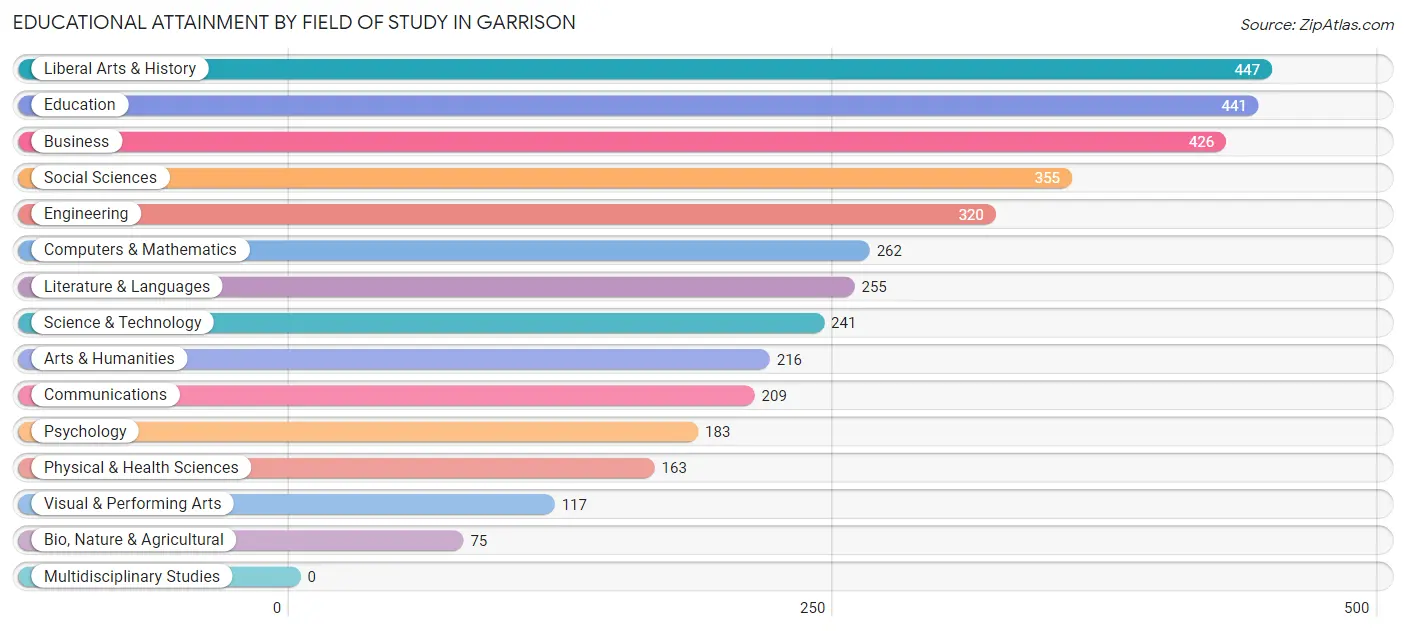
| Field of Study | # Graduates | % Graduates |
| Computers & Mathematics | 262 | 7.1% |
| Bio, Nature & Agricultural | 75 | 2.0% |
| Physical & Health Sciences | 163 | 4.4% |
| Psychology | 183 | 4.9% |
| Social Sciences | 355 | 9.6% |
| Engineering | 320 | 8.6% |
| Multidisciplinary Studies | 0 | 0.0% |
| Science & Technology | 241 | 6.5% |
| Business | 426 | 11.5% |
| Education | 441 | 11.9% |
| Literature & Languages | 255 | 6.9% |
| Liberal Arts & History | 447 | 12.0% |
| Visual & Performing Arts | 117 | 3.2% |
| Communications | 209 | 5.6% |
| Arts & Humanities | 216 | 5.8% |
| Total | 3,710 | 100.0% |
Transportation & Commute in Garrison
Vehicle Availability by Sex in Garrison
The most prevalent vehicle ownership categories in Garrison are males with 2 vehicles (1,171, accounting for 50.9%) and females with 2 vehicles (889, making up 51.9%).
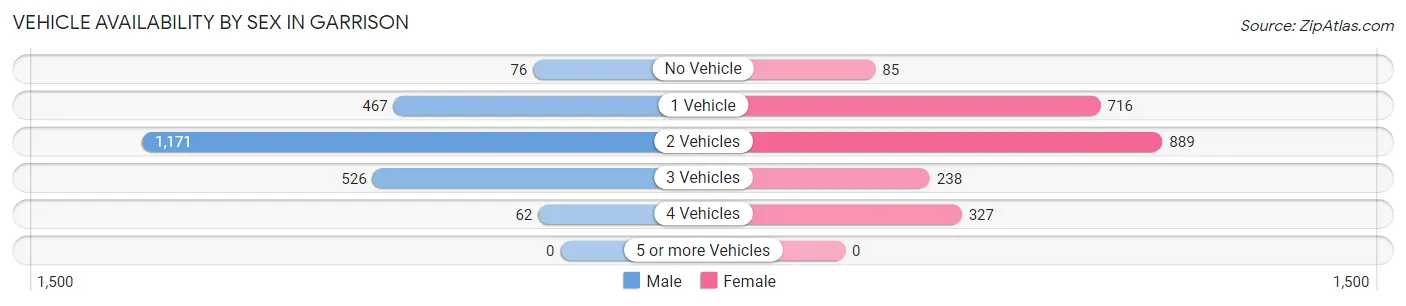
| Vehicles Available | Male | Female |
| No Vehicle | 76 (3.3%) | 85 (3.8%) |
| 1 Vehicle | 467 (20.3%) | 716 (31.8%) |
| 2 Vehicles | 1,171 (50.9%) | 889 (39.4%) |
| 3 Vehicles | 526 (22.9%) | 238 (10.5%) |
| 4 Vehicles | 62 (2.7%) | 327 (14.5%) |
| 5 or more Vehicles | 0 (0.0%) | 0 (0.0%) |
| Total | 2,302 (100.0%) | 2,255 (100.0%) |
Commute Time in Garrison
The most frequently occuring commute durations in Garrison are 10 to 14 minutes (626 commuters, 16.2%), 45 to 59 minutes (496 commuters, 12.8%), and 15 to 19 minutes (463 commuters, 11.9%).
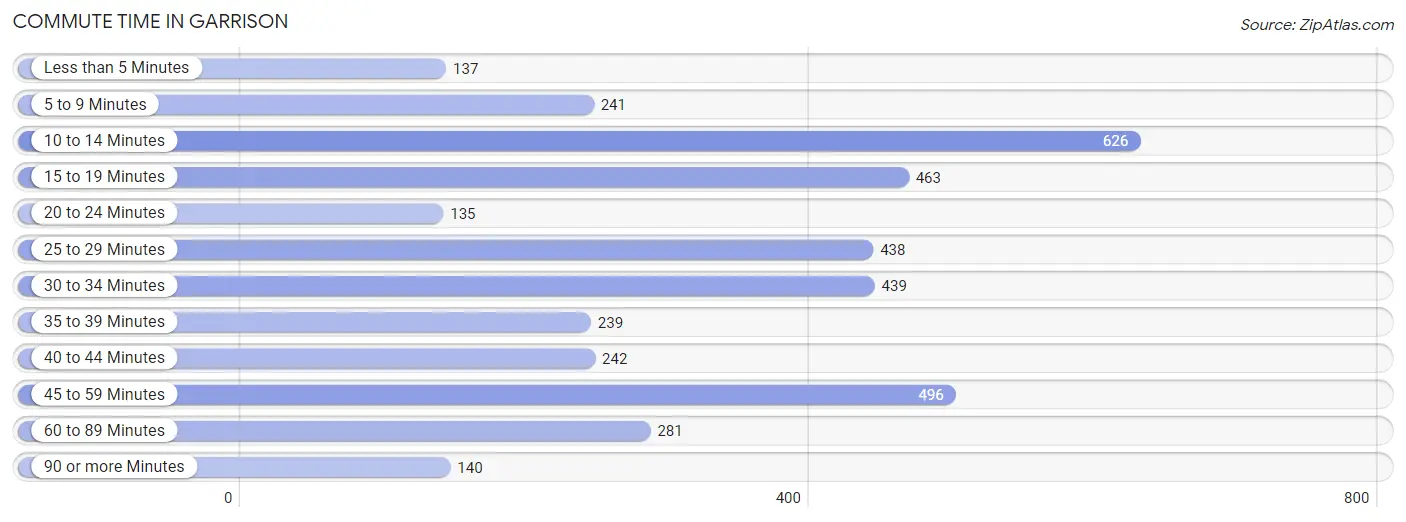
| Commute Time | # Commuters | % Commuters |
| Less than 5 Minutes | 137 | 3.5% |
| 5 to 9 Minutes | 241 | 6.2% |
| 10 to 14 Minutes | 626 | 16.2% |
| 15 to 19 Minutes | 463 | 11.9% |
| 20 to 24 Minutes | 135 | 3.5% |
| 25 to 29 Minutes | 438 | 11.3% |
| 30 to 34 Minutes | 439 | 11.3% |
| 35 to 39 Minutes | 239 | 6.2% |
| 40 to 44 Minutes | 242 | 6.2% |
| 45 to 59 Minutes | 496 | 12.8% |
| 60 to 89 Minutes | 281 | 7.2% |
| 90 or more Minutes | 140 | 3.6% |
Commute Time by Sex in Garrison
The most common commute times in Garrison are 25 to 29 minutes (290 commuters, 14.7%) for males and 45 to 59 minutes (404 commuters, 21.3%) for females.
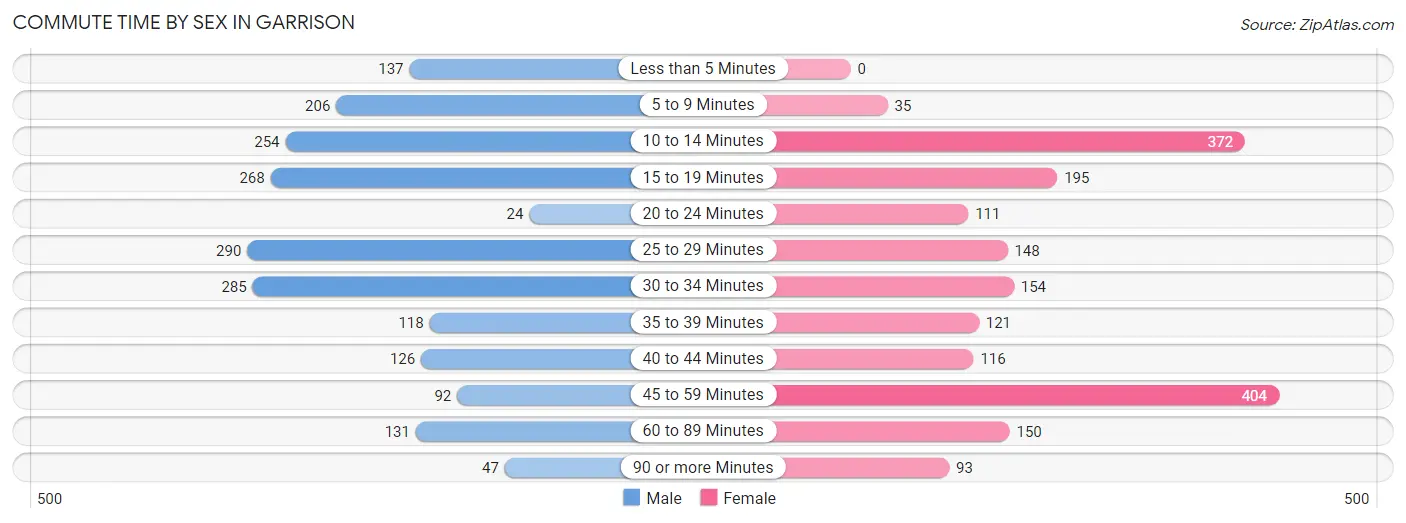
| Commute Time | Male | Female |
| Less than 5 Minutes | 137 (6.9%) | 0 (0.0%) |
| 5 to 9 Minutes | 206 (10.4%) | 35 (1.8%) |
| 10 to 14 Minutes | 254 (12.8%) | 372 (19.6%) |
| 15 to 19 Minutes | 268 (13.6%) | 195 (10.3%) |
| 20 to 24 Minutes | 24 (1.2%) | 111 (5.9%) |
| 25 to 29 Minutes | 290 (14.7%) | 148 (7.8%) |
| 30 to 34 Minutes | 285 (14.4%) | 154 (8.1%) |
| 35 to 39 Minutes | 118 (6.0%) | 121 (6.4%) |
| 40 to 44 Minutes | 126 (6.4%) | 116 (6.1%) |
| 45 to 59 Minutes | 92 (4.6%) | 404 (21.3%) |
| 60 to 89 Minutes | 131 (6.6%) | 150 (7.9%) |
| 90 or more Minutes | 47 (2.4%) | 93 (4.9%) |
Time of Departure to Work by Sex in Garrison
The most frequent times of departure to work in Garrison are 6:30 AM to 6:59 AM (441, 22.3%) for males and 8:00 AM to 8:29 AM (378, 19.9%) for females.
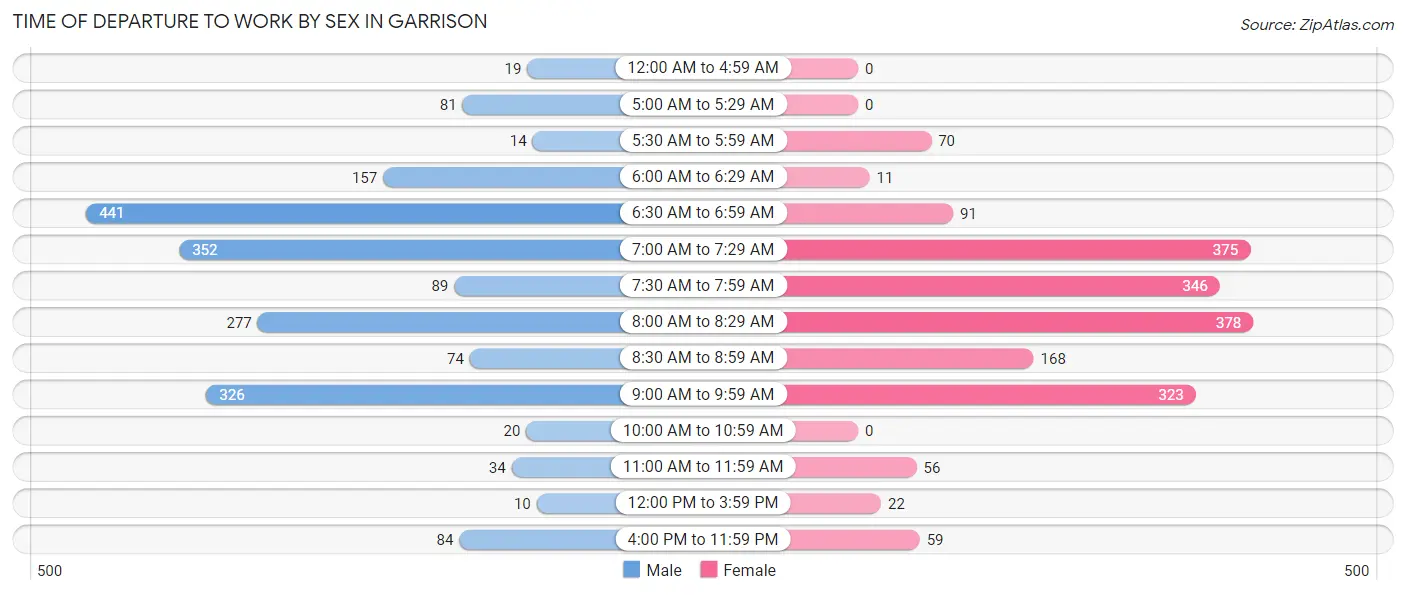
| Time of Departure | Male | Female |
| 12:00 AM to 4:59 AM | 19 (1.0%) | 0 (0.0%) |
| 5:00 AM to 5:29 AM | 81 (4.1%) | 0 (0.0%) |
| 5:30 AM to 5:59 AM | 14 (0.7%) | 70 (3.7%) |
| 6:00 AM to 6:29 AM | 157 (7.9%) | 11 (0.6%) |
| 6:30 AM to 6:59 AM | 441 (22.3%) | 91 (4.8%) |
| 7:00 AM to 7:29 AM | 352 (17.8%) | 375 (19.8%) |
| 7:30 AM to 7:59 AM | 89 (4.5%) | 346 (18.2%) |
| 8:00 AM to 8:29 AM | 277 (14.0%) | 378 (19.9%) |
| 8:30 AM to 8:59 AM | 74 (3.7%) | 168 (8.8%) |
| 9:00 AM to 9:59 AM | 326 (16.5%) | 323 (17.0%) |
| 10:00 AM to 10:59 AM | 20 (1.0%) | 0 (0.0%) |
| 11:00 AM to 11:59 AM | 34 (1.7%) | 56 (2.9%) |
| 12:00 PM to 3:59 PM | 10 (0.5%) | 22 (1.2%) |
| 4:00 PM to 11:59 PM | 84 (4.3%) | 59 (3.1%) |
| Total | 1,978 (100.0%) | 1,899 (100.0%) |
Housing Occupancy in Garrison
Occupancy by Ownership in Garrison
Of the total 3,504 dwellings in Garrison, owner-occupied units account for 1,418 (40.5%), while renter-occupied units make up 2,086 (59.5%).
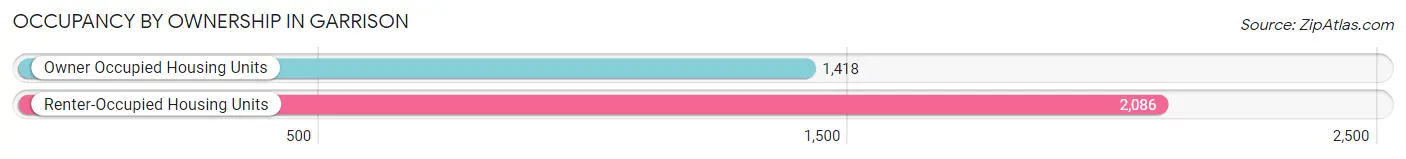
| Occupancy | # Housing Units | % Housing Units |
| Owner Occupied Housing Units | 1,418 | 40.5% |
| Renter-Occupied Housing Units | 2,086 | 59.5% |
| Total Occupied Housing Units | 3,504 | 100.0% |
Occupancy by Household Size in Garrison
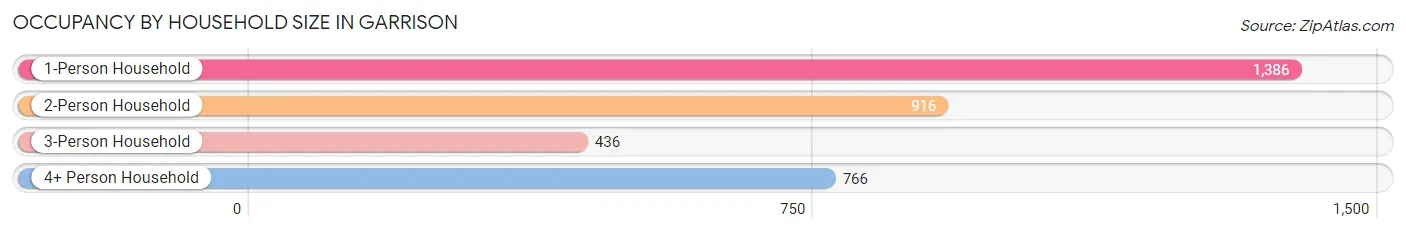
| Household Size | # Housing Units | % Housing Units |
| 1-Person Household | 1,386 | 39.6% |
| 2-Person Household | 916 | 26.1% |
| 3-Person Household | 436 | 12.4% |
| 4+ Person Household | 766 | 21.9% |
| Total Housing Units | 3,504 | 100.0% |
Occupancy by Ownership by Household Size in Garrison
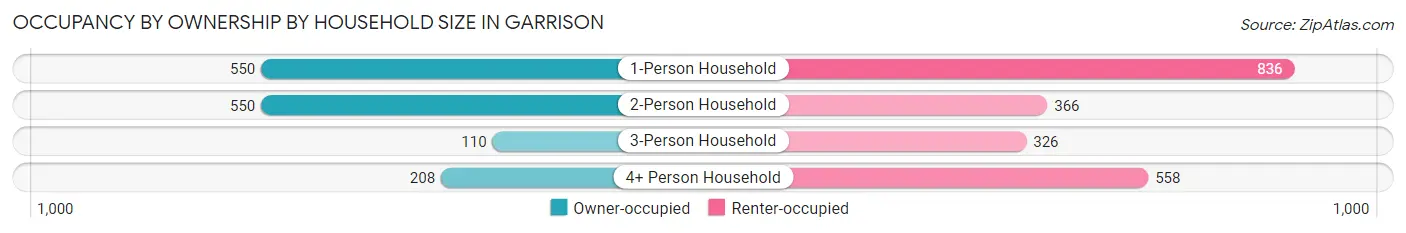
| Household Size | Owner-occupied | Renter-occupied |
| 1-Person Household | 550 (39.7%) | 836 (60.3%) |
| 2-Person Household | 550 (60.0%) | 366 (40.0%) |
| 3-Person Household | 110 (25.2%) | 326 (74.8%) |
| 4+ Person Household | 208 (27.2%) | 558 (72.9%) |
| Total Housing Units | 1,418 (40.5%) | 2,086 (59.5%) |
Occupancy by Educational Attainment in Garrison
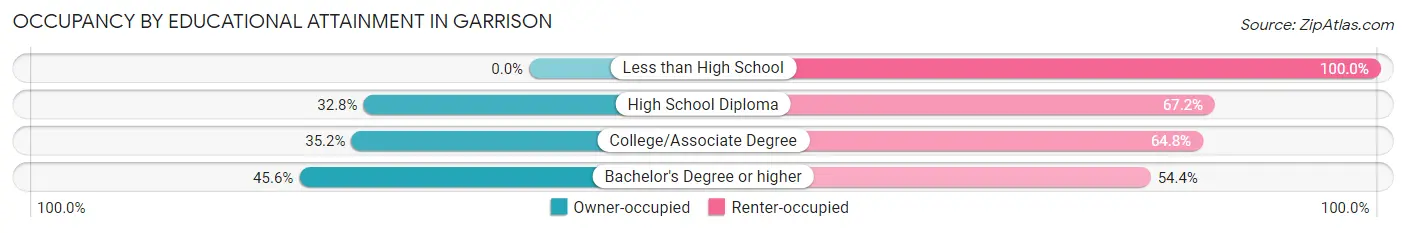
| Household Size | Owner-occupied | Renter-occupied |
| Less than High School | 0 (0.0%) | 74 (100.0%) |
| High School Diploma | 133 (32.8%) | 272 (67.2%) |
| College/Associate Degree | 318 (35.2%) | 585 (64.8%) |
| Bachelor's Degree or higher | 967 (45.6%) | 1,155 (54.4%) |
Occupancy by Age of Householder in Garrison
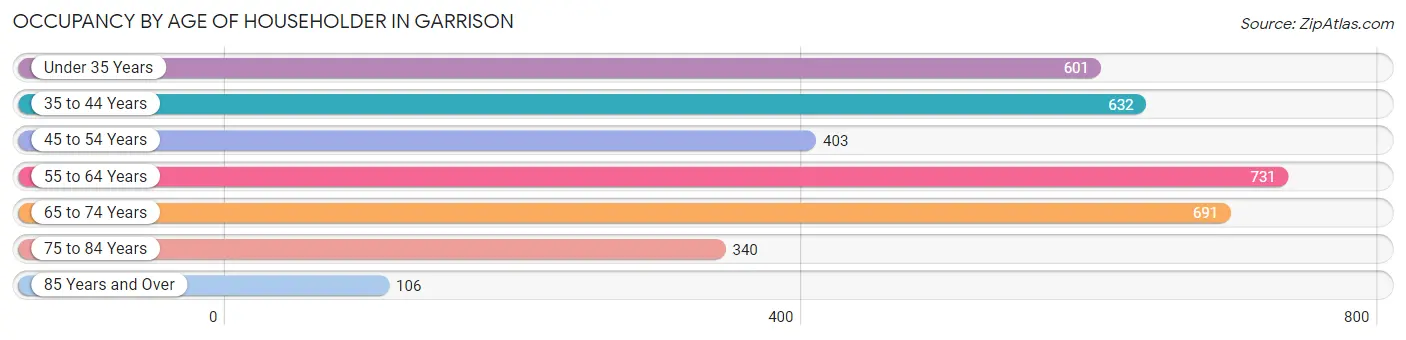
| Age Bracket | # Households | % Households |
| Under 35 Years | 601 | 17.2% |
| 35 to 44 Years | 632 | 18.0% |
| 45 to 54 Years | 403 | 11.5% |
| 55 to 64 Years | 731 | 20.9% |
| 65 to 74 Years | 691 | 19.7% |
| 75 to 84 Years | 340 | 9.7% |
| 85 Years and Over | 106 | 3.0% |
| Total | 3,504 | 100.0% |
Housing Finances in Garrison
Median Income by Occupancy in Garrison
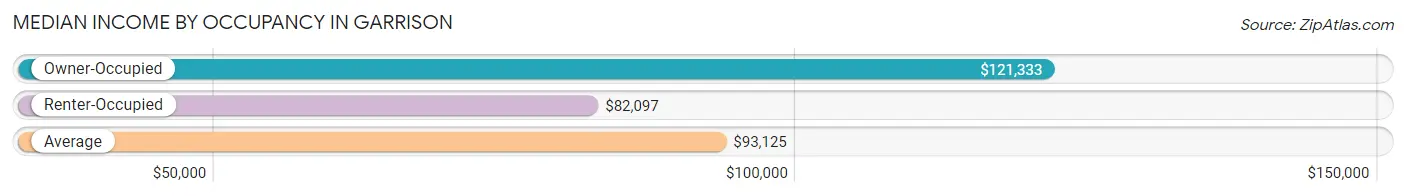
| Occupancy Type | # Households | Median Income |
| Owner-Occupied | 1,418 (40.5%) | $121,333 |
| Renter-Occupied | 2,086 (59.5%) | $82,097 |
| Average | 3,504 (100.0%) | $93,125 |
Occupancy by Householder Income Bracket in Garrison
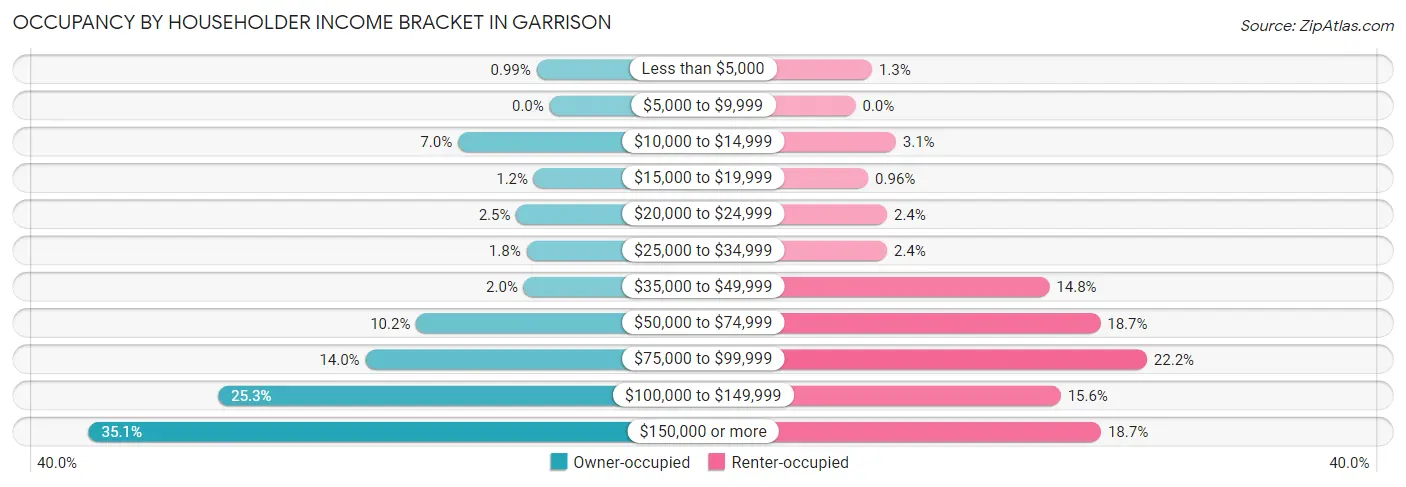
| Income Bracket | Owner-occupied | Renter-occupied |
| Less than $5,000 | 14 (1.0%) | 26 (1.3%) |
| $5,000 to $9,999 | 0 (0.0%) | 0 (0.0%) |
| $10,000 to $14,999 | 99 (7.0%) | 64 (3.1%) |
| $15,000 to $19,999 | 17 (1.2%) | 20 (1.0%) |
| $20,000 to $24,999 | 36 (2.5%) | 50 (2.4%) |
| $25,000 to $34,999 | 25 (1.8%) | 50 (2.4%) |
| $35,000 to $49,999 | 28 (2.0%) | 308 (14.8%) |
| $50,000 to $74,999 | 144 (10.2%) | 389 (18.6%) |
| $75,000 to $99,999 | 199 (14.0%) | 463 (22.2%) |
| $100,000 to $149,999 | 358 (25.3%) | 326 (15.6%) |
| $150,000 or more | 498 (35.1%) | 390 (18.7%) |
| Total | 1,418 (100.0%) | 2,086 (100.0%) |
Monthly Housing Cost Tiers in Garrison
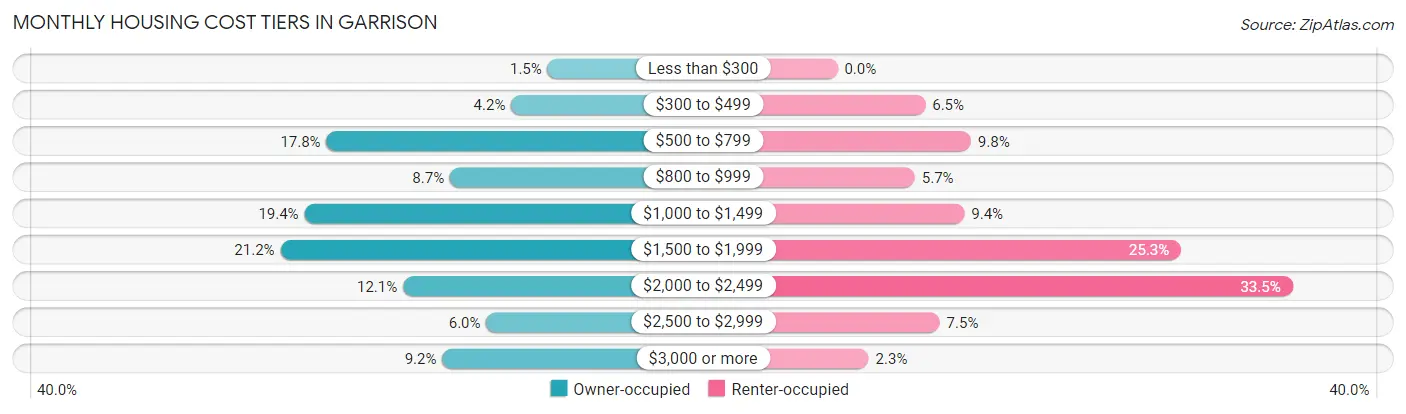
| Monthly Cost | Owner-occupied | Renter-occupied |
| Less than $300 | 21 (1.5%) | 0 (0.0%) |
| $300 to $499 | 59 (4.2%) | 135 (6.5%) |
| $500 to $799 | 252 (17.8%) | 205 (9.8%) |
| $800 to $999 | 123 (8.7%) | 119 (5.7%) |
| $1,000 to $1,499 | 275 (19.4%) | 195 (9.3%) |
| $1,500 to $1,999 | 300 (21.2%) | 528 (25.3%) |
| $2,000 to $2,499 | 172 (12.1%) | 699 (33.5%) |
| $2,500 to $2,999 | 85 (6.0%) | 157 (7.5%) |
| $3,000 or more | 131 (9.2%) | 48 (2.3%) |
| Total | 1,418 (100.0%) | 2,086 (100.0%) |
Physical Housing Characteristics in Garrison
Housing Structures in Garrison
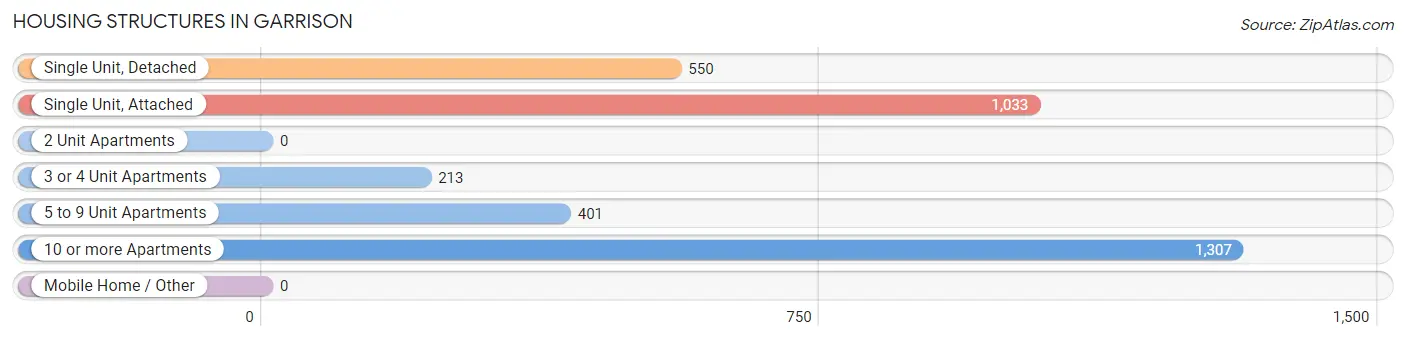
| Structure Type | # Housing Units | % Housing Units |
| Single Unit, Detached | 550 | 15.7% |
| Single Unit, Attached | 1,033 | 29.5% |
| 2 Unit Apartments | 0 | 0.0% |
| 3 or 4 Unit Apartments | 213 | 6.1% |
| 5 to 9 Unit Apartments | 401 | 11.4% |
| 10 or more Apartments | 1,307 | 37.3% |
| Mobile Home / Other | 0 | 0.0% |
| Total | 3,504 | 100.0% |
Housing Structures by Occupancy in Garrison
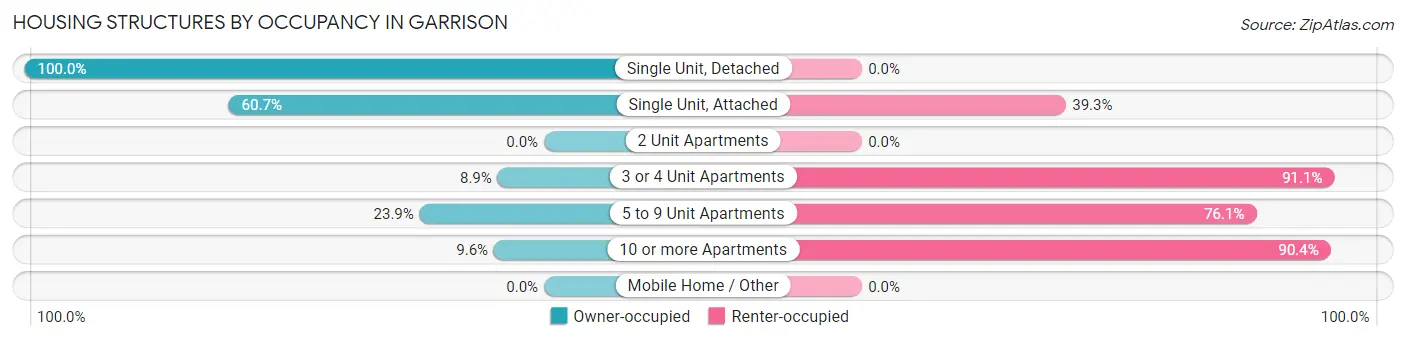
| Structure Type | Owner-occupied | Renter-occupied |
| Single Unit, Detached | 550 (100.0%) | 0 (0.0%) |
| Single Unit, Attached | 627 (60.7%) | 406 (39.3%) |
| 2 Unit Apartments | 0 (0.0%) | 0 (0.0%) |
| 3 or 4 Unit Apartments | 19 (8.9%) | 194 (91.1%) |
| 5 to 9 Unit Apartments | 96 (23.9%) | 305 (76.1%) |
| 10 or more Apartments | 126 (9.6%) | 1,181 (90.4%) |
| Mobile Home / Other | 0 (0.0%) | 0 (0.0%) |
| Total | 1,418 (40.5%) | 2,086 (59.5%) |
Housing Structures by Number of Rooms in Garrison
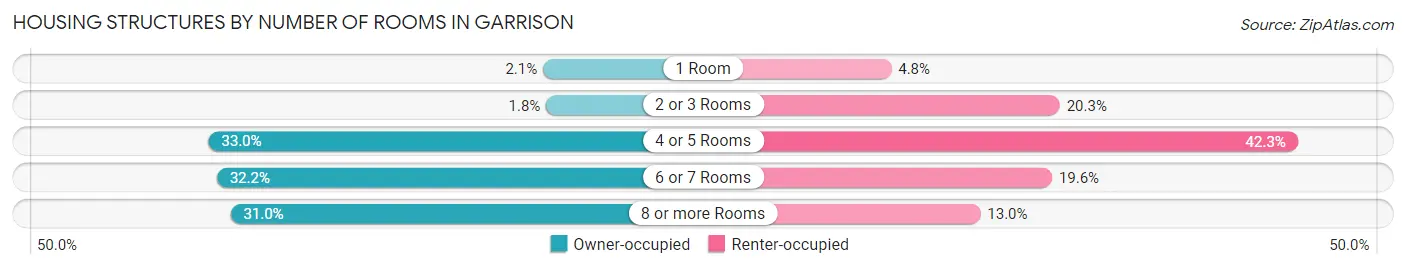
| Number of Rooms | Owner-occupied | Renter-occupied |
| 1 Room | 29 (2.1%) | 99 (4.8%) |
| 2 or 3 Rooms | 25 (1.8%) | 424 (20.3%) |
| 4 or 5 Rooms | 468 (33.0%) | 883 (42.3%) |
| 6 or 7 Rooms | 457 (32.2%) | 409 (19.6%) |
| 8 or more Rooms | 439 (31.0%) | 271 (13.0%) |
| Total | 1,418 (100.0%) | 2,086 (100.0%) |
Housing Structure by Heating Type in Garrison
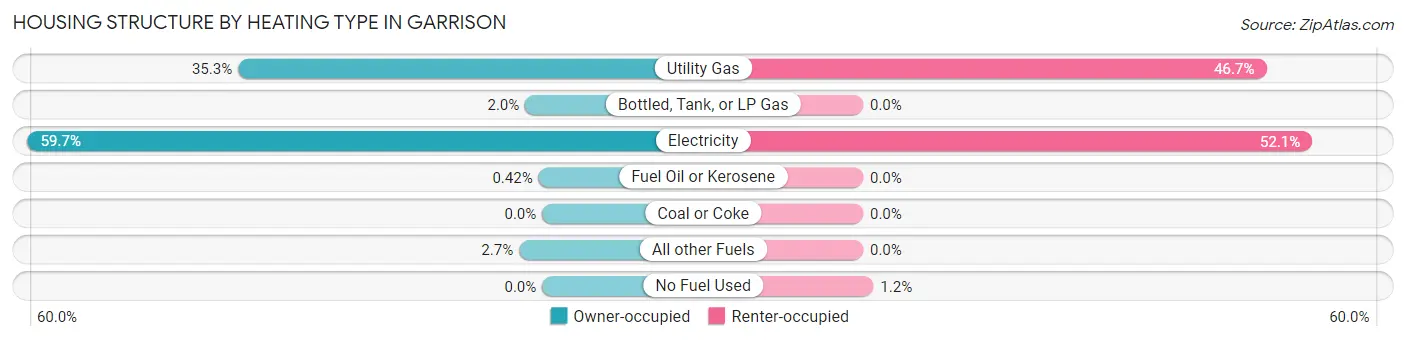
| Heating Type | Owner-occupied | Renter-occupied |
| Utility Gas | 500 (35.3%) | 975 (46.7%) |
| Bottled, Tank, or LP Gas | 28 (2.0%) | 0 (0.0%) |
| Electricity | 846 (59.7%) | 1,086 (52.1%) |
| Fuel Oil or Kerosene | 6 (0.4%) | 0 (0.0%) |
| Coal or Coke | 0 (0.0%) | 0 (0.0%) |
| All other Fuels | 38 (2.7%) | 0 (0.0%) |
| No Fuel Used | 0 (0.0%) | 25 (1.2%) |
| Total | 1,418 (100.0%) | 2,086 (100.0%) |
Household Vehicle Usage in Garrison
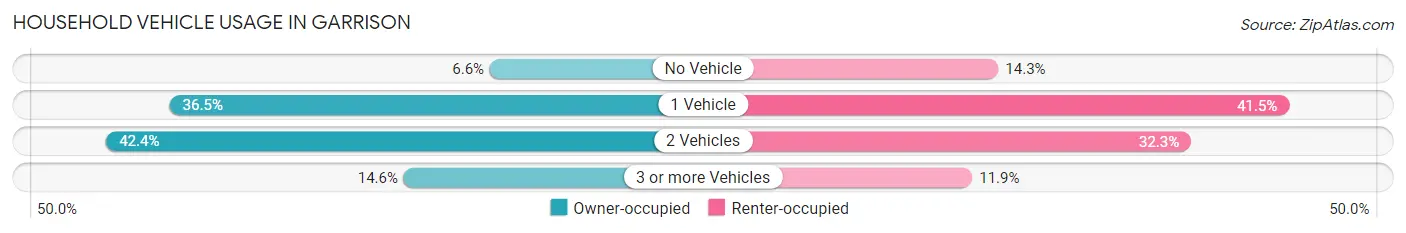
| Vehicles per Household | Owner-occupied | Renter-occupied |
| No Vehicle | 93 (6.6%) | 299 (14.3%) |
| 1 Vehicle | 517 (36.5%) | 865 (41.5%) |
| 2 Vehicles | 601 (42.4%) | 674 (32.3%) |
| 3 or more Vehicles | 207 (14.6%) | 248 (11.9%) |
| Total | 1,418 (100.0%) | 2,086 (100.0%) |
Real Estate & Mortgages in Garrison
Real Estate and Mortgage Overview in Garrison
| Characteristic | Without Mortgage | With Mortgage |
| Housing Units | 552 | 866 |
| Median Property Value | $343,100 | $316,900 |
| Median Household Income | $101,500 | $293 |
| Monthly Housing Costs | $826 | $100 |
| Real Estate Taxes | $4,000 | $142 |
Property Value by Mortgage Status in Garrison
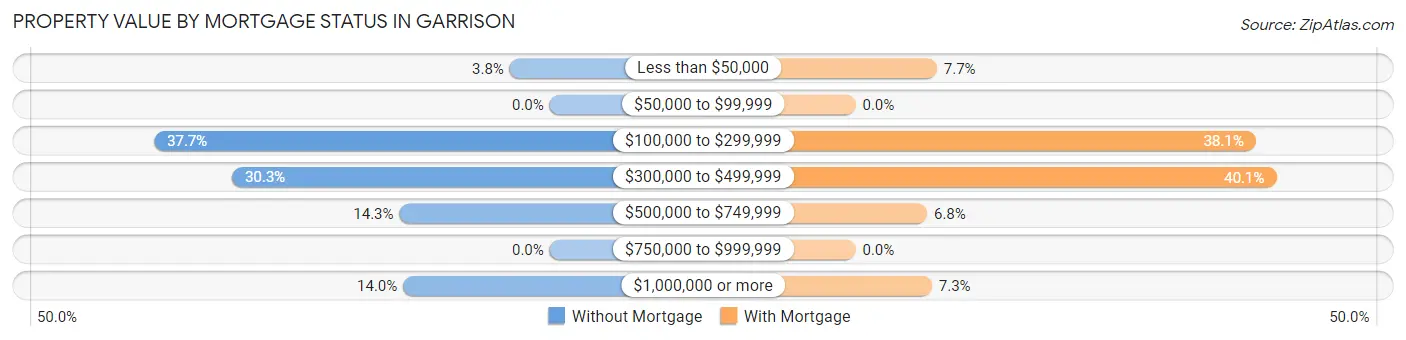
| Property Value | Without Mortgage | With Mortgage |
| Less than $50,000 | 21 (3.8%) | 67 (7.7%) |
| $50,000 to $99,999 | 0 (0.0%) | 0 (0.0%) |
| $100,000 to $299,999 | 208 (37.7%) | 330 (38.1%) |
| $300,000 to $499,999 | 167 (30.2%) | 347 (40.1%) |
| $500,000 to $749,999 | 79 (14.3%) | 59 (6.8%) |
| $750,000 to $999,999 | 0 (0.0%) | 0 (0.0%) |
| $1,000,000 or more | 77 (14.0%) | 63 (7.3%) |
| Total | 552 (100.0%) | 866 (100.0%) |
Household Income by Mortgage Status in Garrison
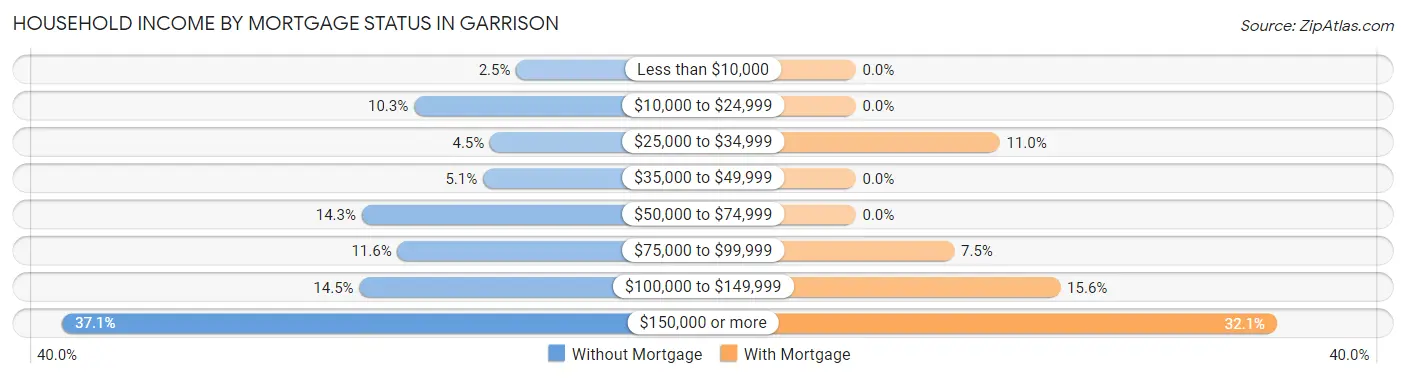
| Household Income | Without Mortgage | With Mortgage |
| Less than $10,000 | 14 (2.5%) | 0 (0.0%) |
| $10,000 to $24,999 | 57 (10.3%) | 0 (0.0%) |
| $25,000 to $34,999 | 25 (4.5%) | 95 (11.0%) |
| $35,000 to $49,999 | 28 (5.1%) | 0 (0.0%) |
| $50,000 to $74,999 | 79 (14.3%) | 0 (0.0%) |
| $75,000 to $99,999 | 64 (11.6%) | 65 (7.5%) |
| $100,000 to $149,999 | 80 (14.5%) | 135 (15.6%) |
| $150,000 or more | 205 (37.1%) | 278 (32.1%) |
| Total | 552 (100.0%) | 866 (100.0%) |
Property Value to Household Income Ratio in Garrison
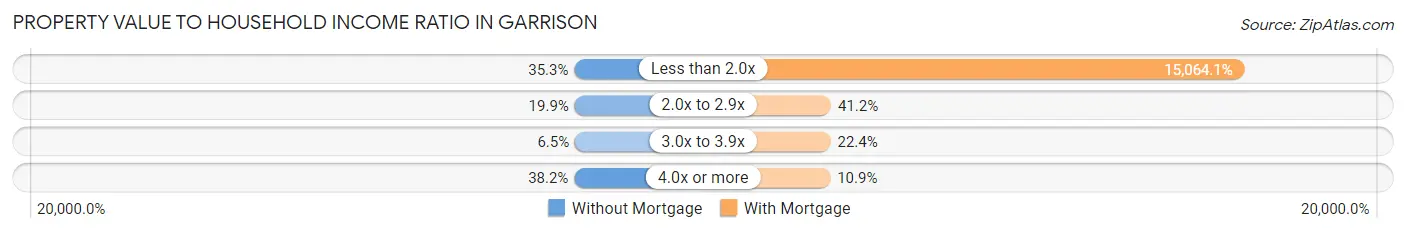
| Value-to-Income Ratio | Without Mortgage | With Mortgage |
| Less than 2.0x | 195 (35.3%) | 130,455 (15,064.1%) |
| 2.0x to 2.9x | 110 (19.9%) | 357 (41.2%) |
| 3.0x to 3.9x | 36 (6.5%) | 194 (22.4%) |
| 4.0x or more | 211 (38.2%) | 94 (10.8%) |
| Total | 552 (100.0%) | 866 (100.0%) |
Real Estate Taxes by Mortgage Status in Garrison
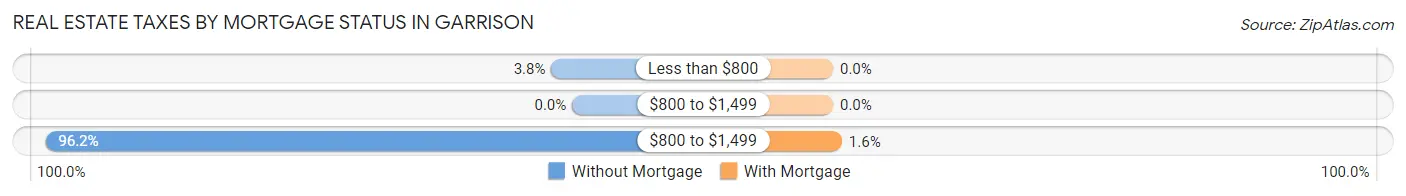
| Property Taxes | Without Mortgage | With Mortgage |
| Less than $800 | 21 (3.8%) | 0 (0.0%) |
| $800 to $1,499 | 0 (0.0%) | 0 (0.0%) |
| $800 to $1,499 | 531 (96.2%) | 14 (1.6%) |
| Total | 552 (100.0%) | 866 (100.0%) |
Health & Disability in Garrison
Health Insurance Coverage by Age in Garrison
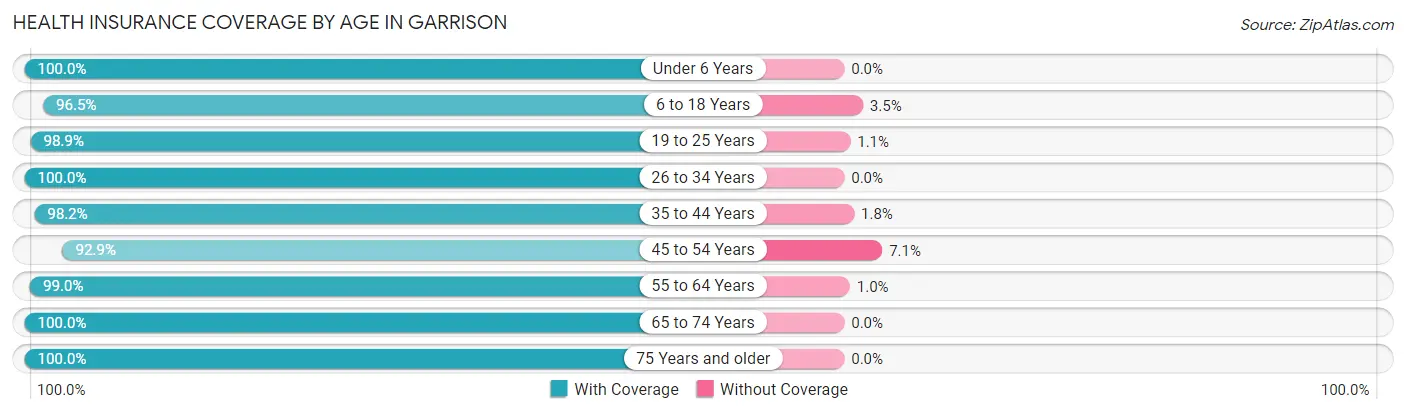
| Age Bracket | With Coverage | Without Coverage |
| Under 6 Years | 790 (100.0%) | 0 (0.0%) |
| 6 to 18 Years | 1,806 (96.5%) | 65 (3.5%) |
| 19 to 25 Years | 1,320 (98.9%) | 15 (1.1%) |
| 26 to 34 Years | 738 (100.0%) | 0 (0.0%) |
| 35 to 44 Years | 1,232 (98.2%) | 23 (1.8%) |
| 45 to 54 Years | 800 (92.9%) | 61 (7.1%) |
| 55 to 64 Years | 1,151 (99.0%) | 12 (1.0%) |
| 65 to 74 Years | 1,097 (100.0%) | 0 (0.0%) |
| 75 Years and older | 645 (100.0%) | 0 (0.0%) |
| Total | 9,579 (98.2%) | 176 (1.8%) |
Health Insurance Coverage by Citizenship Status in Garrison
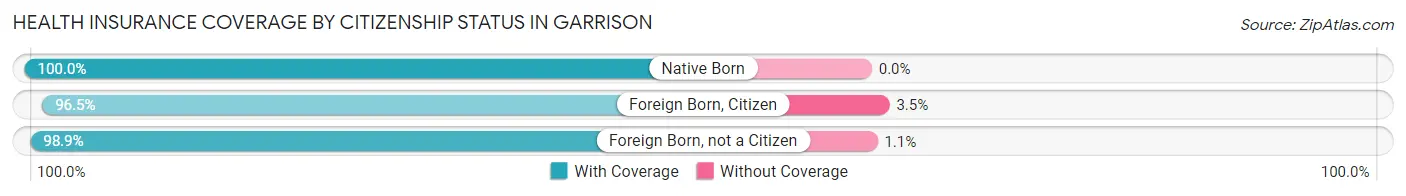
| Citizenship Status | With Coverage | Without Coverage |
| Native Born | 790 (100.0%) | 0 (0.0%) |
| Foreign Born, Citizen | 1,806 (96.5%) | 65 (3.5%) |
| Foreign Born, not a Citizen | 1,320 (98.9%) | 15 (1.1%) |
Health Insurance Coverage by Household Income in Garrison
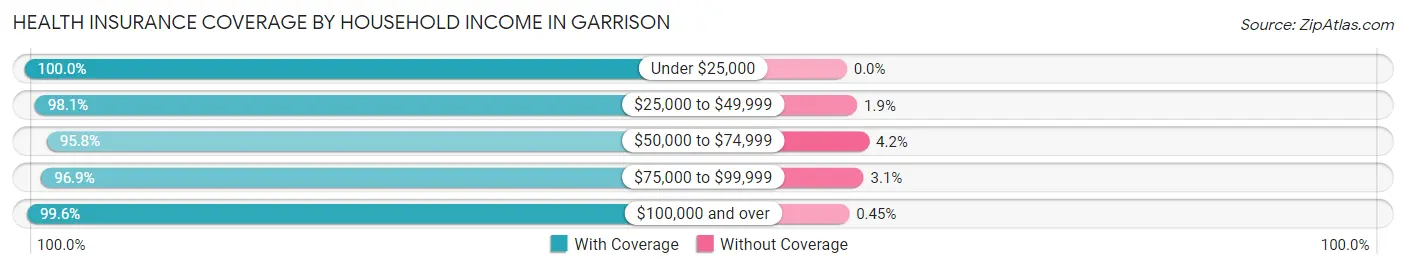
| Household Income | With Coverage | Without Coverage |
| Under $25,000 | 505 (100.0%) | 0 (0.0%) |
| $25,000 to $49,999 | 607 (98.1%) | 12 (1.9%) |
| $50,000 to $74,999 | 2,086 (95.8%) | 91 (4.2%) |
| $75,000 to $99,999 | 1,636 (96.9%) | 53 (3.1%) |
| $100,000 and over | 4,423 (99.6%) | 20 (0.4%) |
Public vs Private Health Insurance Coverage by Age in Garrison
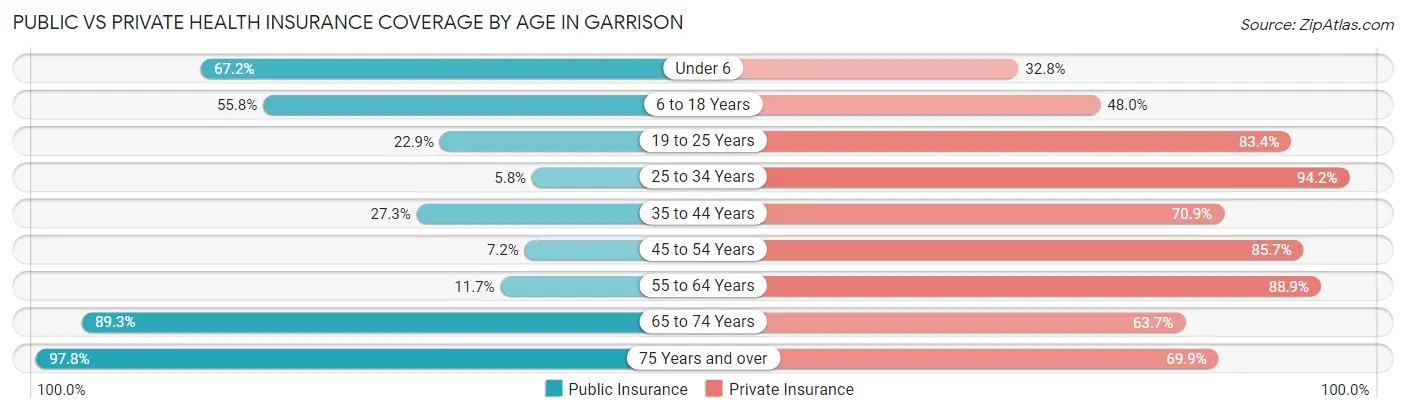
| Age Bracket | Public Insurance | Private Insurance |
| Under 6 | 531 (67.2%) | 259 (32.8%) |
| 6 to 18 Years | 1,043 (55.7%) | 898 (48.0%) |
| 19 to 25 Years | 306 (22.9%) | 1,113 (83.4%) |
| 25 to 34 Years | 43 (5.8%) | 695 (94.2%) |
| 35 to 44 Years | 342 (27.3%) | 890 (70.9%) |
| 45 to 54 Years | 62 (7.2%) | 738 (85.7%) |
| 55 to 64 Years | 136 (11.7%) | 1,034 (88.9%) |
| 65 to 74 Years | 980 (89.3%) | 699 (63.7%) |
| 75 Years and over | 631 (97.8%) | 451 (69.9%) |
| Total | 4,074 (41.8%) | 6,777 (69.5%) |
Disability Status by Sex by Age in Garrison
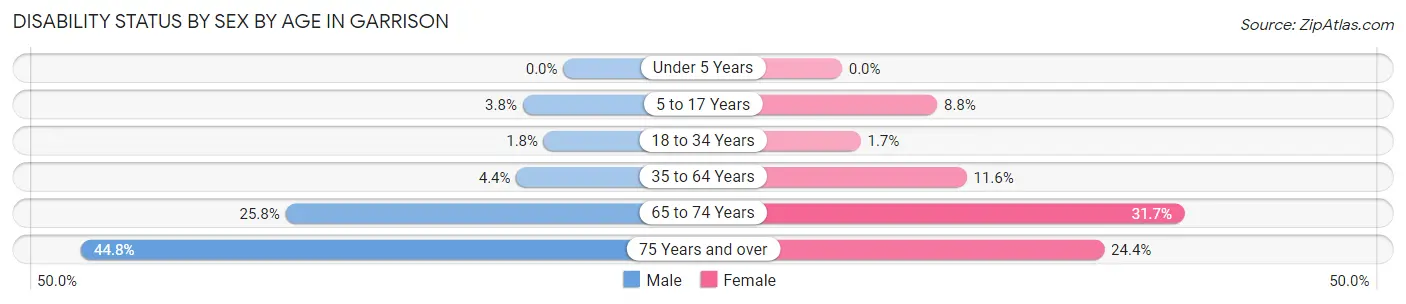
| Age Bracket | Male | Female |
| Under 5 Years | 0 (0.0%) | 0 (0.0%) |
| 5 to 17 Years | 34 (3.8%) | 65 (8.8%) |
| 18 to 34 Years | 24 (1.8%) | 18 (1.7%) |
| 35 to 64 Years | 59 (4.4%) | 223 (11.6%) |
| 65 to 74 Years | 148 (25.8%) | 166 (31.7%) |
| 75 Years and over | 81 (44.8%) | 113 (24.3%) |
Disability Class by Sex by Age in Garrison
Disability Class: Hearing Difficulty
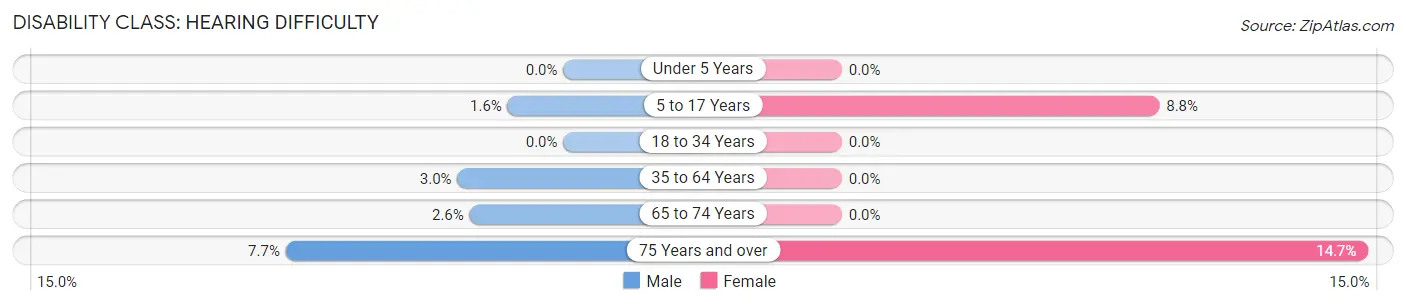
| Age Bracket | Male | Female |
| Under 5 Years | 0 (0.0%) | 0 (0.0%) |
| 5 to 17 Years | 14 (1.5%) | 65 (8.8%) |
| 18 to 34 Years | 0 (0.0%) | 0 (0.0%) |
| 35 to 64 Years | 40 (2.9%) | 0 (0.0%) |
| 65 to 74 Years | 15 (2.6%) | 0 (0.0%) |
| 75 Years and over | 14 (7.7%) | 68 (14.7%) |
Disability Class: Vision Difficulty
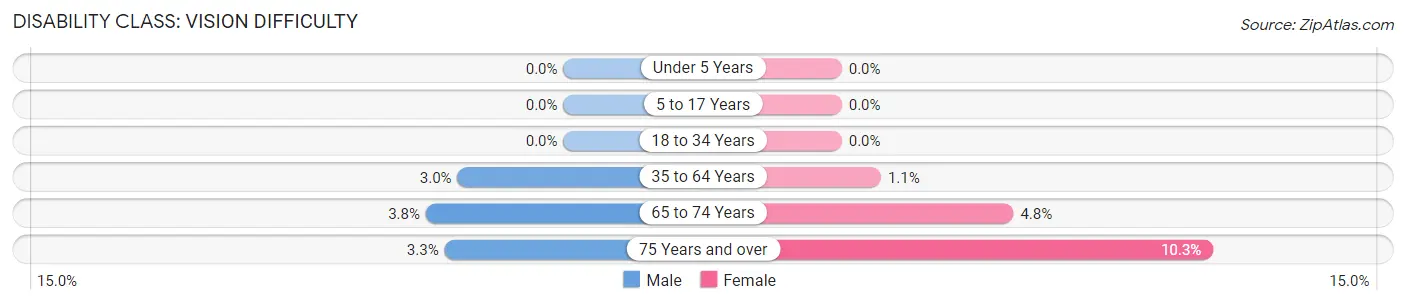
| Age Bracket | Male | Female |
| Under 5 Years | 0 (0.0%) | 0 (0.0%) |
| 5 to 17 Years | 0 (0.0%) | 0 (0.0%) |
| 18 to 34 Years | 0 (0.0%) | 0 (0.0%) |
| 35 to 64 Years | 40 (2.9%) | 21 (1.1%) |
| 65 to 74 Years | 22 (3.8%) | 25 (4.8%) |
| 75 Years and over | 6 (3.3%) | 48 (10.3%) |
Disability Class: Cognitive Difficulty
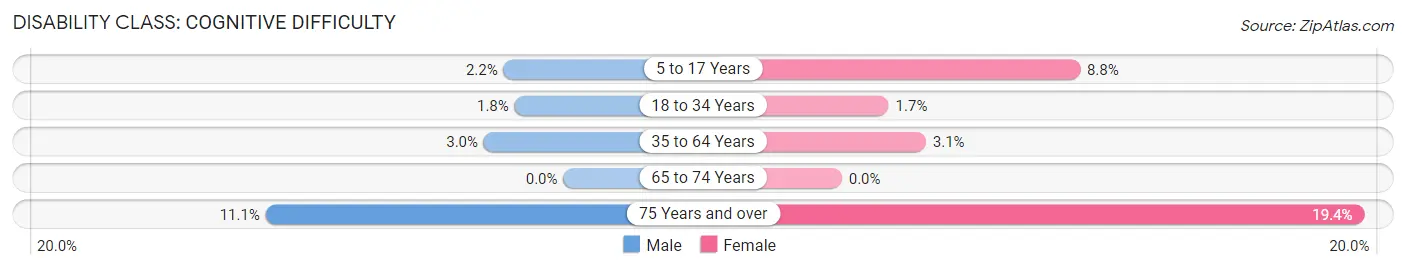
| Age Bracket | Male | Female |
| 5 to 17 Years | 20 (2.2%) | 65 (8.8%) |
| 18 to 34 Years | 24 (1.8%) | 18 (1.7%) |
| 35 to 64 Years | 40 (2.9%) | 60 (3.1%) |
| 65 to 74 Years | 0 (0.0%) | 0 (0.0%) |
| 75 Years and over | 20 (11.1%) | 90 (19.4%) |
Disability Class: Ambulatory Difficulty
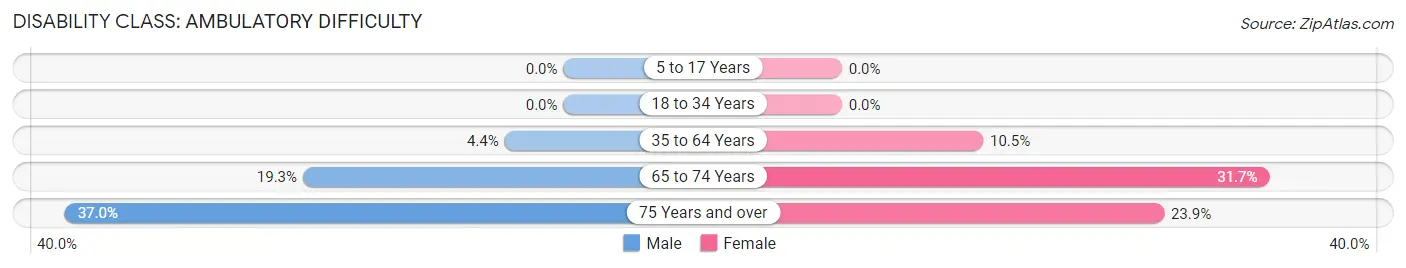
| Age Bracket | Male | Female |
| 5 to 17 Years | 0 (0.0%) | 0 (0.0%) |
| 18 to 34 Years | 0 (0.0%) | 0 (0.0%) |
| 35 to 64 Years | 59 (4.4%) | 202 (10.5%) |
| 65 to 74 Years | 111 (19.3%) | 166 (31.7%) |
| 75 Years and over | 67 (37.0%) | 111 (23.9%) |
Disability Class: Self-Care Difficulty
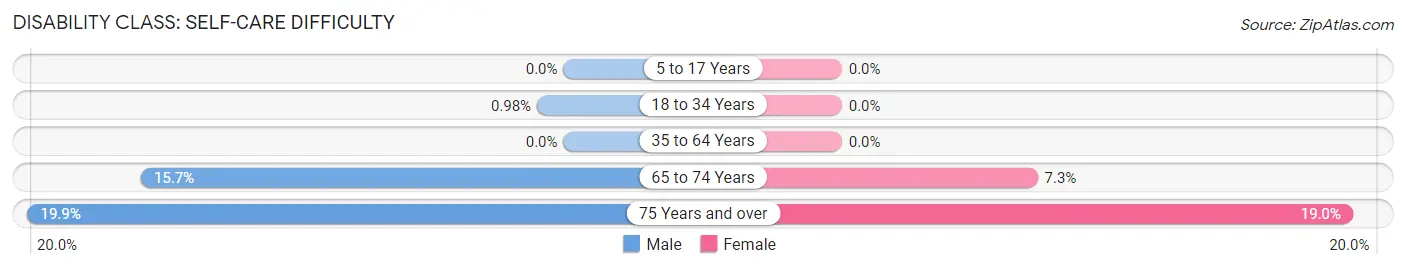
| Age Bracket | Male | Female |
| 5 to 17 Years | 0 (0.0%) | 0 (0.0%) |
| 18 to 34 Years | 13 (1.0%) | 0 (0.0%) |
| 35 to 64 Years | 0 (0.0%) | 0 (0.0%) |
| 65 to 74 Years | 90 (15.7%) | 38 (7.3%) |
| 75 Years and over | 36 (19.9%) | 88 (19.0%) |
Technology Access in Garrison
Computing Device Access in Garrison
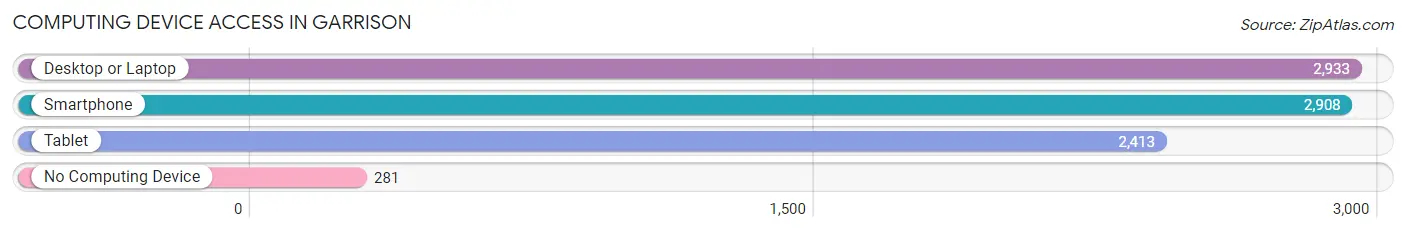
| Device Type | # Households | % Households |
| Desktop or Laptop | 2,933 | 83.7% |
| Smartphone | 2,908 | 83.0% |
| Tablet | 2,413 | 68.9% |
| No Computing Device | 281 | 8.0% |
| Total | 3,504 | 100.0% |
Internet Access in Garrison
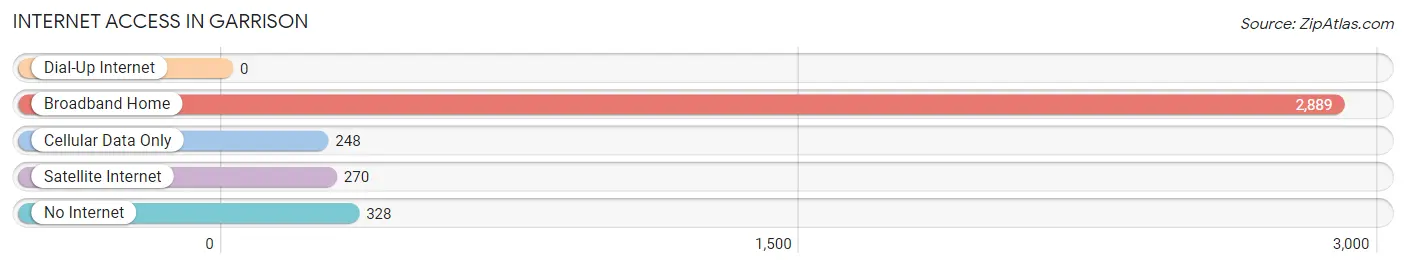
| Internet Type | # Households | % Households |
| Dial-Up Internet | 0 | 0.0% |
| Broadband Home | 2,889 | 82.5% |
| Cellular Data Only | 248 | 7.1% |
| Satellite Internet | 270 | 7.7% |
| No Internet | 328 | 9.4% |
| Total | 3,504 | 100.0% |
Garrison Summary
Garrison, Maryland is a small town located in Montgomery County, Maryland. It is situated on the banks of the Potomac River, just north of Washington, D.C. The town has a population of approximately 1,500 people and is part of the Washington Metropolitan Area.
Geography
Garrison is located in the Piedmont region of Maryland, which is characterized by rolling hills and valleys. The town is situated on the banks of the Potomac River, just north of Washington, D.C. The town is bordered by the towns of Poolesville to the north, Dickerson to the east, and Barnesville to the south. The town is located in the zip code of 20878.
The town is located in a rural area, with much of the land being used for agricultural purposes. The town is surrounded by farms and fields, and there are several small streams and creeks that run through the area. The town is also home to several parks, including the Montgomery County Agricultural Reserve, which is a protected area of land that is used for agricultural and recreational purposes.
History
Garrison was founded in 1790 by a group of settlers from Pennsylvania. The town was named after a Revolutionary War hero, General William Garrison. The town was originally a farming community, and the townspeople grew corn, wheat, and other crops. The town was also home to several mills, which were used to grind grain and produce flour.
In the late 19th century, the town began to grow and develop. The town was home to several businesses, including a blacksmith shop, a general store, and a post office. The town also had a school, which was built in 1891.
Economy
Garrison is a small town with a limited economy. The town is home to several small businesses, including a grocery store, a hardware store, and a few restaurants. The town is also home to several farms, which produce a variety of crops, including corn, wheat, and hay.
The town is also home to several small manufacturing companies, which produce a variety of products, including furniture, clothing, and electronics. The town is also home to several government offices, including the Montgomery County Department of Public Works.
Demographics
Garrison is a small town with a population of approximately 1,500 people. The town is predominantly white, with approximately 90% of the population being white. The town is also home to a small Hispanic population, with approximately 5% of the population being Hispanic. The town is also home to a small African American population, with approximately 3% of the population being African American.
The town has a median household income of approximately $60,000, which is slightly higher than the national average. The town also has a low unemployment rate, with approximately 3% of the population being unemployed.
Conclusion
Garrison, Maryland is a small town located in Montgomery County, Maryland. The town has a population of approximately 1,500 people and is part of the Washington Metropolitan Area. The town is situated on the banks of the Potomac River, just north of Washington, D.C. The town is predominantly white, with approximately 90% of the population being white. The town has a median household income of approximately $60,000, which is slightly higher than the national average. The town is home to several small businesses, farms, and manufacturing companies. The town is also home to several government offices, including the Montgomery County Department of Public Works.
Common Questions
What is Per Capita Income in Garrison?
Per Capita income in Garrison is $50,008.
What is the Median Family Income in Garrison?
Median Family Income in Garrison is $112,759.
What is the Median Household income in Garrison?
Median Household Income in Garrison is $93,125.
What is Income or Wage Gap in Garrison?
Income or Wage Gap in Garrison is 12.0%.
Women in Garrison earn 88.0 cents for every dollar earned by a man.
What is Inequality or Gini Index in Garrison?
Inequality or Gini Index in Garrison is 0.47.
What is the Total Population of Garrison?
Total Population of Garrison is 9,764.
What is the Total Male Population of Garrison?
Total Male Population of Garrison is 4,760.
What is the Total Female Population of Garrison?
Total Female Population of Garrison is 5,004.
What is the Ratio of Males per 100 Females in Garrison?
There are 95.12 Males per 100 Females in Garrison.
What is the Ratio of Females per 100 Males in Garrison?
There are 105.13 Females per 100 Males in Garrison.
What is the Median Population Age in Garrison?
Median Population Age in Garrison is 35.8 Years.
What is the Average Family Size in Garrison
Average Family Size in Garrison is 3.9 People.
What is the Average Household Size in Garrison
Average Household Size in Garrison is 2.7 People.
How Large is the Labor Force in Garrison?
There are 4,833 People in the Labor Forcein in Garrison.
What is the Percentage of People in the Labor Force in Garrison?
63.1% of People are in the Labor Force in Garrison.
What is the Unemployment Rate in Garrison?
Unemployment Rate in Garrison is 3.7%.