Cities with the Lowest Per Capita Income in Delaware
RELATED REPORTS & OPTIONS
Lowest Per Capita Income
Delaware
Compare Cities
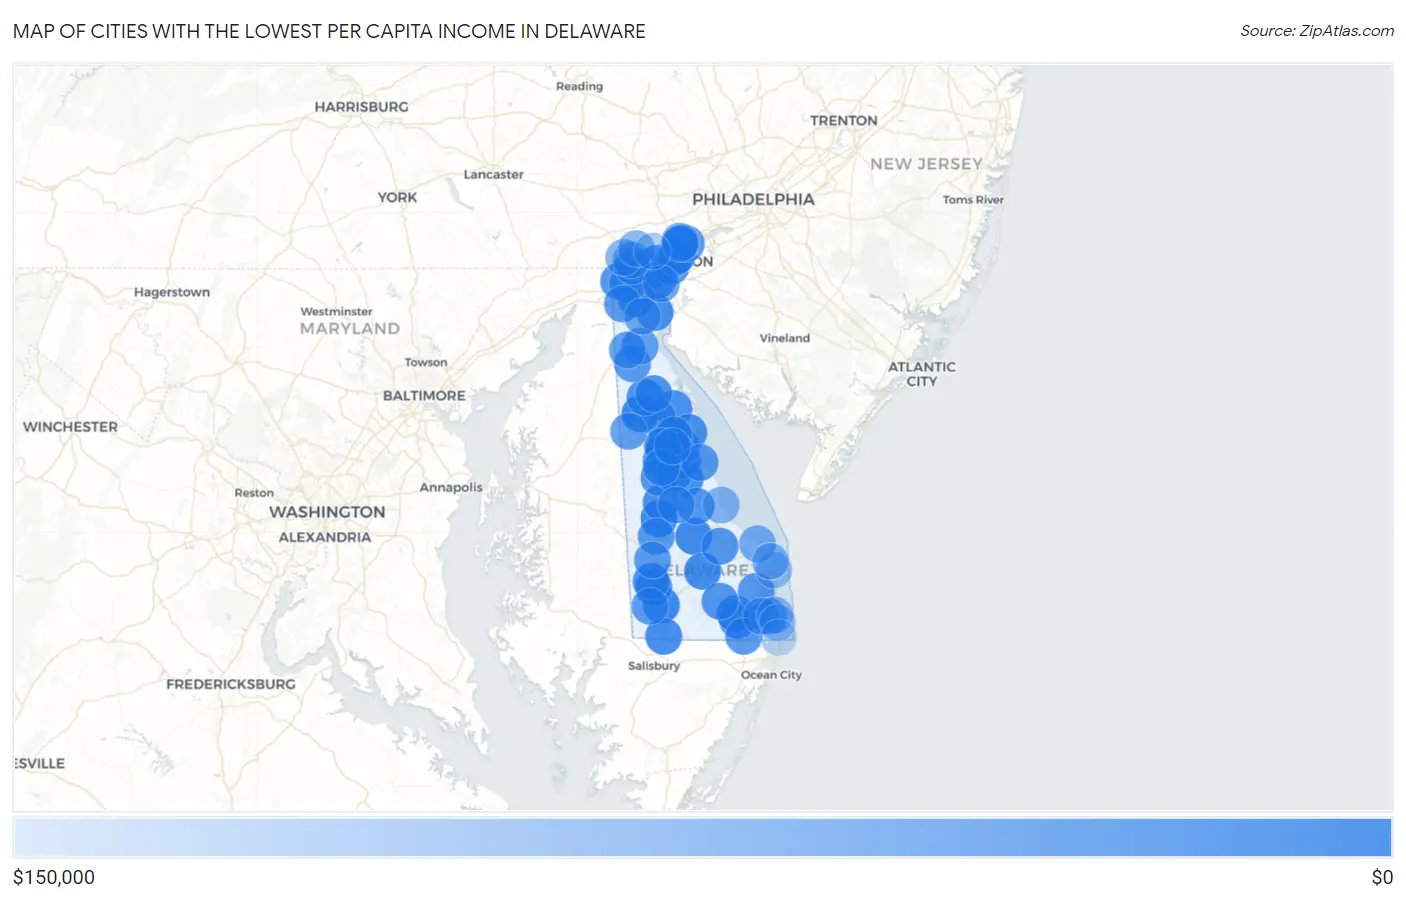
Map of Cities with the Lowest Per Capita Income in Delaware
$150,000
$0
Cities with the Lowest Per Capita Income in Delaware
| City | Per Capita Income | vs State | vs National | |
| 1. | Kenton | $13,531 | $42,180(-28.6k)#1 | $41,261(-27.7k)#988 |
| 2. | Laurel | $16,378 | $42,180(-25.8k)#2 | $41,261(-24.9k)#1,827 |
| 3. | Rodney Village | $18,256 | $42,180(-23.9k)#3 | $41,261(-23.0k)#2,629 |
| 4. | Farmington | $19,899 | $42,180(-22.3k)#4 | $41,261(-21.4k)#3,569 |
| 5. | Ellendale | $20,258 | $42,180(-21.9k)#5 | $41,261(-21.0k)#3,839 |
| 6. | Woodside East | $22,233 | $42,180(-19.9k)#6 | $41,261(-19.0k)#5,421 |
| 7. | Lincoln | $22,592 | $42,180(-19.6k)#7 | $41,261(-18.7k)#5,756 |
| 8. | Georgetown | $22,640 | $42,180(-19.5k)#8 | $41,261(-18.6k)#5,811 |
| 9. | Frederica | $24,666 | $42,180(-17.5k)#9 | $41,261(-16.6k)#7,892 |
| 10. | Magnolia | $25,069 | $42,180(-17.1k)#10 | $41,261(-16.2k)#8,357 |
| 11. | Delmar | $25,221 | $42,180(-17.0k)#11 | $41,261(-16.0k)#8,523 |
| 12. | Dover Base Housing | $25,705 | $42,180(-16.5k)#12 | $41,261(-15.6k)#9,091 |
| 13. | Blades | $26,045 | $42,180(-16.1k)#13 | $41,261(-15.2k)#9,494 |
| 14. | Woodside | $26,368 | $42,180(-15.8k)#14 | $41,261(-14.9k)#9,886 |
| 15. | Seaford | $26,952 | $42,180(-15.2k)#15 | $41,261(-14.3k)#10,589 |
| 16. | Harrington | $27,550 | $42,180(-14.6k)#16 | $41,261(-13.7k)#11,334 |
| 17. | Newport | $27,838 | $42,180(-14.3k)#17 | $41,261(-13.4k)#11,709 |
| 18. | Leipsic | $28,375 | $42,180(-13.8k)#18 | $41,261(-12.9k)#12,356 |
| 19. | Kent Acres | $28,900 | $42,180(-13.3k)#19 | $41,261(-12.4k)#12,954 |
| 20. | Little Creek | $29,443 | $42,180(-12.7k)#20 | $41,261(-11.8k)#13,599 |
| 21. | Cheswold | $29,680 | $42,180(-12.5k)#21 | $41,261(-11.6k)#13,866 |
| 22. | Dover | $29,796 | $42,180(-12.4k)#22 | $41,261(-11.5k)#14,006 |
| 23. | Rising Sun Lebanon | $29,812 | $42,180(-12.4k)#23 | $41,261(-11.4k)#14,030 |
| 24. | Frankford | $29,879 | $42,180(-12.3k)#24 | $41,261(-11.4k)#14,102 |
| 25. | Dagsboro | $30,317 | $42,180(-11.9k)#25 | $41,261(-10.9k)#14,610 |
| 26. | Clayton | $30,652 | $42,180(-11.5k)#26 | $41,261(-10.6k)#14,981 |
| 27. | Camden | $30,893 | $42,180(-11.3k)#27 | $41,261(-10.4k)#15,246 |
| 28. | Elsmere | $30,900 | $42,180(-11.3k)#28 | $41,261(-10.4k)#15,251 |
| 29. | Wyoming | $30,914 | $42,180(-11.3k)#29 | $41,261(-10.3k)#15,269 |
| 30. | Smyrna | $31,340 | $42,180(-10.8k)#30 | $41,261(-9.92k)#15,758 |
| 31. | Newark | $32,240 | $42,180(-9.94k)#31 | $41,261(-9.02k)#16,744 |
| 32. | Delaware City | $32,328 | $42,180(-9.85k)#32 | $41,261(-8.93k)#16,842 |
| 33. | Milford | $33,823 | $42,180(-8.36k)#33 | $41,261(-7.44k)#18,405 |
| 34. | Millsboro | $34,247 | $42,180(-7.93k)#34 | $41,261(-7.01k)#18,795 |
| 35. | Wilmington Manor | $34,760 | $42,180(-7.42k)#35 | $41,261(-6.50k)#19,249 |
| 36. | Brookside | $34,827 | $42,180(-7.35k)#36 | $41,261(-6.43k)#19,311 |
| 37. | Milton | $35,412 | $42,180(-6.77k)#37 | $41,261(-5.85k)#19,829 |
| 38. | Felton | $35,877 | $42,180(-6.30k)#38 | $41,261(-5.38k)#20,223 |
| 39. | Wilmington | $36,446 | $42,180(-5.73k)#39 | $41,261(-4.82k)#20,690 |
| 40. | Bear | $38,426 | $42,180(-3.75k)#40 | $41,261(-2.83k)#22,057 |
| 41. | Bellefonte | $38,492 | $42,180(-3.69k)#41 | $41,261(-2.77k)#22,100 |
| 42. | Long Neck | $39,311 | $42,180(-2.87k)#42 | $41,261(-1.95k)#22,580 |
| 43. | Riverview | $39,745 | $42,180(-2.44k)#43 | $41,261(-1.52k)#22,811 |
| 44. | Selbyville | $39,852 | $42,180(-2.33k)#44 | $41,261(-1.41k)#22,871 |
| 45. | Edgemoor | $40,072 | $42,180(-2.11k)#45 | $41,261(-1.19k)#23,003 |
| 46. | Claymont | $40,226 | $42,180(-1.95k)#46 | $41,261(-1.03k)#23,076 |
| 47. | Bowers | $40,410 | $42,180(-1.77k)#47 | $41,261(-851)#23,174 |
| 48. | Greenwood | $40,531 | $42,180(-1.65k)#48 | $41,261(-730)#23,238 |
| 49. | Glasgow | $41,452 | $42,180(-728)#49 | $41,261(+191)#23,716 |
| 50. | Townsend | $41,503 | $42,180(-677)#50 | $41,261(+242)#23,746 |
| 51. | Bridgeville | $42,044 | $42,180(-136)#51 | $41,261(+783)#23,999 |
| 52. | Bethel | $42,939 | $42,180(+759)#52 | $41,261(+1.68k)#24,420 |
| 53. | Port Penn | $43,400 | $42,180(+1.22k)#53 | $41,261(+2.14k)#24,603 |
| 54. | Viola | $43,865 | $42,180(+1.69k)#54 | $41,261(+2.60k)#24,819 |
| 55. | Highland Acres | $44,615 | $42,180(+2.44k)#55 | $41,261(+3.35k)#25,105 |
| 56. | Houston | $45,092 | $42,180(+2.91k)#56 | $41,261(+3.83k)#25,297 |
| 57. | Odessa | $45,905 | $42,180(+3.73k)#57 | $41,261(+4.64k)#25,616 |
| 58. | Ocean View | $46,215 | $42,180(+4.04k)#58 | $41,261(+4.95k)#25,703 |
| 59. | Hartly | $47,549 | $42,180(+5.37k)#59 | $41,261(+6.29k)#26,121 |
| 60. | Middletown | $48,426 | $42,180(+6.25k)#60 | $41,261(+7.17k)#26,367 |
| 61. | Pike Creek Valley | $48,651 | $42,180(+6.47k)#61 | $41,261(+7.39k)#26,431 |
| 62. | Arden | $49,135 | $42,180(+6.96k)#62 | $41,261(+7.87k)#26,560 |
| 63. | Ardentown | $53,403 | $42,180(+11.2k)#63 | $41,261(+12.1k)#27,518 |
| 64. | New Castle | $53,997 | $42,180(+11.8k)#64 | $41,261(+12.7k)#27,613 |
| 65. | Millville | $59,054 | $42,180(+16.9k)#65 | $41,261(+17.8k)#28,420 |
| 66. | St Georges | $59,574 | $42,180(+17.4k)#66 | $41,261(+18.3k)#28,491 |
| 67. | Ardencroft | $61,623 | $42,180(+19.4k)#67 | $41,261(+20.4k)#28,770 |
| 68. | Lewes | $63,941 | $42,180(+21.8k)#68 | $41,261(+22.7k)#29,018 |
| 69. | Pike Creek | $64,914 | $42,180(+22.7k)#69 | $41,261(+23.7k)#29,107 |
| 70. | North Star | $72,757 | $42,180(+30.6k)#70 | $41,261(+31.5k)#29,696 |
| 71. | Hockessin | $74,299 | $42,180(+32.1k)#71 | $41,261(+33.0k)#29,777 |
| 72. | Slaughter Beach | $76,410 | $42,180(+34.2k)#72 | $41,261(+35.1k)#29,887 |
| 73. | Bethany Beach | $80,028 | $42,180(+37.8k)#73 | $41,261(+38.8k)#30,041 |
| 74. | Dewey Beach | $87,153 | $42,180(+45.0k)#74 | $41,261(+45.9k)#30,252 |
| 75. | Greenville | $102,638 | $42,180(+60.5k)#75 | $41,261(+61.4k)#30,555 |
| 76. | South Bethany | $104,454 | $42,180(+62.3k)#76 | $41,261(+63.2k)#30,584 |
| 77. | Henlopen Acres | $110,969 | $42,180(+68.8k)#77 | $41,261(+69.7k)#30,667 |
| 78. | Rehoboth Beach | $114,683 | $42,180(+72.5k)#78 | $41,261(+73.4k)#30,709 |
| 79. | Fenwick Island | $118,955 | $42,180(+76.8k)#79 | $41,261(+77.7k)#30,749 |
1
Common Questions
What are the Top 10 Cities with the Lowest Per Capita Income in Delaware?
Top 10 Cities with the Lowest Per Capita Income in Delaware are:
#1
$13,531
#2
$16,378
#3
$18,256
#4
$19,899
#5
$20,258
#6
$22,233
#7
$22,640
#8
$24,666
#9
$25,069
#10
$25,221
What city has the Lowest Per Capita Income in Delaware?
Kenton has the Lowest Per Capita Income in Delaware with $13,531.
What is the Per Capita Income in the State of Delaware?
Per Capita Income in Delaware is $42,180.
What is the Per Capita Income in the United States?
Per Capita Income in the United States is $41,261.