Tselakai Dezza, UT Map & Demographics
Tselakai Dezza Map
Tselakai Dezza Overview
$10,798
PER CAPITA INCOME
$23,750
AVG FAMILY INCOME
$27,500
AVG HOUSEHOLD INCOME
0.39
INEQUALITY / GINI INDEX
89
TOTAL POPULATION
38
MALE POPULATION
51
FEMALE POPULATION
74.51
MALES / 100 FEMALES
134.21
FEMALES / 100 MALES
43.1
MEDIAN AGE
3.9
AVG FAMILY SIZE
3.0
AVG HOUSEHOLD SIZE
23
LABOR FORCE [ PEOPLE ]
39.0%
PERCENT IN LABOR FORCE
17.4%
UNEMPLOYMENT RATE
Income in Tselakai Dezza
Income Overview in Tselakai Dezza
Per Capita Income in Tselakai Dezza is $10,798, while median incomes of families and households are $23,750 and $27,500 respectively.
| Characteristic | Number | Measure |
| Per Capita Income | 89 | $10,798 |
| Median Family Income | 20 | $23,750 |
| Mean Family Income | 20 | $25,265 |
| Median Household Income | 30 | $27,500 |
| Mean Household Income | 30 | $32,033 |
| Income Deficit | 20 | $0 |
| Wage / Income Gap (%) | 89 | 0.00% |
| Wage / Income Gap ($) | 89 | 100.00¢ per $1 |
| Gini / Inequality Index | 89 | 0.39 |
Earnings by Sex in Tselakai Dezza
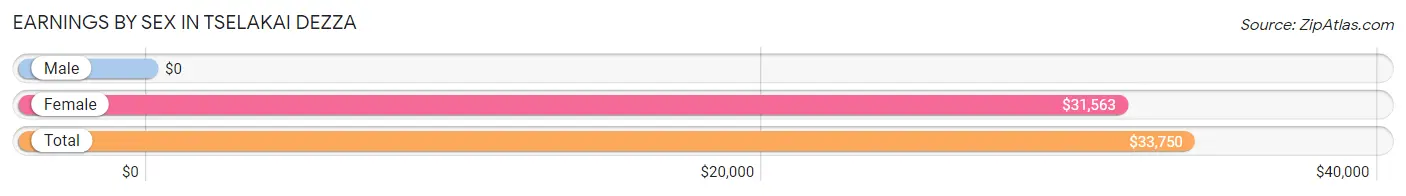
| Sex | Number | Average Earnings |
| Male | 6 (31.6%) | $0 |
| Female | 13 (68.4%) | $31,563 |
| Total | 19 (100.0%) | $33,750 |
Earnings by Sex by Income Bracket in Tselakai Dezza
The most common earnings brackets in Tselakai Dezza are $40,000 to $44,999 for men (2 | 33.3%) and $30,000 to $34,999 for women (7 | 53.8%).
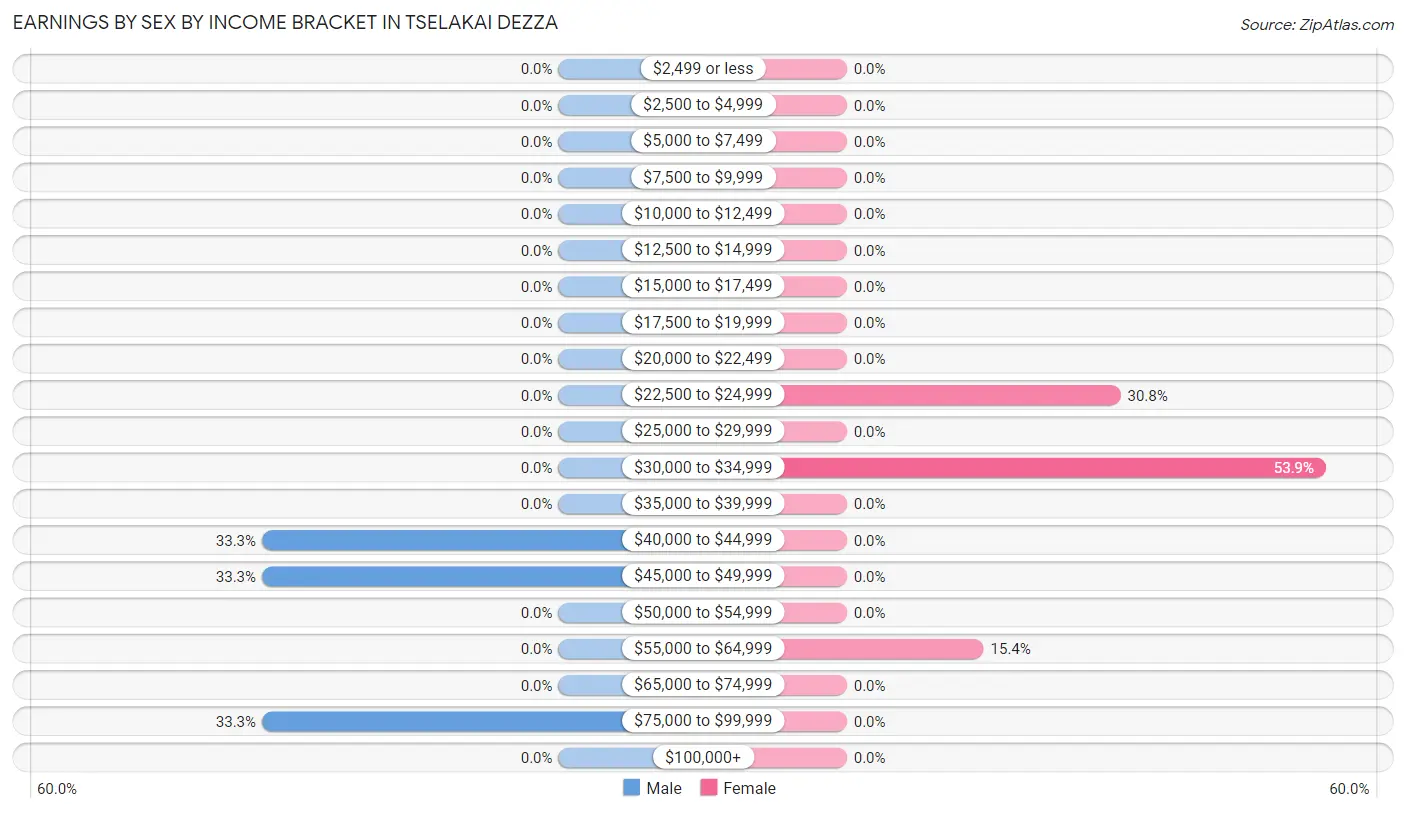
| Income | Male | Female |
| $2,499 or less | 0 (0.0%) | 0 (0.0%) |
| $2,500 to $4,999 | 0 (0.0%) | 0 (0.0%) |
| $5,000 to $7,499 | 0 (0.0%) | 0 (0.0%) |
| $7,500 to $9,999 | 0 (0.0%) | 0 (0.0%) |
| $10,000 to $12,499 | 0 (0.0%) | 0 (0.0%) |
| $12,500 to $14,999 | 0 (0.0%) | 0 (0.0%) |
| $15,000 to $17,499 | 0 (0.0%) | 0 (0.0%) |
| $17,500 to $19,999 | 0 (0.0%) | 0 (0.0%) |
| $20,000 to $22,499 | 0 (0.0%) | 0 (0.0%) |
| $22,500 to $24,999 | 0 (0.0%) | 4 (30.8%) |
| $25,000 to $29,999 | 0 (0.0%) | 0 (0.0%) |
| $30,000 to $34,999 | 0 (0.0%) | 7 (53.8%) |
| $35,000 to $39,999 | 0 (0.0%) | 0 (0.0%) |
| $40,000 to $44,999 | 2 (33.3%) | 0 (0.0%) |
| $45,000 to $49,999 | 2 (33.3%) | 0 (0.0%) |
| $50,000 to $54,999 | 0 (0.0%) | 0 (0.0%) |
| $55,000 to $64,999 | 0 (0.0%) | 2 (15.4%) |
| $65,000 to $74,999 | 0 (0.0%) | 0 (0.0%) |
| $75,000 to $99,999 | 2 (33.3%) | 0 (0.0%) |
| $100,000+ | 0 (0.0%) | 0 (0.0%) |
| Total | 6 (100.0%) | 13 (100.0%) |
Earnings by Sex by Educational Attainment in Tselakai Dezza
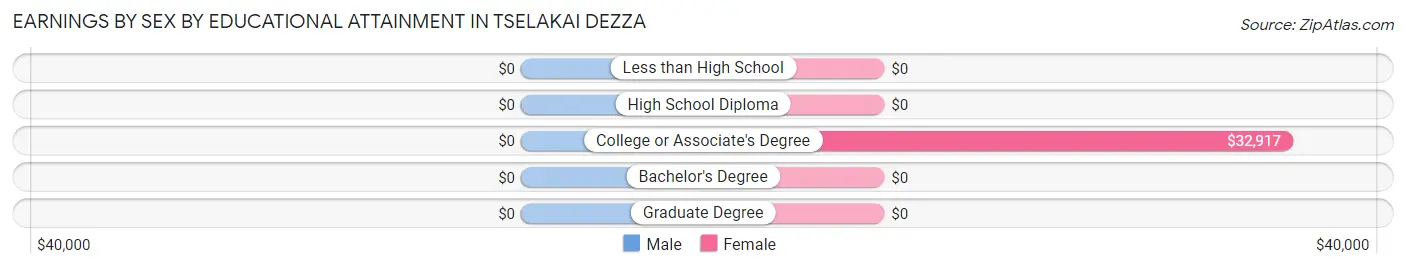
| Educational Attainment | Male Income | Female Income |
| Less than High School | - | - |
| High School Diploma | - | - |
| College or Associate's Degree | - | - |
| Bachelor's Degree | - | - |
| Graduate Degree | - | - |
| Total | - | - |
Family Income in Tselakai Dezza
Family Income Brackets in Tselakai Dezza
According to the Tselakai Dezza family income data, there are 9 families falling into the $15,000 to $24,999 income range, which is the most common income bracket and makes up 45.0% of all families.
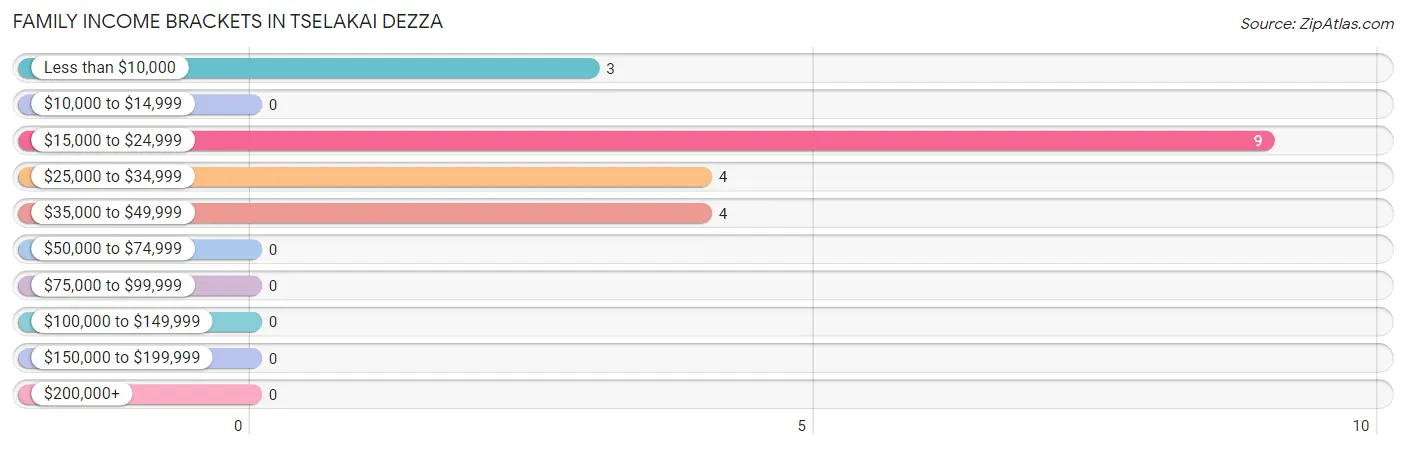
| Income Bracket | # Families | % Families |
| Less than $10,000 | 3 | 15.0% |
| $10,000 to $14,999 | 0 | 0.0% |
| $15,000 to $24,999 | 9 | 45.0% |
| $25,000 to $34,999 | 4 | 20.0% |
| $35,000 to $49,999 | 4 | 20.0% |
| $50,000 to $74,999 | 0 | 0.0% |
| $75,000 to $99,999 | 0 | 0.0% |
| $100,000 to $149,999 | 0 | 0.0% |
| $150,000 to $199,999 | 0 | 0.0% |
| $200,000+ | 0 | 0.0% |
Family Income by Famaliy Size in Tselakai Dezza
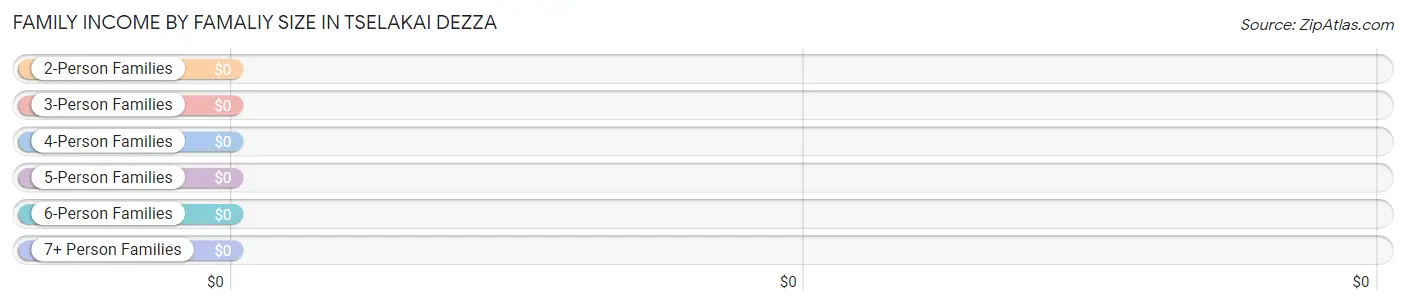
| Income Bracket | # Families | Median Income |
| 2-Person Families | 8 (40.0%) | $0 |
| 3-Person Families | 5 (25.0%) | $0 |
| 4-Person Families | 0 (0.0%) | $0 |
| 5-Person Families | 3 (15.0%) | $0 |
| 6-Person Families | 4 (20.0%) | $0 |
| 7+ Person Families | 0 (0.0%) | $0 |
| Total | 20 (100.0%) | $23,750 |
Family Income by Number of Earners in Tselakai Dezza
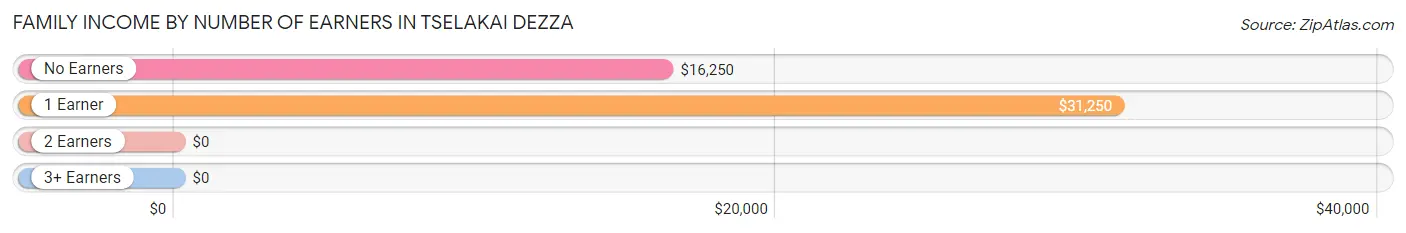
| Number of Earners | # Families | Median Income |
| No Earners | 8 (40.0%) | $16,250 |
| 1 Earner | 12 (60.0%) | $31,250 |
| 2 Earners | 0 (0.0%) | $0 |
| 3+ Earners | 0 (0.0%) | $0 |
| Total | 20 (100.0%) | $23,750 |
Household Income in Tselakai Dezza
Household Income Brackets in Tselakai Dezza
With 9 households falling in the category, the $15,000 to $24,999 income range is the most frequent in Tselakai Dezza, accounting for 30.0% of all households.
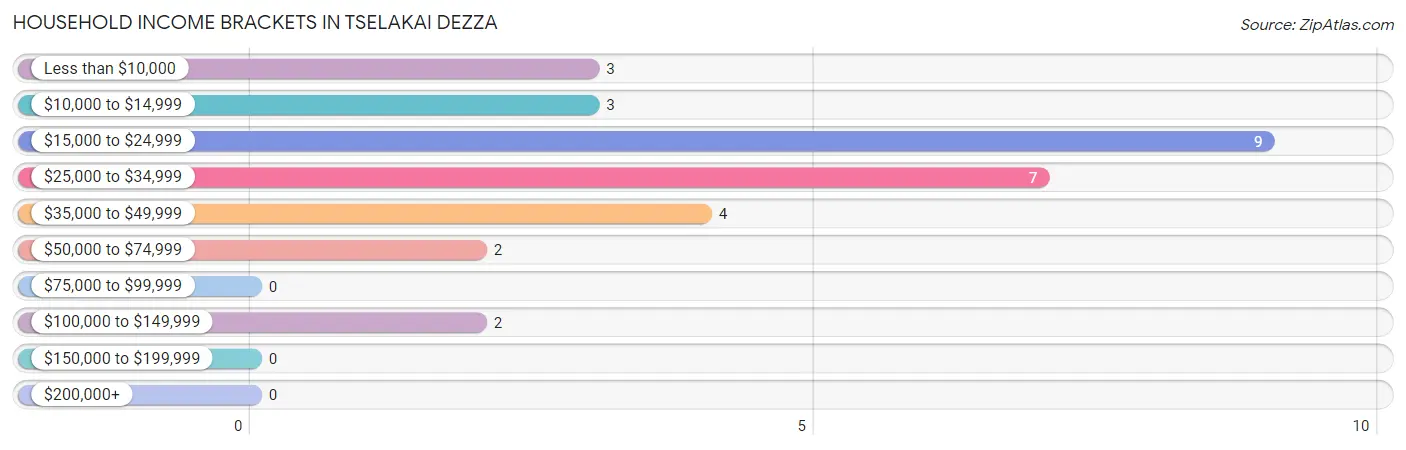
| Income Bracket | # Households | % Households |
| Less than $10,000 | 3 | 10.0% |
| $10,000 to $14,999 | 3 | 10.0% |
| $15,000 to $24,999 | 9 | 30.0% |
| $25,000 to $34,999 | 7 | 23.3% |
| $35,000 to $49,999 | 4 | 13.3% |
| $50,000 to $74,999 | 2 | 6.7% |
| $75,000 to $99,999 | 0 | 0.0% |
| $100,000 to $149,999 | 2 | 6.7% |
| $150,000 to $199,999 | 0 | 0.0% |
| $200,000+ | 0 | 0.0% |
Household Income by Householder Age in Tselakai Dezza
The median household income in Tselakai Dezza is $27,500, with the highest median household income of $31,563 found in the 45 to 64 years age bracket for the primary householder. A total of 17 households (56.7%) fall into this category.
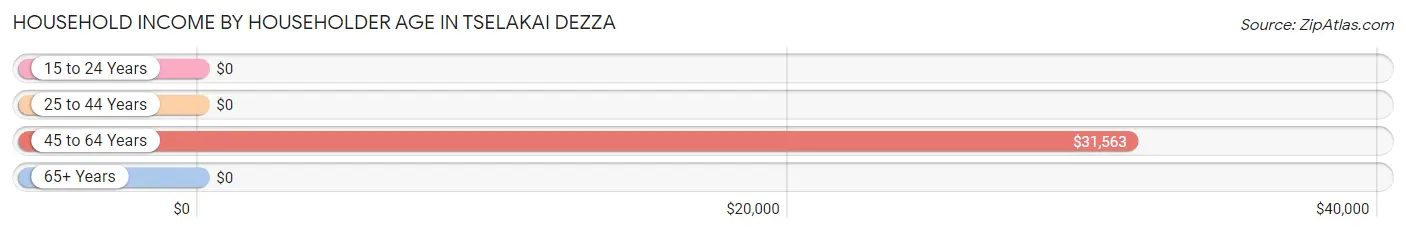
| Income Bracket | # Households | Median Income |
| 15 to 24 Years | 0 (0.0%) | $0 |
| 25 to 44 Years | 7 (23.3%) | $0 |
| 45 to 64 Years | 17 (56.7%) | $31,563 |
| 65+ Years | 6 (20.0%) | $0 |
| Total | 30 (100.0%) | $27,500 |
Poverty in Tselakai Dezza
Income Below Poverty by Sex and Age in Tselakai Dezza
With 50.0% poverty level for males and 56.9% for females among the residents of Tselakai Dezza, 18 to 24 year old males and 12 to 14 year old females are the most vulnerable to poverty, with 2 males (100.0%) and 12 females (100.0%) in their respective age groups living below the poverty level.
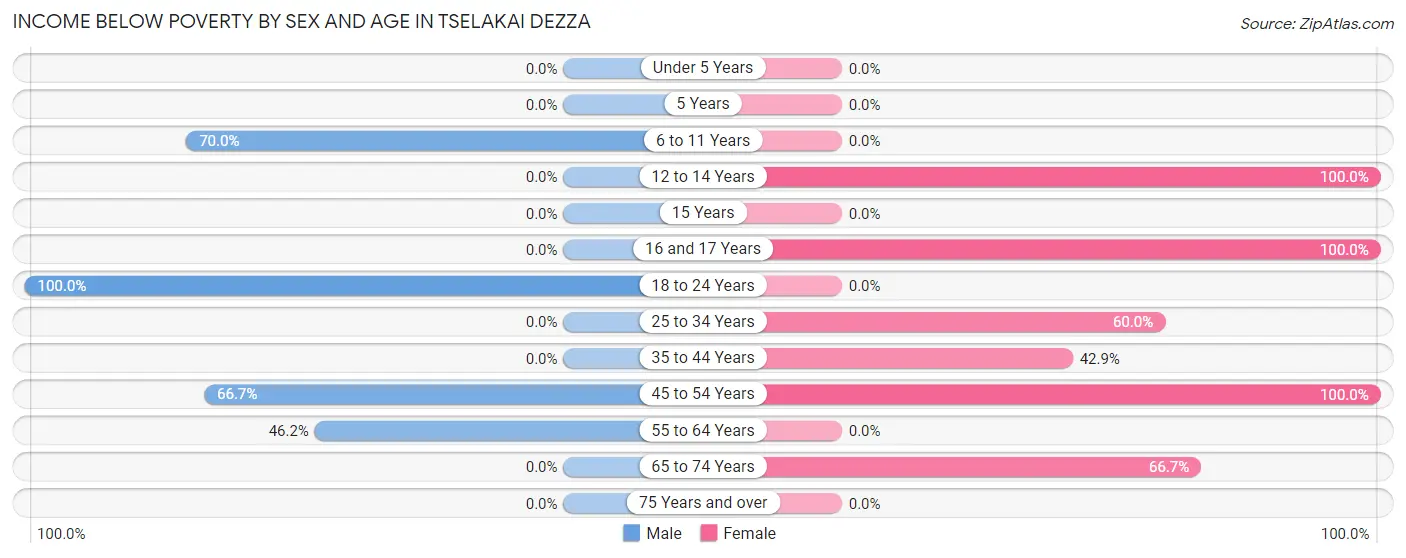
| Age Bracket | Male | Female |
| Under 5 Years | 0 (0.0%) | 0 (0.0%) |
| 5 Years | 0 (0.0%) | 0 (0.0%) |
| 6 to 11 Years | 7 (70.0%) | 0 (0.0%) |
| 12 to 14 Years | 0 (0.0%) | 12 (100.0%) |
| 15 Years | 0 (0.0%) | 0 (0.0%) |
| 16 and 17 Years | 0 (0.0%) | 4 (100.0%) |
| 18 to 24 Years | 2 (100.0%) | 0 (0.0%) |
| 25 to 34 Years | 0 (0.0%) | 3 (60.0%) |
| 35 to 44 Years | 0 (0.0%) | 3 (42.9%) |
| 45 to 54 Years | 4 (66.7%) | 3 (100.0%) |
| 55 to 64 Years | 6 (46.2%) | 0 (0.0%) |
| 65 to 74 Years | 0 (0.0%) | 4 (66.7%) |
| 75 Years and over | 0 (0.0%) | 0 (0.0%) |
| Total | 19 (50.0%) | 29 (56.9%) |
Income Above Poverty by Sex and Age in Tselakai Dezza
According to the poverty statistics in Tselakai Dezza, males aged under 5 years and females aged 15 years are the age groups that are most secure financially, with 100.0% of males and 100.0% of females in these age groups living above the poverty line.
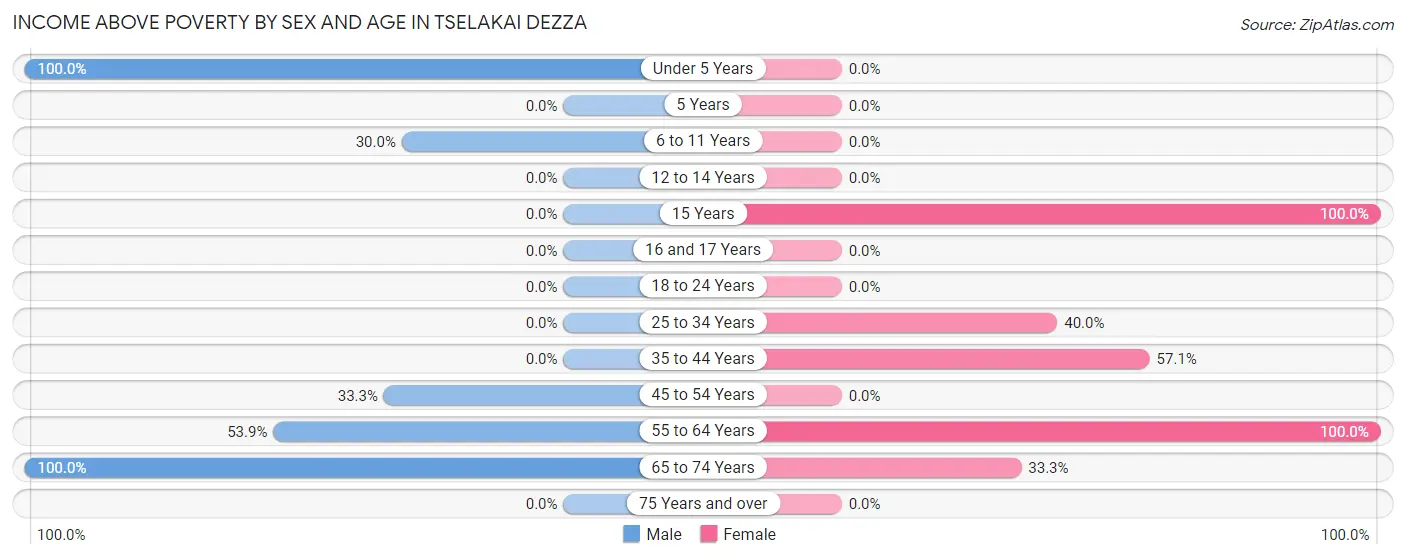
| Age Bracket | Male | Female |
| Under 5 Years | 5 (100.0%) | 0 (0.0%) |
| 5 Years | 0 (0.0%) | 0 (0.0%) |
| 6 to 11 Years | 3 (30.0%) | 0 (0.0%) |
| 12 to 14 Years | 0 (0.0%) | 0 (0.0%) |
| 15 Years | 0 (0.0%) | 3 (100.0%) |
| 16 and 17 Years | 0 (0.0%) | 0 (0.0%) |
| 18 to 24 Years | 0 (0.0%) | 0 (0.0%) |
| 25 to 34 Years | 0 (0.0%) | 2 (40.0%) |
| 35 to 44 Years | 0 (0.0%) | 4 (57.1%) |
| 45 to 54 Years | 2 (33.3%) | 0 (0.0%) |
| 55 to 64 Years | 7 (53.8%) | 11 (100.0%) |
| 65 to 74 Years | 2 (100.0%) | 2 (33.3%) |
| 75 Years and over | 0 (0.0%) | 0 (0.0%) |
| Total | 19 (50.0%) | 22 (43.1%) |
Income Below Poverty Among Married-Couple Families in Tselakai Dezza
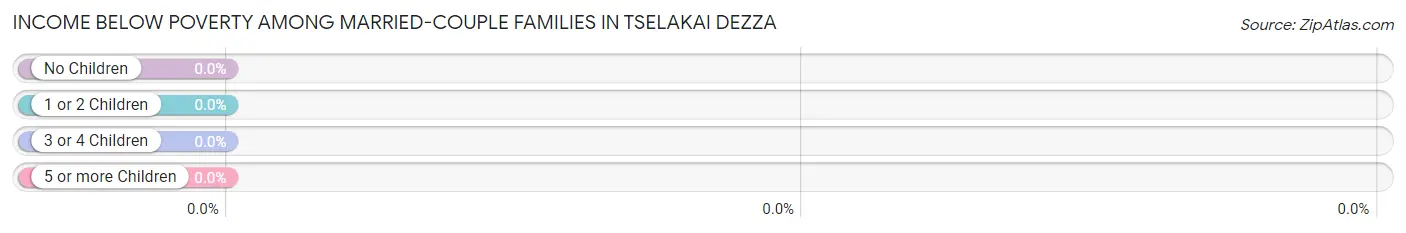
| Children | Above Poverty | Below Poverty |
| No Children | 8 (100.0%) | 0 (0.0%) |
| 1 or 2 Children | 2 (100.0%) | 0 (0.0%) |
| 3 or 4 Children | 2 (100.0%) | 0 (0.0%) |
| 5 or more Children | 0 (0.0%) | 0 (0.0%) |
| Total | 12 (100.0%) | 0 (0.0%) |
Income Below Poverty Among Single-Parent Households in Tselakai Dezza
According to the poverty data in Tselakai Dezza, 100.0% or 3 single-father households and 100.0% or 5 single-mother households are living below the poverty line. Among single-father households, those with no children have the highest poverty rate, with 3 households (100.0%) experiencing poverty. Likewise, among single-mother households, those with 1 or 2 children have the highest poverty rate, with 3 households (100.0%) falling below the poverty line.
| Children | Single Father | Single Mother |
| No Children | 3 (100.0%) | 0 (0.0%) |
| 1 or 2 Children | 0 (0.0%) | 3 (100.0%) |
| 3 or 4 Children | 0 (0.0%) | 0 (0.0%) |
| 5 or more Children | 0 (0.0%) | 2 (100.0%) |
| Total | 3 (100.0%) | 5 (100.0%) |
Income Below Poverty Among Married-Couple vs Single-Parent Households in Tselakai Dezza
| Children | Married-Couple Families | Single-Parent Households |
| No Children | 0 (0.0%) | 3 (100.0%) |
| 1 or 2 Children | 0 (0.0%) | 3 (100.0%) |
| 3 or 4 Children | 0 (0.0%) | 0 (0.0%) |
| 5 or more Children | 0 (0.0%) | 2 (100.0%) |
| Total | 0 (0.0%) | 8 (100.0%) |
Race in Tselakai Dezza
The most populous races in Tselakai Dezza are , and Native / Alaskan (89 | 100.0%).
| Race | # Population | % Population |
| Asian | 0 | 0.0% |
| Black / African American | 0 | 0.0% |
| Hawaiian / Pacific | 0 | 0.0% |
| Hispanic or Latino | 0 | 0.0% |
| Native / Alaskan | 89 | 100.0% |
| White / Caucasian | 0 | 0.0% |
| Two or more Races | 0 | 0.0% |
| Some other Race | 0 | 0.0% |
| Total | 89 | 100.0% |
Ancestry in Tselakai Dezza
The most populous ancestries reported in Tselakai Dezza are Navajo (89 | 100.0%), and Arapaho (19 | 21.3%), together accounting for 121.4% of all Tselakai Dezza residents.
| Ancestry | # Population | % Population |
| Arapaho | 19 | 21.3% |
| Navajo | 89 | 100.0% | View All 2 Rows |
Immigrants in Tselakai Dezza

| Immigration Origin | # Population | % Population | View All 0 Rows |
Sex and Age in Tselakai Dezza
Sex and Age in Tselakai Dezza
The most populous age groups in Tselakai Dezza are 60 to 64 Years (10 | 26.3%) for men and 10 to 14 Years (12 | 23.5%) for women.
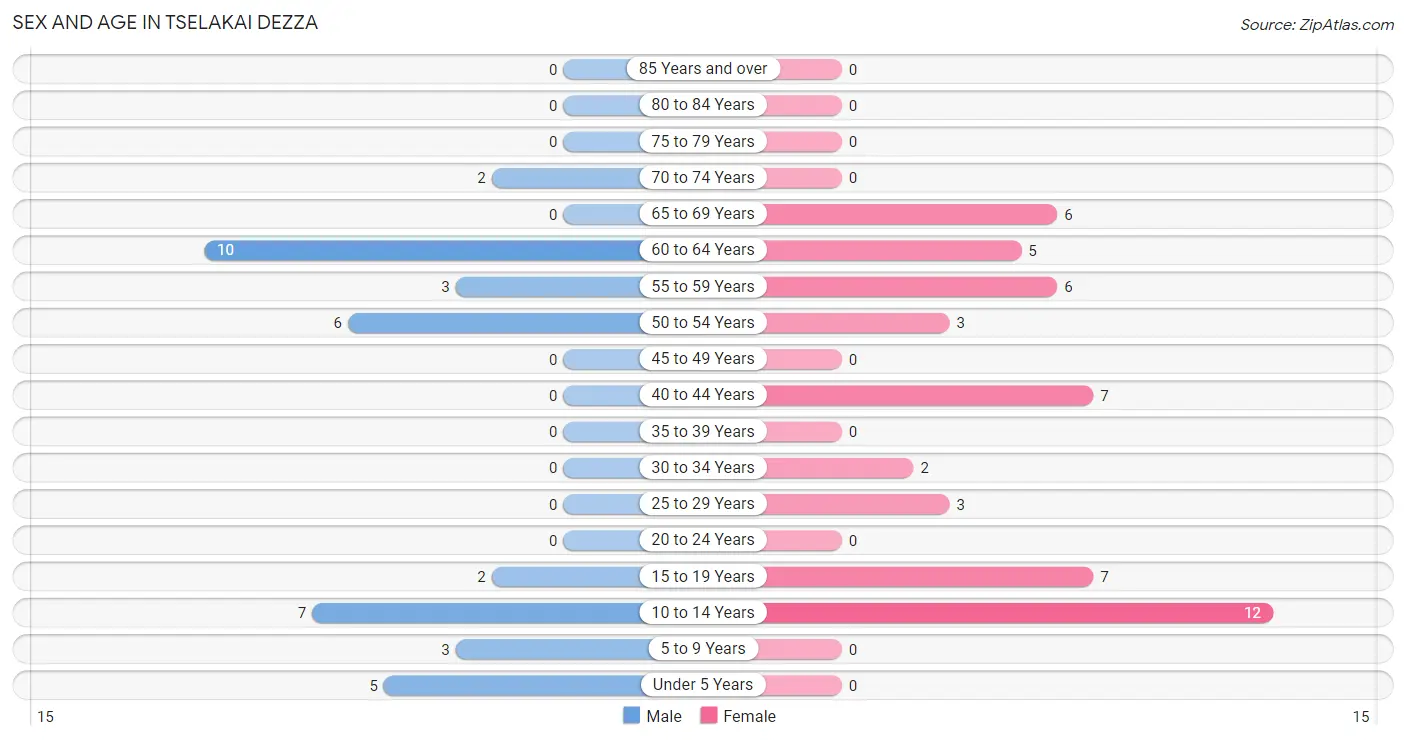
| Age Bracket | Male | Female |
| Under 5 Years | 5 (13.2%) | 0 (0.0%) |
| 5 to 9 Years | 3 (7.9%) | 0 (0.0%) |
| 10 to 14 Years | 7 (18.4%) | 12 (23.5%) |
| 15 to 19 Years | 2 (5.3%) | 7 (13.7%) |
| 20 to 24 Years | 0 (0.0%) | 0 (0.0%) |
| 25 to 29 Years | 0 (0.0%) | 3 (5.9%) |
| 30 to 34 Years | 0 (0.0%) | 2 (3.9%) |
| 35 to 39 Years | 0 (0.0%) | 0 (0.0%) |
| 40 to 44 Years | 0 (0.0%) | 7 (13.7%) |
| 45 to 49 Years | 0 (0.0%) | 0 (0.0%) |
| 50 to 54 Years | 6 (15.8%) | 3 (5.9%) |
| 55 to 59 Years | 3 (7.9%) | 6 (11.8%) |
| 60 to 64 Years | 10 (26.3%) | 5 (9.8%) |
| 65 to 69 Years | 0 (0.0%) | 6 (11.8%) |
| 70 to 74 Years | 2 (5.3%) | 0 (0.0%) |
| 75 to 79 Years | 0 (0.0%) | 0 (0.0%) |
| 80 to 84 Years | 0 (0.0%) | 0 (0.0%) |
| 85 Years and over | 0 (0.0%) | 0 (0.0%) |
| Total | 38 (100.0%) | 51 (100.0%) |
Families and Households in Tselakai Dezza
Median Family Size in Tselakai Dezza
The median family size in Tselakai Dezza is 3.85 persons per family, with single female/mother families (5 | 25.0%) accounting for the largest median family size of 6.6 persons per family. On the other hand, married-couple families (12 | 60.0%) represent the smallest median family size with 2.83 persons per family.
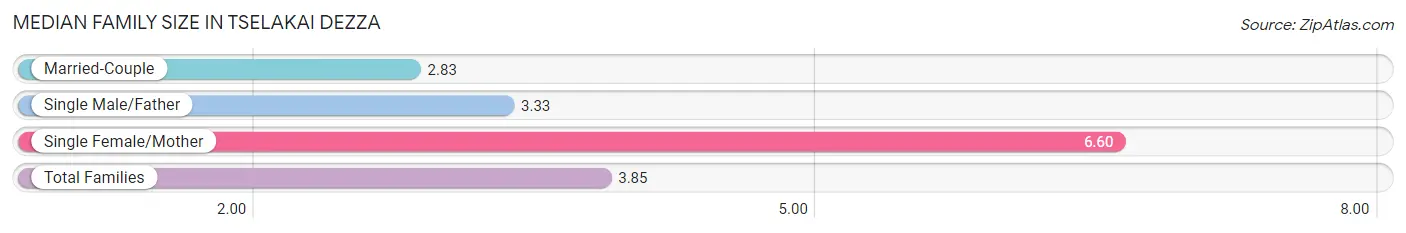
| Family Type | # Families | Family Size |
| Married-Couple | 12 (60.0%) | 2.83 |
| Single Male/Father | 3 (15.0%) | 3.33 |
| Single Female/Mother | 5 (25.0%) | 6.60 |
| Total Families | 20 (100.0%) | 3.85 |
Median Household Size in Tselakai Dezza
The median household size in Tselakai Dezza is 2.97 persons per household, with single female/mother households (5 | 16.7%) accounting for the largest median household size of 6.6 persons per household. non-family households (10 | 33.3%) represent the smallest median household size with 1.20 persons per household.
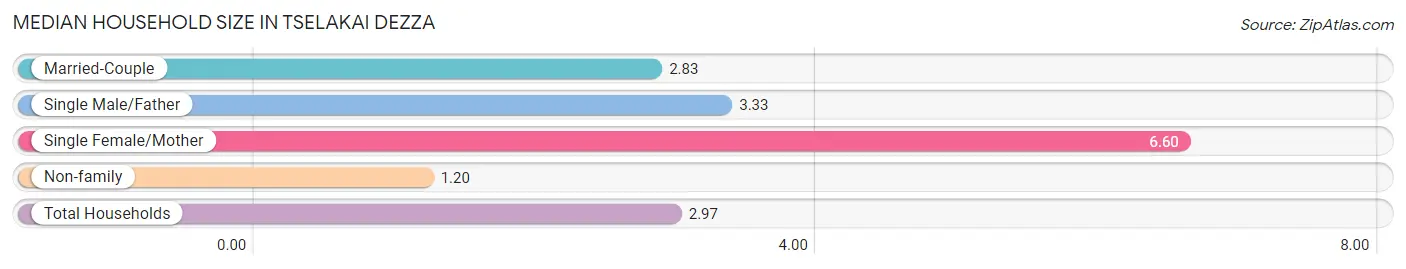
| Household Type | # Households | Household Size |
| Married-Couple | 12 (40.0%) | 2.83 |
| Single Male/Father | 3 (10.0%) | 3.33 |
| Single Female/Mother | 5 (16.7%) | 6.60 |
| Non-family | 10 (33.3%) | 1.20 |
| Total Households | 30 (100.0%) | 2.97 |
Household Size by Marriage Status in Tselakai Dezza
Out of a total of 30 households in Tselakai Dezza, 20 (66.7%) are family households, while 10 (33.3%) are nonfamily households. The most numerous type of family households are 2-person households, comprising 8, and the most common type of nonfamily households are 1-person households, comprising 8.
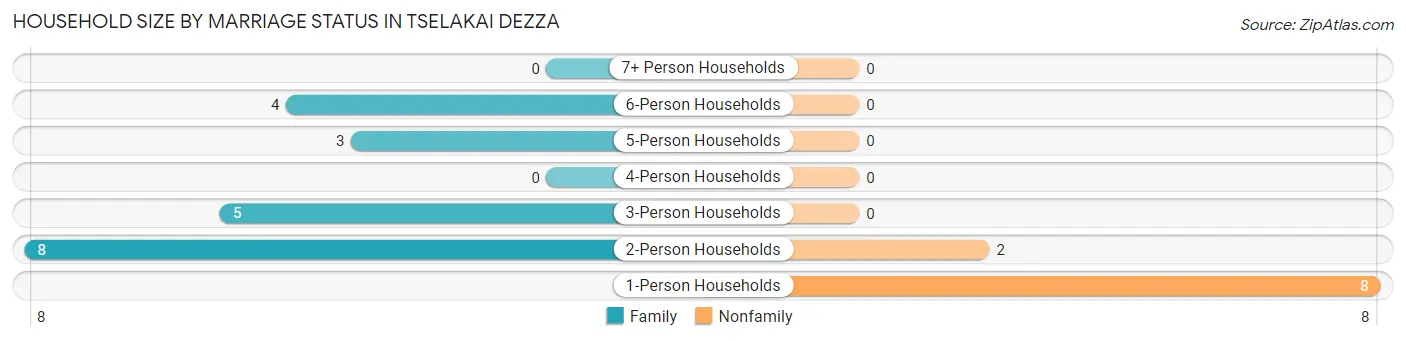
| Household Size | Family Households | Nonfamily Households |
| 1-Person Households | - | 8 (26.7%) |
| 2-Person Households | 8 (26.7%) | 2 (6.7%) |
| 3-Person Households | 5 (16.7%) | 0 (0.0%) |
| 4-Person Households | 0 (0.0%) | 0 (0.0%) |
| 5-Person Households | 3 (10.0%) | 0 (0.0%) |
| 6-Person Households | 4 (13.3%) | 0 (0.0%) |
| 7+ Person Households | 0 (0.0%) | 0 (0.0%) |
| Total | 20 (66.7%) | 10 (33.3%) |
Female Fertility in Tselakai Dezza
Fertility by Age in Tselakai Dezza
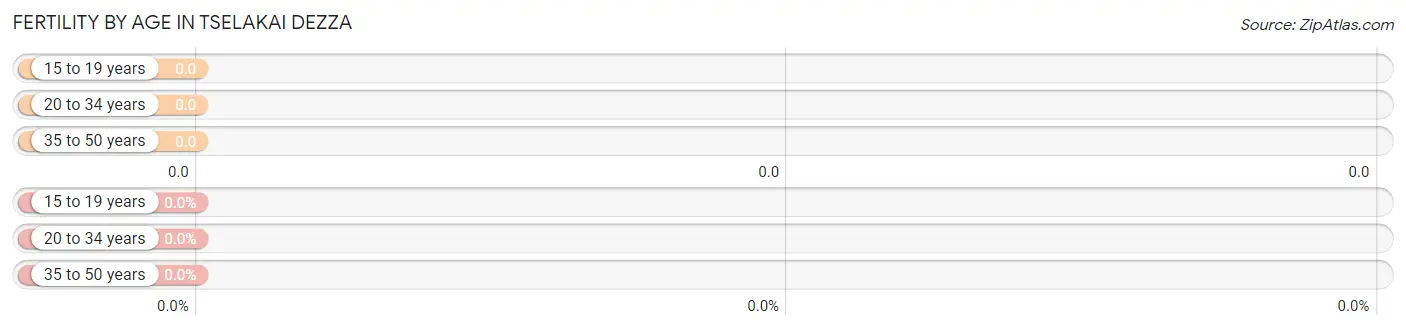
| Age Bracket | Women with Births | Births / 1,000 Women |
| 15 to 19 years | 0 (0.0%) | 0.0 |
| 20 to 34 years | 0 (0.0%) | 0.0 |
| 35 to 50 years | 0 (0.0%) | 0.0 |
| Total | 0 (0.0%) | 0.0 |
Fertility by Age by Marriage Status in Tselakai Dezza
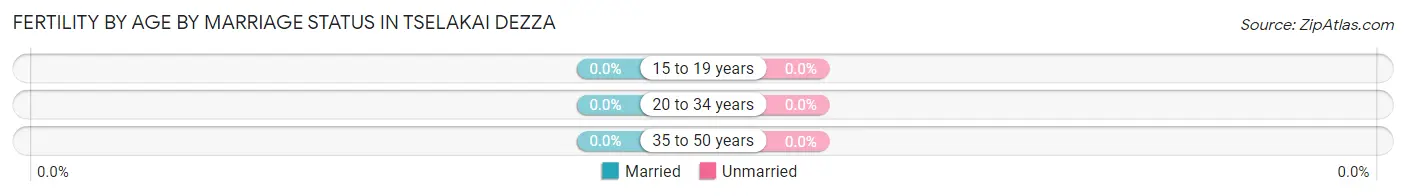
| Age Bracket | Married | Unmarried |
| 15 to 19 years | 0 (0.0%) | 0 (0.0%) |
| 20 to 34 years | 0 (0.0%) | 0 (0.0%) |
| 35 to 50 years | 0 (0.0%) | 0 (0.0%) |
| Total | 0 (0.0%) | 0 (0.0%) |
Fertility by Education in Tselakai Dezza
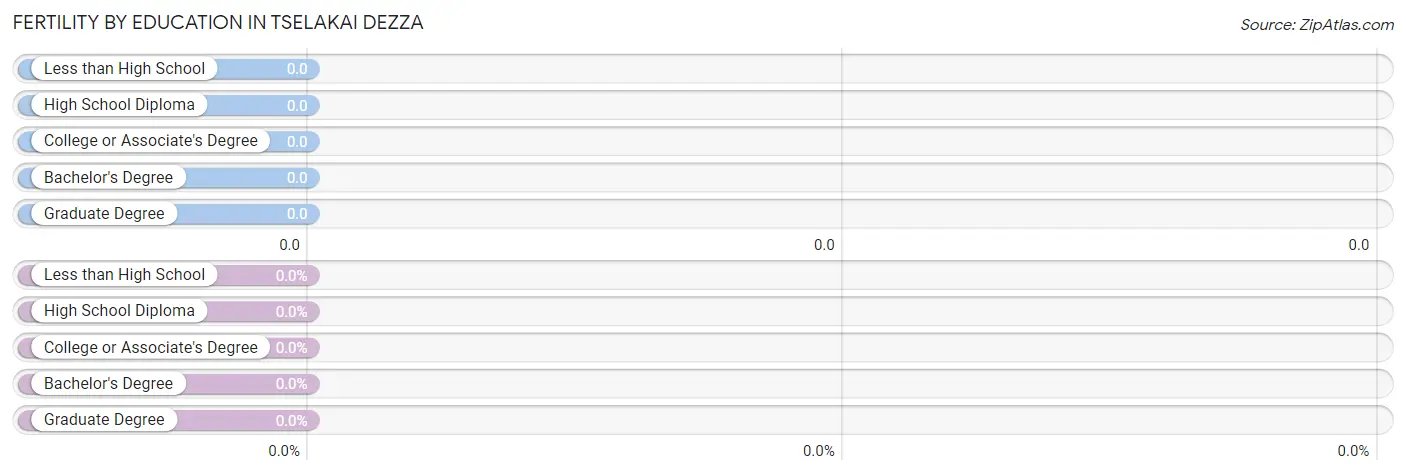
| Educational Attainment | Women with Births | Births / 1,000 Women |
| Less than High School | 0 (0.0%) | 0.0 |
| High School Diploma | 0 (0.0%) | 0.0 |
| College or Associate's Degree | 0 (0.0%) | 0.0 |
| Bachelor's Degree | 0 (0.0%) | 0.0 |
| Graduate Degree | 0 (0.0%) | 0.0 |
| Total | 0 (0.0%) | 0.0 |
Fertility by Education by Marriage Status in Tselakai Dezza
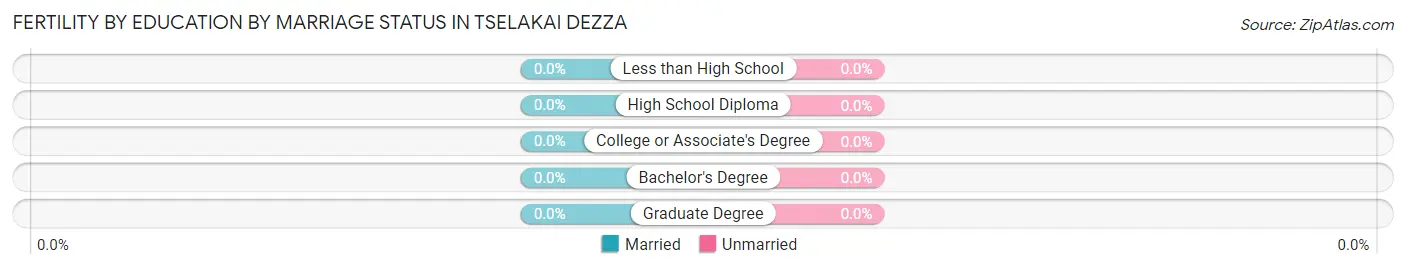
| Educational Attainment | Married | Unmarried |
| Less than High School | 0 (0.0%) | 0 (0.0%) |
| High School Diploma | 0 (0.0%) | 0 (0.0%) |
| College or Associate's Degree | 0 (0.0%) | 0 (0.0%) |
| Bachelor's Degree | 0 (0.0%) | 0 (0.0%) |
| Graduate Degree | 0 (0.0%) | 0 (0.0%) |
| Total | 0 (0.0%) | 0 (0.0%) |
Employment Characteristics in Tselakai Dezza
Employment by Class of Employer in Tselakai Dezza
Among the 19 employed individuals in Tselakai Dezza, private company employees (15 | 78.9%), and state government employees (4 | 21.0%) make up the most common classes of employment.
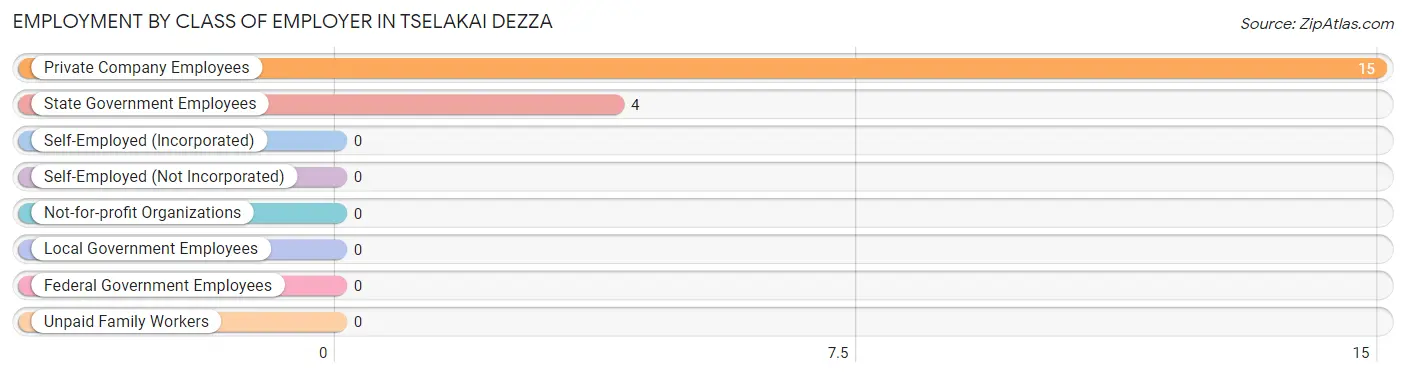
| Employer Class | # Employees | % Employees |
| Private Company Employees | 15 | 78.9% |
| Self-Employed (Incorporated) | 0 | 0.0% |
| Self-Employed (Not Incorporated) | 0 | 0.0% |
| Not-for-profit Organizations | 0 | 0.0% |
| Local Government Employees | 0 | 0.0% |
| State Government Employees | 4 | 21.0% |
| Federal Government Employees | 0 | 0.0% |
| Unpaid Family Workers | 0 | 0.0% |
| Total | 19 | 100.0% |
Employment Status by Age in Tselakai Dezza
According to the labor force statistics for Tselakai Dezza, out of the total population over 16 years of age (59), 39.0% or 23 individuals are in the labor force, with 17.4% or 4 of them unemployed. The age group with the highest labor force participation rate is 35 to 44 years, with 57.1% or 4 individuals in the labor force. Within the labor force, the 45 to 54 years age range has the highest percentage of unemployed individuals, with 100.0% or 4 of them being unemployed.
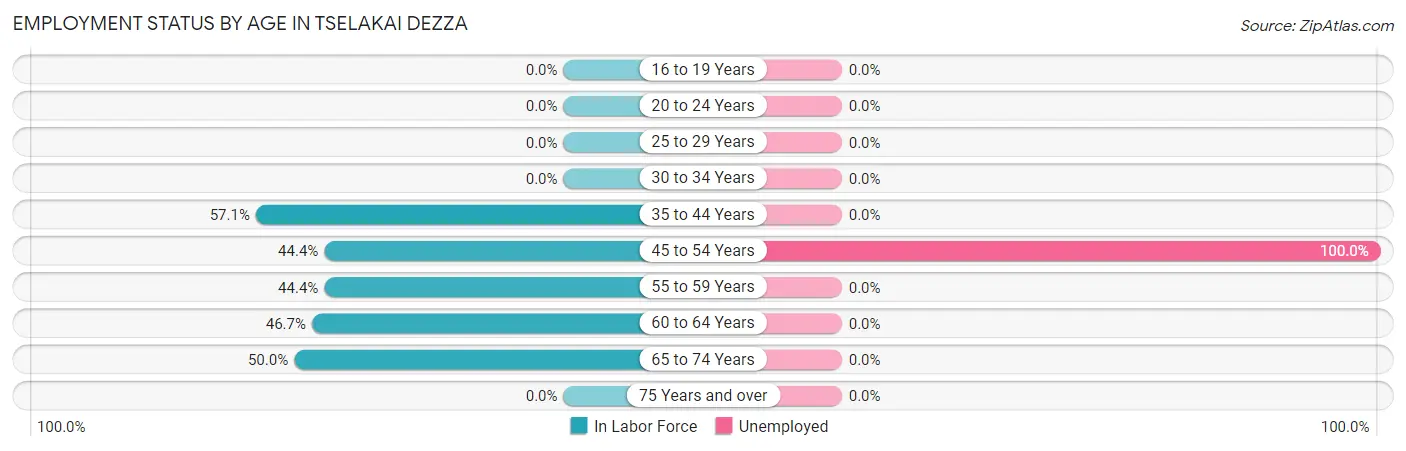
| Age Bracket | In Labor Force | Unemployed |
| 16 to 19 Years | 0 (0.0%) | 0 (0.0%) |
| 20 to 24 Years | 0 (0.0%) | 0 (0.0%) |
| 25 to 29 Years | 0 (0.0%) | 0 (0.0%) |
| 30 to 34 Years | 0 (0.0%) | 0 (0.0%) |
| 35 to 44 Years | 4 (57.1%) | 0 (0.0%) |
| 45 to 54 Years | 4 (44.4%) | 4 (100.0%) |
| 55 to 59 Years | 4 (44.4%) | 0 (0.0%) |
| 60 to 64 Years | 7 (46.7%) | 0 (0.0%) |
| 65 to 74 Years | 4 (50.0%) | 0 (0.0%) |
| 75 Years and over | 0 (0.0%) | 0 (0.0%) |
| Total | 23 (39.0%) | 4 (17.4%) |
Employment Status by Educational Attainment in Tselakai Dezza
According to labor force statistics for Tselakai Dezza, 42.2% of individuals (19) out of the total population between 25 and 64 years of age (45) are in the labor force, with 21.1% or 4 of them being unemployed. The group with the highest labor force participation rate are those with the educational attainment of bachelor's degree or higher, with 57.1% or 4 individuals in the labor force. Within the labor force, individuals with high school diploma education have the highest percentage of unemployment, with 66.7% or 4 of them being unemployed.
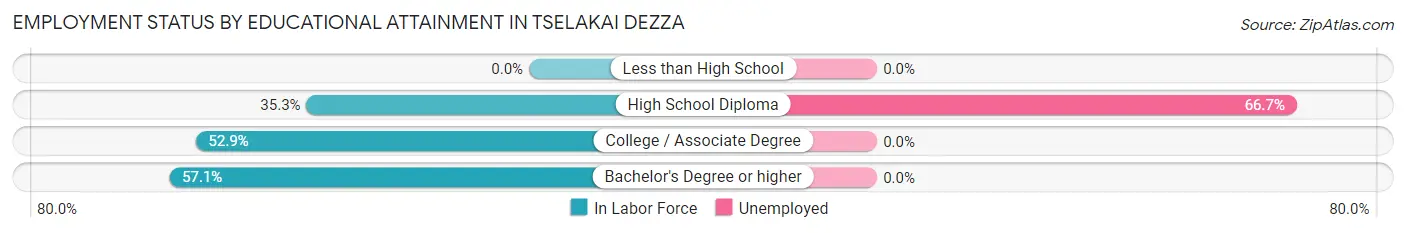
| Educational Attainment | In Labor Force | Unemployed |
| Less than High School | 0 (0.0%) | 0 (0.0%) |
| High School Diploma | 6 (35.3%) | 11 (66.7%) |
| College / Associate Degree | 9 (52.9%) | 0 (0.0%) |
| Bachelor's Degree or higher | 4 (57.1%) | 0 (0.0%) |
| Total | 19 (42.2%) | 9 (21.1%) |
Employment Occupations by Sex in Tselakai Dezza
Management, Business, Science and Arts Occupations
The most common Management, Business, Science and Arts occupations in Tselakai Dezza are Community & Social Service (4 | 21.0%), Education, Arts & Media (4 | 21.0%), Management (2 | 10.5%), Health Diagnosing & Treating (2 | 10.5%), and Health Technologists (2 | 10.5%).
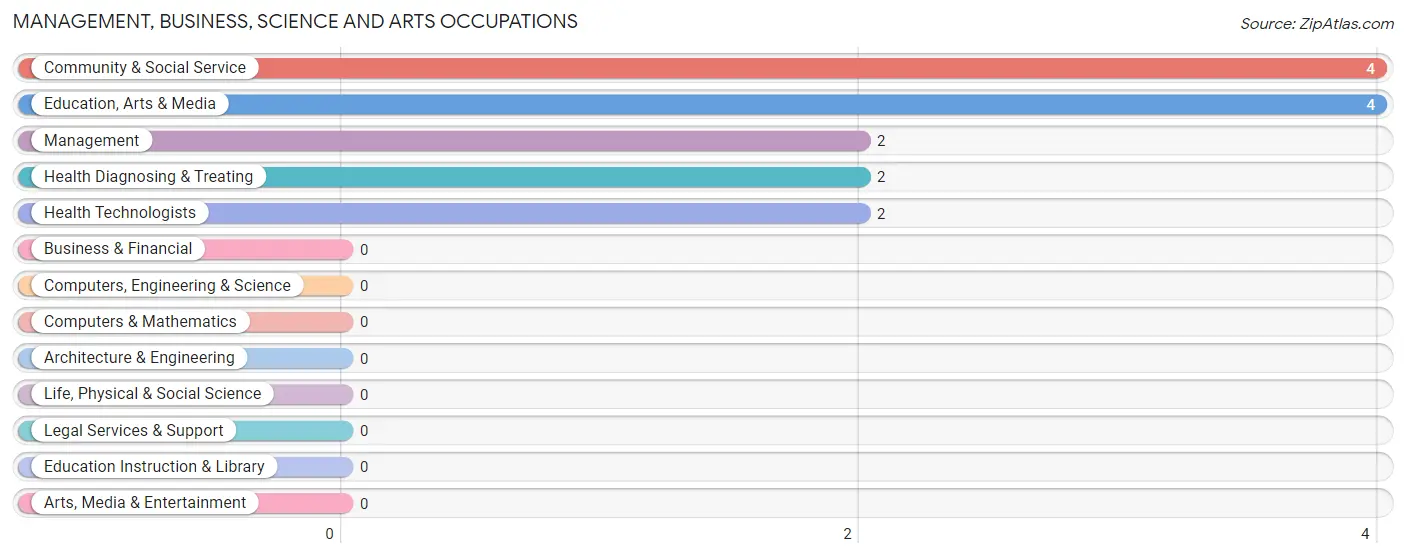
Management, Business, Science and Arts Occupations by Sex
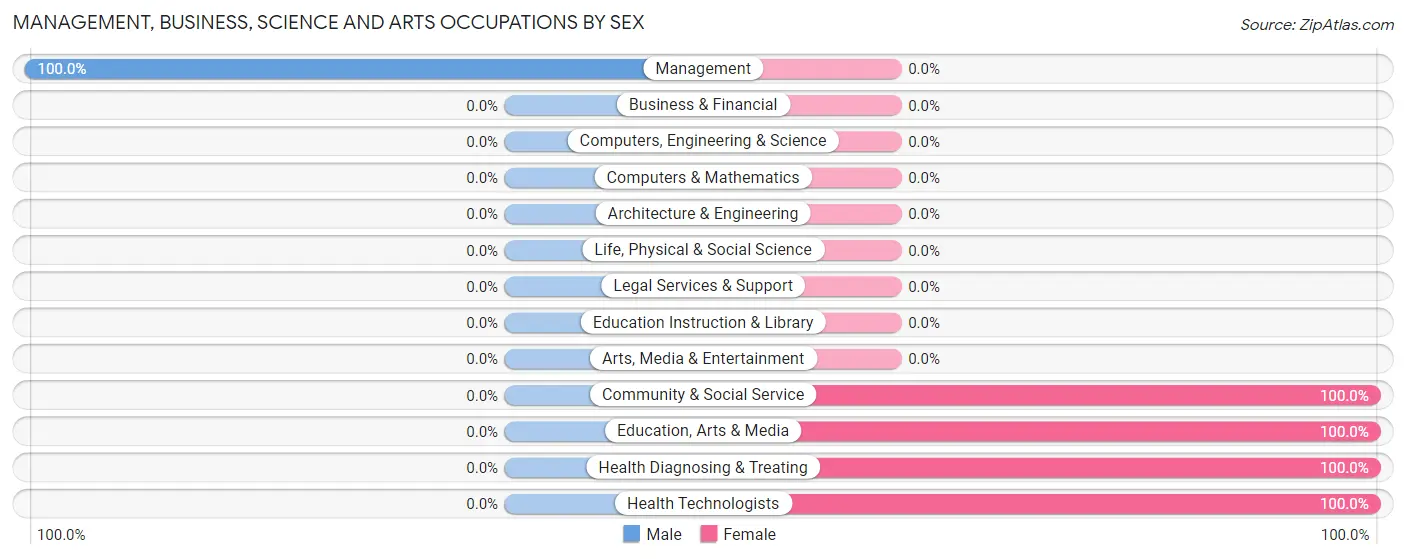
| Occupation | Male | Female |
| Management | 2 (100.0%) | 0 (0.0%) |
| Business & Financial | 0 (0.0%) | 0 (0.0%) |
| Computers, Engineering & Science | 0 (0.0%) | 0 (0.0%) |
| Computers & Mathematics | 0 (0.0%) | 0 (0.0%) |
| Architecture & Engineering | 0 (0.0%) | 0 (0.0%) |
| Life, Physical & Social Science | 0 (0.0%) | 0 (0.0%) |
| Community & Social Service | 0 (0.0%) | 4 (100.0%) |
| Education, Arts & Media | 0 (0.0%) | 4 (100.0%) |
| Legal Services & Support | 0 (0.0%) | 0 (0.0%) |
| Education Instruction & Library | 0 (0.0%) | 0 (0.0%) |
| Arts, Media & Entertainment | 0 (0.0%) | 0 (0.0%) |
| Health Diagnosing & Treating | 0 (0.0%) | 2 (100.0%) |
| Health Technologists | 0 (0.0%) | 2 (100.0%) |
| Total (Category) | 2 (25.0%) | 6 (75.0%) |
| Total (Overall) | 6 (31.6%) | 13 (68.4%) |
Services Occupations
The most common Services occupations in Tselakai Dezza are , and Healthcare Support (3 | 15.8%).
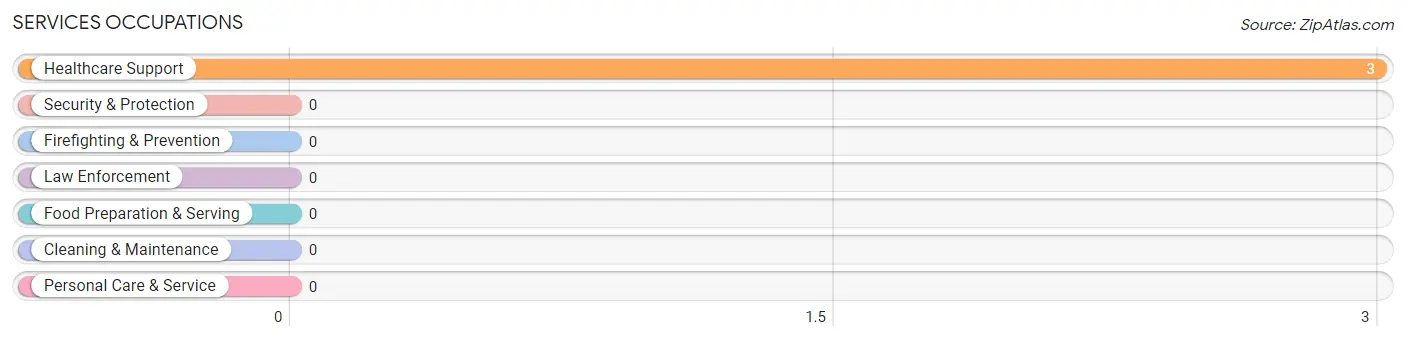
Services Occupations by Sex
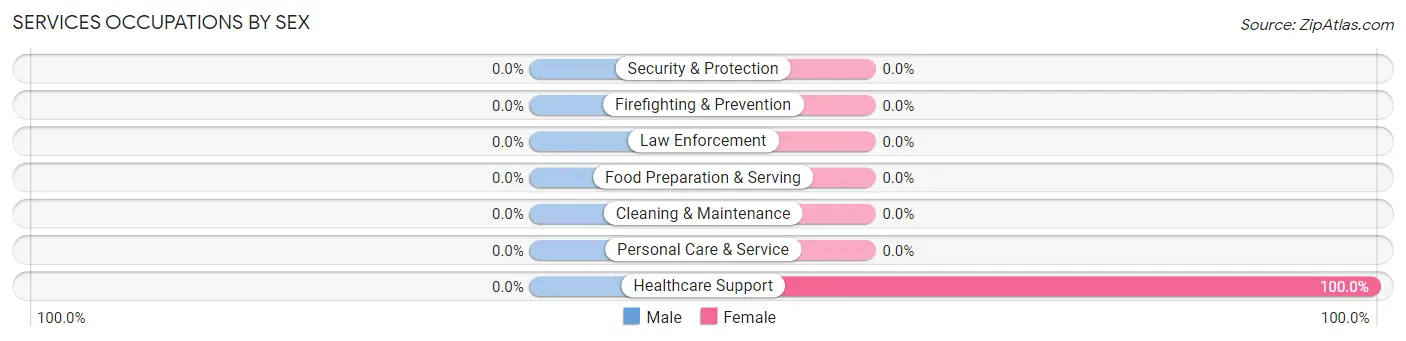
| Occupation | Male | Female |
| Healthcare Support | 0 (0.0%) | 3 (100.0%) |
| Security & Protection | 0 (0.0%) | 0 (0.0%) |
| Firefighting & Prevention | 0 (0.0%) | 0 (0.0%) |
| Law Enforcement | 0 (0.0%) | 0 (0.0%) |
| Food Preparation & Serving | 0 (0.0%) | 0 (0.0%) |
| Cleaning & Maintenance | 0 (0.0%) | 0 (0.0%) |
| Personal Care & Service | 0 (0.0%) | 0 (0.0%) |
| Total (Category) | 0 (0.0%) | 3 (100.0%) |
| Total (Overall) | 6 (31.6%) | 13 (68.4%) |
Sales and Office Occupations

Sales and Office Occupations by Sex

| Occupation | Male | Female |
| Sales & Related | 0 (0.0%) | 0 (0.0%) |
| Office & Administration | 0 (0.0%) | 0 (0.0%) |
| Total (Category) | 0 (0.0%) | 0 (0.0%) |
| Total (Overall) | 6 (31.6%) | 13 (68.4%) |
Natural Resources, Construction and Maintenance Occupations
The most common Natural Resources, Construction and Maintenance occupations in Tselakai Dezza are Construction & Extraction (2 | 10.5%), and Installation, Maintenance & Repair (2 | 10.5%).
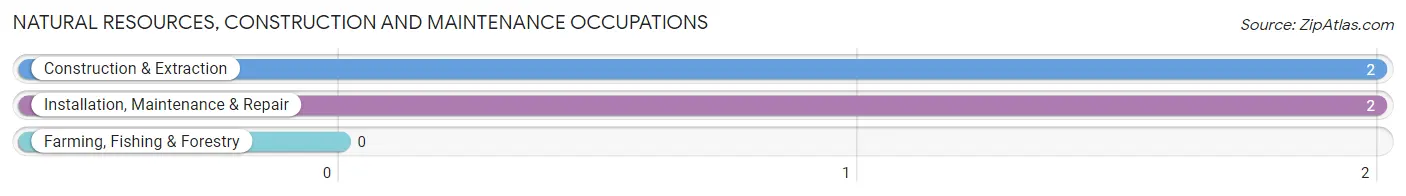
Natural Resources, Construction and Maintenance Occupations by Sex
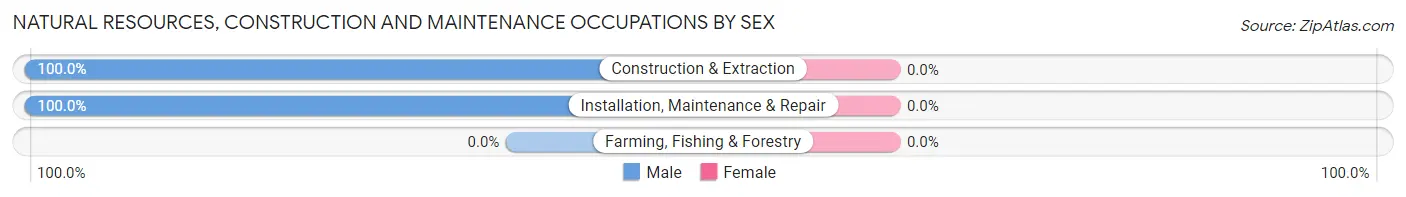
| Occupation | Male | Female |
| Farming, Fishing & Forestry | 0 (0.0%) | 0 (0.0%) |
| Construction & Extraction | 2 (100.0%) | 0 (0.0%) |
| Installation, Maintenance & Repair | 2 (100.0%) | 0 (0.0%) |
| Total (Category) | 4 (100.0%) | 0 (0.0%) |
| Total (Overall) | 6 (31.6%) | 13 (68.4%) |
Production, Transportation and Moving Occupations
The most common Production, Transportation and Moving occupations in Tselakai Dezza are , and Production (4 | 21.0%).
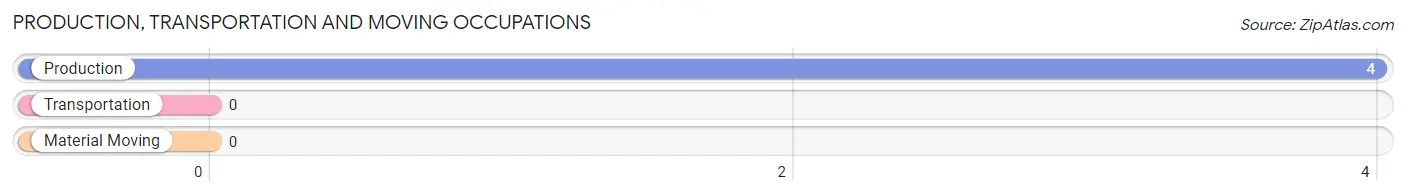
Production, Transportation and Moving Occupations by Sex
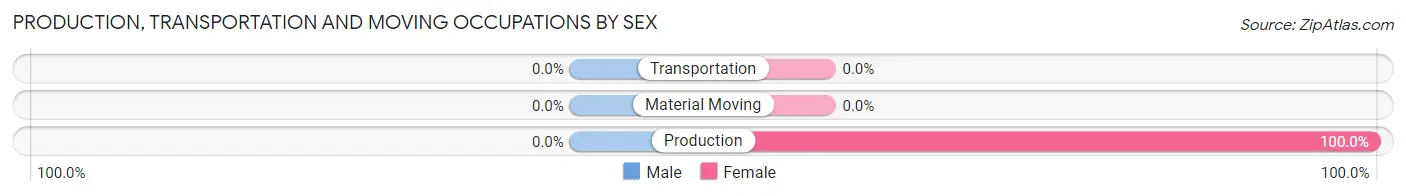
| Occupation | Male | Female |
| Production | 0 (0.0%) | 4 (100.0%) |
| Transportation | 0 (0.0%) | 0 (0.0%) |
| Material Moving | 0 (0.0%) | 0 (0.0%) |
| Total (Category) | 0 (0.0%) | 4 (100.0%) |
| Total (Overall) | 6 (31.6%) | 13 (68.4%) |
Employment Industries by Sex in Tselakai Dezza
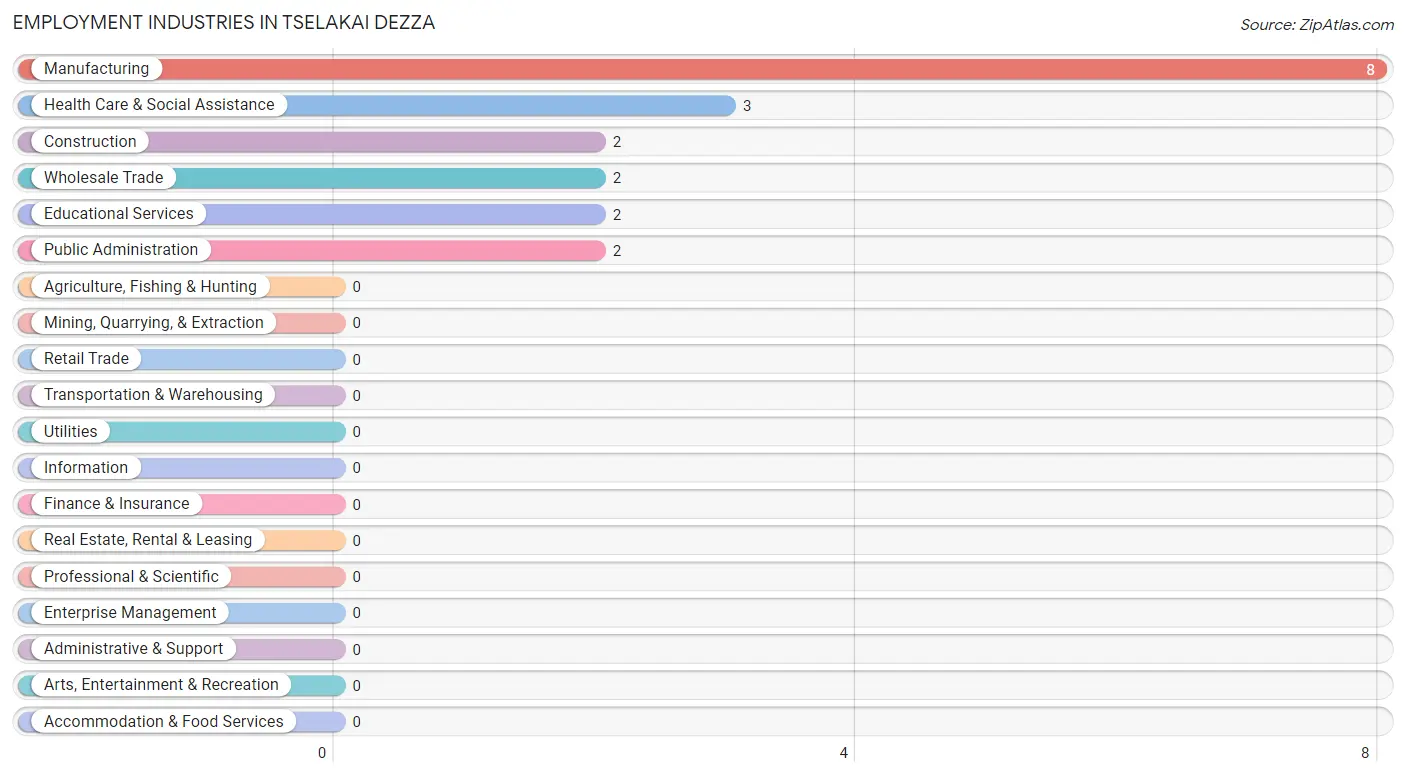
Employment Industries in Tselakai Dezza
The major employment industries in Tselakai Dezza include Manufacturing (8 | 42.1%), Health Care & Social Assistance (3 | 15.8%), Construction (2 | 10.5%), Wholesale Trade (2 | 10.5%), and Educational Services (2 | 10.5%).
Employment Industries by Sex in Tselakai Dezza
The Tselakai Dezza industries that see more men than women are Construction (100.0%), Wholesale Trade (100.0%), and Public Administration (100.0%), whereas the industries that tend to have a higher number of women are Manufacturing (100.0%), Educational Services (100.0%), and Health Care & Social Assistance (100.0%).
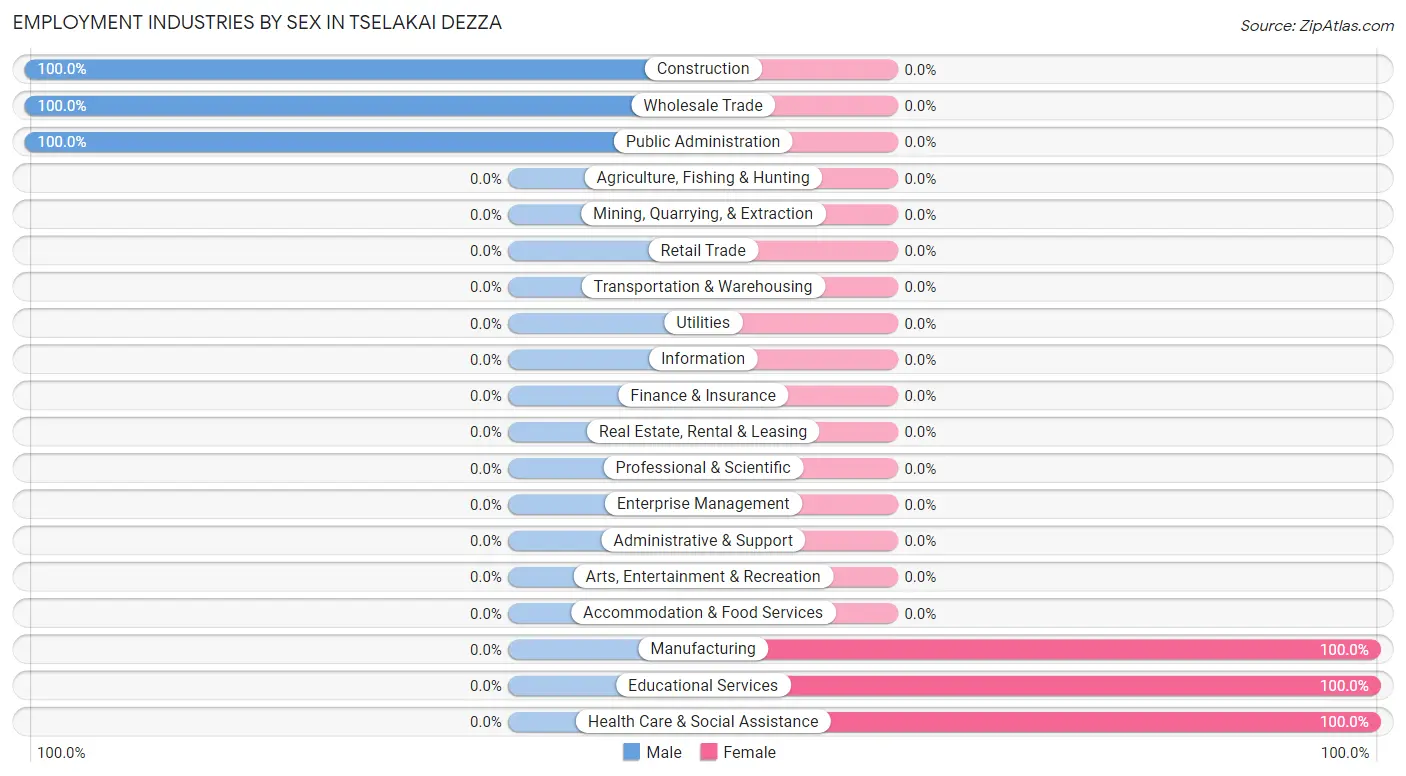
| Industry | Male | Female |
| Agriculture, Fishing & Hunting | 0 (0.0%) | 0 (0.0%) |
| Mining, Quarrying, & Extraction | 0 (0.0%) | 0 (0.0%) |
| Construction | 2 (100.0%) | 0 (0.0%) |
| Manufacturing | 0 (0.0%) | 8 (100.0%) |
| Wholesale Trade | 2 (100.0%) | 0 (0.0%) |
| Retail Trade | 0 (0.0%) | 0 (0.0%) |
| Transportation & Warehousing | 0 (0.0%) | 0 (0.0%) |
| Utilities | 0 (0.0%) | 0 (0.0%) |
| Information | 0 (0.0%) | 0 (0.0%) |
| Finance & Insurance | 0 (0.0%) | 0 (0.0%) |
| Real Estate, Rental & Leasing | 0 (0.0%) | 0 (0.0%) |
| Professional & Scientific | 0 (0.0%) | 0 (0.0%) |
| Enterprise Management | 0 (0.0%) | 0 (0.0%) |
| Administrative & Support | 0 (0.0%) | 0 (0.0%) |
| Educational Services | 0 (0.0%) | 2 (100.0%) |
| Health Care & Social Assistance | 0 (0.0%) | 3 (100.0%) |
| Arts, Entertainment & Recreation | 0 (0.0%) | 0 (0.0%) |
| Accommodation & Food Services | 0 (0.0%) | 0 (0.0%) |
| Public Administration | 2 (100.0%) | 0 (0.0%) |
| Total | 6 (31.6%) | 13 (68.4%) |
Education in Tselakai Dezza
School Enrollment in Tselakai Dezza
The most common levels of schooling among the 34 students in Tselakai Dezza are middle school (14 | 41.2%), high school (14 | 41.2%), and elementary school (3 | 8.8%).
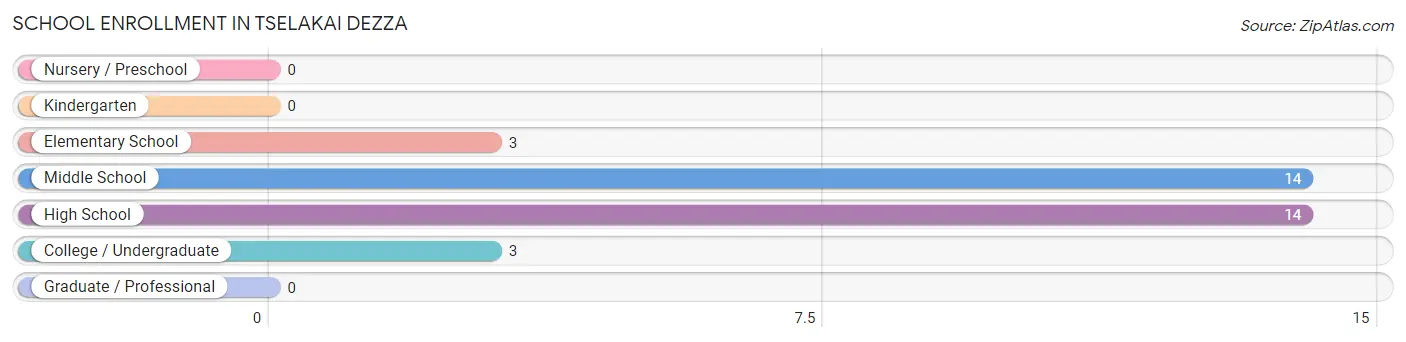
| School Level | # Students | % Students |
| Nursery / Preschool | 0 | 0.0% |
| Kindergarten | 0 | 0.0% |
| Elementary School | 3 | 8.8% |
| Middle School | 14 | 41.2% |
| High School | 14 | 41.2% |
| College / Undergraduate | 3 | 8.8% |
| Graduate / Professional | 0 | 0.0% |
| Total | 34 | 100.0% |
School Enrollment by Age by Funding Source in Tselakai Dezza
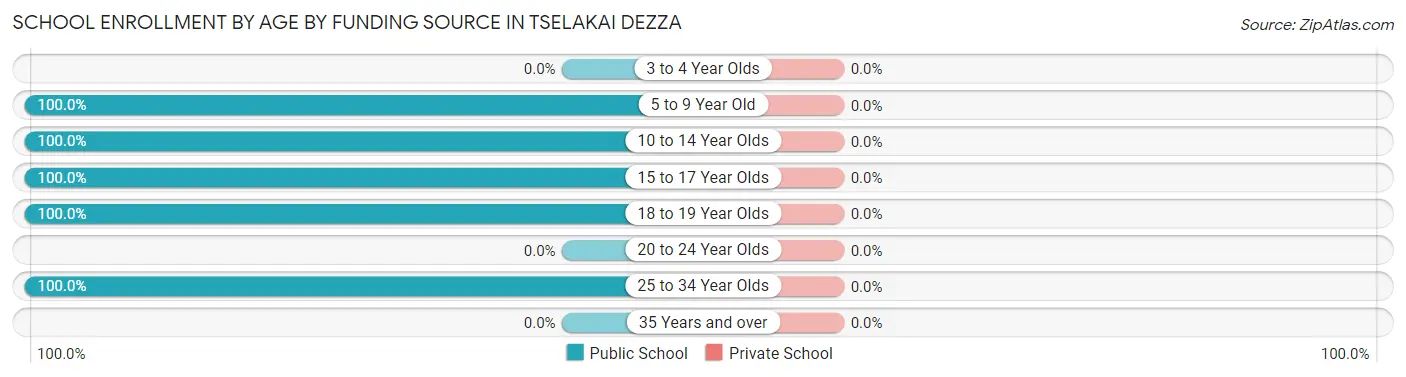
| Age Bracket | Public School | Private School |
| 3 to 4 Year Olds | 0 (0.0%) | 0 (0.0%) |
| 5 to 9 Year Old | 3 (100.0%) | 0 (0.0%) |
| 10 to 14 Year Olds | 19 (100.0%) | 0 (0.0%) |
| 15 to 17 Year Olds | 7 (100.0%) | 0 (0.0%) |
| 18 to 19 Year Olds | 2 (100.0%) | 0 (0.0%) |
| 20 to 24 Year Olds | 0 (0.0%) | 0 (0.0%) |
| 25 to 34 Year Olds | 3 (100.0%) | 0 (0.0%) |
| 35 Years and over | 0 (0.0%) | 0 (0.0%) |
| Total | 34 (100.0%) | 0 (0.0%) |
Educational Attainment by Field of Study in Tselakai Dezza
, and engineering (7 | 100.0%) are the most common fields of study among 7 individuals in Tselakai Dezza who have obtained a bachelor's degree or higher.
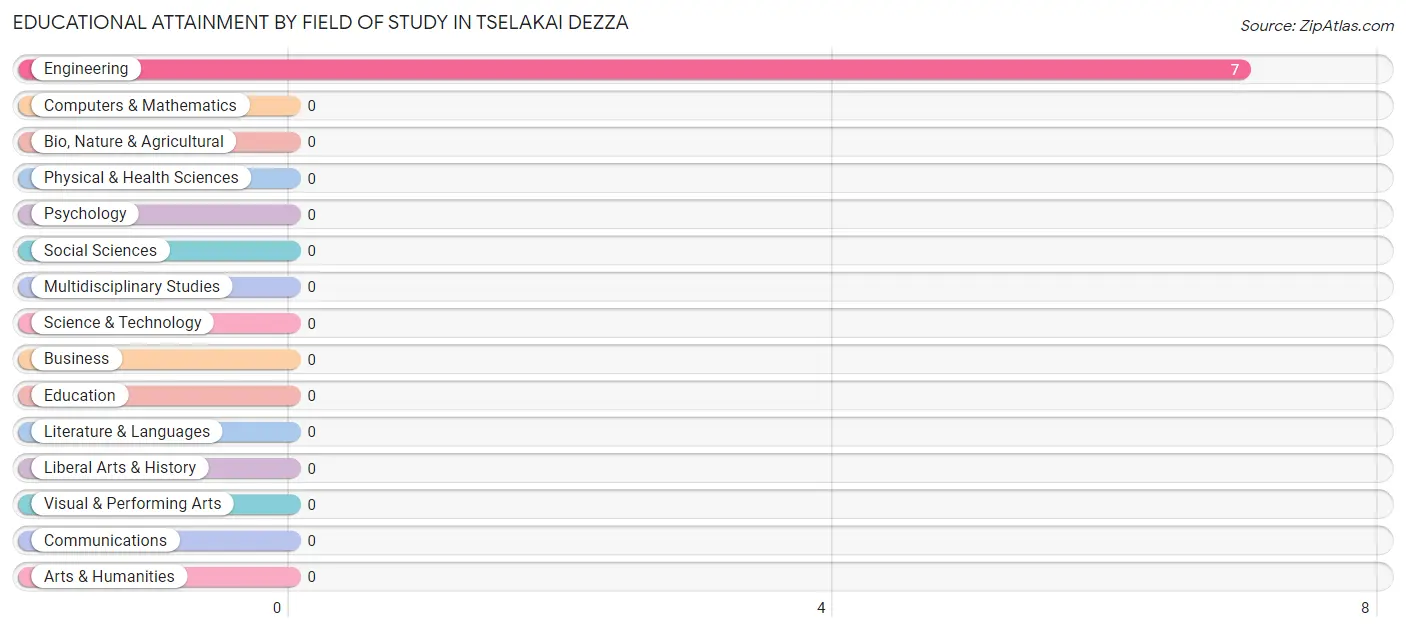
| Field of Study | # Graduates | % Graduates |
| Computers & Mathematics | 0 | 0.0% |
| Bio, Nature & Agricultural | 0 | 0.0% |
| Physical & Health Sciences | 0 | 0.0% |
| Psychology | 0 | 0.0% |
| Social Sciences | 0 | 0.0% |
| Engineering | 7 | 100.0% |
| Multidisciplinary Studies | 0 | 0.0% |
| Science & Technology | 0 | 0.0% |
| Business | 0 | 0.0% |
| Education | 0 | 0.0% |
| Literature & Languages | 0 | 0.0% |
| Liberal Arts & History | 0 | 0.0% |
| Visual & Performing Arts | 0 | 0.0% |
| Communications | 0 | 0.0% |
| Arts & Humanities | 0 | 0.0% |
| Total | 7 | 100.0% |
Transportation & Commute in Tselakai Dezza
Vehicle Availability by Sex in Tselakai Dezza
The most prevalent vehicle ownership categories in Tselakai Dezza are males with 2 vehicles (4, accounting for 66.7%) and females with 2 vehicles (0, making up 30.8%).
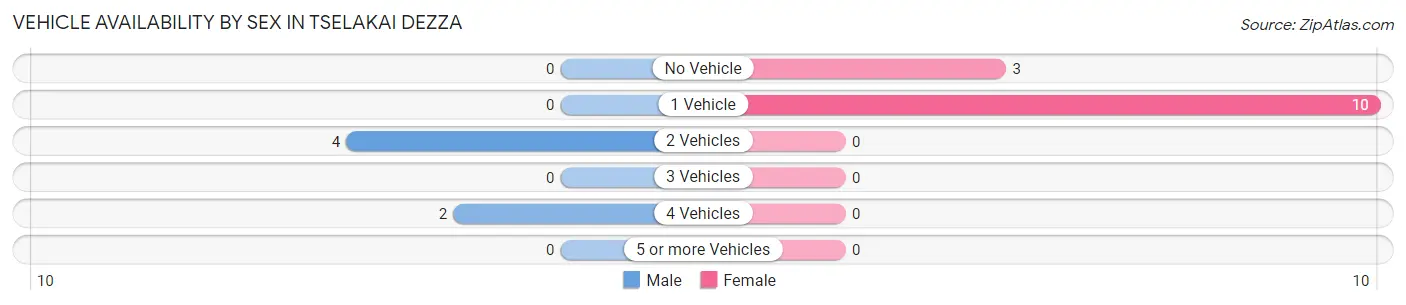
| Vehicles Available | Male | Female |
| No Vehicle | 0 (0.0%) | 3 (23.1%) |
| 1 Vehicle | 0 (0.0%) | 10 (76.9%) |
| 2 Vehicles | 4 (66.7%) | 0 (0.0%) |
| 3 Vehicles | 0 (0.0%) | 0 (0.0%) |
| 4 Vehicles | 2 (33.3%) | 0 (0.0%) |
| 5 or more Vehicles | 0 (0.0%) | 0 (0.0%) |
| Total | 6 (100.0%) | 13 (100.0%) |
Commute Time in Tselakai Dezza
The most frequently occuring commute durations in Tselakai Dezza are 45 to 59 minutes (8 commuters, 47.1%), 60 to 89 minutes (5 commuters, 29.4%), and 35 to 39 minutes (4 commuters, 23.5%).
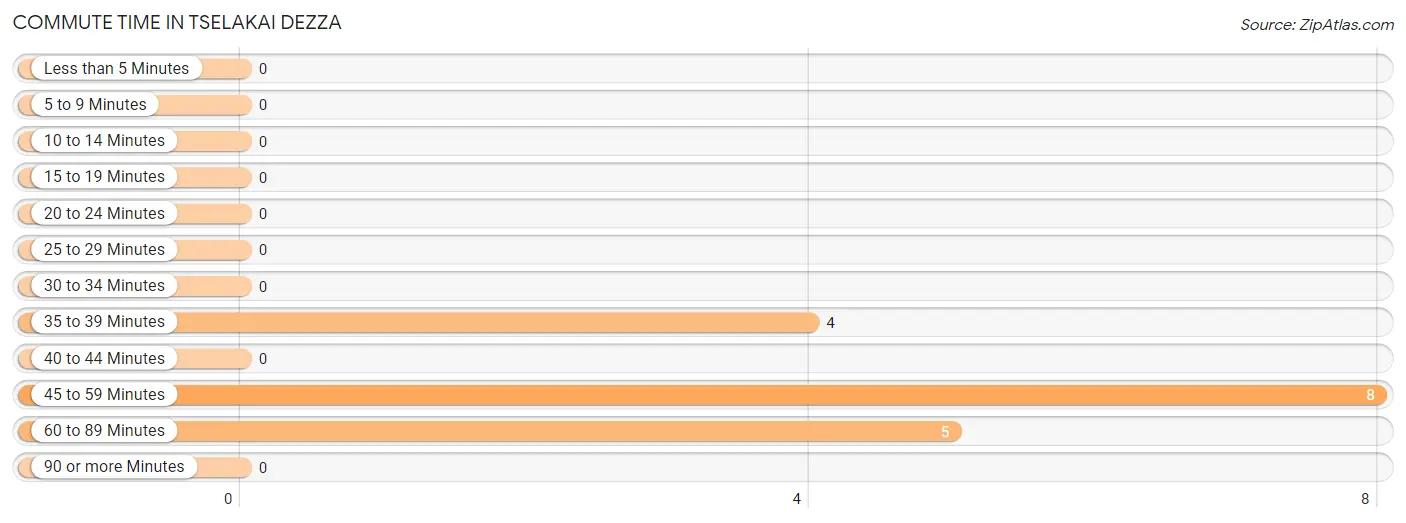
| Commute Time | # Commuters | % Commuters |
| Less than 5 Minutes | 0 | 0.0% |
| 5 to 9 Minutes | 0 | 0.0% |
| 10 to 14 Minutes | 0 | 0.0% |
| 15 to 19 Minutes | 0 | 0.0% |
| 20 to 24 Minutes | 0 | 0.0% |
| 25 to 29 Minutes | 0 | 0.0% |
| 30 to 34 Minutes | 0 | 0.0% |
| 35 to 39 Minutes | 4 | 23.5% |
| 40 to 44 Minutes | 0 | 0.0% |
| 45 to 59 Minutes | 8 | 47.1% |
| 60 to 89 Minutes | 5 | 29.4% |
| 90 or more Minutes | 0 | 0.0% |
Commute Time by Sex in Tselakai Dezza
The most common commute times in Tselakai Dezza are 45 to 59 minutes (4 commuters, 100.0%) for males and 60 to 89 minutes (5 commuters, 38.5%) for females.
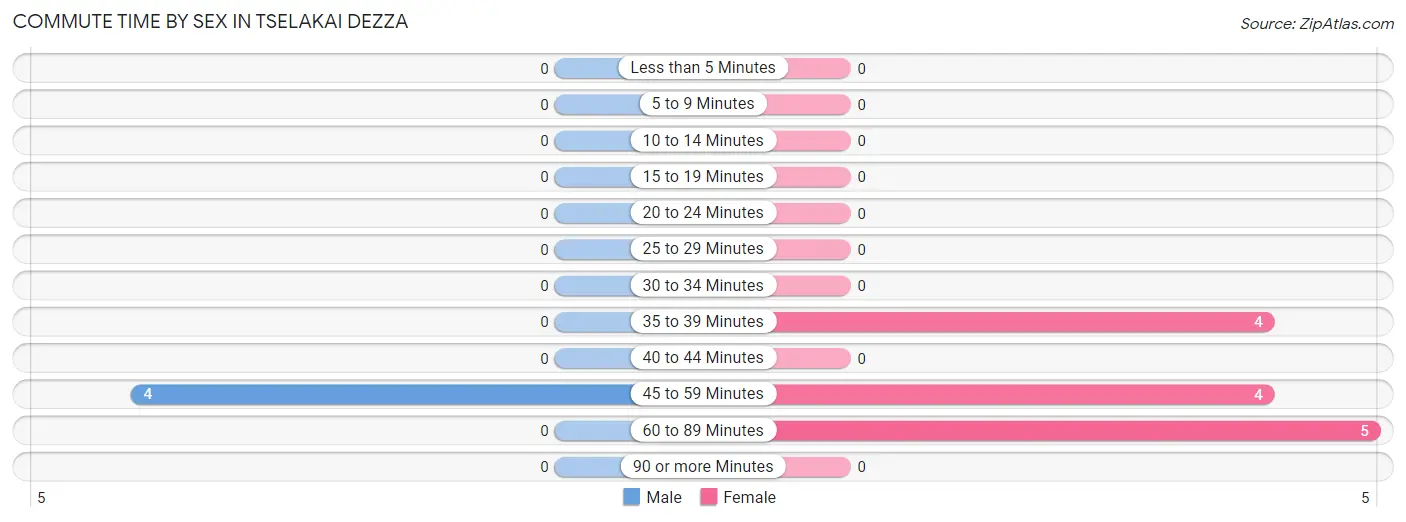
| Commute Time | Male | Female |
| Less than 5 Minutes | 0 (0.0%) | 0 (0.0%) |
| 5 to 9 Minutes | 0 (0.0%) | 0 (0.0%) |
| 10 to 14 Minutes | 0 (0.0%) | 0 (0.0%) |
| 15 to 19 Minutes | 0 (0.0%) | 0 (0.0%) |
| 20 to 24 Minutes | 0 (0.0%) | 0 (0.0%) |
| 25 to 29 Minutes | 0 (0.0%) | 0 (0.0%) |
| 30 to 34 Minutes | 0 (0.0%) | 0 (0.0%) |
| 35 to 39 Minutes | 0 (0.0%) | 4 (30.8%) |
| 40 to 44 Minutes | 0 (0.0%) | 0 (0.0%) |
| 45 to 59 Minutes | 4 (100.0%) | 4 (30.8%) |
| 60 to 89 Minutes | 0 (0.0%) | 5 (38.5%) |
| 90 or more Minutes | 0 (0.0%) | 0 (0.0%) |
Time of Departure to Work by Sex in Tselakai Dezza
The most frequent times of departure to work in Tselakai Dezza are 12:00 AM to 4:59 AM (2, 50.0%) for males and 7:00 AM to 7:29 AM (4, 30.8%) for females.
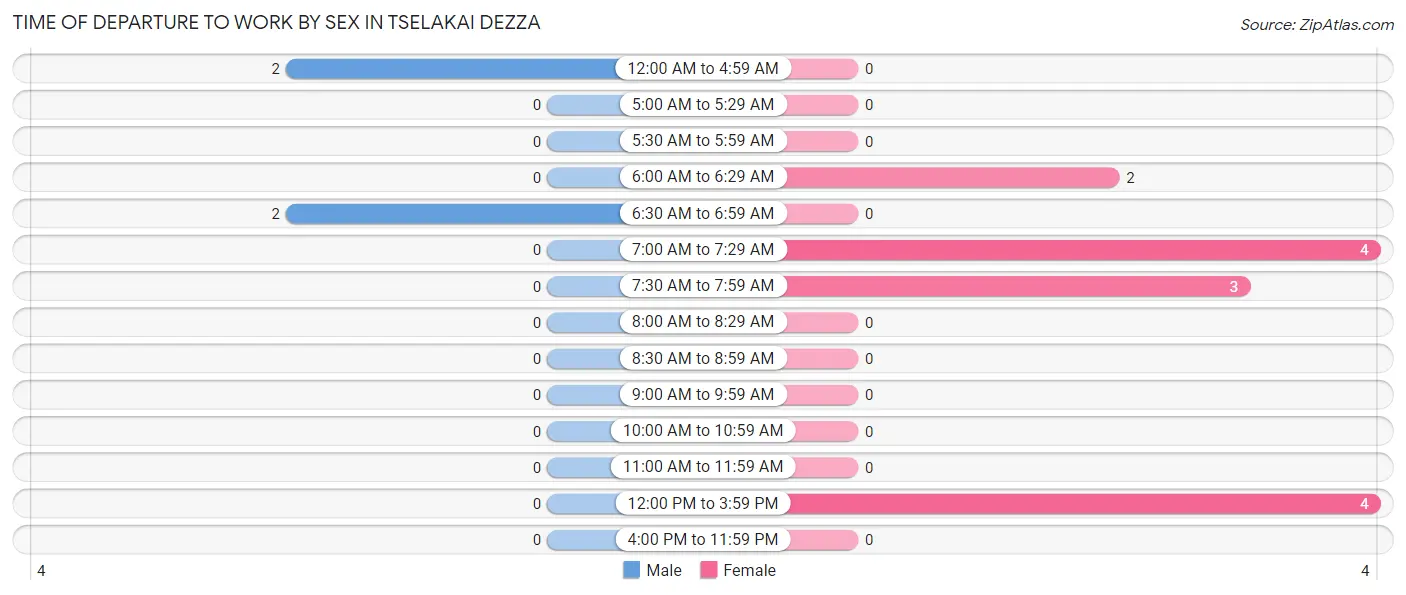
| Time of Departure | Male | Female |
| 12:00 AM to 4:59 AM | 2 (50.0%) | 0 (0.0%) |
| 5:00 AM to 5:29 AM | 0 (0.0%) | 0 (0.0%) |
| 5:30 AM to 5:59 AM | 0 (0.0%) | 0 (0.0%) |
| 6:00 AM to 6:29 AM | 0 (0.0%) | 2 (15.4%) |
| 6:30 AM to 6:59 AM | 2 (50.0%) | 0 (0.0%) |
| 7:00 AM to 7:29 AM | 0 (0.0%) | 4 (30.8%) |
| 7:30 AM to 7:59 AM | 0 (0.0%) | 3 (23.1%) |
| 8:00 AM to 8:29 AM | 0 (0.0%) | 0 (0.0%) |
| 8:30 AM to 8:59 AM | 0 (0.0%) | 0 (0.0%) |
| 9:00 AM to 9:59 AM | 0 (0.0%) | 0 (0.0%) |
| 10:00 AM to 10:59 AM | 0 (0.0%) | 0 (0.0%) |
| 11:00 AM to 11:59 AM | 0 (0.0%) | 0 (0.0%) |
| 12:00 PM to 3:59 PM | 0 (0.0%) | 4 (30.8%) |
| 4:00 PM to 11:59 PM | 0 (0.0%) | 0 (0.0%) |
| Total | 4 (100.0%) | 13 (100.0%) |
Housing Occupancy in Tselakai Dezza
Occupancy by Ownership in Tselakai Dezza
Of the total 30 dwellings in Tselakai Dezza, owner-occupied units account for 27 (90.0%), while renter-occupied units make up 3 (10.0%).
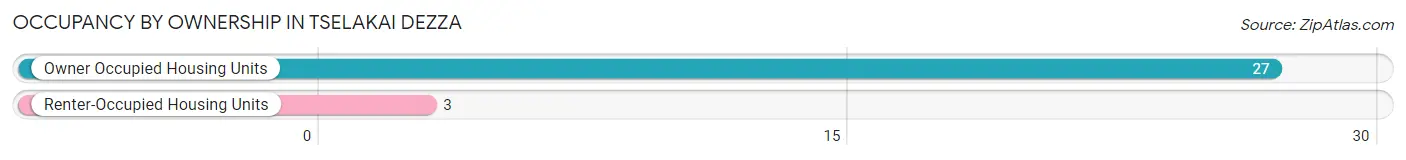
| Occupancy | # Housing Units | % Housing Units |
| Owner Occupied Housing Units | 27 | 90.0% |
| Renter-Occupied Housing Units | 3 | 10.0% |
| Total Occupied Housing Units | 30 | 100.0% |
Occupancy by Household Size in Tselakai Dezza
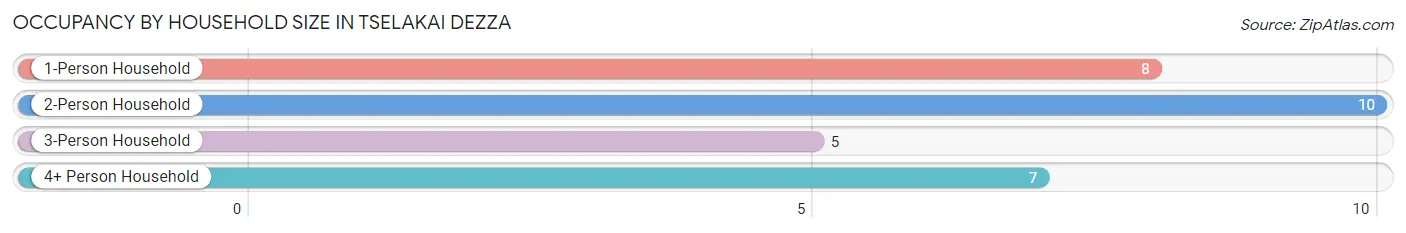
| Household Size | # Housing Units | % Housing Units |
| 1-Person Household | 8 | 26.7% |
| 2-Person Household | 10 | 33.3% |
| 3-Person Household | 5 | 16.7% |
| 4+ Person Household | 7 | 23.3% |
| Total Housing Units | 30 | 100.0% |
Occupancy by Ownership by Household Size in Tselakai Dezza
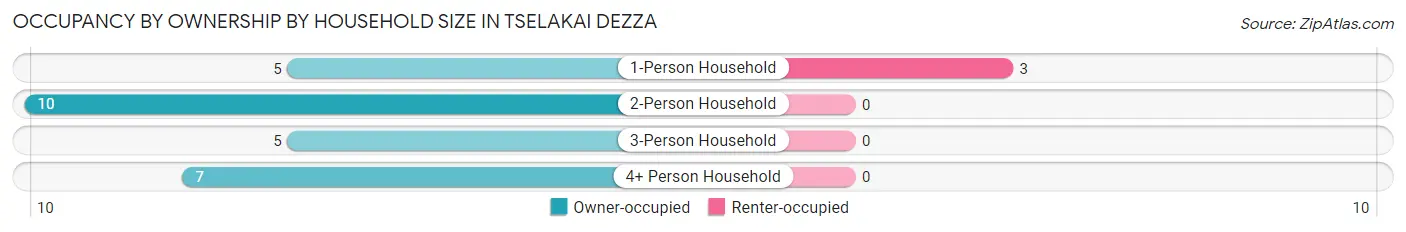
| Household Size | Owner-occupied | Renter-occupied |
| 1-Person Household | 5 (62.5%) | 3 (37.5%) |
| 2-Person Household | 10 (100.0%) | 0 (0.0%) |
| 3-Person Household | 5 (100.0%) | 0 (0.0%) |
| 4+ Person Household | 7 (100.0%) | 0 (0.0%) |
| Total Housing Units | 27 (90.0%) | 3 (10.0%) |
Occupancy by Educational Attainment in Tselakai Dezza
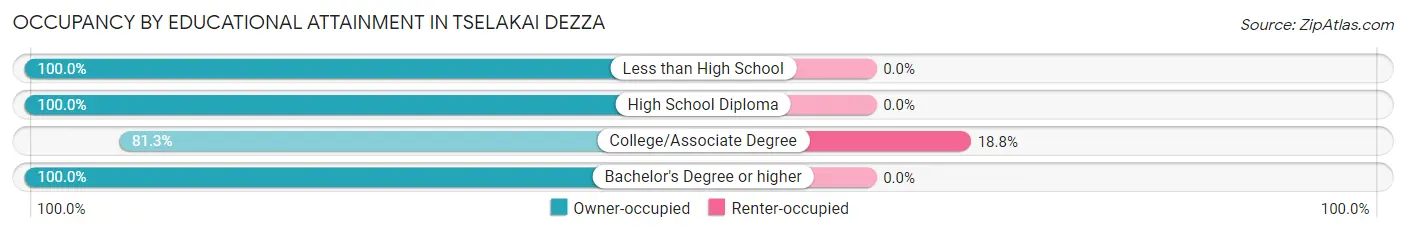
| Household Size | Owner-occupied | Renter-occupied |
| Less than High School | 2 (100.0%) | 0 (0.0%) |
| High School Diploma | 5 (100.0%) | 0 (0.0%) |
| College/Associate Degree | 13 (81.2%) | 3 (18.8%) |
| Bachelor's Degree or higher | 7 (100.0%) | 0 (0.0%) |
Occupancy by Age of Householder in Tselakai Dezza
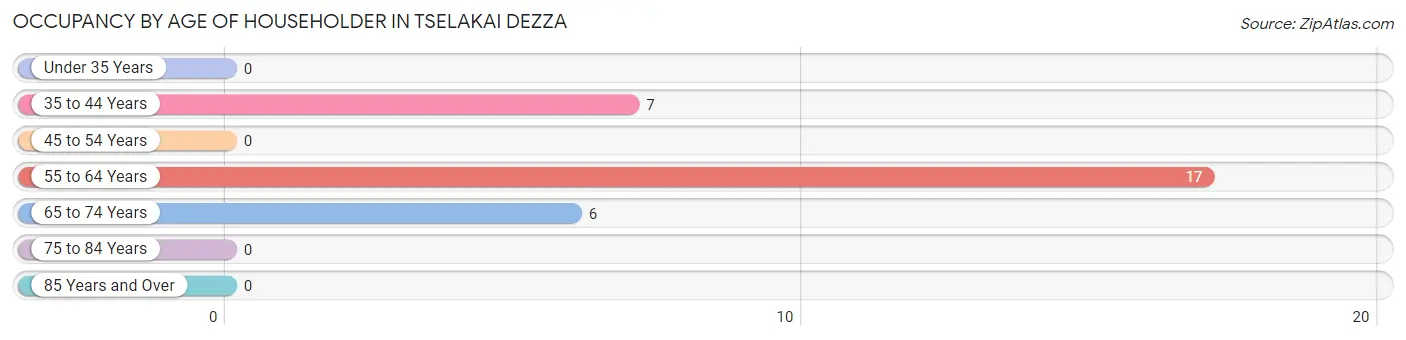
| Age Bracket | # Households | % Households |
| Under 35 Years | 0 | 0.0% |
| 35 to 44 Years | 7 | 23.3% |
| 45 to 54 Years | 0 | 0.0% |
| 55 to 64 Years | 17 | 56.7% |
| 65 to 74 Years | 6 | 20.0% |
| 75 to 84 Years | 0 | 0.0% |
| 85 Years and Over | 0 | 0.0% |
| Total | 30 | 100.0% |
Housing Finances in Tselakai Dezza
Median Income by Occupancy in Tselakai Dezza
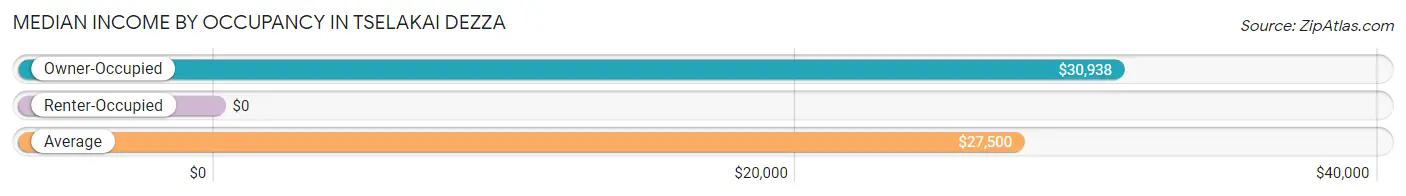
| Occupancy Type | # Households | Median Income |
| Owner-Occupied | 27 (90.0%) | $30,938 |
| Renter-Occupied | 3 (10.0%) | $0 |
| Average | 30 (100.0%) | $27,500 |
Occupancy by Householder Income Bracket in Tselakai Dezza
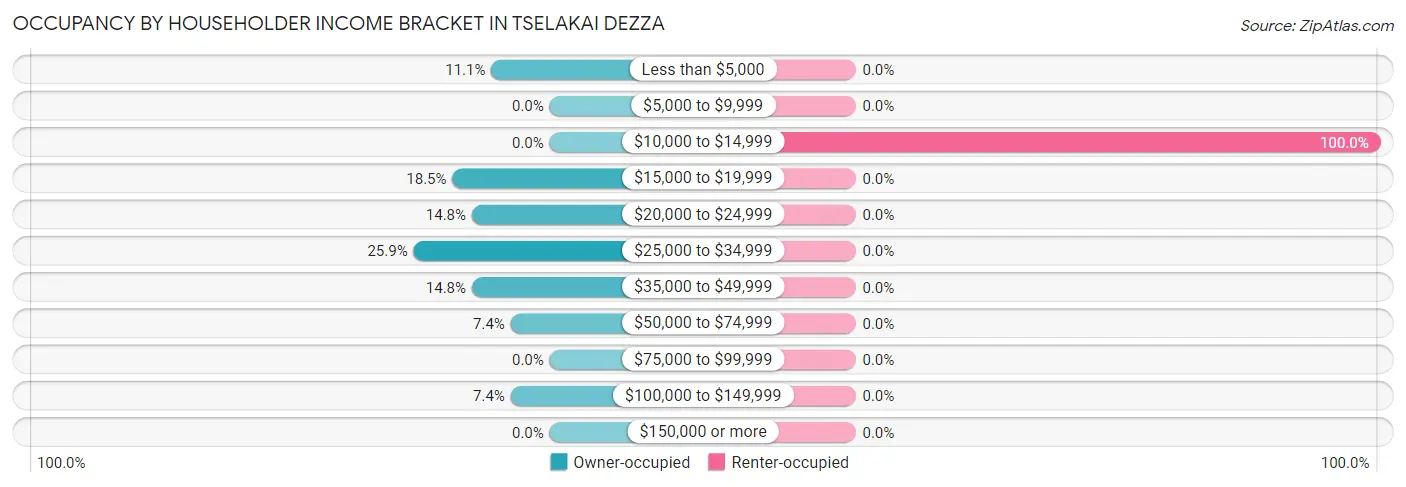
| Income Bracket | Owner-occupied | Renter-occupied |
| Less than $5,000 | 3 (11.1%) | 0 (0.0%) |
| $5,000 to $9,999 | 0 (0.0%) | 0 (0.0%) |
| $10,000 to $14,999 | 0 (0.0%) | 3 (100.0%) |
| $15,000 to $19,999 | 5 (18.5%) | 0 (0.0%) |
| $20,000 to $24,999 | 4 (14.8%) | 0 (0.0%) |
| $25,000 to $34,999 | 7 (25.9%) | 0 (0.0%) |
| $35,000 to $49,999 | 4 (14.8%) | 0 (0.0%) |
| $50,000 to $74,999 | 2 (7.4%) | 0 (0.0%) |
| $75,000 to $99,999 | 0 (0.0%) | 0 (0.0%) |
| $100,000 to $149,999 | 2 (7.4%) | 0 (0.0%) |
| $150,000 or more | 0 (0.0%) | 0 (0.0%) |
| Total | 27 (100.0%) | 3 (100.0%) |
Monthly Housing Cost Tiers in Tselakai Dezza
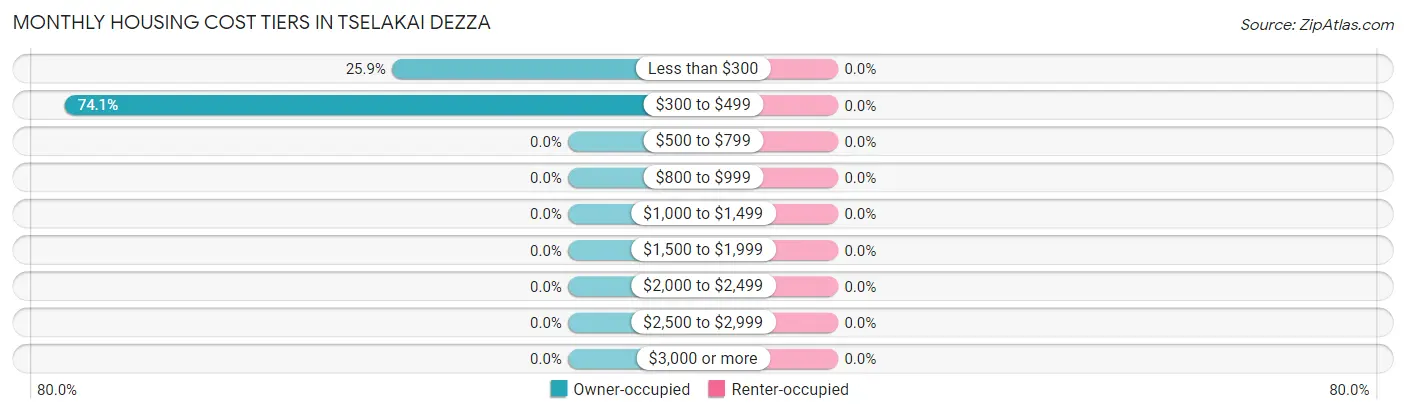
| Monthly Cost | Owner-occupied | Renter-occupied |
| Less than $300 | 7 (25.9%) | 0 (0.0%) |
| $300 to $499 | 20 (74.1%) | 0 (0.0%) |
| $500 to $799 | 0 (0.0%) | 0 (0.0%) |
| $800 to $999 | 0 (0.0%) | 0 (0.0%) |
| $1,000 to $1,499 | 0 (0.0%) | 0 (0.0%) |
| $1,500 to $1,999 | 0 (0.0%) | 0 (0.0%) |
| $2,000 to $2,499 | 0 (0.0%) | 0 (0.0%) |
| $2,500 to $2,999 | 0 (0.0%) | 0 (0.0%) |
| $3,000 or more | 0 (0.0%) | 0 (0.0%) |
| Total | 27 (100.0%) | 3 (100.0%) |
Physical Housing Characteristics in Tselakai Dezza
Housing Structures in Tselakai Dezza
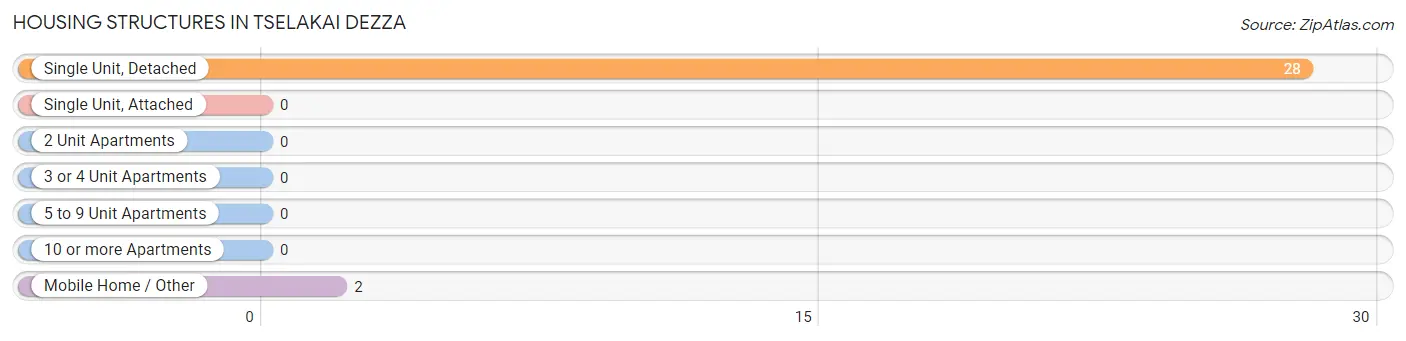
| Structure Type | # Housing Units | % Housing Units |
| Single Unit, Detached | 28 | 93.3% |
| Single Unit, Attached | 0 | 0.0% |
| 2 Unit Apartments | 0 | 0.0% |
| 3 or 4 Unit Apartments | 0 | 0.0% |
| 5 to 9 Unit Apartments | 0 | 0.0% |
| 10 or more Apartments | 0 | 0.0% |
| Mobile Home / Other | 2 | 6.7% |
| Total | 30 | 100.0% |
Housing Structures by Occupancy in Tselakai Dezza
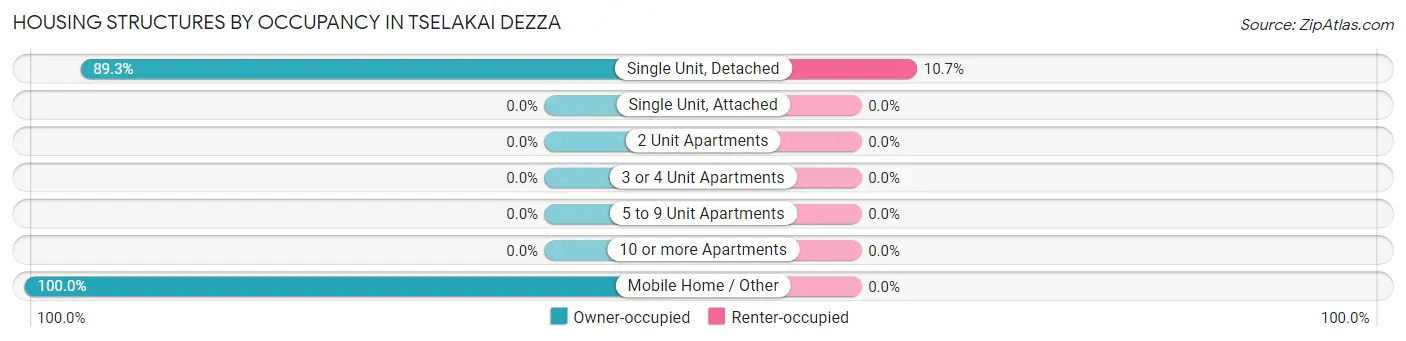
| Structure Type | Owner-occupied | Renter-occupied |
| Single Unit, Detached | 25 (89.3%) | 3 (10.7%) |
| Single Unit, Attached | 0 (0.0%) | 0 (0.0%) |
| 2 Unit Apartments | 0 (0.0%) | 0 (0.0%) |
| 3 or 4 Unit Apartments | 0 (0.0%) | 0 (0.0%) |
| 5 to 9 Unit Apartments | 0 (0.0%) | 0 (0.0%) |
| 10 or more Apartments | 0 (0.0%) | 0 (0.0%) |
| Mobile Home / Other | 2 (100.0%) | 0 (0.0%) |
| Total | 27 (90.0%) | 3 (10.0%) |
Housing Structures by Number of Rooms in Tselakai Dezza
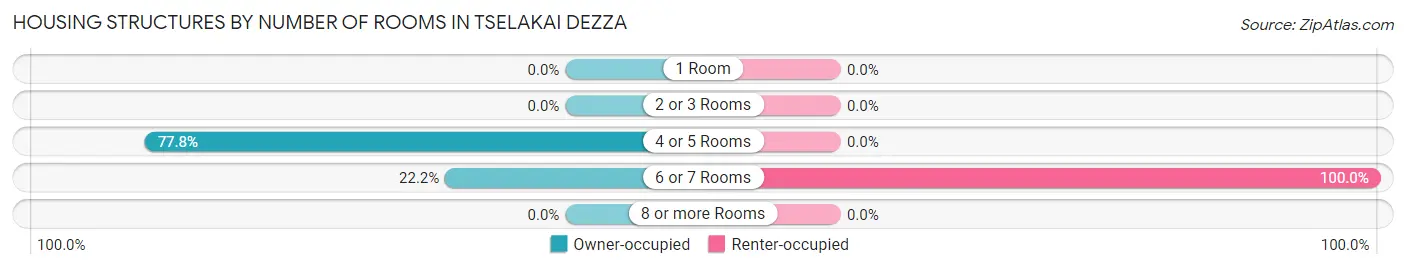
| Number of Rooms | Owner-occupied | Renter-occupied |
| 1 Room | 0 (0.0%) | 0 (0.0%) |
| 2 or 3 Rooms | 0 (0.0%) | 0 (0.0%) |
| 4 or 5 Rooms | 21 (77.8%) | 0 (0.0%) |
| 6 or 7 Rooms | 6 (22.2%) | 3 (100.0%) |
| 8 or more Rooms | 0 (0.0%) | 0 (0.0%) |
| Total | 27 (100.0%) | 3 (100.0%) |
Housing Structure by Heating Type in Tselakai Dezza
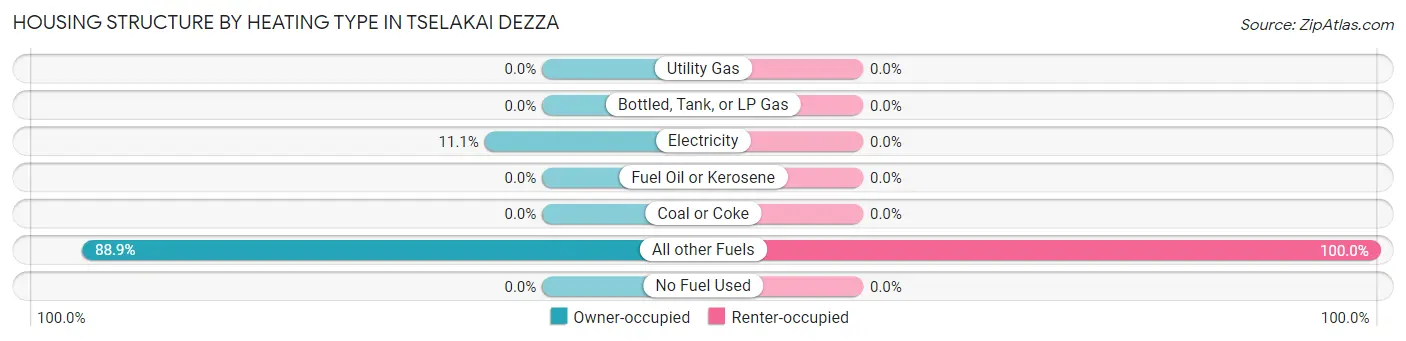
| Heating Type | Owner-occupied | Renter-occupied |
| Utility Gas | 0 (0.0%) | 0 (0.0%) |
| Bottled, Tank, or LP Gas | 0 (0.0%) | 0 (0.0%) |
| Electricity | 3 (11.1%) | 0 (0.0%) |
| Fuel Oil or Kerosene | 0 (0.0%) | 0 (0.0%) |
| Coal or Coke | 0 (0.0%) | 0 (0.0%) |
| All other Fuels | 24 (88.9%) | 3 (100.0%) |
| No Fuel Used | 0 (0.0%) | 0 (0.0%) |
| Total | 27 (100.0%) | 3 (100.0%) |
Household Vehicle Usage in Tselakai Dezza
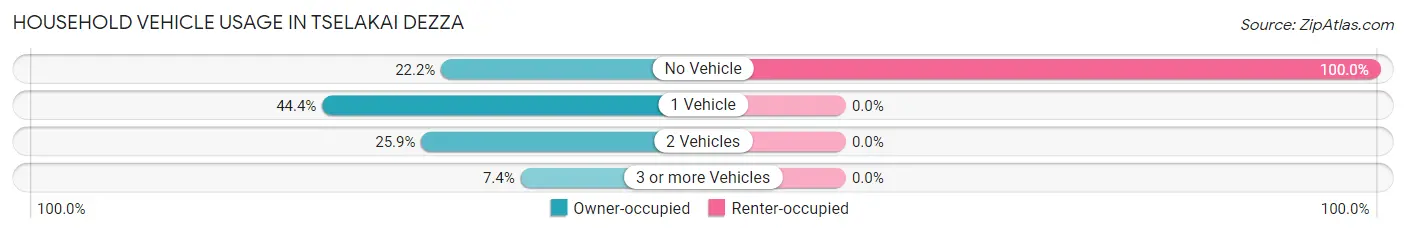
| Vehicles per Household | Owner-occupied | Renter-occupied |
| No Vehicle | 6 (22.2%) | 3 (100.0%) |
| 1 Vehicle | 12 (44.4%) | 0 (0.0%) |
| 2 Vehicles | 7 (25.9%) | 0 (0.0%) |
| 3 or more Vehicles | 2 (7.4%) | 0 (0.0%) |
| Total | 27 (100.0%) | 3 (100.0%) |
Real Estate & Mortgages in Tselakai Dezza
Real Estate and Mortgage Overview in Tselakai Dezza
| Characteristic | Without Mortgage | With Mortgage |
| Housing Units | 27 | 0 |
| Median Property Value | $60,800 | $0 |
| Median Household Income | $30,938 | $0 |
| Monthly Housing Costs | $386 | $0 |
| Real Estate Taxes | - | - |
Property Value by Mortgage Status in Tselakai Dezza
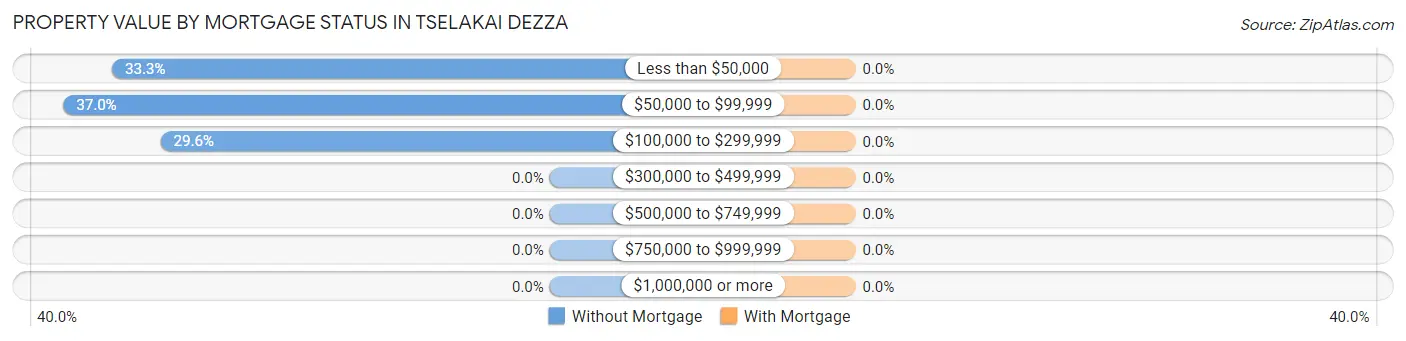
| Property Value | Without Mortgage | With Mortgage |
| Less than $50,000 | 9 (33.3%) | 0 (0.0%) |
| $50,000 to $99,999 | 10 (37.0%) | 0 (0.0%) |
| $100,000 to $299,999 | 8 (29.6%) | 0 (0.0%) |
| $300,000 to $499,999 | 0 (0.0%) | 0 (0.0%) |
| $500,000 to $749,999 | 0 (0.0%) | 0 (0.0%) |
| $750,000 to $999,999 | 0 (0.0%) | 0 (0.0%) |
| $1,000,000 or more | 0 (0.0%) | 0 (0.0%) |
| Total | 27 (100.0%) | 0 (0.0%) |
Household Income by Mortgage Status in Tselakai Dezza
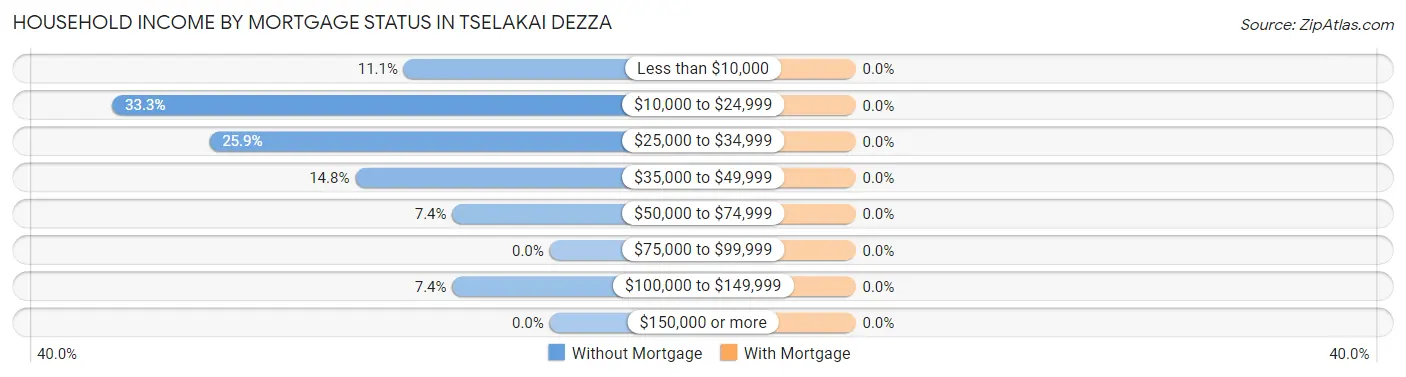
| Household Income | Without Mortgage | With Mortgage |
| Less than $10,000 | 3 (11.1%) | 0 (0.0%) |
| $10,000 to $24,999 | 9 (33.3%) | 0 (0.0%) |
| $25,000 to $34,999 | 7 (25.9%) | 0 (0.0%) |
| $35,000 to $49,999 | 4 (14.8%) | 0 (0.0%) |
| $50,000 to $74,999 | 2 (7.4%) | 0 (0.0%) |
| $75,000 to $99,999 | 0 (0.0%) | 0 (0.0%) |
| $100,000 to $149,999 | 2 (7.4%) | 0 (0.0%) |
| $150,000 or more | 0 (0.0%) | 0 (0.0%) |
| Total | 27 (100.0%) | 0 (0.0%) |
Property Value to Household Income Ratio in Tselakai Dezza
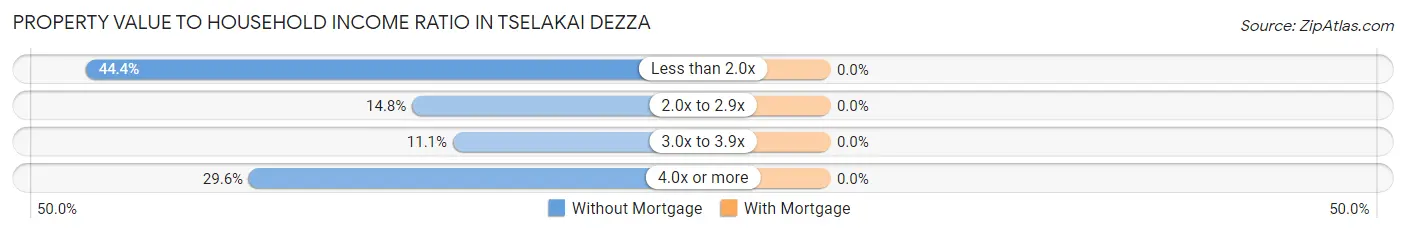
| Value-to-Income Ratio | Without Mortgage | With Mortgage |
| Less than 2.0x | 12 (44.4%) | 0 (0.0%) |
| 2.0x to 2.9x | 4 (14.8%) | 0 (0.0%) |
| 3.0x to 3.9x | 3 (11.1%) | 0 (0.0%) |
| 4.0x or more | 8 (29.6%) | 0 (0.0%) |
| Total | 27 (100.0%) | 0 (0.0%) |
Real Estate Taxes by Mortgage Status in Tselakai Dezza
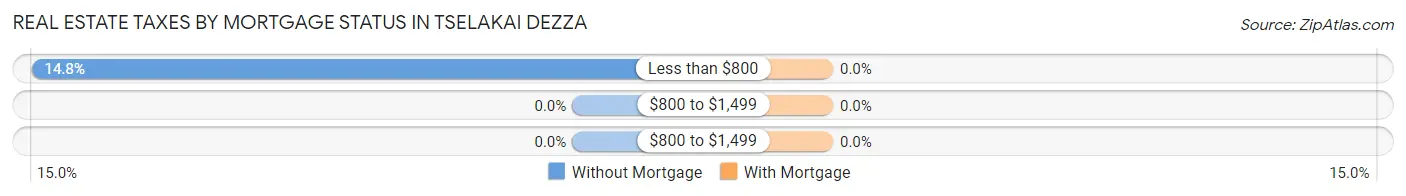
| Property Taxes | Without Mortgage | With Mortgage |
| Less than $800 | 4 (14.8%) | 0 (0.0%) |
| $800 to $1,499 | 0 (0.0%) | 0 (0.0%) |
| $800 to $1,499 | 0 (0.0%) | 0 (0.0%) |
| Total | 27 (100.0%) | 0 (0.0%) |
Health & Disability in Tselakai Dezza
Health Insurance Coverage by Age in Tselakai Dezza
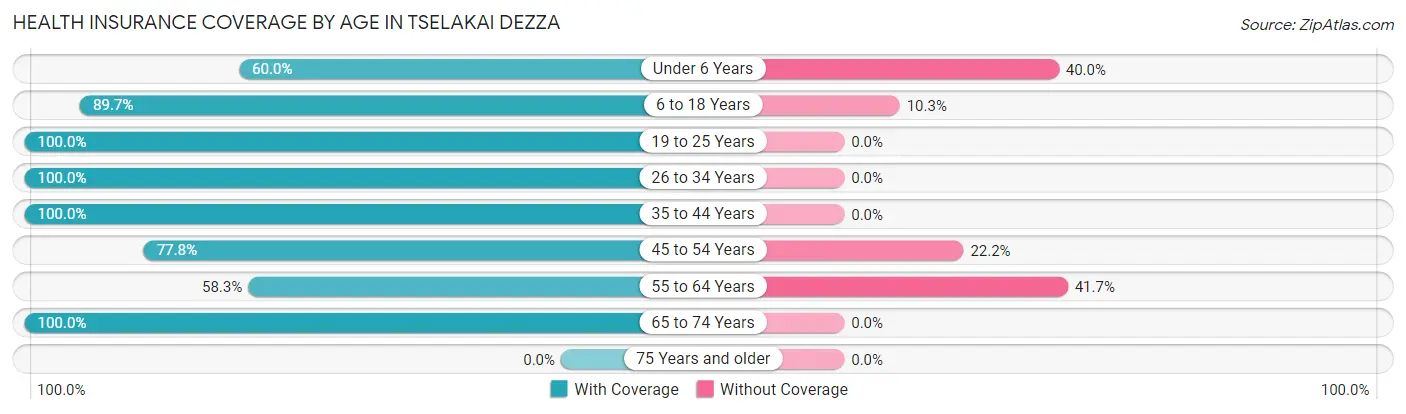
| Age Bracket | With Coverage | Without Coverage |
| Under 6 Years | 3 (60.0%) | 2 (40.0%) |
| 6 to 18 Years | 26 (89.7%) | 3 (10.3%) |
| 19 to 25 Years | 5 (100.0%) | 0 (0.0%) |
| 26 to 34 Years | 2 (100.0%) | 0 (0.0%) |
| 35 to 44 Years | 7 (100.0%) | 0 (0.0%) |
| 45 to 54 Years | 7 (77.8%) | 2 (22.2%) |
| 55 to 64 Years | 14 (58.3%) | 10 (41.7%) |
| 65 to 74 Years | 8 (100.0%) | 0 (0.0%) |
| 75 Years and older | 0 (0.0%) | 0 (0.0%) |
| Total | 72 (80.9%) | 17 (19.1%) |
Health Insurance Coverage by Citizenship Status in Tselakai Dezza
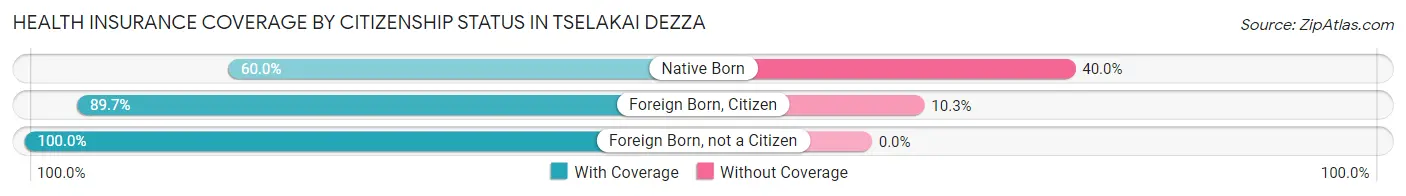
| Citizenship Status | With Coverage | Without Coverage |
| Native Born | 3 (60.0%) | 2 (40.0%) |
| Foreign Born, Citizen | 26 (89.7%) | 3 (10.3%) |
| Foreign Born, not a Citizen | 5 (100.0%) | 0 (0.0%) |
Health Insurance Coverage by Household Income in Tselakai Dezza
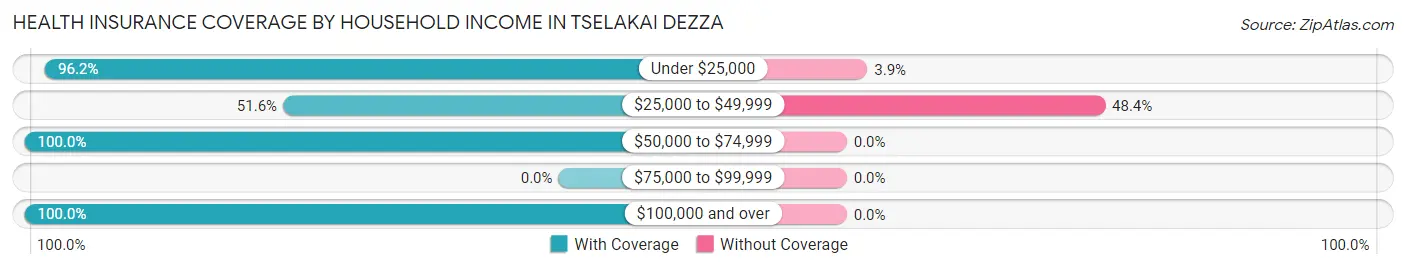
| Household Income | With Coverage | Without Coverage |
| Under $25,000 | 50 (96.2%) | 2 (3.8%) |
| $25,000 to $49,999 | 16 (51.6%) | 15 (48.4%) |
| $50,000 to $74,999 | 2 (100.0%) | 0 (0.0%) |
| $75,000 to $99,999 | 0 (0.0%) | 0 (0.0%) |
| $100,000 and over | 4 (100.0%) | 0 (0.0%) |
Public vs Private Health Insurance Coverage by Age in Tselakai Dezza
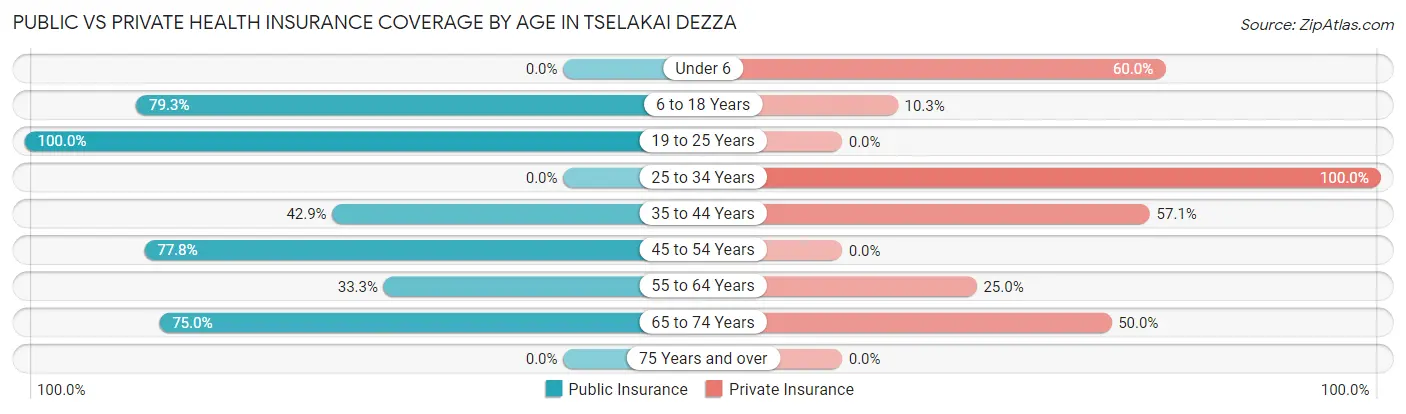
| Age Bracket | Public Insurance | Private Insurance |
| Under 6 | 0 (0.0%) | 3 (60.0%) |
| 6 to 18 Years | 23 (79.3%) | 3 (10.3%) |
| 19 to 25 Years | 5 (100.0%) | 0 (0.0%) |
| 25 to 34 Years | 0 (0.0%) | 2 (100.0%) |
| 35 to 44 Years | 3 (42.9%) | 4 (57.1%) |
| 45 to 54 Years | 7 (77.8%) | 0 (0.0%) |
| 55 to 64 Years | 8 (33.3%) | 6 (25.0%) |
| 65 to 74 Years | 6 (75.0%) | 4 (50.0%) |
| 75 Years and over | 0 (0.0%) | 0 (0.0%) |
| Total | 52 (58.4%) | 22 (24.7%) |
Disability Status by Sex by Age in Tselakai Dezza
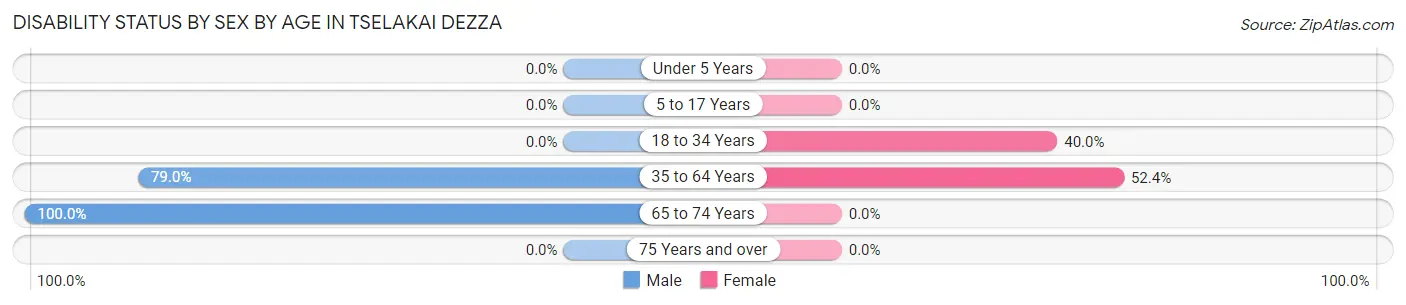
| Age Bracket | Male | Female |
| Under 5 Years | 0 (0.0%) | 0 (0.0%) |
| 5 to 17 Years | 0 (0.0%) | 0 (0.0%) |
| 18 to 34 Years | 0 (0.0%) | 2 (40.0%) |
| 35 to 64 Years | 15 (78.9%) | 11 (52.4%) |
| 65 to 74 Years | 2 (100.0%) | 0 (0.0%) |
| 75 Years and over | 0 (0.0%) | 0 (0.0%) |
Disability Class by Sex by Age in Tselakai Dezza
Disability Class: Hearing Difficulty
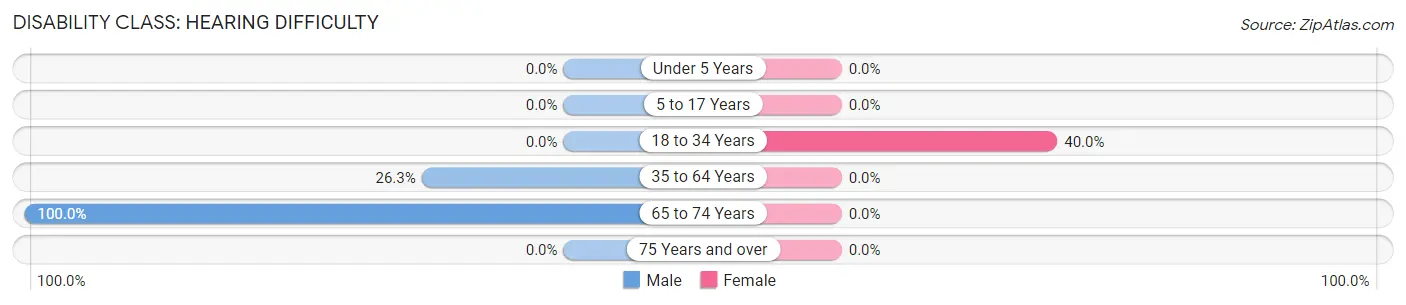
| Age Bracket | Male | Female |
| Under 5 Years | 0 (0.0%) | 0 (0.0%) |
| 5 to 17 Years | 0 (0.0%) | 0 (0.0%) |
| 18 to 34 Years | 0 (0.0%) | 2 (40.0%) |
| 35 to 64 Years | 5 (26.3%) | 0 (0.0%) |
| 65 to 74 Years | 2 (100.0%) | 0 (0.0%) |
| 75 Years and over | 0 (0.0%) | 0 (0.0%) |
Disability Class: Vision Difficulty
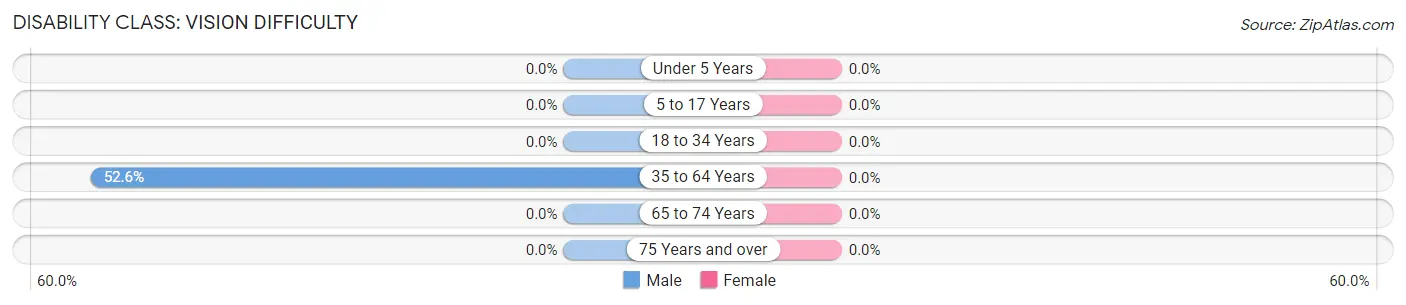
| Age Bracket | Male | Female |
| Under 5 Years | 0 (0.0%) | 0 (0.0%) |
| 5 to 17 Years | 0 (0.0%) | 0 (0.0%) |
| 18 to 34 Years | 0 (0.0%) | 0 (0.0%) |
| 35 to 64 Years | 10 (52.6%) | 0 (0.0%) |
| 65 to 74 Years | 0 (0.0%) | 0 (0.0%) |
| 75 Years and over | 0 (0.0%) | 0 (0.0%) |
Disability Class: Cognitive Difficulty
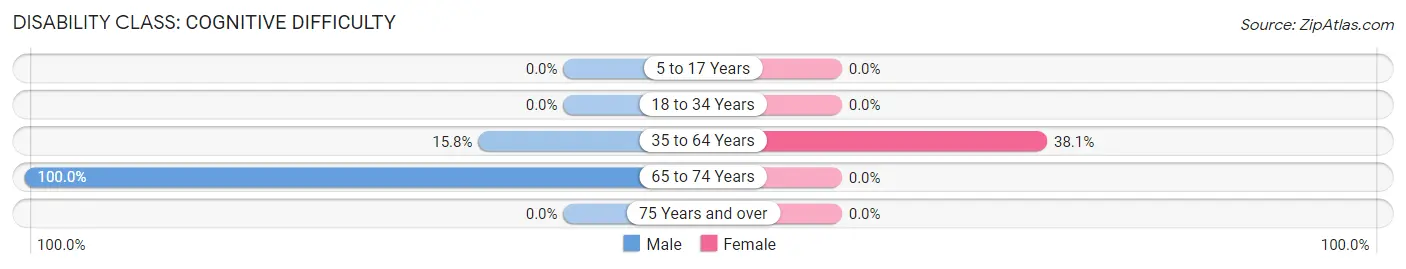
| Age Bracket | Male | Female |
| 5 to 17 Years | 0 (0.0%) | 0 (0.0%) |
| 18 to 34 Years | 0 (0.0%) | 0 (0.0%) |
| 35 to 64 Years | 3 (15.8%) | 8 (38.1%) |
| 65 to 74 Years | 2 (100.0%) | 0 (0.0%) |
| 75 Years and over | 0 (0.0%) | 0 (0.0%) |
Disability Class: Ambulatory Difficulty
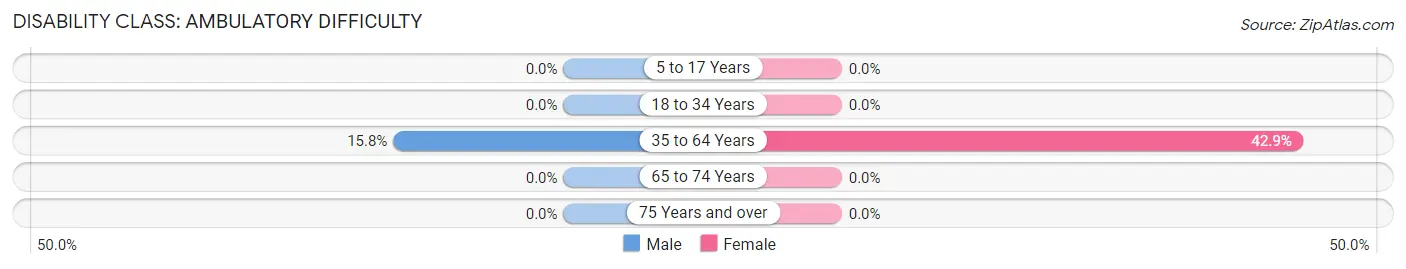
| Age Bracket | Male | Female |
| 5 to 17 Years | 0 (0.0%) | 0 (0.0%) |
| 18 to 34 Years | 0 (0.0%) | 0 (0.0%) |
| 35 to 64 Years | 3 (15.8%) | 9 (42.9%) |
| 65 to 74 Years | 0 (0.0%) | 0 (0.0%) |
| 75 Years and over | 0 (0.0%) | 0 (0.0%) |
Disability Class: Self-Care Difficulty
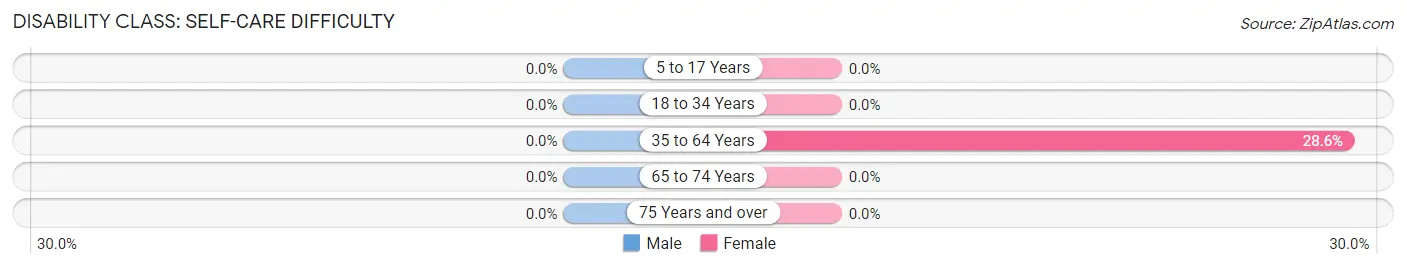
| Age Bracket | Male | Female |
| 5 to 17 Years | 0 (0.0%) | 0 (0.0%) |
| 18 to 34 Years | 0 (0.0%) | 0 (0.0%) |
| 35 to 64 Years | 0 (0.0%) | 6 (28.6%) |
| 65 to 74 Years | 0 (0.0%) | 0 (0.0%) |
| 75 Years and over | 0 (0.0%) | 0 (0.0%) |
Technology Access in Tselakai Dezza
Computing Device Access in Tselakai Dezza
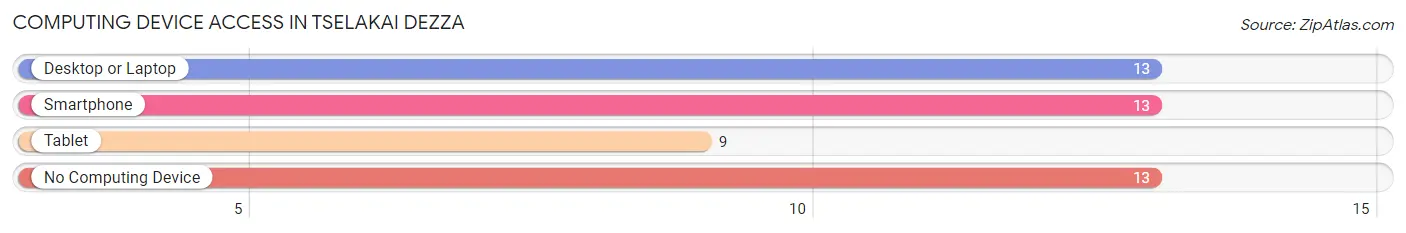
| Device Type | # Households | % Households |
| Desktop or Laptop | 13 | 43.3% |
| Smartphone | 13 | 43.3% |
| Tablet | 9 | 30.0% |
| No Computing Device | 13 | 43.3% |
| Total | 30 | 100.0% |
Internet Access in Tselakai Dezza
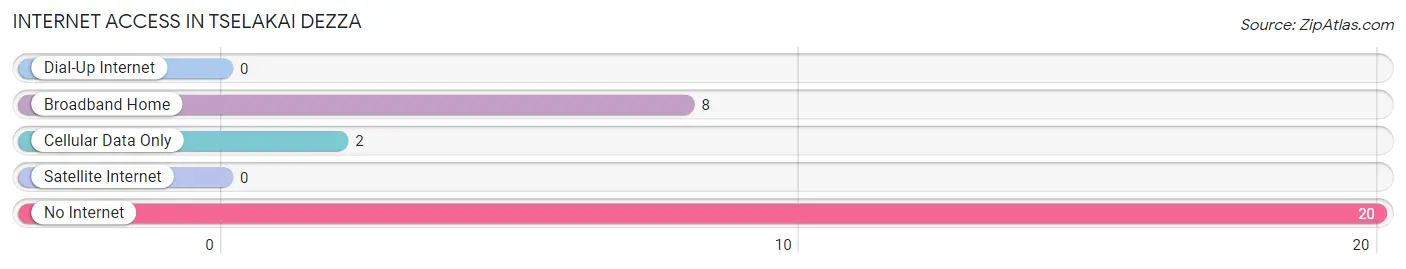
| Internet Type | # Households | % Households |
| Dial-Up Internet | 0 | 0.0% |
| Broadband Home | 8 | 26.7% |
| Cellular Data Only | 2 | 6.7% |
| Satellite Internet | 0 | 0.0% |
| No Internet | 20 | 66.7% |
| Total | 30 | 100.0% |
Tselakai Dezza Summary
The state of Utah is located in the western United States and is bordered by Idaho, Wyoming, Colorado, Arizona, and Nevada. It is the 13th largest state in the United States and the 11th most populous. Utah is known for its diverse geography, ranging from the Great Salt Lake in the north to the red rock canyons of the south. It is also home to the highest point in the contiguous United States, Kings Peak, which stands at 13,534 feet.
The history of Utah dates back to the early 19th century when the first Mormon settlers arrived in the area. The Mormons were led by Brigham Young, who established Salt Lake City as the capital of the Utah Territory in 1847. The area was officially admitted to the Union as the 45th state in 1896.
The economy of Utah is largely based on the service industry, with tourism being a major contributor. The state is also home to a number of technology companies, including Adobe, eBay, and Oracle. The state is also home to a number of natural resources, including coal, copper, and oil.
The population of Utah in 2000 was 2,233,169, making it the 11th most populous state in the United States. The population was spread out with a median age of 28.7 years. The racial makeup of the state was 91.2% White, 2.2% African American, 1.2% Native American, 1.7% Asian, 0.2% Pacific Islander, 2.7% from other races, and 1.8% from two or more races. The largest religious group in the state was the Church of Jesus Christ of Latter-day Saints, which accounted for 68.3% of the population.
The median household income in 2000 was $45,737, and the median family income was $54,945. The per capita income was $20,845. The unemployment rate in 2000 was 3.2%.
In conclusion, Utah is a state with a rich history and diverse geography. It is home to a variety of industries, including technology, tourism, and natural resources. The population of the state in 2000 was 2,233,169, with a median age of 28.7 years. The median household income was $45,737, and the median family income was $54,945. The unemployment rate in 2000 was 3.2%.
Common Questions
What is Per Capita Income in Tselakai Dezza?
Per Capita income in Tselakai Dezza is $10,798.
What is the Median Family Income in Tselakai Dezza?
Median Family Income in Tselakai Dezza is $23,750.
What is the Median Household income in Tselakai Dezza?
Median Household Income in Tselakai Dezza is $27,500.
What is Inequality or Gini Index in Tselakai Dezza?
Inequality or Gini Index in Tselakai Dezza is 0.39.
What is the Total Population of Tselakai Dezza?
Total Population of Tselakai Dezza is 89.
What is the Total Male Population of Tselakai Dezza?
Total Male Population of Tselakai Dezza is 38.
What is the Total Female Population of Tselakai Dezza?
Total Female Population of Tselakai Dezza is 51.
What is the Ratio of Males per 100 Females in Tselakai Dezza?
There are 74.51 Males per 100 Females in Tselakai Dezza.
What is the Ratio of Females per 100 Males in Tselakai Dezza?
There are 134.21 Females per 100 Males in Tselakai Dezza.
What is the Median Population Age in Tselakai Dezza?
Median Population Age in Tselakai Dezza is 43.1 Years.
What is the Average Family Size in Tselakai Dezza
Average Family Size in Tselakai Dezza is 3.9 People.
What is the Average Household Size in Tselakai Dezza
Average Household Size in Tselakai Dezza is 3.0 People.
How Large is the Labor Force in Tselakai Dezza?
There are 23 People in the Labor Forcein in Tselakai Dezza.
What is the Percentage of People in the Labor Force in Tselakai Dezza?
39.0% of People are in the Labor Force in Tselakai Dezza.
What is the Unemployment Rate in Tselakai Dezza?
Unemployment Rate in Tselakai Dezza is 17.4%.