Monroe, OK Map & Demographics
Monroe Map
Monroe Overview
$14,245
PER CAPITA INCOME
$39,063
AVG FAMILY INCOME
$33,750
AVG HOUSEHOLD INCOME
0.47
INEQUALITY / GINI INDEX
132
TOTAL POPULATION
72
MALE POPULATION
60
FEMALE POPULATION
120.00
MALES / 100 FEMALES
83.33
FEMALES / 100 MALES
21.9
MEDIAN AGE
4.0
AVG FAMILY SIZE
3.3
AVG HOUSEHOLD SIZE
41
LABOR FORCE [ PEOPLE ]
45.6%
PERCENT IN LABOR FORCE
46.3%
UNEMPLOYMENT RATE
Monroe Zip Codes
Monroe Area Codes
Income in Monroe
Income Overview in Monroe
Per Capita Income in Monroe is $14,245, while median incomes of families and households are $39,063 and $33,750 respectively.
| Characteristic | Number | Measure |
| Per Capita Income | 132 | $14,245 |
| Median Family Income | 31 | $39,063 |
| Mean Family Income | 31 | $48,855 |
| Median Household Income | 40 | $33,750 |
| Mean Household Income | 40 | $41,170 |
| Income Deficit | 31 | $0 |
| Wage / Income Gap (%) | 132 | 0.00% |
| Wage / Income Gap ($) | 132 | 100.00¢ per $1 |
| Gini / Inequality Index | 132 | 0.47 |
Earnings by Sex in Monroe
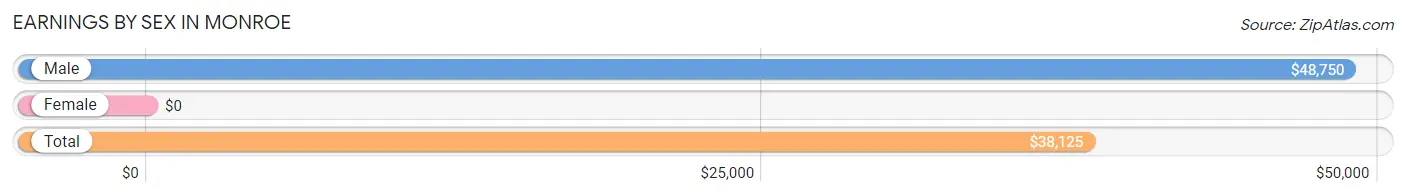
| Sex | Number | Average Earnings |
| Male | 20 (76.9%) | $48,750 |
| Female | 6 (23.1%) | $0 |
| Total | 26 (100.0%) | $38,125 |
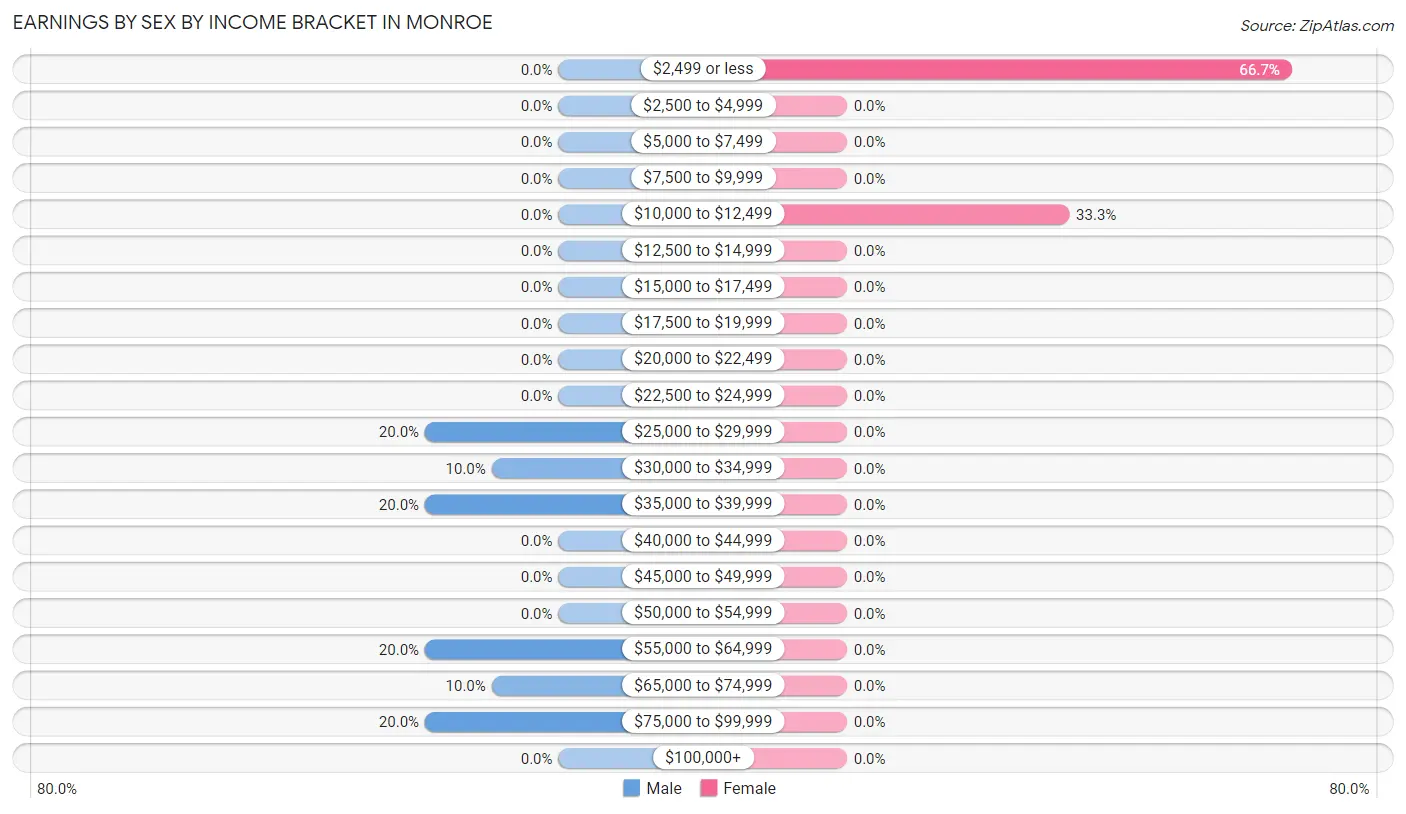
Earnings by Sex by Income Bracket in Monroe
The most common earnings brackets in Monroe are $25,000 to $29,999 for men (4 | 20.0%) and $2,499 or less for women (4 | 66.7%).
| Income | Male | Female |
| $2,499 or less | 0 (0.0%) | 4 (66.7%) |
| $2,500 to $4,999 | 0 (0.0%) | 0 (0.0%) |
| $5,000 to $7,499 | 0 (0.0%) | 0 (0.0%) |
| $7,500 to $9,999 | 0 (0.0%) | 0 (0.0%) |
| $10,000 to $12,499 | 0 (0.0%) | 2 (33.3%) |
| $12,500 to $14,999 | 0 (0.0%) | 0 (0.0%) |
| $15,000 to $17,499 | 0 (0.0%) | 0 (0.0%) |
| $17,500 to $19,999 | 0 (0.0%) | 0 (0.0%) |
| $20,000 to $22,499 | 0 (0.0%) | 0 (0.0%) |
| $22,500 to $24,999 | 0 (0.0%) | 0 (0.0%) |
| $25,000 to $29,999 | 4 (20.0%) | 0 (0.0%) |
| $30,000 to $34,999 | 2 (10.0%) | 0 (0.0%) |
| $35,000 to $39,999 | 4 (20.0%) | 0 (0.0%) |
| $40,000 to $44,999 | 0 (0.0%) | 0 (0.0%) |
| $45,000 to $49,999 | 0 (0.0%) | 0 (0.0%) |
| $50,000 to $54,999 | 0 (0.0%) | 0 (0.0%) |
| $55,000 to $64,999 | 4 (20.0%) | 0 (0.0%) |
| $65,000 to $74,999 | 2 (10.0%) | 0 (0.0%) |
| $75,000 to $99,999 | 4 (20.0%) | 0 (0.0%) |
| $100,000+ | 0 (0.0%) | 0 (0.0%) |
| Total | 20 (100.0%) | 6 (100.0%) |
Earnings by Sex by Educational Attainment in Monroe
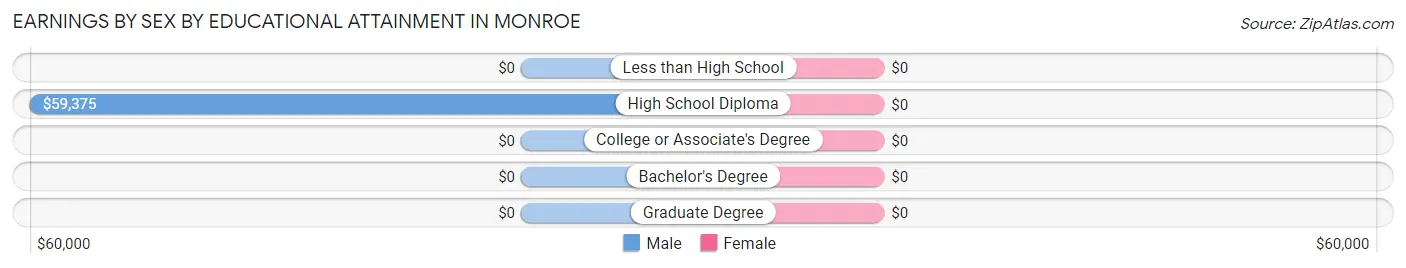
| Educational Attainment | Male Income | Female Income |
| Less than High School | - | - |
| High School Diploma | $59,375 | $0 |
| College or Associate's Degree | - | - |
| Bachelor's Degree | - | - |
| Graduate Degree | - | - |
| Total | $58,750 | $0 |
Family Income in Monroe
Family Income Brackets in Monroe
According to the Monroe family income data, there are 8 families falling into the $75,000 to $99,999 income range, which is the most common income bracket and makes up 25.8% of all families.
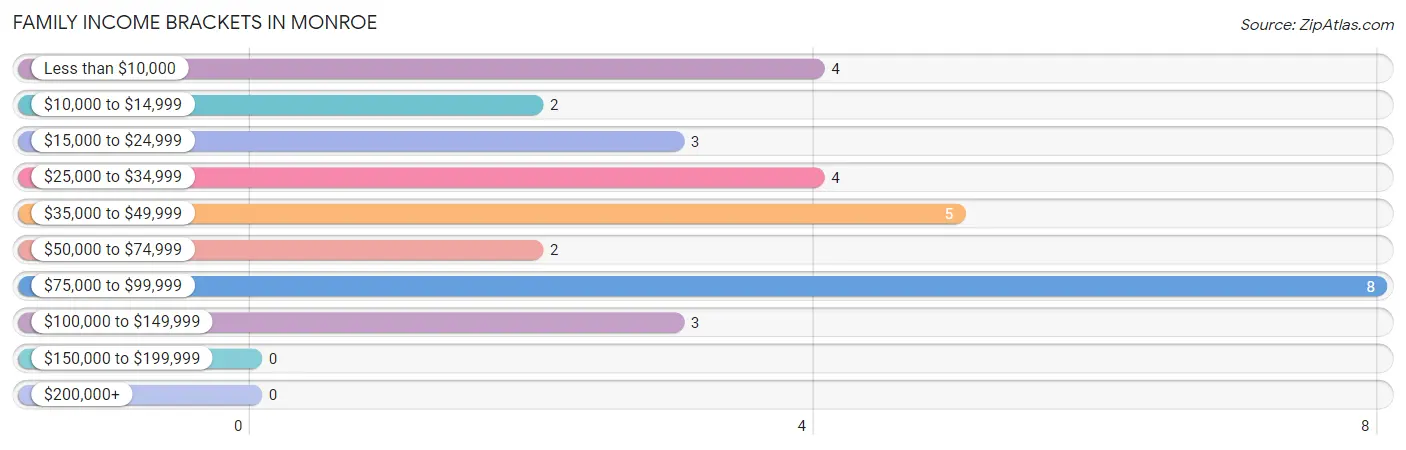
| Income Bracket | # Families | % Families |
| Less than $10,000 | 4 | 12.9% |
| $10,000 to $14,999 | 2 | 6.5% |
| $15,000 to $24,999 | 3 | 9.7% |
| $25,000 to $34,999 | 4 | 12.9% |
| $35,000 to $49,999 | 5 | 16.1% |
| $50,000 to $74,999 | 2 | 6.5% |
| $75,000 to $99,999 | 8 | 25.8% |
| $100,000 to $149,999 | 3 | 9.7% |
| $150,000 to $199,999 | 0 | 0.0% |
| $200,000+ | 0 | 0.0% |
Family Income by Famaliy Size in Monroe
2-person families (11 | 35.5%) account for the highest median family income in Monroe with $76,250 per family, while 2-person families (11 | 35.5%) have the highest median income of $38,125 per family member.
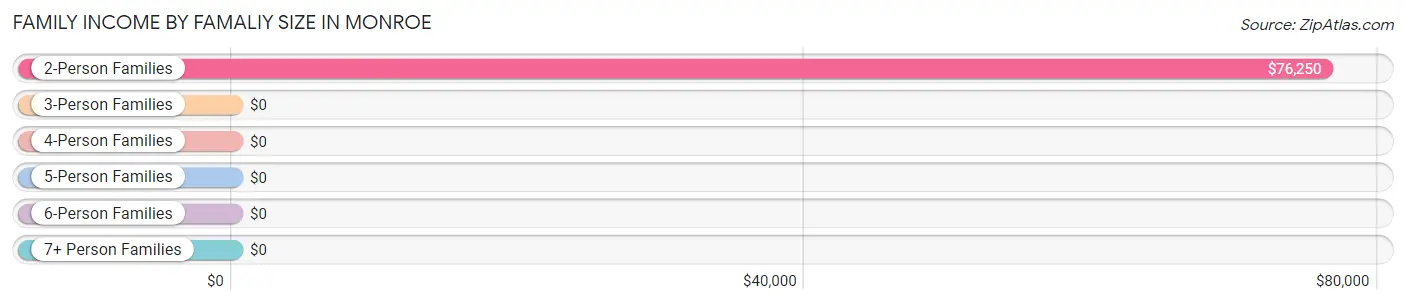
| Income Bracket | # Families | Median Income |
| 2-Person Families | 11 (35.5%) | $76,250 |
| 3-Person Families | 11 (35.5%) | $0 |
| 4-Person Families | 2 (6.5%) | $0 |
| 5-Person Families | 3 (9.7%) | $0 |
| 6-Person Families | 0 (0.0%) | $0 |
| 7+ Person Families | 4 (12.9%) | $0 |
| Total | 31 (100.0%) | $39,063 |
Family Income by Number of Earners in Monroe
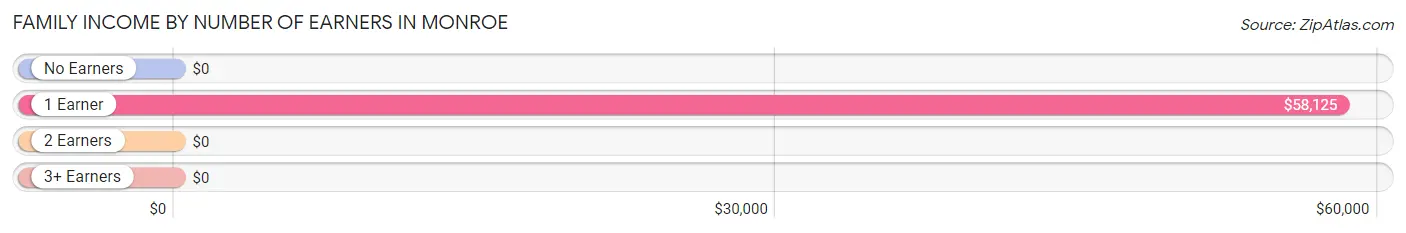
| Number of Earners | # Families | Median Income |
| No Earners | 14 (45.2%) | $0 |
| 1 Earner | 13 (41.9%) | $58,125 |
| 2 Earners | 4 (12.9%) | $0 |
| 3+ Earners | 0 (0.0%) | $0 |
| Total | 31 (100.0%) | $39,063 |
Household Income in Monroe
Household Income Brackets in Monroe
With 11 households falling in the category, the less than $10,000 income range is the most frequent in Monroe, accounting for 27.5% of all households.
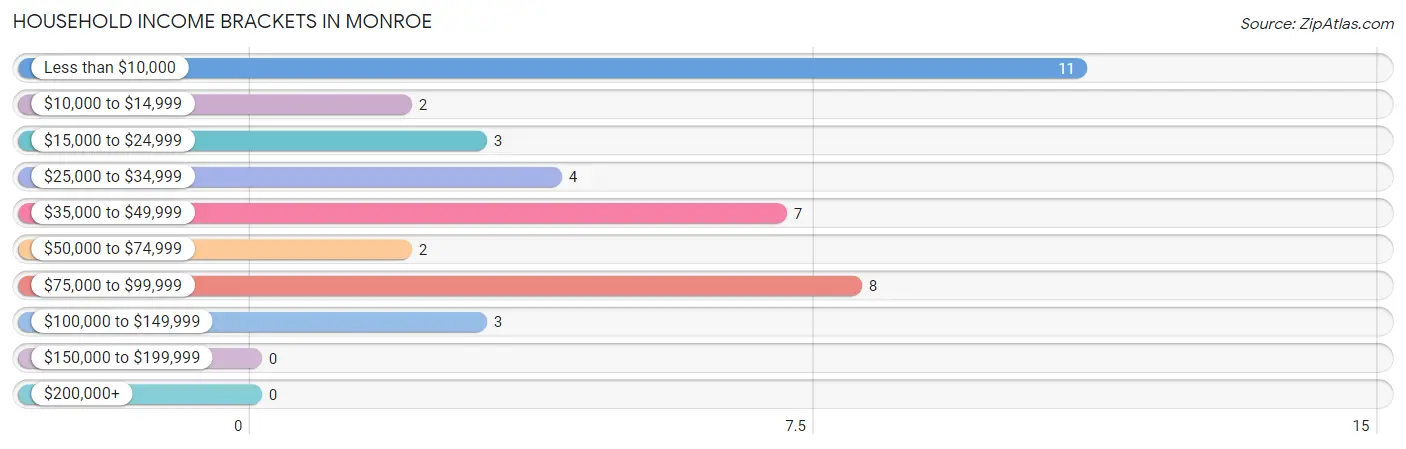
| Income Bracket | # Households | % Households |
| Less than $10,000 | 11 | 27.5% |
| $10,000 to $14,999 | 2 | 5.0% |
| $15,000 to $24,999 | 3 | 7.5% |
| $25,000 to $34,999 | 4 | 10.0% |
| $35,000 to $49,999 | 7 | 17.5% |
| $50,000 to $74,999 | 2 | 5.0% |
| $75,000 to $99,999 | 8 | 20.0% |
| $100,000 to $149,999 | 3 | 7.5% |
| $150,000 to $199,999 | 0 | 0.0% |
| $200,000+ | 0 | 0.0% |
Household Income by Householder Age in Monroe
The median household income in Monroe is $33,750, with the highest median household income of $38,750 found in the 45 to 64 years age bracket for the primary householder. A total of 12 households (30.0%) fall into this category. Meanwhile, the 15 to 24 years age bracket for the primary householder has the lowest median household income of $0, with 11 households (27.5%) in this group.
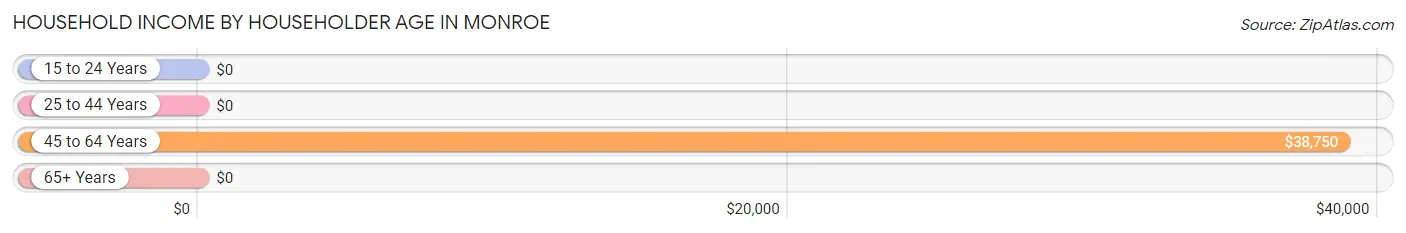
| Income Bracket | # Households | Median Income |
| 15 to 24 Years | 11 (27.5%) | $0 |
| 25 to 44 Years | 3 (7.5%) | $0 |
| 45 to 64 Years | 12 (30.0%) | $38,750 |
| 65+ Years | 14 (35.0%) | $0 |
| Total | 40 (100.0%) | $33,750 |
Poverty in Monroe
Income Below Poverty by Sex and Age in Monroe
With 45.8% poverty level for males and 60.0% for females among the residents of Monroe, 12 to 14 year old males and under 5 year old females are the most vulnerable to poverty, with 2 males (100.0%) and 9 females (100.0%) in their respective age groups living below the poverty level.
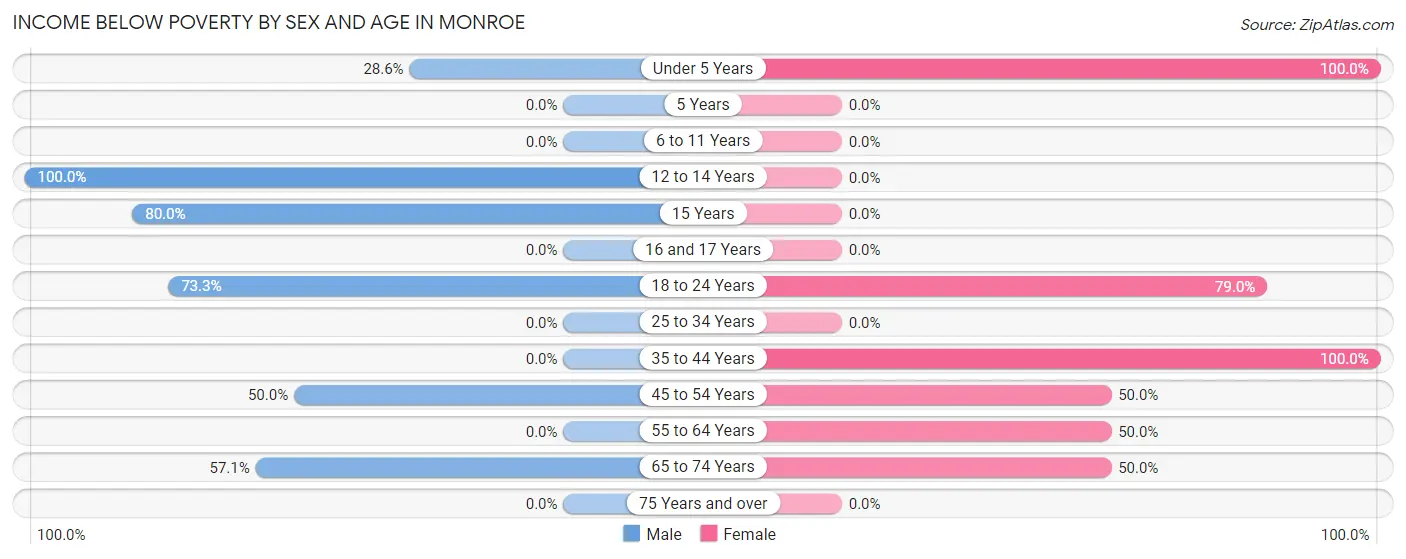
| Age Bracket | Male | Female |
| Under 5 Years | 4 (28.6%) | 9 (100.0%) |
| 5 Years | 0 (0.0%) | 0 (0.0%) |
| 6 to 11 Years | 0 (0.0%) | 0 (0.0%) |
| 12 to 14 Years | 2 (100.0%) | 0 (0.0%) |
| 15 Years | 8 (80.0%) | 0 (0.0%) |
| 16 and 17 Years | 0 (0.0%) | 0 (0.0%) |
| 18 to 24 Years | 11 (73.3%) | 15 (78.9%) |
| 25 to 34 Years | 0 (0.0%) | 0 (0.0%) |
| 35 to 44 Years | 0 (0.0%) | 4 (100.0%) |
| 45 to 54 Years | 4 (50.0%) | 2 (50.0%) |
| 55 to 64 Years | 0 (0.0%) | 3 (50.0%) |
| 65 to 74 Years | 4 (57.1%) | 3 (50.0%) |
| 75 Years and over | 0 (0.0%) | 0 (0.0%) |
| Total | 33 (45.8%) | 36 (60.0%) |
Income Above Poverty by Sex and Age in Monroe
According to the poverty statistics in Monroe, males aged 6 to 11 years and females aged 12 to 14 years are the age groups that are most secure financially, with 100.0% of males and 100.0% of females in these age groups living above the poverty line.
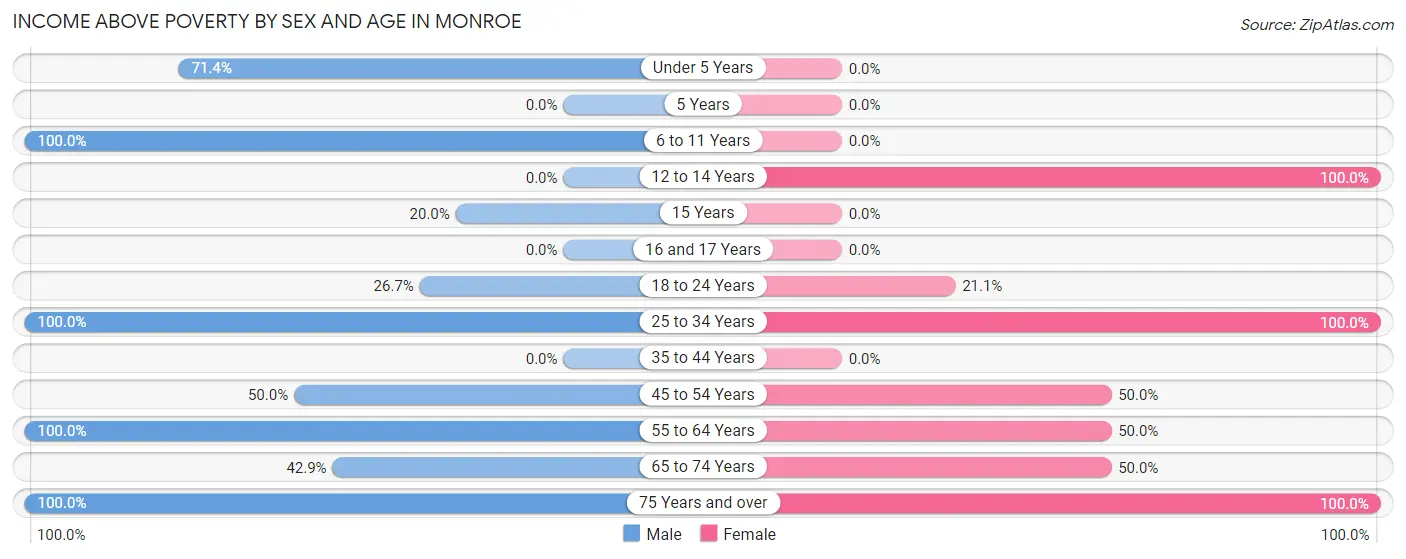
| Age Bracket | Male | Female |
| Under 5 Years | 10 (71.4%) | 0 (0.0%) |
| 5 Years | 0 (0.0%) | 0 (0.0%) |
| 6 to 11 Years | 4 (100.0%) | 0 (0.0%) |
| 12 to 14 Years | 0 (0.0%) | 3 (100.0%) |
| 15 Years | 2 (20.0%) | 0 (0.0%) |
| 16 and 17 Years | 0 (0.0%) | 0 (0.0%) |
| 18 to 24 Years | 4 (26.7%) | 4 (21.0%) |
| 25 to 34 Years | 4 (100.0%) | 3 (100.0%) |
| 35 to 44 Years | 0 (0.0%) | 0 (0.0%) |
| 45 to 54 Years | 4 (50.0%) | 2 (50.0%) |
| 55 to 64 Years | 4 (100.0%) | 3 (50.0%) |
| 65 to 74 Years | 3 (42.9%) | 3 (50.0%) |
| 75 Years and over | 4 (100.0%) | 6 (100.0%) |
| Total | 39 (54.2%) | 24 (40.0%) |
Income Below Poverty Among Married-Couple Families in Monroe
The poverty statistics for married-couple families in Monroe show that 28.0% or 7 of the total 25 families live below the poverty line. Families with 3 or 4 children have the highest poverty rate of 57.1%, comprising of 4 families. On the other hand, families with 1 or 2 children have the lowest poverty rate of 0.0%, which includes 0 families.
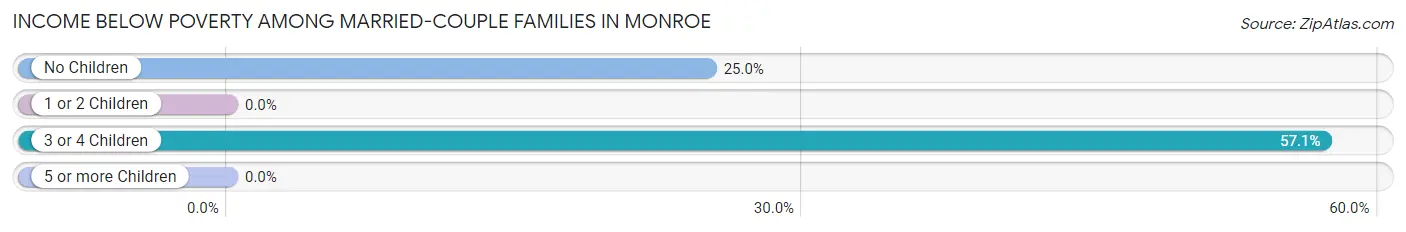
| Children | Above Poverty | Below Poverty |
| No Children | 9 (75.0%) | 3 (25.0%) |
| 1 or 2 Children | 6 (100.0%) | 0 (0.0%) |
| 3 or 4 Children | 3 (42.9%) | 4 (57.1%) |
| 5 or more Children | 0 (0.0%) | 0 (0.0%) |
| Total | 18 (72.0%) | 7 (28.0%) |
Income Below Poverty Among Single-Parent Households in Monroe
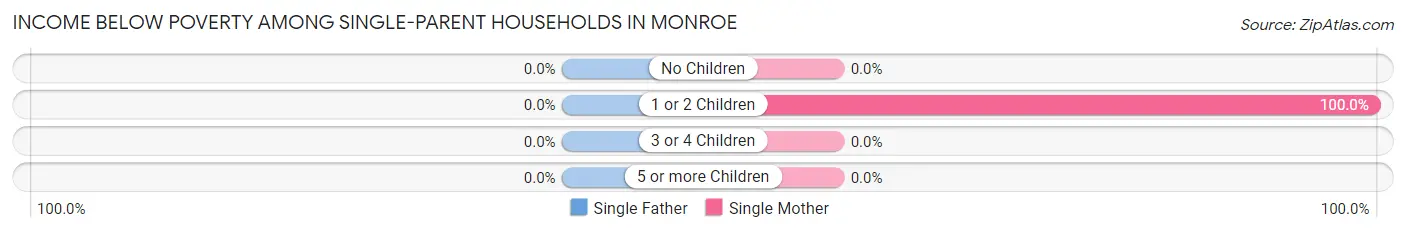
| Children | Single Father | Single Mother |
| No Children | 0 (0.0%) | 0 (0.0%) |
| 1 or 2 Children | 0 (0.0%) | 6 (100.0%) |
| 3 or 4 Children | 0 (0.0%) | 0 (0.0%) |
| 5 or more Children | 0 (0.0%) | 0 (0.0%) |
| Total | 0 (0.0%) | 6 (100.0%) |
Income Below Poverty Among Married-Couple vs Single-Parent Households in Monroe
The poverty data for Monroe shows that 7 of the married-couple family households (28.0%) and 6 of the single-parent households (100.0%) are living below the poverty level. Within the married-couple family households, those with 3 or 4 children have the highest poverty rate, with 4 households (57.1%) falling below the poverty line. Among the single-parent households, those with 1 or 2 children have the highest poverty rate, with 6 household (100.0%) living below poverty.
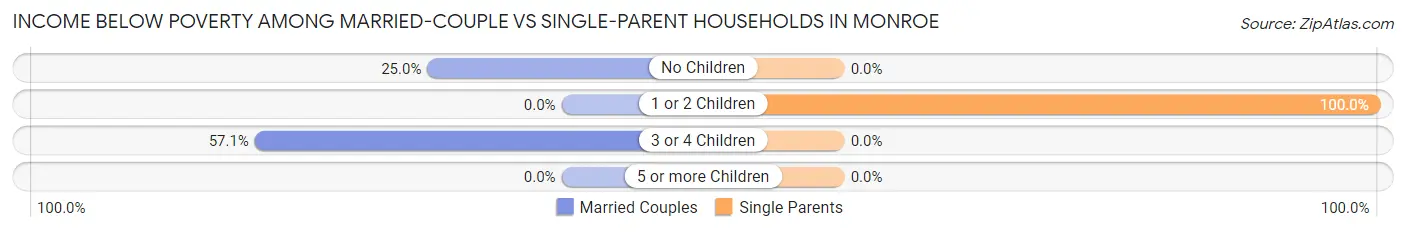
| Children | Married-Couple Families | Single-Parent Households |
| No Children | 3 (25.0%) | 0 (0.0%) |
| 1 or 2 Children | 0 (0.0%) | 6 (100.0%) |
| 3 or 4 Children | 4 (57.1%) | 0 (0.0%) |
| 5 or more Children | 0 (0.0%) | 0 (0.0%) |
| Total | 7 (28.0%) | 6 (100.0%) |
Race in Monroe
The most populous races in Monroe are White / Caucasian (110 | 83.3%), Native / Alaskan (12 | 9.1%), and Asian (6 | 4.5%).
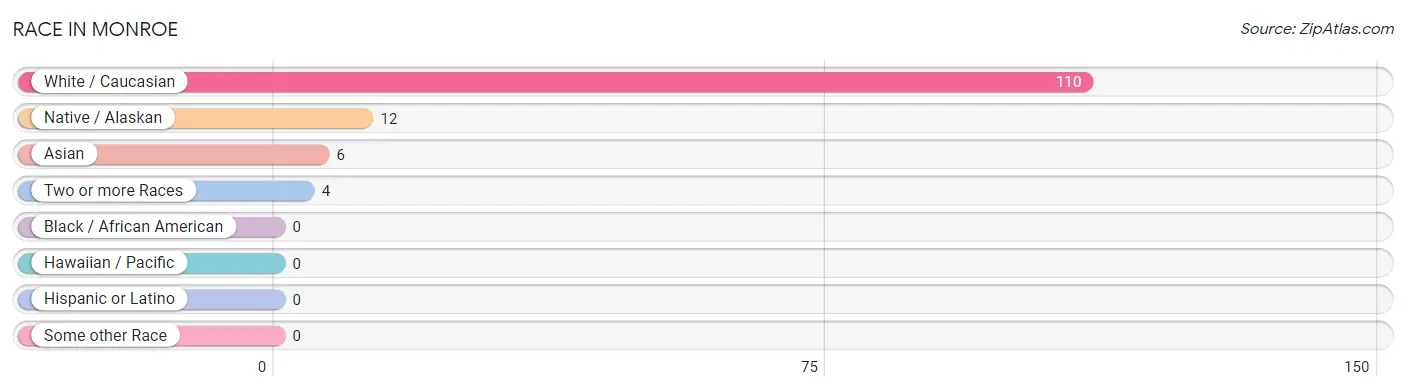
| Race | # Population | % Population |
| Asian | 6 | 4.5% |
| Black / African American | 0 | 0.0% |
| Hawaiian / Pacific | 0 | 0.0% |
| Hispanic or Latino | 0 | 0.0% |
| Native / Alaskan | 12 | 9.1% |
| White / Caucasian | 110 | 83.3% |
| Two or more Races | 4 | 3.0% |
| Some other Race | 0 | 0.0% |
| Total | 132 | 100.0% |
Ancestry in Monroe
The most populous ancestries reported in Monroe are English (50 | 37.9%), Choctaw (15 | 11.4%), American (13 | 9.9%), Korean (6 | 4.5%), and Dutch (3 | 2.3%), together accounting for 65.9% of all Monroe residents.
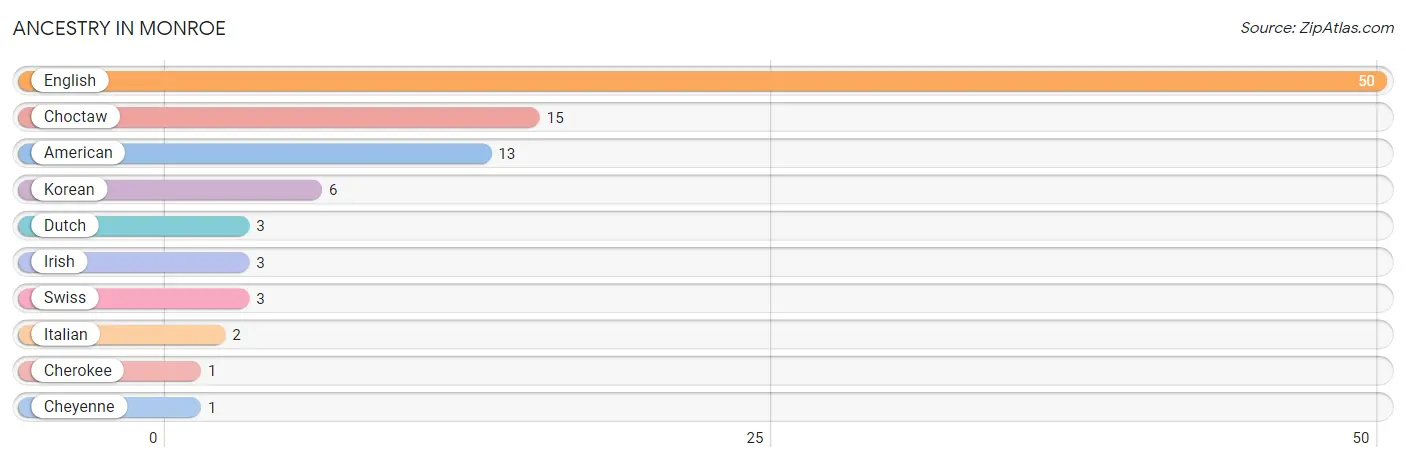
| Ancestry | # Population | % Population |
| American | 13 | 9.9% |
| Cherokee | 1 | 0.8% |
| Cheyenne | 1 | 0.8% |
| Choctaw | 15 | 11.4% |
| Dutch | 3 | 2.3% |
| English | 50 | 37.9% |
| Irish | 3 | 2.3% |
| Italian | 2 | 1.5% |
| Korean | 6 | 4.5% |
| Swiss | 3 | 2.3% | View All 10 Rows |
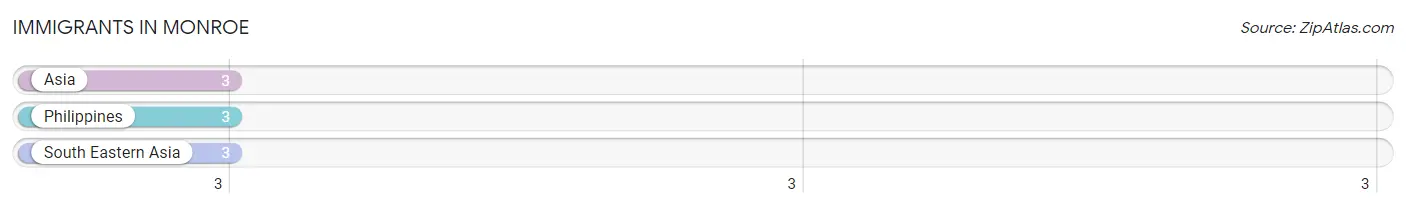
Immigrants in Monroe
The most numerous immigrant groups reported in Monroe came from Asia (3 | 2.3%), Philippines (3 | 2.3%), and South Eastern Asia (3 | 2.3%), together accounting for 6.8% of all Monroe residents.
| Immigration Origin | # Population | % Population |
| Asia | 3 | 2.3% |
| Philippines | 3 | 2.3% |
| South Eastern Asia | 3 | 2.3% | View All 3 Rows |
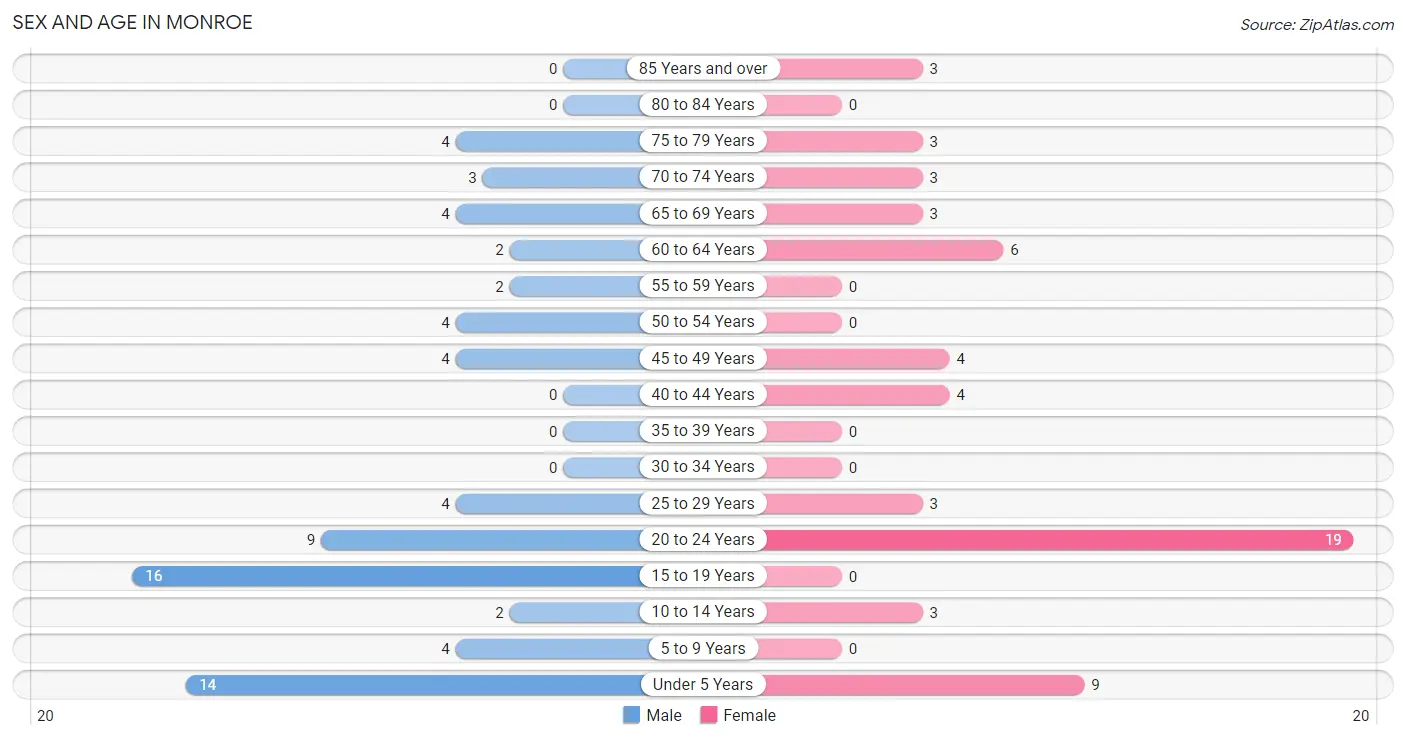
Sex and Age in Monroe
Sex and Age in Monroe
The most populous age groups in Monroe are 15 to 19 Years (16 | 22.2%) for men and 20 to 24 Years (19 | 31.7%) for women.
| Age Bracket | Male | Female |
| Under 5 Years | 14 (19.4%) | 9 (15.0%) |
| 5 to 9 Years | 4 (5.6%) | 0 (0.0%) |
| 10 to 14 Years | 2 (2.8%) | 3 (5.0%) |
| 15 to 19 Years | 16 (22.2%) | 0 (0.0%) |
| 20 to 24 Years | 9 (12.5%) | 19 (31.7%) |
| 25 to 29 Years | 4 (5.6%) | 3 (5.0%) |
| 30 to 34 Years | 0 (0.0%) | 0 (0.0%) |
| 35 to 39 Years | 0 (0.0%) | 0 (0.0%) |
| 40 to 44 Years | 0 (0.0%) | 4 (6.7%) |
| 45 to 49 Years | 4 (5.6%) | 4 (6.7%) |
| 50 to 54 Years | 4 (5.6%) | 0 (0.0%) |
| 55 to 59 Years | 2 (2.8%) | 0 (0.0%) |
| 60 to 64 Years | 2 (2.8%) | 6 (10.0%) |
| 65 to 69 Years | 4 (5.6%) | 3 (5.0%) |
| 70 to 74 Years | 3 (4.2%) | 3 (5.0%) |
| 75 to 79 Years | 4 (5.6%) | 3 (5.0%) |
| 80 to 84 Years | 0 (0.0%) | 0 (0.0%) |
| 85 Years and over | 0 (0.0%) | 3 (5.0%) |
| Total | 72 (100.0%) | 60 (100.0%) |
Families and Households in Monroe
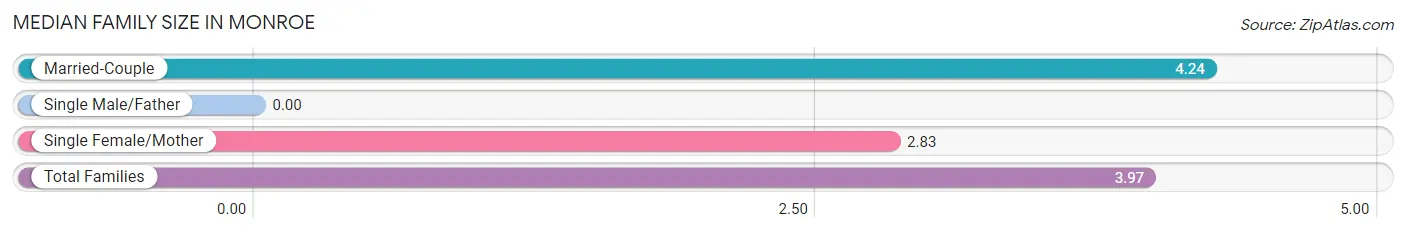
Median Family Size in Monroe
| Family Type | # Families | Family Size |
| Married-Couple | 25 (80.6%) | 4.24 |
| Single Male/Father | 0 (0.0%) | - |
| Single Female/Mother | 6 (19.4%) | 2.83 |
| Total Families | 31 (100.0%) | 3.97 |
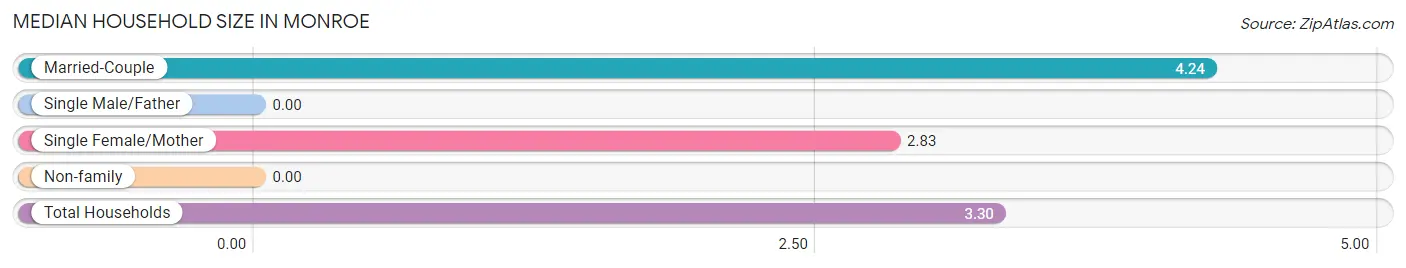
Median Household Size in Monroe
| Household Type | # Households | Household Size |
| Married-Couple | 25 (62.5%) | 4.24 |
| Single Male/Father | 0 (0.0%) | - |
| Single Female/Mother | 6 (15.0%) | 2.83 |
| Non-family | 9 (22.5%) | - |
| Total Households | 40 (100.0%) | 3.30 |
Household Size by Marriage Status in Monroe
Out of a total of 40 households in Monroe, 31 (77.5%) are family households, while 9 (22.5%) are nonfamily households. The most numerous type of family households are 2-person households, comprising 11, and the most common type of nonfamily households are 1-person households, comprising 9.
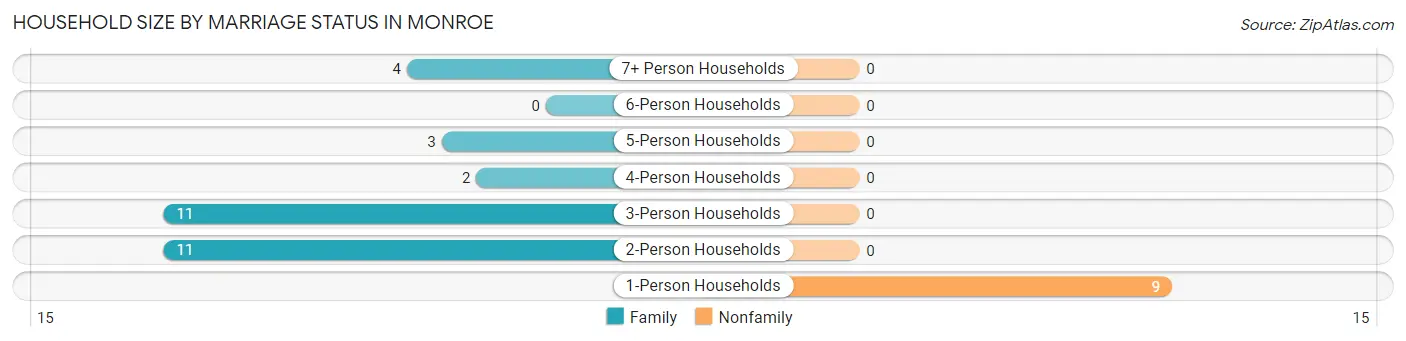
| Household Size | Family Households | Nonfamily Households |
| 1-Person Households | - | 9 (22.5%) |
| 2-Person Households | 11 (27.5%) | 0 (0.0%) |
| 3-Person Households | 11 (27.5%) | 0 (0.0%) |
| 4-Person Households | 2 (5.0%) | 0 (0.0%) |
| 5-Person Households | 3 (7.5%) | 0 (0.0%) |
| 6-Person Households | 0 (0.0%) | 0 (0.0%) |
| 7+ Person Households | 4 (10.0%) | 0 (0.0%) |
| Total | 31 (77.5%) | 9 (22.5%) |
Female Fertility in Monroe
Fertility by Age in Monroe
Average fertility rate in Monroe is 133.0 births per 1,000 women. Women in the age bracket of 20 to 34 years have the highest fertility rate with 182.0 births per 1,000 women. Women in the age bracket of 20 to 34 years acount for 100.0% of all women with births.
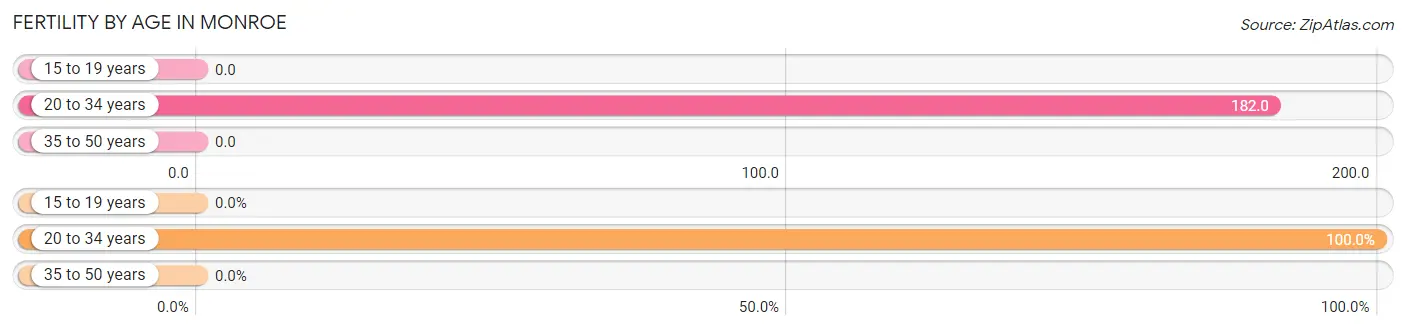
| Age Bracket | Women with Births | Births / 1,000 Women |
| 15 to 19 years | 0 (0.0%) | 0.0 |
| 20 to 34 years | 4 (100.0%) | 182.0 |
| 35 to 50 years | 0 (0.0%) | 0.0 |
| Total | 4 (100.0%) | 133.0 |
Fertility by Age by Marriage Status in Monroe
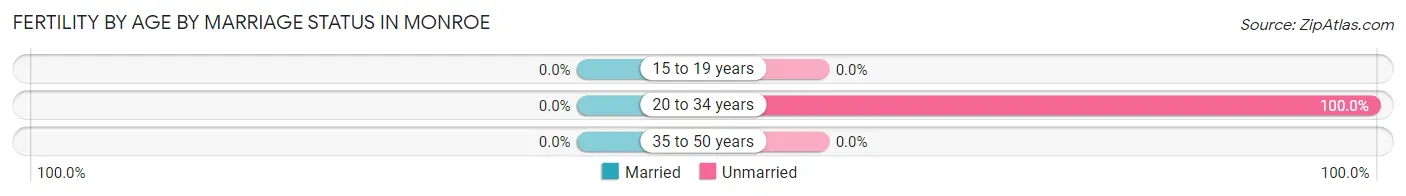
| Age Bracket | Married | Unmarried |
| 15 to 19 years | 0 (0.0%) | 0 (0.0%) |
| 20 to 34 years | 0 (0.0%) | 4 (100.0%) |
| 35 to 50 years | 0 (0.0%) | 0 (0.0%) |
| Total | 0 (0.0%) | 4 (100.0%) |
Fertility by Education in Monroe
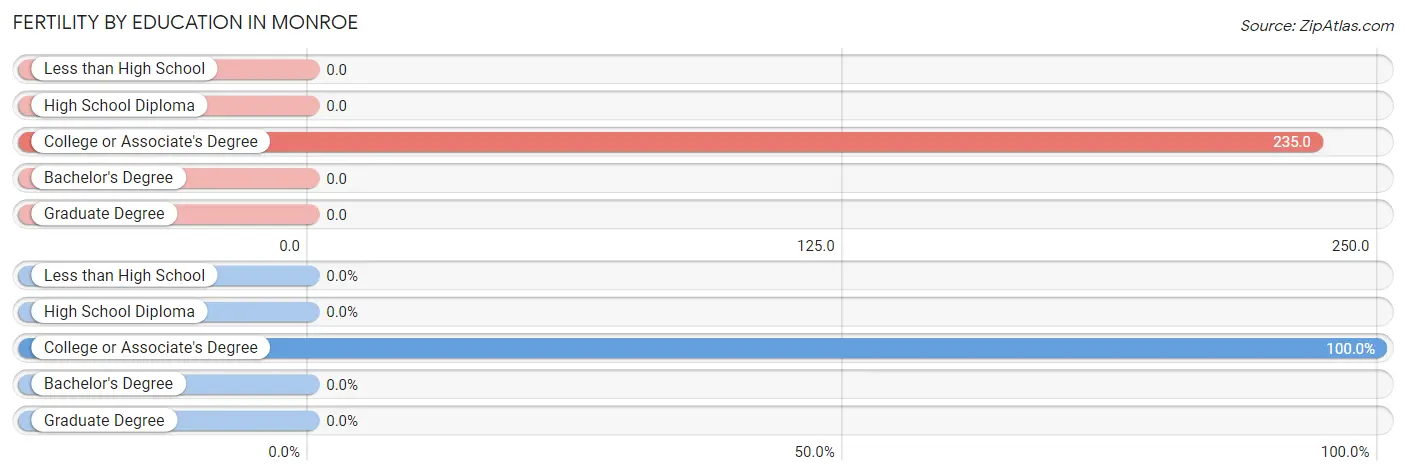
| Educational Attainment | Women with Births | Births / 1,000 Women |
| Less than High School | 0 (0.0%) | 0.0 |
| High School Diploma | 0 (0.0%) | 0.0 |
| College or Associate's Degree | 4 (100.0%) | 235.0 |
| Bachelor's Degree | 0 (0.0%) | 0.0 |
| Graduate Degree | 0 (0.0%) | 0.0 |
| Total | 4 (100.0%) | 133.0 |
Fertility by Education by Marriage Status in Monroe
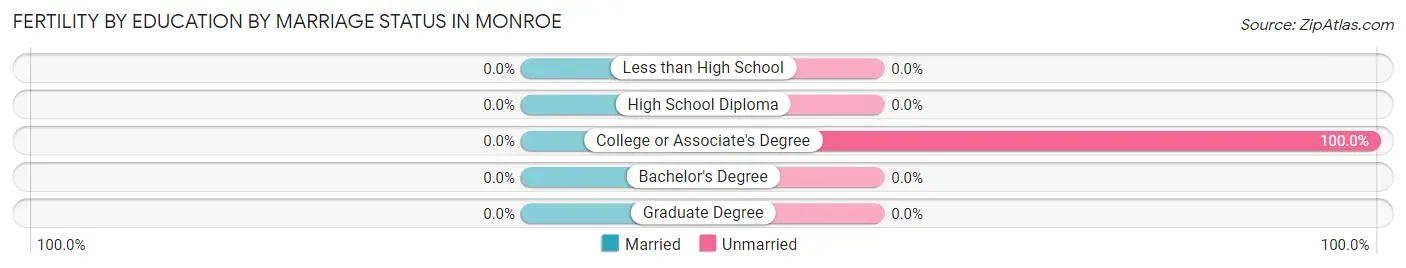
| Educational Attainment | Married | Unmarried |
| Less than High School | 0 (0.0%) | 0 (0.0%) |
| High School Diploma | 0 (0.0%) | 0 (0.0%) |
| College or Associate's Degree | 0 (0.0%) | 4 (100.0%) |
| Bachelor's Degree | 0 (0.0%) | 0 (0.0%) |
| Graduate Degree | 0 (0.0%) | 0 (0.0%) |
| Total | 0 (0.0%) | 4 (100.0%) |
Employment Characteristics in Monroe
Employment by Class of Employer in Monroe
Among the 22 employed individuals in Monroe, private company employees (18 | 81.8%), and state government employees (4 | 18.2%) make up the most common classes of employment.
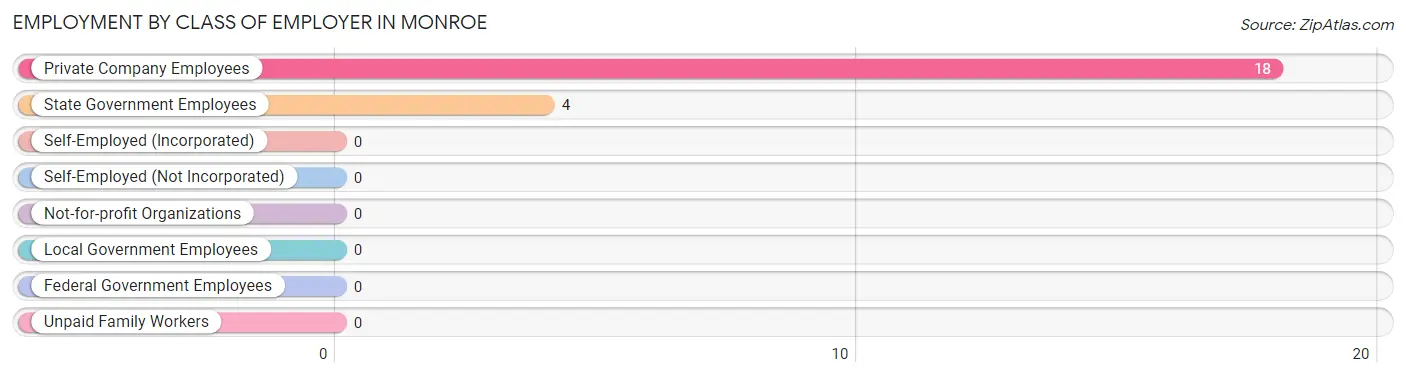
| Employer Class | # Employees | % Employees |
| Private Company Employees | 18 | 81.8% |
| Self-Employed (Incorporated) | 0 | 0.0% |
| Self-Employed (Not Incorporated) | 0 | 0.0% |
| Not-for-profit Organizations | 0 | 0.0% |
| Local Government Employees | 0 | 0.0% |
| State Government Employees | 4 | 18.2% |
| Federal Government Employees | 0 | 0.0% |
| Unpaid Family Workers | 0 | 0.0% |
| Total | 22 | 100.0% |
Employment Status by Age in Monroe
According to the labor force statistics for Monroe, out of the total population over 16 years of age (90), 45.6% or 41 individuals are in the labor force, with 46.3% or 19 of them unemployed. The age group with the highest labor force participation rate is 16 to 19 years, with 100.0% or 6 individuals in the labor force. Within the labor force, the 16 to 19 years age range has the highest percentage of unemployed individuals, with 100.0% or 6 of them being unemployed.
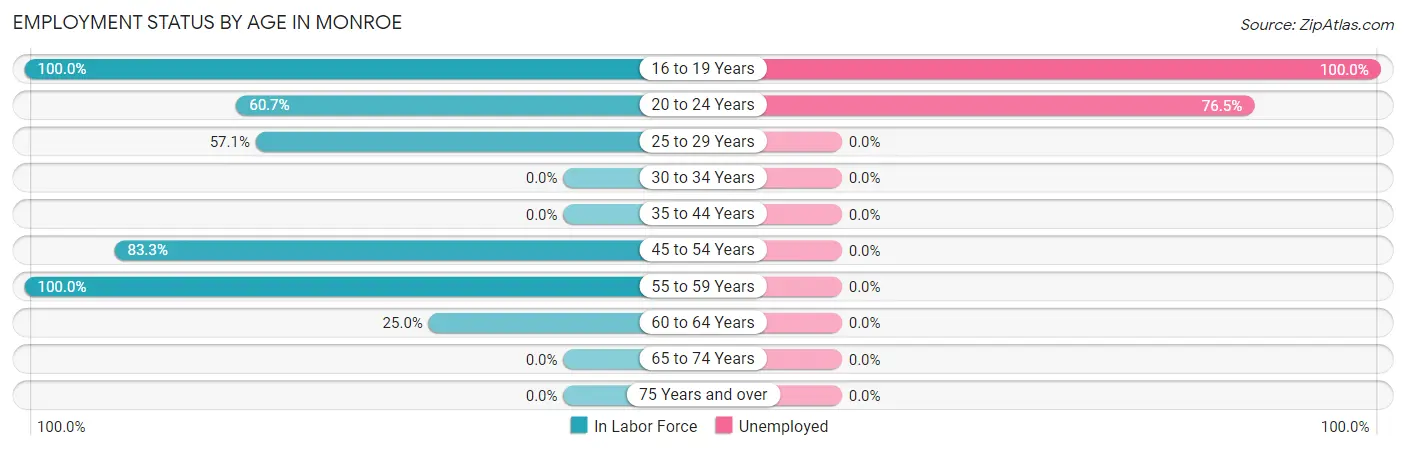
| Age Bracket | In Labor Force | Unemployed |
| 16 to 19 Years | 6 (100.0%) | 6 (100.0%) |
| 20 to 24 Years | 17 (60.7%) | 13 (76.5%) |
| 25 to 29 Years | 4 (57.1%) | 0 (0.0%) |
| 30 to 34 Years | 0 (0.0%) | 0 (0.0%) |
| 35 to 44 Years | 0 (0.0%) | 0 (0.0%) |
| 45 to 54 Years | 10 (83.3%) | 0 (0.0%) |
| 55 to 59 Years | 2 (100.0%) | 0 (0.0%) |
| 60 to 64 Years | 2 (25.0%) | 0 (0.0%) |
| 65 to 74 Years | 0 (0.0%) | 0 (0.0%) |
| 75 Years and over | 0 (0.0%) | 0 (0.0%) |
| Total | 41 (45.6%) | 19 (46.3%) |
Employment Status by Educational Attainment in Monroe
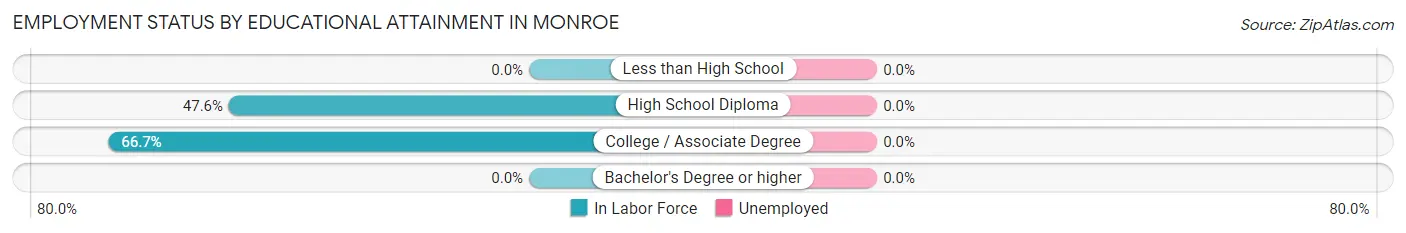
| Educational Attainment | In Labor Force | Unemployed |
| Less than High School | 0 (0.0%) | 0 (0.0%) |
| High School Diploma | 10 (47.6%) | 0 (0.0%) |
| College / Associate Degree | 8 (66.7%) | 0 (0.0%) |
| Bachelor's Degree or higher | 0 (0.0%) | 0 (0.0%) |
| Total | 18 (54.5%) | 0 (0.0%) |
Employment Occupations by Sex in Monroe
Management, Business, Science and Arts Occupations
Management, Business, Science and Arts Occupations by Sex
| Occupation | Male | Female |
| Management | 0 (0.0%) | 0 (0.0%) |
| Business & Financial | 0 (0.0%) | 0 (0.0%) |
| Computers, Engineering & Science | 0 (0.0%) | 0 (0.0%) |
| Computers & Mathematics | 0 (0.0%) | 0 (0.0%) |
| Architecture & Engineering | 0 (0.0%) | 0 (0.0%) |
| Life, Physical & Social Science | 0 (0.0%) | 0 (0.0%) |
| Community & Social Service | 0 (0.0%) | 0 (0.0%) |
| Education, Arts & Media | 0 (0.0%) | 0 (0.0%) |
| Legal Services & Support | 0 (0.0%) | 0 (0.0%) |
| Education Instruction & Library | 0 (0.0%) | 0 (0.0%) |
| Arts, Media & Entertainment | 0 (0.0%) | 0 (0.0%) |
| Health Diagnosing & Treating | 0 (0.0%) | 0 (0.0%) |
| Health Technologists | 0 (0.0%) | 0 (0.0%) |
| Total (Category) | 0 (0.0%) | 0 (0.0%) |
| Total (Overall) | 20 (90.9%) | 2 (9.1%) |
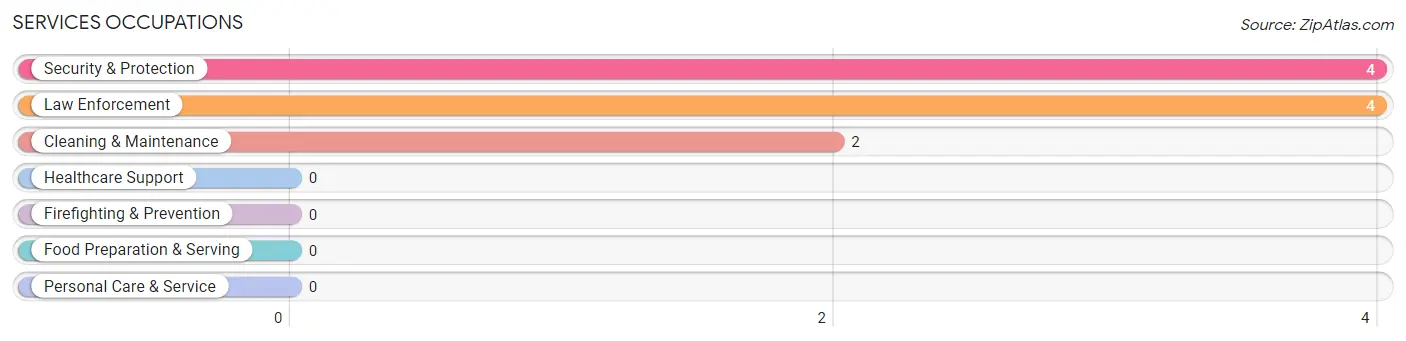
Services Occupations
The most common Services occupations in Monroe are Security & Protection (4 | 18.2%), Law Enforcement (4 | 18.2%), and Cleaning & Maintenance (2 | 9.1%).
Services Occupations by Sex
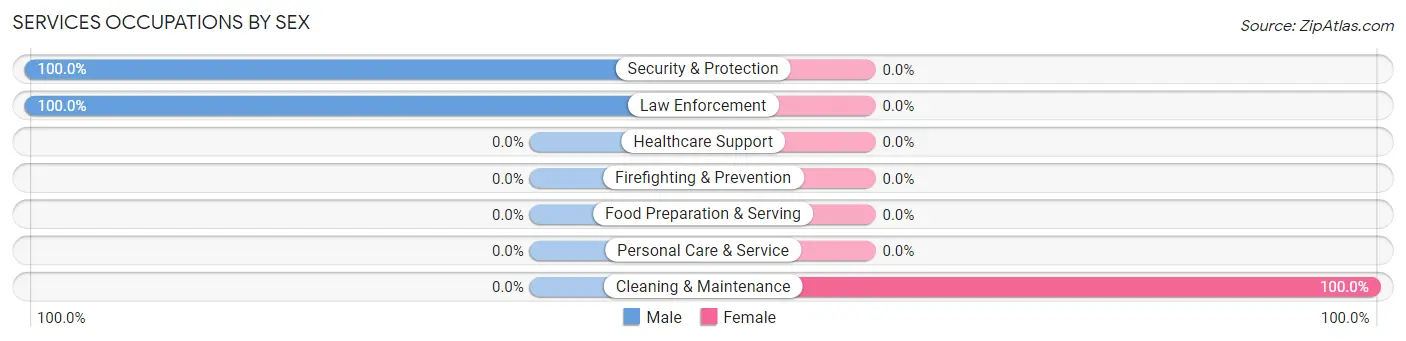
| Occupation | Male | Female |
| Healthcare Support | 0 (0.0%) | 0 (0.0%) |
| Security & Protection | 4 (100.0%) | 0 (0.0%) |
| Firefighting & Prevention | 0 (0.0%) | 0 (0.0%) |
| Law Enforcement | 4 (100.0%) | 0 (0.0%) |
| Food Preparation & Serving | 0 (0.0%) | 0 (0.0%) |
| Cleaning & Maintenance | 0 (0.0%) | 2 (100.0%) |
| Personal Care & Service | 0 (0.0%) | 0 (0.0%) |
| Total (Category) | 4 (66.7%) | 2 (33.3%) |
| Total (Overall) | 20 (90.9%) | 2 (9.1%) |
Sales and Office Occupations
Sales and Office Occupations by Sex
| Occupation | Male | Female |
| Sales & Related | 0 (0.0%) | 0 (0.0%) |
| Office & Administration | 0 (0.0%) | 0 (0.0%) |
| Total (Category) | 0 (0.0%) | 0 (0.0%) |
| Total (Overall) | 20 (90.9%) | 2 (9.1%) |
Natural Resources, Construction and Maintenance Occupations
The most common Natural Resources, Construction and Maintenance occupations in Monroe are Installation, Maintenance & Repair (6 | 27.3%), and Construction & Extraction (4 | 18.2%).
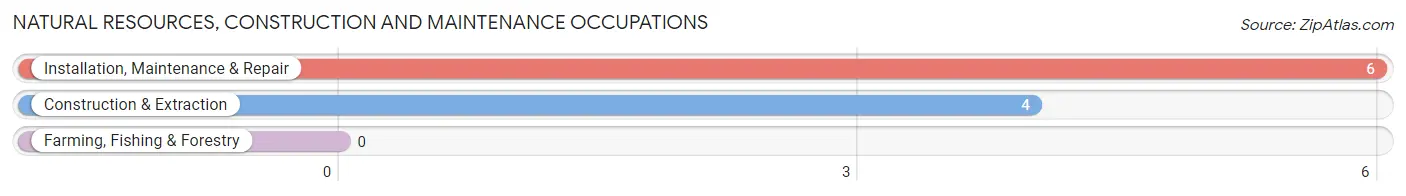
Natural Resources, Construction and Maintenance Occupations by Sex
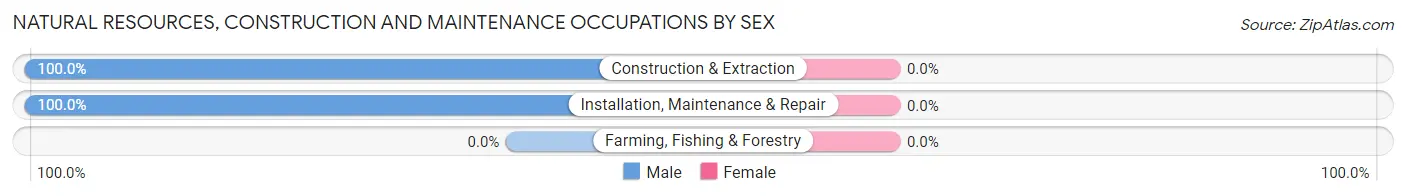
| Occupation | Male | Female |
| Farming, Fishing & Forestry | 0 (0.0%) | 0 (0.0%) |
| Construction & Extraction | 4 (100.0%) | 0 (0.0%) |
| Installation, Maintenance & Repair | 6 (100.0%) | 0 (0.0%) |
| Total (Category) | 10 (100.0%) | 0 (0.0%) |
| Total (Overall) | 20 (90.9%) | 2 (9.1%) |
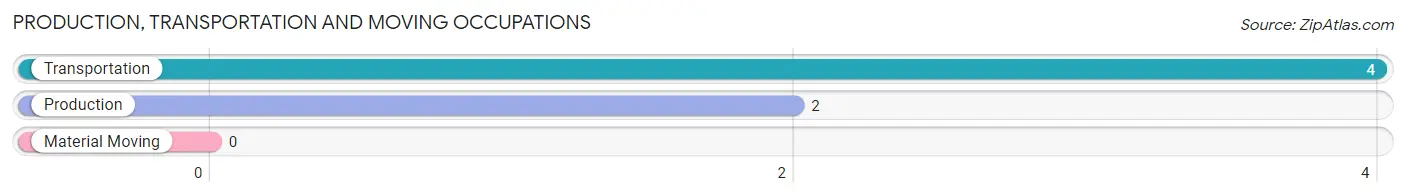
Production, Transportation and Moving Occupations
The most common Production, Transportation and Moving occupations in Monroe are Transportation (4 | 18.2%), and Production (2 | 9.1%).
Production, Transportation and Moving Occupations by Sex
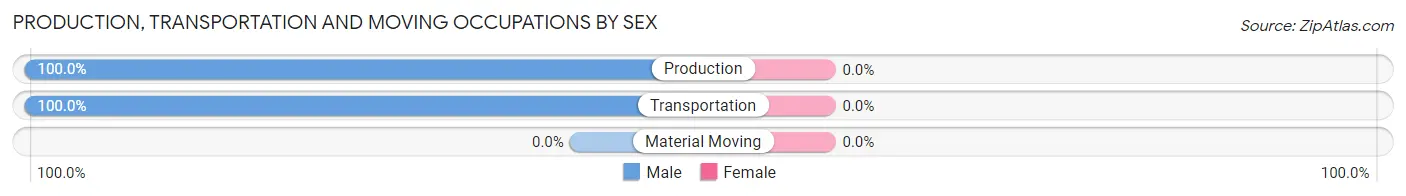
| Occupation | Male | Female |
| Production | 2 (100.0%) | 0 (0.0%) |
| Transportation | 4 (100.0%) | 0 (0.0%) |
| Material Moving | 0 (0.0%) | 0 (0.0%) |
| Total (Category) | 6 (100.0%) | 0 (0.0%) |
| Total (Overall) | 20 (90.9%) | 2 (9.1%) |
Employment Industries by Sex in Monroe
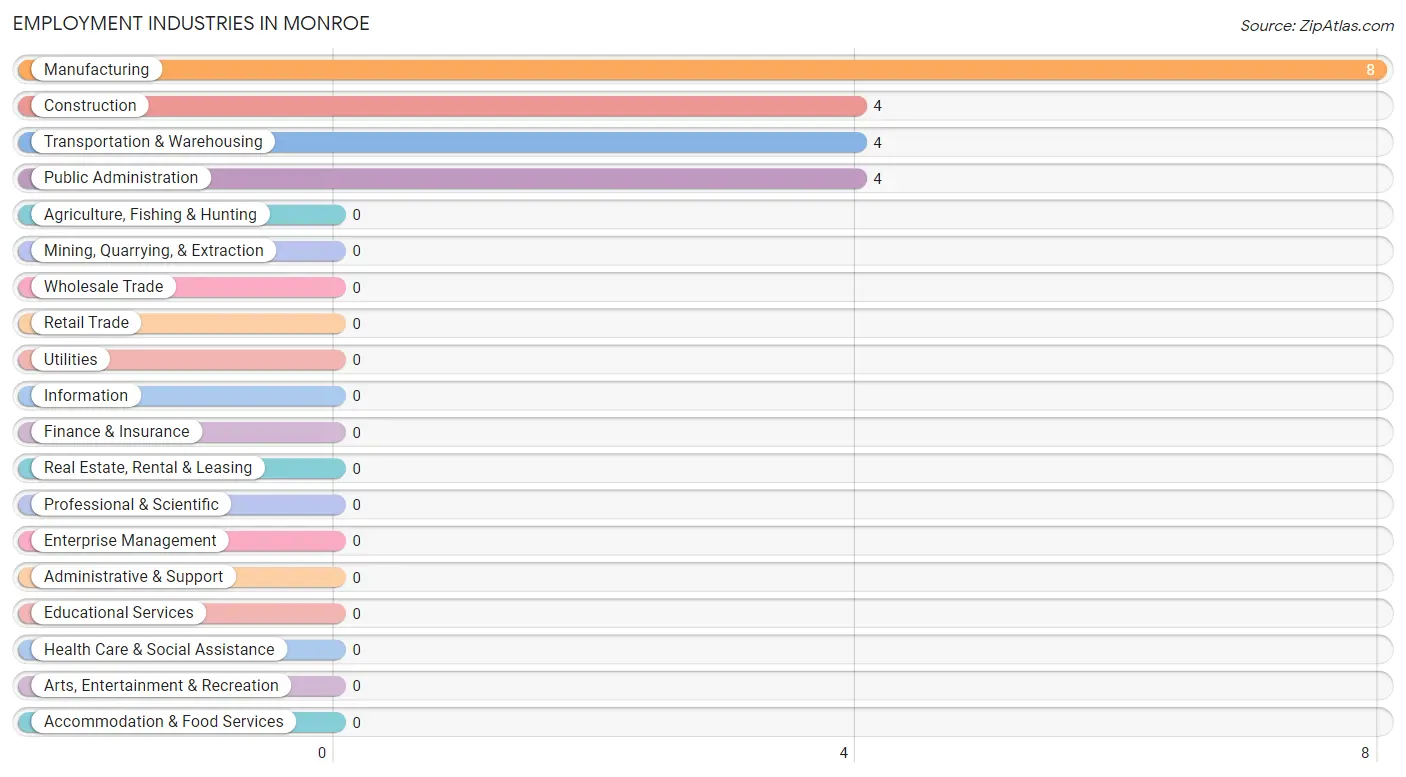
Employment Industries in Monroe
The major employment industries in Monroe include Manufacturing (8 | 36.4%), Construction (4 | 18.2%), Transportation & Warehousing (4 | 18.2%), and Public Administration (4 | 18.2%).
Employment Industries by Sex in Monroe
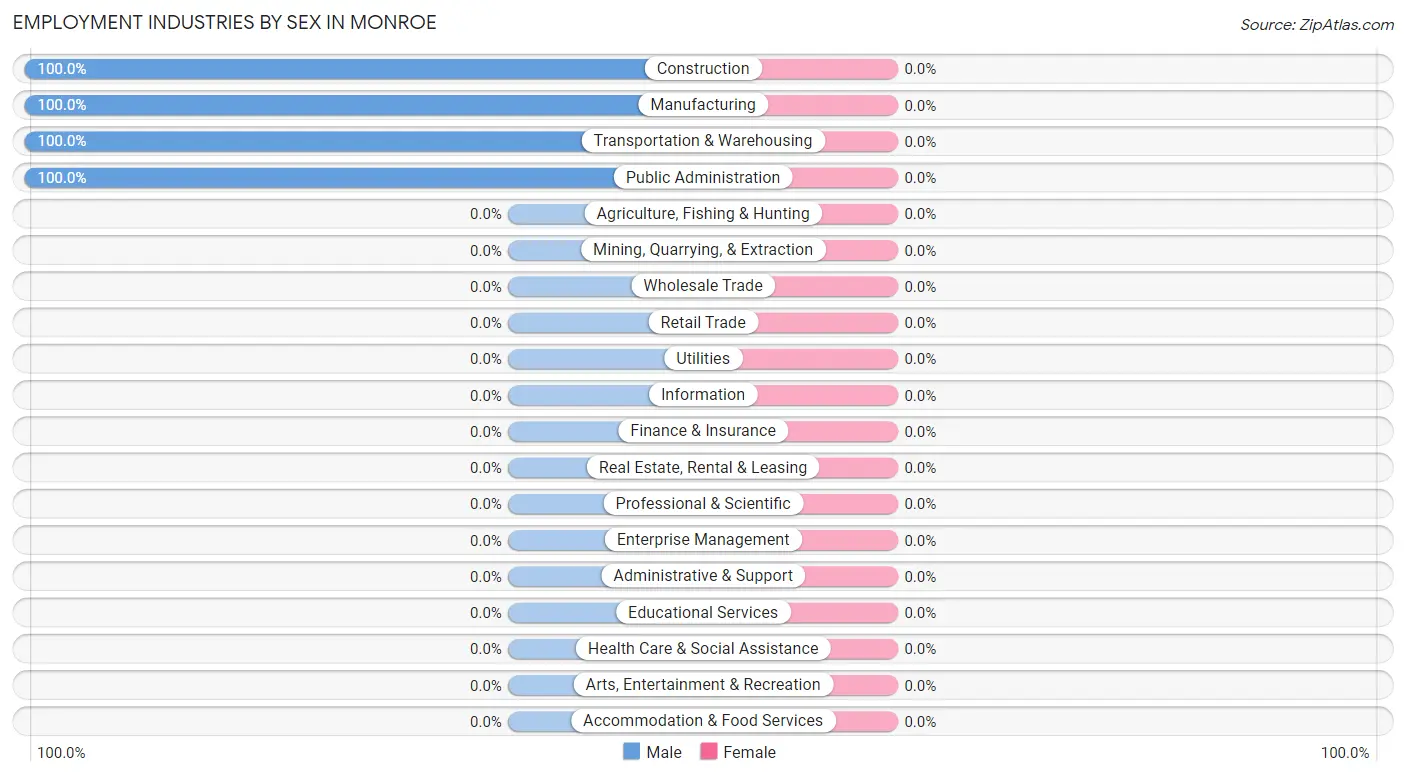
| Industry | Male | Female |
| Agriculture, Fishing & Hunting | 0 (0.0%) | 0 (0.0%) |
| Mining, Quarrying, & Extraction | 0 (0.0%) | 0 (0.0%) |
| Construction | 4 (100.0%) | 0 (0.0%) |
| Manufacturing | 8 (100.0%) | 0 (0.0%) |
| Wholesale Trade | 0 (0.0%) | 0 (0.0%) |
| Retail Trade | 0 (0.0%) | 0 (0.0%) |
| Transportation & Warehousing | 4 (100.0%) | 0 (0.0%) |
| Utilities | 0 (0.0%) | 0 (0.0%) |
| Information | 0 (0.0%) | 0 (0.0%) |
| Finance & Insurance | 0 (0.0%) | 0 (0.0%) |
| Real Estate, Rental & Leasing | 0 (0.0%) | 0 (0.0%) |
| Professional & Scientific | 0 (0.0%) | 0 (0.0%) |
| Enterprise Management | 0 (0.0%) | 0 (0.0%) |
| Administrative & Support | 0 (0.0%) | 0 (0.0%) |
| Educational Services | 0 (0.0%) | 0 (0.0%) |
| Health Care & Social Assistance | 0 (0.0%) | 0 (0.0%) |
| Arts, Entertainment & Recreation | 0 (0.0%) | 0 (0.0%) |
| Accommodation & Food Services | 0 (0.0%) | 0 (0.0%) |
| Public Administration | 4 (100.0%) | 0 (0.0%) |
| Total | 20 (90.9%) | 2 (9.1%) |
Education in Monroe
School Enrollment in Monroe
The most common levels of schooling among the 15 students in Monroe are high school (10 | 66.7%), and middle school (5 | 33.3%).
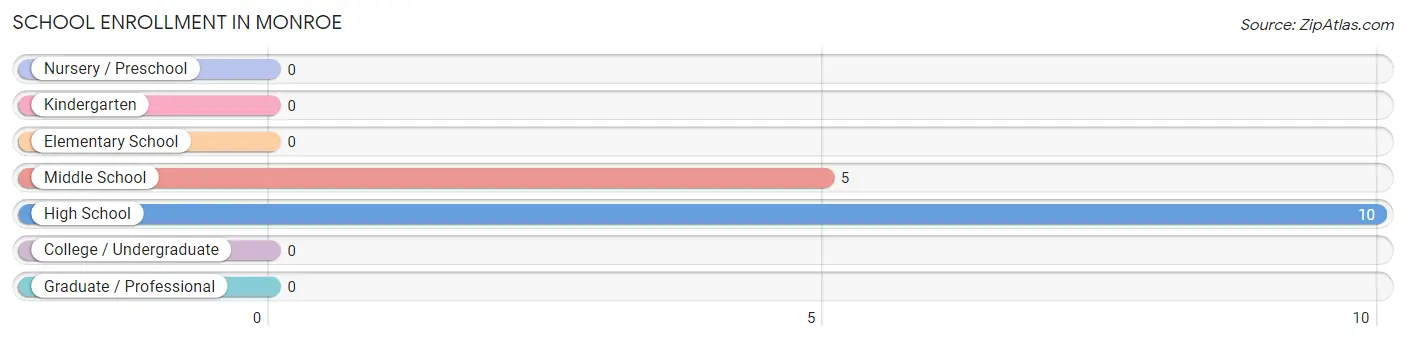
| School Level | # Students | % Students |
| Nursery / Preschool | 0 | 0.0% |
| Kindergarten | 0 | 0.0% |
| Elementary School | 0 | 0.0% |
| Middle School | 5 | 33.3% |
| High School | 10 | 66.7% |
| College / Undergraduate | 0 | 0.0% |
| Graduate / Professional | 0 | 0.0% |
| Total | 15 | 100.0% |
School Enrollment by Age by Funding Source in Monroe
Out of a total of 15 students who are enrolled in schools in Monroe, 2 (13.3%) attend a private institution, while the remaining 13 (86.7%) are enrolled in public schools. The age group of 10 to 14 year olds has the highest likelihood of being enrolled in private schools, with 2 (40.0% in the age bracket) enrolled. Conversely, the age group of 15 to 17 year olds has the lowest likelihood of being enrolled in a private school, with 10 (100.0% in the age bracket) attending a public institution.
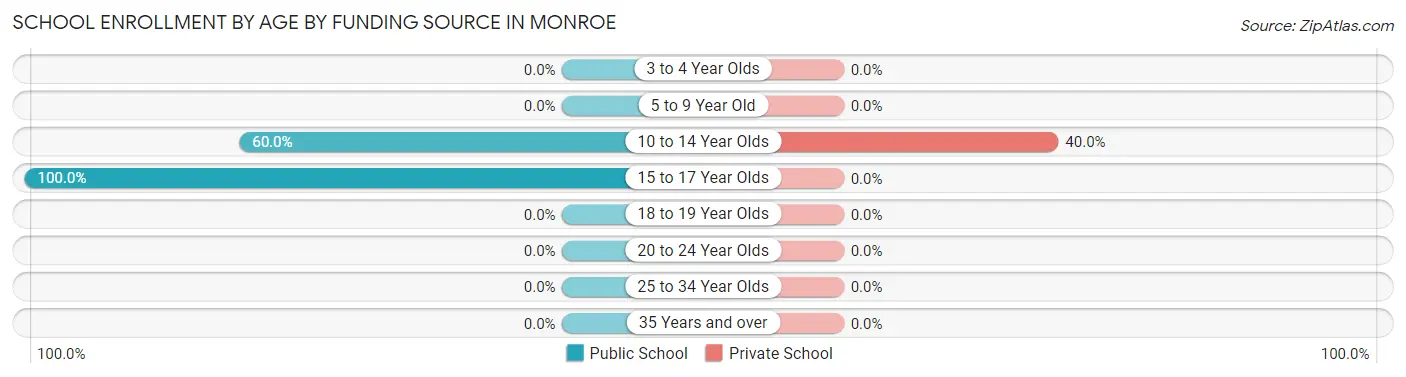
| Age Bracket | Public School | Private School |
| 3 to 4 Year Olds | 0 (0.0%) | 0 (0.0%) |
| 5 to 9 Year Old | 0 (0.0%) | 0 (0.0%) |
| 10 to 14 Year Olds | 3 (60.0%) | 2 (40.0%) |
| 15 to 17 Year Olds | 10 (100.0%) | 0 (0.0%) |
| 18 to 19 Year Olds | 0 (0.0%) | 0 (0.0%) |
| 20 to 24 Year Olds | 0 (0.0%) | 0 (0.0%) |
| 25 to 34 Year Olds | 0 (0.0%) | 0 (0.0%) |
| 35 Years and over | 0 (0.0%) | 0 (0.0%) |
| Total | 13 (86.7%) | 2 (13.3%) |
Educational Attainment by Field of Study in Monroe
, and engineering (3 | 100.0%) are the most common fields of study among 3 individuals in Monroe who have obtained a bachelor's degree or higher.
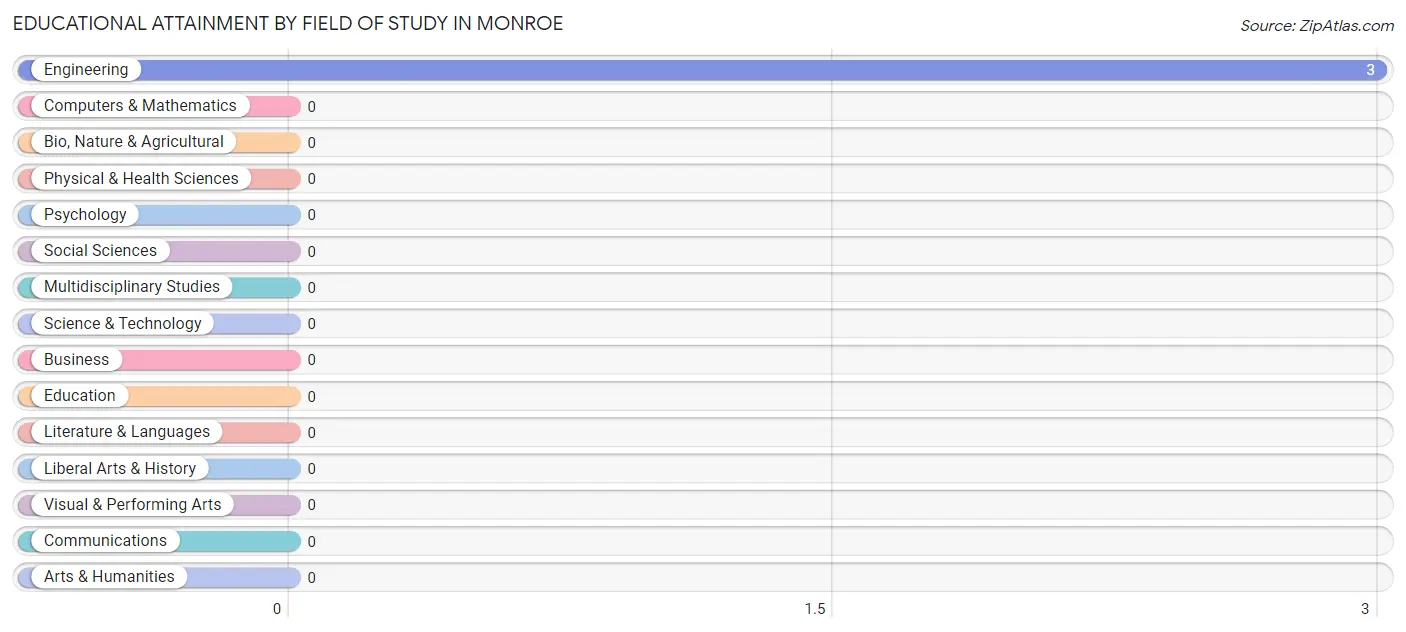
| Field of Study | # Graduates | % Graduates |
| Computers & Mathematics | 0 | 0.0% |
| Bio, Nature & Agricultural | 0 | 0.0% |
| Physical & Health Sciences | 0 | 0.0% |
| Psychology | 0 | 0.0% |
| Social Sciences | 0 | 0.0% |
| Engineering | 3 | 100.0% |
| Multidisciplinary Studies | 0 | 0.0% |
| Science & Technology | 0 | 0.0% |
| Business | 0 | 0.0% |
| Education | 0 | 0.0% |
| Literature & Languages | 0 | 0.0% |
| Liberal Arts & History | 0 | 0.0% |
| Visual & Performing Arts | 0 | 0.0% |
| Communications | 0 | 0.0% |
| Arts & Humanities | 0 | 0.0% |
| Total | 3 | 100.0% |
Transportation & Commute in Monroe
Vehicle Availability by Sex in Monroe
The most prevalent vehicle ownership categories in Monroe are males with 2 vehicles (16, accounting for 80.0%) and females with 2 vehicles (0, making up 800.0%).
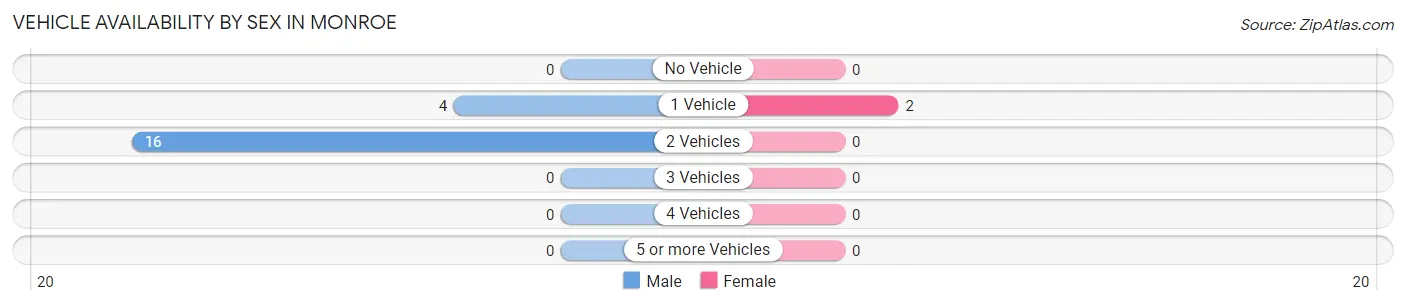
| Vehicles Available | Male | Female |
| No Vehicle | 0 (0.0%) | 0 (0.0%) |
| 1 Vehicle | 4 (20.0%) | 2 (100.0%) |
| 2 Vehicles | 16 (80.0%) | 0 (0.0%) |
| 3 Vehicles | 0 (0.0%) | 0 (0.0%) |
| 4 Vehicles | 0 (0.0%) | 0 (0.0%) |
| 5 or more Vehicles | 0 (0.0%) | 0 (0.0%) |
| Total | 20 (100.0%) | 2 (100.0%) |
Commute Time in Monroe
The most frequently occuring commute durations in Monroe are 45 to 59 minutes (10 commuters, 45.5%), 20 to 24 minutes (4 commuters, 18.2%), and 30 to 34 minutes (4 commuters, 18.2%).
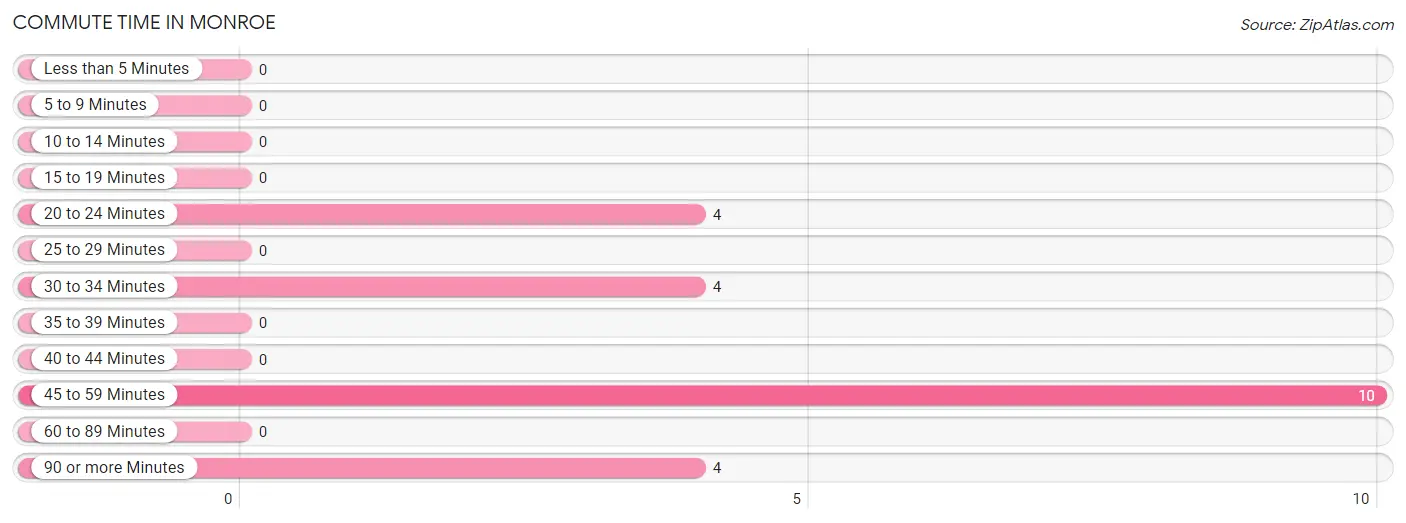
| Commute Time | # Commuters | % Commuters |
| Less than 5 Minutes | 0 | 0.0% |
| 5 to 9 Minutes | 0 | 0.0% |
| 10 to 14 Minutes | 0 | 0.0% |
| 15 to 19 Minutes | 0 | 0.0% |
| 20 to 24 Minutes | 4 | 18.2% |
| 25 to 29 Minutes | 0 | 0.0% |
| 30 to 34 Minutes | 4 | 18.2% |
| 35 to 39 Minutes | 0 | 0.0% |
| 40 to 44 Minutes | 0 | 0.0% |
| 45 to 59 Minutes | 10 | 45.5% |
| 60 to 89 Minutes | 0 | 0.0% |
| 90 or more Minutes | 4 | 18.2% |
Commute Time by Sex in Monroe
The most common commute times in Monroe are 45 to 59 minutes (10 commuters, 50.0%) for males and 20 to 24 minutes (2 commuters, 100.0%) for females.
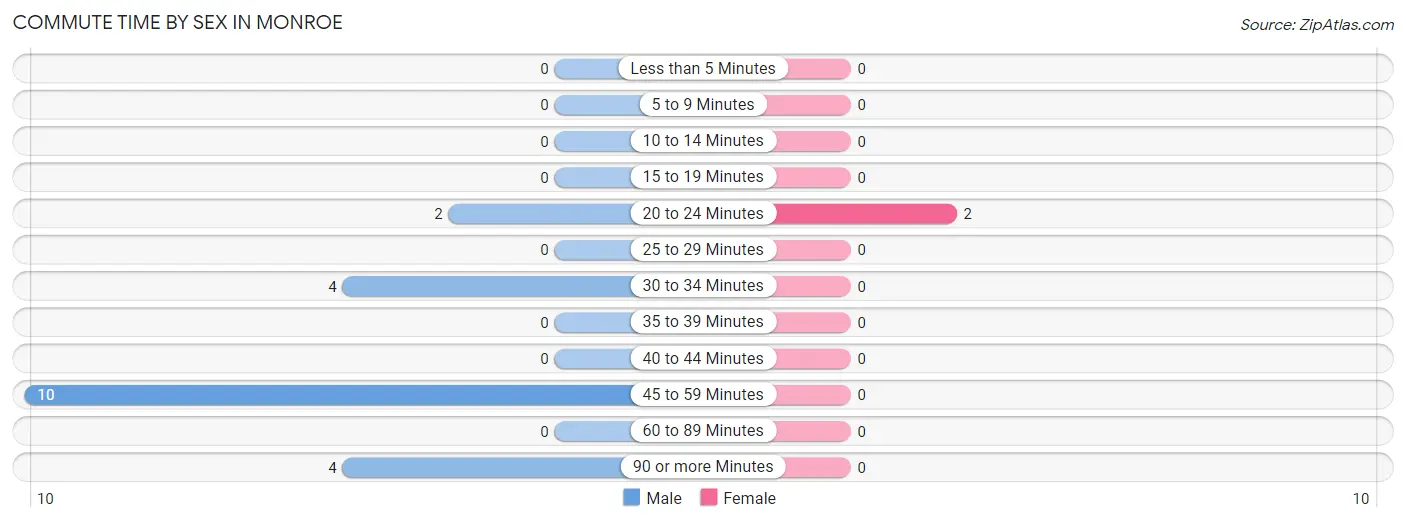
| Commute Time | Male | Female |
| Less than 5 Minutes | 0 (0.0%) | 0 (0.0%) |
| 5 to 9 Minutes | 0 (0.0%) | 0 (0.0%) |
| 10 to 14 Minutes | 0 (0.0%) | 0 (0.0%) |
| 15 to 19 Minutes | 0 (0.0%) | 0 (0.0%) |
| 20 to 24 Minutes | 2 (10.0%) | 2 (100.0%) |
| 25 to 29 Minutes | 0 (0.0%) | 0 (0.0%) |
| 30 to 34 Minutes | 4 (20.0%) | 0 (0.0%) |
| 35 to 39 Minutes | 0 (0.0%) | 0 (0.0%) |
| 40 to 44 Minutes | 0 (0.0%) | 0 (0.0%) |
| 45 to 59 Minutes | 10 (50.0%) | 0 (0.0%) |
| 60 to 89 Minutes | 0 (0.0%) | 0 (0.0%) |
| 90 or more Minutes | 4 (20.0%) | 0 (0.0%) |
Time of Departure to Work by Sex in Monroe
The most frequent times of departure to work in Monroe are 12:00 PM to 3:59 PM (8, 40.0%) for males and 10:00 AM to 10:59 AM (2, 100.0%) for females.
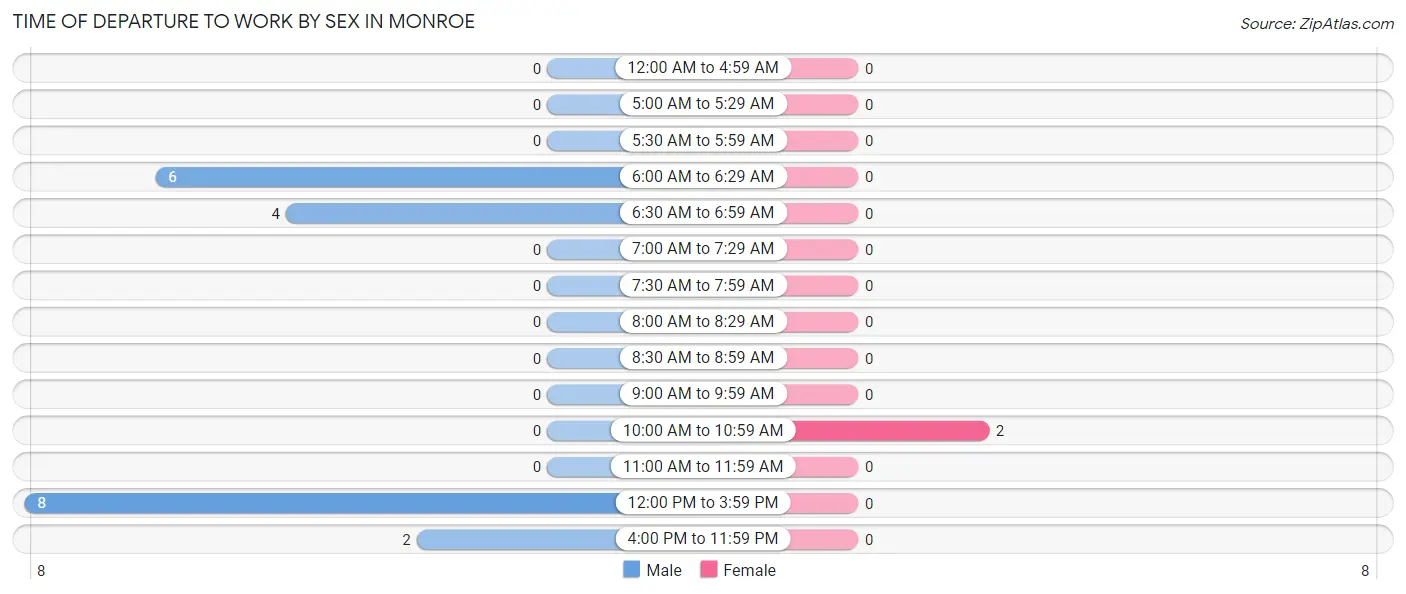
| Time of Departure | Male | Female |
| 12:00 AM to 4:59 AM | 0 (0.0%) | 0 (0.0%) |
| 5:00 AM to 5:29 AM | 0 (0.0%) | 0 (0.0%) |
| 5:30 AM to 5:59 AM | 0 (0.0%) | 0 (0.0%) |
| 6:00 AM to 6:29 AM | 6 (30.0%) | 0 (0.0%) |
| 6:30 AM to 6:59 AM | 4 (20.0%) | 0 (0.0%) |
| 7:00 AM to 7:29 AM | 0 (0.0%) | 0 (0.0%) |
| 7:30 AM to 7:59 AM | 0 (0.0%) | 0 (0.0%) |
| 8:00 AM to 8:29 AM | 0 (0.0%) | 0 (0.0%) |
| 8:30 AM to 8:59 AM | 0 (0.0%) | 0 (0.0%) |
| 9:00 AM to 9:59 AM | 0 (0.0%) | 0 (0.0%) |
| 10:00 AM to 10:59 AM | 0 (0.0%) | 2 (100.0%) |
| 11:00 AM to 11:59 AM | 0 (0.0%) | 0 (0.0%) |
| 12:00 PM to 3:59 PM | 8 (40.0%) | 0 (0.0%) |
| 4:00 PM to 11:59 PM | 2 (10.0%) | 0 (0.0%) |
| Total | 20 (100.0%) | 2 (100.0%) |
Housing Occupancy in Monroe
Occupancy by Ownership in Monroe
Of the total 40 dwellings in Monroe, owner-occupied units account for 27 (67.5%), while renter-occupied units make up 13 (32.5%).
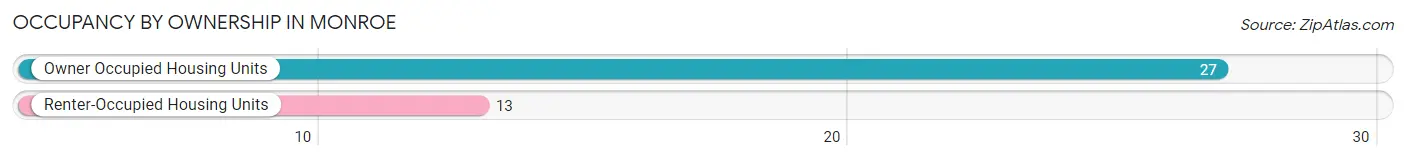
| Occupancy | # Housing Units | % Housing Units |
| Owner Occupied Housing Units | 27 | 67.5% |
| Renter-Occupied Housing Units | 13 | 32.5% |
| Total Occupied Housing Units | 40 | 100.0% |
Occupancy by Household Size in Monroe
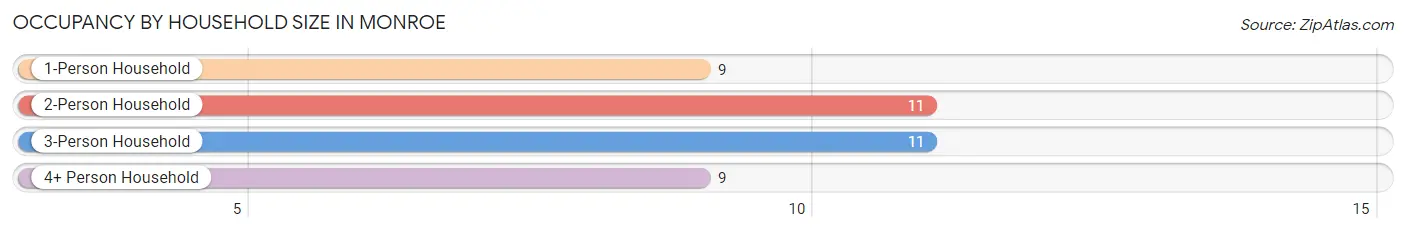
| Household Size | # Housing Units | % Housing Units |
| 1-Person Household | 9 | 22.5% |
| 2-Person Household | 11 | 27.5% |
| 3-Person Household | 11 | 27.5% |
| 4+ Person Household | 9 | 22.5% |
| Total Housing Units | 40 | 100.0% |
Occupancy by Ownership by Household Size in Monroe
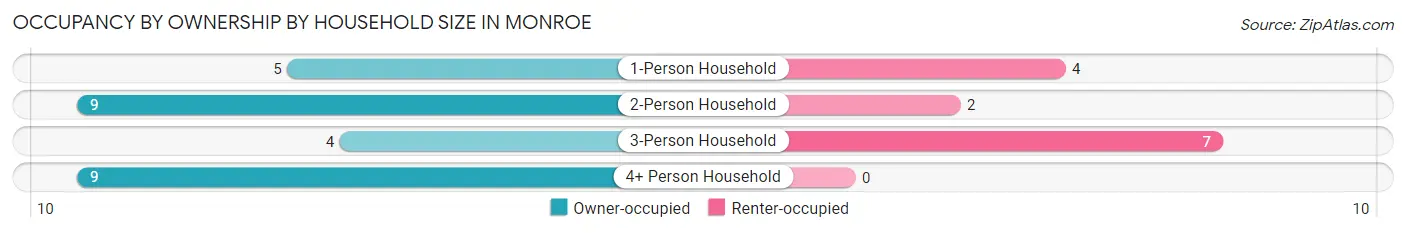
| Household Size | Owner-occupied | Renter-occupied |
| 1-Person Household | 5 (55.6%) | 4 (44.4%) |
| 2-Person Household | 9 (81.8%) | 2 (18.2%) |
| 3-Person Household | 4 (36.4%) | 7 (63.6%) |
| 4+ Person Household | 9 (100.0%) | 0 (0.0%) |
| Total Housing Units | 27 (67.5%) | 13 (32.5%) |
Occupancy by Educational Attainment in Monroe
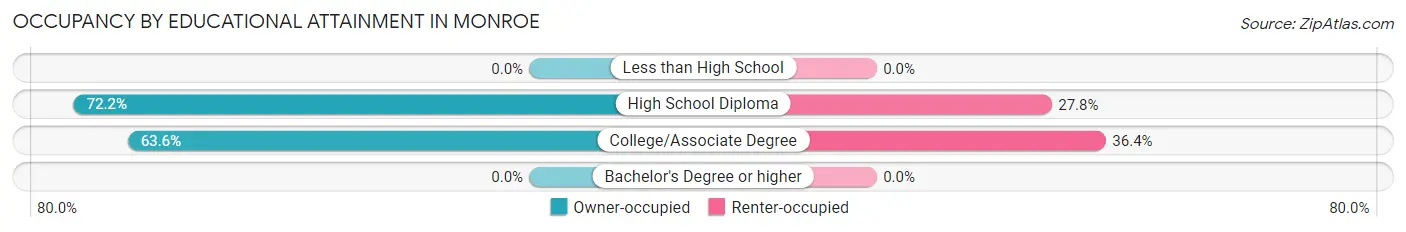
| Household Size | Owner-occupied | Renter-occupied |
| Less than High School | 0 (0.0%) | 0 (0.0%) |
| High School Diploma | 13 (72.2%) | 5 (27.8%) |
| College/Associate Degree | 14 (63.6%) | 8 (36.4%) |
| Bachelor's Degree or higher | 0 (0.0%) | 0 (0.0%) |
Occupancy by Age of Householder in Monroe
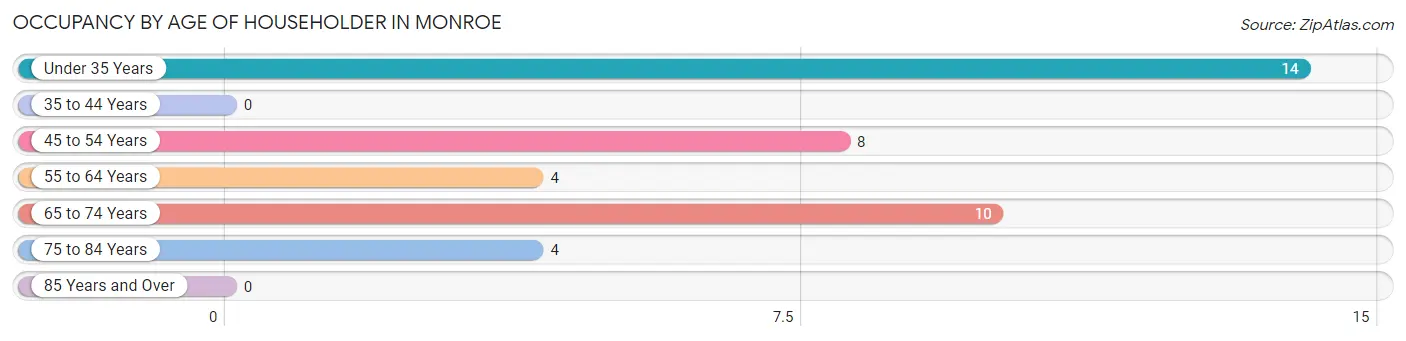
| Age Bracket | # Households | % Households |
| Under 35 Years | 14 | 35.0% |
| 35 to 44 Years | 0 | 0.0% |
| 45 to 54 Years | 8 | 20.0% |
| 55 to 64 Years | 4 | 10.0% |
| 65 to 74 Years | 10 | 25.0% |
| 75 to 84 Years | 4 | 10.0% |
| 85 Years and Over | 0 | 0.0% |
| Total | 40 | 100.0% |
Housing Finances in Monroe
Median Income by Occupancy in Monroe
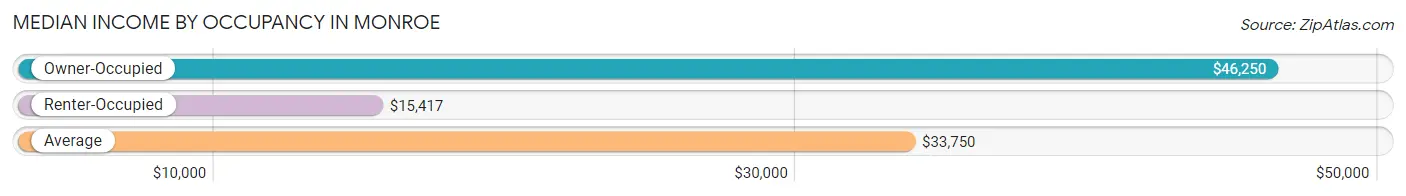
| Occupancy Type | # Households | Median Income |
| Owner-Occupied | 27 (67.5%) | $46,250 |
| Renter-Occupied | 13 (32.5%) | $15,417 |
| Average | 40 (100.0%) | $33,750 |
Occupancy by Householder Income Bracket in Monroe
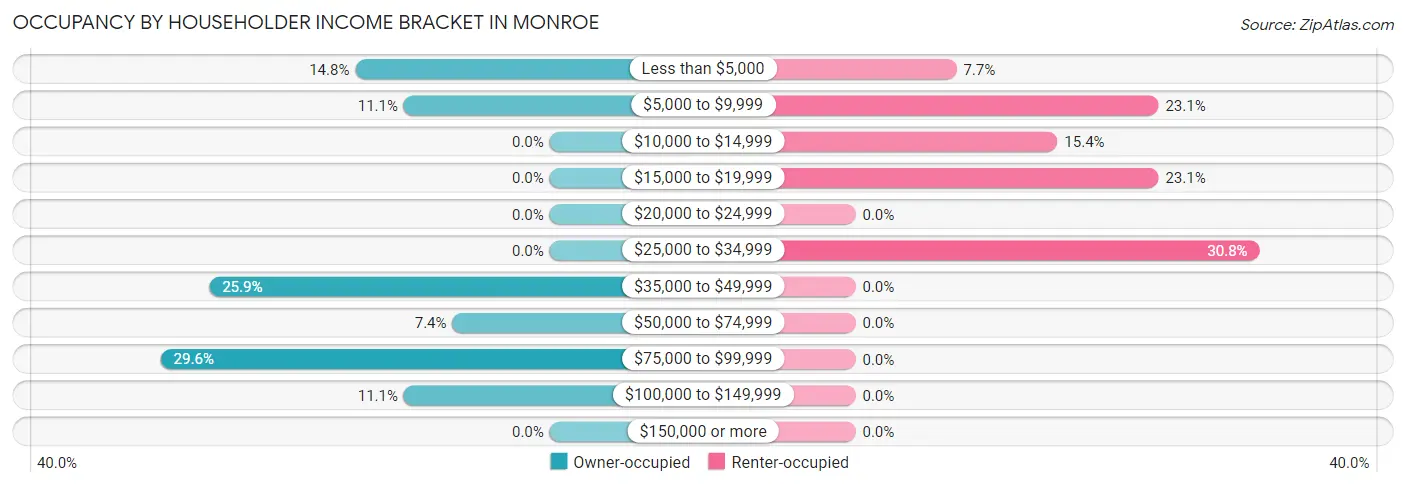
| Income Bracket | Owner-occupied | Renter-occupied |
| Less than $5,000 | 4 (14.8%) | 1 (7.7%) |
| $5,000 to $9,999 | 3 (11.1%) | 3 (23.1%) |
| $10,000 to $14,999 | 0 (0.0%) | 2 (15.4%) |
| $15,000 to $19,999 | 0 (0.0%) | 3 (23.1%) |
| $20,000 to $24,999 | 0 (0.0%) | 0 (0.0%) |
| $25,000 to $34,999 | 0 (0.0%) | 4 (30.8%) |
| $35,000 to $49,999 | 7 (25.9%) | 0 (0.0%) |
| $50,000 to $74,999 | 2 (7.4%) | 0 (0.0%) |
| $75,000 to $99,999 | 8 (29.6%) | 0 (0.0%) |
| $100,000 to $149,999 | 3 (11.1%) | 0 (0.0%) |
| $150,000 or more | 0 (0.0%) | 0 (0.0%) |
| Total | 27 (100.0%) | 13 (100.0%) |
Monthly Housing Cost Tiers in Monroe
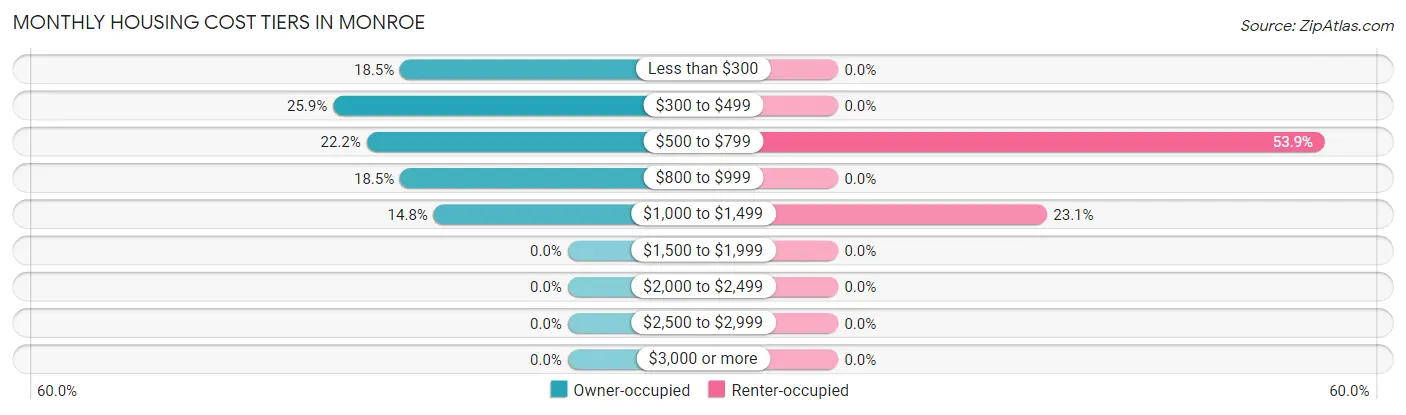
| Monthly Cost | Owner-occupied | Renter-occupied |
| Less than $300 | 5 (18.5%) | 0 (0.0%) |
| $300 to $499 | 7 (25.9%) | 0 (0.0%) |
| $500 to $799 | 6 (22.2%) | 7 (53.8%) |
| $800 to $999 | 5 (18.5%) | 0 (0.0%) |
| $1,000 to $1,499 | 4 (14.8%) | 3 (23.1%) |
| $1,500 to $1,999 | 0 (0.0%) | 0 (0.0%) |
| $2,000 to $2,499 | 0 (0.0%) | 0 (0.0%) |
| $2,500 to $2,999 | 0 (0.0%) | 0 (0.0%) |
| $3,000 or more | 0 (0.0%) | 0 (0.0%) |
| Total | 27 (100.0%) | 13 (100.0%) |
Physical Housing Characteristics in Monroe
Housing Structures in Monroe
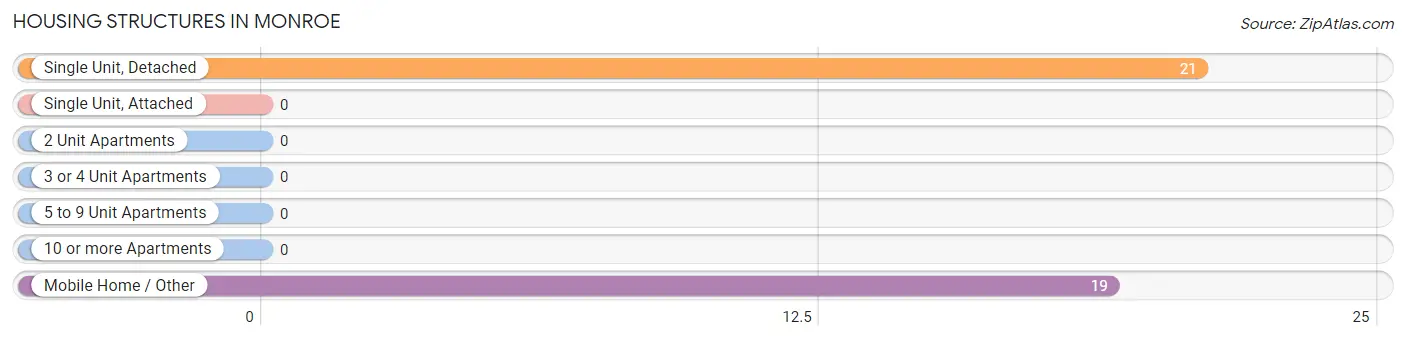
| Structure Type | # Housing Units | % Housing Units |
| Single Unit, Detached | 21 | 52.5% |
| Single Unit, Attached | 0 | 0.0% |
| 2 Unit Apartments | 0 | 0.0% |
| 3 or 4 Unit Apartments | 0 | 0.0% |
| 5 to 9 Unit Apartments | 0 | 0.0% |
| 10 or more Apartments | 0 | 0.0% |
| Mobile Home / Other | 19 | 47.5% |
| Total | 40 | 100.0% |
Housing Structures by Occupancy in Monroe
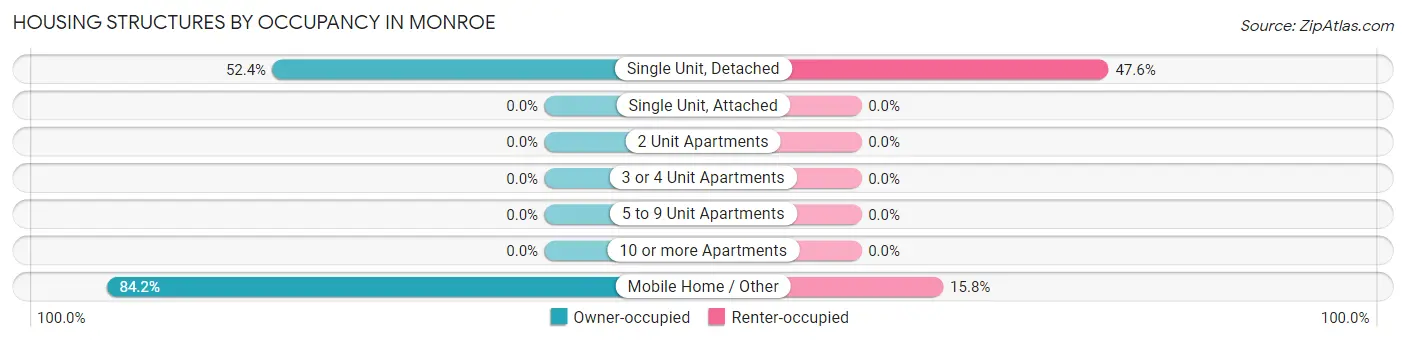
| Structure Type | Owner-occupied | Renter-occupied |
| Single Unit, Detached | 11 (52.4%) | 10 (47.6%) |
| Single Unit, Attached | 0 (0.0%) | 0 (0.0%) |
| 2 Unit Apartments | 0 (0.0%) | 0 (0.0%) |
| 3 or 4 Unit Apartments | 0 (0.0%) | 0 (0.0%) |
| 5 to 9 Unit Apartments | 0 (0.0%) | 0 (0.0%) |
| 10 or more Apartments | 0 (0.0%) | 0 (0.0%) |
| Mobile Home / Other | 16 (84.2%) | 3 (15.8%) |
| Total | 27 (67.5%) | 13 (32.5%) |
Housing Structures by Number of Rooms in Monroe
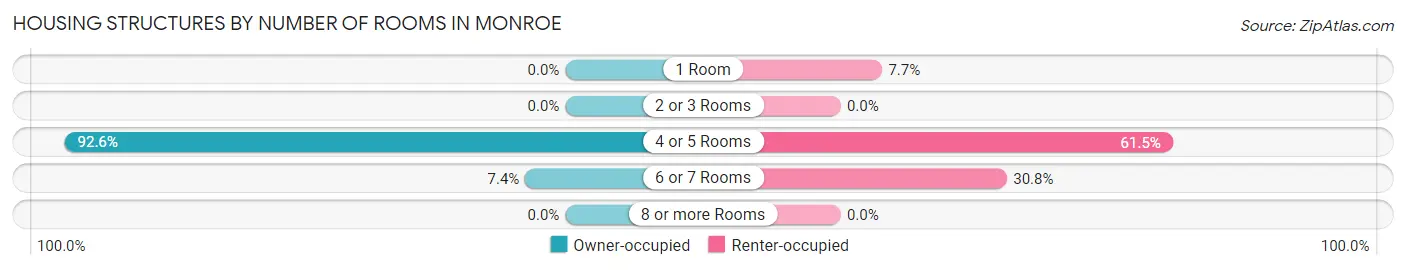
| Number of Rooms | Owner-occupied | Renter-occupied |
| 1 Room | 0 (0.0%) | 1 (7.7%) |
| 2 or 3 Rooms | 0 (0.0%) | 0 (0.0%) |
| 4 or 5 Rooms | 25 (92.6%) | 8 (61.5%) |
| 6 or 7 Rooms | 2 (7.4%) | 4 (30.8%) |
| 8 or more Rooms | 0 (0.0%) | 0 (0.0%) |
| Total | 27 (100.0%) | 13 (100.0%) |
Housing Structure by Heating Type in Monroe
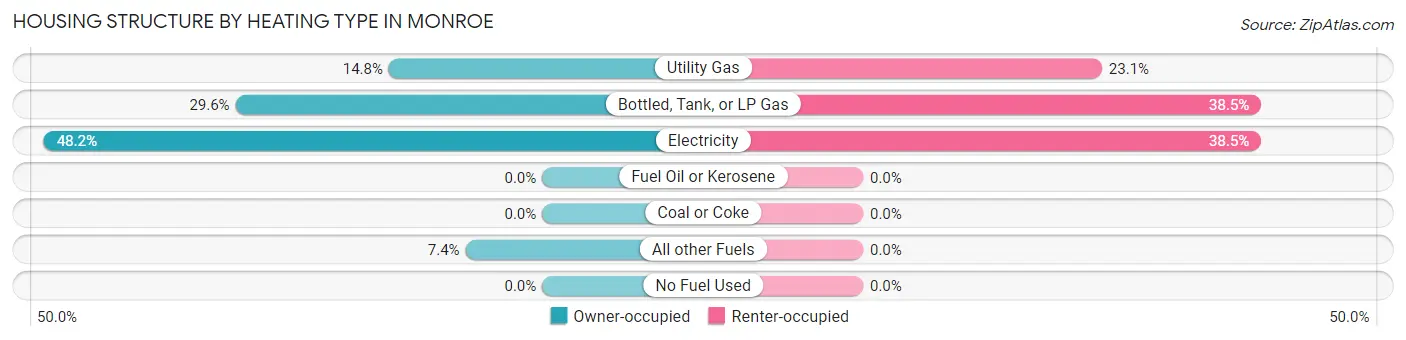
| Heating Type | Owner-occupied | Renter-occupied |
| Utility Gas | 4 (14.8%) | 3 (23.1%) |
| Bottled, Tank, or LP Gas | 8 (29.6%) | 5 (38.5%) |
| Electricity | 13 (48.1%) | 5 (38.5%) |
| Fuel Oil or Kerosene | 0 (0.0%) | 0 (0.0%) |
| Coal or Coke | 0 (0.0%) | 0 (0.0%) |
| All other Fuels | 2 (7.4%) | 0 (0.0%) |
| No Fuel Used | 0 (0.0%) | 0 (0.0%) |
| Total | 27 (100.0%) | 13 (100.0%) |
Household Vehicle Usage in Monroe
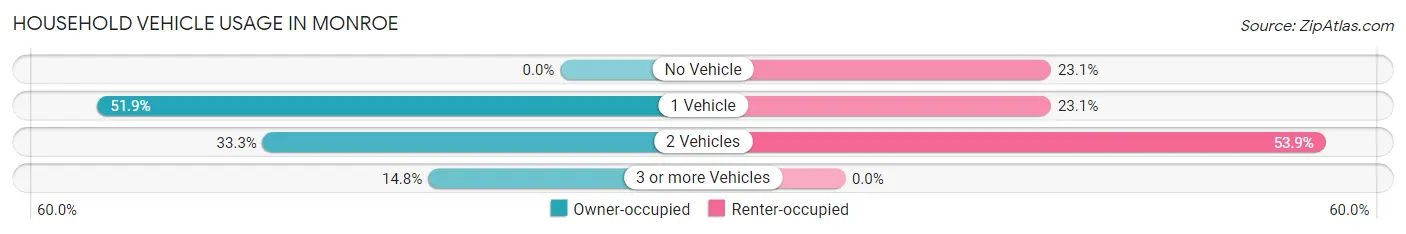
| Vehicles per Household | Owner-occupied | Renter-occupied |
| No Vehicle | 0 (0.0%) | 3 (23.1%) |
| 1 Vehicle | 14 (51.8%) | 3 (23.1%) |
| 2 Vehicles | 9 (33.3%) | 7 (53.8%) |
| 3 or more Vehicles | 4 (14.8%) | 0 (0.0%) |
| Total | 27 (100.0%) | 13 (100.0%) |
Real Estate & Mortgages in Monroe
Real Estate and Mortgage Overview in Monroe
| Characteristic | Without Mortgage | With Mortgage |
| Housing Units | 19 | 8 |
| Median Property Value | $92,500 | $0 |
| Median Household Income | - | - |
| Monthly Housing Costs | $417 | $0 |
| Real Estate Taxes | $1,031 | $0 |
Property Value by Mortgage Status in Monroe
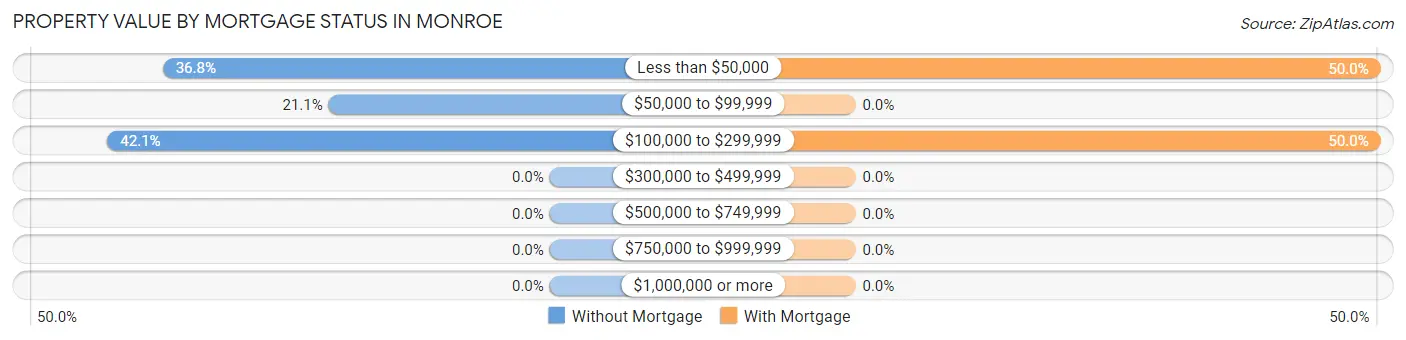
| Property Value | Without Mortgage | With Mortgage |
| Less than $50,000 | 7 (36.8%) | 4 (50.0%) |
| $50,000 to $99,999 | 4 (21.0%) | 0 (0.0%) |
| $100,000 to $299,999 | 8 (42.1%) | 4 (50.0%) |
| $300,000 to $499,999 | 0 (0.0%) | 0 (0.0%) |
| $500,000 to $749,999 | 0 (0.0%) | 0 (0.0%) |
| $750,000 to $999,999 | 0 (0.0%) | 0 (0.0%) |
| $1,000,000 or more | 0 (0.0%) | 0 (0.0%) |
| Total | 19 (100.0%) | 8 (100.0%) |
Household Income by Mortgage Status in Monroe
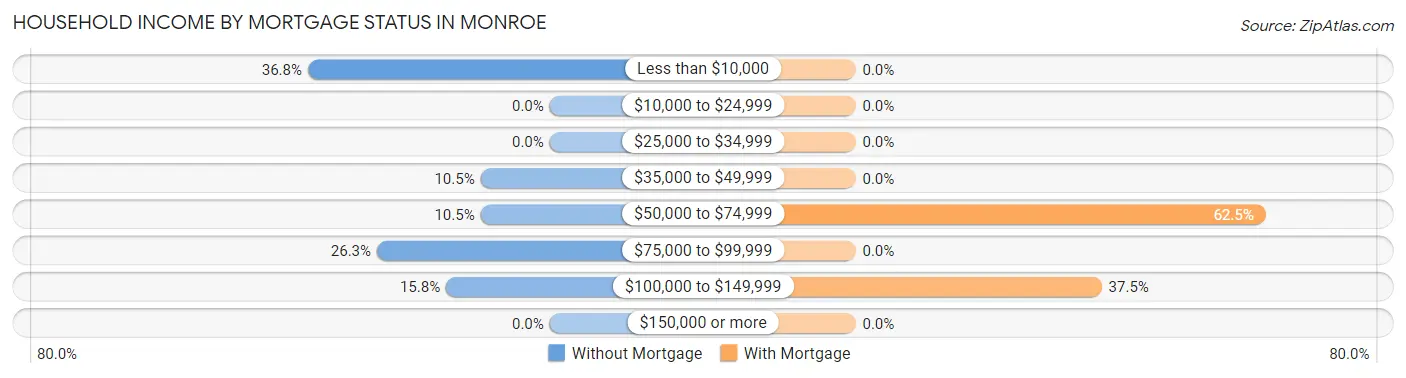
| Household Income | Without Mortgage | With Mortgage |
| Less than $10,000 | 7 (36.8%) | 0 (0.0%) |
| $10,000 to $24,999 | 0 (0.0%) | 0 (0.0%) |
| $25,000 to $34,999 | 0 (0.0%) | 0 (0.0%) |
| $35,000 to $49,999 | 2 (10.5%) | 0 (0.0%) |
| $50,000 to $74,999 | 2 (10.5%) | 5 (62.5%) |
| $75,000 to $99,999 | 5 (26.3%) | 0 (0.0%) |
| $100,000 to $149,999 | 3 (15.8%) | 3 (37.5%) |
| $150,000 or more | 0 (0.0%) | 0 (0.0%) |
| Total | 19 (100.0%) | 8 (100.0%) |
Property Value to Household Income Ratio in Monroe
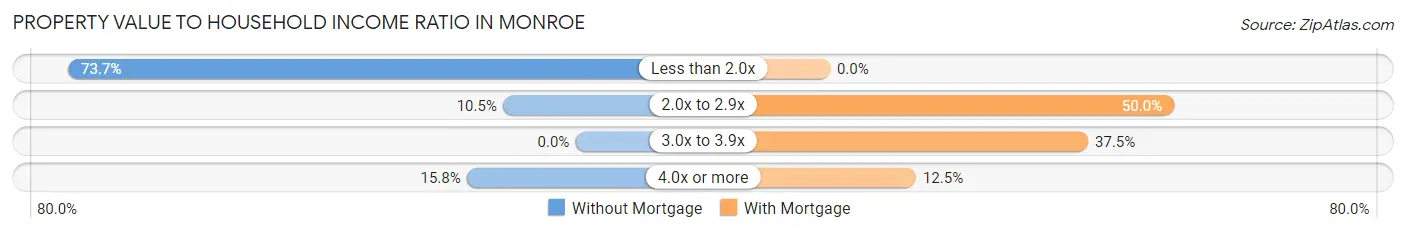
| Value-to-Income Ratio | Without Mortgage | With Mortgage |
| Less than 2.0x | 14 (73.7%) | 0 (0.0%) |
| 2.0x to 2.9x | 2 (10.5%) | 4 (50.0%) |
| 3.0x to 3.9x | 0 (0.0%) | 3 (37.5%) |
| 4.0x or more | 3 (15.8%) | 1 (12.5%) |
| Total | 19 (100.0%) | 8 (100.0%) |
Real Estate Taxes by Mortgage Status in Monroe
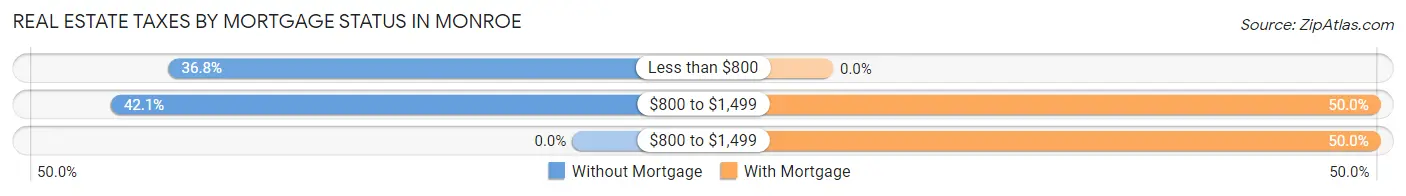
| Property Taxes | Without Mortgage | With Mortgage |
| Less than $800 | 7 (36.8%) | 0 (0.0%) |
| $800 to $1,499 | 8 (42.1%) | 4 (50.0%) |
| $800 to $1,499 | 0 (0.0%) | 4 (50.0%) |
| Total | 19 (100.0%) | 8 (100.0%) |
Health & Disability in Monroe
Health Insurance Coverage by Age in Monroe
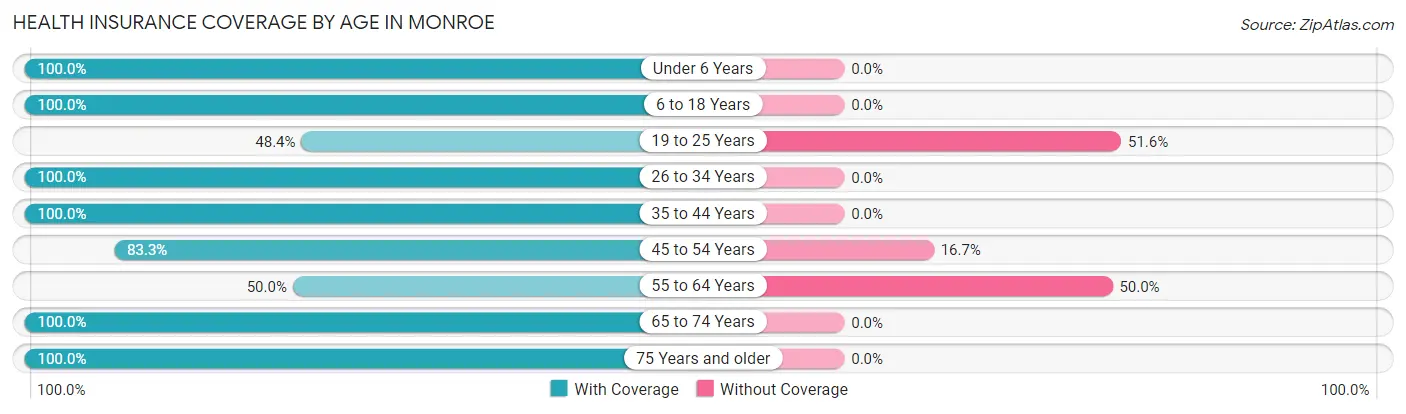
| Age Bracket | With Coverage | Without Coverage |
| Under 6 Years | 23 (100.0%) | 0 (0.0%) |
| 6 to 18 Years | 25 (100.0%) | 0 (0.0%) |
| 19 to 25 Years | 15 (48.4%) | 16 (51.6%) |
| 26 to 34 Years | 4 (100.0%) | 0 (0.0%) |
| 35 to 44 Years | 4 (100.0%) | 0 (0.0%) |
| 45 to 54 Years | 10 (83.3%) | 2 (16.7%) |
| 55 to 64 Years | 5 (50.0%) | 5 (50.0%) |
| 65 to 74 Years | 13 (100.0%) | 0 (0.0%) |
| 75 Years and older | 10 (100.0%) | 0 (0.0%) |
| Total | 109 (82.6%) | 23 (17.4%) |
Health Insurance Coverage by Citizenship Status in Monroe
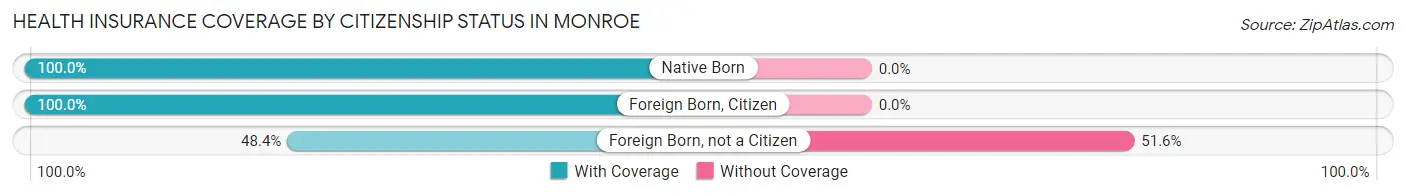
| Citizenship Status | With Coverage | Without Coverage |
| Native Born | 23 (100.0%) | 0 (0.0%) |
| Foreign Born, Citizen | 25 (100.0%) | 0 (0.0%) |
| Foreign Born, not a Citizen | 15 (48.4%) | 16 (51.6%) |
Health Insurance Coverage by Household Income in Monroe
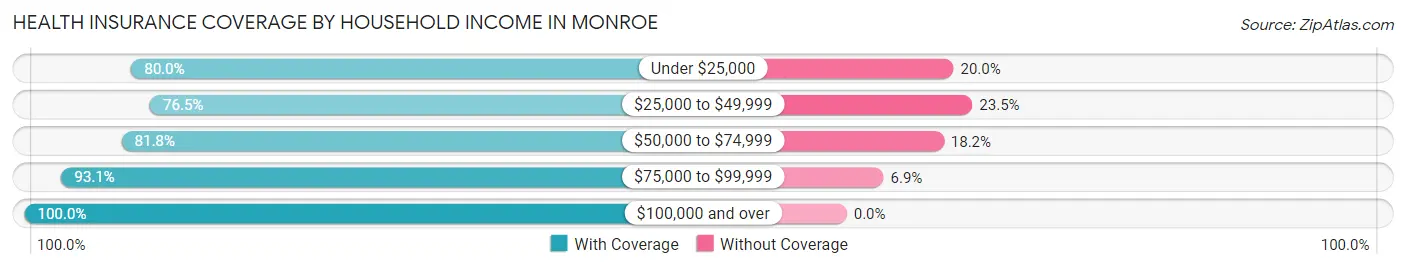
| Household Income | With Coverage | Without Coverage |
| Under $25,000 | 28 (80.0%) | 7 (20.0%) |
| $25,000 to $49,999 | 39 (76.5%) | 12 (23.5%) |
| $50,000 to $74,999 | 9 (81.8%) | 2 (18.2%) |
| $75,000 to $99,999 | 27 (93.1%) | 2 (6.9%) |
| $100,000 and over | 6 (100.0%) | 0 (0.0%) |
Public vs Private Health Insurance Coverage by Age in Monroe
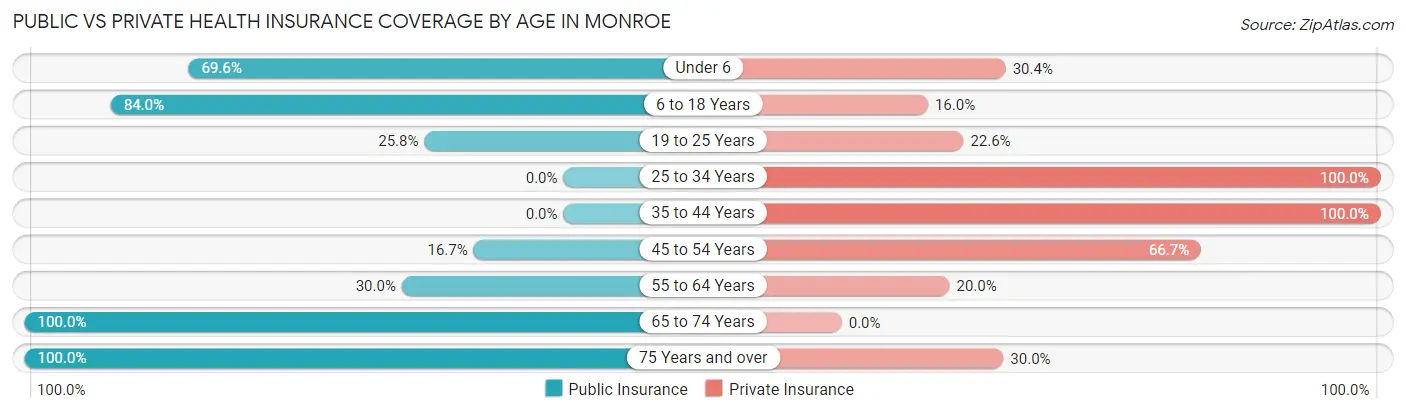
| Age Bracket | Public Insurance | Private Insurance |
| Under 6 | 16 (69.6%) | 7 (30.4%) |
| 6 to 18 Years | 21 (84.0%) | 4 (16.0%) |
| 19 to 25 Years | 8 (25.8%) | 7 (22.6%) |
| 25 to 34 Years | 0 (0.0%) | 4 (100.0%) |
| 35 to 44 Years | 0 (0.0%) | 4 (100.0%) |
| 45 to 54 Years | 2 (16.7%) | 8 (66.7%) |
| 55 to 64 Years | 3 (30.0%) | 2 (20.0%) |
| 65 to 74 Years | 13 (100.0%) | 0 (0.0%) |
| 75 Years and over | 10 (100.0%) | 3 (30.0%) |
| Total | 73 (55.3%) | 39 (29.5%) |
Disability Status by Sex by Age in Monroe
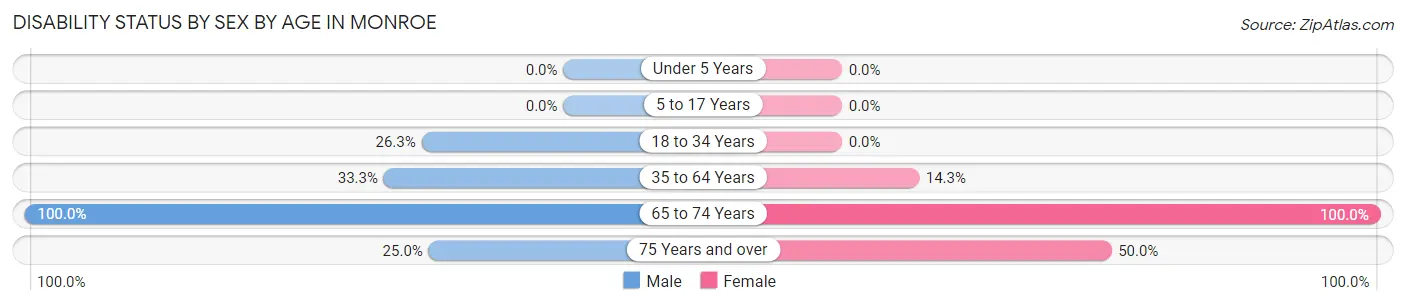
| Age Bracket | Male | Female |
| Under 5 Years | 0 (0.0%) | 0 (0.0%) |
| 5 to 17 Years | 0 (0.0%) | 0 (0.0%) |
| 18 to 34 Years | 5 (26.3%) | 0 (0.0%) |
| 35 to 64 Years | 4 (33.3%) | 2 (14.3%) |
| 65 to 74 Years | 7 (100.0%) | 6 (100.0%) |
| 75 Years and over | 1 (25.0%) | 3 (50.0%) |
Disability Class by Sex by Age in Monroe
Disability Class: Hearing Difficulty
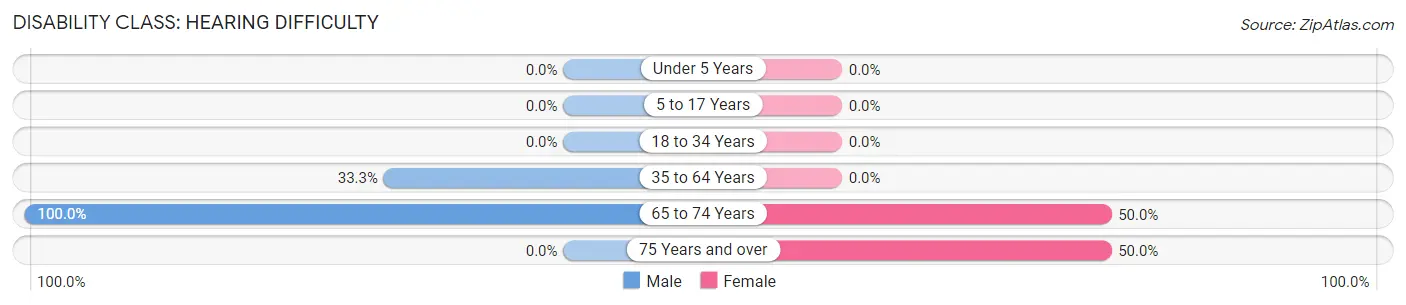
| Age Bracket | Male | Female |
| Under 5 Years | 0 (0.0%) | 0 (0.0%) |
| 5 to 17 Years | 0 (0.0%) | 0 (0.0%) |
| 18 to 34 Years | 0 (0.0%) | 0 (0.0%) |
| 35 to 64 Years | 4 (33.3%) | 0 (0.0%) |
| 65 to 74 Years | 7 (100.0%) | 3 (50.0%) |
| 75 Years and over | 0 (0.0%) | 3 (50.0%) |
Disability Class: Vision Difficulty
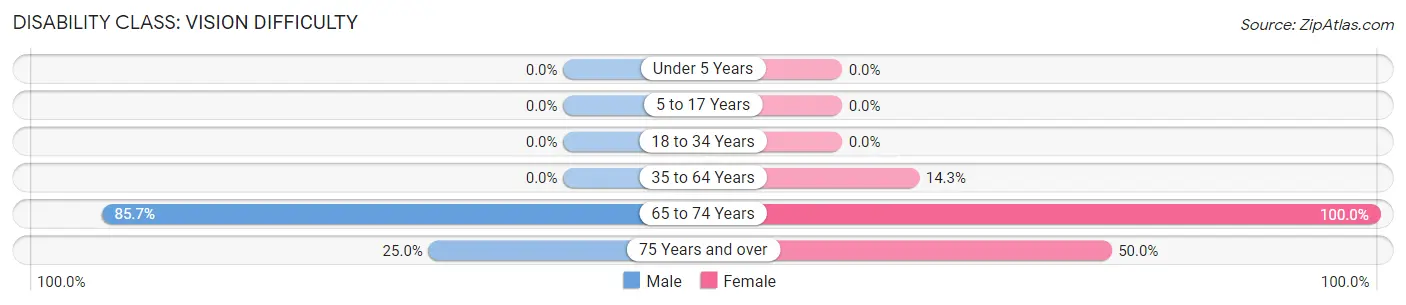
| Age Bracket | Male | Female |
| Under 5 Years | 0 (0.0%) | 0 (0.0%) |
| 5 to 17 Years | 0 (0.0%) | 0 (0.0%) |
| 18 to 34 Years | 0 (0.0%) | 0 (0.0%) |
| 35 to 64 Years | 0 (0.0%) | 2 (14.3%) |
| 65 to 74 Years | 6 (85.7%) | 6 (100.0%) |
| 75 Years and over | 1 (25.0%) | 3 (50.0%) |
Disability Class: Cognitive Difficulty
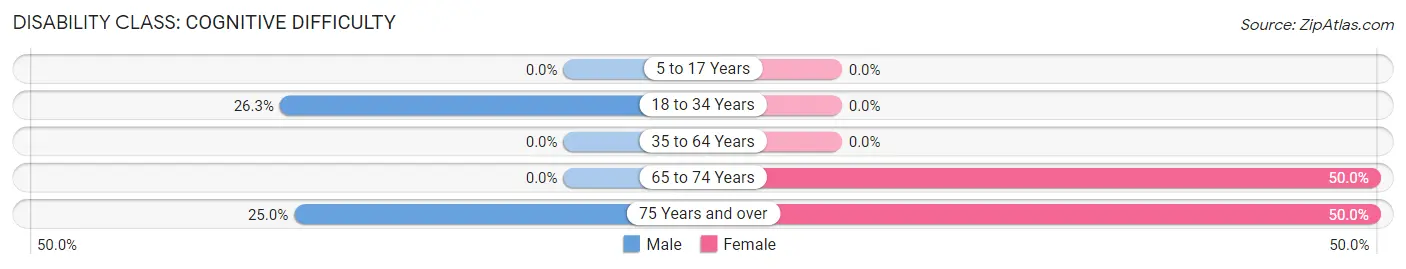
| Age Bracket | Male | Female |
| 5 to 17 Years | 0 (0.0%) | 0 (0.0%) |
| 18 to 34 Years | 5 (26.3%) | 0 (0.0%) |
| 35 to 64 Years | 0 (0.0%) | 0 (0.0%) |
| 65 to 74 Years | 0 (0.0%) | 3 (50.0%) |
| 75 Years and over | 1 (25.0%) | 3 (50.0%) |
Disability Class: Ambulatory Difficulty
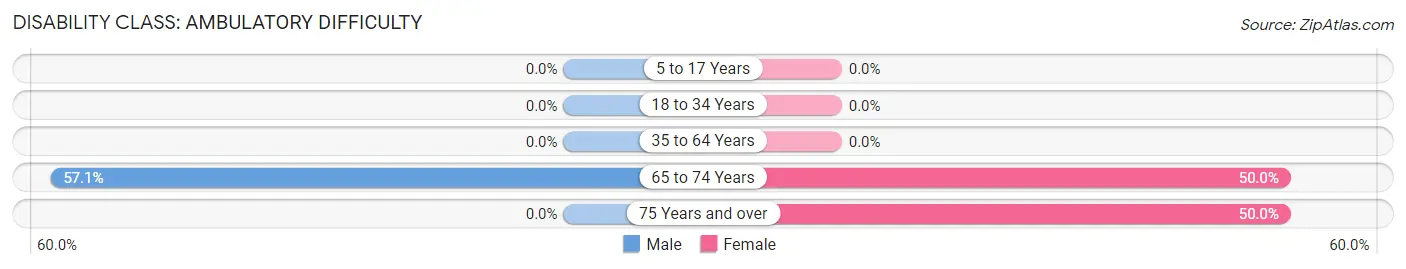
| Age Bracket | Male | Female |
| 5 to 17 Years | 0 (0.0%) | 0 (0.0%) |
| 18 to 34 Years | 0 (0.0%) | 0 (0.0%) |
| 35 to 64 Years | 0 (0.0%) | 0 (0.0%) |
| 65 to 74 Years | 4 (57.1%) | 3 (50.0%) |
| 75 Years and over | 0 (0.0%) | 3 (50.0%) |
Disability Class: Self-Care Difficulty
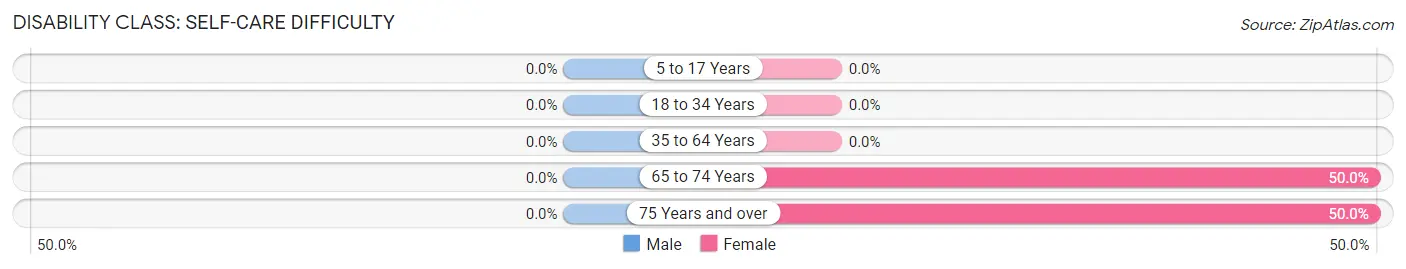
| Age Bracket | Male | Female |
| 5 to 17 Years | 0 (0.0%) | 0 (0.0%) |
| 18 to 34 Years | 0 (0.0%) | 0 (0.0%) |
| 35 to 64 Years | 0 (0.0%) | 0 (0.0%) |
| 65 to 74 Years | 0 (0.0%) | 3 (50.0%) |
| 75 Years and over | 0 (0.0%) | 3 (50.0%) |
Technology Access in Monroe
Computing Device Access in Monroe
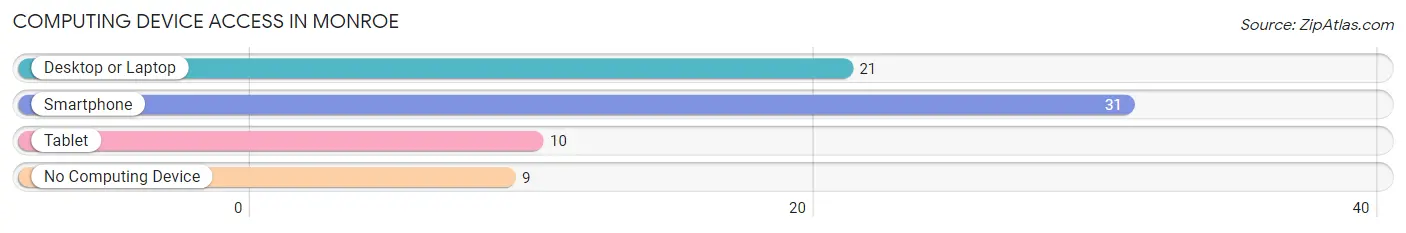
| Device Type | # Households | % Households |
| Desktop or Laptop | 21 | 52.5% |
| Smartphone | 31 | 77.5% |
| Tablet | 10 | 25.0% |
| No Computing Device | 9 | 22.5% |
| Total | 40 | 100.0% |
Internet Access in Monroe
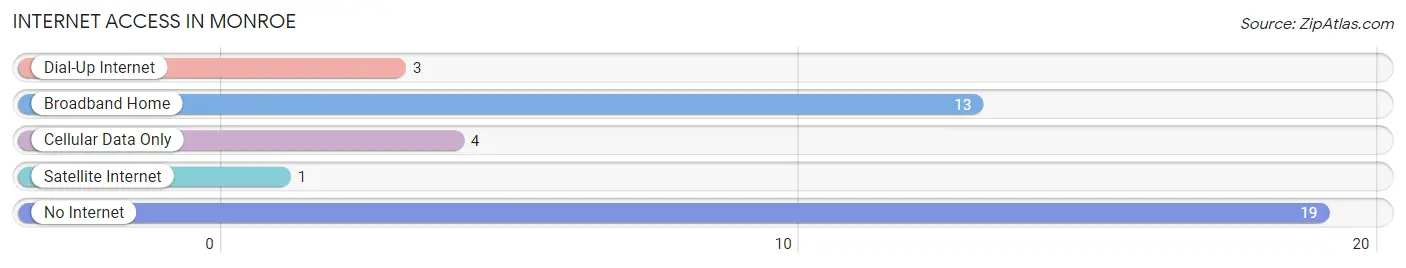
| Internet Type | # Households | % Households |
| Dial-Up Internet | 3 | 7.5% |
| Broadband Home | 13 | 32.5% |
| Cellular Data Only | 4 | 10.0% |
| Satellite Internet | 1 | 2.5% |
| No Internet | 19 | 47.5% |
| Total | 40 | 100.0% |
Monroe Summary
Monroe, Oklahoma is a small town located in the southeastern corner of the state. It is situated in the foothills of the Ouachita Mountains and is part of the Ouachita National Forest. The town is located in LeFlore County and is approximately 20 miles from the Arkansas border. The population of Monroe in 2000 was 1,093.
History
Monroe was founded in 1872 by a group of settlers from Arkansas. The town was named after James Monroe, the fifth president of the United States. The town was originally a farming community and the main crops were cotton, corn, and wheat. In the early 1900s, the town began to grow and the population increased. The town was incorporated in 1910 and the first mayor was elected in 1911.
In the 1920s, the town began to experience an economic boom due to the discovery of oil in the area. This led to the construction of several oil refineries and other businesses. The population of Monroe increased significantly during this time and the town became a major center for oil production.
In the 1950s, the town began to experience a decline in population as the oil industry began to decline. The town was also affected by the Great Depression and World War II. The population of Monroe decreased significantly during this time and the town experienced a period of economic decline.
In the 1970s, the town began to experience a resurgence in population and economic activity. The town was revitalized by the construction of a new school and the opening of several businesses. The population of Monroe increased significantly during this time and the town experienced a period of economic growth.
Geography
Monroe is located in the southeastern corner of Oklahoma in LeFlore County. The town is situated in the foothills of the Ouachita Mountains and is part of the Ouachita National Forest. The town is located approximately 20 miles from the Arkansas border. The town is located at an elevation of 845 feet above sea level.
The climate in Monroe is classified as humid subtropical. The average temperature in the summer is around 90 degrees Fahrenheit and the average temperature in the winter is around 40 degrees Fahrenheit. The town receives an average of 48 inches of precipitation per year.
Economy
The economy of Monroe is largely based on agriculture and tourism. The town is home to several farms that produce cotton, corn, and wheat. The town is also home to several tourist attractions, including the Ouachita National Forest and the nearby Lake Wister State Park.
The town is also home to several businesses, including a grocery store, a hardware store, and several restaurants. The town is also home to several manufacturing companies, including a furniture factory and a plastics factory.
Demographics
In 2000, the population of Monroe was 1,093. The racial makeup of the town was 95.3% White, 0.7% African American, 0.7% Native American, 0.3% Asian, and 2.9% from other races. The median household income in 2000 was $25,938. The median age of the population was 37.7 years.
Common Questions
What is Per Capita Income in Monroe?
Per Capita income in Monroe is $14,245.
What is the Median Family Income in Monroe?
Median Family Income in Monroe is $39,063.
What is the Median Household income in Monroe?
Median Household Income in Monroe is $33,750.
What is Inequality or Gini Index in Monroe?
Inequality or Gini Index in Monroe is 0.47.
What is the Total Population of Monroe?
Total Population of Monroe is 132.
What is the Total Male Population of Monroe?
Total Male Population of Monroe is 72.
What is the Total Female Population of Monroe?
Total Female Population of Monroe is 60.
What is the Ratio of Males per 100 Females in Monroe?
There are 120.00 Males per 100 Females in Monroe.
What is the Ratio of Females per 100 Males in Monroe?
There are 83.33 Females per 100 Males in Monroe.
What is the Median Population Age in Monroe?
Median Population Age in Monroe is 21.9 Years.
What is the Average Family Size in Monroe
Average Family Size in Monroe is 4.0 People.
What is the Average Household Size in Monroe
Average Household Size in Monroe is 3.3 People.
How Large is the Labor Force in Monroe?
There are 41 People in the Labor Forcein in Monroe.
What is the Percentage of People in the Labor Force in Monroe?
45.6% of People are in the Labor Force in Monroe.
What is the Unemployment Rate in Monroe?
Unemployment Rate in Monroe is 46.3%.