Edmonson, TX Map & Demographics
Edmonson Map
Edmonson Overview
$19,032
PER CAPITA INCOME
$70,714
AVG FAMILY INCOME
$48,194
AVG HOUSEHOLD INCOME
7.4%
WAGE / INCOME GAP [ % ]
92.6¢/ $1
WAGE / INCOME GAP [ $ ]
0.20
INEQUALITY / GINI INDEX
114
TOTAL POPULATION
66
MALE POPULATION
48
FEMALE POPULATION
137.50
MALES / 100 FEMALES
72.73
FEMALES / 100 MALES
34.1
MEDIAN AGE
4.5
AVG FAMILY SIZE
2.6
AVG HOUSEHOLD SIZE
55
LABOR FORCE [ PEOPLE ]
70.5%
PERCENT IN LABOR FORCE
3.6%
UNEMPLOYMENT RATE
Edmonson Zip Codes
Edmonson Area Codes
Income in Edmonson
Income Overview in Edmonson
Per Capita Income in Edmonson is $19,032, while median incomes of families and households are $70,714 and $48,194 respectively.
| Characteristic | Number | Measure |
| Per Capita Income | 114 | $19,032 |
| Median Family Income | 20 | $70,714 |
| Mean Family Income | 20 | $59,895 |
| Median Household Income | 43 | $48,194 |
| Mean Household Income | 43 | $48,167 |
| Income Deficit | 20 | $0 |
| Wage / Income Gap (%) | 114 | 7.39% |
| Wage / Income Gap ($) | 114 | 92.61¢ per $1 |
| Gini / Inequality Index | 114 | 0.20 |
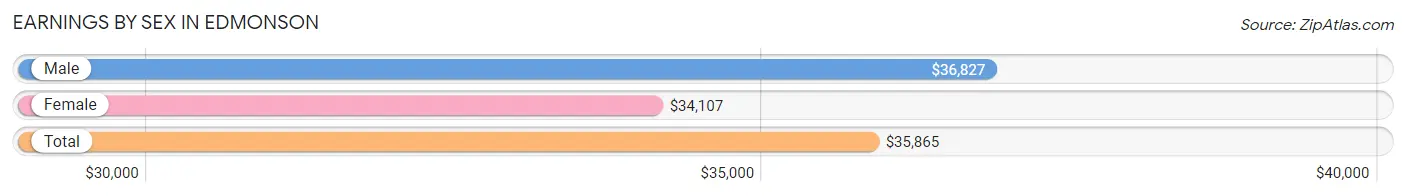
Earnings by Sex in Edmonson
Average Earnings in Edmonson are $35,865, $36,827 for men and $34,107 for women, a difference of 7.4%.
| Sex | Number | Average Earnings |
| Male | 35 (66.0%) | $36,827 |
| Female | 18 (34.0%) | $34,107 |
| Total | 53 (100.0%) | $35,865 |
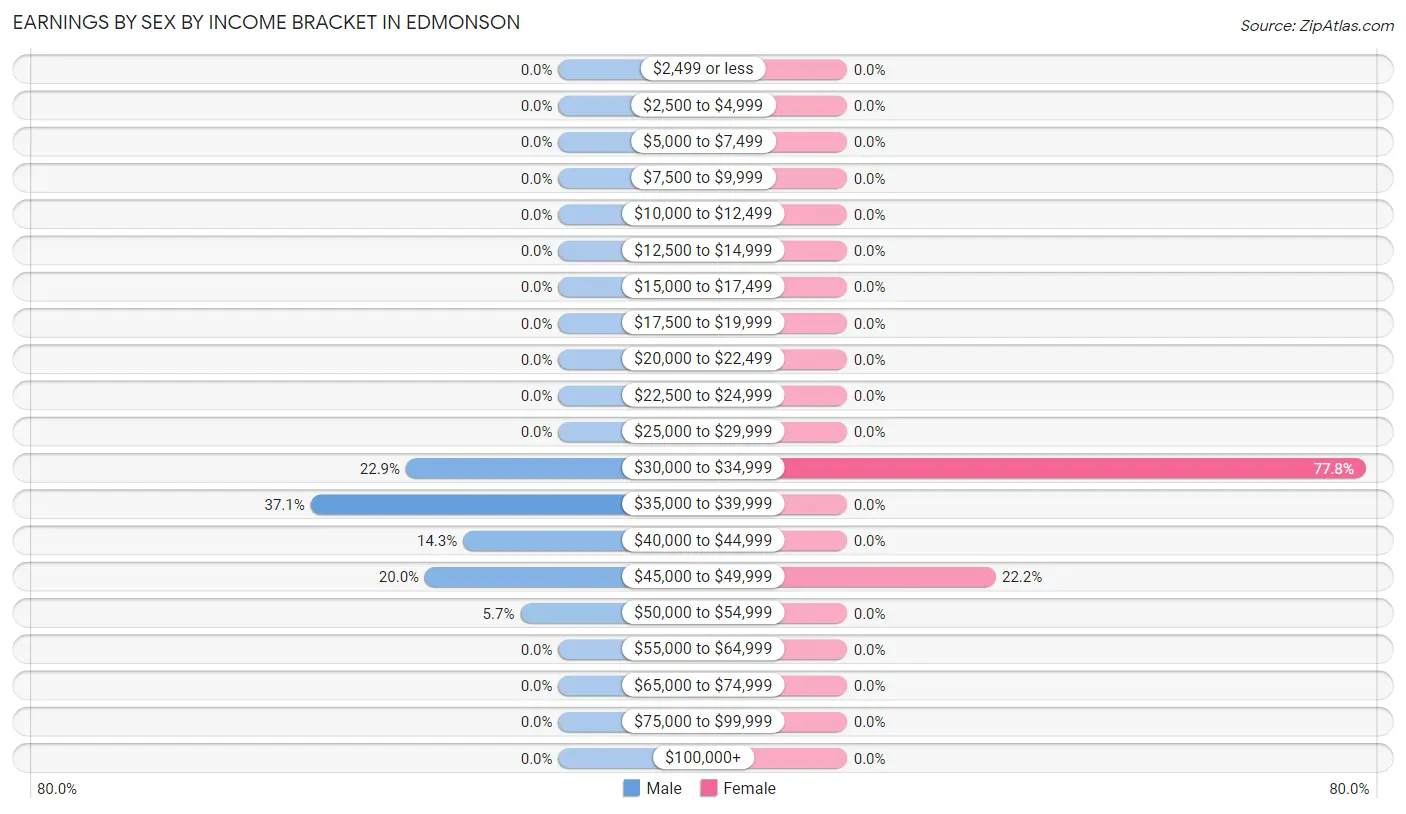
Earnings by Sex by Income Bracket in Edmonson
The most common earnings brackets in Edmonson are $35,000 to $39,999 for men (13 | 37.1%) and $30,000 to $34,999 for women (14 | 77.8%).
| Income | Male | Female |
| $2,499 or less | 0 (0.0%) | 0 (0.0%) |
| $2,500 to $4,999 | 0 (0.0%) | 0 (0.0%) |
| $5,000 to $7,499 | 0 (0.0%) | 0 (0.0%) |
| $7,500 to $9,999 | 0 (0.0%) | 0 (0.0%) |
| $10,000 to $12,499 | 0 (0.0%) | 0 (0.0%) |
| $12,500 to $14,999 | 0 (0.0%) | 0 (0.0%) |
| $15,000 to $17,499 | 0 (0.0%) | 0 (0.0%) |
| $17,500 to $19,999 | 0 (0.0%) | 0 (0.0%) |
| $20,000 to $22,499 | 0 (0.0%) | 0 (0.0%) |
| $22,500 to $24,999 | 0 (0.0%) | 0 (0.0%) |
| $25,000 to $29,999 | 0 (0.0%) | 0 (0.0%) |
| $30,000 to $34,999 | 8 (22.9%) | 14 (77.8%) |
| $35,000 to $39,999 | 13 (37.1%) | 0 (0.0%) |
| $40,000 to $44,999 | 5 (14.3%) | 0 (0.0%) |
| $45,000 to $49,999 | 7 (20.0%) | 4 (22.2%) |
| $50,000 to $54,999 | 2 (5.7%) | 0 (0.0%) |
| $55,000 to $64,999 | 0 (0.0%) | 0 (0.0%) |
| $65,000 to $74,999 | 0 (0.0%) | 0 (0.0%) |
| $75,000 to $99,999 | 0 (0.0%) | 0 (0.0%) |
| $100,000+ | 0 (0.0%) | 0 (0.0%) |
| Total | 35 (100.0%) | 18 (100.0%) |
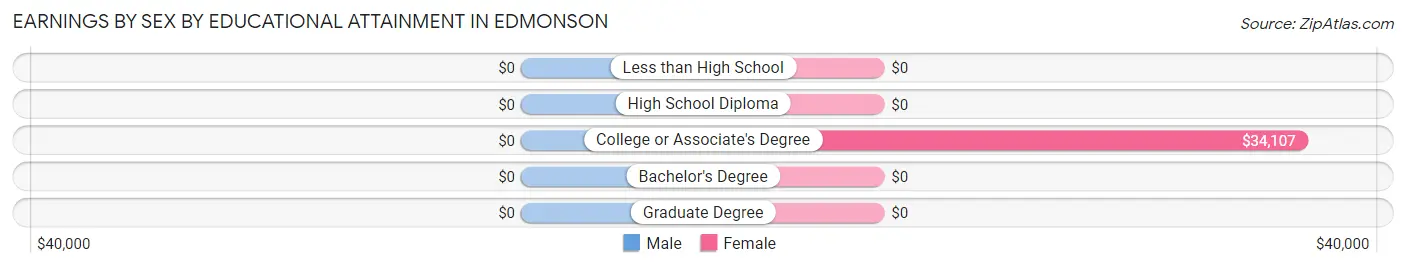
Earnings by Sex by Educational Attainment in Edmonson
| Educational Attainment | Male Income | Female Income |
| Less than High School | - | - |
| High School Diploma | - | - |
| College or Associate's Degree | - | - |
| Bachelor's Degree | - | - |
| Graduate Degree | - | - |
| Total | $36,635 | $34,107 |
Family Income in Edmonson
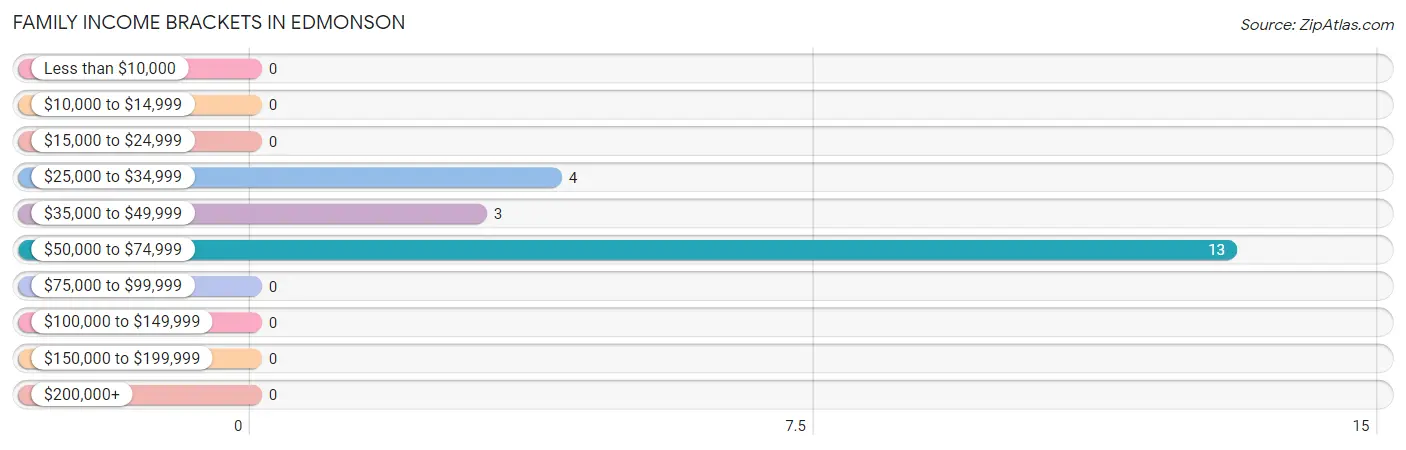
Family Income Brackets in Edmonson
According to the Edmonson family income data, there are 13 families falling into the $50,000 to $74,999 income range, which is the most common income bracket and makes up 65.0% of all families.
| Income Bracket | # Families | % Families |
| Less than $10,000 | 0 | 0.0% |
| $10,000 to $14,999 | 0 | 0.0% |
| $15,000 to $24,999 | 0 | 0.0% |
| $25,000 to $34,999 | 4 | 20.0% |
| $35,000 to $49,999 | 3 | 15.0% |
| $50,000 to $74,999 | 13 | 65.0% |
| $75,000 to $99,999 | 0 | 0.0% |
| $100,000 to $149,999 | 0 | 0.0% |
| $150,000 to $199,999 | 0 | 0.0% |
| $200,000+ | 0 | 0.0% |
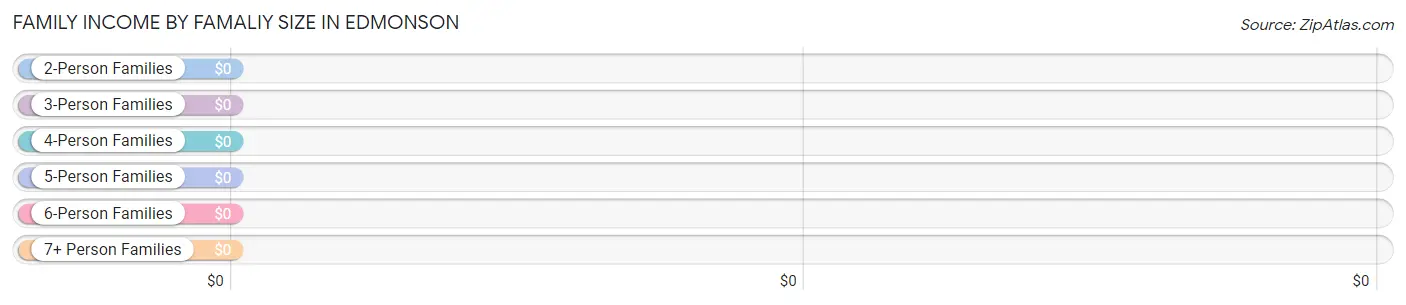
Family Income by Famaliy Size in Edmonson
| Income Bracket | # Families | Median Income |
| 2-Person Families | 2 (10.0%) | $0 |
| 3-Person Families | 6 (30.0%) | $0 |
| 4-Person Families | 7 (35.0%) | $0 |
| 5-Person Families | 0 (0.0%) | $0 |
| 6-Person Families | 5 (25.0%) | $0 |
| 7+ Person Families | 0 (0.0%) | $0 |
| Total | 20 (100.0%) | $70,714 |
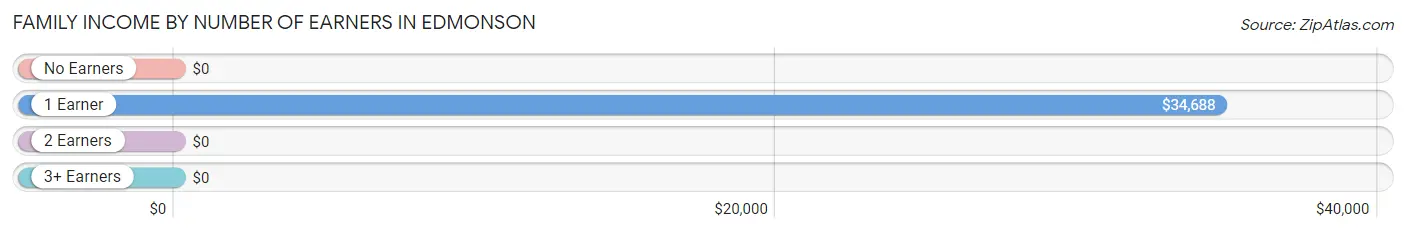
Family Income by Number of Earners in Edmonson
| Number of Earners | # Families | Median Income |
| No Earners | 1 (5.0%) | $0 |
| 1 Earner | 7 (35.0%) | $34,688 |
| 2 Earners | 12 (60.0%) | $0 |
| 3+ Earners | 0 (0.0%) | $0 |
| Total | 20 (100.0%) | $70,714 |
Household Income in Edmonson
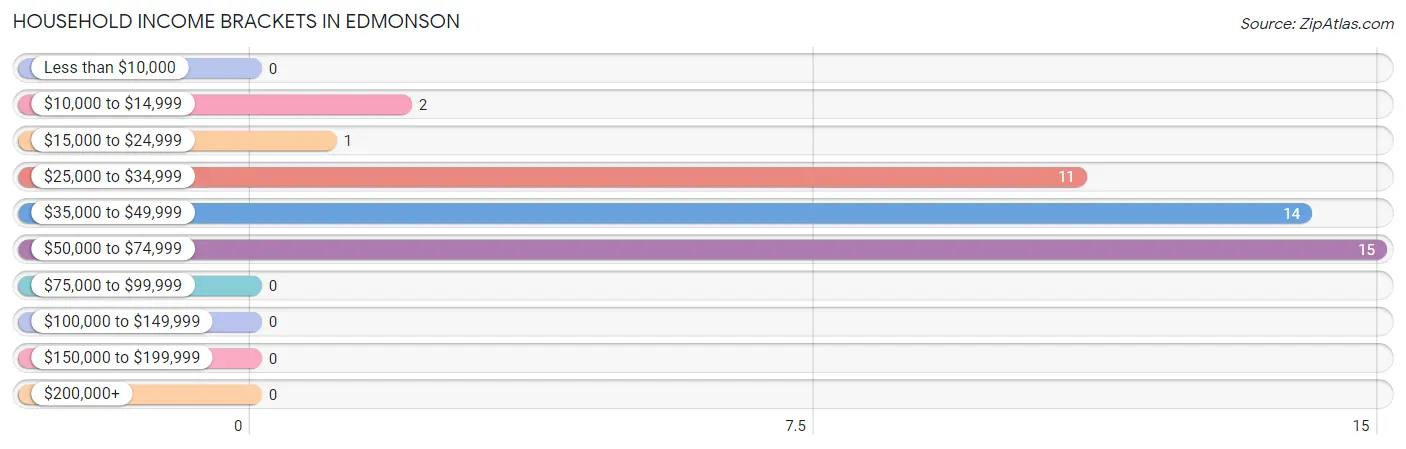
Household Income Brackets in Edmonson
With 15 households falling in the category, the $50,000 to $74,999 income range is the most frequent in Edmonson, accounting for 34.9% of all households.
| Income Bracket | # Households | % Households |
| Less than $10,000 | 0 | 0.0% |
| $10,000 to $14,999 | 2 | 4.7% |
| $15,000 to $24,999 | 1 | 2.3% |
| $25,000 to $34,999 | 11 | 25.6% |
| $35,000 to $49,999 | 14 | 32.6% |
| $50,000 to $74,999 | 15 | 34.9% |
| $75,000 to $99,999 | 0 | 0.0% |
| $100,000 to $149,999 | 0 | 0.0% |
| $150,000 to $199,999 | 0 | 0.0% |
| $200,000+ | 0 | 0.0% |
Household Income by Householder Age in Edmonson
The median household income in Edmonson is $48,194, with the highest median household income of $73,000 found in the 45 to 64 years age bracket for the primary householder. A total of 8 households (18.6%) fall into this category. Meanwhile, the 15 to 24 years age bracket for the primary householder has the lowest median household income of $0, with 4 households (9.3%) in this group.
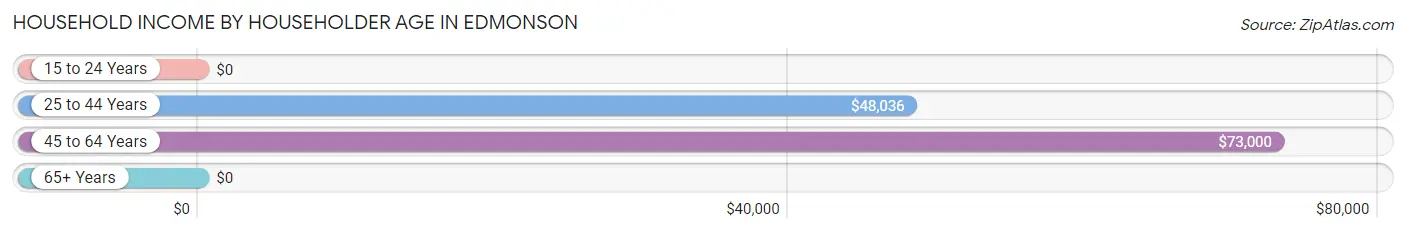
| Income Bracket | # Households | Median Income |
| 15 to 24 Years | 4 (9.3%) | $0 |
| 25 to 44 Years | 25 (58.1%) | $48,036 |
| 45 to 64 Years | 8 (18.6%) | $73,000 |
| 65+ Years | 6 (14.0%) | $0 |
| Total | 43 (100.0%) | $48,194 |
Poverty in Edmonson
Income Below Poverty by Sex and Age in Edmonson
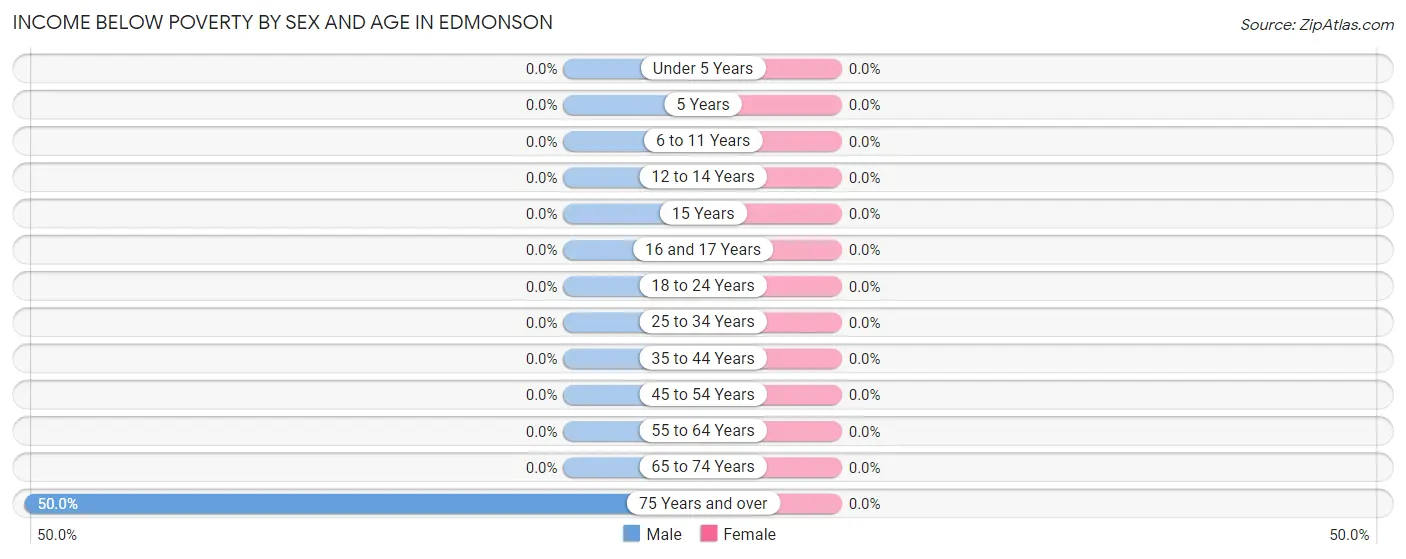
| Age Bracket | Male | Female |
| Under 5 Years | 0 (0.0%) | 0 (0.0%) |
| 5 Years | 0 (0.0%) | 0 (0.0%) |
| 6 to 11 Years | 0 (0.0%) | 0 (0.0%) |
| 12 to 14 Years | 0 (0.0%) | 0 (0.0%) |
| 15 Years | 0 (0.0%) | 0 (0.0%) |
| 16 and 17 Years | 0 (0.0%) | 0 (0.0%) |
| 18 to 24 Years | 0 (0.0%) | 0 (0.0%) |
| 25 to 34 Years | 0 (0.0%) | 0 (0.0%) |
| 35 to 44 Years | 0 (0.0%) | 0 (0.0%) |
| 45 to 54 Years | 0 (0.0%) | 0 (0.0%) |
| 55 to 64 Years | 0 (0.0%) | 0 (0.0%) |
| 65 to 74 Years | 0 (0.0%) | 0 (0.0%) |
| 75 Years and over | 2 (50.0%) | 0 (0.0%) |
| Total | 2 (3.0%) | 0 (0.0%) |
Income Above Poverty by Sex and Age in Edmonson
According to the poverty statistics in Edmonson, males aged under 5 years and females aged 6 to 11 years are the age groups that are most secure financially, with 100.0% of males and 100.0% of females in these age groups living above the poverty line.
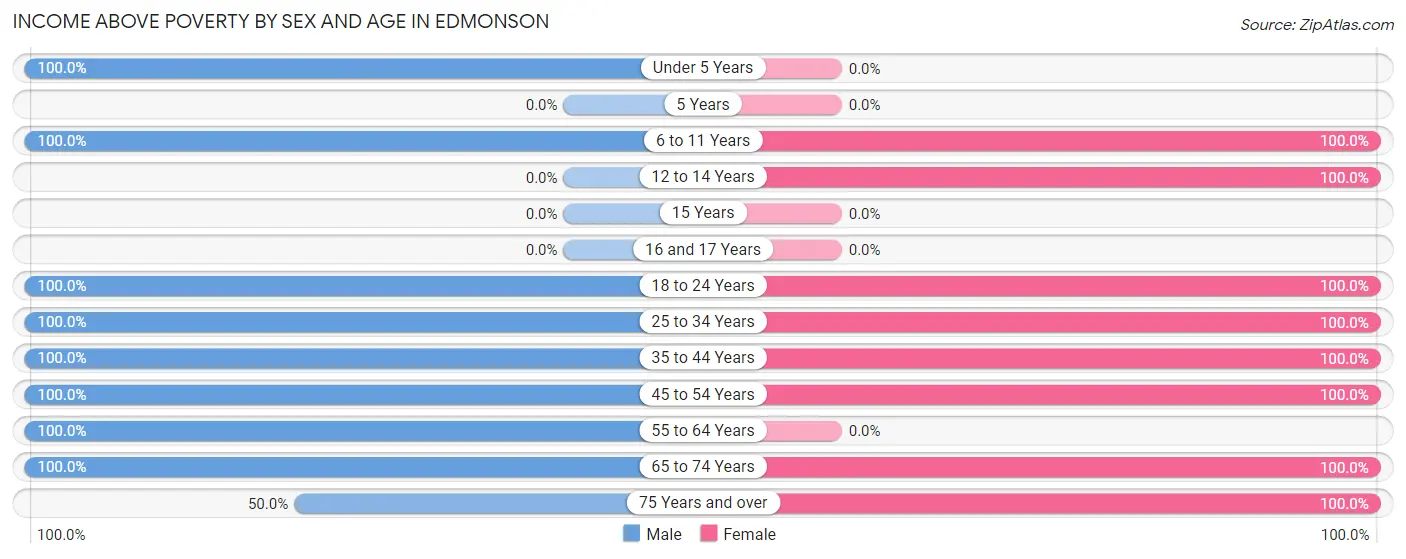
| Age Bracket | Male | Female |
| Under 5 Years | 3 (100.0%) | 0 (0.0%) |
| 5 Years | 0 (0.0%) | 0 (0.0%) |
| 6 to 11 Years | 23 (100.0%) | 5 (100.0%) |
| 12 to 14 Years | 0 (0.0%) | 5 (100.0%) |
| 15 Years | 0 (0.0%) | 0 (0.0%) |
| 16 and 17 Years | 0 (0.0%) | 0 (0.0%) |
| 18 to 24 Years | 8 (100.0%) | 4 (100.0%) |
| 25 to 34 Years | 12 (100.0%) | 7 (100.0%) |
| 35 to 44 Years | 7 (100.0%) | 7 (100.0%) |
| 45 to 54 Years | 6 (100.0%) | 12 (100.0%) |
| 55 to 64 Years | 2 (100.0%) | 0 (0.0%) |
| 65 to 74 Years | 1 (100.0%) | 1 (100.0%) |
| 75 Years and over | 2 (50.0%) | 7 (100.0%) |
| Total | 64 (97.0%) | 48 (100.0%) |
Income Below Poverty Among Married-Couple Families in Edmonson
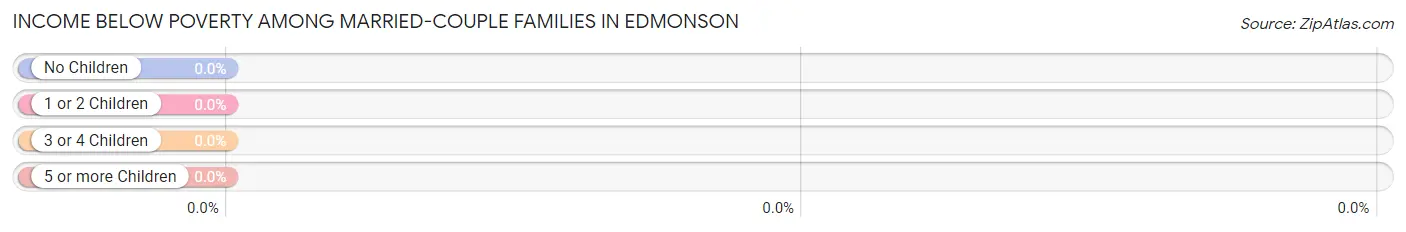
| Children | Above Poverty | Below Poverty |
| No Children | 4 (100.0%) | 0 (0.0%) |
| 1 or 2 Children | 11 (100.0%) | 0 (0.0%) |
| 3 or 4 Children | 5 (100.0%) | 0 (0.0%) |
| 5 or more Children | 0 (0.0%) | 0 (0.0%) |
| Total | 20 (100.0%) | 0 (0.0%) |
Income Below Poverty Among Single-Parent Households in Edmonson
| Children | Single Father | Single Mother |
| No Children | 0 (0.0%) | 0 (0.0%) |
| 1 or 2 Children | 0 (0.0%) | 0 (0.0%) |
| 3 or 4 Children | 0 (0.0%) | 0 (0.0%) |
| 5 or more Children | 0 (0.0%) | 0 (0.0%) |
| Total | 0 (0.0%) | 0 (0.0%) |
Income Below Poverty Among Married-Couple vs Single-Parent Households in Edmonson
| Children | Married-Couple Families | Single-Parent Households |
| No Children | 0 (0.0%) | 0 (0.0%) |
| 1 or 2 Children | 0 (0.0%) | 0 (0.0%) |
| 3 or 4 Children | 0 (0.0%) | 0 (0.0%) |
| 5 or more Children | 0 (0.0%) | 0 (0.0%) |
| Total | 0 (0.0%) | 0 (0.0%) |
Race in Edmonson
The most populous races in Edmonson are Hispanic or Latino (96 | 84.2%), White / Caucasian (76 | 66.7%), and Two or more Races (38 | 33.3%).
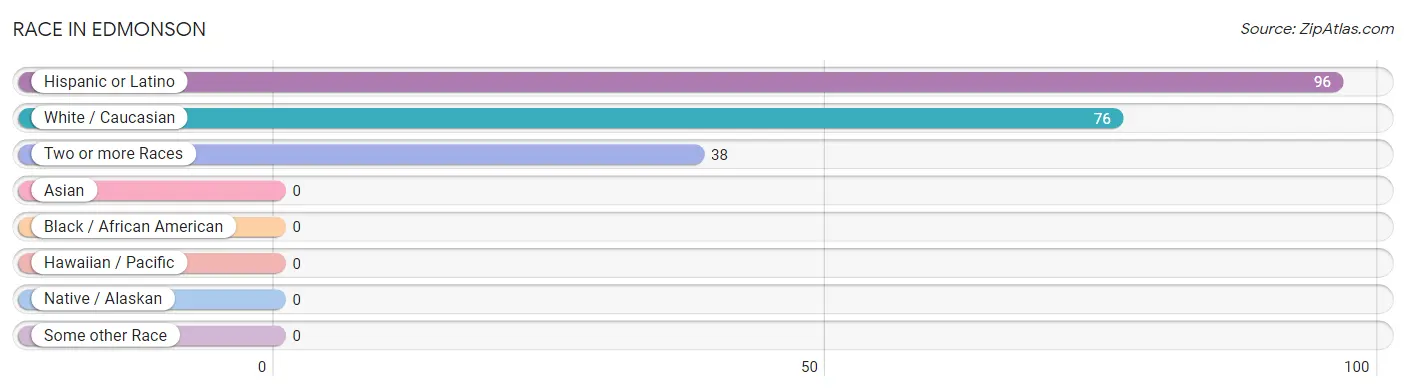
| Race | # Population | % Population |
| Asian | 0 | 0.0% |
| Black / African American | 0 | 0.0% |
| Hawaiian / Pacific | 0 | 0.0% |
| Hispanic or Latino | 96 | 84.2% |
| Native / Alaskan | 0 | 0.0% |
| White / Caucasian | 76 | 66.7% |
| Two or more Races | 38 | 33.3% |
| Some other Race | 0 | 0.0% |
| Total | 114 | 100.0% |
Ancestry in Edmonson
The most populous ancestries reported in Edmonson are Mexican (96 | 84.2%), and American (2 | 1.8%), together accounting for 86.0% of all Edmonson residents.
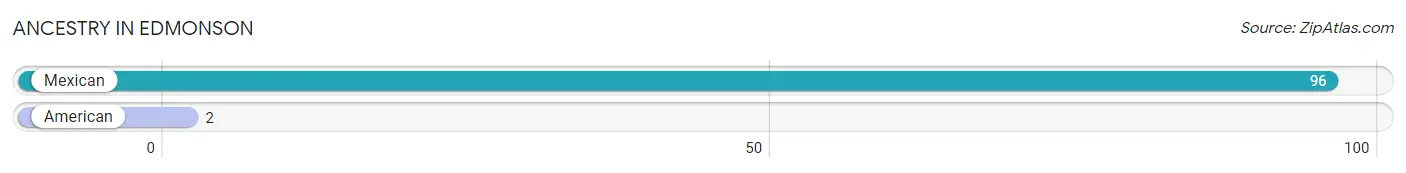
| Ancestry | # Population | % Population |
| American | 2 | 1.8% |
| Mexican | 96 | 84.2% | View All 2 Rows |
Immigrants in Edmonson
The most numerous immigrant groups reported in Edmonson came from Central America (13 | 11.4%), Latin America (13 | 11.4%), and Mexico (13 | 11.4%), together accounting for 34.2% of all Edmonson residents.
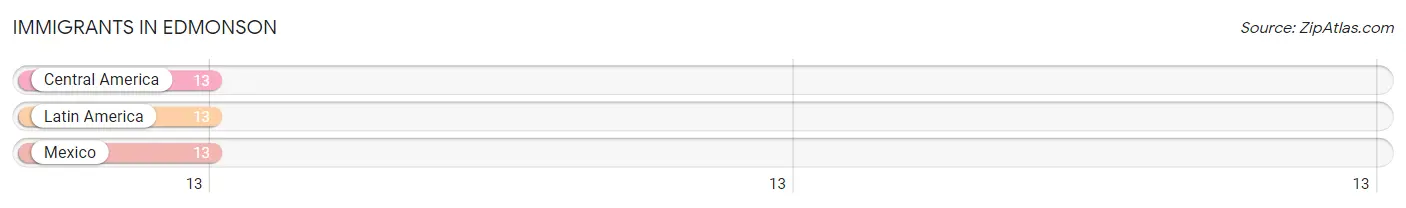
| Immigration Origin | # Population | % Population |
| Central America | 13 | 11.4% |
| Latin America | 13 | 11.4% |
| Mexico | 13 | 11.4% | View All 3 Rows |
Sex and Age in Edmonson
Sex and Age in Edmonson
The most populous age groups in Edmonson are 5 to 9 Years (15 | 22.7%) for men and 10 to 14 Years (10 | 20.8%) for women.
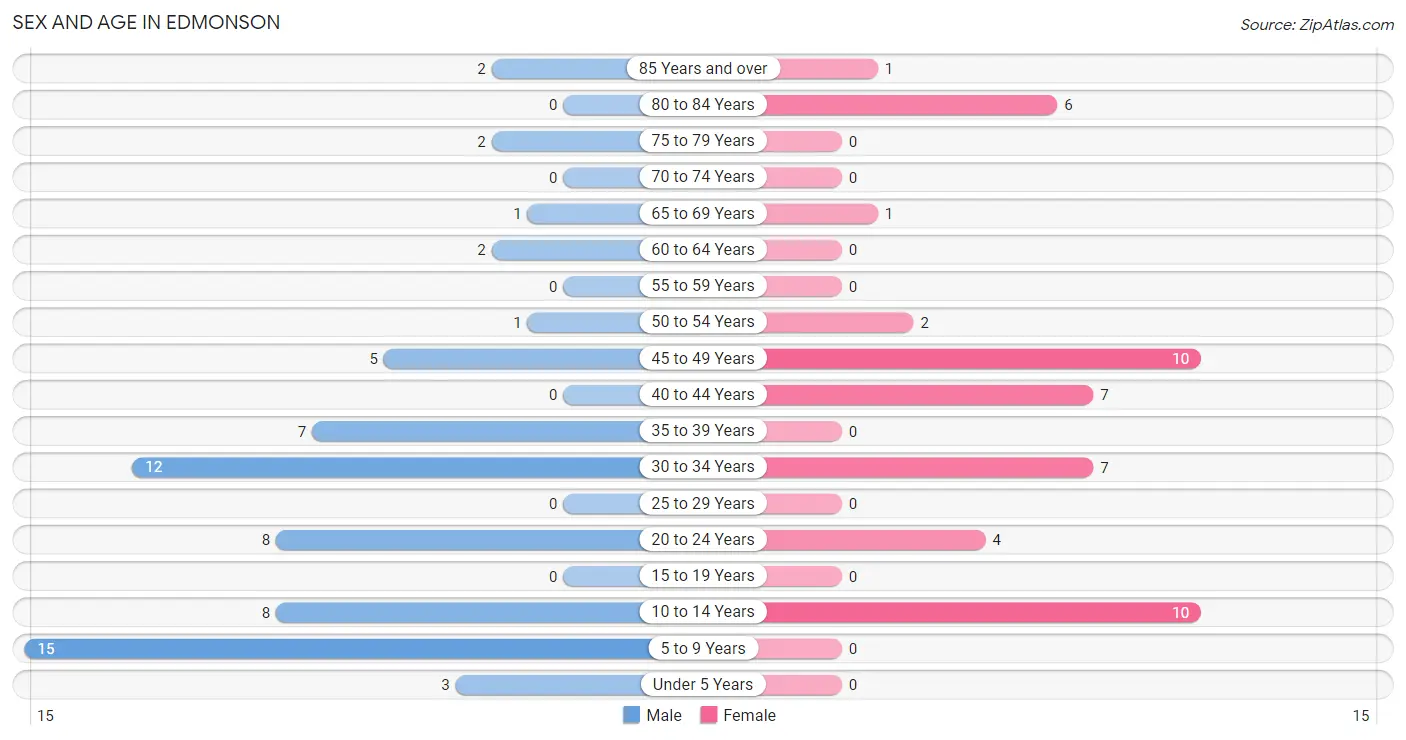
| Age Bracket | Male | Female |
| Under 5 Years | 3 (4.5%) | 0 (0.0%) |
| 5 to 9 Years | 15 (22.7%) | 0 (0.0%) |
| 10 to 14 Years | 8 (12.1%) | 10 (20.8%) |
| 15 to 19 Years | 0 (0.0%) | 0 (0.0%) |
| 20 to 24 Years | 8 (12.1%) | 4 (8.3%) |
| 25 to 29 Years | 0 (0.0%) | 0 (0.0%) |
| 30 to 34 Years | 12 (18.2%) | 7 (14.6%) |
| 35 to 39 Years | 7 (10.6%) | 0 (0.0%) |
| 40 to 44 Years | 0 (0.0%) | 7 (14.6%) |
| 45 to 49 Years | 5 (7.6%) | 10 (20.8%) |
| 50 to 54 Years | 1 (1.5%) | 2 (4.2%) |
| 55 to 59 Years | 0 (0.0%) | 0 (0.0%) |
| 60 to 64 Years | 2 (3.0%) | 0 (0.0%) |
| 65 to 69 Years | 1 (1.5%) | 1 (2.1%) |
| 70 to 74 Years | 0 (0.0%) | 0 (0.0%) |
| 75 to 79 Years | 2 (3.0%) | 0 (0.0%) |
| 80 to 84 Years | 0 (0.0%) | 6 (12.5%) |
| 85 Years and over | 2 (3.0%) | 1 (2.1%) |
| Total | 66 (100.0%) | 48 (100.0%) |
Families and Households in Edmonson
Median Family Size in Edmonson
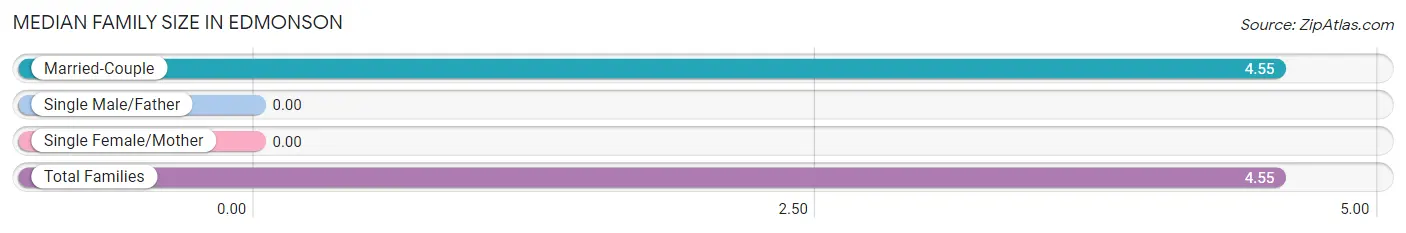
| Family Type | # Families | Family Size |
| Married-Couple | 20 (100.0%) | 4.55 |
| Single Male/Father | 0 (0.0%) | - |
| Single Female/Mother | 0 (0.0%) | - |
| Total Families | 20 (100.0%) | 4.55 |
Median Household Size in Edmonson
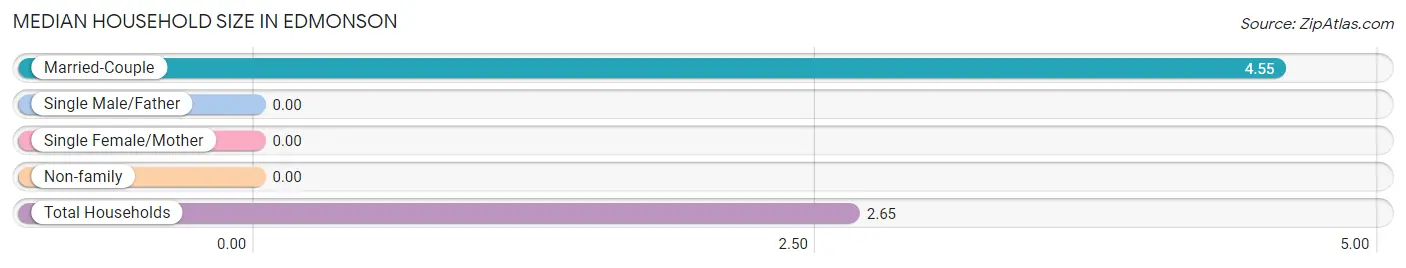
| Household Type | # Households | Household Size |
| Married-Couple | 20 (46.5%) | 4.55 |
| Single Male/Father | 0 (0.0%) | - |
| Single Female/Mother | 0 (0.0%) | - |
| Non-family | 23 (53.5%) | - |
| Total Households | 43 (100.0%) | 2.65 |
Household Size by Marriage Status in Edmonson
Out of a total of 43 households in Edmonson, 20 (46.5%) are family households, while 23 (53.5%) are nonfamily households. The most numerous type of family households are 4-person households, comprising 7, and the most common type of nonfamily households are 1-person households, comprising 23.
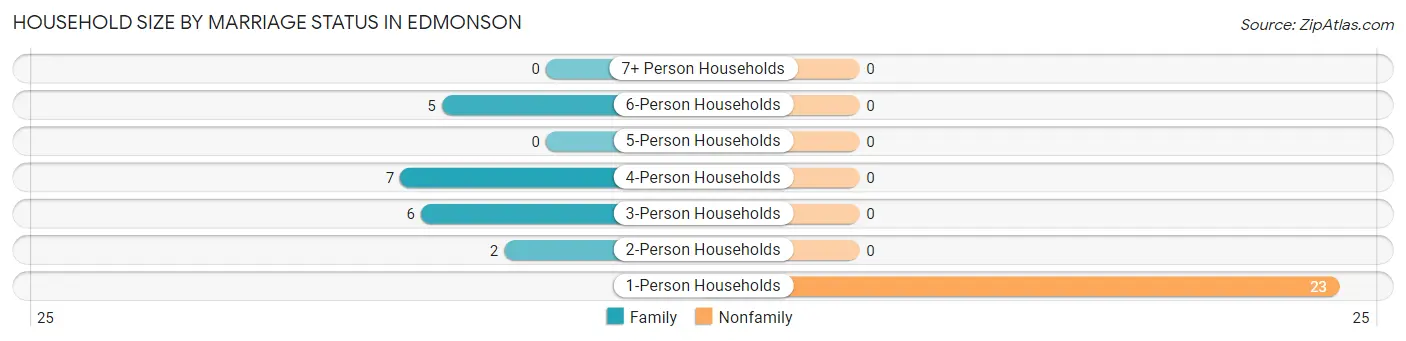
| Household Size | Family Households | Nonfamily Households |
| 1-Person Households | - | 23 (53.5%) |
| 2-Person Households | 2 (4.6%) | 0 (0.0%) |
| 3-Person Households | 6 (14.0%) | 0 (0.0%) |
| 4-Person Households | 7 (16.3%) | 0 (0.0%) |
| 5-Person Households | 0 (0.0%) | 0 (0.0%) |
| 6-Person Households | 5 (11.6%) | 0 (0.0%) |
| 7+ Person Households | 0 (0.0%) | 0 (0.0%) |
| Total | 20 (46.5%) | 23 (53.5%) |
Female Fertility in Edmonson
Fertility by Age in Edmonson
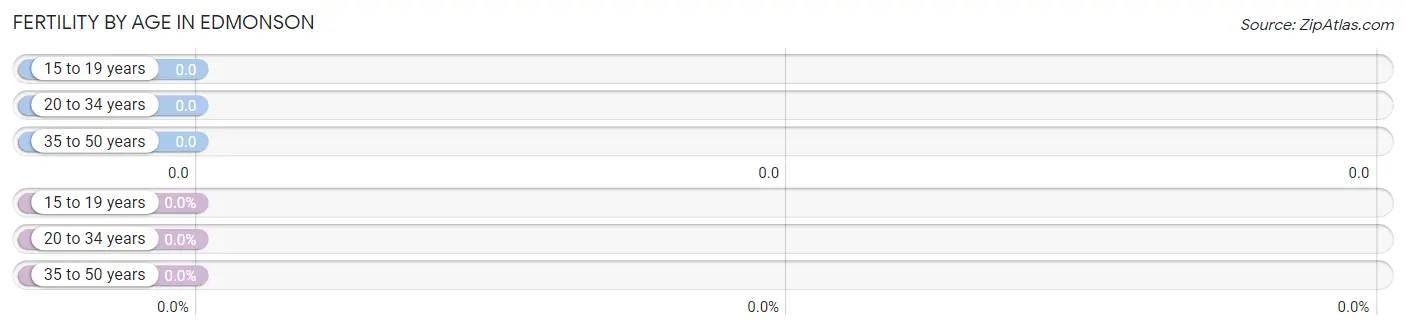
| Age Bracket | Women with Births | Births / 1,000 Women |
| 15 to 19 years | 0 (0.0%) | 0.0 |
| 20 to 34 years | 0 (0.0%) | 0.0 |
| 35 to 50 years | 0 (0.0%) | 0.0 |
| Total | 0 (0.0%) | 0.0 |
Fertility by Age by Marriage Status in Edmonson
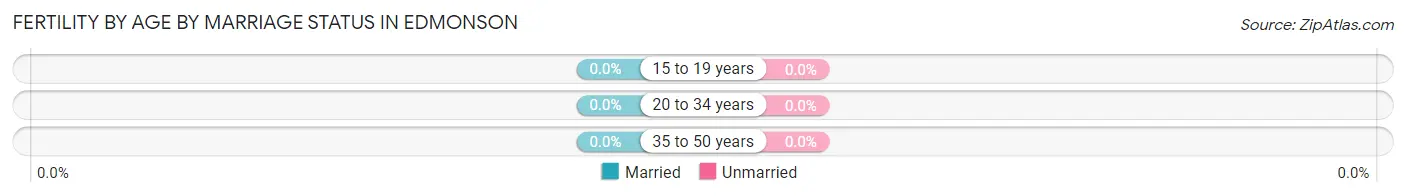
| Age Bracket | Married | Unmarried |
| 15 to 19 years | 0 (0.0%) | 0 (0.0%) |
| 20 to 34 years | 0 (0.0%) | 0 (0.0%) |
| 35 to 50 years | 0 (0.0%) | 0 (0.0%) |
| Total | 0 (0.0%) | 0 (0.0%) |
Fertility by Education in Edmonson
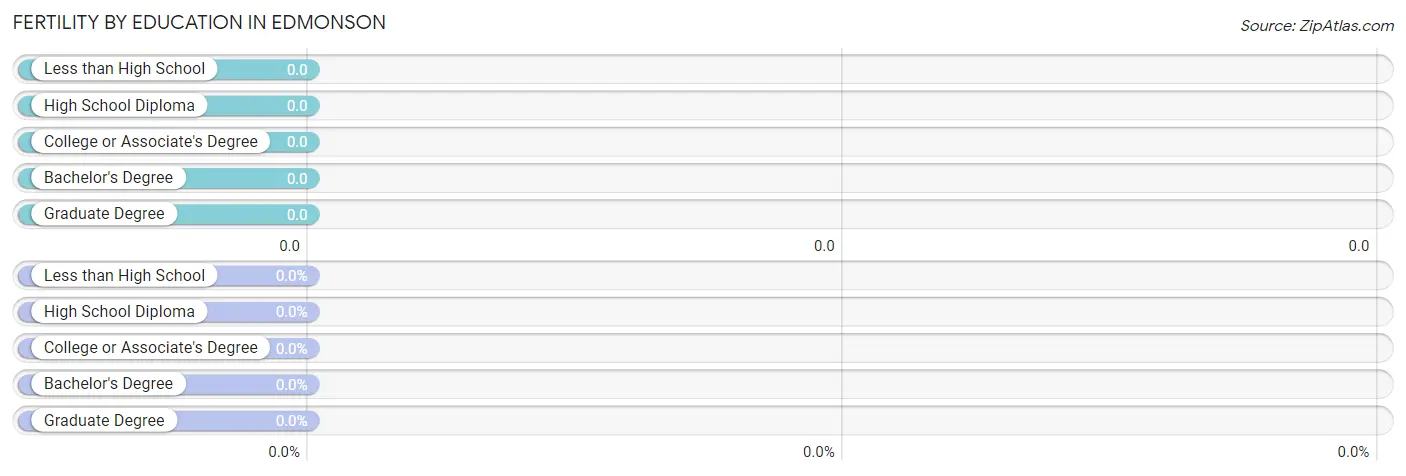
| Educational Attainment | Women with Births | Births / 1,000 Women |
| Less than High School | 0 (0.0%) | 0.0 |
| High School Diploma | 0 (0.0%) | 0.0 |
| College or Associate's Degree | 0 (0.0%) | 0.0 |
| Bachelor's Degree | 0 (0.0%) | 0.0 |
| Graduate Degree | 0 (0.0%) | 0.0 |
| Total | 0 (0.0%) | 0.0 |
Fertility by Education by Marriage Status in Edmonson
| Educational Attainment | Married | Unmarried |
| Less than High School | 0 (0.0%) | 0 (0.0%) |
| High School Diploma | 0 (0.0%) | 0 (0.0%) |
| College or Associate's Degree | 0 (0.0%) | 0 (0.0%) |
| Bachelor's Degree | 0 (0.0%) | 0 (0.0%) |
| Graduate Degree | 0 (0.0%) | 0 (0.0%) |
| Total | 0 (0.0%) | 0 (0.0%) |
Employment Characteristics in Edmonson
Employment by Class of Employer in Edmonson
Among the 53 employed individuals in Edmonson, private company employees (37 | 69.8%), not-for-profit organizations (8 | 15.1%), and local government employees (8 | 15.1%) make up the most common classes of employment.
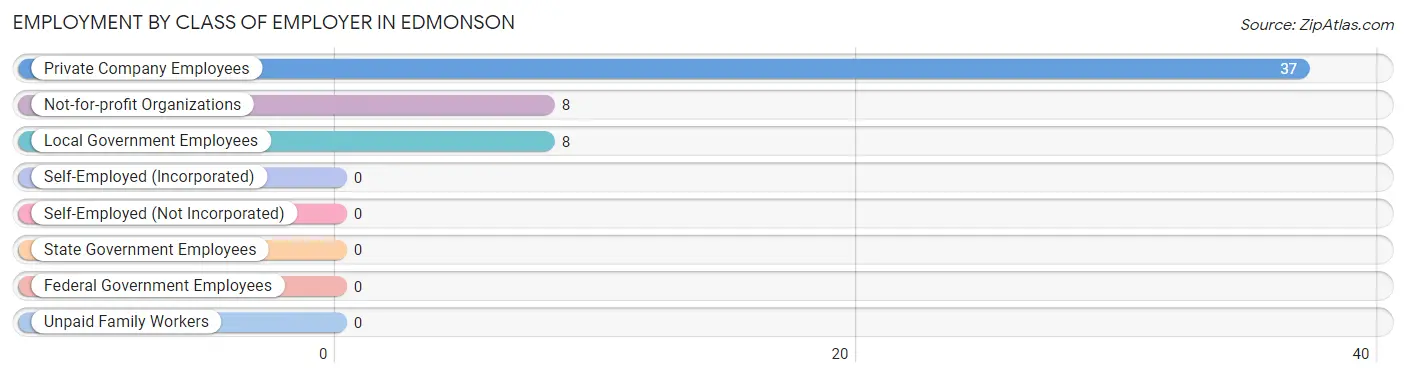
| Employer Class | # Employees | % Employees |
| Private Company Employees | 37 | 69.8% |
| Self-Employed (Incorporated) | 0 | 0.0% |
| Self-Employed (Not Incorporated) | 0 | 0.0% |
| Not-for-profit Organizations | 8 | 15.1% |
| Local Government Employees | 8 | 15.1% |
| State Government Employees | 0 | 0.0% |
| Federal Government Employees | 0 | 0.0% |
| Unpaid Family Workers | 0 | 0.0% |
| Total | 53 | 100.0% |
Employment Status by Age in Edmonson
According to the labor force statistics for Edmonson, out of the total population over 16 years of age (78), 70.5% or 55 individuals are in the labor force, with 3.6% or 2 of them unemployed. The age group with the highest labor force participation rate is 30 to 34 years, with 100.0% or 19 individuals in the labor force. Within the labor force, the 45 to 54 years age range has the highest percentage of unemployed individuals, with 16.7% or 2 of them being unemployed.
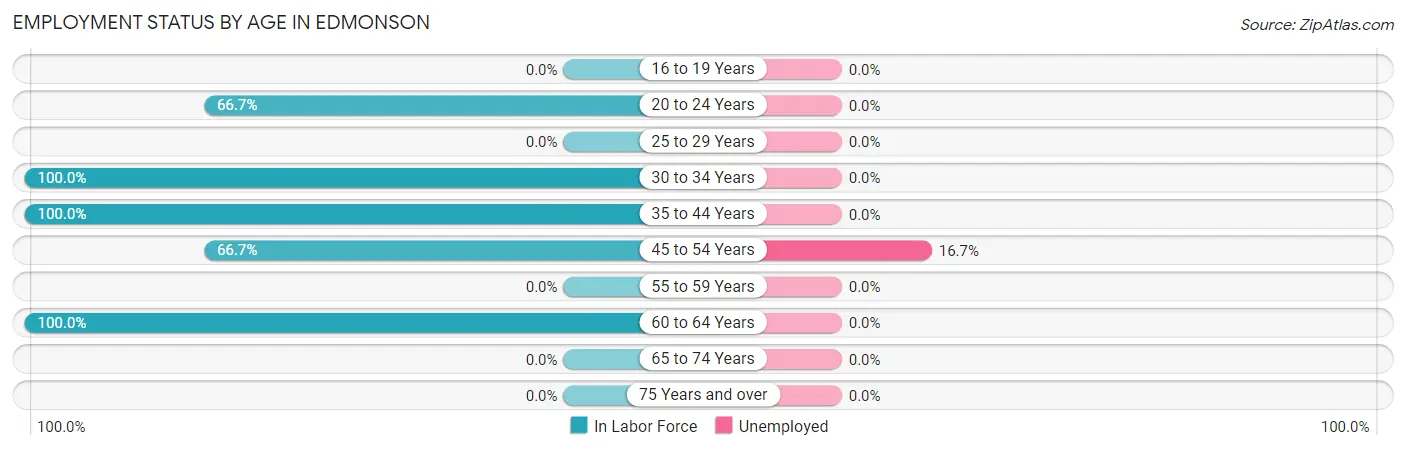
| Age Bracket | In Labor Force | Unemployed |
| 16 to 19 Years | 0 (0.0%) | 0 (0.0%) |
| 20 to 24 Years | 8 (66.7%) | 0 (0.0%) |
| 25 to 29 Years | 0 (0.0%) | 0 (0.0%) |
| 30 to 34 Years | 19 (100.0%) | 0 (0.0%) |
| 35 to 44 Years | 14 (100.0%) | 0 (0.0%) |
| 45 to 54 Years | 12 (66.7%) | 2 (16.7%) |
| 55 to 59 Years | 0 (0.0%) | 0 (0.0%) |
| 60 to 64 Years | 2 (100.0%) | 0 (0.0%) |
| 65 to 74 Years | 0 (0.0%) | 0 (0.0%) |
| 75 Years and over | 0 (0.0%) | 0 (0.0%) |
| Total | 55 (70.5%) | 2 (3.6%) |
Employment Status by Educational Attainment in Edmonson
According to labor force statistics for Edmonson, 88.7% of individuals (47) out of the total population between 25 and 64 years of age (53) are in the labor force, with 4.3% or 2 of them being unemployed. The group with the highest labor force participation rate are those with the educational attainment of high school diploma, with 100.0% or 11 individuals in the labor force. Within the labor force, individuals with high school diploma education have the highest percentage of unemployment, with 18.2% or 2 of them being unemployed.
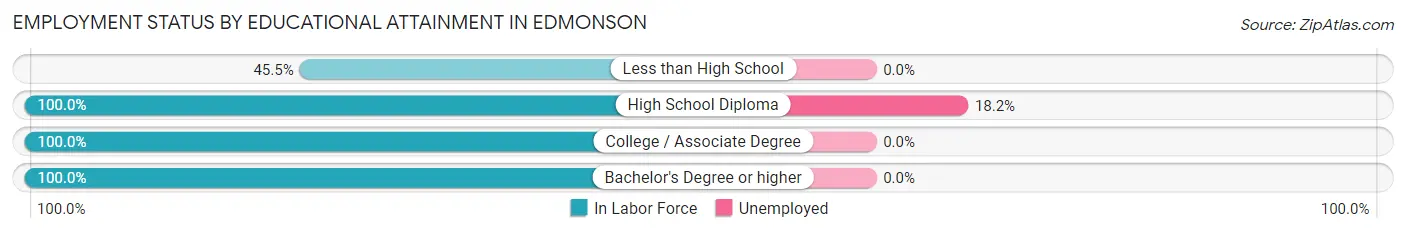
| Educational Attainment | In Labor Force | Unemployed |
| Less than High School | 5 (45.5%) | 0 (0.0%) |
| High School Diploma | 11 (100.0%) | 2 (18.2%) |
| College / Associate Degree | 27 (100.0%) | 0 (0.0%) |
| Bachelor's Degree or higher | 4 (100.0%) | 0 (0.0%) |
| Total | 47 (88.7%) | 2 (4.3%) |
Employment Occupations by Sex in Edmonson
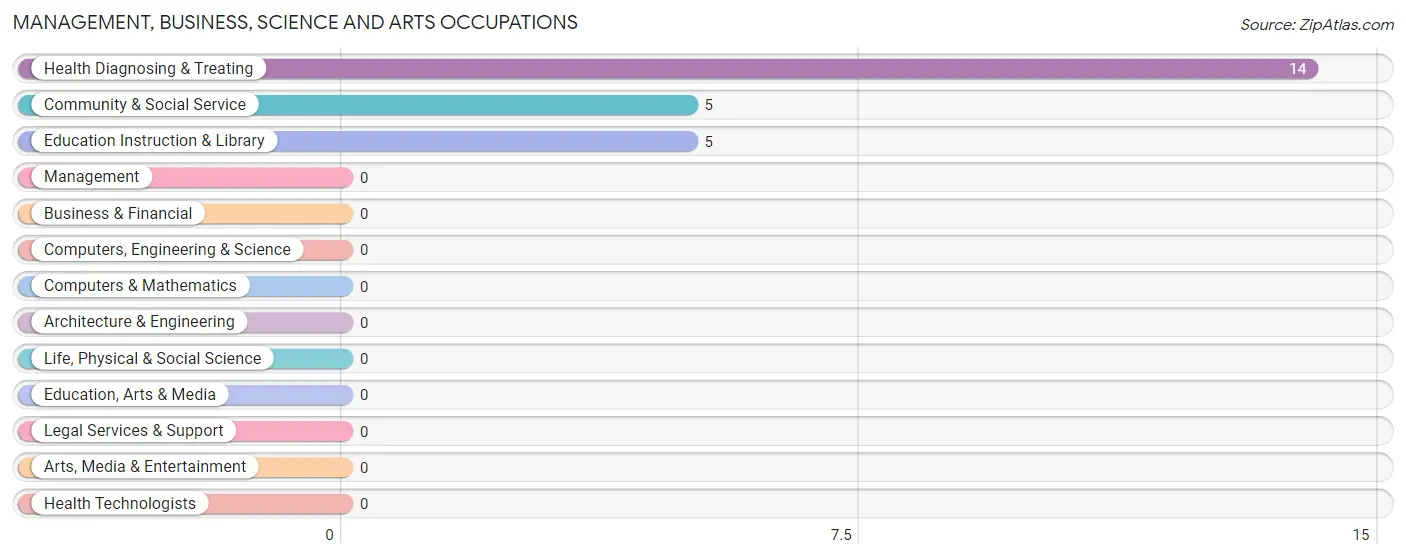
Management, Business, Science and Arts Occupations
The most common Management, Business, Science and Arts occupations in Edmonson are Health Diagnosing & Treating (14 | 26.4%), Community & Social Service (5 | 9.4%), and Education Instruction & Library (5 | 9.4%).
Management, Business, Science and Arts Occupations by Sex
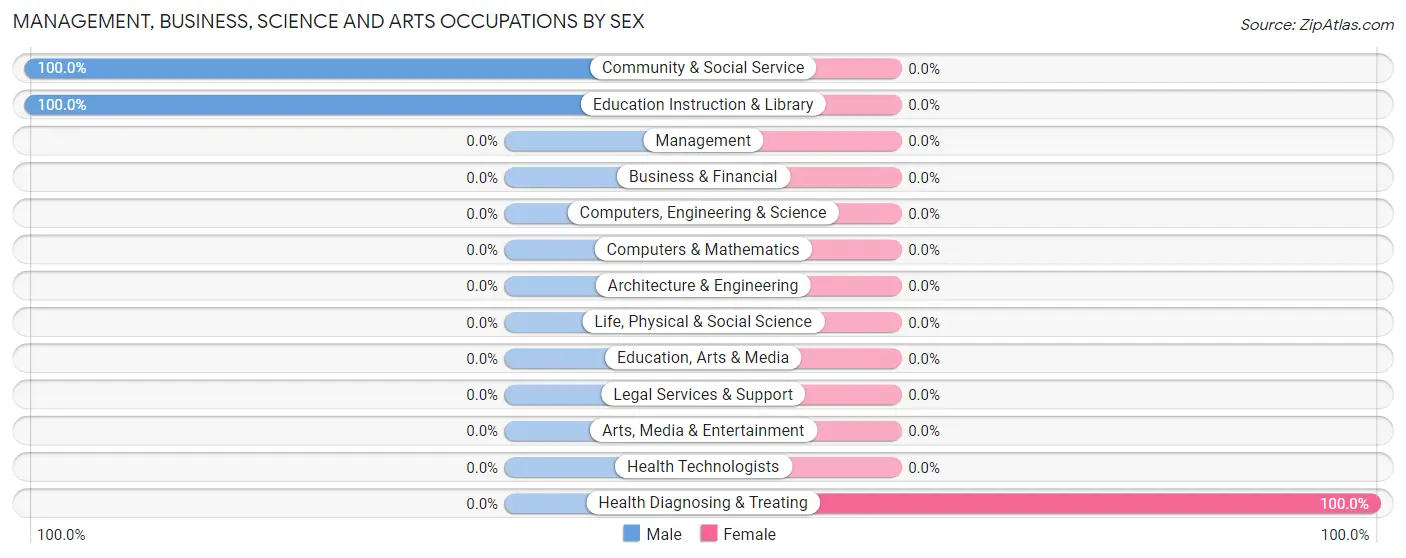
| Occupation | Male | Female |
| Management | 0 (0.0%) | 0 (0.0%) |
| Business & Financial | 0 (0.0%) | 0 (0.0%) |
| Computers, Engineering & Science | 0 (0.0%) | 0 (0.0%) |
| Computers & Mathematics | 0 (0.0%) | 0 (0.0%) |
| Architecture & Engineering | 0 (0.0%) | 0 (0.0%) |
| Life, Physical & Social Science | 0 (0.0%) | 0 (0.0%) |
| Community & Social Service | 5 (100.0%) | 0 (0.0%) |
| Education, Arts & Media | 0 (0.0%) | 0 (0.0%) |
| Legal Services & Support | 0 (0.0%) | 0 (0.0%) |
| Education Instruction & Library | 5 (100.0%) | 0 (0.0%) |
| Arts, Media & Entertainment | 0 (0.0%) | 0 (0.0%) |
| Health Diagnosing & Treating | 0 (0.0%) | 14 (100.0%) |
| Health Technologists | 0 (0.0%) | 0 (0.0%) |
| Total (Category) | 5 (26.3%) | 14 (73.7%) |
| Total (Overall) | 35 (66.0%) | 18 (34.0%) |
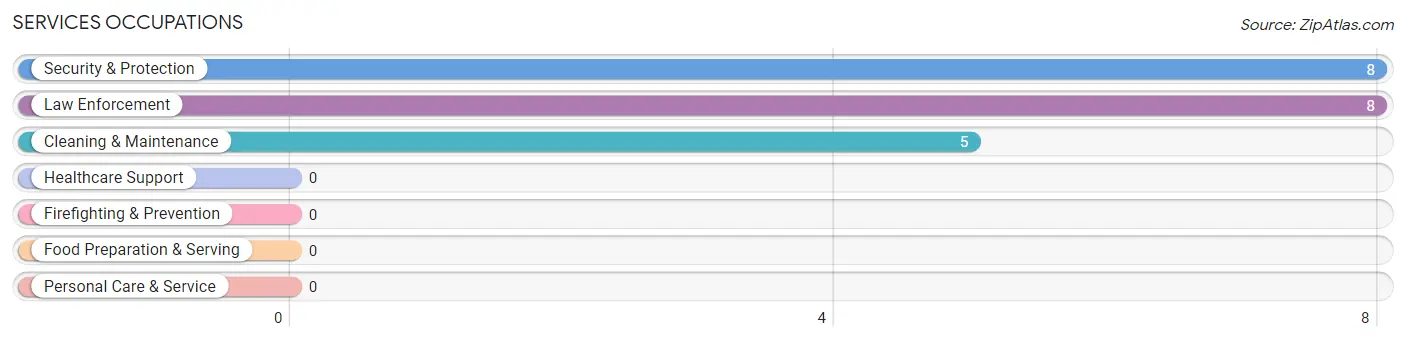
Services Occupations
The most common Services occupations in Edmonson are Security & Protection (8 | 15.1%), Law Enforcement (8 | 15.1%), and Cleaning & Maintenance (5 | 9.4%).
Services Occupations by Sex
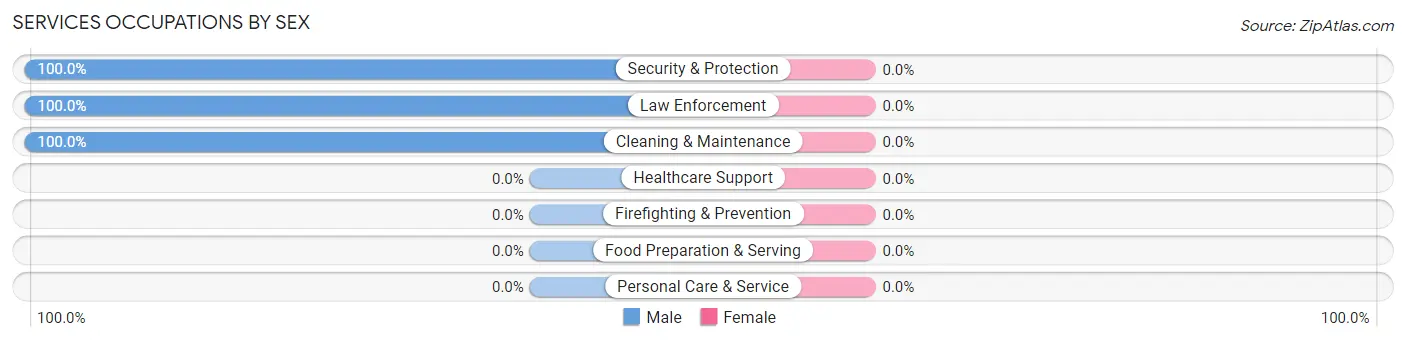
| Occupation | Male | Female |
| Healthcare Support | 0 (0.0%) | 0 (0.0%) |
| Security & Protection | 8 (100.0%) | 0 (0.0%) |
| Firefighting & Prevention | 0 (0.0%) | 0 (0.0%) |
| Law Enforcement | 8 (100.0%) | 0 (0.0%) |
| Food Preparation & Serving | 0 (0.0%) | 0 (0.0%) |
| Cleaning & Maintenance | 5 (100.0%) | 0 (0.0%) |
| Personal Care & Service | 0 (0.0%) | 0 (0.0%) |
| Total (Category) | 13 (100.0%) | 0 (0.0%) |
| Total (Overall) | 35 (66.0%) | 18 (34.0%) |
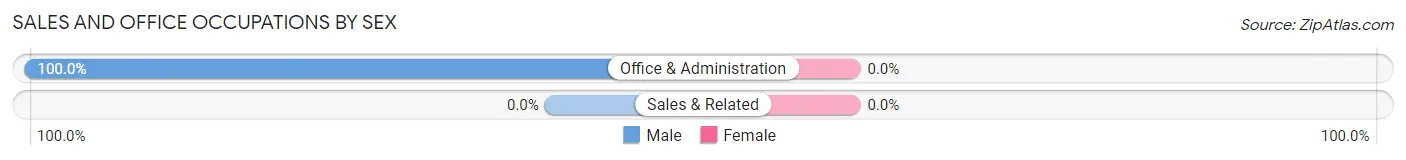
Sales and Office Occupations
The most common Sales and Office occupations in Edmonson are , and Office & Administration (4 | 7.5%).
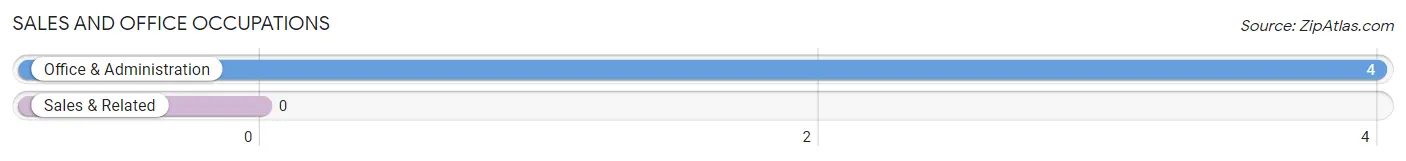
Sales and Office Occupations by Sex
| Occupation | Male | Female |
| Sales & Related | 0 (0.0%) | 0 (0.0%) |
| Office & Administration | 4 (100.0%) | 0 (0.0%) |
| Total (Category) | 4 (100.0%) | 0 (0.0%) |
| Total (Overall) | 35 (66.0%) | 18 (34.0%) |
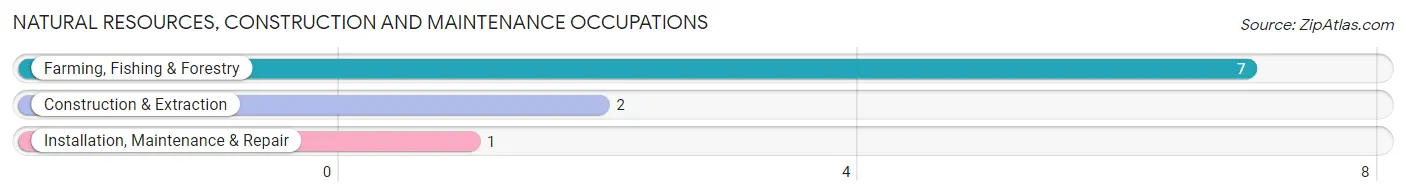
Natural Resources, Construction and Maintenance Occupations
The most common Natural Resources, Construction and Maintenance occupations in Edmonson are Farming, Fishing & Forestry (7 | 13.2%), Construction & Extraction (2 | 3.8%), and Installation, Maintenance & Repair (1 | 1.9%).
Natural Resources, Construction and Maintenance Occupations by Sex
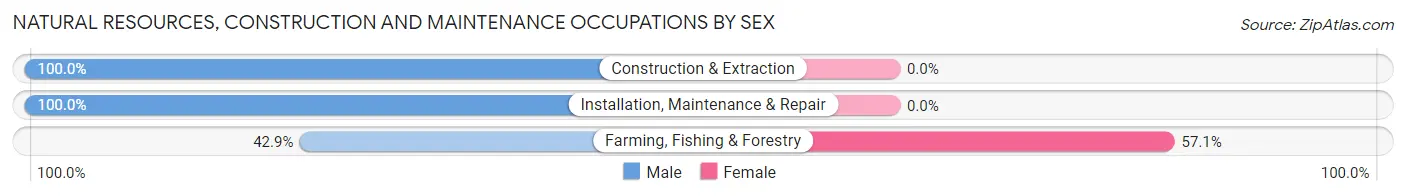
| Occupation | Male | Female |
| Farming, Fishing & Forestry | 3 (42.9%) | 4 (57.1%) |
| Construction & Extraction | 2 (100.0%) | 0 (0.0%) |
| Installation, Maintenance & Repair | 1 (100.0%) | 0 (0.0%) |
| Total (Category) | 6 (60.0%) | 4 (40.0%) |
| Total (Overall) | 35 (66.0%) | 18 (34.0%) |
Production, Transportation and Moving Occupations
The most common Production, Transportation and Moving occupations in Edmonson are , and Material Moving (7 | 13.2%).
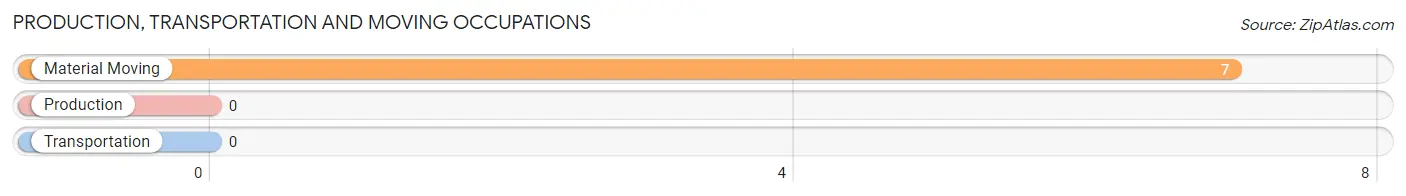
Production, Transportation and Moving Occupations by Sex
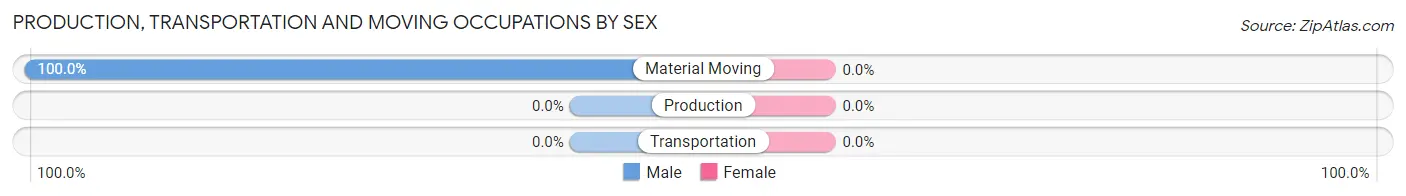
| Occupation | Male | Female |
| Production | 0 (0.0%) | 0 (0.0%) |
| Transportation | 0 (0.0%) | 0 (0.0%) |
| Material Moving | 7 (100.0%) | 0 (0.0%) |
| Total (Category) | 7 (100.0%) | 0 (0.0%) |
| Total (Overall) | 35 (66.0%) | 18 (34.0%) |
Employment Industries by Sex in Edmonson
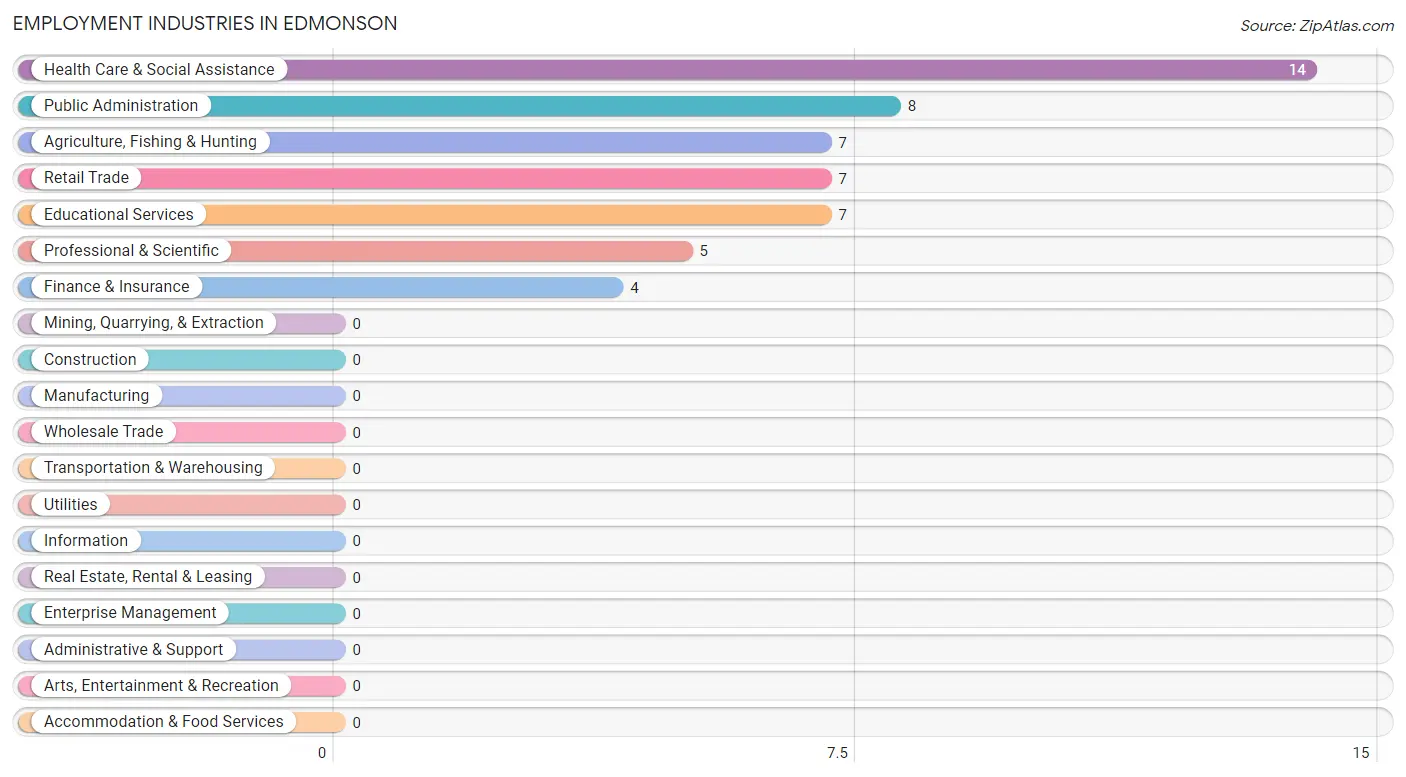
Employment Industries in Edmonson
The major employment industries in Edmonson include Health Care & Social Assistance (14 | 26.4%), Public Administration (8 | 15.1%), Agriculture, Fishing & Hunting (7 | 13.2%), Retail Trade (7 | 13.2%), and Educational Services (7 | 13.2%).
Employment Industries by Sex in Edmonson
The Edmonson industries that see more men than women are Retail Trade (100.0%), Finance & Insurance (100.0%), and Professional & Scientific (100.0%), whereas the industries that tend to have a higher number of women are Health Care & Social Assistance (100.0%), and Agriculture, Fishing & Hunting (57.1%).

| Industry | Male | Female |
| Agriculture, Fishing & Hunting | 3 (42.9%) | 4 (57.1%) |
| Mining, Quarrying, & Extraction | 0 (0.0%) | 0 (0.0%) |
| Construction | 0 (0.0%) | 0 (0.0%) |
| Manufacturing | 0 (0.0%) | 0 (0.0%) |
| Wholesale Trade | 0 (0.0%) | 0 (0.0%) |
| Retail Trade | 7 (100.0%) | 0 (0.0%) |
| Transportation & Warehousing | 0 (0.0%) | 0 (0.0%) |
| Utilities | 0 (0.0%) | 0 (0.0%) |
| Information | 0 (0.0%) | 0 (0.0%) |
| Finance & Insurance | 4 (100.0%) | 0 (0.0%) |
| Real Estate, Rental & Leasing | 0 (0.0%) | 0 (0.0%) |
| Professional & Scientific | 5 (100.0%) | 0 (0.0%) |
| Enterprise Management | 0 (0.0%) | 0 (0.0%) |
| Administrative & Support | 0 (0.0%) | 0 (0.0%) |
| Educational Services | 7 (100.0%) | 0 (0.0%) |
| Health Care & Social Assistance | 0 (0.0%) | 14 (100.0%) |
| Arts, Entertainment & Recreation | 0 (0.0%) | 0 (0.0%) |
| Accommodation & Food Services | 0 (0.0%) | 0 (0.0%) |
| Public Administration | 8 (100.0%) | 0 (0.0%) |
| Total | 35 (66.0%) | 18 (34.0%) |
Education in Edmonson
School Enrollment in Edmonson
The most common levels of schooling among the 33 students in Edmonson are elementary school (15 | 45.5%), middle school (13 | 39.4%), and high school (5 | 15.1%).
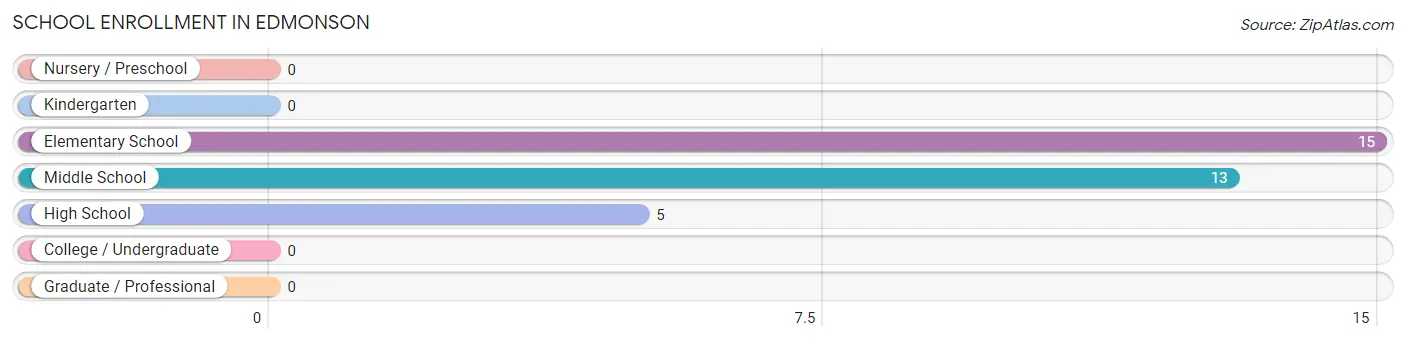
| School Level | # Students | % Students |
| Nursery / Preschool | 0 | 0.0% |
| Kindergarten | 0 | 0.0% |
| Elementary School | 15 | 45.5% |
| Middle School | 13 | 39.4% |
| High School | 5 | 15.1% |
| College / Undergraduate | 0 | 0.0% |
| Graduate / Professional | 0 | 0.0% |
| Total | 33 | 100.0% |
School Enrollment by Age by Funding Source in Edmonson
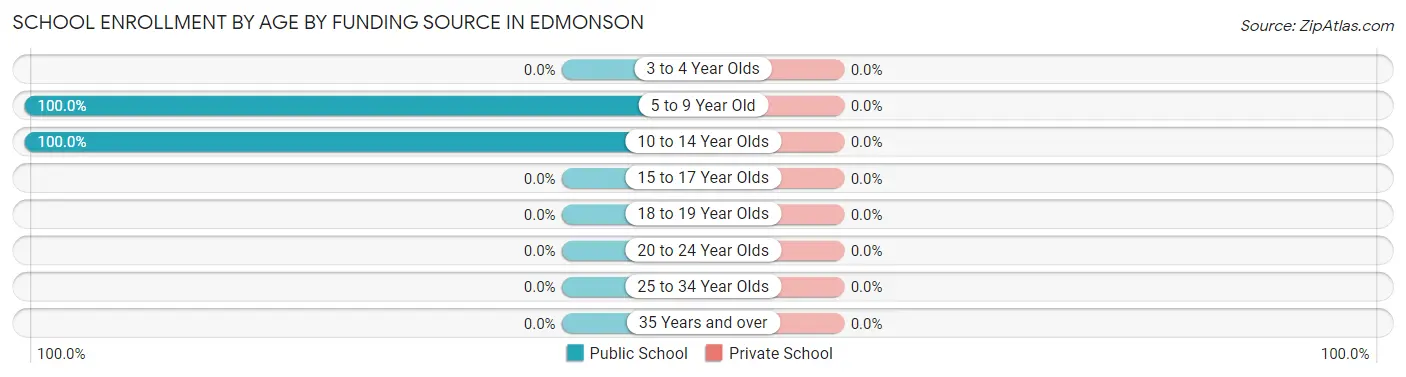
| Age Bracket | Public School | Private School |
| 3 to 4 Year Olds | 0 (0.0%) | 0 (0.0%) |
| 5 to 9 Year Old | 15 (100.0%) | 0 (0.0%) |
| 10 to 14 Year Olds | 18 (100.0%) | 0 (0.0%) |
| 15 to 17 Year Olds | 0 (0.0%) | 0 (0.0%) |
| 18 to 19 Year Olds | 0 (0.0%) | 0 (0.0%) |
| 20 to 24 Year Olds | 0 (0.0%) | 0 (0.0%) |
| 25 to 34 Year Olds | 0 (0.0%) | 0 (0.0%) |
| 35 Years and over | 0 (0.0%) | 0 (0.0%) |
| Total | 33 (100.0%) | 0 (0.0%) |
Educational Attainment by Field of Study in Edmonson
, and engineering (4 | 100.0%) are the most common fields of study among 4 individuals in Edmonson who have obtained a bachelor's degree or higher.
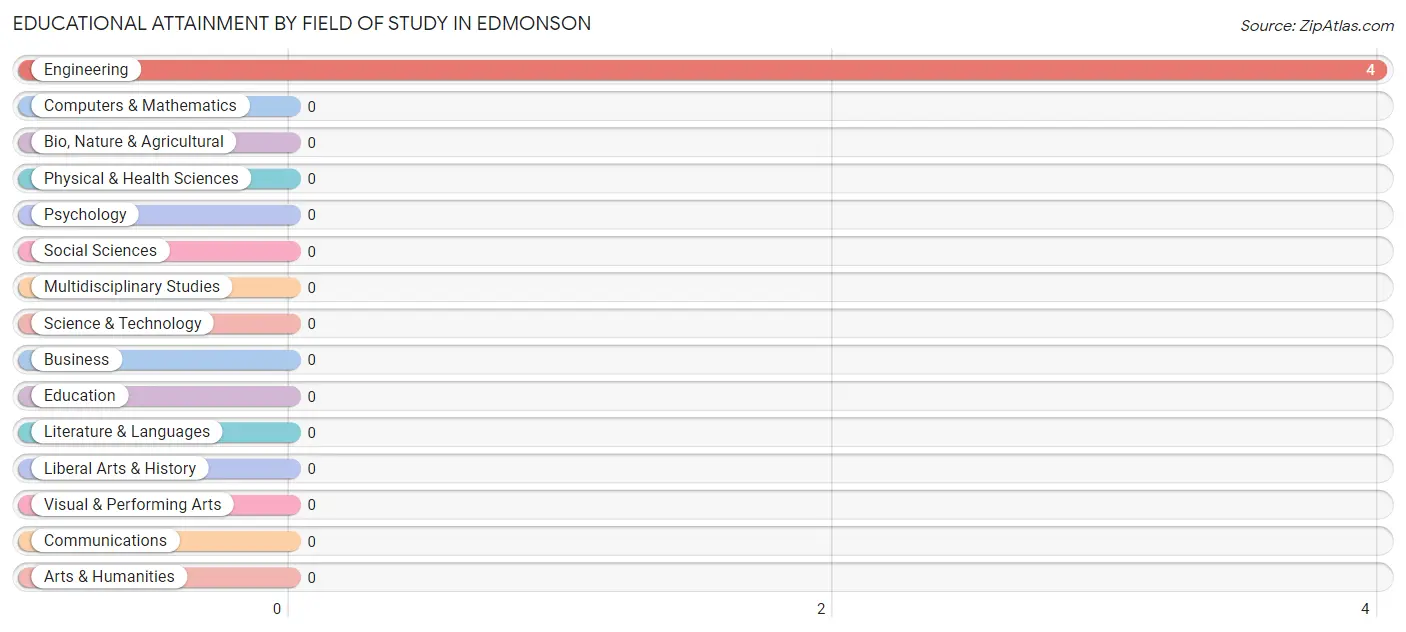
| Field of Study | # Graduates | % Graduates |
| Computers & Mathematics | 0 | 0.0% |
| Bio, Nature & Agricultural | 0 | 0.0% |
| Physical & Health Sciences | 0 | 0.0% |
| Psychology | 0 | 0.0% |
| Social Sciences | 0 | 0.0% |
| Engineering | 4 | 100.0% |
| Multidisciplinary Studies | 0 | 0.0% |
| Science & Technology | 0 | 0.0% |
| Business | 0 | 0.0% |
| Education | 0 | 0.0% |
| Literature & Languages | 0 | 0.0% |
| Liberal Arts & History | 0 | 0.0% |
| Visual & Performing Arts | 0 | 0.0% |
| Communications | 0 | 0.0% |
| Arts & Humanities | 0 | 0.0% |
| Total | 4 | 100.0% |
Transportation & Commute in Edmonson
Vehicle Availability by Sex in Edmonson
The most prevalent vehicle ownership categories in Edmonson are males with 1 vehicle (12, accounting for 34.3%) and females with 1 vehicle (0, making up 66.7%).
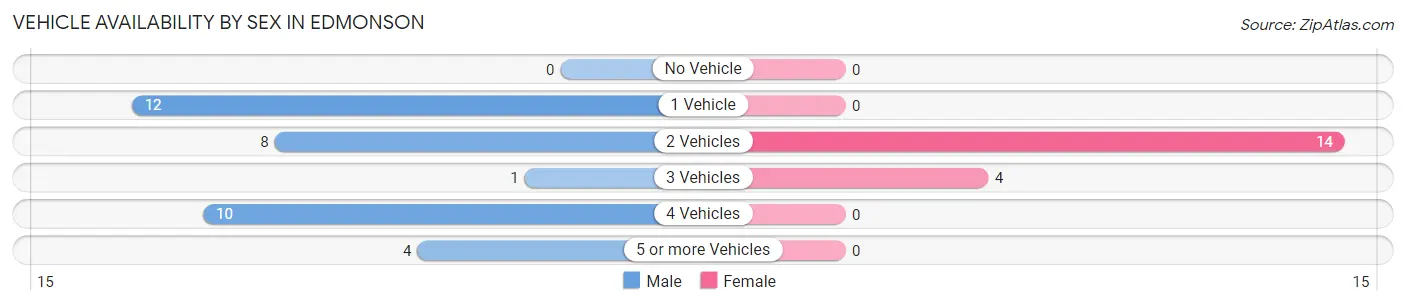
| Vehicles Available | Male | Female |
| No Vehicle | 0 (0.0%) | 0 (0.0%) |
| 1 Vehicle | 12 (34.3%) | 0 (0.0%) |
| 2 Vehicles | 8 (22.9%) | 14 (77.8%) |
| 3 Vehicles | 1 (2.9%) | 4 (22.2%) |
| 4 Vehicles | 10 (28.6%) | 0 (0.0%) |
| 5 or more Vehicles | 4 (11.4%) | 0 (0.0%) |
| Total | 35 (100.0%) | 18 (100.0%) |
Commute Time in Edmonson
The most frequently occuring commute durations in Edmonson are 20 to 24 minutes (15 commuters, 28.3%), 5 to 9 minutes (12 commuters, 22.6%), and 30 to 34 minutes (12 commuters, 22.6%).
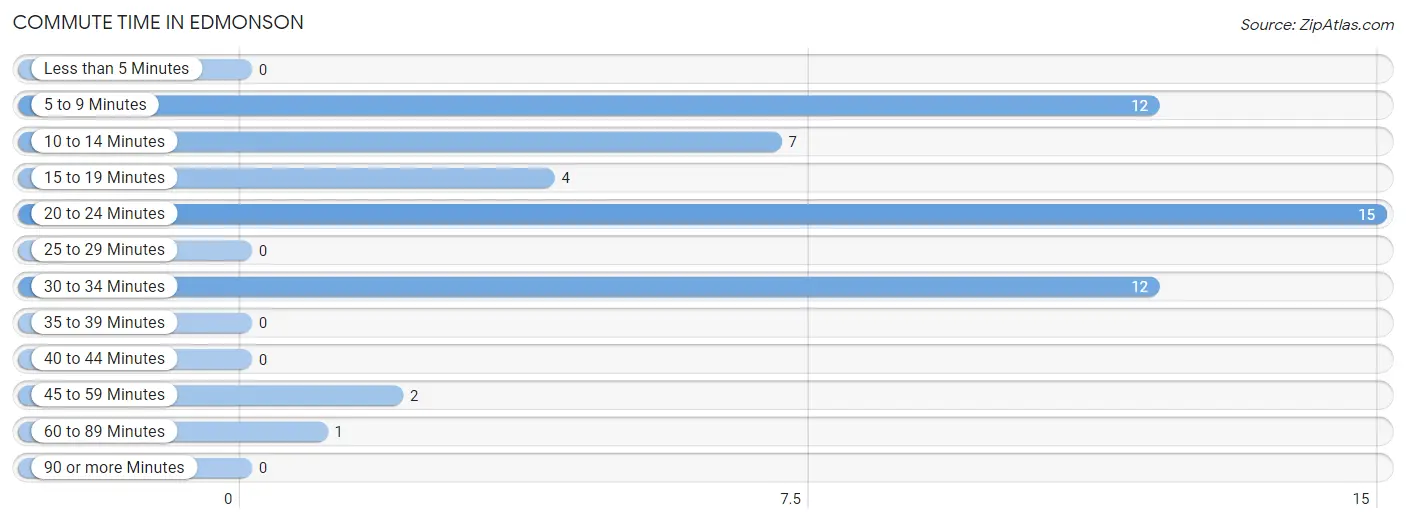
| Commute Time | # Commuters | % Commuters |
| Less than 5 Minutes | 0 | 0.0% |
| 5 to 9 Minutes | 12 | 22.6% |
| 10 to 14 Minutes | 7 | 13.2% |
| 15 to 19 Minutes | 4 | 7.5% |
| 20 to 24 Minutes | 15 | 28.3% |
| 25 to 29 Minutes | 0 | 0.0% |
| 30 to 34 Minutes | 12 | 22.6% |
| 35 to 39 Minutes | 0 | 0.0% |
| 40 to 44 Minutes | 0 | 0.0% |
| 45 to 59 Minutes | 2 | 3.8% |
| 60 to 89 Minutes | 1 | 1.9% |
| 90 or more Minutes | 0 | 0.0% |
Commute Time by Sex in Edmonson
The most common commute times in Edmonson are 20 to 24 minutes (15 commuters, 42.9%) for males and 10 to 14 minutes (7 commuters, 38.9%) for females.
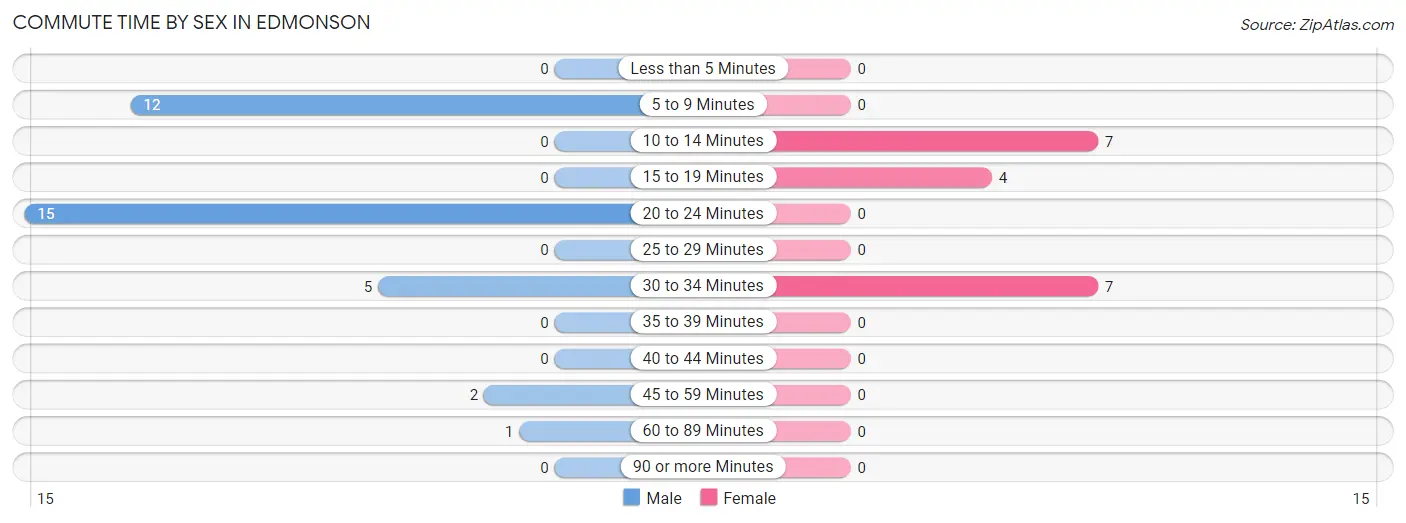
| Commute Time | Male | Female |
| Less than 5 Minutes | 0 (0.0%) | 0 (0.0%) |
| 5 to 9 Minutes | 12 (34.3%) | 0 (0.0%) |
| 10 to 14 Minutes | 0 (0.0%) | 7 (38.9%) |
| 15 to 19 Minutes | 0 (0.0%) | 4 (22.2%) |
| 20 to 24 Minutes | 15 (42.9%) | 0 (0.0%) |
| 25 to 29 Minutes | 0 (0.0%) | 0 (0.0%) |
| 30 to 34 Minutes | 5 (14.3%) | 7 (38.9%) |
| 35 to 39 Minutes | 0 (0.0%) | 0 (0.0%) |
| 40 to 44 Minutes | 0 (0.0%) | 0 (0.0%) |
| 45 to 59 Minutes | 2 (5.7%) | 0 (0.0%) |
| 60 to 89 Minutes | 1 (2.9%) | 0 (0.0%) |
| 90 or more Minutes | 0 (0.0%) | 0 (0.0%) |
Time of Departure to Work by Sex in Edmonson
The most frequent times of departure to work in Edmonson are 8:00 AM to 8:29 AM (13, 37.1%) for males and 7:00 AM to 7:29 AM (7, 38.9%) for females.
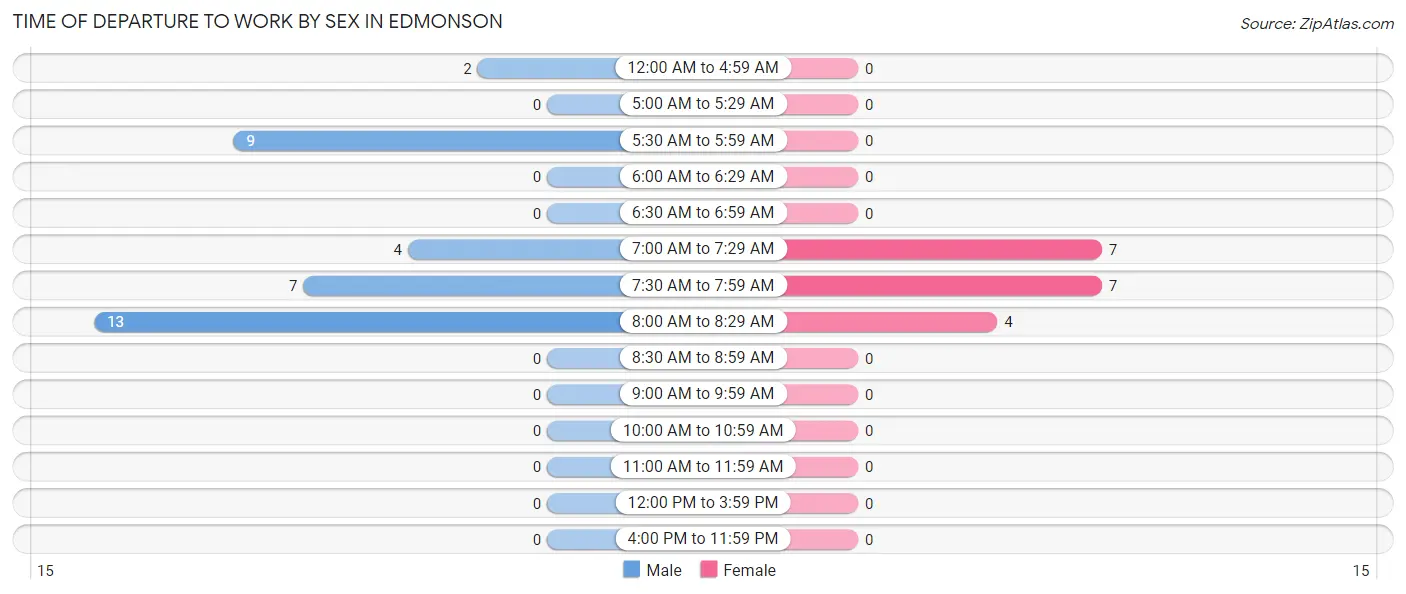
| Time of Departure | Male | Female |
| 12:00 AM to 4:59 AM | 2 (5.7%) | 0 (0.0%) |
| 5:00 AM to 5:29 AM | 0 (0.0%) | 0 (0.0%) |
| 5:30 AM to 5:59 AM | 9 (25.7%) | 0 (0.0%) |
| 6:00 AM to 6:29 AM | 0 (0.0%) | 0 (0.0%) |
| 6:30 AM to 6:59 AM | 0 (0.0%) | 0 (0.0%) |
| 7:00 AM to 7:29 AM | 4 (11.4%) | 7 (38.9%) |
| 7:30 AM to 7:59 AM | 7 (20.0%) | 7 (38.9%) |
| 8:00 AM to 8:29 AM | 13 (37.1%) | 4 (22.2%) |
| 8:30 AM to 8:59 AM | 0 (0.0%) | 0 (0.0%) |
| 9:00 AM to 9:59 AM | 0 (0.0%) | 0 (0.0%) |
| 10:00 AM to 10:59 AM | 0 (0.0%) | 0 (0.0%) |
| 11:00 AM to 11:59 AM | 0 (0.0%) | 0 (0.0%) |
| 12:00 PM to 3:59 PM | 0 (0.0%) | 0 (0.0%) |
| 4:00 PM to 11:59 PM | 0 (0.0%) | 0 (0.0%) |
| Total | 35 (100.0%) | 18 (100.0%) |
Housing Occupancy in Edmonson
Occupancy by Ownership in Edmonson
Of the total 43 dwellings in Edmonson, owner-occupied units account for 28 (65.1%), while renter-occupied units make up 15 (34.9%).
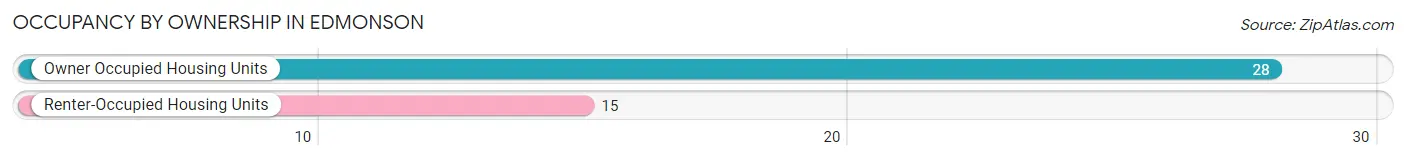
| Occupancy | # Housing Units | % Housing Units |
| Owner Occupied Housing Units | 28 | 65.1% |
| Renter-Occupied Housing Units | 15 | 34.9% |
| Total Occupied Housing Units | 43 | 100.0% |
Occupancy by Household Size in Edmonson
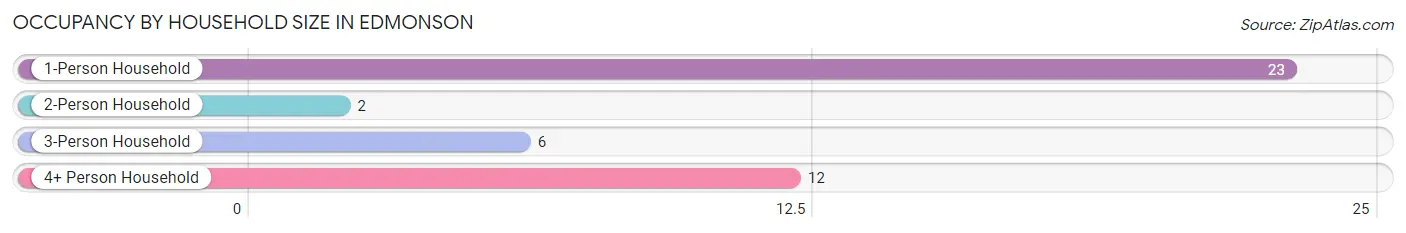
| Household Size | # Housing Units | % Housing Units |
| 1-Person Household | 23 | 53.5% |
| 2-Person Household | 2 | 4.6% |
| 3-Person Household | 6 | 14.0% |
| 4+ Person Household | 12 | 27.9% |
| Total Housing Units | 43 | 100.0% |
Occupancy by Ownership by Household Size in Edmonson
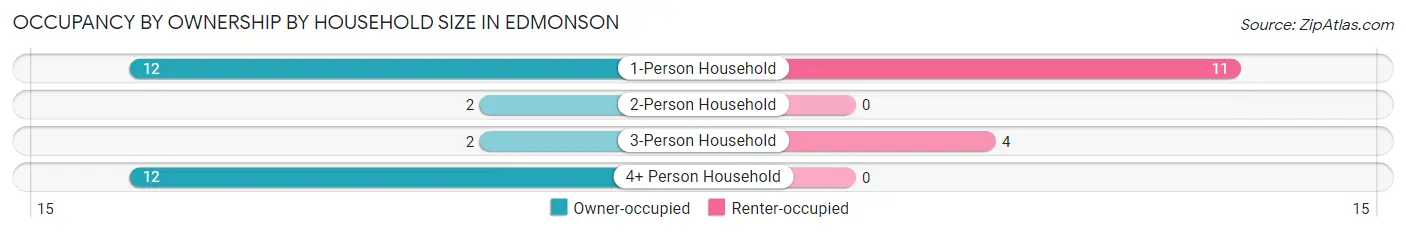
| Household Size | Owner-occupied | Renter-occupied |
| 1-Person Household | 12 (52.2%) | 11 (47.8%) |
| 2-Person Household | 2 (100.0%) | 0 (0.0%) |
| 3-Person Household | 2 (33.3%) | 4 (66.7%) |
| 4+ Person Household | 12 (100.0%) | 0 (0.0%) |
| Total Housing Units | 28 (65.1%) | 15 (34.9%) |
Occupancy by Educational Attainment in Edmonson
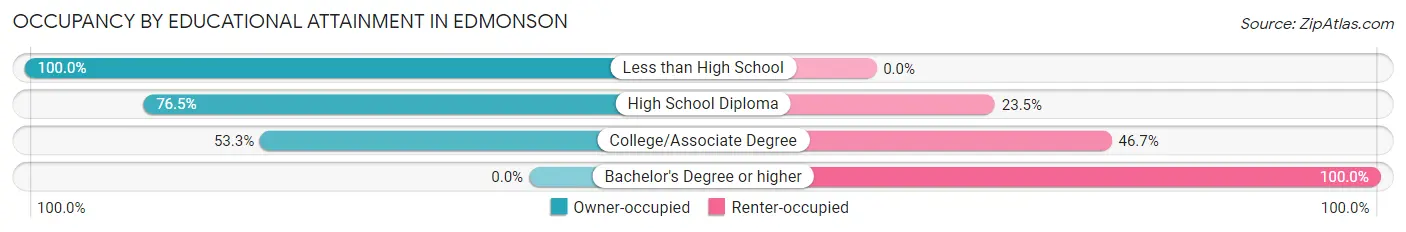
| Household Size | Owner-occupied | Renter-occupied |
| Less than High School | 7 (100.0%) | 0 (0.0%) |
| High School Diploma | 13 (76.5%) | 4 (23.5%) |
| College/Associate Degree | 8 (53.3%) | 7 (46.7%) |
| Bachelor's Degree or higher | 0 (0.0%) | 4 (100.0%) |
Occupancy by Age of Householder in Edmonson
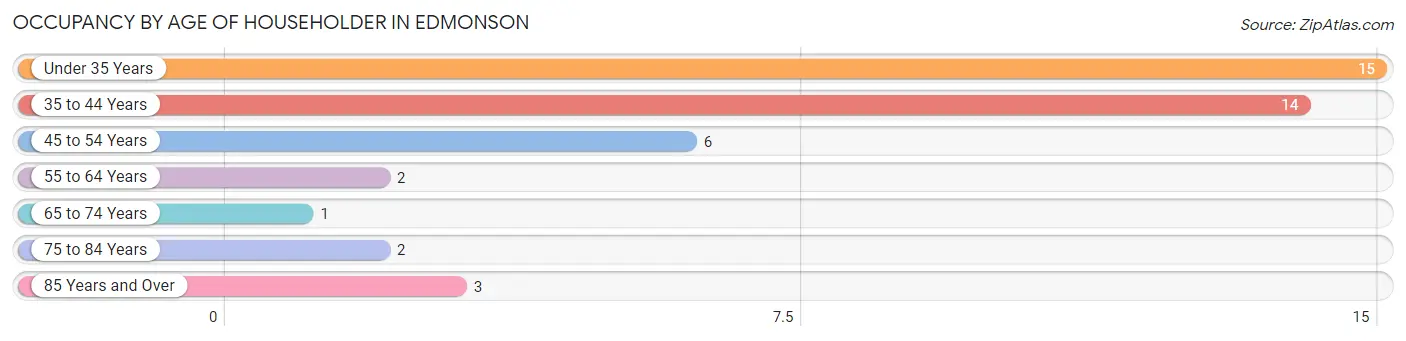
| Age Bracket | # Households | % Households |
| Under 35 Years | 15 | 34.9% |
| 35 to 44 Years | 14 | 32.6% |
| 45 to 54 Years | 6 | 14.0% |
| 55 to 64 Years | 2 | 4.6% |
| 65 to 74 Years | 1 | 2.3% |
| 75 to 84 Years | 2 | 4.6% |
| 85 Years and Over | 3 | 7.0% |
| Total | 43 | 100.0% |
Housing Finances in Edmonson
Median Income by Occupancy in Edmonson
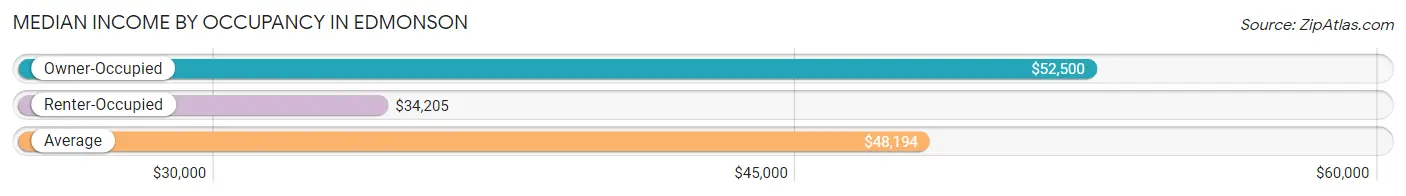
| Occupancy Type | # Households | Median Income |
| Owner-Occupied | 28 (65.1%) | $52,500 |
| Renter-Occupied | 15 (34.9%) | $34,205 |
| Average | 43 (100.0%) | $48,194 |
Occupancy by Householder Income Bracket in Edmonson
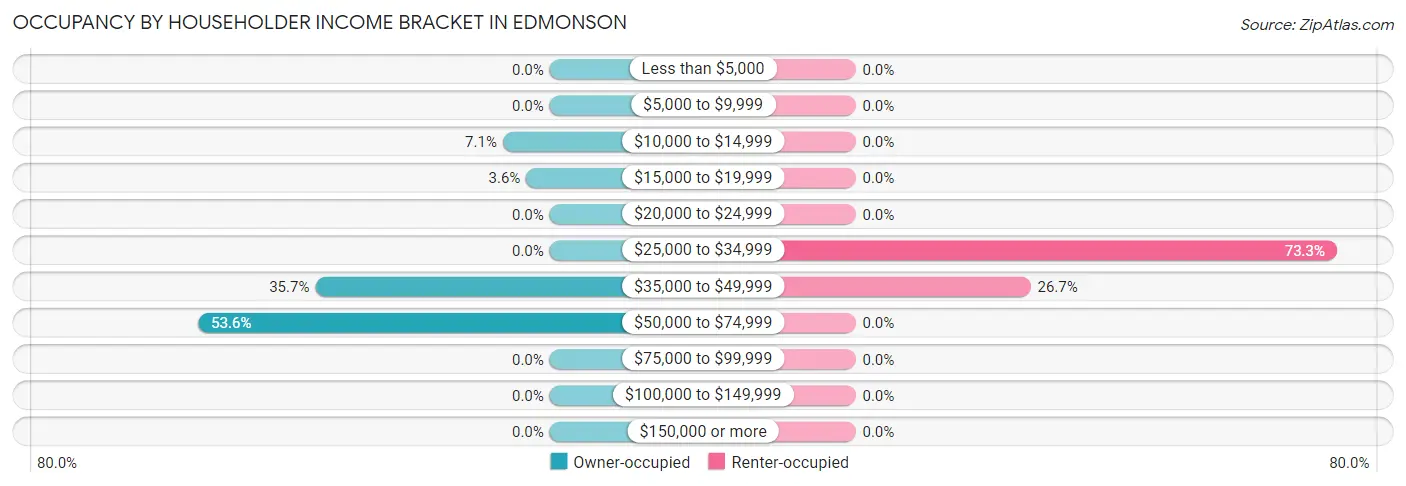
| Income Bracket | Owner-occupied | Renter-occupied |
| Less than $5,000 | 0 (0.0%) | 0 (0.0%) |
| $5,000 to $9,999 | 0 (0.0%) | 0 (0.0%) |
| $10,000 to $14,999 | 2 (7.1%) | 0 (0.0%) |
| $15,000 to $19,999 | 1 (3.6%) | 0 (0.0%) |
| $20,000 to $24,999 | 0 (0.0%) | 0 (0.0%) |
| $25,000 to $34,999 | 0 (0.0%) | 11 (73.3%) |
| $35,000 to $49,999 | 10 (35.7%) | 4 (26.7%) |
| $50,000 to $74,999 | 15 (53.6%) | 0 (0.0%) |
| $75,000 to $99,999 | 0 (0.0%) | 0 (0.0%) |
| $100,000 to $149,999 | 0 (0.0%) | 0 (0.0%) |
| $150,000 or more | 0 (0.0%) | 0 (0.0%) |
| Total | 28 (100.0%) | 15 (100.0%) |
Monthly Housing Cost Tiers in Edmonson
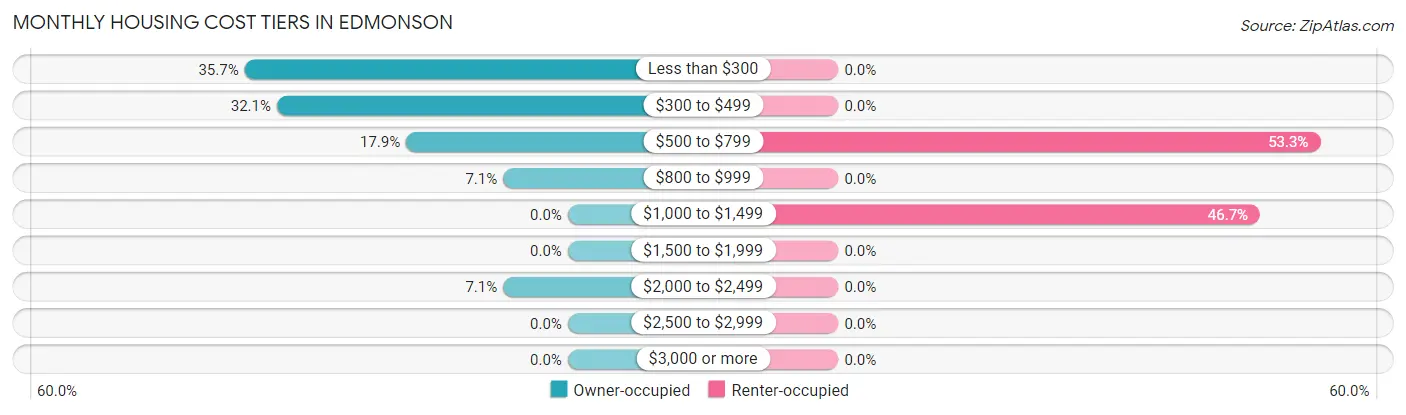
| Monthly Cost | Owner-occupied | Renter-occupied |
| Less than $300 | 10 (35.7%) | 0 (0.0%) |
| $300 to $499 | 9 (32.1%) | 0 (0.0%) |
| $500 to $799 | 5 (17.9%) | 8 (53.3%) |
| $800 to $999 | 2 (7.1%) | 0 (0.0%) |
| $1,000 to $1,499 | 0 (0.0%) | 7 (46.7%) |
| $1,500 to $1,999 | 0 (0.0%) | 0 (0.0%) |
| $2,000 to $2,499 | 2 (7.1%) | 0 (0.0%) |
| $2,500 to $2,999 | 0 (0.0%) | 0 (0.0%) |
| $3,000 or more | 0 (0.0%) | 0 (0.0%) |
| Total | 28 (100.0%) | 15 (100.0%) |
Physical Housing Characteristics in Edmonson
Housing Structures in Edmonson
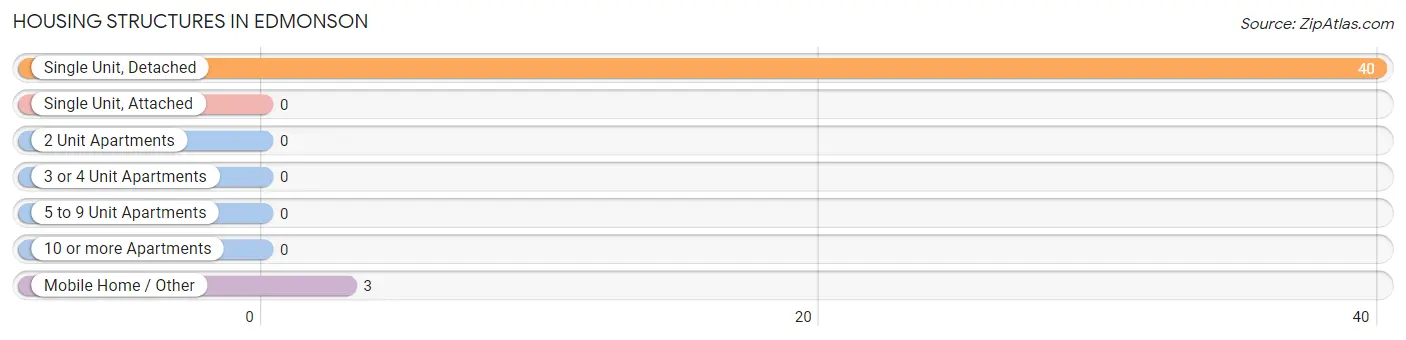
| Structure Type | # Housing Units | % Housing Units |
| Single Unit, Detached | 40 | 93.0% |
| Single Unit, Attached | 0 | 0.0% |
| 2 Unit Apartments | 0 | 0.0% |
| 3 or 4 Unit Apartments | 0 | 0.0% |
| 5 to 9 Unit Apartments | 0 | 0.0% |
| 10 or more Apartments | 0 | 0.0% |
| Mobile Home / Other | 3 | 7.0% |
| Total | 43 | 100.0% |
Housing Structures by Occupancy in Edmonson
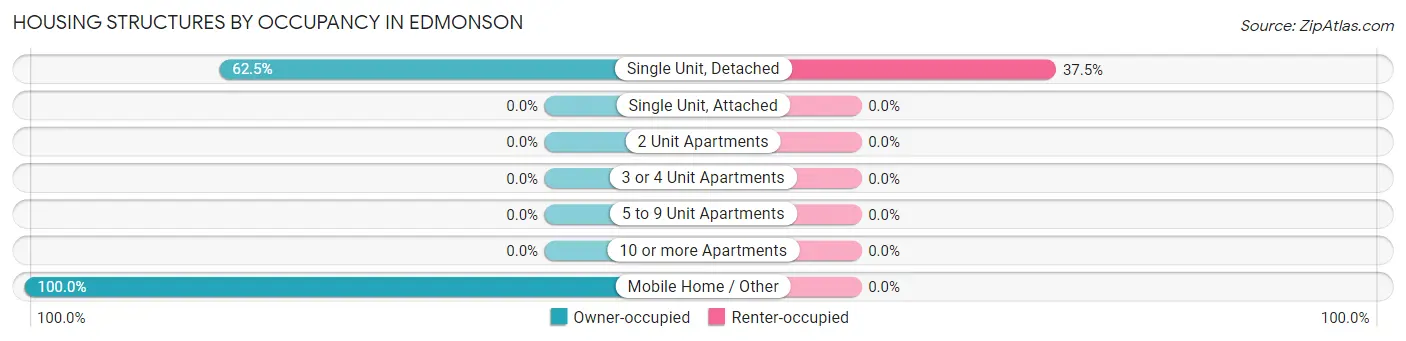
| Structure Type | Owner-occupied | Renter-occupied |
| Single Unit, Detached | 25 (62.5%) | 15 (37.5%) |
| Single Unit, Attached | 0 (0.0%) | 0 (0.0%) |
| 2 Unit Apartments | 0 (0.0%) | 0 (0.0%) |
| 3 or 4 Unit Apartments | 0 (0.0%) | 0 (0.0%) |
| 5 to 9 Unit Apartments | 0 (0.0%) | 0 (0.0%) |
| 10 or more Apartments | 0 (0.0%) | 0 (0.0%) |
| Mobile Home / Other | 3 (100.0%) | 0 (0.0%) |
| Total | 28 (65.1%) | 15 (34.9%) |
Housing Structures by Number of Rooms in Edmonson
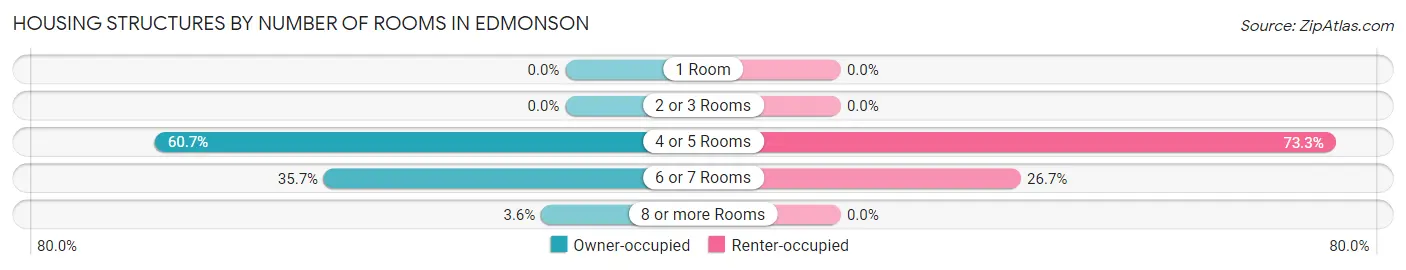
| Number of Rooms | Owner-occupied | Renter-occupied |
| 1 Room | 0 (0.0%) | 0 (0.0%) |
| 2 or 3 Rooms | 0 (0.0%) | 0 (0.0%) |
| 4 or 5 Rooms | 17 (60.7%) | 11 (73.3%) |
| 6 or 7 Rooms | 10 (35.7%) | 4 (26.7%) |
| 8 or more Rooms | 1 (3.6%) | 0 (0.0%) |
| Total | 28 (100.0%) | 15 (100.0%) |
Housing Structure by Heating Type in Edmonson
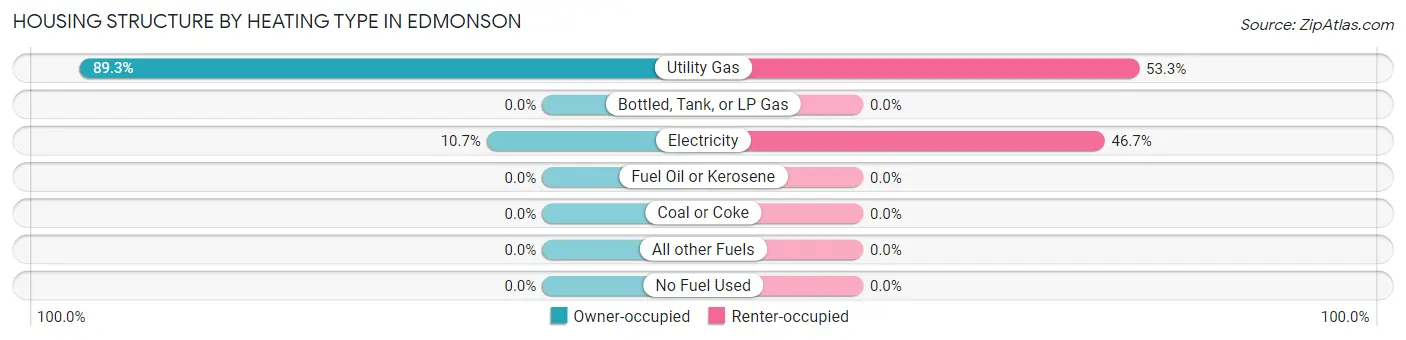
| Heating Type | Owner-occupied | Renter-occupied |
| Utility Gas | 25 (89.3%) | 8 (53.3%) |
| Bottled, Tank, or LP Gas | 0 (0.0%) | 0 (0.0%) |
| Electricity | 3 (10.7%) | 7 (46.7%) |
| Fuel Oil or Kerosene | 0 (0.0%) | 0 (0.0%) |
| Coal or Coke | 0 (0.0%) | 0 (0.0%) |
| All other Fuels | 0 (0.0%) | 0 (0.0%) |
| No Fuel Used | 0 (0.0%) | 0 (0.0%) |
| Total | 28 (100.0%) | 15 (100.0%) |
Household Vehicle Usage in Edmonson
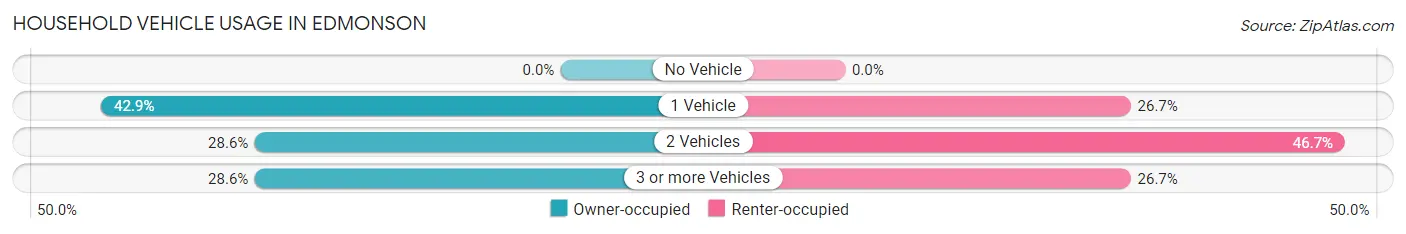
| Vehicles per Household | Owner-occupied | Renter-occupied |
| No Vehicle | 0 (0.0%) | 0 (0.0%) |
| 1 Vehicle | 12 (42.9%) | 4 (26.7%) |
| 2 Vehicles | 8 (28.6%) | 7 (46.7%) |
| 3 or more Vehicles | 8 (28.6%) | 4 (26.7%) |
| Total | 28 (100.0%) | 15 (100.0%) |
Real Estate & Mortgages in Edmonson
Real Estate and Mortgage Overview in Edmonson
| Characteristic | Without Mortgage | With Mortgage |
| Housing Units | 24 | 4 |
| Median Property Value | $93,300 | $0 |
| Median Household Income | $61,250 | $0 |
| Monthly Housing Costs | $314 | $0 |
| Real Estate Taxes | $829 | $0 |
Property Value by Mortgage Status in Edmonson
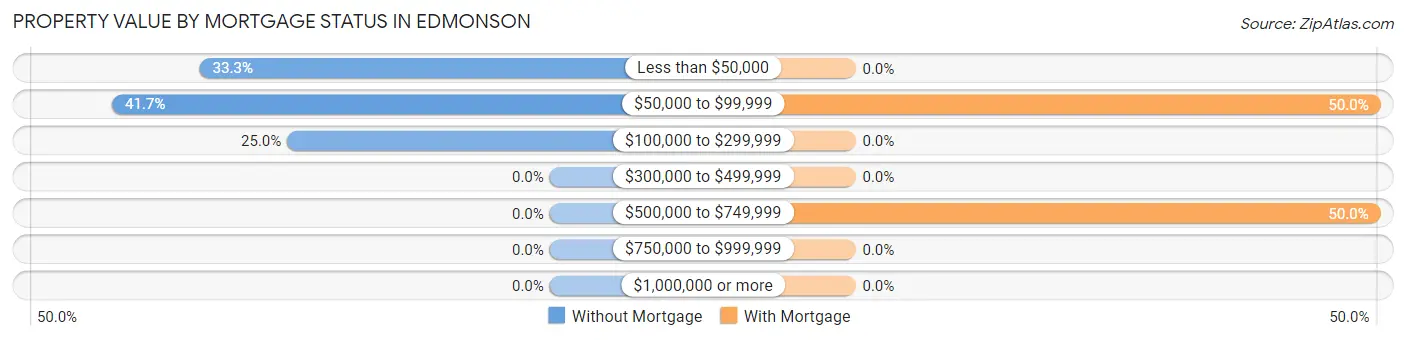
| Property Value | Without Mortgage | With Mortgage |
| Less than $50,000 | 8 (33.3%) | 0 (0.0%) |
| $50,000 to $99,999 | 10 (41.7%) | 2 (50.0%) |
| $100,000 to $299,999 | 6 (25.0%) | 0 (0.0%) |
| $300,000 to $499,999 | 0 (0.0%) | 0 (0.0%) |
| $500,000 to $749,999 | 0 (0.0%) | 2 (50.0%) |
| $750,000 to $999,999 | 0 (0.0%) | 0 (0.0%) |
| $1,000,000 or more | 0 (0.0%) | 0 (0.0%) |
| Total | 24 (100.0%) | 4 (100.0%) |
Household Income by Mortgage Status in Edmonson
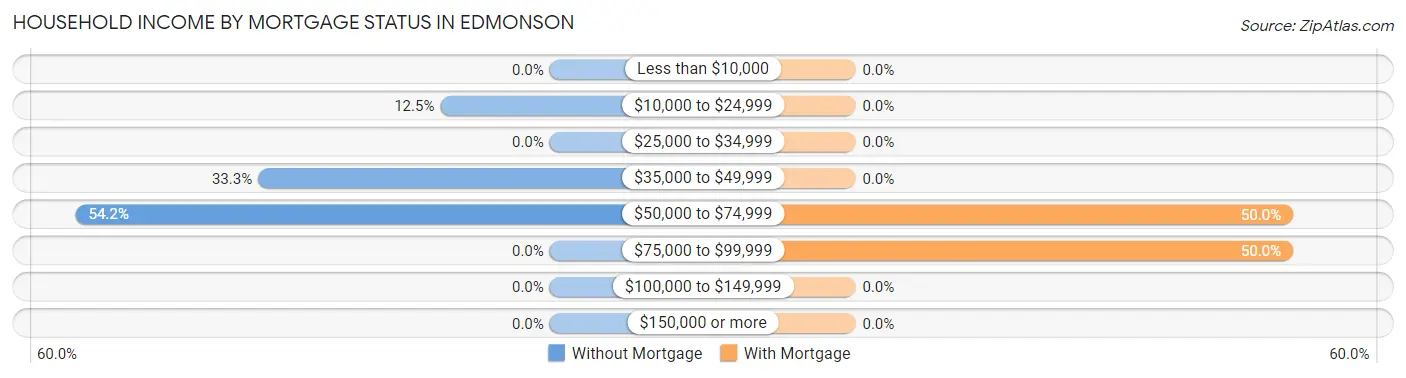
| Household Income | Without Mortgage | With Mortgage |
| Less than $10,000 | 0 (0.0%) | 0 (0.0%) |
| $10,000 to $24,999 | 3 (12.5%) | 0 (0.0%) |
| $25,000 to $34,999 | 0 (0.0%) | 0 (0.0%) |
| $35,000 to $49,999 | 8 (33.3%) | 0 (0.0%) |
| $50,000 to $74,999 | 13 (54.2%) | 2 (50.0%) |
| $75,000 to $99,999 | 0 (0.0%) | 2 (50.0%) |
| $100,000 to $149,999 | 0 (0.0%) | 0 (0.0%) |
| $150,000 or more | 0 (0.0%) | 0 (0.0%) |
| Total | 24 (100.0%) | 4 (100.0%) |
Property Value to Household Income Ratio in Edmonson
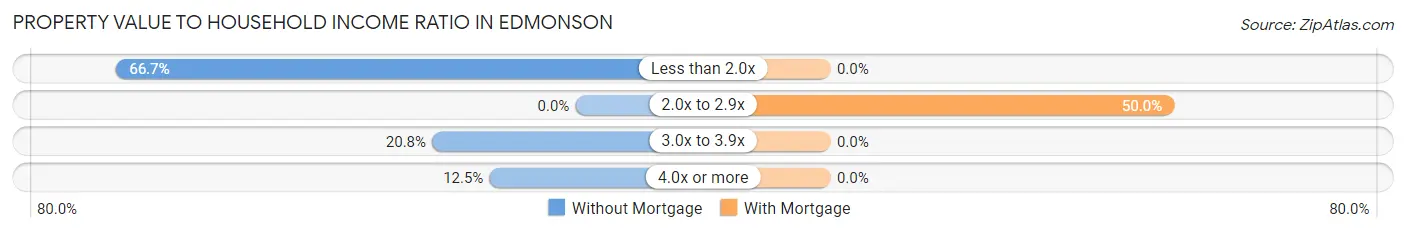
| Value-to-Income Ratio | Without Mortgage | With Mortgage |
| Less than 2.0x | 16 (66.7%) | 0 (0.0%) |
| 2.0x to 2.9x | 0 (0.0%) | 2 (50.0%) |
| 3.0x to 3.9x | 5 (20.8%) | 0 (0.0%) |
| 4.0x or more | 3 (12.5%) | 0 (0.0%) |
| Total | 24 (100.0%) | 4 (100.0%) |
Real Estate Taxes by Mortgage Status in Edmonson
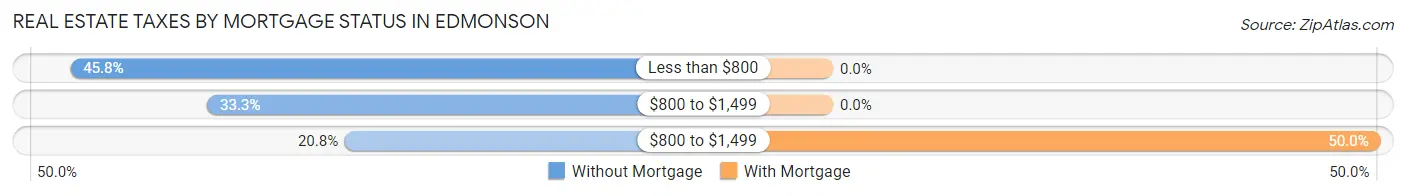
| Property Taxes | Without Mortgage | With Mortgage |
| Less than $800 | 11 (45.8%) | 0 (0.0%) |
| $800 to $1,499 | 8 (33.3%) | 0 (0.0%) |
| $800 to $1,499 | 5 (20.8%) | 2 (50.0%) |
| Total | 24 (100.0%) | 4 (100.0%) |
Health & Disability in Edmonson
Health Insurance Coverage by Age in Edmonson
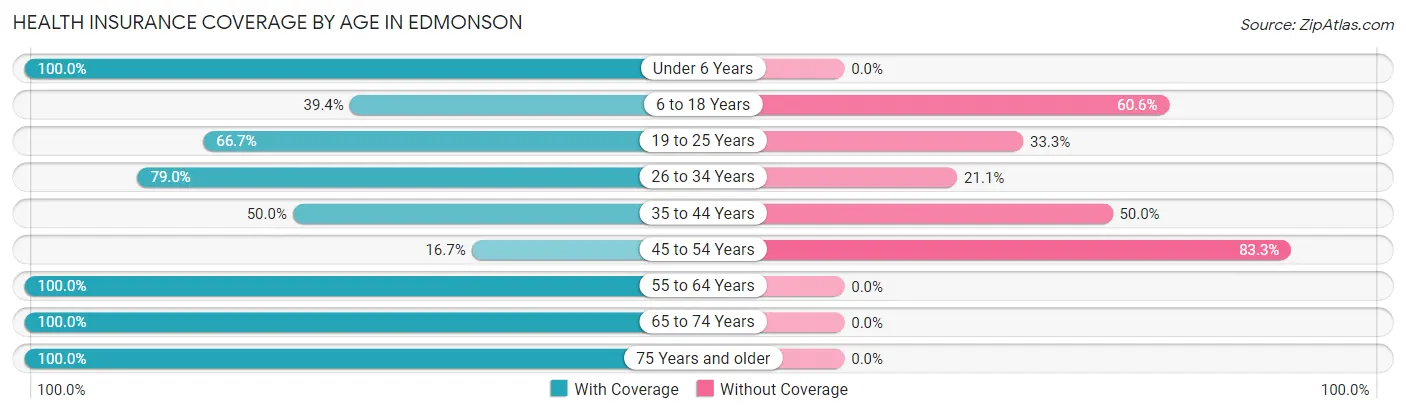
| Age Bracket | With Coverage | Without Coverage |
| Under 6 Years | 3 (100.0%) | 0 (0.0%) |
| 6 to 18 Years | 13 (39.4%) | 20 (60.6%) |
| 19 to 25 Years | 8 (66.7%) | 4 (33.3%) |
| 26 to 34 Years | 15 (78.9%) | 4 (21.0%) |
| 35 to 44 Years | 7 (50.0%) | 7 (50.0%) |
| 45 to 54 Years | 3 (16.7%) | 15 (83.3%) |
| 55 to 64 Years | 2 (100.0%) | 0 (0.0%) |
| 65 to 74 Years | 2 (100.0%) | 0 (0.0%) |
| 75 Years and older | 11 (100.0%) | 0 (0.0%) |
| Total | 64 (56.1%) | 50 (43.9%) |
Health Insurance Coverage by Citizenship Status in Edmonson
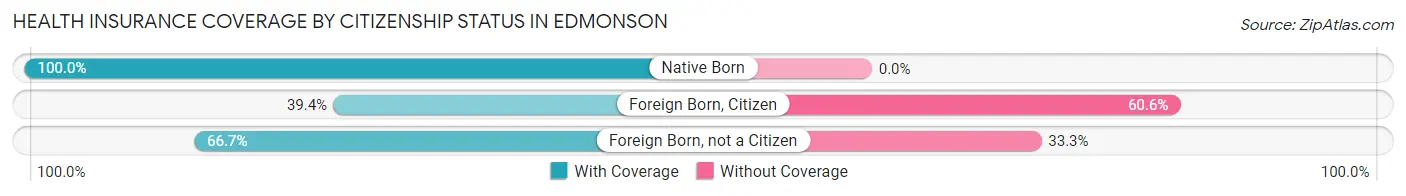
| Citizenship Status | With Coverage | Without Coverage |
| Native Born | 3 (100.0%) | 0 (0.0%) |
| Foreign Born, Citizen | 13 (39.4%) | 20 (60.6%) |
| Foreign Born, not a Citizen | 8 (66.7%) | 4 (33.3%) |
Health Insurance Coverage by Household Income in Edmonson
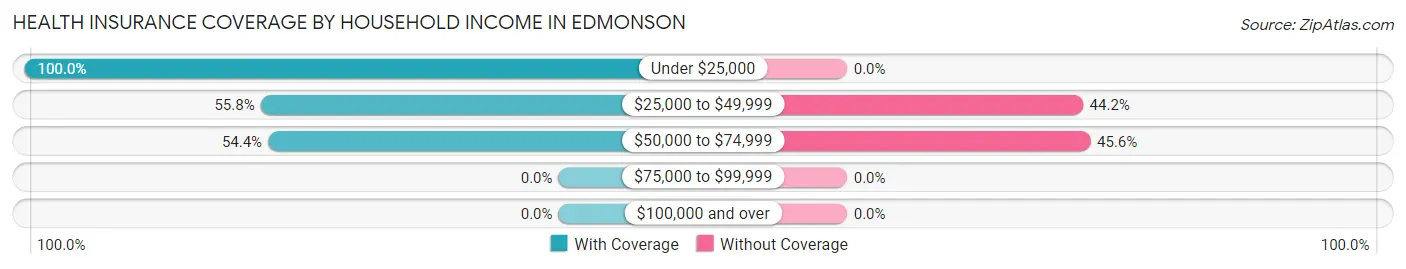
| Household Income | With Coverage | Without Coverage |
| Under $25,000 | 3 (100.0%) | 0 (0.0%) |
| $25,000 to $49,999 | 24 (55.8%) | 19 (44.2%) |
| $50,000 to $74,999 | 37 (54.4%) | 31 (45.6%) |
| $75,000 to $99,999 | 0 (0.0%) | 0 (0.0%) |
| $100,000 and over | 0 (0.0%) | 0 (0.0%) |
Public vs Private Health Insurance Coverage by Age in Edmonson
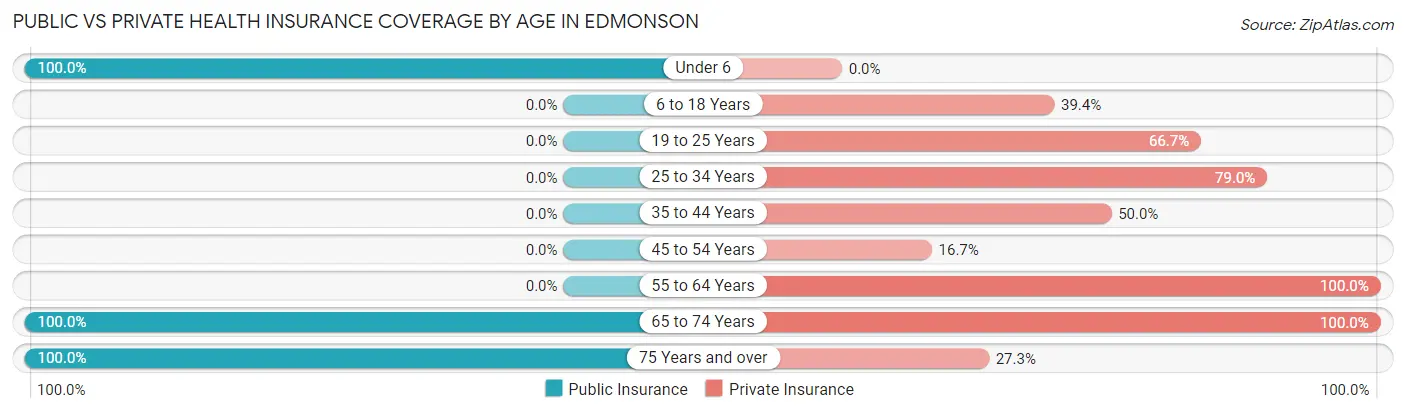
| Age Bracket | Public Insurance | Private Insurance |
| Under 6 | 3 (100.0%) | 0 (0.0%) |
| 6 to 18 Years | 0 (0.0%) | 13 (39.4%) |
| 19 to 25 Years | 0 (0.0%) | 8 (66.7%) |
| 25 to 34 Years | 0 (0.0%) | 15 (78.9%) |
| 35 to 44 Years | 0 (0.0%) | 7 (50.0%) |
| 45 to 54 Years | 0 (0.0%) | 3 (16.7%) |
| 55 to 64 Years | 0 (0.0%) | 2 (100.0%) |
| 65 to 74 Years | 2 (100.0%) | 2 (100.0%) |
| 75 Years and over | 11 (100.0%) | 3 (27.3%) |
| Total | 16 (14.0%) | 53 (46.5%) |
Disability Status by Sex by Age in Edmonson
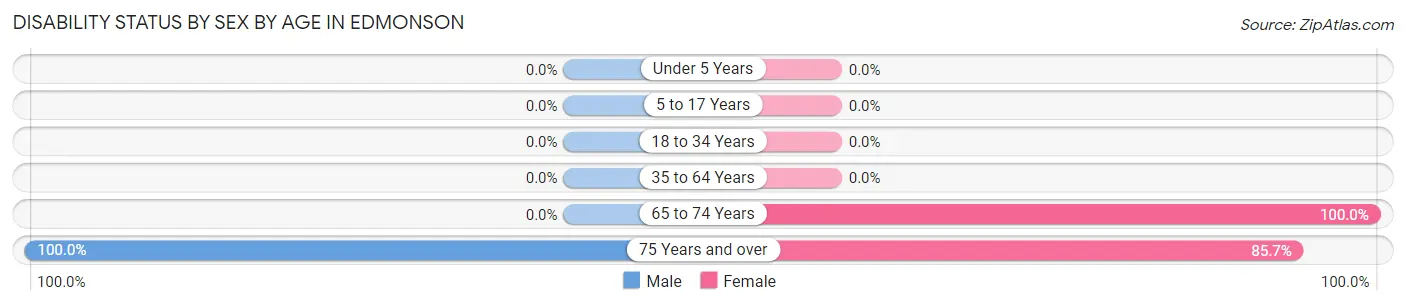
| Age Bracket | Male | Female |
| Under 5 Years | 0 (0.0%) | 0 (0.0%) |
| 5 to 17 Years | 0 (0.0%) | 0 (0.0%) |
| 18 to 34 Years | 0 (0.0%) | 0 (0.0%) |
| 35 to 64 Years | 0 (0.0%) | 0 (0.0%) |
| 65 to 74 Years | 0 (0.0%) | 1 (100.0%) |
| 75 Years and over | 4 (100.0%) | 6 (85.7%) |
Disability Class by Sex by Age in Edmonson
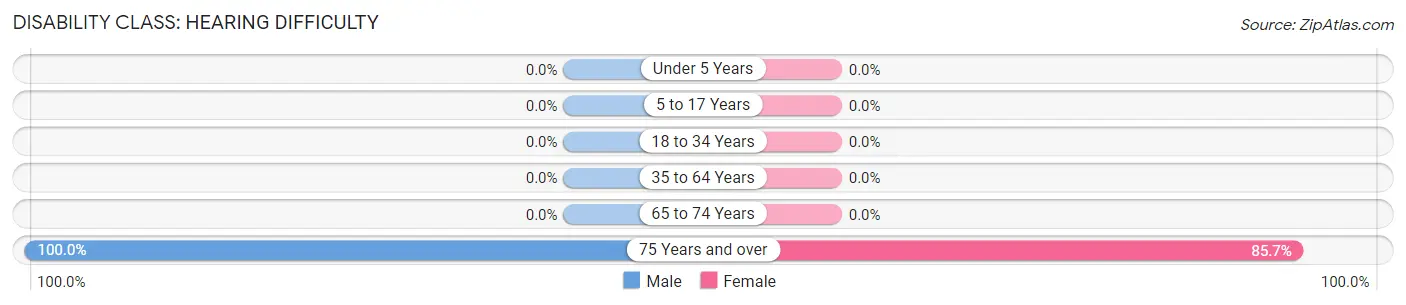
Disability Class: Hearing Difficulty
| Age Bracket | Male | Female |
| Under 5 Years | 0 (0.0%) | 0 (0.0%) |
| 5 to 17 Years | 0 (0.0%) | 0 (0.0%) |
| 18 to 34 Years | 0 (0.0%) | 0 (0.0%) |
| 35 to 64 Years | 0 (0.0%) | 0 (0.0%) |
| 65 to 74 Years | 0 (0.0%) | 0 (0.0%) |
| 75 Years and over | 4 (100.0%) | 6 (85.7%) |
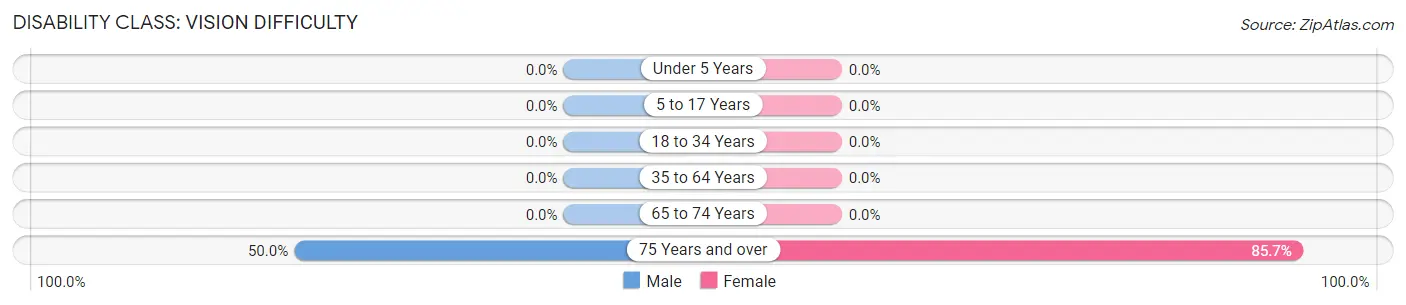
Disability Class: Vision Difficulty
| Age Bracket | Male | Female |
| Under 5 Years | 0 (0.0%) | 0 (0.0%) |
| 5 to 17 Years | 0 (0.0%) | 0 (0.0%) |
| 18 to 34 Years | 0 (0.0%) | 0 (0.0%) |
| 35 to 64 Years | 0 (0.0%) | 0 (0.0%) |
| 65 to 74 Years | 0 (0.0%) | 0 (0.0%) |
| 75 Years and over | 2 (50.0%) | 6 (85.7%) |
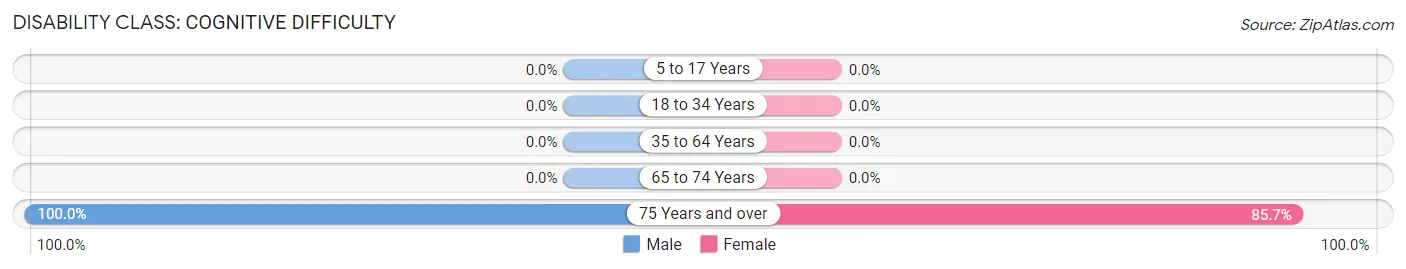
Disability Class: Cognitive Difficulty
| Age Bracket | Male | Female |
| 5 to 17 Years | 0 (0.0%) | 0 (0.0%) |
| 18 to 34 Years | 0 (0.0%) | 0 (0.0%) |
| 35 to 64 Years | 0 (0.0%) | 0 (0.0%) |
| 65 to 74 Years | 0 (0.0%) | 0 (0.0%) |
| 75 Years and over | 4 (100.0%) | 6 (85.7%) |
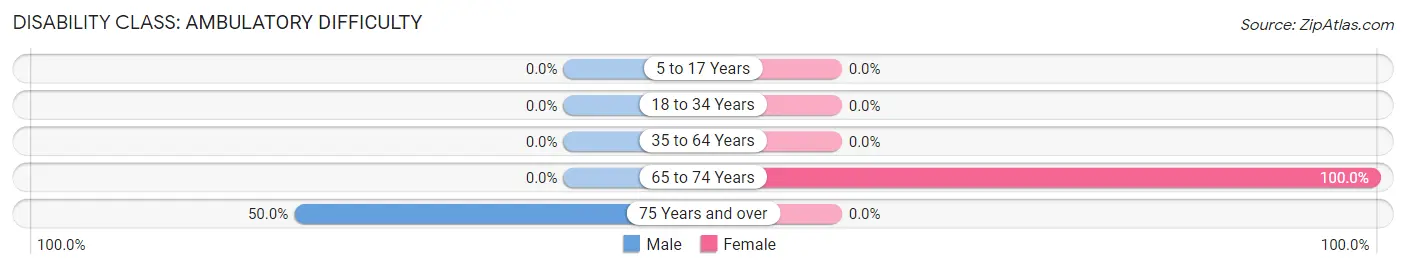
Disability Class: Ambulatory Difficulty
| Age Bracket | Male | Female |
| 5 to 17 Years | 0 (0.0%) | 0 (0.0%) |
| 18 to 34 Years | 0 (0.0%) | 0 (0.0%) |
| 35 to 64 Years | 0 (0.0%) | 0 (0.0%) |
| 65 to 74 Years | 0 (0.0%) | 1 (100.0%) |
| 75 Years and over | 2 (50.0%) | 0 (0.0%) |
Disability Class: Self-Care Difficulty
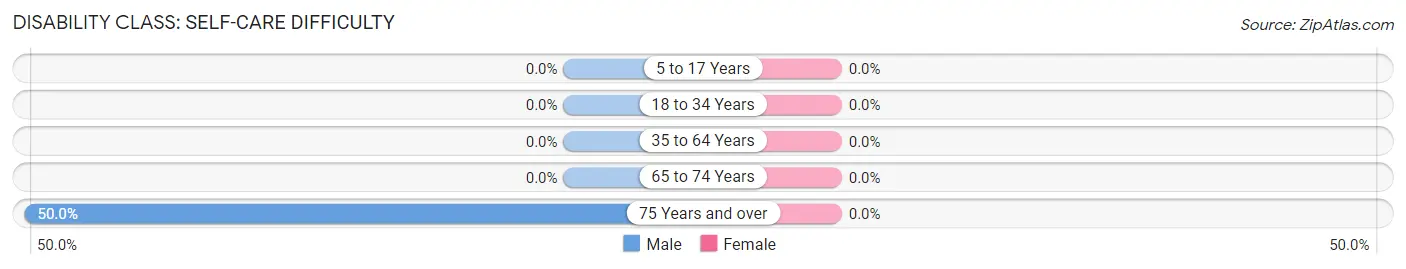
| Age Bracket | Male | Female |
| 5 to 17 Years | 0 (0.0%) | 0 (0.0%) |
| 18 to 34 Years | 0 (0.0%) | 0 (0.0%) |
| 35 to 64 Years | 0 (0.0%) | 0 (0.0%) |
| 65 to 74 Years | 0 (0.0%) | 0 (0.0%) |
| 75 Years and over | 2 (50.0%) | 0 (0.0%) |
Technology Access in Edmonson
Computing Device Access in Edmonson
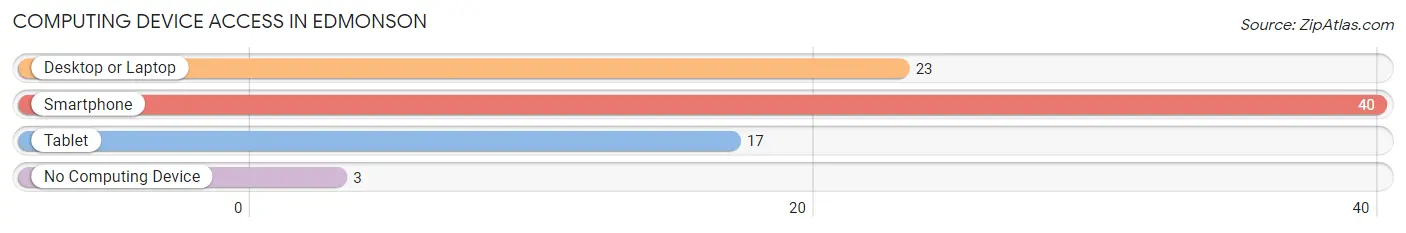
| Device Type | # Households | % Households |
| Desktop or Laptop | 23 | 53.5% |
| Smartphone | 40 | 93.0% |
| Tablet | 17 | 39.5% |
| No Computing Device | 3 | 7.0% |
| Total | 43 | 100.0% |
Internet Access in Edmonson
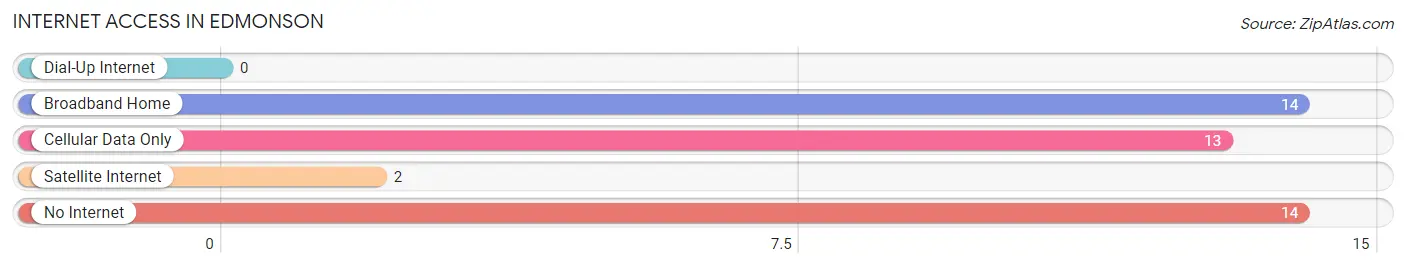
| Internet Type | # Households | % Households |
| Dial-Up Internet | 0 | 0.0% |
| Broadband Home | 14 | 32.6% |
| Cellular Data Only | 13 | 30.2% |
| Satellite Internet | 2 | 4.6% |
| No Internet | 14 | 32.6% |
| Total | 43 | 100.0% |
Edmonson Summary
Edmonson, Texas is a small town located in the western part of the state, about 25 miles east of Lubbock. It is part of the Lubbock Metropolitan Statistical Area and has a population of just over 1,000 people. The town was founded in 1891 and named after a local rancher, William Edmonson.
History
Edmonson was founded in 1891 by William Edmonson, a local rancher. The town was originally called Edmonsonville, but the name was changed to Edmonson in 1895. The town was incorporated in 1909 and the first mayor was elected in 1910.
The town grew slowly but steadily over the years, and by the 1950s it had a population of around 1,000 people. The town was home to several businesses, including a cotton gin, a grocery store, a bank, and a post office.
In the 1960s, the town began to decline as many of its businesses closed. The population dropped to around 500 people by the 1970s. In the 1980s, the town began to experience a resurgence as new businesses opened and the population began to grow again.
Geography
Edmonson is located in the western part of Texas, about 25 miles east of Lubbock. It is part of the Lubbock Metropolitan Statistical Area. The town is situated on the Llano Estacado, a large plateau that covers much of the western part of the state. The town is located at an elevation of 3,000 feet above sea level.
The climate in Edmonson is semi-arid, with hot summers and mild winters. The average annual temperature is around 68 degrees Fahrenheit. The average annual precipitation is around 17 inches.
Economy
The economy of Edmonson is largely based on agriculture. The town is home to several farms and ranches, which produce a variety of crops, including cotton, corn, wheat, and sorghum. The town is also home to several businesses, including a grocery store, a bank, and a post office.
Demographics
As of the 2010 census, the population of Edmonson was 1,072. The racial makeup of the town was 94.3% White, 0.7% African American, 0.3% Native American, 0.2% Asian, and 4.5% from other races. The median household income was $37,500, and the median family income was $41,250.
The town is served by the Edmonson Independent School District, which includes one elementary school, one middle school, and one high school. The town is also home to several churches, including the First Baptist Church, the First United Methodist Church, and the Church of Christ.
Edmonson is a small town with a rich history and a bright future. The town is home to a diverse population and a strong economy. It is a great place to live, work, and raise a family.
Common Questions
What is Per Capita Income in Edmonson?
Per Capita income in Edmonson is $19,032.
What is the Median Family Income in Edmonson?
Median Family Income in Edmonson is $70,714.
What is the Median Household income in Edmonson?
Median Household Income in Edmonson is $48,194.
What is Income or Wage Gap in Edmonson?
Income or Wage Gap in Edmonson is 7.4%.
Women in Edmonson earn 92.6 cents for every dollar earned by a man.
What is Inequality or Gini Index in Edmonson?
Inequality or Gini Index in Edmonson is 0.20.
What is the Total Population of Edmonson?
Total Population of Edmonson is 114.
What is the Total Male Population of Edmonson?
Total Male Population of Edmonson is 66.
What is the Total Female Population of Edmonson?
Total Female Population of Edmonson is 48.
What is the Ratio of Males per 100 Females in Edmonson?
There are 137.50 Males per 100 Females in Edmonson.
What is the Ratio of Females per 100 Males in Edmonson?
There are 72.73 Females per 100 Males in Edmonson.
What is the Median Population Age in Edmonson?
Median Population Age in Edmonson is 34.1 Years.
What is the Average Family Size in Edmonson
Average Family Size in Edmonson is 4.5 People.
What is the Average Household Size in Edmonson
Average Household Size in Edmonson is 2.6 People.
How Large is the Labor Force in Edmonson?
There are 55 People in the Labor Forcein in Edmonson.
What is the Percentage of People in the Labor Force in Edmonson?
70.5% of People are in the Labor Force in Edmonson.
What is the Unemployment Rate in Edmonson?
Unemployment Rate in Edmonson is 3.6%.