Hayes, LA Map & Demographics
Hayes Map
Hayes Overview
$21,676
PER CAPITA INCOME
0.48
INEQUALITY / GINI INDEX
477
TOTAL POPULATION
213
MALE POPULATION
264
FEMALE POPULATION
80.68
MALES / 100 FEMALES
123.94
FEMALES / 100 MALES
30.1
MEDIAN AGE
3.6
AVG FAMILY SIZE
3.9
AVG HOUSEHOLD SIZE
201
LABOR FORCE [ PEOPLE ]
60.0%
PERCENT IN LABOR FORCE
21.9%
UNEMPLOYMENT RATE
Hayes Zip Codes
Hayes Area Codes
Income in Hayes
Income Overview in Hayes
| Characteristic | Number | Measure |
| Per Capita Income | 477 | $21,676 |
| Median Family Income | 121 | $0 |
| Mean Family Income | 121 | $69,200 |
| Median Household Income | 121 | $0 |
| Mean Household Income | 121 | $76,260 |
| Income Deficit | 121 | $0 |
| Wage / Income Gap (%) | 477 | 0.00% |
| Wage / Income Gap ($) | 477 | 100.00¢ per $1 |
| Gini / Inequality Index | 477 | 0.48 |
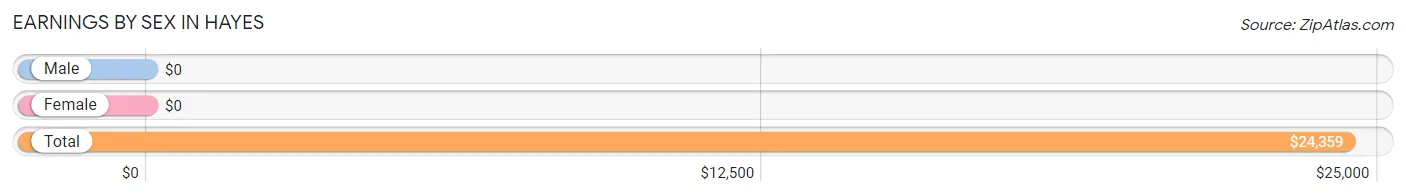
Earnings by Sex in Hayes
| Sex | Number | Average Earnings |
| Male | 99 (49.2%) | $0 |
| Female | 102 (50.7%) | $0 |
| Total | 201 (100.0%) | $24,359 |
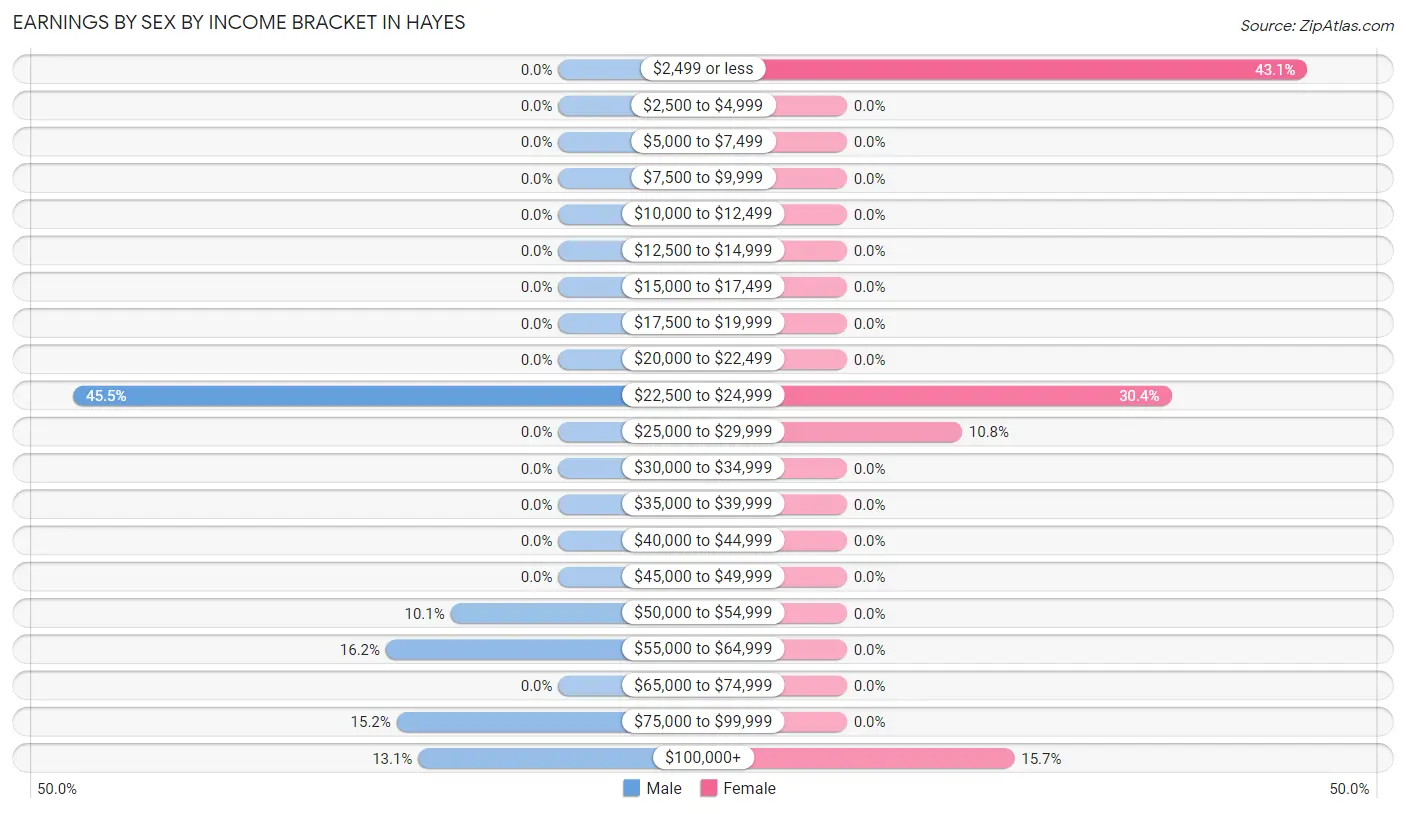
Earnings by Sex by Income Bracket in Hayes
The most common earnings brackets in Hayes are $22,500 to $24,999 for men (45 | 45.5%) and $2,499 or less for women (44 | 43.1%).
| Income | Male | Female |
| $2,499 or less | 0 (0.0%) | 44 (43.1%) |
| $2,500 to $4,999 | 0 (0.0%) | 0 (0.0%) |
| $5,000 to $7,499 | 0 (0.0%) | 0 (0.0%) |
| $7,500 to $9,999 | 0 (0.0%) | 0 (0.0%) |
| $10,000 to $12,499 | 0 (0.0%) | 0 (0.0%) |
| $12,500 to $14,999 | 0 (0.0%) | 0 (0.0%) |
| $15,000 to $17,499 | 0 (0.0%) | 0 (0.0%) |
| $17,500 to $19,999 | 0 (0.0%) | 0 (0.0%) |
| $20,000 to $22,499 | 0 (0.0%) | 0 (0.0%) |
| $22,500 to $24,999 | 45 (45.5%) | 31 (30.4%) |
| $25,000 to $29,999 | 0 (0.0%) | 11 (10.8%) |
| $30,000 to $34,999 | 0 (0.0%) | 0 (0.0%) |
| $35,000 to $39,999 | 0 (0.0%) | 0 (0.0%) |
| $40,000 to $44,999 | 0 (0.0%) | 0 (0.0%) |
| $45,000 to $49,999 | 0 (0.0%) | 0 (0.0%) |
| $50,000 to $54,999 | 10 (10.1%) | 0 (0.0%) |
| $55,000 to $64,999 | 16 (16.2%) | 0 (0.0%) |
| $65,000 to $74,999 | 0 (0.0%) | 0 (0.0%) |
| $75,000 to $99,999 | 15 (15.1%) | 0 (0.0%) |
| $100,000+ | 13 (13.1%) | 16 (15.7%) |
| Total | 99 (100.0%) | 102 (100.0%) |
Earnings by Sex by Educational Attainment in Hayes
| Educational Attainment | Male Income | Female Income |
| Less than High School | - | - |
| High School Diploma | - | - |
| College or Associate's Degree | - | - |
| Bachelor's Degree | - | - |
| Graduate Degree | - | - |
| Total | - | - |
Family Income in Hayes
Family Income Brackets in Hayes
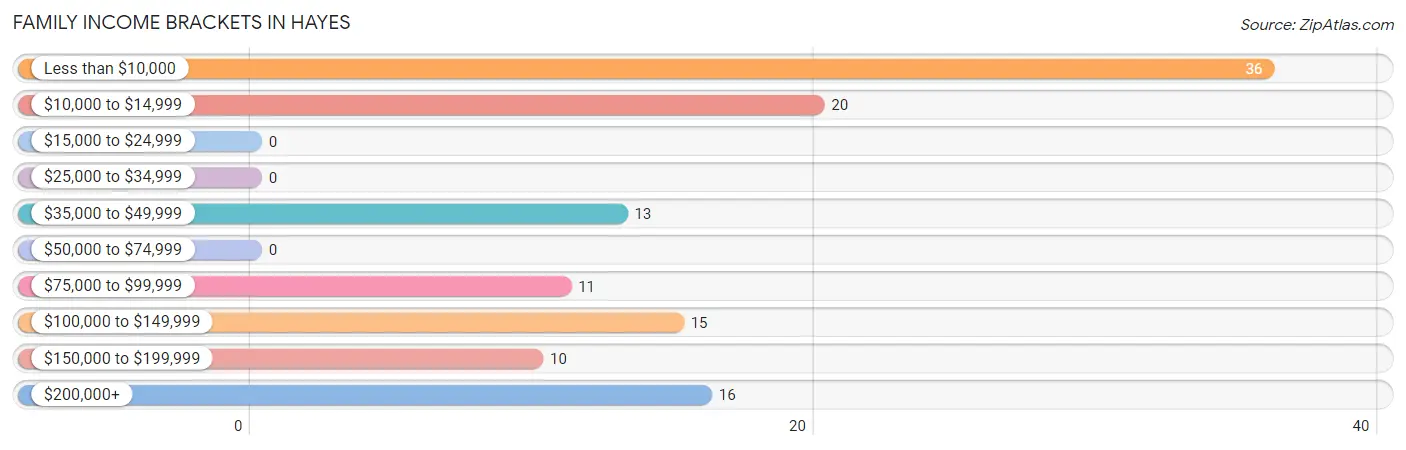
According to the Hayes family income data, there are 36 families falling into the less than $10,000 income range, which is the most common income bracket and makes up 29.7% of all families.
| Income Bracket | # Families | % Families |
| Less than $10,000 | 36 | 29.8% |
| $10,000 to $14,999 | 20 | 16.5% |
| $15,000 to $24,999 | 0 | 0.0% |
| $25,000 to $34,999 | 0 | 0.0% |
| $35,000 to $49,999 | 13 | 10.7% |
| $50,000 to $74,999 | 0 | 0.0% |
| $75,000 to $99,999 | 11 | 9.1% |
| $100,000 to $149,999 | 15 | 12.4% |
| $150,000 to $199,999 | 10 | 8.3% |
| $200,000+ | 16 | 13.2% |
Family Income by Famaliy Size in Hayes
| Income Bracket | # Families | Median Income |
| 2-Person Families | 13 (10.7%) | $0 |
| 3-Person Families | 92 (76.0%) | $0 |
| 4-Person Families | 0 (0.0%) | $0 |
| 5-Person Families | 16 (13.2%) | $0 |
| 6-Person Families | 0 (0.0%) | $0 |
| 7+ Person Families | 0 (0.0%) | $0 |
| Total | 121 (100.0%) | $0 |
Family Income by Number of Earners in Hayes
| Number of Earners | # Families | Median Income |
| No Earners | 49 (40.5%) | $0 |
| 1 Earner | 30 (24.8%) | $0 |
| 2 Earners | 26 (21.5%) | $0 |
| 3+ Earners | 16 (13.2%) | $0 |
| Total | 121 (100.0%) | $0 |
Household Income in Hayes
Household Income Brackets in Hayes
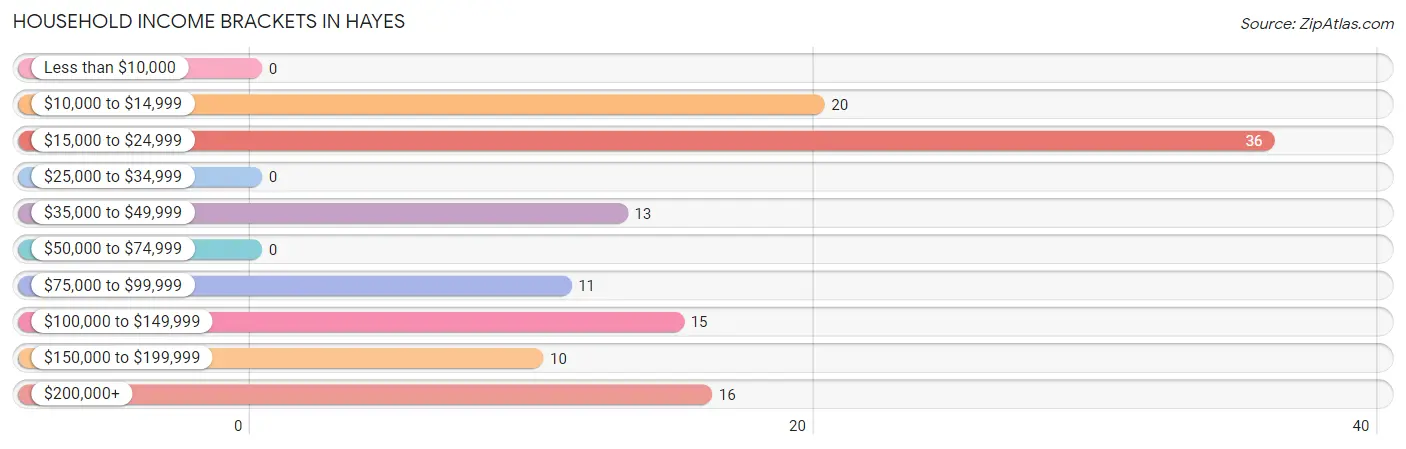
With 36 households falling in the category, the $15,000 to $24,999 income range is the most frequent in Hayes, accounting for 29.7% of all households.
| Income Bracket | # Households | % Households |
| Less than $10,000 | 0 | 0.0% |
| $10,000 to $14,999 | 20 | 16.5% |
| $15,000 to $24,999 | 36 | 29.8% |
| $25,000 to $34,999 | 0 | 0.0% |
| $35,000 to $49,999 | 13 | 10.7% |
| $50,000 to $74,999 | 0 | 0.0% |
| $75,000 to $99,999 | 11 | 9.1% |
| $100,000 to $149,999 | 15 | 12.4% |
| $150,000 to $199,999 | 10 | 8.3% |
| $200,000+ | 16 | 13.2% |
Household Income by Householder Age in Hayes
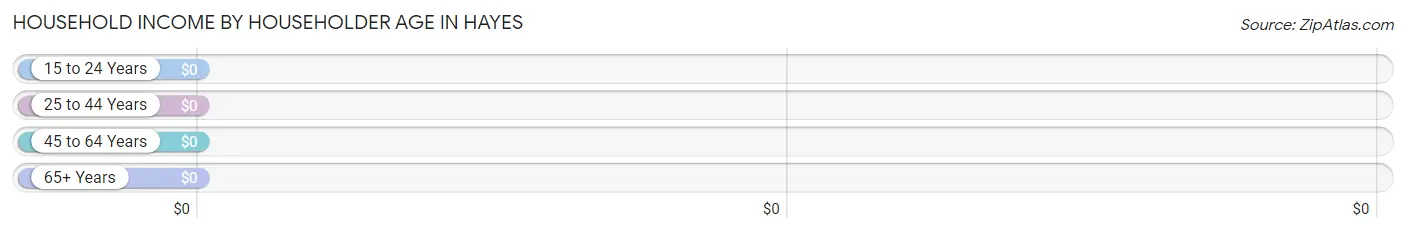
| Income Bracket | # Households | Median Income |
| 15 to 24 Years | 0 (0.0%) | $0 |
| 25 to 44 Years | 47 (38.8%) | $0 |
| 45 to 64 Years | 61 (50.4%) | $0 |
| 65+ Years | 13 (10.7%) | $0 |
| Total | 121 (100.0%) | $0 |
Poverty in Hayes
Income Below Poverty by Sex and Age in Hayes
With 31.0% poverty level for males and 51.1% for females among the residents of Hayes, 12 to 14 year old males and 5 year old females are the most vulnerable to poverty, with 26 males (100.0%) and 35 females (100.0%) in their respective age groups living below the poverty level.
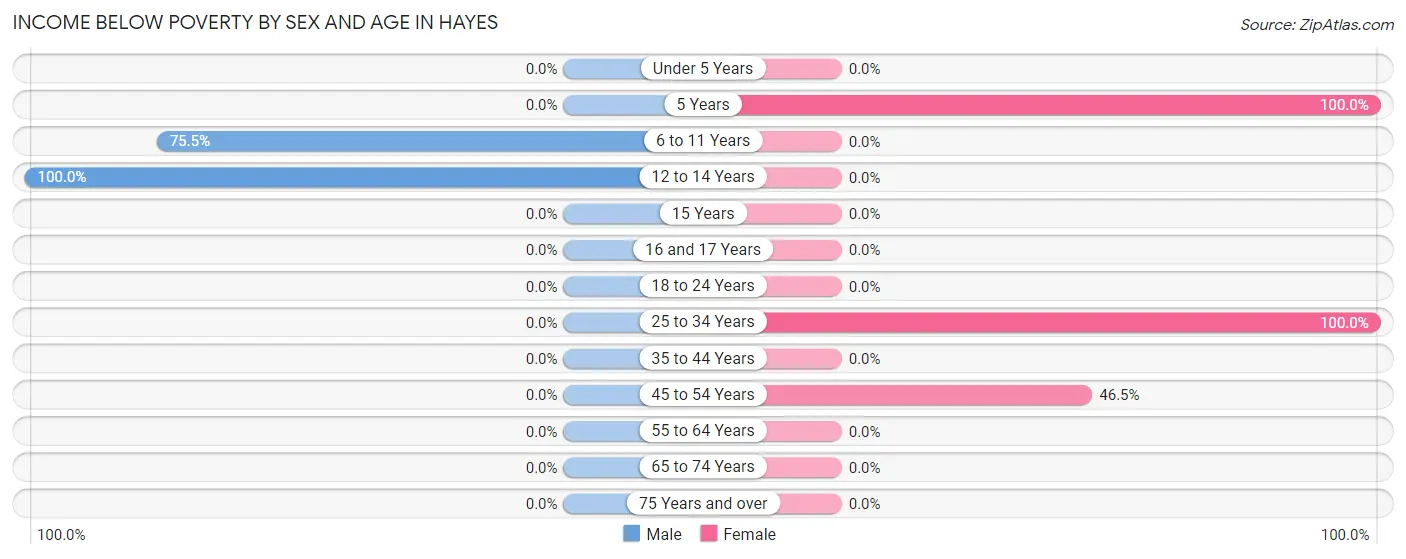
| Age Bracket | Male | Female |
| Under 5 Years | 0 (0.0%) | 0 (0.0%) |
| 5 Years | 0 (0.0%) | 35 (100.0%) |
| 6 to 11 Years | 40 (75.5%) | 0 (0.0%) |
| 12 to 14 Years | 26 (100.0%) | 0 (0.0%) |
| 15 Years | 0 (0.0%) | 0 (0.0%) |
| 16 and 17 Years | 0 (0.0%) | 0 (0.0%) |
| 18 to 24 Years | 0 (0.0%) | 0 (0.0%) |
| 25 to 34 Years | 0 (0.0%) | 80 (100.0%) |
| 35 to 44 Years | 0 (0.0%) | 0 (0.0%) |
| 45 to 54 Years | 0 (0.0%) | 20 (46.5%) |
| 55 to 64 Years | 0 (0.0%) | 0 (0.0%) |
| 65 to 74 Years | 0 (0.0%) | 0 (0.0%) |
| 75 Years and over | 0 (0.0%) | 0 (0.0%) |
| Total | 66 (31.0%) | 135 (51.1%) |
Income Above Poverty by Sex and Age in Hayes
According to the poverty statistics in Hayes, males aged 18 to 24 years and females aged 6 to 11 years are the age groups that are most secure financially, with 100.0% of males and 100.0% of females in these age groups living above the poverty line.
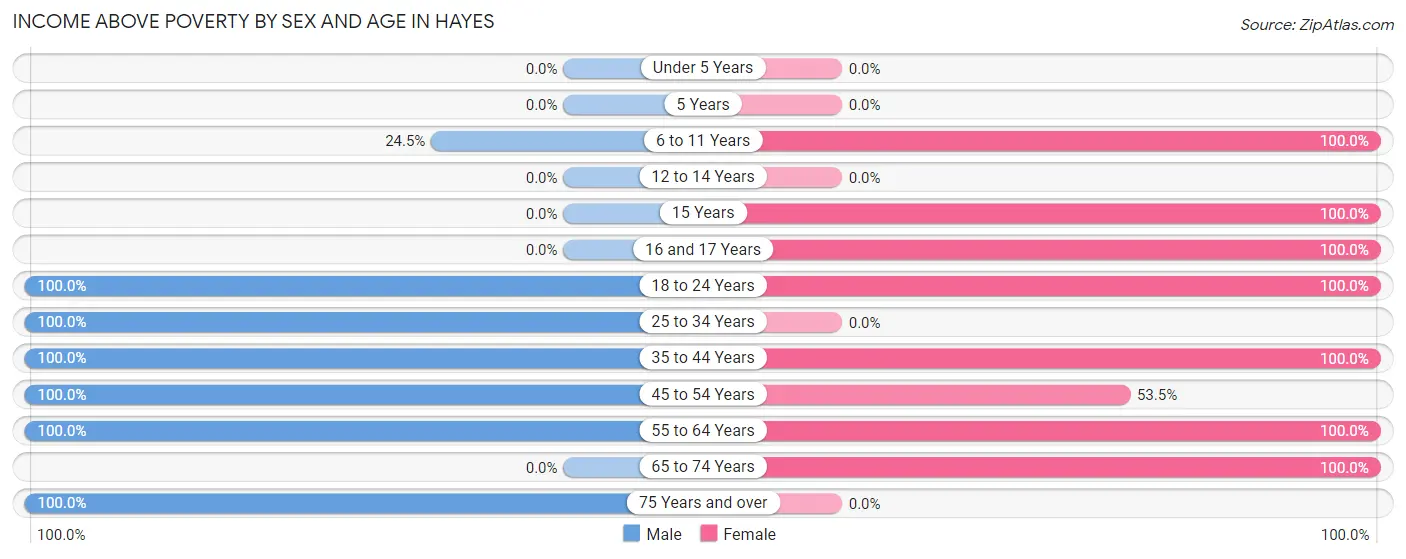
| Age Bracket | Male | Female |
| Under 5 Years | 0 (0.0%) | 0 (0.0%) |
| 5 Years | 0 (0.0%) | 0 (0.0%) |
| 6 to 11 Years | 13 (24.5%) | 13 (100.0%) |
| 12 to 14 Years | 0 (0.0%) | 0 (0.0%) |
| 15 Years | 0 (0.0%) | 15 (100.0%) |
| 16 and 17 Years | 0 (0.0%) | 20 (100.0%) |
| 18 to 24 Years | 16 (100.0%) | 18 (100.0%) |
| 25 to 34 Years | 45 (100.0%) | 0 (0.0%) |
| 35 to 44 Years | 10 (100.0%) | 11 (100.0%) |
| 45 to 54 Years | 28 (100.0%) | 23 (53.5%) |
| 55 to 64 Years | 16 (100.0%) | 16 (100.0%) |
| 65 to 74 Years | 0 (0.0%) | 13 (100.0%) |
| 75 Years and over | 19 (100.0%) | 0 (0.0%) |
| Total | 147 (69.0%) | 129 (48.9%) |
Income Below Poverty Among Married-Couple Families in Hayes
| Children | Above Poverty | Below Poverty |
| No Children | 13 (100.0%) | 0 (0.0%) |
| 1 or 2 Children | 52 (100.0%) | 0 (0.0%) |
| 3 or 4 Children | 0 (0.0%) | 0 (0.0%) |
| 5 or more Children | 0 (0.0%) | 0 (0.0%) |
| Total | 65 (100.0%) | 0 (0.0%) |
Income Below Poverty Among Single-Parent Households in Hayes
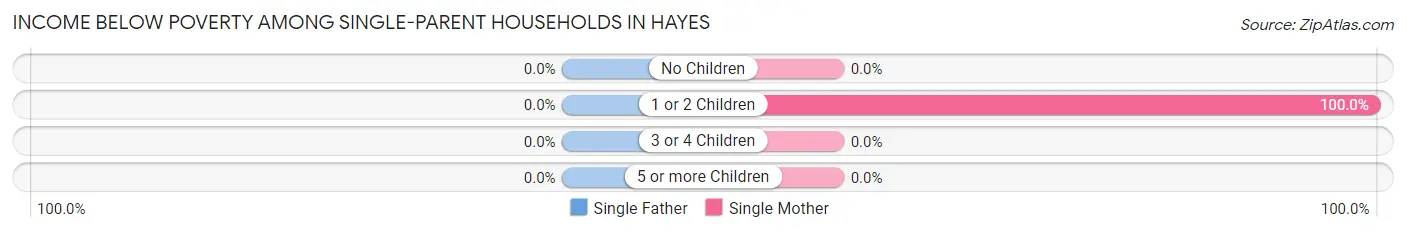
| Children | Single Father | Single Mother |
| No Children | 0 (0.0%) | 0 (0.0%) |
| 1 or 2 Children | 0 (0.0%) | 56 (100.0%) |
| 3 or 4 Children | 0 (0.0%) | 0 (0.0%) |
| 5 or more Children | 0 (0.0%) | 0 (0.0%) |
| Total | 0 (0.0%) | 56 (100.0%) |
Income Below Poverty Among Married-Couple vs Single-Parent Households in Hayes
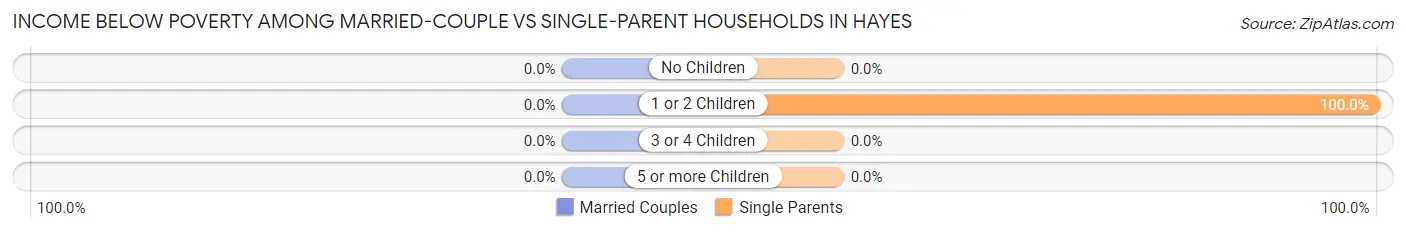
| Children | Married-Couple Families | Single-Parent Households |
| No Children | 0 (0.0%) | 0 (0.0%) |
| 1 or 2 Children | 0 (0.0%) | 56 (100.0%) |
| 3 or 4 Children | 0 (0.0%) | 0 (0.0%) |
| 5 or more Children | 0 (0.0%) | 0 (0.0%) |
| Total | 0 (0.0%) | 56 (100.0%) |
Race in Hayes
The most populous races in Hayes are White / Caucasian (407 | 85.3%), and Two or more Races (70 | 14.7%).
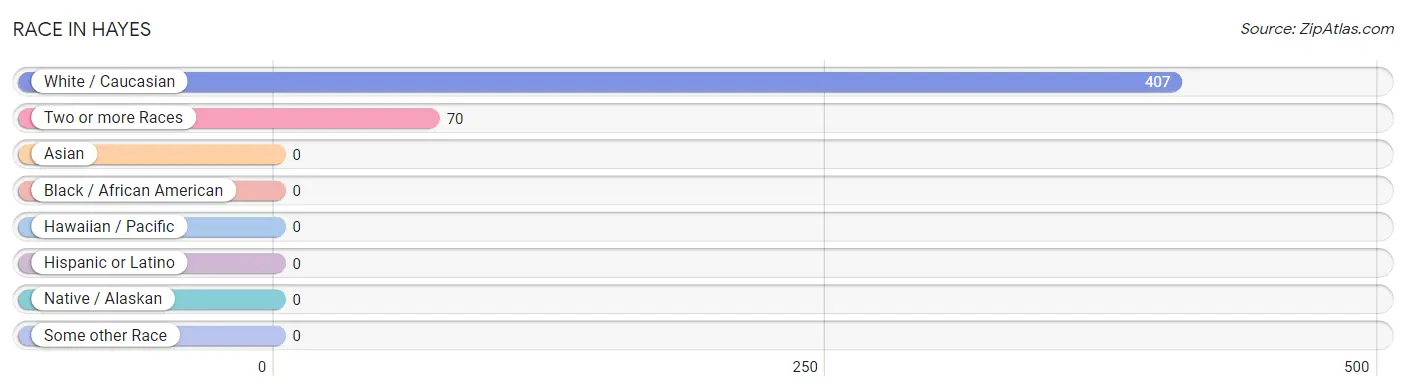
| Race | # Population | % Population |
| Asian | 0 | 0.0% |
| Black / African American | 0 | 0.0% |
| Hawaiian / Pacific | 0 | 0.0% |
| Hispanic or Latino | 0 | 0.0% |
| Native / Alaskan | 0 | 0.0% |
| White / Caucasian | 407 | 85.3% |
| Two or more Races | 70 | 14.7% |
| Some other Race | 0 | 0.0% |
| Total | 477 | 100.0% |
Ancestry in Hayes
The most populous ancestries reported in Hayes are Cajun (41 | 8.6%), French (41 | 8.6%), English (28 | 5.9%), and Irish (16 | 3.4%), together accounting for 26.4% of all Hayes residents.
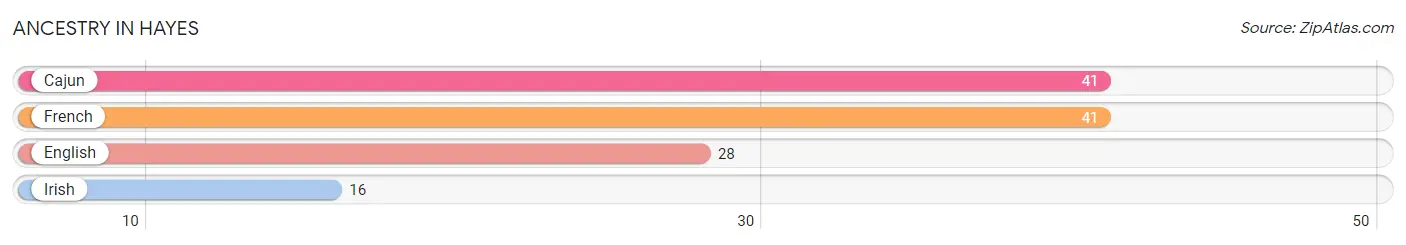
| Ancestry | # Population | % Population |
| Cajun | 41 | 8.6% |
| English | 28 | 5.9% |
| French | 41 | 8.6% |
| Irish | 16 | 3.4% | View All 4 Rows |
Immigrants in Hayes

| Immigration Origin | # Population | % Population | View All 0 Rows |
Sex and Age in Hayes
Sex and Age in Hayes
The most populous age groups in Hayes are 10 to 14 Years (66 | 31.0%) for men and 30 to 34 Years (44 | 16.7%) for women.
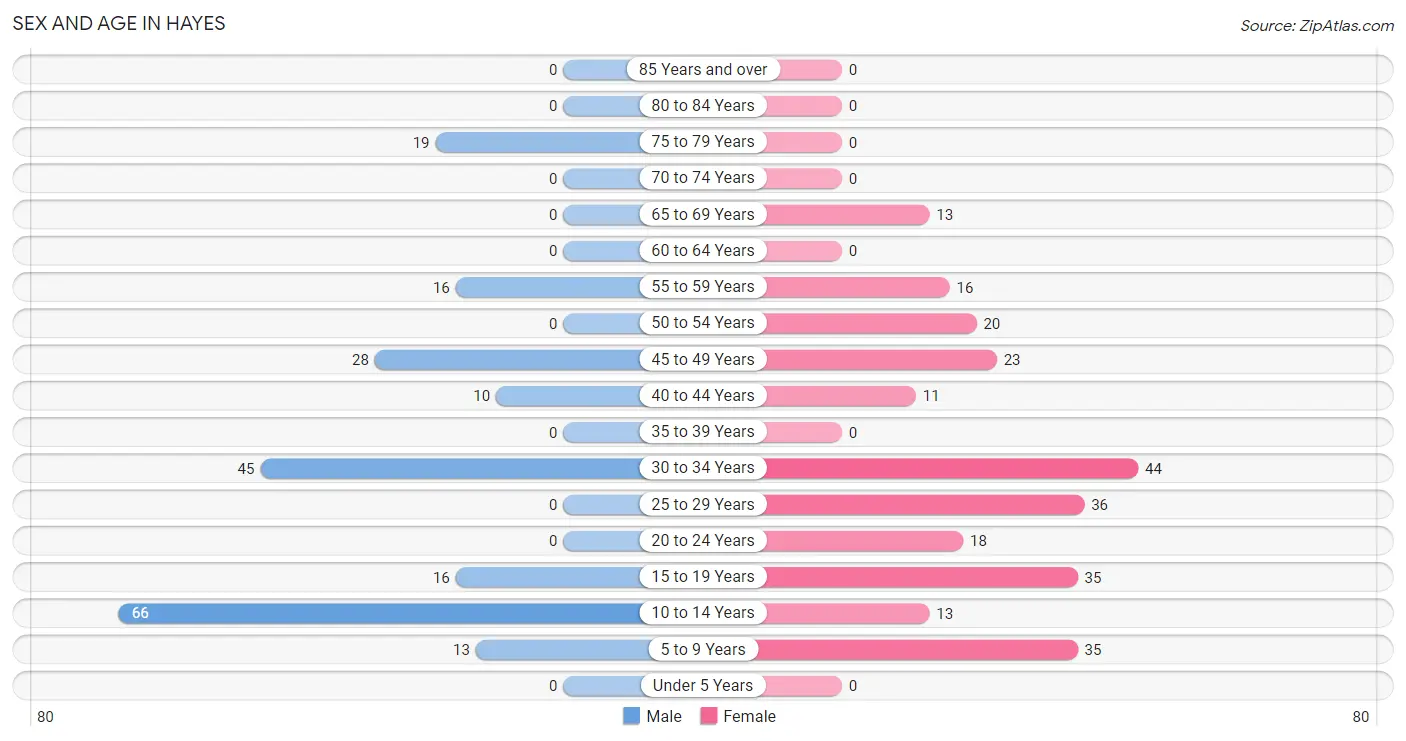
| Age Bracket | Male | Female |
| Under 5 Years | 0 (0.0%) | 0 (0.0%) |
| 5 to 9 Years | 13 (6.1%) | 35 (13.3%) |
| 10 to 14 Years | 66 (31.0%) | 13 (4.9%) |
| 15 to 19 Years | 16 (7.5%) | 35 (13.3%) |
| 20 to 24 Years | 0 (0.0%) | 18 (6.8%) |
| 25 to 29 Years | 0 (0.0%) | 36 (13.6%) |
| 30 to 34 Years | 45 (21.1%) | 44 (16.7%) |
| 35 to 39 Years | 0 (0.0%) | 0 (0.0%) |
| 40 to 44 Years | 10 (4.7%) | 11 (4.2%) |
| 45 to 49 Years | 28 (13.2%) | 23 (8.7%) |
| 50 to 54 Years | 0 (0.0%) | 20 (7.6%) |
| 55 to 59 Years | 16 (7.5%) | 16 (6.1%) |
| 60 to 64 Years | 0 (0.0%) | 0 (0.0%) |
| 65 to 69 Years | 0 (0.0%) | 13 (4.9%) |
| 70 to 74 Years | 0 (0.0%) | 0 (0.0%) |
| 75 to 79 Years | 19 (8.9%) | 0 (0.0%) |
| 80 to 84 Years | 0 (0.0%) | 0 (0.0%) |
| 85 Years and over | 0 (0.0%) | 0 (0.0%) |
| Total | 213 (100.0%) | 264 (100.0%) |
Families and Households in Hayes
Median Family Size in Hayes
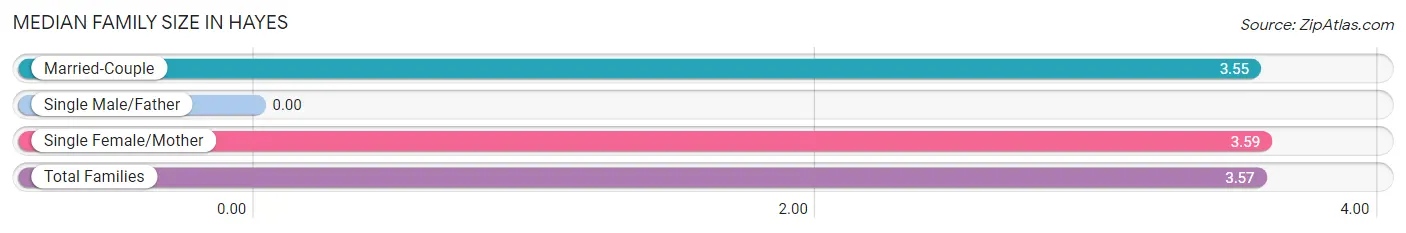
| Family Type | # Families | Family Size |
| Married-Couple | 65 (53.7%) | 3.55 |
| Single Male/Father | 0 (0.0%) | - |
| Single Female/Mother | 56 (46.3%) | 3.59 |
| Total Families | 121 (100.0%) | 3.57 |
Median Household Size in Hayes
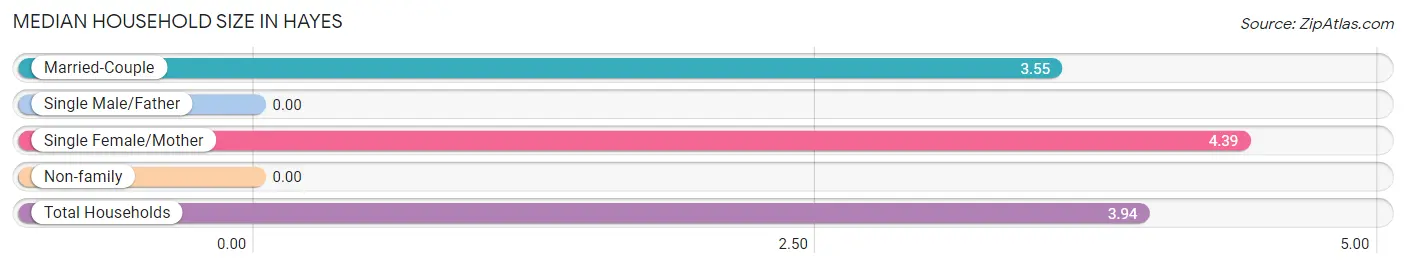
| Household Type | # Households | Household Size |
| Married-Couple | 65 (53.7%) | 3.55 |
| Single Male/Father | 0 (0.0%) | - |
| Single Female/Mother | 56 (46.3%) | 4.39 |
| Non-family | 0 (0.0%) | - |
| Total Households | 121 (100.0%) | 3.94 |
Household Size by Marriage Status in Hayes
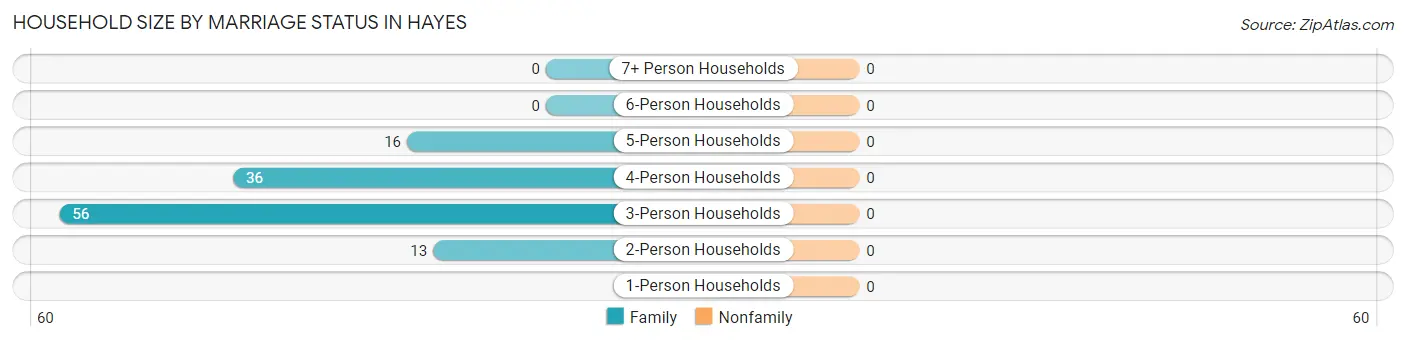
| Household Size | Family Households | Nonfamily Households |
| 1-Person Households | - | 0 (0.0%) |
| 2-Person Households | 13 (10.7%) | 0 (0.0%) |
| 3-Person Households | 56 (46.3%) | 0 (0.0%) |
| 4-Person Households | 36 (29.7%) | 0 (0.0%) |
| 5-Person Households | 16 (13.2%) | 0 (0.0%) |
| 6-Person Households | 0 (0.0%) | 0 (0.0%) |
| 7+ Person Households | 0 (0.0%) | 0 (0.0%) |
| Total | 121 (100.0%) | 0 (0.0%) |
Female Fertility in Hayes
Fertility by Age in Hayes
| Age Bracket | Women with Births | Births / 1,000 Women |
| 15 to 19 years | 0 (0.0%) | 0.0 |
| 20 to 34 years | 0 (0.0%) | 0.0 |
| 35 to 50 years | 0 (0.0%) | 0.0 |
| Total | 0 (0.0%) | 0.0 |
Fertility by Age by Marriage Status in Hayes
| Age Bracket | Married | Unmarried |
| 15 to 19 years | 0 (0.0%) | 0 (0.0%) |
| 20 to 34 years | 0 (0.0%) | 0 (0.0%) |
| 35 to 50 years | 0 (0.0%) | 0 (0.0%) |
| Total | 0 (0.0%) | 0 (0.0%) |
Fertility by Education in Hayes
| Educational Attainment | Women with Births | Births / 1,000 Women |
| Less than High School | 0 (0.0%) | 0.0 |
| High School Diploma | 0 (0.0%) | 0.0 |
| College or Associate's Degree | 0 (0.0%) | 0.0 |
| Bachelor's Degree | 0 (0.0%) | 0.0 |
| Graduate Degree | 0 (0.0%) | 0.0 |
| Total | 0 (0.0%) | 0.0 |
Fertility by Education by Marriage Status in Hayes
| Educational Attainment | Married | Unmarried |
| Less than High School | 0 (0.0%) | 0 (0.0%) |
| High School Diploma | 0 (0.0%) | 0 (0.0%) |
| College or Associate's Degree | 0 (0.0%) | 0 (0.0%) |
| Bachelor's Degree | 0 (0.0%) | 0 (0.0%) |
| Graduate Degree | 0 (0.0%) | 0 (0.0%) |
| Total | 0 (0.0%) | 0 (0.0%) |
Employment Characteristics in Hayes
Employment by Class of Employer in Hayes
Among the 157 employed individuals in Hayes, private company employees (102 | 65.0%), self-employed (incorporated) (39 | 24.8%), and not-for-profit organizations (16 | 10.2%) make up the most common classes of employment.
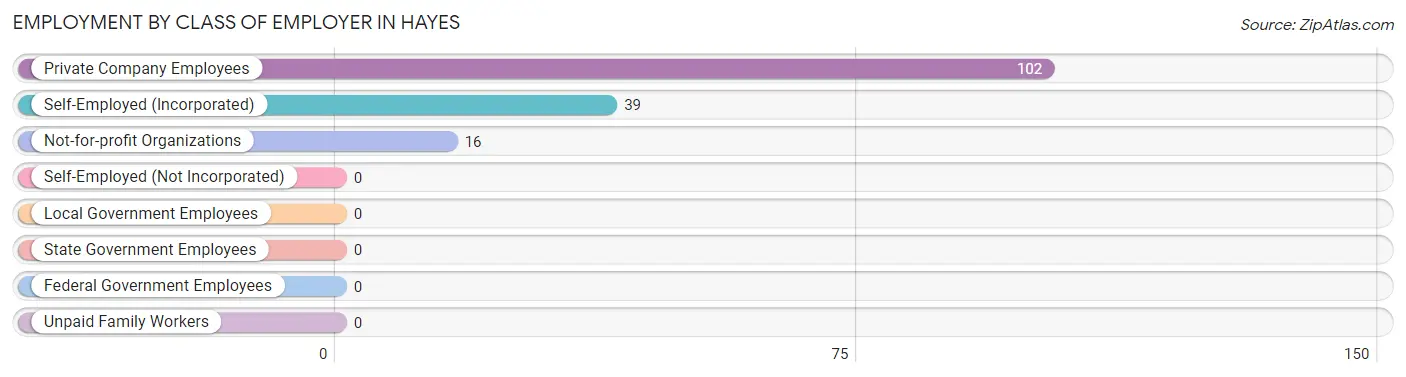
| Employer Class | # Employees | % Employees |
| Private Company Employees | 102 | 65.0% |
| Self-Employed (Incorporated) | 39 | 24.8% |
| Self-Employed (Not Incorporated) | 0 | 0.0% |
| Not-for-profit Organizations | 16 | 10.2% |
| Local Government Employees | 0 | 0.0% |
| State Government Employees | 0 | 0.0% |
| Federal Government Employees | 0 | 0.0% |
| Unpaid Family Workers | 0 | 0.0% |
| Total | 157 | 100.0% |
Employment Status by Age in Hayes
According to the labor force statistics for Hayes, out of the total population over 16 years of age (335), 60.0% or 201 individuals are in the labor force, with 21.9% or 44 of them unemployed. The age group with the highest labor force participation rate is 20 to 24 years, with 100.0% or 18 individuals in the labor force. Within the labor force, the 30 to 34 years age range has the highest percentage of unemployed individuals, with 49.4% or 44 of them being unemployed.
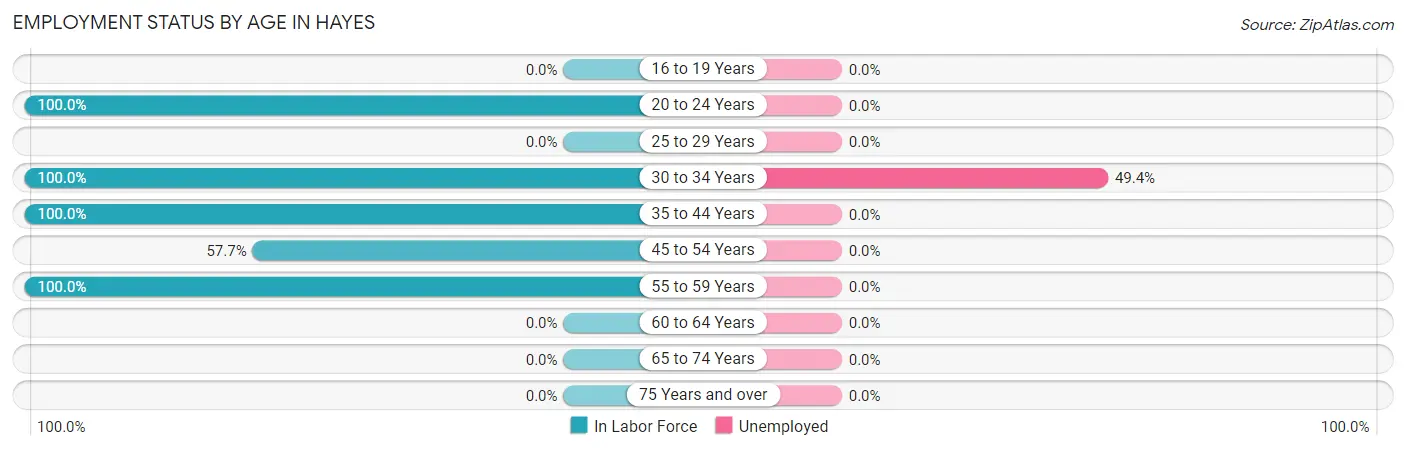
| Age Bracket | In Labor Force | Unemployed |
| 16 to 19 Years | 0 (0.0%) | 0 (0.0%) |
| 20 to 24 Years | 18 (100.0%) | 0 (0.0%) |
| 25 to 29 Years | 0 (0.0%) | 0 (0.0%) |
| 30 to 34 Years | 89 (100.0%) | 44 (49.4%) |
| 35 to 44 Years | 21 (100.0%) | 0 (0.0%) |
| 45 to 54 Years | 41 (57.7%) | 0 (0.0%) |
| 55 to 59 Years | 32 (100.0%) | 0 (0.0%) |
| 60 to 64 Years | 0 (0.0%) | 0 (0.0%) |
| 65 to 74 Years | 0 (0.0%) | 0 (0.0%) |
| 75 Years and over | 0 (0.0%) | 0 (0.0%) |
| Total | 201 (60.0%) | 44 (21.9%) |
Employment Status by Educational Attainment in Hayes
According to labor force statistics for Hayes, 73.5% of individuals (183) out of the total population between 25 and 64 years of age (249) are in the labor force, with 24.0% or 44 of them being unemployed. The group with the highest labor force participation rate are those with the educational attainment of less than high school, with 100.0% or 58 individuals in the labor force. Within the labor force, individuals with bachelor's degree or higher education have the highest percentage of unemployment, with 80.0% or 44 of them being unemployed.
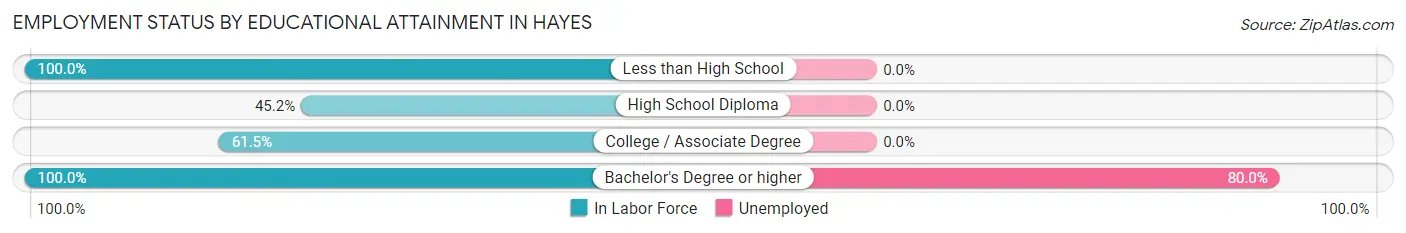
| Educational Attainment | In Labor Force | Unemployed |
| Less than High School | 58 (100.0%) | 0 (0.0%) |
| High School Diploma | 38 (45.2%) | 0 (0.0%) |
| College / Associate Degree | 32 (61.5%) | 0 (0.0%) |
| Bachelor's Degree or higher | 55 (100.0%) | 44 (80.0%) |
| Total | 183 (73.5%) | 60 (24.0%) |
Employment Occupations by Sex in Hayes
Management, Business, Science and Arts Occupations
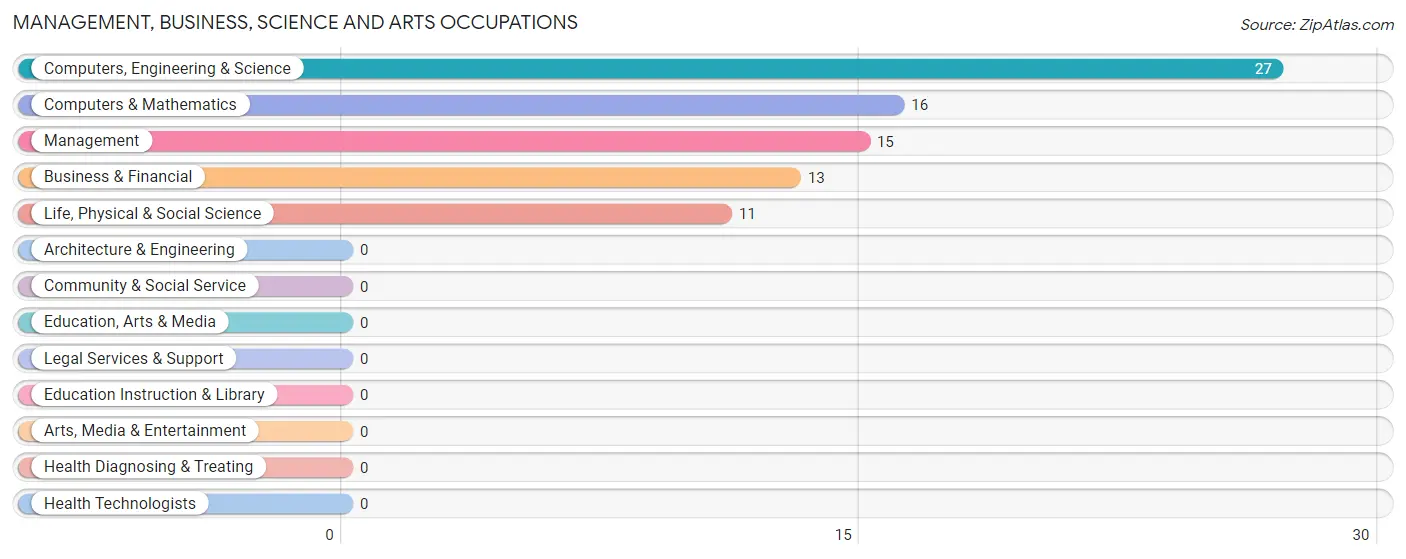
The most common Management, Business, Science and Arts occupations in Hayes are Computers, Engineering & Science (27 | 17.2%), Computers & Mathematics (16 | 10.2%), Management (15 | 9.6%), Business & Financial (13 | 8.3%), and Life, Physical & Social Science (11 | 7.0%).
Management, Business, Science and Arts Occupations by Sex
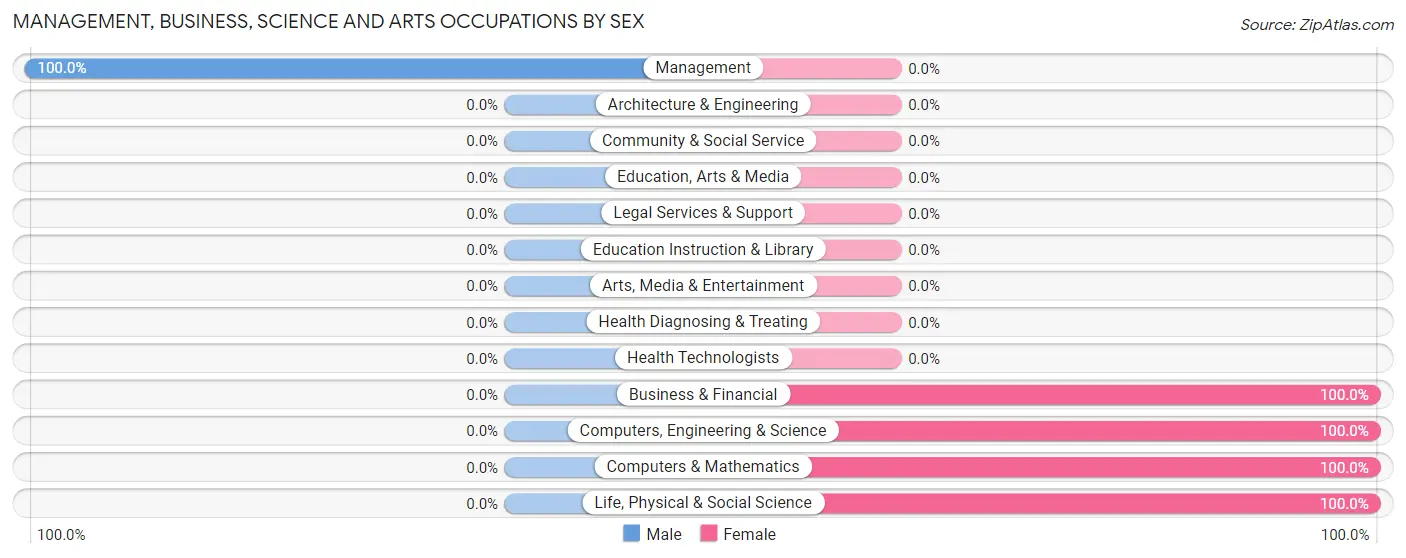
| Occupation | Male | Female |
| Management | 15 (100.0%) | 0 (0.0%) |
| Business & Financial | 0 (0.0%) | 13 (100.0%) |
| Computers, Engineering & Science | 0 (0.0%) | 27 (100.0%) |
| Computers & Mathematics | 0 (0.0%) | 16 (100.0%) |
| Architecture & Engineering | 0 (0.0%) | 0 (0.0%) |
| Life, Physical & Social Science | 0 (0.0%) | 11 (100.0%) |
| Community & Social Service | 0 (0.0%) | 0 (0.0%) |
| Education, Arts & Media | 0 (0.0%) | 0 (0.0%) |
| Legal Services & Support | 0 (0.0%) | 0 (0.0%) |
| Education Instruction & Library | 0 (0.0%) | 0 (0.0%) |
| Arts, Media & Entertainment | 0 (0.0%) | 0 (0.0%) |
| Health Diagnosing & Treating | 0 (0.0%) | 0 (0.0%) |
| Health Technologists | 0 (0.0%) | 0 (0.0%) |
| Total (Category) | 15 (27.3%) | 40 (72.7%) |
| Total (Overall) | 99 (63.1%) | 58 (36.9%) |
Services Occupations
Services Occupations by Sex
| Occupation | Male | Female |
| Healthcare Support | 0 (0.0%) | 0 (0.0%) |
| Security & Protection | 0 (0.0%) | 0 (0.0%) |
| Firefighting & Prevention | 0 (0.0%) | 0 (0.0%) |
| Law Enforcement | 0 (0.0%) | 0 (0.0%) |
| Food Preparation & Serving | 0 (0.0%) | 0 (0.0%) |
| Cleaning & Maintenance | 0 (0.0%) | 0 (0.0%) |
| Personal Care & Service | 0 (0.0%) | 0 (0.0%) |
| Total (Category) | 0 (0.0%) | 0 (0.0%) |
| Total (Overall) | 99 (63.1%) | 58 (36.9%) |
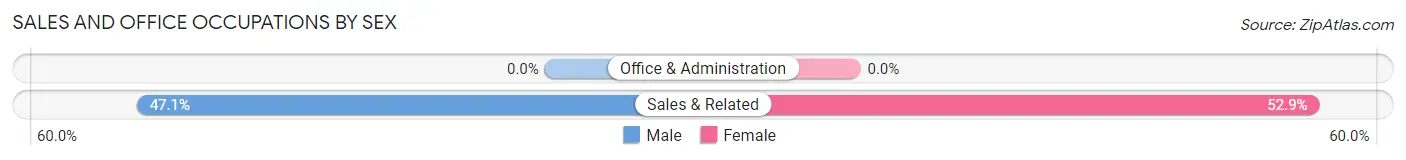
Sales and Office Occupations
The most common Sales and Office occupations in Hayes are , and Sales & Related (34 | 21.7%).
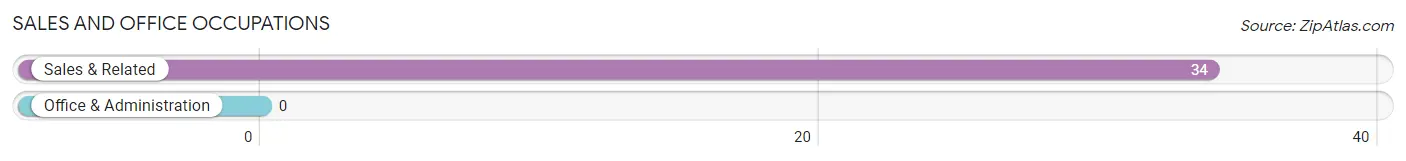
Sales and Office Occupations by Sex
| Occupation | Male | Female |
| Sales & Related | 16 (47.1%) | 18 (52.9%) |
| Office & Administration | 0 (0.0%) | 0 (0.0%) |
| Total (Category) | 16 (47.1%) | 18 (52.9%) |
| Total (Overall) | 99 (63.1%) | 58 (36.9%) |
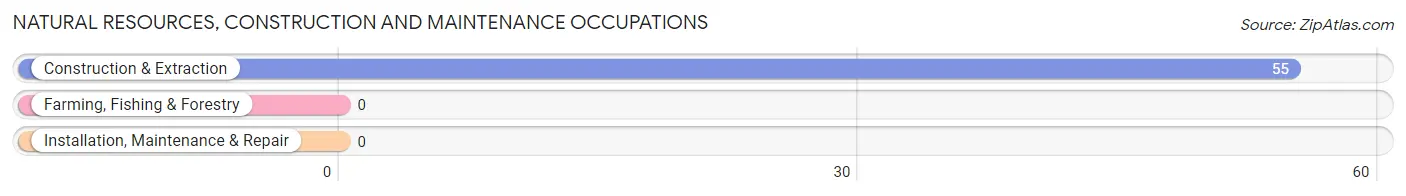
Natural Resources, Construction and Maintenance Occupations
The most common Natural Resources, Construction and Maintenance occupations in Hayes are , and Construction & Extraction (55 | 35.0%).
Natural Resources, Construction and Maintenance Occupations by Sex
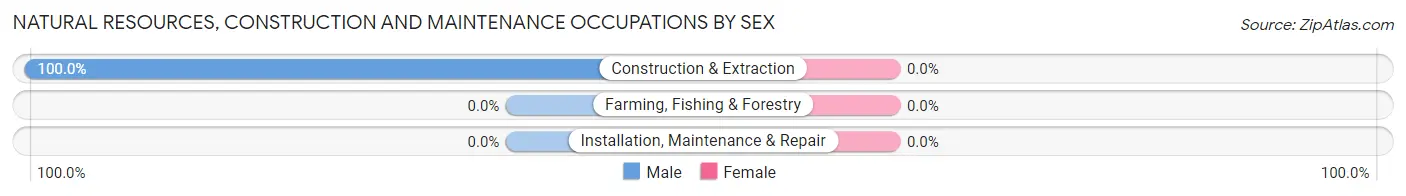
| Occupation | Male | Female |
| Farming, Fishing & Forestry | 0 (0.0%) | 0 (0.0%) |
| Construction & Extraction | 55 (100.0%) | 0 (0.0%) |
| Installation, Maintenance & Repair | 0 (0.0%) | 0 (0.0%) |
| Total (Category) | 55 (100.0%) | 0 (0.0%) |
| Total (Overall) | 99 (63.1%) | 58 (36.9%) |
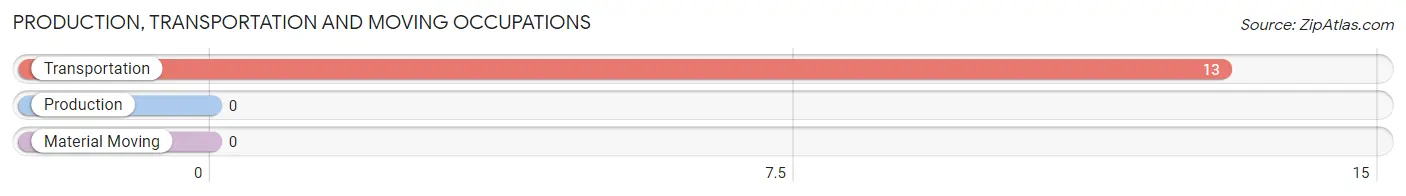
Production, Transportation and Moving Occupations
The most common Production, Transportation and Moving occupations in Hayes are , and Transportation (13 | 8.3%).
Production, Transportation and Moving Occupations by Sex
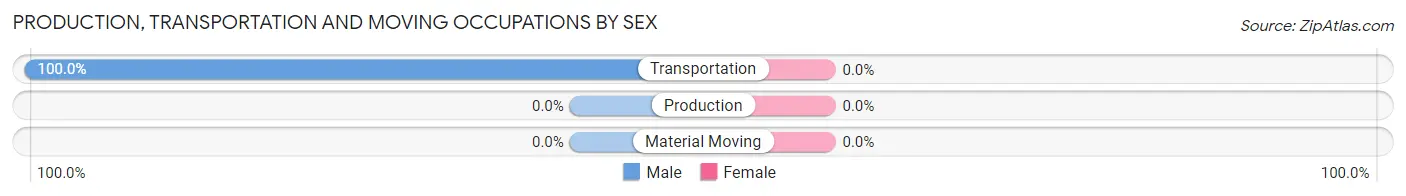
| Occupation | Male | Female |
| Production | 0 (0.0%) | 0 (0.0%) |
| Transportation | 13 (100.0%) | 0 (0.0%) |
| Material Moving | 0 (0.0%) | 0 (0.0%) |
| Total (Category) | 13 (100.0%) | 0 (0.0%) |
| Total (Overall) | 99 (63.1%) | 58 (36.9%) |
Employment Industries by Sex in Hayes
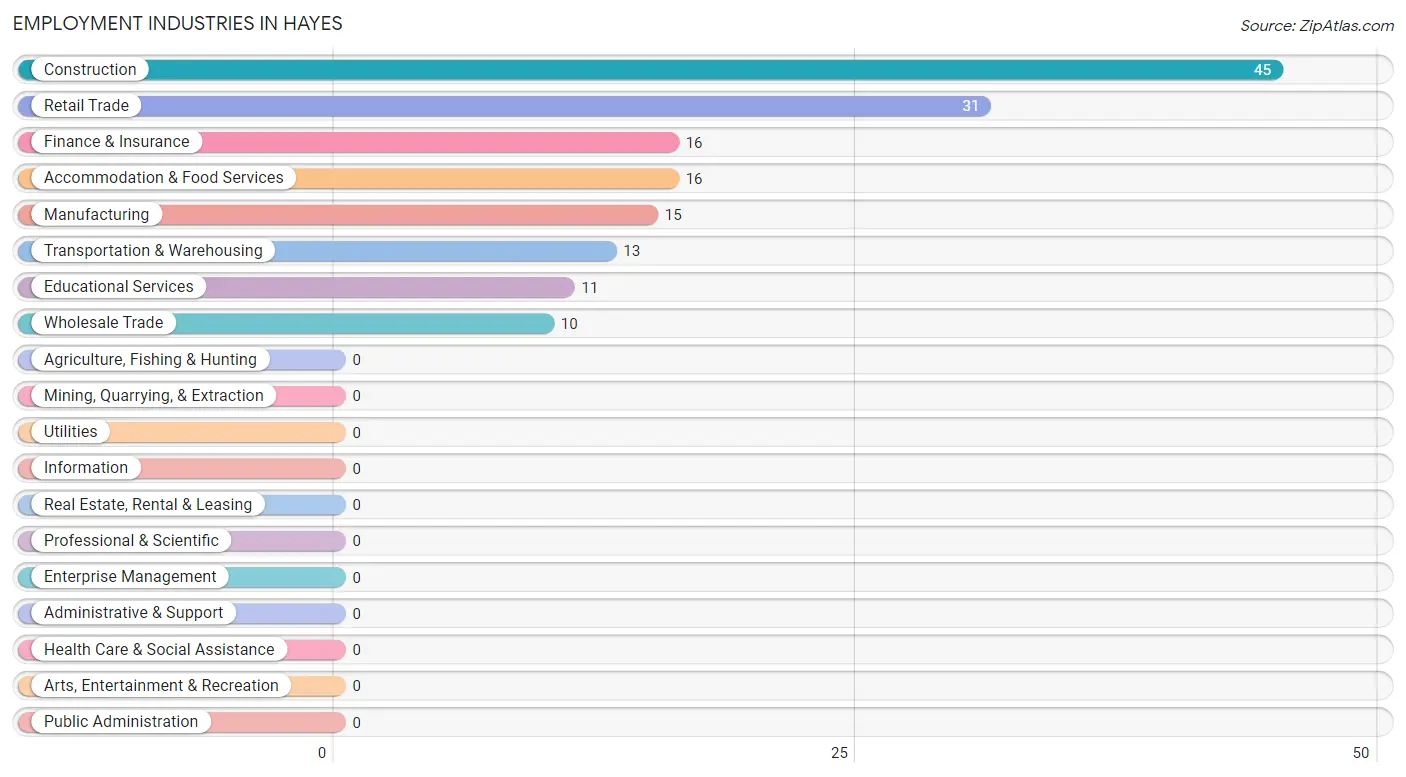
Employment Industries in Hayes
The major employment industries in Hayes include Construction (45 | 28.7%), Retail Trade (31 | 19.8%), Finance & Insurance (16 | 10.2%), Accommodation & Food Services (16 | 10.2%), and Manufacturing (15 | 9.6%).
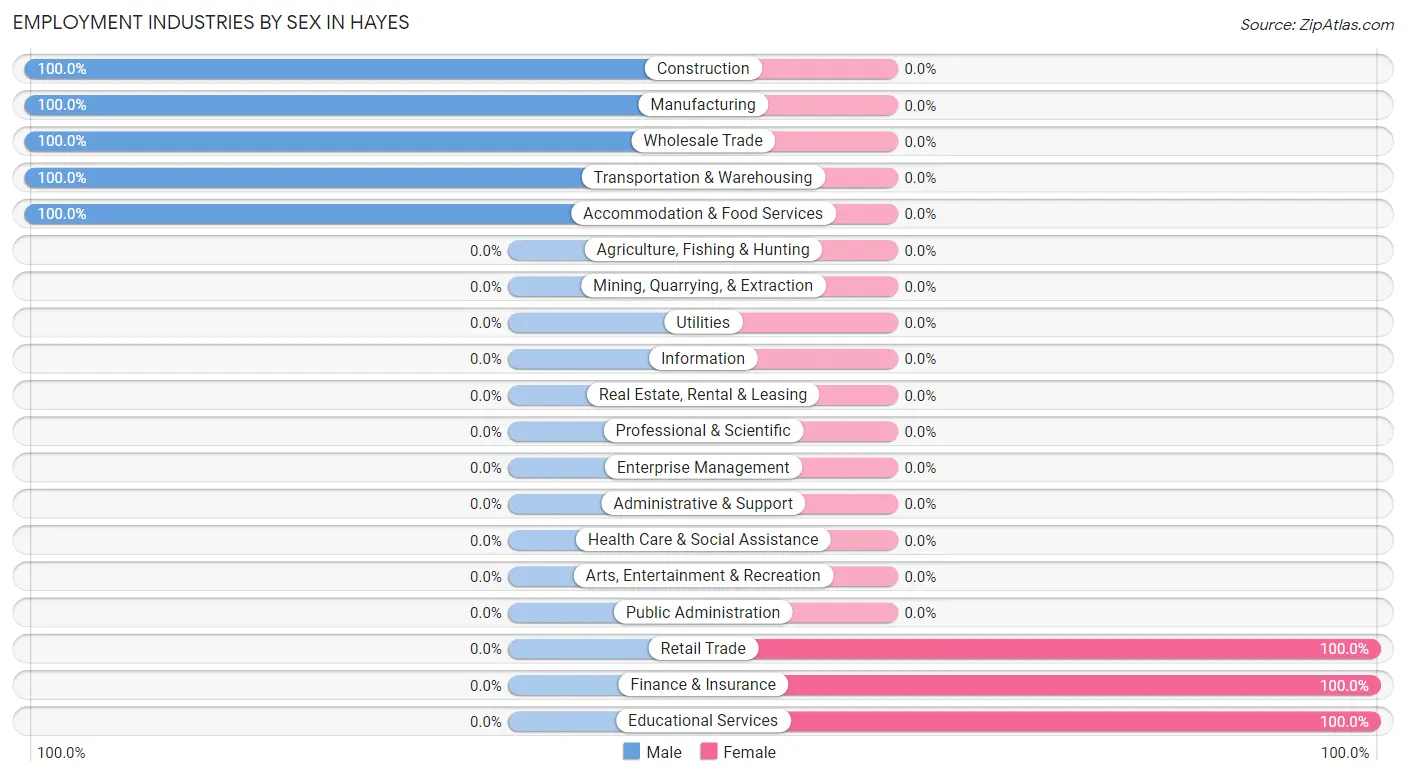
Employment Industries by Sex in Hayes
The Hayes industries that see more men than women are Construction (100.0%), Manufacturing (100.0%), and Wholesale Trade (100.0%), whereas the industries that tend to have a higher number of women are Retail Trade (100.0%), Finance & Insurance (100.0%), and Educational Services (100.0%).
| Industry | Male | Female |
| Agriculture, Fishing & Hunting | 0 (0.0%) | 0 (0.0%) |
| Mining, Quarrying, & Extraction | 0 (0.0%) | 0 (0.0%) |
| Construction | 45 (100.0%) | 0 (0.0%) |
| Manufacturing | 15 (100.0%) | 0 (0.0%) |
| Wholesale Trade | 10 (100.0%) | 0 (0.0%) |
| Retail Trade | 0 (0.0%) | 31 (100.0%) |
| Transportation & Warehousing | 13 (100.0%) | 0 (0.0%) |
| Utilities | 0 (0.0%) | 0 (0.0%) |
| Information | 0 (0.0%) | 0 (0.0%) |
| Finance & Insurance | 0 (0.0%) | 16 (100.0%) |
| Real Estate, Rental & Leasing | 0 (0.0%) | 0 (0.0%) |
| Professional & Scientific | 0 (0.0%) | 0 (0.0%) |
| Enterprise Management | 0 (0.0%) | 0 (0.0%) |
| Administrative & Support | 0 (0.0%) | 0 (0.0%) |
| Educational Services | 0 (0.0%) | 11 (100.0%) |
| Health Care & Social Assistance | 0 (0.0%) | 0 (0.0%) |
| Arts, Entertainment & Recreation | 0 (0.0%) | 0 (0.0%) |
| Accommodation & Food Services | 16 (100.0%) | 0 (0.0%) |
| Public Administration | 0 (0.0%) | 0 (0.0%) |
| Total | 99 (63.1%) | 58 (36.9%) |
Education in Hayes
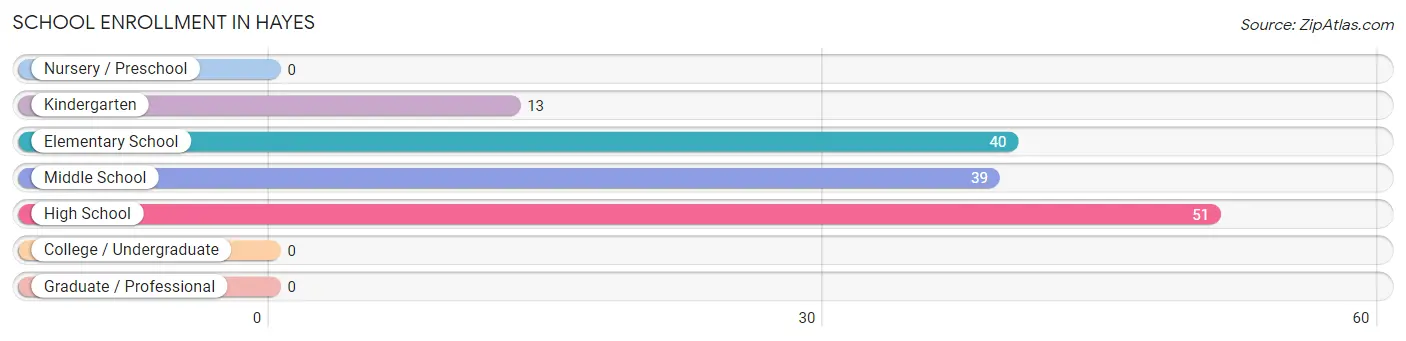
School Enrollment in Hayes
The most common levels of schooling among the 143 students in Hayes are high school (51 | 35.7%), elementary school (40 | 28.0%), and middle school (39 | 27.3%).
| School Level | # Students | % Students |
| Nursery / Preschool | 0 | 0.0% |
| Kindergarten | 13 | 9.1% |
| Elementary School | 40 | 28.0% |
| Middle School | 39 | 27.3% |
| High School | 51 | 35.7% |
| College / Undergraduate | 0 | 0.0% |
| Graduate / Professional | 0 | 0.0% |
| Total | 143 | 100.0% |
School Enrollment by Age by Funding Source in Hayes
Out of a total of 143 students who are enrolled in schools in Hayes, 13 (9.1%) attend a private institution, while the remaining 130 (90.9%) are enrolled in public schools. The age group of 5 to 9 year old has the highest likelihood of being enrolled in private schools, with 13 (100.0% in the age bracket) enrolled. Conversely, the age group of 10 to 14 year olds has the lowest likelihood of being enrolled in a private school, with 79 (100.0% in the age bracket) attending a public institution.
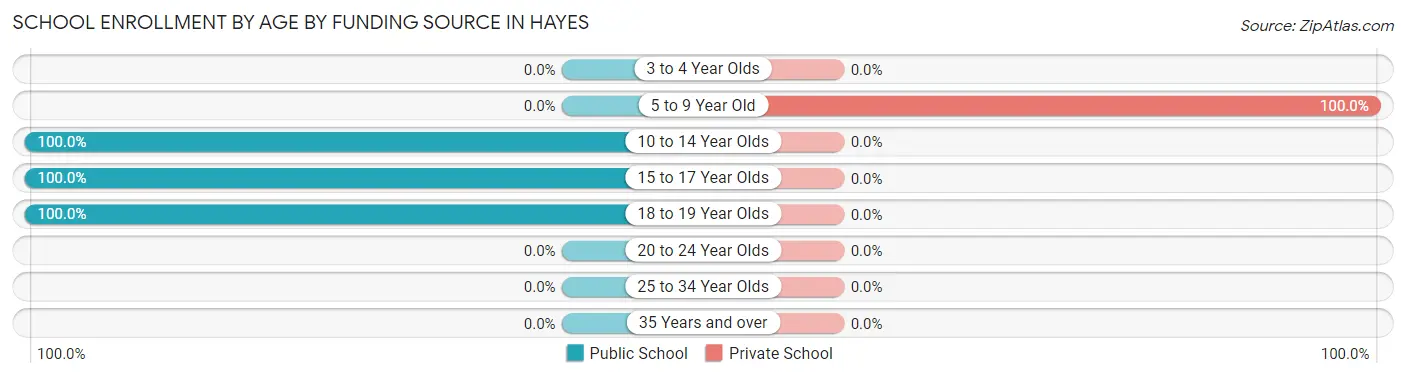
| Age Bracket | Public School | Private School |
| 3 to 4 Year Olds | 0 (0.0%) | 0 (0.0%) |
| 5 to 9 Year Old | 0 (0.0%) | 13 (100.0%) |
| 10 to 14 Year Olds | 79 (100.0%) | 0 (0.0%) |
| 15 to 17 Year Olds | 35 (100.0%) | 0 (0.0%) |
| 18 to 19 Year Olds | 16 (100.0%) | 0 (0.0%) |
| 20 to 24 Year Olds | 0 (0.0%) | 0 (0.0%) |
| 25 to 34 Year Olds | 0 (0.0%) | 0 (0.0%) |
| 35 Years and over | 0 (0.0%) | 0 (0.0%) |
| Total | 130 (90.9%) | 13 (9.1%) |
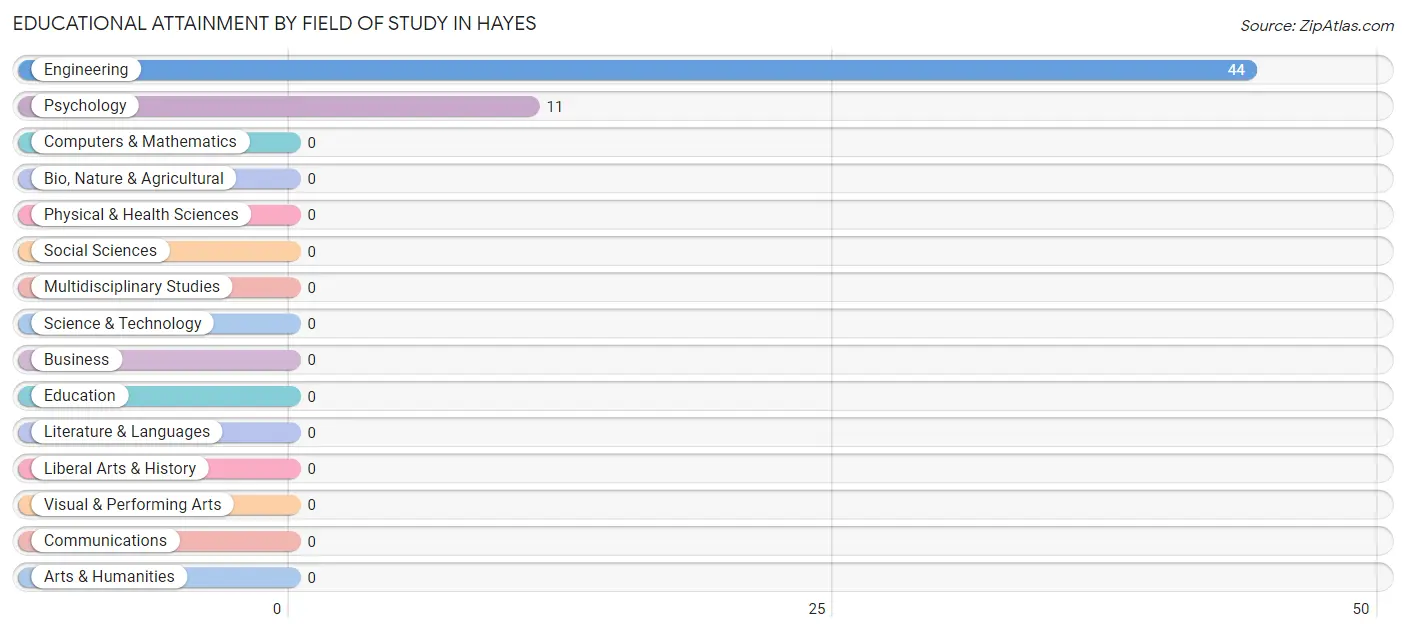
Educational Attainment by Field of Study in Hayes
Engineering (44 | 80.0%), and psychology (11 | 20.0%) are the most common fields of study among 55 individuals in Hayes who have obtained a bachelor's degree or higher.
| Field of Study | # Graduates | % Graduates |
| Computers & Mathematics | 0 | 0.0% |
| Bio, Nature & Agricultural | 0 | 0.0% |
| Physical & Health Sciences | 0 | 0.0% |
| Psychology | 11 | 20.0% |
| Social Sciences | 0 | 0.0% |
| Engineering | 44 | 80.0% |
| Multidisciplinary Studies | 0 | 0.0% |
| Science & Technology | 0 | 0.0% |
| Business | 0 | 0.0% |
| Education | 0 | 0.0% |
| Literature & Languages | 0 | 0.0% |
| Liberal Arts & History | 0 | 0.0% |
| Visual & Performing Arts | 0 | 0.0% |
| Communications | 0 | 0.0% |
| Arts & Humanities | 0 | 0.0% |
| Total | 55 | 100.0% |
Transportation & Commute in Hayes
Vehicle Availability by Sex in Hayes
The most prevalent vehicle ownership categories in Hayes are males with 1 vehicle (45, accounting for 45.5%) and females with 1 vehicle (0, making up 77.6%).
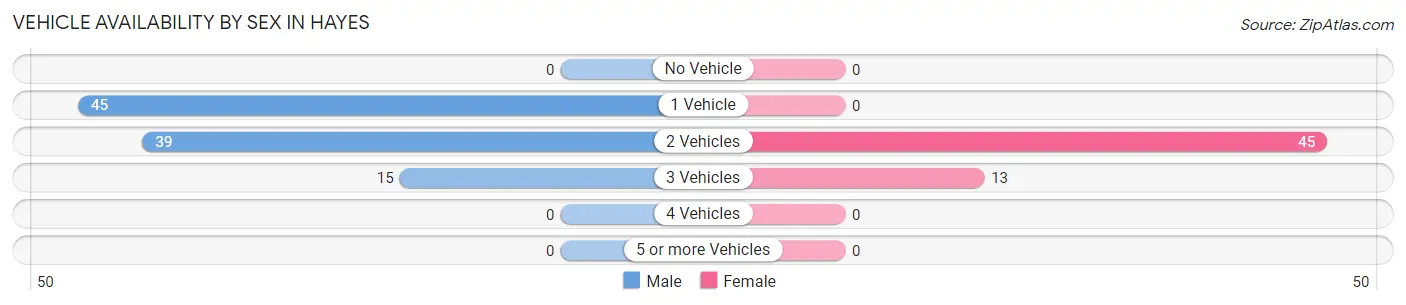
| Vehicles Available | Male | Female |
| No Vehicle | 0 (0.0%) | 0 (0.0%) |
| 1 Vehicle | 45 (45.5%) | 0 (0.0%) |
| 2 Vehicles | 39 (39.4%) | 45 (77.6%) |
| 3 Vehicles | 15 (15.1%) | 13 (22.4%) |
| 4 Vehicles | 0 (0.0%) | 0 (0.0%) |
| 5 or more Vehicles | 0 (0.0%) | 0 (0.0%) |
| Total | 99 (100.0%) | 58 (100.0%) |
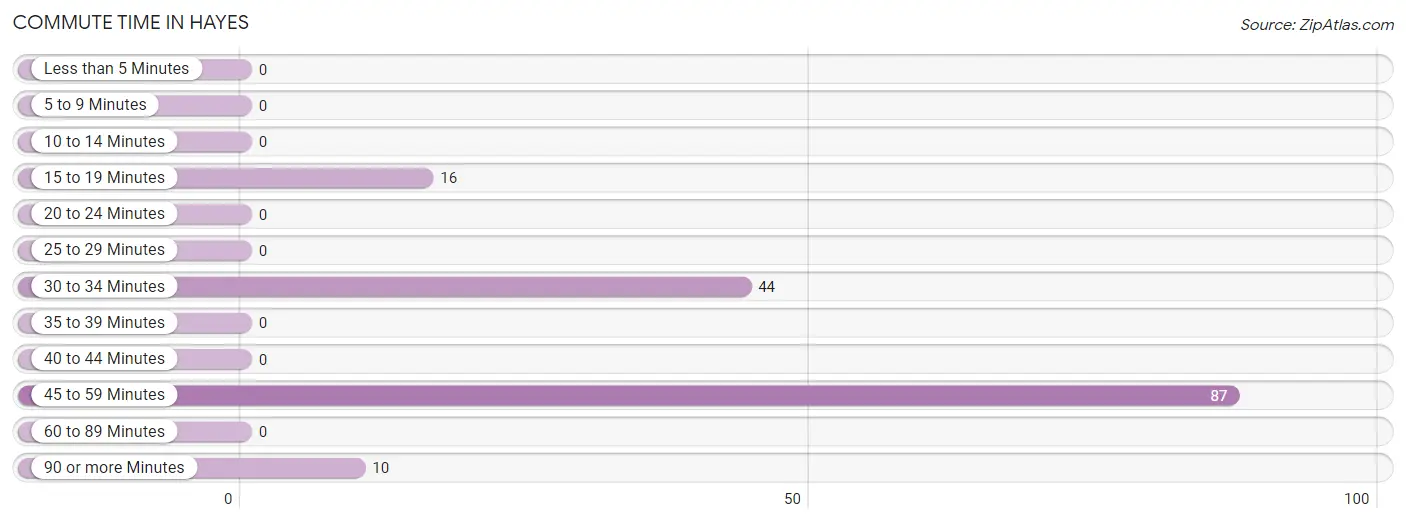
Commute Time in Hayes
The most frequently occuring commute durations in Hayes are 45 to 59 minutes (87 commuters, 55.4%), 30 to 34 minutes (44 commuters, 28.0%), and 15 to 19 minutes (16 commuters, 10.2%).
| Commute Time | # Commuters | % Commuters |
| Less than 5 Minutes | 0 | 0.0% |
| 5 to 9 Minutes | 0 | 0.0% |
| 10 to 14 Minutes | 0 | 0.0% |
| 15 to 19 Minutes | 16 | 10.2% |
| 20 to 24 Minutes | 0 | 0.0% |
| 25 to 29 Minutes | 0 | 0.0% |
| 30 to 34 Minutes | 44 | 28.0% |
| 35 to 39 Minutes | 0 | 0.0% |
| 40 to 44 Minutes | 0 | 0.0% |
| 45 to 59 Minutes | 87 | 55.4% |
| 60 to 89 Minutes | 0 | 0.0% |
| 90 or more Minutes | 10 | 6.4% |
Commute Time by Sex in Hayes
The most common commute times in Hayes are 45 to 59 minutes (58 commuters, 58.6%) for males and 45 to 59 minutes (29 commuters, 50.0%) for females.
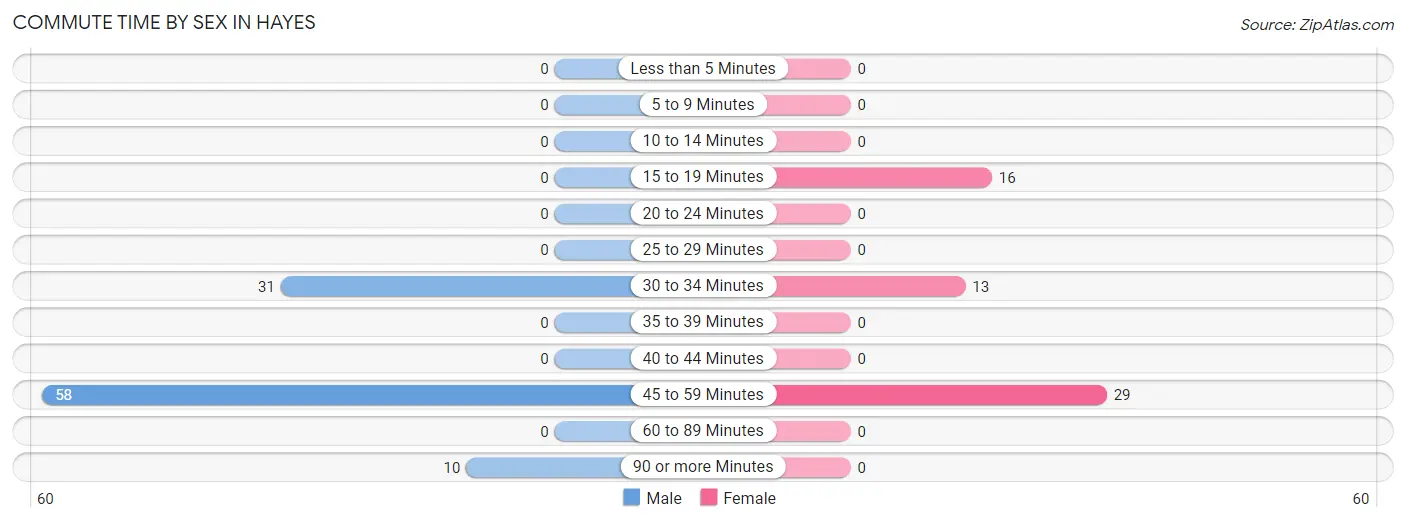
| Commute Time | Male | Female |
| Less than 5 Minutes | 0 (0.0%) | 0 (0.0%) |
| 5 to 9 Minutes | 0 (0.0%) | 0 (0.0%) |
| 10 to 14 Minutes | 0 (0.0%) | 0 (0.0%) |
| 15 to 19 Minutes | 0 (0.0%) | 16 (27.6%) |
| 20 to 24 Minutes | 0 (0.0%) | 0 (0.0%) |
| 25 to 29 Minutes | 0 (0.0%) | 0 (0.0%) |
| 30 to 34 Minutes | 31 (31.3%) | 13 (22.4%) |
| 35 to 39 Minutes | 0 (0.0%) | 0 (0.0%) |
| 40 to 44 Minutes | 0 (0.0%) | 0 (0.0%) |
| 45 to 59 Minutes | 58 (58.6%) | 29 (50.0%) |
| 60 to 89 Minutes | 0 (0.0%) | 0 (0.0%) |
| 90 or more Minutes | 10 (10.1%) | 0 (0.0%) |
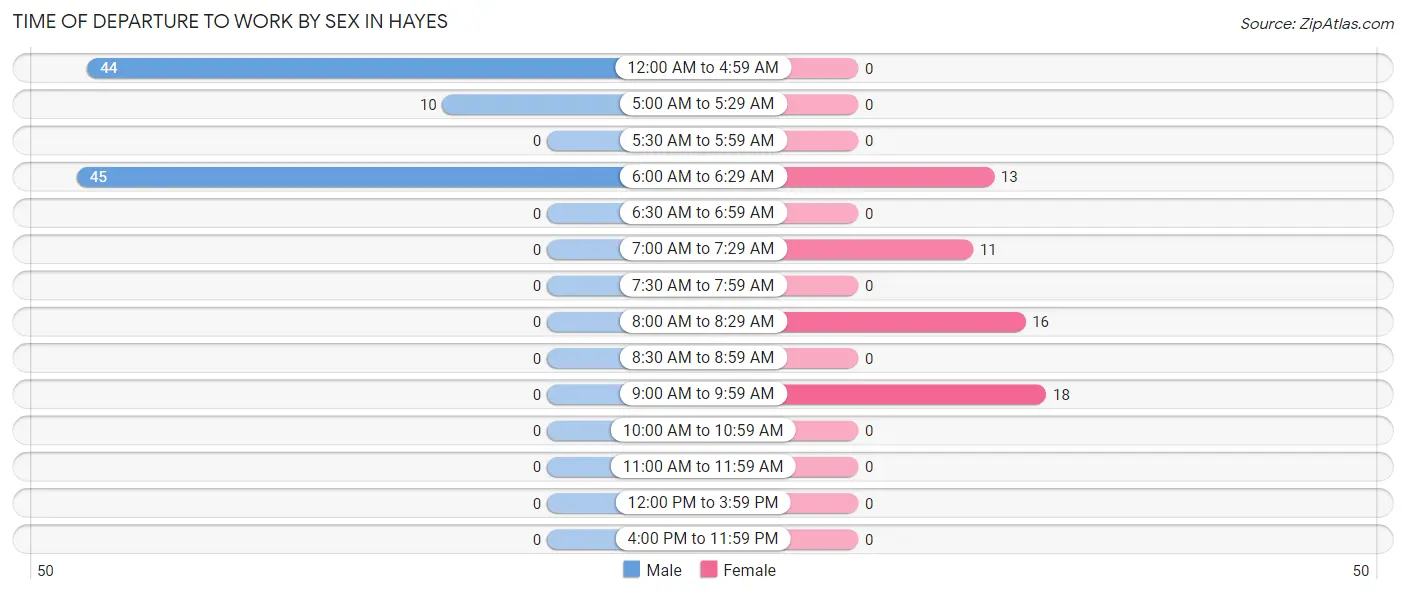
Time of Departure to Work by Sex in Hayes
The most frequent times of departure to work in Hayes are 6:00 AM to 6:29 AM (45, 45.5%) for males and 9:00 AM to 9:59 AM (18, 31.0%) for females.
| Time of Departure | Male | Female |
| 12:00 AM to 4:59 AM | 44 (44.4%) | 0 (0.0%) |
| 5:00 AM to 5:29 AM | 10 (10.1%) | 0 (0.0%) |
| 5:30 AM to 5:59 AM | 0 (0.0%) | 0 (0.0%) |
| 6:00 AM to 6:29 AM | 45 (45.5%) | 13 (22.4%) |
| 6:30 AM to 6:59 AM | 0 (0.0%) | 0 (0.0%) |
| 7:00 AM to 7:29 AM | 0 (0.0%) | 11 (19.0%) |
| 7:30 AM to 7:59 AM | 0 (0.0%) | 0 (0.0%) |
| 8:00 AM to 8:29 AM | 0 (0.0%) | 16 (27.6%) |
| 8:30 AM to 8:59 AM | 0 (0.0%) | 0 (0.0%) |
| 9:00 AM to 9:59 AM | 0 (0.0%) | 18 (31.0%) |
| 10:00 AM to 10:59 AM | 0 (0.0%) | 0 (0.0%) |
| 11:00 AM to 11:59 AM | 0 (0.0%) | 0 (0.0%) |
| 12:00 PM to 3:59 PM | 0 (0.0%) | 0 (0.0%) |
| 4:00 PM to 11:59 PM | 0 (0.0%) | 0 (0.0%) |
| Total | 99 (100.0%) | 58 (100.0%) |
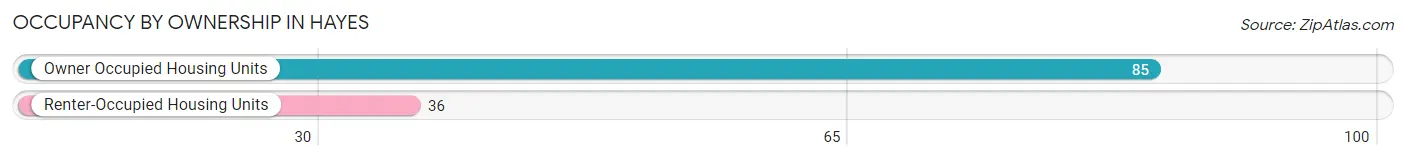
Housing Occupancy in Hayes
Occupancy by Ownership in Hayes
Of the total 121 dwellings in Hayes, owner-occupied units account for 85 (70.3%), while renter-occupied units make up 36 (29.7%).
| Occupancy | # Housing Units | % Housing Units |
| Owner Occupied Housing Units | 85 | 70.3% |
| Renter-Occupied Housing Units | 36 | 29.7% |
| Total Occupied Housing Units | 121 | 100.0% |
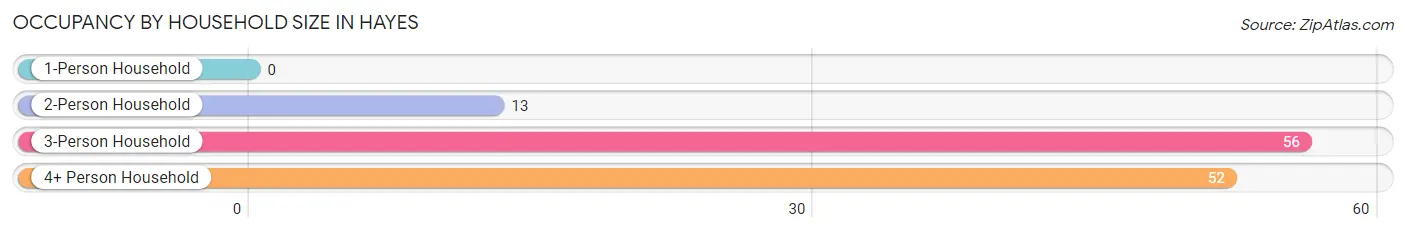
Occupancy by Household Size in Hayes
| Household Size | # Housing Units | % Housing Units |
| 1-Person Household | 0 | 0.0% |
| 2-Person Household | 13 | 10.7% |
| 3-Person Household | 56 | 46.3% |
| 4+ Person Household | 52 | 43.0% |
| Total Housing Units | 121 | 100.0% |
Occupancy by Ownership by Household Size in Hayes
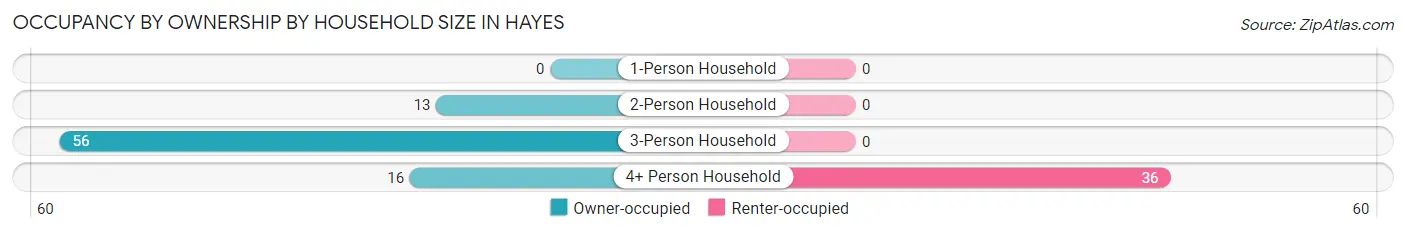
| Household Size | Owner-occupied | Renter-occupied |
| 1-Person Household | 0 (0.0%) | 0 (0.0%) |
| 2-Person Household | 13 (100.0%) | 0 (0.0%) |
| 3-Person Household | 56 (100.0%) | 0 (0.0%) |
| 4+ Person Household | 16 (30.8%) | 36 (69.2%) |
| Total Housing Units | 85 (70.3%) | 36 (29.7%) |
Occupancy by Educational Attainment in Hayes
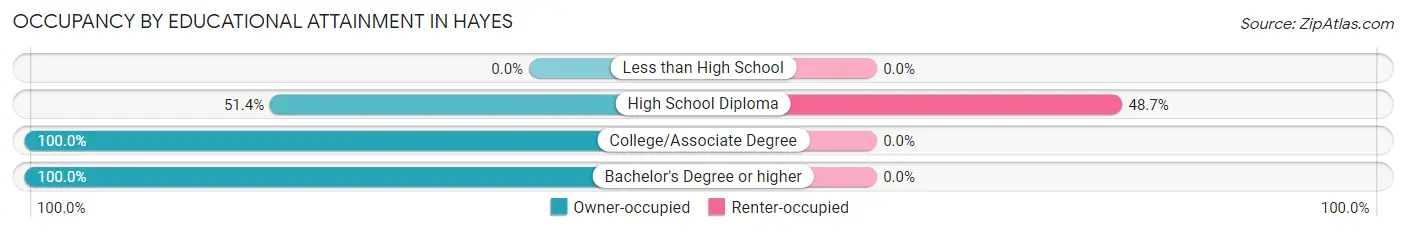
| Household Size | Owner-occupied | Renter-occupied |
| Less than High School | 0 (0.0%) | 0 (0.0%) |
| High School Diploma | 38 (51.3%) | 36 (48.6%) |
| College/Associate Degree | 36 (100.0%) | 0 (0.0%) |
| Bachelor's Degree or higher | 11 (100.0%) | 0 (0.0%) |
Occupancy by Age of Householder in Hayes
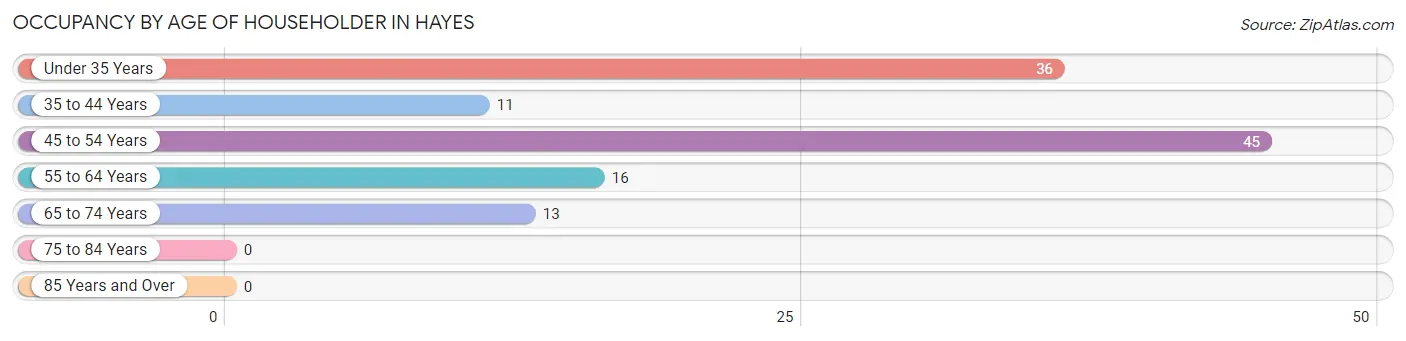
| Age Bracket | # Households | % Households |
| Under 35 Years | 36 | 29.7% |
| 35 to 44 Years | 11 | 9.1% |
| 45 to 54 Years | 45 | 37.2% |
| 55 to 64 Years | 16 | 13.2% |
| 65 to 74 Years | 13 | 10.7% |
| 75 to 84 Years | 0 | 0.0% |
| 85 Years and Over | 0 | 0.0% |
| Total | 121 | 100.0% |
Housing Finances in Hayes
Median Income by Occupancy in Hayes
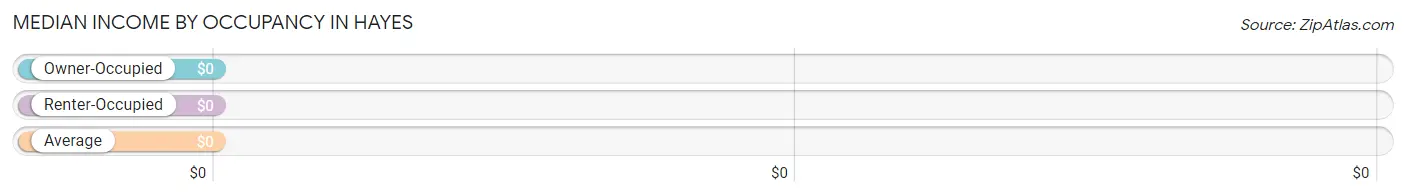
| Occupancy Type | # Households | Median Income |
| Owner-Occupied | 85 (70.3%) | $0 |
| Renter-Occupied | 36 (29.7%) | $0 |
| Average | 121 (100.0%) | $0 |
Occupancy by Householder Income Bracket in Hayes
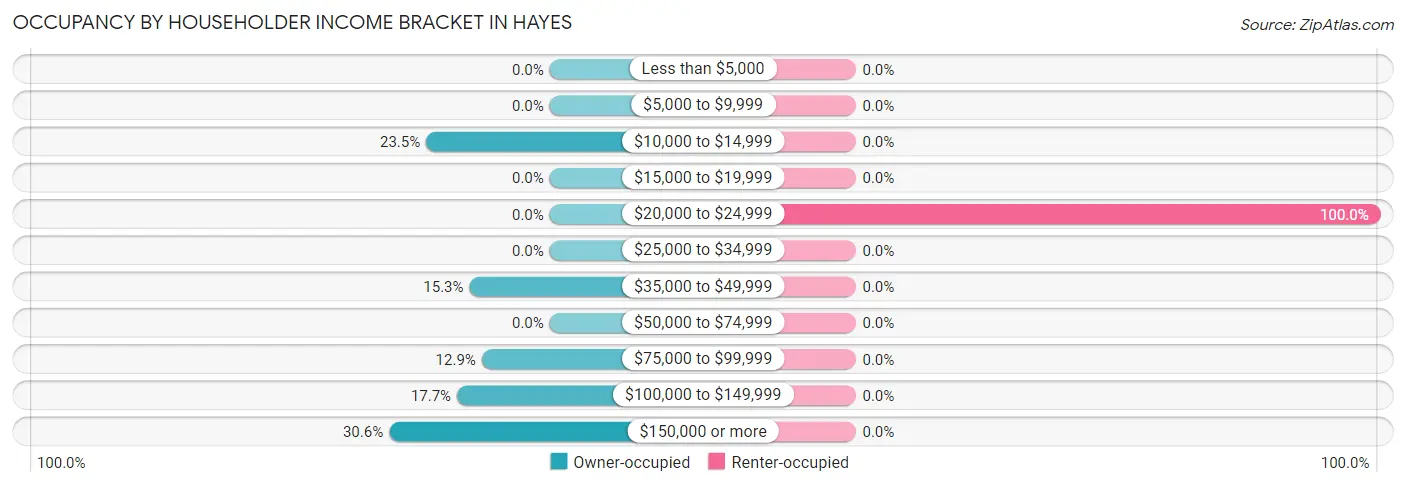
| Income Bracket | Owner-occupied | Renter-occupied |
| Less than $5,000 | 0 (0.0%) | 0 (0.0%) |
| $5,000 to $9,999 | 0 (0.0%) | 0 (0.0%) |
| $10,000 to $14,999 | 20 (23.5%) | 0 (0.0%) |
| $15,000 to $19,999 | 0 (0.0%) | 0 (0.0%) |
| $20,000 to $24,999 | 0 (0.0%) | 36 (100.0%) |
| $25,000 to $34,999 | 0 (0.0%) | 0 (0.0%) |
| $35,000 to $49,999 | 13 (15.3%) | 0 (0.0%) |
| $50,000 to $74,999 | 0 (0.0%) | 0 (0.0%) |
| $75,000 to $99,999 | 11 (12.9%) | 0 (0.0%) |
| $100,000 to $149,999 | 15 (17.6%) | 0 (0.0%) |
| $150,000 or more | 26 (30.6%) | 0 (0.0%) |
| Total | 85 (100.0%) | 36 (100.0%) |
Monthly Housing Cost Tiers in Hayes
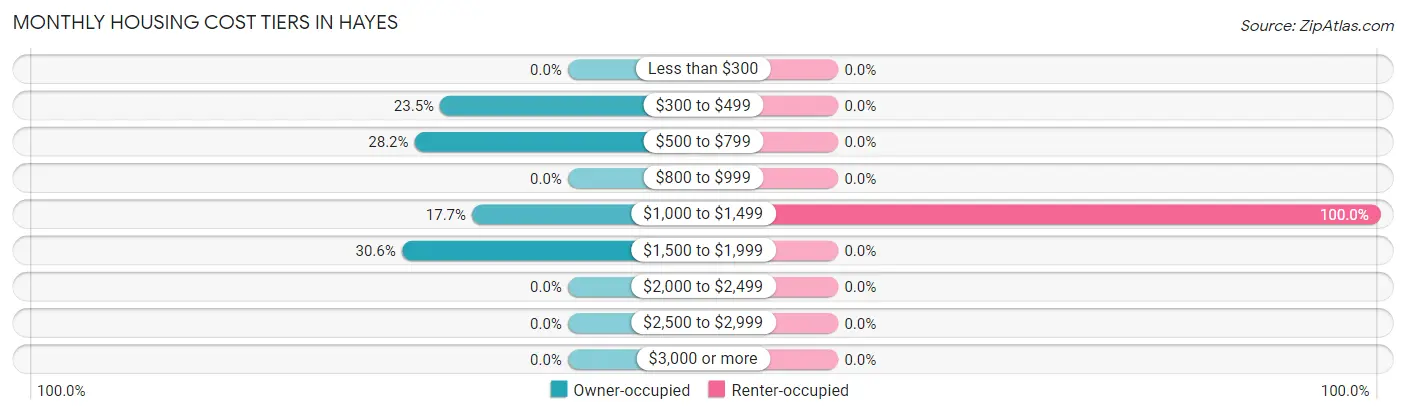
| Monthly Cost | Owner-occupied | Renter-occupied |
| Less than $300 | 0 (0.0%) | 0 (0.0%) |
| $300 to $499 | 20 (23.5%) | 0 (0.0%) |
| $500 to $799 | 24 (28.2%) | 0 (0.0%) |
| $800 to $999 | 0 (0.0%) | 0 (0.0%) |
| $1,000 to $1,499 | 15 (17.6%) | 36 (100.0%) |
| $1,500 to $1,999 | 26 (30.6%) | 0 (0.0%) |
| $2,000 to $2,499 | 0 (0.0%) | 0 (0.0%) |
| $2,500 to $2,999 | 0 (0.0%) | 0 (0.0%) |
| $3,000 or more | 0 (0.0%) | 0 (0.0%) |
| Total | 85 (100.0%) | 36 (100.0%) |
Physical Housing Characteristics in Hayes
Housing Structures in Hayes
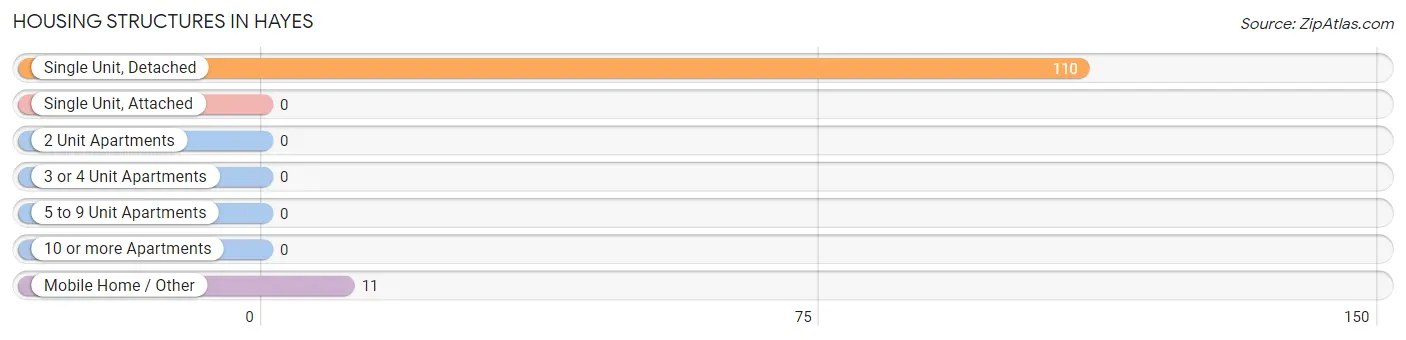
| Structure Type | # Housing Units | % Housing Units |
| Single Unit, Detached | 110 | 90.9% |
| Single Unit, Attached | 0 | 0.0% |
| 2 Unit Apartments | 0 | 0.0% |
| 3 or 4 Unit Apartments | 0 | 0.0% |
| 5 to 9 Unit Apartments | 0 | 0.0% |
| 10 or more Apartments | 0 | 0.0% |
| Mobile Home / Other | 11 | 9.1% |
| Total | 121 | 100.0% |
Housing Structures by Occupancy in Hayes
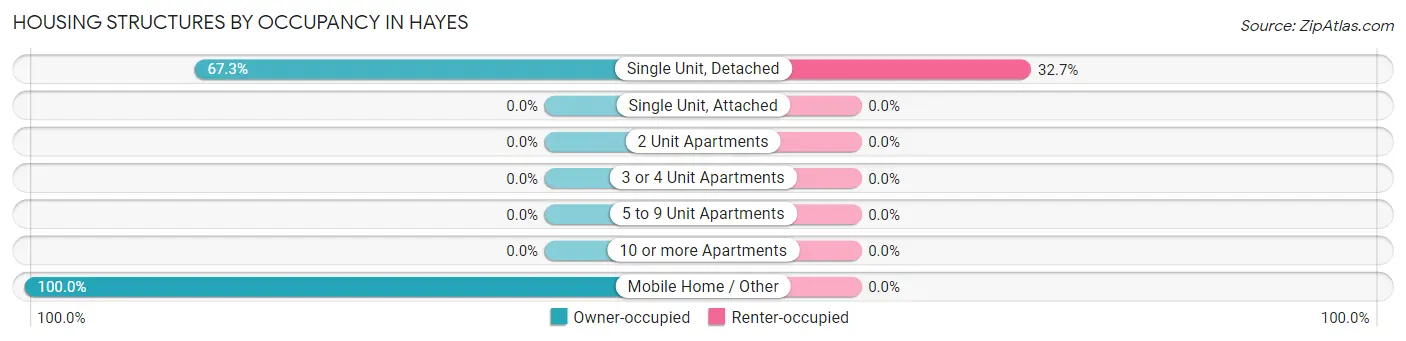
| Structure Type | Owner-occupied | Renter-occupied |
| Single Unit, Detached | 74 (67.3%) | 36 (32.7%) |
| Single Unit, Attached | 0 (0.0%) | 0 (0.0%) |
| 2 Unit Apartments | 0 (0.0%) | 0 (0.0%) |
| 3 or 4 Unit Apartments | 0 (0.0%) | 0 (0.0%) |
| 5 to 9 Unit Apartments | 0 (0.0%) | 0 (0.0%) |
| 10 or more Apartments | 0 (0.0%) | 0 (0.0%) |
| Mobile Home / Other | 11 (100.0%) | 0 (0.0%) |
| Total | 85 (70.3%) | 36 (29.7%) |
Housing Structures by Number of Rooms in Hayes
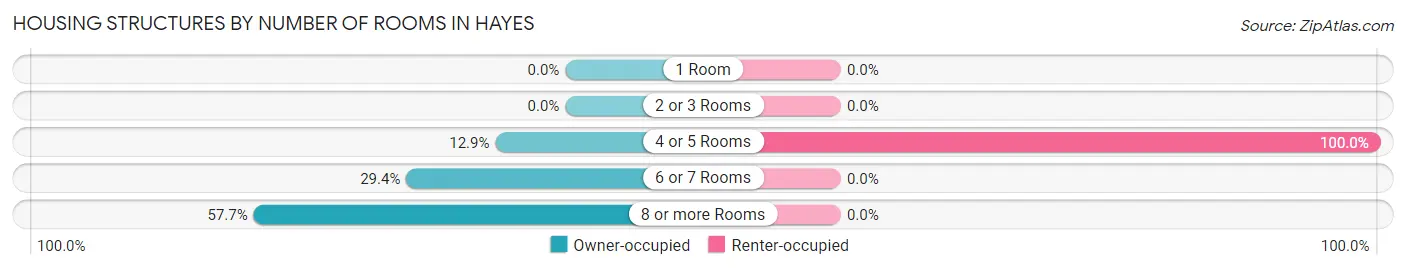
| Number of Rooms | Owner-occupied | Renter-occupied |
| 1 Room | 0 (0.0%) | 0 (0.0%) |
| 2 or 3 Rooms | 0 (0.0%) | 0 (0.0%) |
| 4 or 5 Rooms | 11 (12.9%) | 36 (100.0%) |
| 6 or 7 Rooms | 25 (29.4%) | 0 (0.0%) |
| 8 or more Rooms | 49 (57.7%) | 0 (0.0%) |
| Total | 85 (100.0%) | 36 (100.0%) |
Housing Structure by Heating Type in Hayes
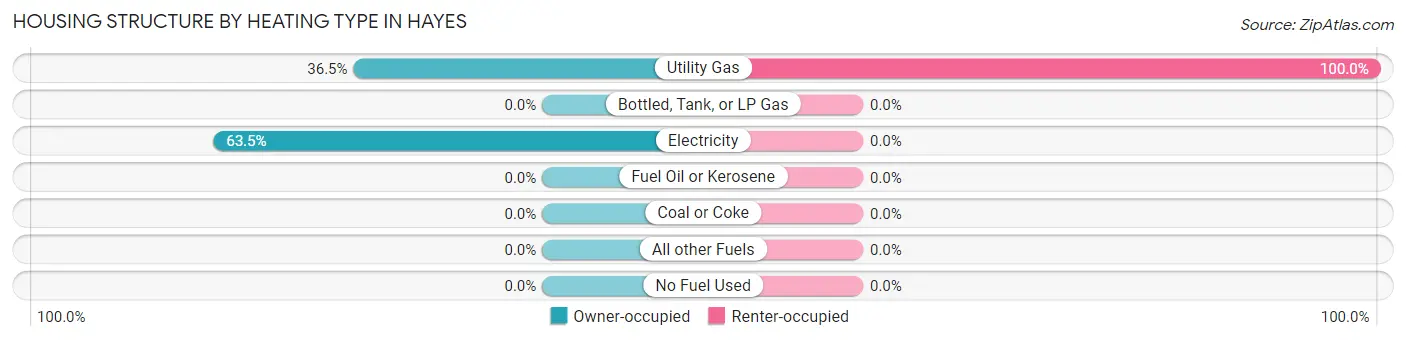
| Heating Type | Owner-occupied | Renter-occupied |
| Utility Gas | 31 (36.5%) | 36 (100.0%) |
| Bottled, Tank, or LP Gas | 0 (0.0%) | 0 (0.0%) |
| Electricity | 54 (63.5%) | 0 (0.0%) |
| Fuel Oil or Kerosene | 0 (0.0%) | 0 (0.0%) |
| Coal or Coke | 0 (0.0%) | 0 (0.0%) |
| All other Fuels | 0 (0.0%) | 0 (0.0%) |
| No Fuel Used | 0 (0.0%) | 0 (0.0%) |
| Total | 85 (100.0%) | 36 (100.0%) |
Household Vehicle Usage in Hayes
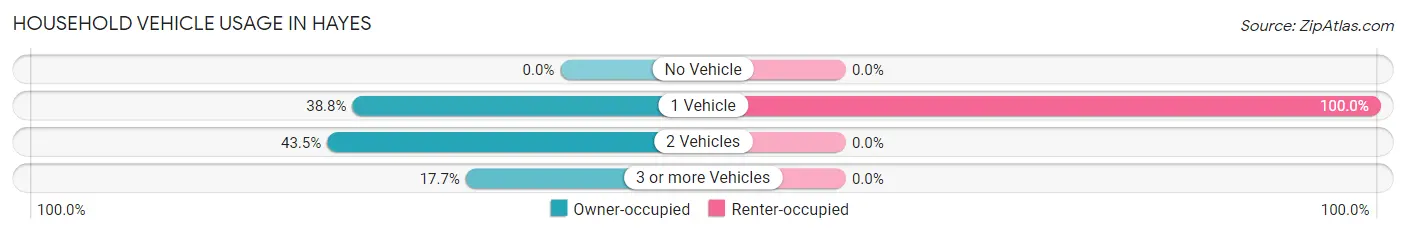
| Vehicles per Household | Owner-occupied | Renter-occupied |
| No Vehicle | 0 (0.0%) | 0 (0.0%) |
| 1 Vehicle | 33 (38.8%) | 36 (100.0%) |
| 2 Vehicles | 37 (43.5%) | 0 (0.0%) |
| 3 or more Vehicles | 15 (17.6%) | 0 (0.0%) |
| Total | 85 (100.0%) | 36 (100.0%) |
Real Estate & Mortgages in Hayes
Real Estate and Mortgage Overview in Hayes
| Characteristic | Without Mortgage | With Mortgage |
| Housing Units | 33 | 52 |
| Median Property Value | - | - |
| Median Household Income | - | - |
| Monthly Housing Costs | - | - |
| Real Estate Taxes | - | - |
Property Value by Mortgage Status in Hayes
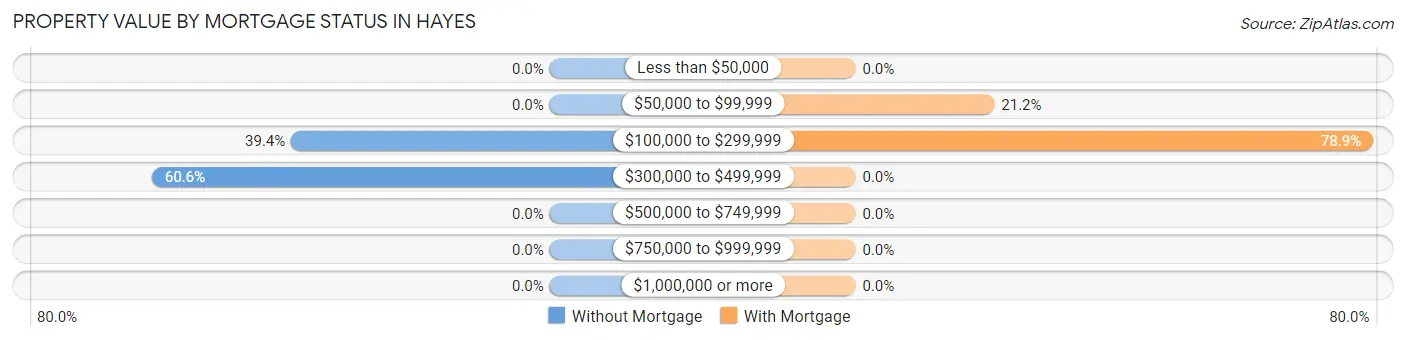
| Property Value | Without Mortgage | With Mortgage |
| Less than $50,000 | 0 (0.0%) | 0 (0.0%) |
| $50,000 to $99,999 | 0 (0.0%) | 11 (21.1%) |
| $100,000 to $299,999 | 13 (39.4%) | 41 (78.8%) |
| $300,000 to $499,999 | 20 (60.6%) | 0 (0.0%) |
| $500,000 to $749,999 | 0 (0.0%) | 0 (0.0%) |
| $750,000 to $999,999 | 0 (0.0%) | 0 (0.0%) |
| $1,000,000 or more | 0 (0.0%) | 0 (0.0%) |
| Total | 33 (100.0%) | 52 (100.0%) |
Household Income by Mortgage Status in Hayes
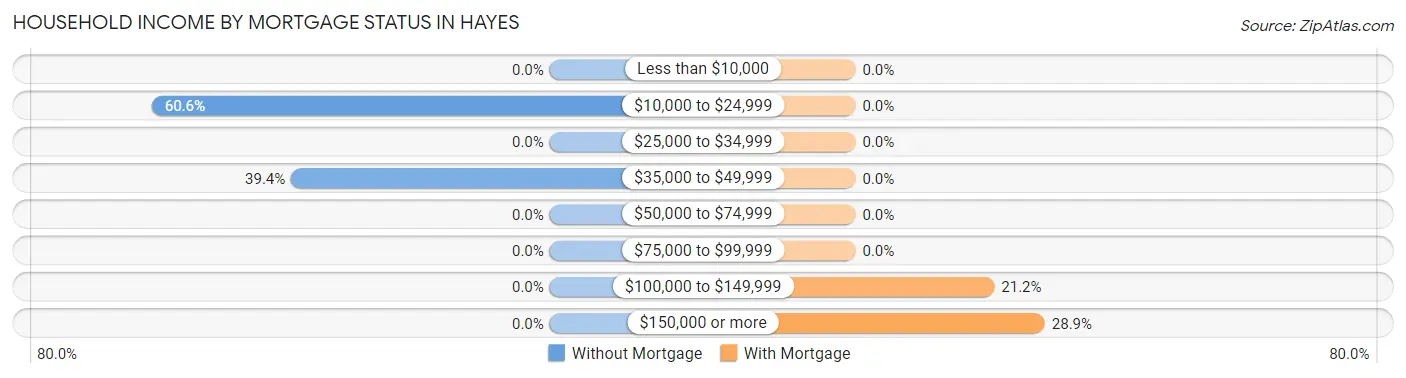
| Household Income | Without Mortgage | With Mortgage |
| Less than $10,000 | 0 (0.0%) | 0 (0.0%) |
| $10,000 to $24,999 | 20 (60.6%) | 0 (0.0%) |
| $25,000 to $34,999 | 0 (0.0%) | 0 (0.0%) |
| $35,000 to $49,999 | 13 (39.4%) | 0 (0.0%) |
| $50,000 to $74,999 | 0 (0.0%) | 0 (0.0%) |
| $75,000 to $99,999 | 0 (0.0%) | 0 (0.0%) |
| $100,000 to $149,999 | 0 (0.0%) | 11 (21.1%) |
| $150,000 or more | 0 (0.0%) | 15 (28.8%) |
| Total | 33 (100.0%) | 52 (100.0%) |
Property Value to Household Income Ratio in Hayes
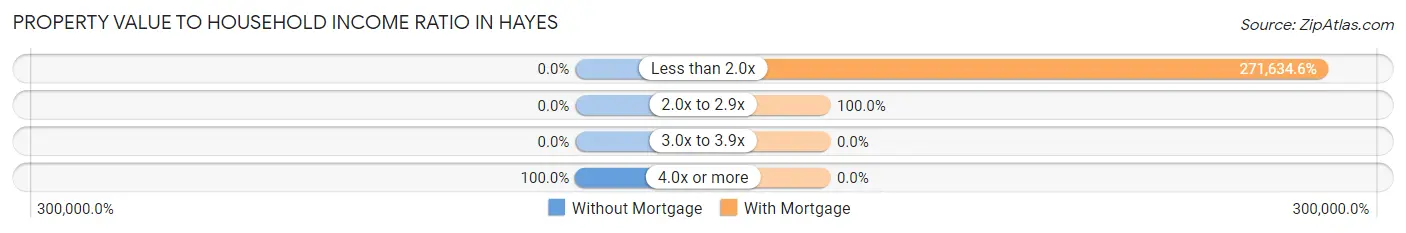
| Value-to-Income Ratio | Without Mortgage | With Mortgage |
| Less than 2.0x | 0 (0.0%) | 141,250 (271,634.6%) |
| 2.0x to 2.9x | 0 (0.0%) | 52 (100.0%) |
| 3.0x to 3.9x | 0 (0.0%) | 0 (0.0%) |
| 4.0x or more | 33 (100.0%) | 0 (0.0%) |
| Total | 33 (100.0%) | 52 (100.0%) |
Real Estate Taxes by Mortgage Status in Hayes
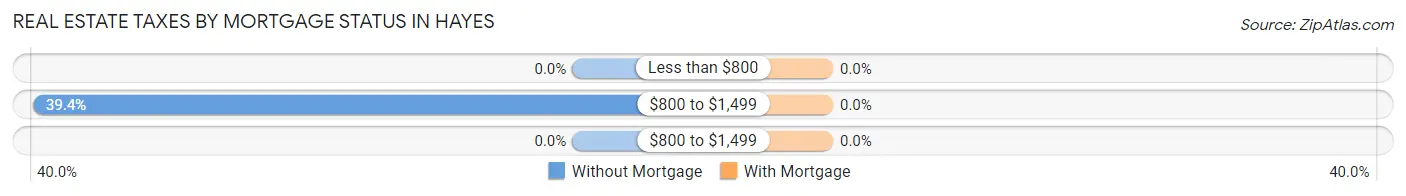
| Property Taxes | Without Mortgage | With Mortgage |
| Less than $800 | 0 (0.0%) | 0 (0.0%) |
| $800 to $1,499 | 13 (39.4%) | 0 (0.0%) |
| $800 to $1,499 | 0 (0.0%) | 0 (0.0%) |
| Total | 33 (100.0%) | 52 (100.0%) |
Health & Disability in Hayes
Health Insurance Coverage by Age in Hayes
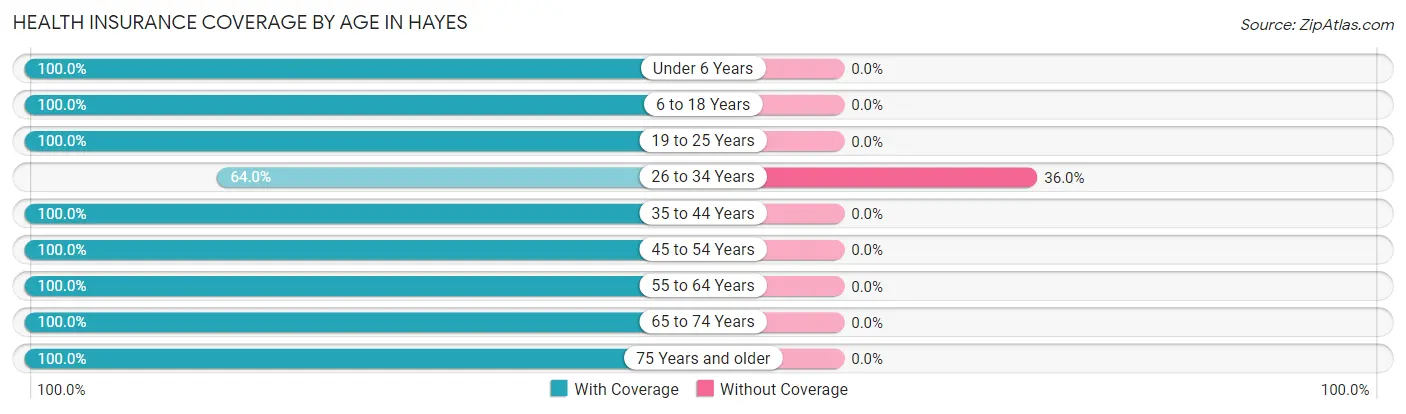
| Age Bracket | With Coverage | Without Coverage |
| Under 6 Years | 35 (100.0%) | 0 (0.0%) |
| 6 to 18 Years | 127 (100.0%) | 0 (0.0%) |
| 19 to 25 Years | 34 (100.0%) | 0 (0.0%) |
| 26 to 34 Years | 80 (64.0%) | 45 (36.0%) |
| 35 to 44 Years | 21 (100.0%) | 0 (0.0%) |
| 45 to 54 Years | 71 (100.0%) | 0 (0.0%) |
| 55 to 64 Years | 32 (100.0%) | 0 (0.0%) |
| 65 to 74 Years | 13 (100.0%) | 0 (0.0%) |
| 75 Years and older | 19 (100.0%) | 0 (0.0%) |
| Total | 432 (90.6%) | 45 (9.4%) |
Health Insurance Coverage by Citizenship Status in Hayes
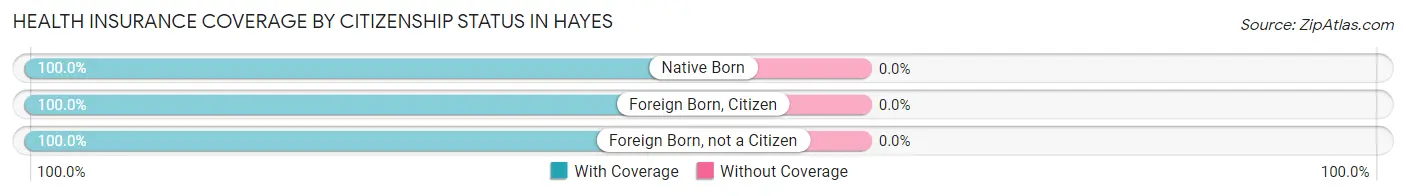
| Citizenship Status | With Coverage | Without Coverage |
| Native Born | 35 (100.0%) | 0 (0.0%) |
| Foreign Born, Citizen | 127 (100.0%) | 0 (0.0%) |
| Foreign Born, not a Citizen | 34 (100.0%) | 0 (0.0%) |
Health Insurance Coverage by Household Income in Hayes
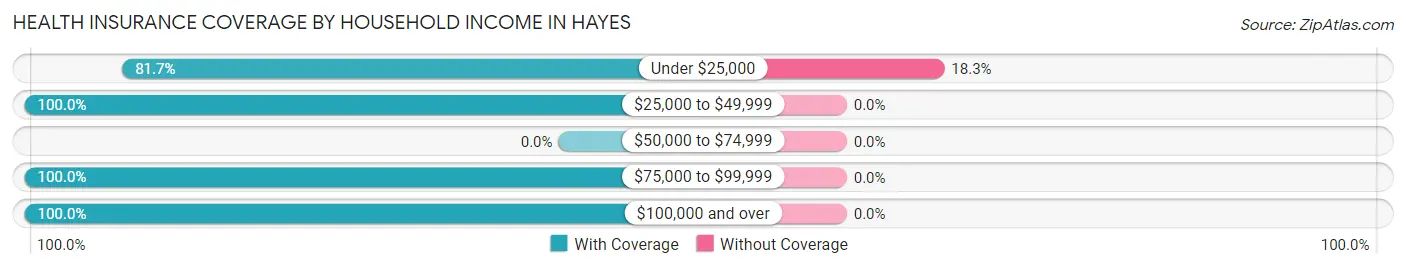
| Household Income | With Coverage | Without Coverage |
| Under $25,000 | 201 (81.7%) | 45 (18.3%) |
| $25,000 to $49,999 | 32 (100.0%) | 0 (0.0%) |
| $50,000 to $74,999 | 0 (0.0%) | 0 (0.0%) |
| $75,000 to $99,999 | 34 (100.0%) | 0 (0.0%) |
| $100,000 and over | 165 (100.0%) | 0 (0.0%) |
Public vs Private Health Insurance Coverage by Age in Hayes
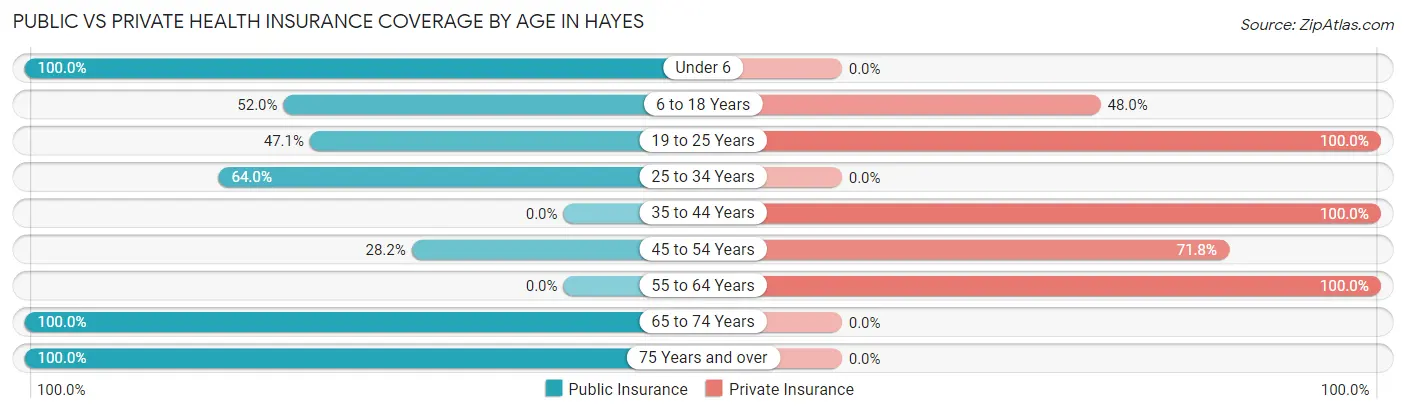
| Age Bracket | Public Insurance | Private Insurance |
| Under 6 | 35 (100.0%) | 0 (0.0%) |
| 6 to 18 Years | 66 (52.0%) | 61 (48.0%) |
| 19 to 25 Years | 16 (47.1%) | 34 (100.0%) |
| 25 to 34 Years | 80 (64.0%) | 0 (0.0%) |
| 35 to 44 Years | 0 (0.0%) | 21 (100.0%) |
| 45 to 54 Years | 20 (28.2%) | 51 (71.8%) |
| 55 to 64 Years | 0 (0.0%) | 32 (100.0%) |
| 65 to 74 Years | 13 (100.0%) | 0 (0.0%) |
| 75 Years and over | 19 (100.0%) | 0 (0.0%) |
| Total | 249 (52.2%) | 199 (41.7%) |
Disability Status by Sex by Age in Hayes
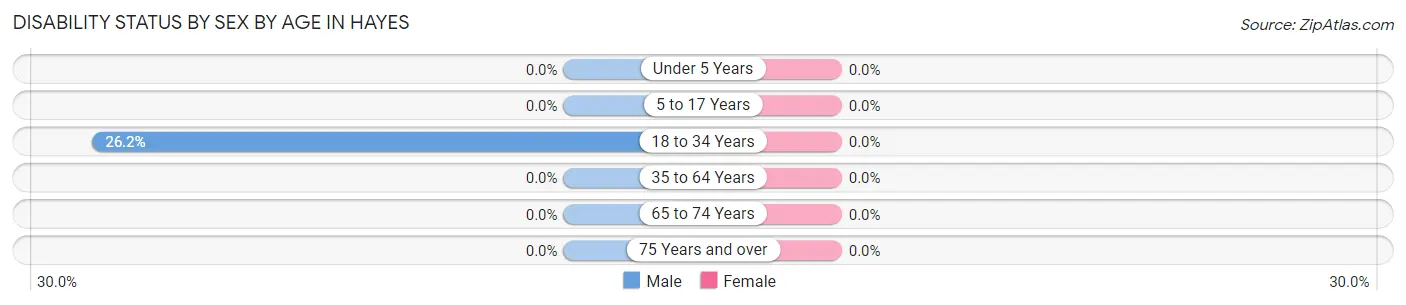
| Age Bracket | Male | Female |
| Under 5 Years | 0 (0.0%) | 0 (0.0%) |
| 5 to 17 Years | 0 (0.0%) | 0 (0.0%) |
| 18 to 34 Years | 16 (26.2%) | 0 (0.0%) |
| 35 to 64 Years | 0 (0.0%) | 0 (0.0%) |
| 65 to 74 Years | 0 (0.0%) | 0 (0.0%) |
| 75 Years and over | 0 (0.0%) | 0 (0.0%) |
Disability Class by Sex by Age in Hayes
Disability Class: Hearing Difficulty
| Age Bracket | Male | Female |
| Under 5 Years | 0 (0.0%) | 0 (0.0%) |
| 5 to 17 Years | 0 (0.0%) | 0 (0.0%) |
| 18 to 34 Years | 0 (0.0%) | 0 (0.0%) |
| 35 to 64 Years | 0 (0.0%) | 0 (0.0%) |
| 65 to 74 Years | 0 (0.0%) | 0 (0.0%) |
| 75 Years and over | 0 (0.0%) | 0 (0.0%) |
Disability Class: Vision Difficulty
| Age Bracket | Male | Female |
| Under 5 Years | 0 (0.0%) | 0 (0.0%) |
| 5 to 17 Years | 0 (0.0%) | 0 (0.0%) |
| 18 to 34 Years | 0 (0.0%) | 0 (0.0%) |
| 35 to 64 Years | 0 (0.0%) | 0 (0.0%) |
| 65 to 74 Years | 0 (0.0%) | 0 (0.0%) |
| 75 Years and over | 0 (0.0%) | 0 (0.0%) |
Disability Class: Cognitive Difficulty

| Age Bracket | Male | Female |
| 5 to 17 Years | 0 (0.0%) | 0 (0.0%) |
| 18 to 34 Years | 16 (26.2%) | 0 (0.0%) |
| 35 to 64 Years | 0 (0.0%) | 0 (0.0%) |
| 65 to 74 Years | 0 (0.0%) | 0 (0.0%) |
| 75 Years and over | 0 (0.0%) | 0 (0.0%) |
Disability Class: Ambulatory Difficulty
| Age Bracket | Male | Female |
| 5 to 17 Years | 0 (0.0%) | 0 (0.0%) |
| 18 to 34 Years | 0 (0.0%) | 0 (0.0%) |
| 35 to 64 Years | 0 (0.0%) | 0 (0.0%) |
| 65 to 74 Years | 0 (0.0%) | 0 (0.0%) |
| 75 Years and over | 0 (0.0%) | 0 (0.0%) |
Disability Class: Self-Care Difficulty
| Age Bracket | Male | Female |
| 5 to 17 Years | 0 (0.0%) | 0 (0.0%) |
| 18 to 34 Years | 16 (26.2%) | 0 (0.0%) |
| 35 to 64 Years | 0 (0.0%) | 0 (0.0%) |
| 65 to 74 Years | 0 (0.0%) | 0 (0.0%) |
| 75 Years and over | 0 (0.0%) | 0 (0.0%) |
Technology Access in Hayes
Computing Device Access in Hayes
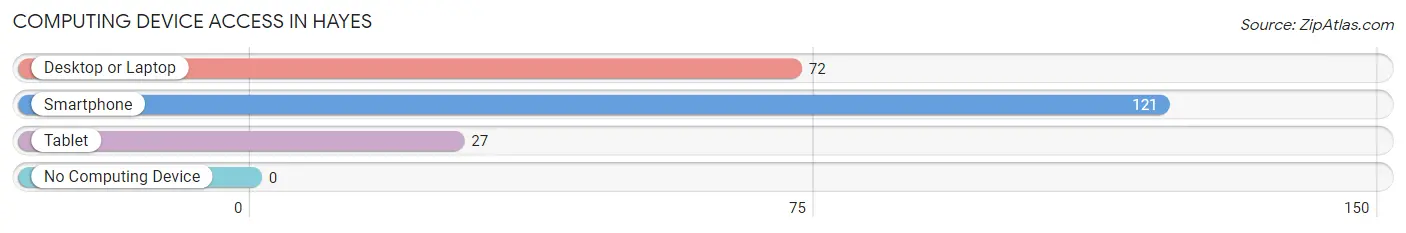
| Device Type | # Households | % Households |
| Desktop or Laptop | 72 | 59.5% |
| Smartphone | 121 | 100.0% |
| Tablet | 27 | 22.3% |
| No Computing Device | 0 | 0.0% |
| Total | 121 | 100.0% |
Internet Access in Hayes
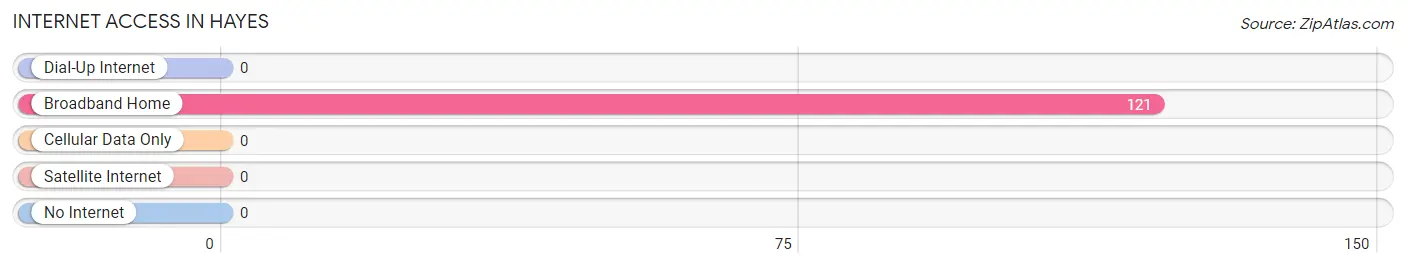
| Internet Type | # Households | % Households |
| Dial-Up Internet | 0 | 0.0% |
| Broadband Home | 121 | 100.0% |
| Cellular Data Only | 0 | 0.0% |
| Satellite Internet | 0 | 0.0% |
| No Internet | 0 | 0.0% |
| Total | 121 | 100.0% |
Hayes Summary
Hayes, Louisiana is a small town located in the southeastern corner of the state, in the parish of St. Mary. It is situated on the banks of the Atchafalaya River, and is part of the Morgan City Micropolitan Statistical Area. Hayes has a population of just over 1,000 people, and is known for its rural charm and friendly atmosphere.
History
Hayes was founded in 1883 by a group of settlers from the nearby town of Franklin. The town was named after the Hayes family, who were among the first settlers. The town was originally a farming community, and the main crops grown were cotton, corn, and sugar cane. In the early 1900s, the town began to grow as the lumber industry began to take off. The lumber industry provided jobs for many of the town’s residents, and the town began to prosper.
In the 1950s, the town began to decline as the lumber industry began to decline. Many of the town’s residents moved away in search of better opportunities. However, in the late 1970s, the town began to experience a resurgence as the oil and gas industry began to take off in the area. This provided new jobs and opportunities for the town’s residents, and the town began to grow again.
Geography
Hayes is located in the southeastern corner of Louisiana, in the parish of St. Mary. It is situated on the banks of the Atchafalaya River, and is part of the Morgan City Micropolitan Statistical Area. The town is located about 30 miles south of Baton Rouge, and about 50 miles west of New Orleans. The town is surrounded by swamps and marshlands, and is known for its rural charm and friendly atmosphere.
Economy
The economy of Hayes is largely based on the oil and gas industry. The town is home to several oil and gas companies, and many of the town’s residents are employed in this industry. The town is also home to several small businesses, including restaurants, convenience stores, and other retail establishments.
Demographics
As of the 2010 census, the population of Hayes was 1,072. The racial makeup of the town was 79.3% White, 17.2% African American, 0.7% Native American, 0.3% Asian, 0.1% Pacific Islander, and 2.4% from other races. The median household income was $31,250, and the median family income was $37,500. The per capita income was $15,845.
Conclusion
Hayes, Louisiana is a small town located in the southeastern corner of the state, in the parish of St. Mary. It is situated on the banks of the Atchafalaya River, and is part of the Morgan City Micropolitan Statistical Area. Hayes has a population of just over 1,000 people, and is known for its rural charm and friendly atmosphere. The economy of Hayes is largely based on the oil and gas industry, and the town is home to several small businesses. The racial makeup of the town is 79.3% White, 17.2% African American, 0.7% Native American, 0.3% Asian, 0.1% Pacific Islander, and 2.4% from other races. The median household income was $31,250, and the median family income was $37,500. The per capita income was $15,845. Hayes is a small town with a rich history and a bright future.
Common Questions
What is Per Capita Income in Hayes?
Per Capita income in Hayes is $21,676.
What is Inequality or Gini Index in Hayes?
Inequality or Gini Index in Hayes is 0.48.
What is the Total Population of Hayes?
Total Population of Hayes is 477.
What is the Total Male Population of Hayes?
Total Male Population of Hayes is 213.
What is the Total Female Population of Hayes?
Total Female Population of Hayes is 264.
What is the Ratio of Males per 100 Females in Hayes?
There are 80.68 Males per 100 Females in Hayes.
What is the Ratio of Females per 100 Males in Hayes?
There are 123.94 Females per 100 Males in Hayes.
What is the Median Population Age in Hayes?
Median Population Age in Hayes is 30.1 Years.
What is the Average Family Size in Hayes
Average Family Size in Hayes is 3.6 People.
What is the Average Household Size in Hayes
Average Household Size in Hayes is 3.9 People.
How Large is the Labor Force in Hayes?
There are 201 People in the Labor Forcein in Hayes.
What is the Percentage of People in the Labor Force in Hayes?
60.0% of People are in the Labor Force in Hayes.
What is the Unemployment Rate in Hayes?
Unemployment Rate in Hayes is 21.9%.