Westport, OR Map & Demographics
Westport Map
Westport Overview
$28,945
PER CAPITA INCOME
$78,750
AVG FAMILY INCOME
$63,750
AVG HOUSEHOLD INCOME
0.38
INEQUALITY / GINI INDEX
367
TOTAL POPULATION
209
MALE POPULATION
158
FEMALE POPULATION
132.28
MALES / 100 FEMALES
75.60
FEMALES / 100 MALES
46.5
MEDIAN AGE
3.1
AVG FAMILY SIZE
2.7
AVG HOUSEHOLD SIZE
187
LABOR FORCE [ PEOPLE ]
51.0%
PERCENT IN LABOR FORCE
Income in Westport
Income Overview in Westport
Per Capita Income in Westport is $28,945, while median incomes of families and households are $78,750 and $63,750 respectively.
| Characteristic | Number | Measure |
| Per Capita Income | 367 | $28,945 |
| Median Family Income | 109 | $78,750 |
| Mean Family Income | 109 | $84,455 |
| Median Household Income | 138 | $63,750 |
| Mean Household Income | 138 | $74,047 |
| Income Deficit | 109 | $0 |
| Wage / Income Gap (%) | 367 | 0.00% |
| Wage / Income Gap ($) | 367 | 100.00¢ per $1 |
| Gini / Inequality Index | 367 | 0.38 |
Earnings by Sex in Westport
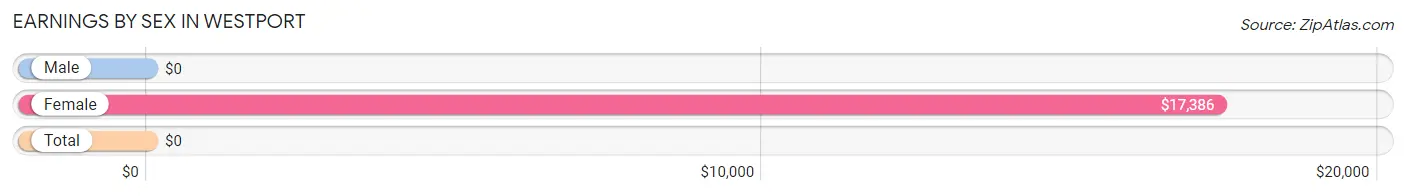
| Sex | Number | Average Earnings |
| Male | 150 (80.2%) | $0 |
| Female | 37 (19.8%) | $17,386 |
| Total | 187 (100.0%) | $0 |
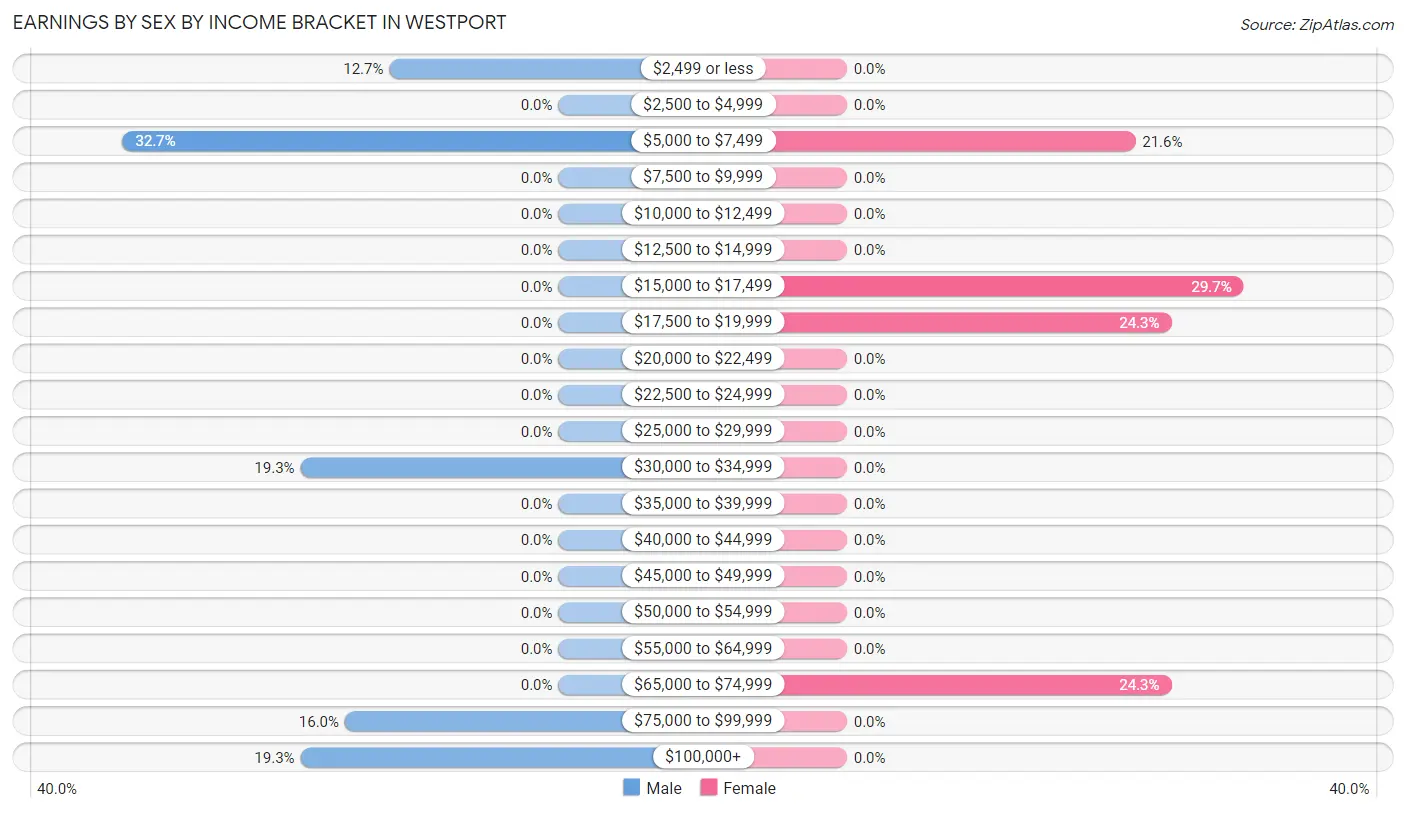
Earnings by Sex by Income Bracket in Westport
The most common earnings brackets in Westport are $5,000 to $7,499 for men (49 | 32.7%) and $15,000 to $17,499 for women (11 | 29.7%).
| Income | Male | Female |
| $2,499 or less | 19 (12.7%) | 0 (0.0%) |
| $2,500 to $4,999 | 0 (0.0%) | 0 (0.0%) |
| $5,000 to $7,499 | 49 (32.7%) | 8 (21.6%) |
| $7,500 to $9,999 | 0 (0.0%) | 0 (0.0%) |
| $10,000 to $12,499 | 0 (0.0%) | 0 (0.0%) |
| $12,500 to $14,999 | 0 (0.0%) | 0 (0.0%) |
| $15,000 to $17,499 | 0 (0.0%) | 11 (29.7%) |
| $17,500 to $19,999 | 0 (0.0%) | 9 (24.3%) |
| $20,000 to $22,499 | 0 (0.0%) | 0 (0.0%) |
| $22,500 to $24,999 | 0 (0.0%) | 0 (0.0%) |
| $25,000 to $29,999 | 0 (0.0%) | 0 (0.0%) |
| $30,000 to $34,999 | 29 (19.3%) | 0 (0.0%) |
| $35,000 to $39,999 | 0 (0.0%) | 0 (0.0%) |
| $40,000 to $44,999 | 0 (0.0%) | 0 (0.0%) |
| $45,000 to $49,999 | 0 (0.0%) | 0 (0.0%) |
| $50,000 to $54,999 | 0 (0.0%) | 0 (0.0%) |
| $55,000 to $64,999 | 0 (0.0%) | 0 (0.0%) |
| $65,000 to $74,999 | 0 (0.0%) | 9 (24.3%) |
| $75,000 to $99,999 | 24 (16.0%) | 0 (0.0%) |
| $100,000+ | 29 (19.3%) | 0 (0.0%) |
| Total | 150 (100.0%) | 37 (100.0%) |
Earnings by Sex by Educational Attainment in Westport
| Educational Attainment | Male Income | Female Income |
| Less than High School | - | - |
| High School Diploma | - | - |
| College or Associate's Degree | - | - |
| Bachelor's Degree | - | - |
| Graduate Degree | - | - |
| Total | $92,857 | $17,386 |
Family Income in Westport
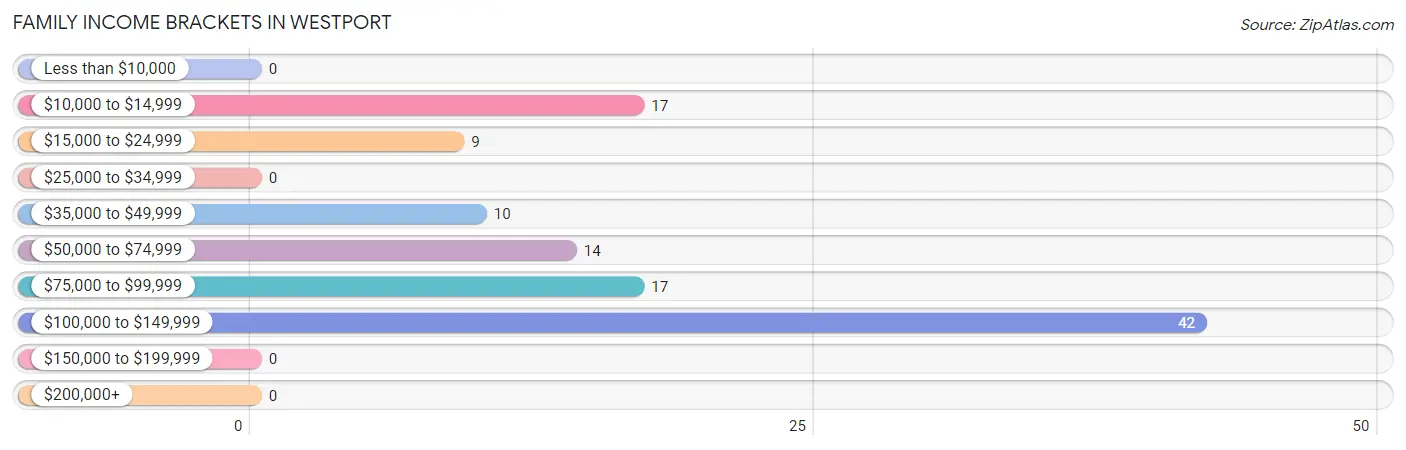
Family Income Brackets in Westport
According to the Westport family income data, there are 42 families falling into the $100,000 to $149,999 income range, which is the most common income bracket and makes up 38.5% of all families.
| Income Bracket | # Families | % Families |
| Less than $10,000 | 0 | 0.0% |
| $10,000 to $14,999 | 17 | 15.6% |
| $15,000 to $24,999 | 9 | 8.3% |
| $25,000 to $34,999 | 0 | 0.0% |
| $35,000 to $49,999 | 10 | 9.2% |
| $50,000 to $74,999 | 14 | 12.8% |
| $75,000 to $99,999 | 17 | 15.6% |
| $100,000 to $149,999 | 42 | 38.5% |
| $150,000 to $199,999 | 0 | 0.0% |
| $200,000+ | 0 | 0.0% |
Family Income by Famaliy Size in Westport
| Income Bracket | # Families | Median Income |
| 2-Person Families | 63 (57.8%) | $0 |
| 3-Person Families | 4 (3.7%) | $0 |
| 4-Person Families | 42 (38.5%) | $0 |
| 5-Person Families | 0 (0.0%) | $0 |
| 6-Person Families | 0 (0.0%) | $0 |
| 7+ Person Families | 0 (0.0%) | $0 |
| Total | 109 (100.0%) | $78,750 |
Family Income by Number of Earners in Westport
| Number of Earners | # Families | Median Income |
| No Earners | 41 (37.6%) | $0 |
| 1 Earner | 18 (16.5%) | $0 |
| 2 Earners | 36 (33.0%) | $0 |
| 3+ Earners | 14 (12.8%) | $0 |
| Total | 109 (100.0%) | $78,750 |
Household Income in Westport
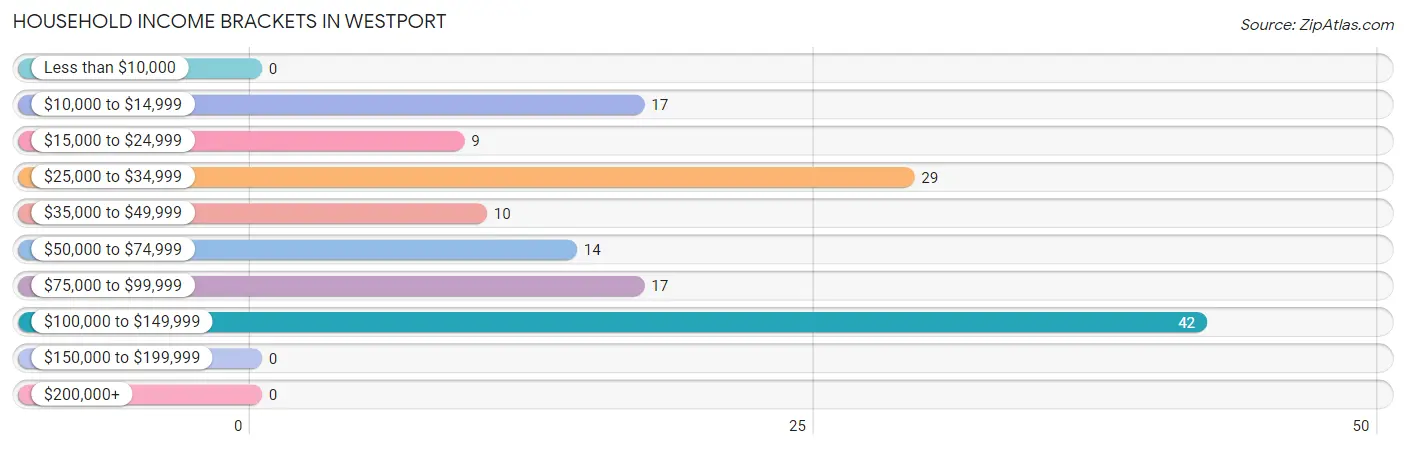
Household Income Brackets in Westport
With 42 households falling in the category, the $100,000 to $149,999 income range is the most frequent in Westport, accounting for 30.4% of all households.
| Income Bracket | # Households | % Households |
| Less than $10,000 | 0 | 0.0% |
| $10,000 to $14,999 | 17 | 12.3% |
| $15,000 to $24,999 | 9 | 6.5% |
| $25,000 to $34,999 | 29 | 21.0% |
| $35,000 to $49,999 | 10 | 7.2% |
| $50,000 to $74,999 | 14 | 10.1% |
| $75,000 to $99,999 | 17 | 12.3% |
| $100,000 to $149,999 | 42 | 30.4% |
| $150,000 to $199,999 | 0 | 0.0% |
| $200,000+ | 0 | 0.0% |
Household Income by Householder Age in Westport
The median household income in Westport is $63,750, with the highest median household income of $139,732 found in the 45 to 64 years age bracket for the primary householder. A total of 59 households (42.7%) fall into this category.
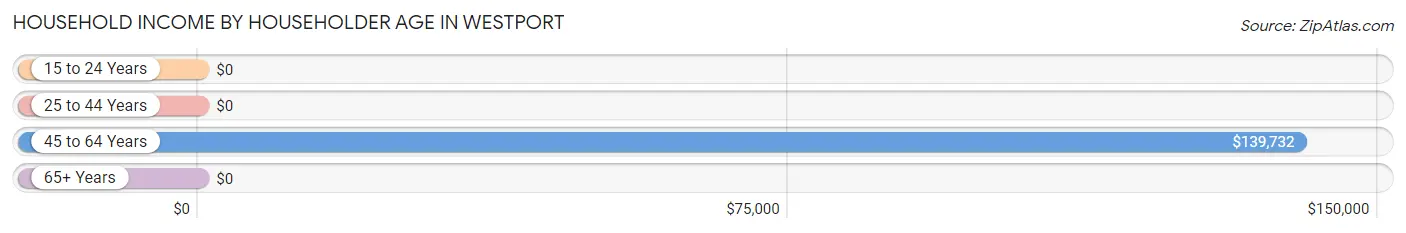
| Income Bracket | # Households | Median Income |
| 15 to 24 Years | 0 (0.0%) | $0 |
| 25 to 44 Years | 29 (21.0%) | $0 |
| 45 to 64 Years | 59 (42.7%) | $139,732 |
| 65+ Years | 50 (36.2%) | $0 |
| Total | 138 (100.0%) | $63,750 |
Poverty in Westport
Income Below Poverty by Sex and Age in Westport
With 7.2% poverty level for males and 10.8% for females among the residents of Westport, 35 to 44 year old males and 65 to 74 year old females are the most vulnerable to poverty, with 15 males (34.1%) and 17 females (40.5%) in their respective age groups living below the poverty level.
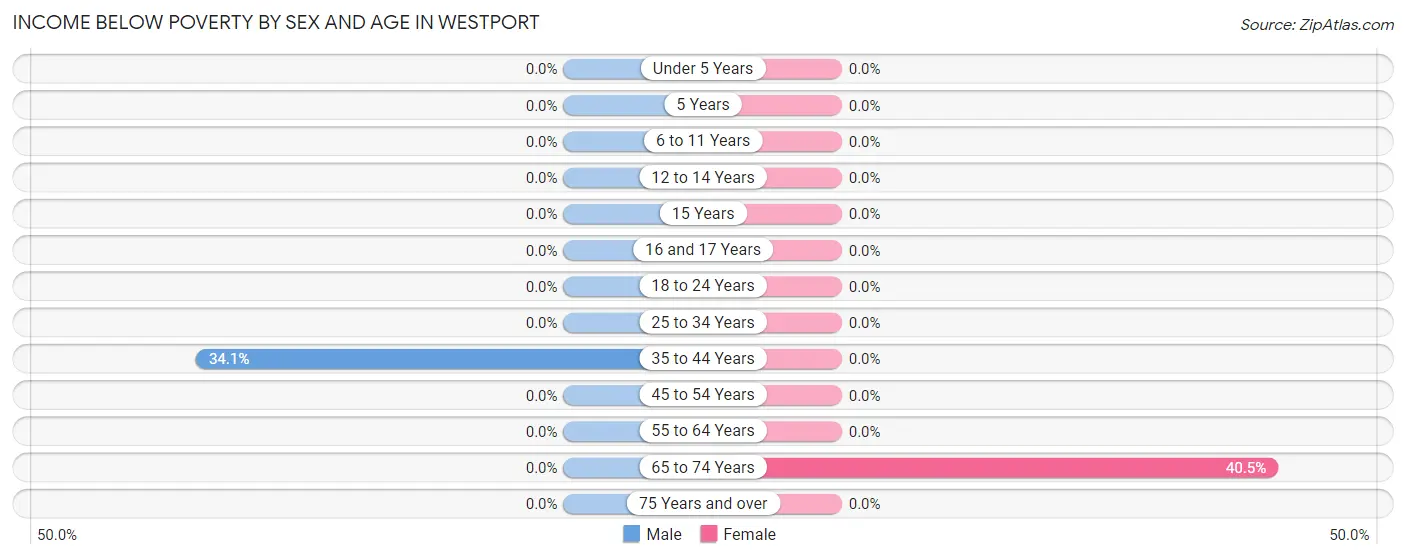
| Age Bracket | Male | Female |
| Under 5 Years | 0 (0.0%) | 0 (0.0%) |
| 5 Years | 0 (0.0%) | 0 (0.0%) |
| 6 to 11 Years | 0 (0.0%) | 0 (0.0%) |
| 12 to 14 Years | 0 (0.0%) | 0 (0.0%) |
| 15 Years | 0 (0.0%) | 0 (0.0%) |
| 16 and 17 Years | 0 (0.0%) | 0 (0.0%) |
| 18 to 24 Years | 0 (0.0%) | 0 (0.0%) |
| 25 to 34 Years | 0 (0.0%) | 0 (0.0%) |
| 35 to 44 Years | 15 (34.1%) | 0 (0.0%) |
| 45 to 54 Years | 0 (0.0%) | 0 (0.0%) |
| 55 to 64 Years | 0 (0.0%) | 0 (0.0%) |
| 65 to 74 Years | 0 (0.0%) | 17 (40.5%) |
| 75 Years and over | 0 (0.0%) | 0 (0.0%) |
| Total | 15 (7.2%) | 17 (10.8%) |
Income Above Poverty by Sex and Age in Westport
According to the poverty statistics in Westport, males aged 18 to 24 years and females aged 16 and 17 years are the age groups that are most secure financially, with 100.0% of males and 100.0% of females in these age groups living above the poverty line.
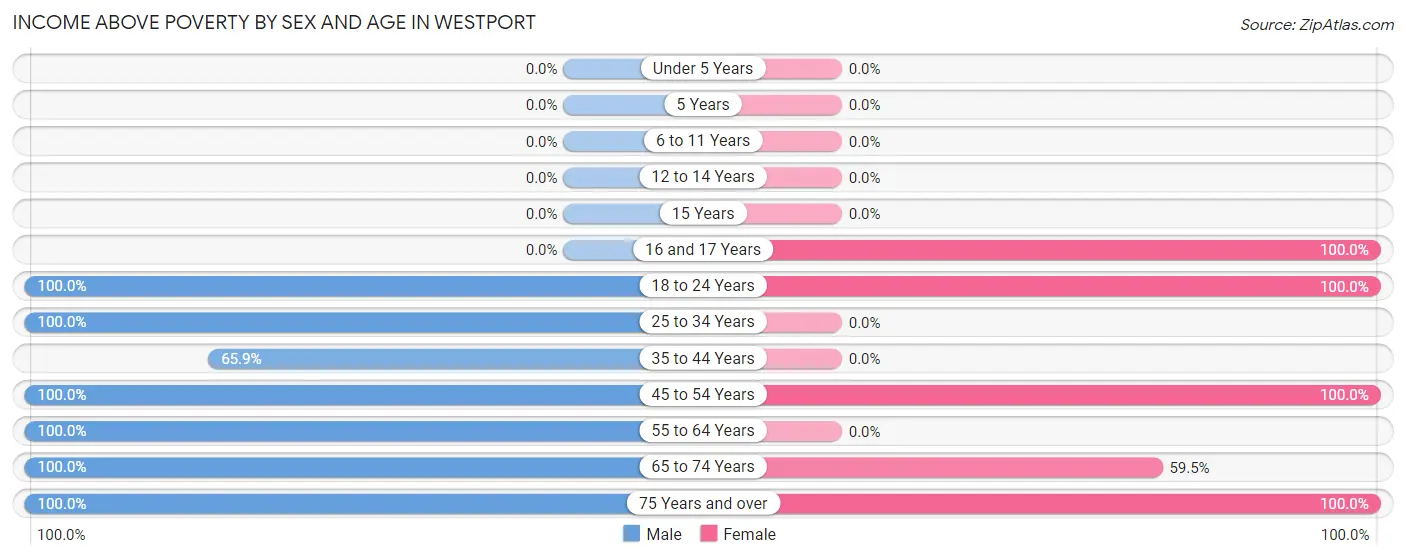
| Age Bracket | Male | Female |
| Under 5 Years | 0 (0.0%) | 0 (0.0%) |
| 5 Years | 0 (0.0%) | 0 (0.0%) |
| 6 to 11 Years | 0 (0.0%) | 0 (0.0%) |
| 12 to 14 Years | 0 (0.0%) | 0 (0.0%) |
| 15 Years | 0 (0.0%) | 0 (0.0%) |
| 16 and 17 Years | 0 (0.0%) | 5 (100.0%) |
| 18 to 24 Years | 68 (100.0%) | 15 (100.0%) |
| 25 to 34 Years | 29 (100.0%) | 0 (0.0%) |
| 35 to 44 Years | 29 (65.9%) | 0 (0.0%) |
| 45 to 54 Years | 34 (100.0%) | 56 (100.0%) |
| 55 to 64 Years | 12 (100.0%) | 0 (0.0%) |
| 65 to 74 Years | 18 (100.0%) | 25 (59.5%) |
| 75 Years and over | 4 (100.0%) | 40 (100.0%) |
| Total | 194 (92.8%) | 141 (89.2%) |
Income Below Poverty Among Married-Couple Families in Westport
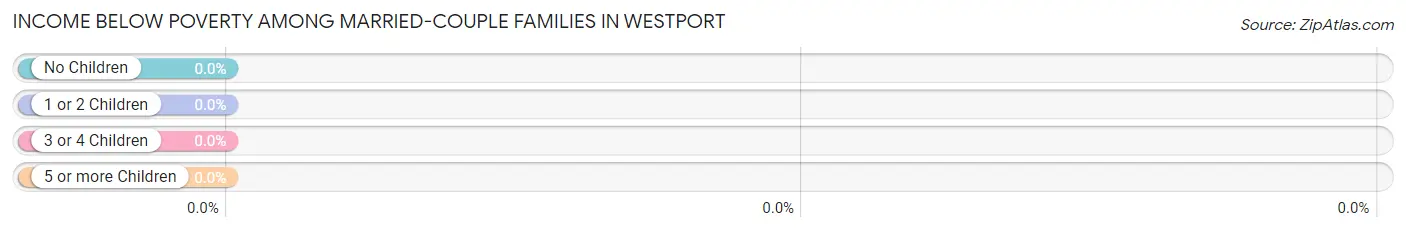
| Children | Above Poverty | Below Poverty |
| No Children | 74 (100.0%) | 0 (0.0%) |
| 1 or 2 Children | 0 (0.0%) | 0 (0.0%) |
| 3 or 4 Children | 0 (0.0%) | 0 (0.0%) |
| 5 or more Children | 0 (0.0%) | 0 (0.0%) |
| Total | 74 (100.0%) | 0 (0.0%) |
Income Below Poverty Among Single-Parent Households in Westport
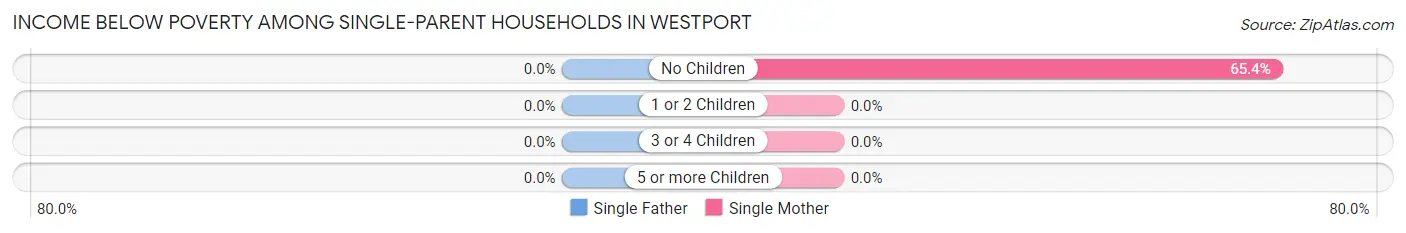
| Children | Single Father | Single Mother |
| No Children | 0 (0.0%) | 17 (65.4%) |
| 1 or 2 Children | 0 (0.0%) | 0 (0.0%) |
| 3 or 4 Children | 0 (0.0%) | 0 (0.0%) |
| 5 or more Children | 0 (0.0%) | 0 (0.0%) |
| Total | 0 (0.0%) | 17 (48.6%) |
Income Below Poverty Among Married-Couple vs Single-Parent Households in Westport
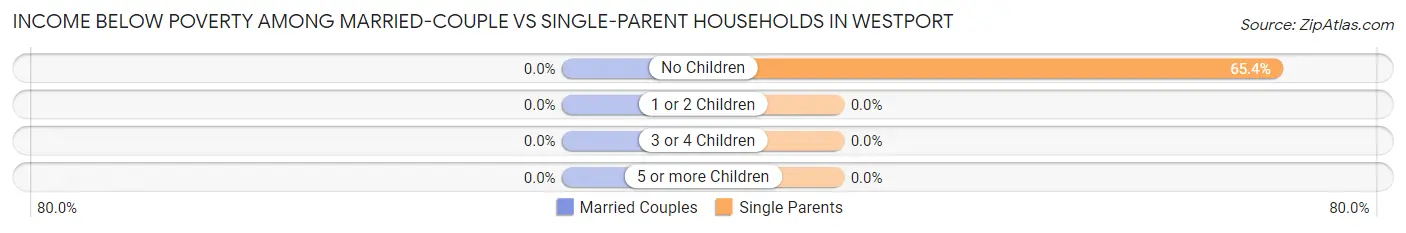
| Children | Married-Couple Families | Single-Parent Households |
| No Children | 0 (0.0%) | 17 (65.4%) |
| 1 or 2 Children | 0 (0.0%) | 0 (0.0%) |
| 3 or 4 Children | 0 (0.0%) | 0 (0.0%) |
| 5 or more Children | 0 (0.0%) | 0 (0.0%) |
| Total | 0 (0.0%) | 17 (48.6%) |
Race in Westport
The most populous races in Westport are White / Caucasian (325 | 88.6%), Two or more Races (42 | 11.4%), and Hispanic or Latino (10 | 2.7%).
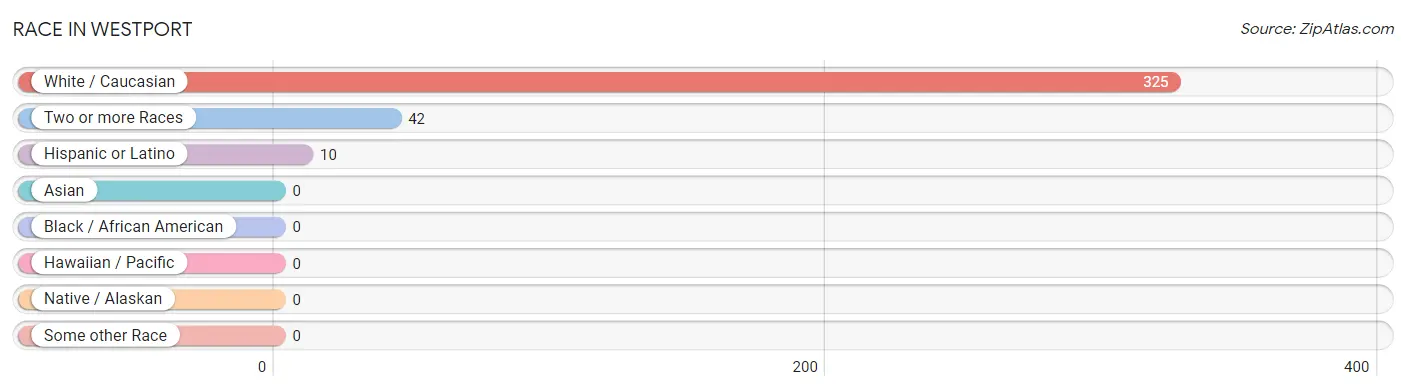
| Race | # Population | % Population |
| Asian | 0 | 0.0% |
| Black / African American | 0 | 0.0% |
| Hawaiian / Pacific | 0 | 0.0% |
| Hispanic or Latino | 10 | 2.7% |
| Native / Alaskan | 0 | 0.0% |
| White / Caucasian | 325 | 88.6% |
| Two or more Races | 42 | 11.4% |
| Some other Race | 0 | 0.0% |
| Total | 367 | 100.0% |
Ancestry in Westport
The most populous ancestries reported in Westport are American (141 | 38.4%), Cherokee (32 | 8.7%), British (29 | 7.9%), Irish (27 | 7.4%), and Dutch (20 | 5.4%), together accounting for 67.8% of all Westport residents.
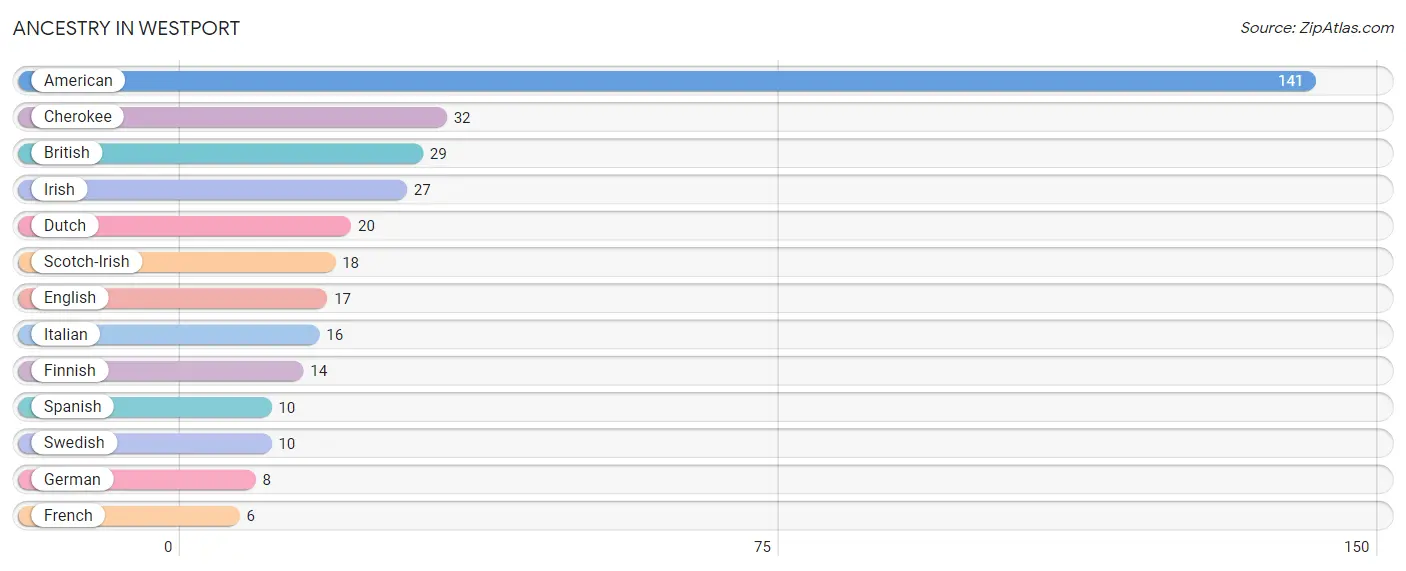
| Ancestry | # Population | % Population |
| American | 141 | 38.4% |
| British | 29 | 7.9% |
| Cherokee | 32 | 8.7% |
| Dutch | 20 | 5.4% |
| English | 17 | 4.6% |
| Finnish | 14 | 3.8% |
| French | 6 | 1.6% |
| German | 8 | 2.2% |
| Irish | 27 | 7.4% |
| Italian | 16 | 4.4% |
| Scotch-Irish | 18 | 4.9% |
| Spanish | 10 | 2.7% |
| Swedish | 10 | 2.7% | View All 13 Rows |
Immigrants in Westport

| Immigration Origin | # Population | % Population | View All 0 Rows |
Sex and Age in Westport
Sex and Age in Westport
The most populous age groups in Westport are 20 to 24 Years (68 | 32.5%) for men and 75 to 79 Years (40 | 25.3%) for women.
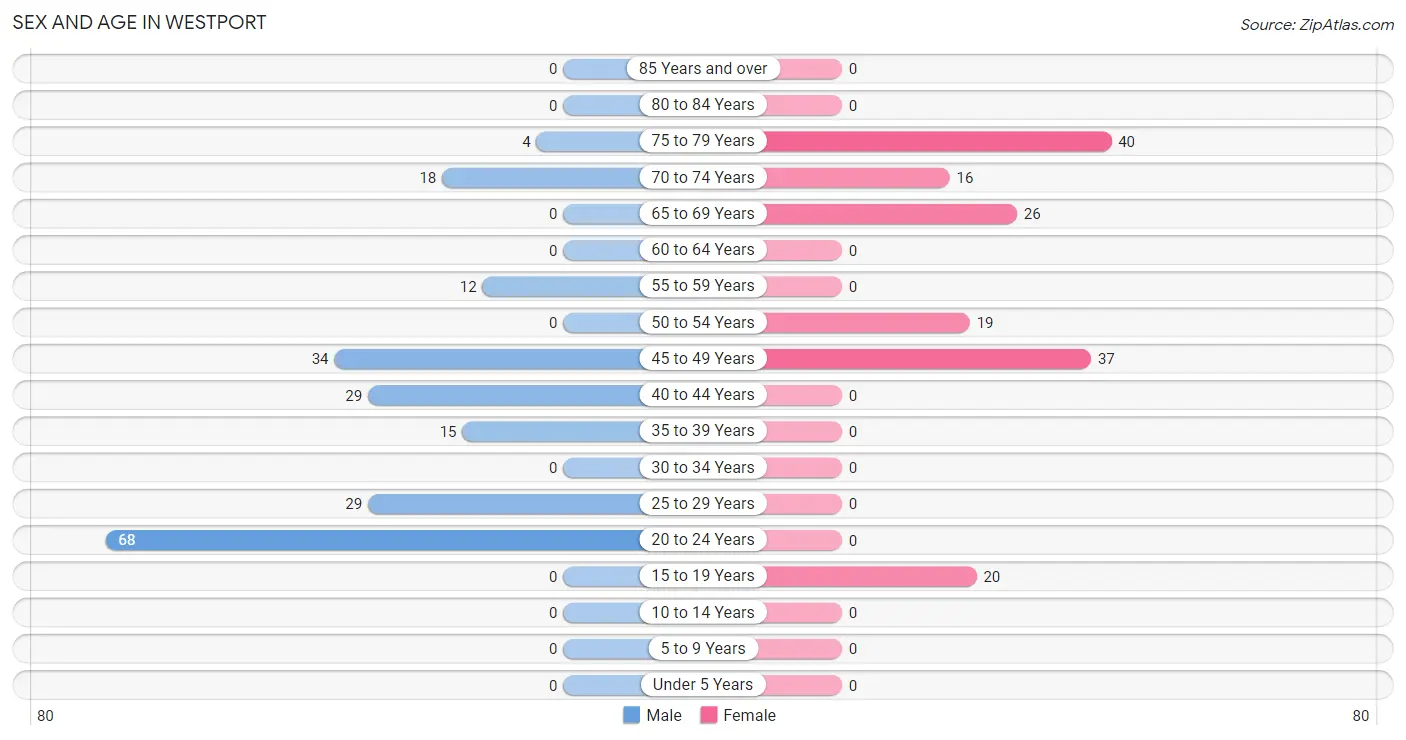
| Age Bracket | Male | Female |
| Under 5 Years | 0 (0.0%) | 0 (0.0%) |
| 5 to 9 Years | 0 (0.0%) | 0 (0.0%) |
| 10 to 14 Years | 0 (0.0%) | 0 (0.0%) |
| 15 to 19 Years | 0 (0.0%) | 20 (12.7%) |
| 20 to 24 Years | 68 (32.5%) | 0 (0.0%) |
| 25 to 29 Years | 29 (13.9%) | 0 (0.0%) |
| 30 to 34 Years | 0 (0.0%) | 0 (0.0%) |
| 35 to 39 Years | 15 (7.2%) | 0 (0.0%) |
| 40 to 44 Years | 29 (13.9%) | 0 (0.0%) |
| 45 to 49 Years | 34 (16.3%) | 37 (23.4%) |
| 50 to 54 Years | 0 (0.0%) | 19 (12.0%) |
| 55 to 59 Years | 12 (5.7%) | 0 (0.0%) |
| 60 to 64 Years | 0 (0.0%) | 0 (0.0%) |
| 65 to 69 Years | 0 (0.0%) | 26 (16.5%) |
| 70 to 74 Years | 18 (8.6%) | 16 (10.1%) |
| 75 to 79 Years | 4 (1.9%) | 40 (25.3%) |
| 80 to 84 Years | 0 (0.0%) | 0 (0.0%) |
| 85 Years and over | 0 (0.0%) | 0 (0.0%) |
| Total | 209 (100.0%) | 158 (100.0%) |
Families and Households in Westport
Median Family Size in Westport
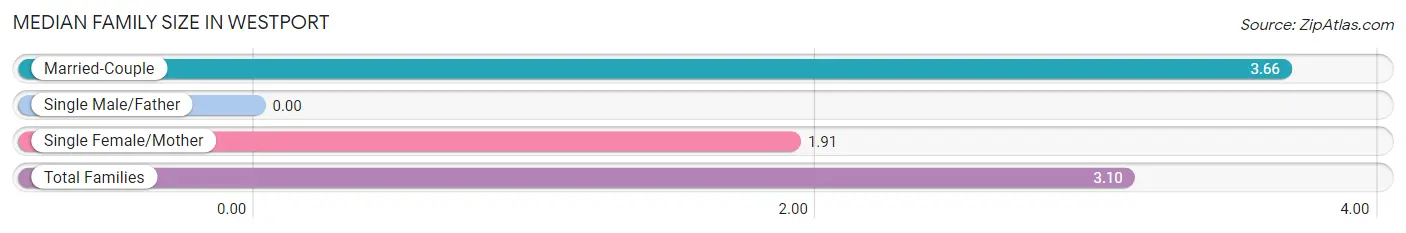
| Family Type | # Families | Family Size |
| Married-Couple | 74 (67.9%) | 3.66 |
| Single Male/Father | 0 (0.0%) | - |
| Single Female/Mother | 35 (32.1%) | 1.91 |
| Total Families | 109 (100.0%) | 3.10 |
Median Household Size in Westport
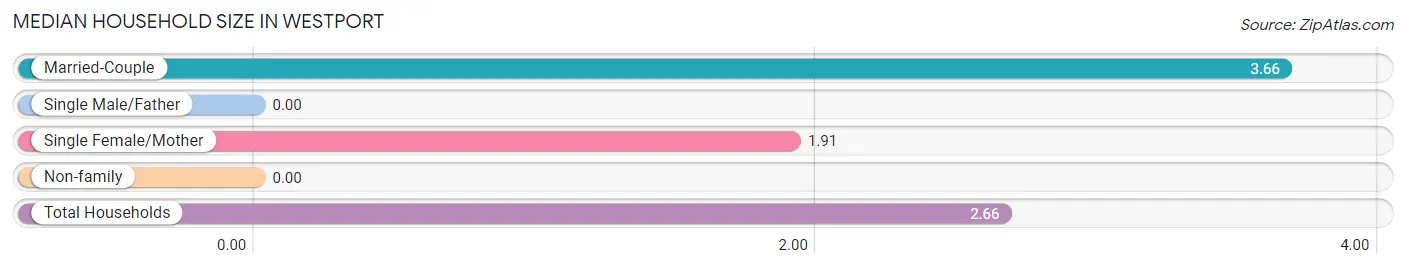
| Household Type | # Households | Household Size |
| Married-Couple | 74 (53.6%) | 3.66 |
| Single Male/Father | 0 (0.0%) | - |
| Single Female/Mother | 35 (25.4%) | 1.91 |
| Non-family | 29 (21.0%) | - |
| Total Households | 138 (100.0%) | 2.66 |
Household Size by Marriage Status in Westport
Out of a total of 138 households in Westport, 109 (79.0%) are family households, while 29 (21.0%) are nonfamily households. The most numerous type of family households are 2-person households, comprising 63, and the most common type of nonfamily households are 1-person households, comprising 29.
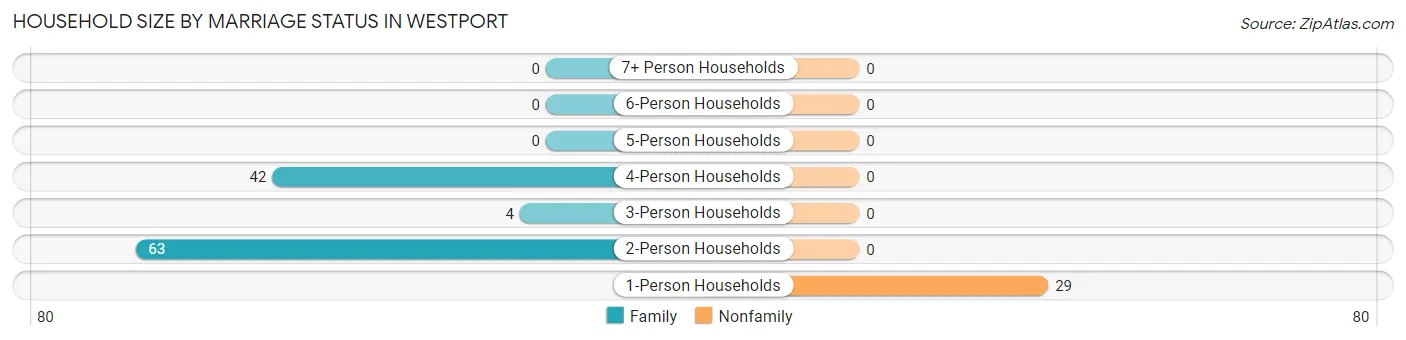
| Household Size | Family Households | Nonfamily Households |
| 1-Person Households | - | 29 (21.0%) |
| 2-Person Households | 63 (45.7%) | 0 (0.0%) |
| 3-Person Households | 4 (2.9%) | 0 (0.0%) |
| 4-Person Households | 42 (30.4%) | 0 (0.0%) |
| 5-Person Households | 0 (0.0%) | 0 (0.0%) |
| 6-Person Households | 0 (0.0%) | 0 (0.0%) |
| 7+ Person Households | 0 (0.0%) | 0 (0.0%) |
| Total | 109 (79.0%) | 29 (21.0%) |
Female Fertility in Westport
Fertility by Age in Westport
| Age Bracket | Women with Births | Births / 1,000 Women |
| 15 to 19 years | 0 (0.0%) | 0.0 |
| 20 to 34 years | 0 (0.0%) | 0.0 |
| 35 to 50 years | 0 (0.0%) | 0.0 |
| Total | 0 (0.0%) | 0.0 |
Fertility by Age by Marriage Status in Westport
| Age Bracket | Married | Unmarried |
| 15 to 19 years | 0 (0.0%) | 0 (0.0%) |
| 20 to 34 years | 0 (0.0%) | 0 (0.0%) |
| 35 to 50 years | 0 (0.0%) | 0 (0.0%) |
| Total | 0 (0.0%) | 0 (0.0%) |
Fertility by Education in Westport
| Educational Attainment | Women with Births | Births / 1,000 Women |
| Less than High School | 0 (0.0%) | 0.0 |
| High School Diploma | 0 (0.0%) | 0.0 |
| College or Associate's Degree | 0 (0.0%) | 0.0 |
| Bachelor's Degree | 0 (0.0%) | 0.0 |
| Graduate Degree | 0 (0.0%) | 0.0 |
| Total | 0 (0.0%) | 0.0 |
Fertility by Education by Marriage Status in Westport
| Educational Attainment | Married | Unmarried |
| Less than High School | 0 (0.0%) | 0 (0.0%) |
| High School Diploma | 0 (0.0%) | 0 (0.0%) |
| College or Associate's Degree | 0 (0.0%) | 0 (0.0%) |
| Bachelor's Degree | 0 (0.0%) | 0 (0.0%) |
| Graduate Degree | 0 (0.0%) | 0 (0.0%) |
| Total | 0 (0.0%) | 0 (0.0%) |
Employment Characteristics in Westport
Employment by Class of Employer in Westport
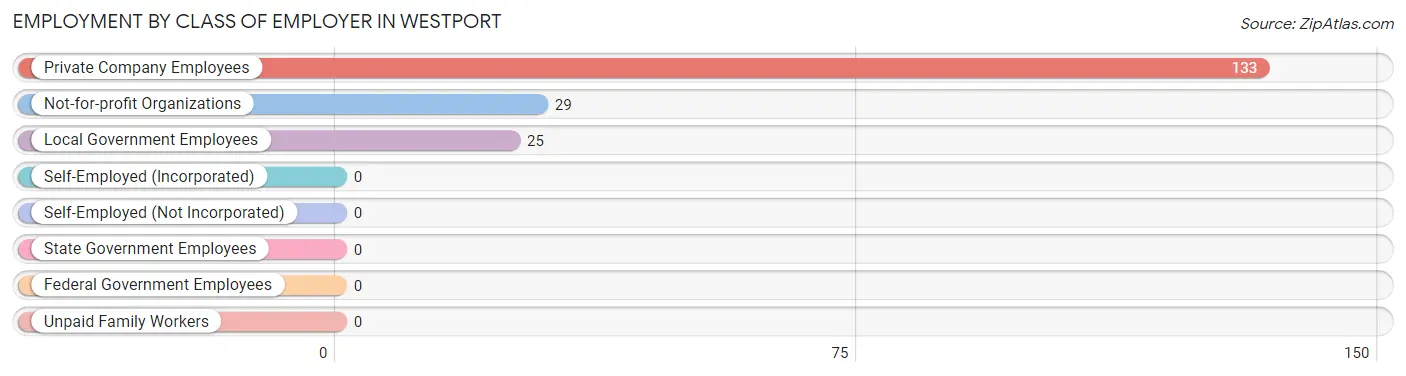
Among the 187 employed individuals in Westport, private company employees (133 | 71.1%), not-for-profit organizations (29 | 15.5%), and local government employees (25 | 13.4%) make up the most common classes of employment.
| Employer Class | # Employees | % Employees |
| Private Company Employees | 133 | 71.1% |
| Self-Employed (Incorporated) | 0 | 0.0% |
| Self-Employed (Not Incorporated) | 0 | 0.0% |
| Not-for-profit Organizations | 29 | 15.5% |
| Local Government Employees | 25 | 13.4% |
| State Government Employees | 0 | 0.0% |
| Federal Government Employees | 0 | 0.0% |
| Unpaid Family Workers | 0 | 0.0% |
| Total | 187 | 100.0% |
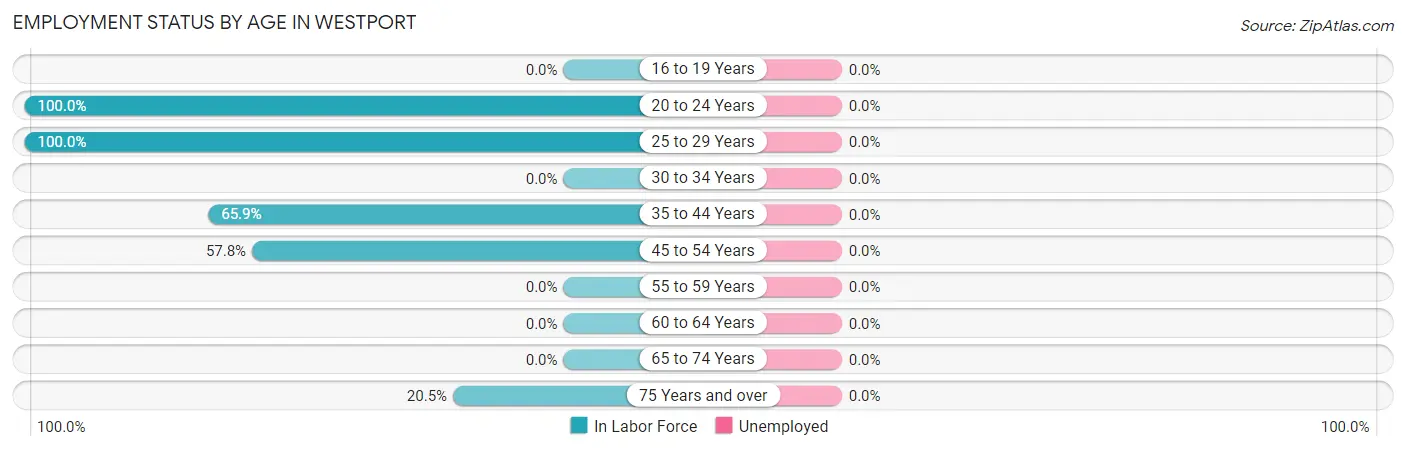
Employment Status by Age in Westport
| Age Bracket | In Labor Force | Unemployed |
| 16 to 19 Years | 0 (0.0%) | 0 (0.0%) |
| 20 to 24 Years | 68 (100.0%) | 0 (0.0%) |
| 25 to 29 Years | 29 (100.0%) | 0 (0.0%) |
| 30 to 34 Years | 0 (0.0%) | 0 (0.0%) |
| 35 to 44 Years | 29 (65.9%) | 0 (0.0%) |
| 45 to 54 Years | 52 (57.8%) | 0 (0.0%) |
| 55 to 59 Years | 0 (0.0%) | 0 (0.0%) |
| 60 to 64 Years | 0 (0.0%) | 0 (0.0%) |
| 65 to 74 Years | 0 (0.0%) | 0 (0.0%) |
| 75 Years and over | 9 (20.5%) | 0 (0.0%) |
| Total | 187 (51.0%) | 0 (0.0%) |
Employment Status by Educational Attainment in Westport

| Educational Attainment | In Labor Force | Unemployed |
| Less than High School | 0 (0.0%) | 0 (0.0%) |
| High School Diploma | 40 (51.3%) | 0 (0.0%) |
| College / Associate Degree | 70 (100.0%) | 0 (0.0%) |
| Bachelor's Degree or higher | 0 (0.0%) | 0 (0.0%) |
| Total | 110 (62.9%) | 0 (0.0%) |
Employment Occupations by Sex in Westport
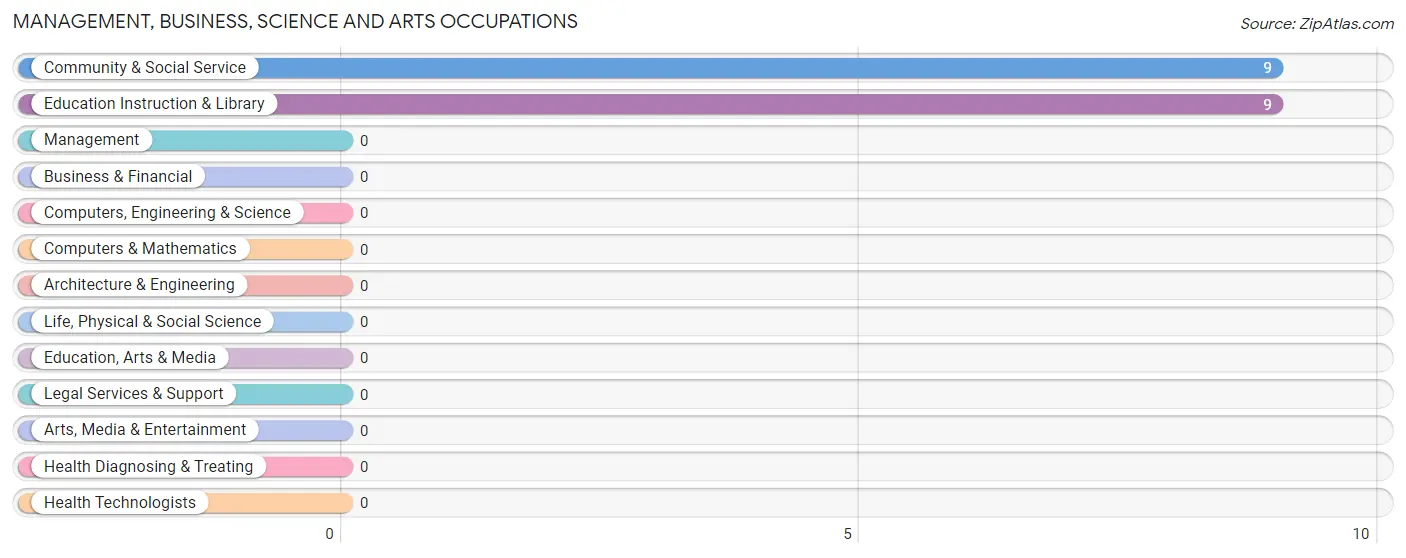
Management, Business, Science and Arts Occupations
The most common Management, Business, Science and Arts occupations in Westport are Community & Social Service (9 | 4.8%), and Education Instruction & Library (9 | 4.8%).
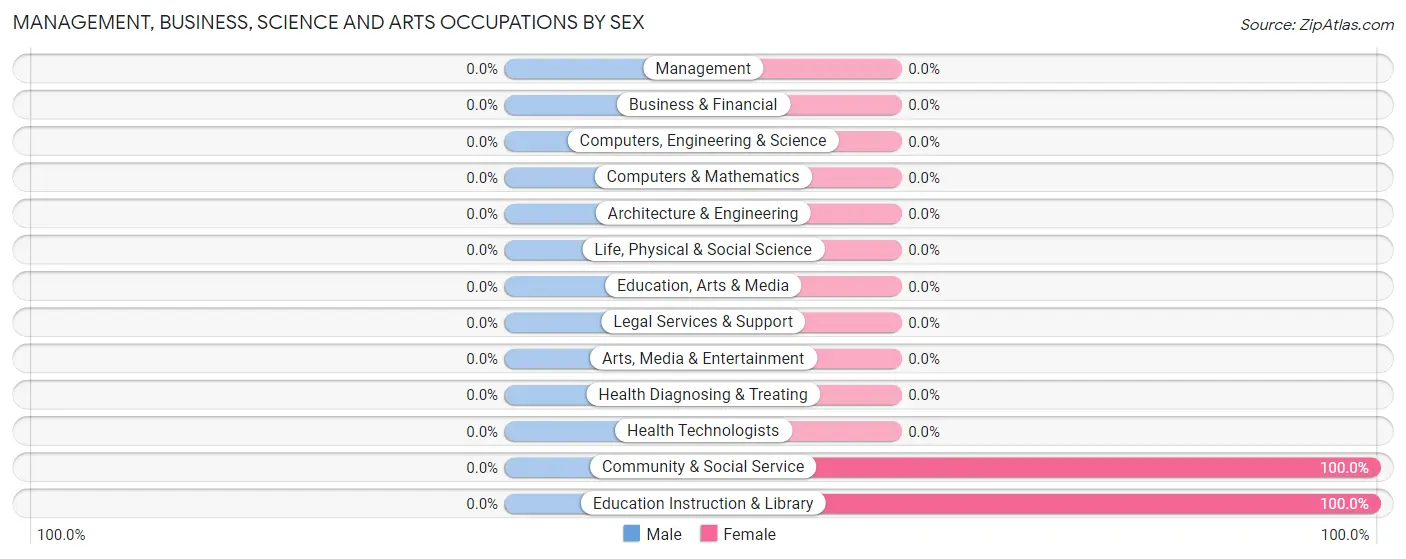
Management, Business, Science and Arts Occupations by Sex
| Occupation | Male | Female |
| Management | 0 (0.0%) | 0 (0.0%) |
| Business & Financial | 0 (0.0%) | 0 (0.0%) |
| Computers, Engineering & Science | 0 (0.0%) | 0 (0.0%) |
| Computers & Mathematics | 0 (0.0%) | 0 (0.0%) |
| Architecture & Engineering | 0 (0.0%) | 0 (0.0%) |
| Life, Physical & Social Science | 0 (0.0%) | 0 (0.0%) |
| Community & Social Service | 0 (0.0%) | 9 (100.0%) |
| Education, Arts & Media | 0 (0.0%) | 0 (0.0%) |
| Legal Services & Support | 0 (0.0%) | 0 (0.0%) |
| Education Instruction & Library | 0 (0.0%) | 9 (100.0%) |
| Arts, Media & Entertainment | 0 (0.0%) | 0 (0.0%) |
| Health Diagnosing & Treating | 0 (0.0%) | 0 (0.0%) |
| Health Technologists | 0 (0.0%) | 0 (0.0%) |
| Total (Category) | 0 (0.0%) | 9 (100.0%) |
| Total (Overall) | 150 (80.2%) | 37 (19.8%) |
Services Occupations
The most common Services occupations in Westport are Healthcare Support (62 | 33.2%), and Food Preparation & Serving (19 | 10.2%).
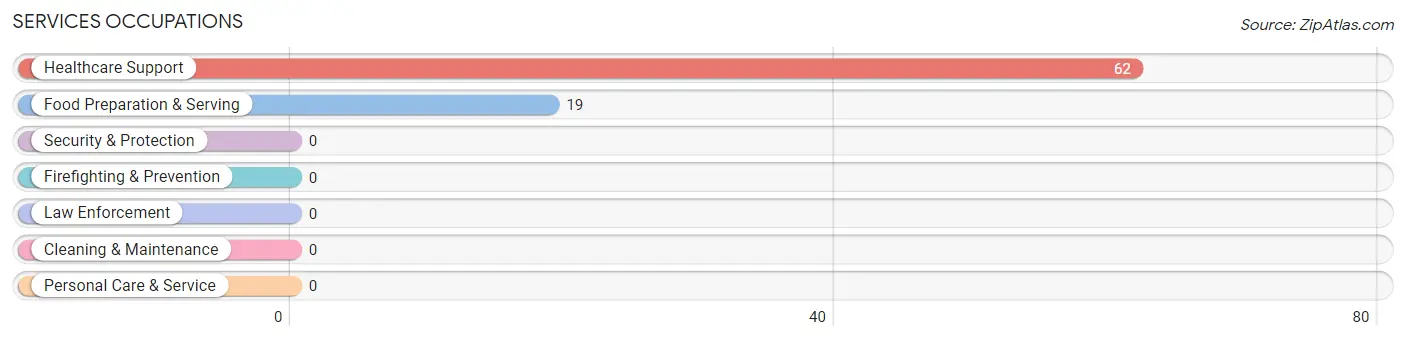
Services Occupations by Sex
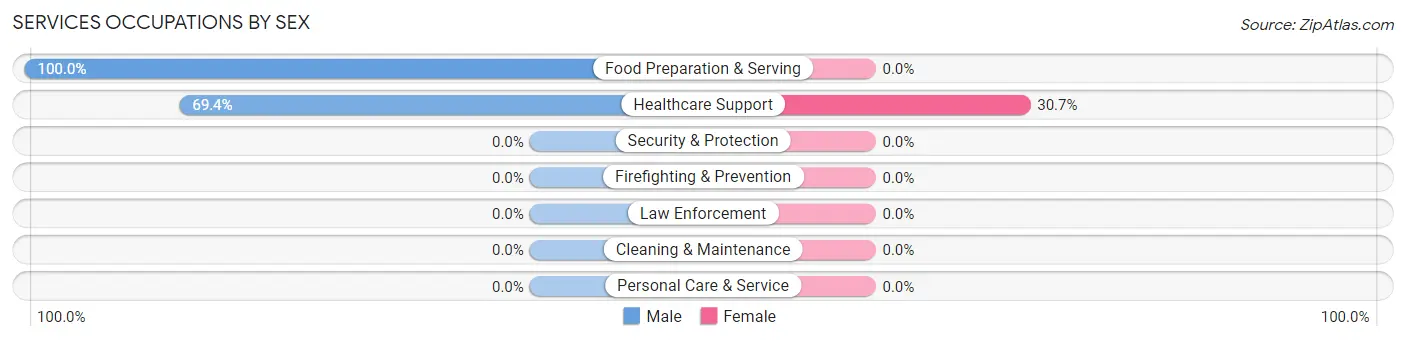
| Occupation | Male | Female |
| Healthcare Support | 43 (69.4%) | 19 (30.6%) |
| Security & Protection | 0 (0.0%) | 0 (0.0%) |
| Firefighting & Prevention | 0 (0.0%) | 0 (0.0%) |
| Law Enforcement | 0 (0.0%) | 0 (0.0%) |
| Food Preparation & Serving | 19 (100.0%) | 0 (0.0%) |
| Cleaning & Maintenance | 0 (0.0%) | 0 (0.0%) |
| Personal Care & Service | 0 (0.0%) | 0 (0.0%) |
| Total (Category) | 62 (76.5%) | 19 (23.5%) |
| Total (Overall) | 150 (80.2%) | 37 (19.8%) |
Sales and Office Occupations
The most common Sales and Office occupations in Westport are , and Office & Administration (9 | 4.8%).
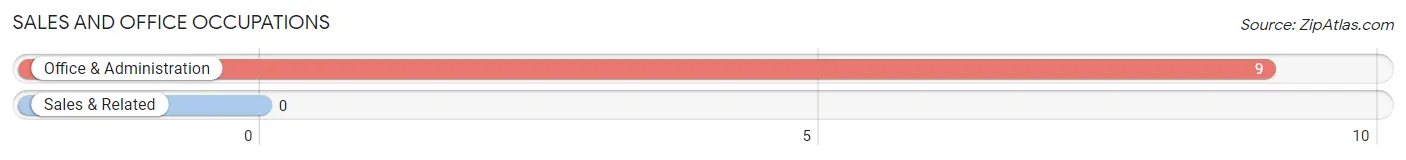
Sales and Office Occupations by Sex

| Occupation | Male | Female |
| Sales & Related | 0 (0.0%) | 0 (0.0%) |
| Office & Administration | 0 (0.0%) | 9 (100.0%) |
| Total (Category) | 0 (0.0%) | 9 (100.0%) |
| Total (Overall) | 150 (80.2%) | 37 (19.8%) |
Natural Resources, Construction and Maintenance Occupations
The most common Natural Resources, Construction and Maintenance occupations in Westport are , and Construction & Extraction (10 | 5.3%).
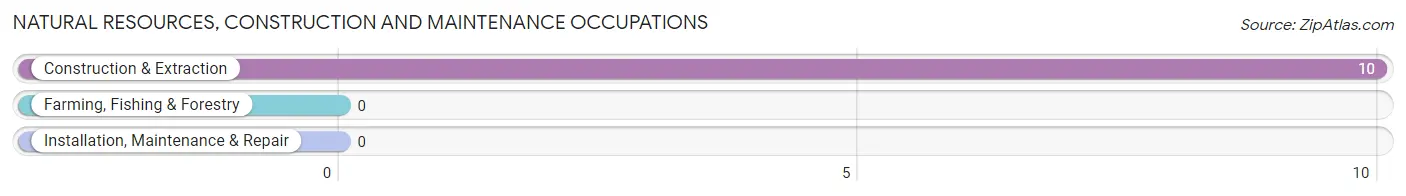
Natural Resources, Construction and Maintenance Occupations by Sex

| Occupation | Male | Female |
| Farming, Fishing & Forestry | 0 (0.0%) | 0 (0.0%) |
| Construction & Extraction | 10 (100.0%) | 0 (0.0%) |
| Installation, Maintenance & Repair | 0 (0.0%) | 0 (0.0%) |
| Total (Category) | 10 (100.0%) | 0 (0.0%) |
| Total (Overall) | 150 (80.2%) | 37 (19.8%) |
Production, Transportation and Moving Occupations
The most common Production, Transportation and Moving occupations in Westport are , and Material Moving (78 | 41.7%).
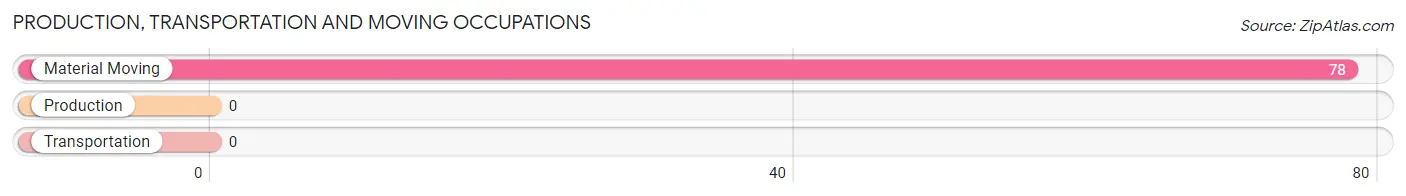
Production, Transportation and Moving Occupations by Sex
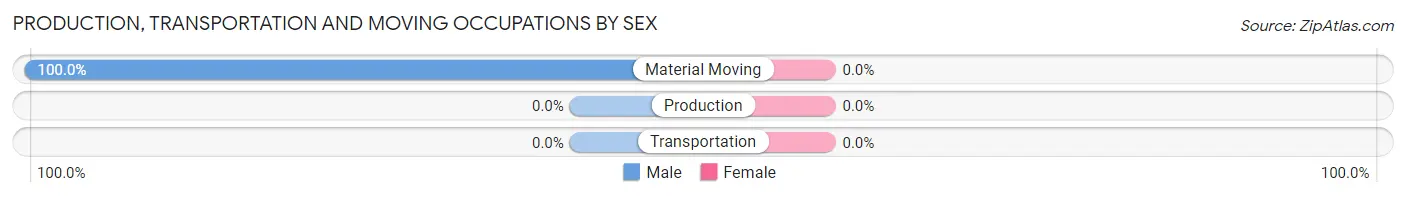
| Occupation | Male | Female |
| Production | 0 (0.0%) | 0 (0.0%) |
| Transportation | 0 (0.0%) | 0 (0.0%) |
| Material Moving | 78 (100.0%) | 0 (0.0%) |
| Total (Category) | 78 (100.0%) | 0 (0.0%) |
| Total (Overall) | 150 (80.2%) | 37 (19.8%) |
Employment Industries by Sex in Westport
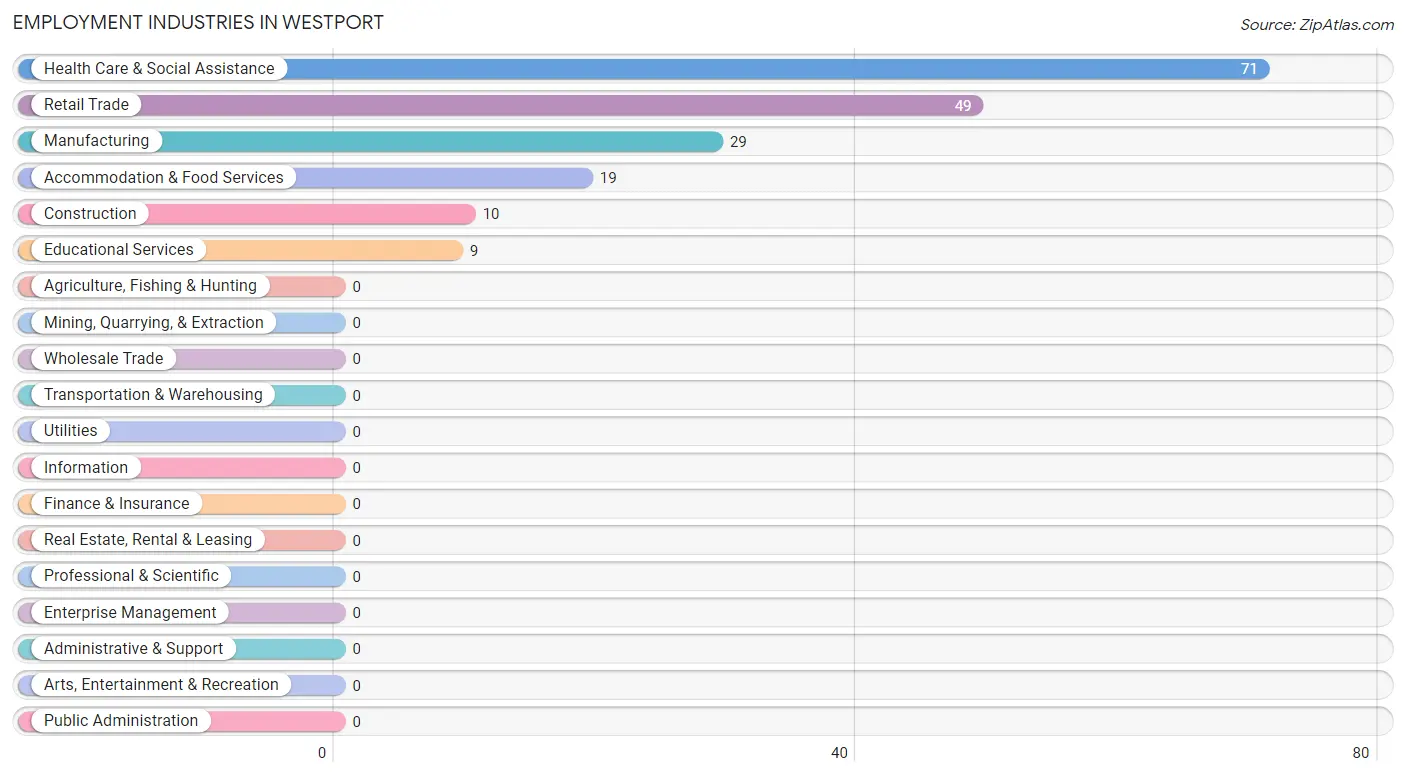
Employment Industries in Westport
The major employment industries in Westport include Health Care & Social Assistance (71 | 38.0%), Retail Trade (49 | 26.2%), Manufacturing (29 | 15.5%), Accommodation & Food Services (19 | 10.2%), and Construction (10 | 5.3%).
Employment Industries by Sex in Westport
The Westport industries that see more men than women are Construction (100.0%), Manufacturing (100.0%), and Retail Trade (100.0%), whereas the industries that tend to have a higher number of women are Educational Services (100.0%), and Health Care & Social Assistance (39.4%).
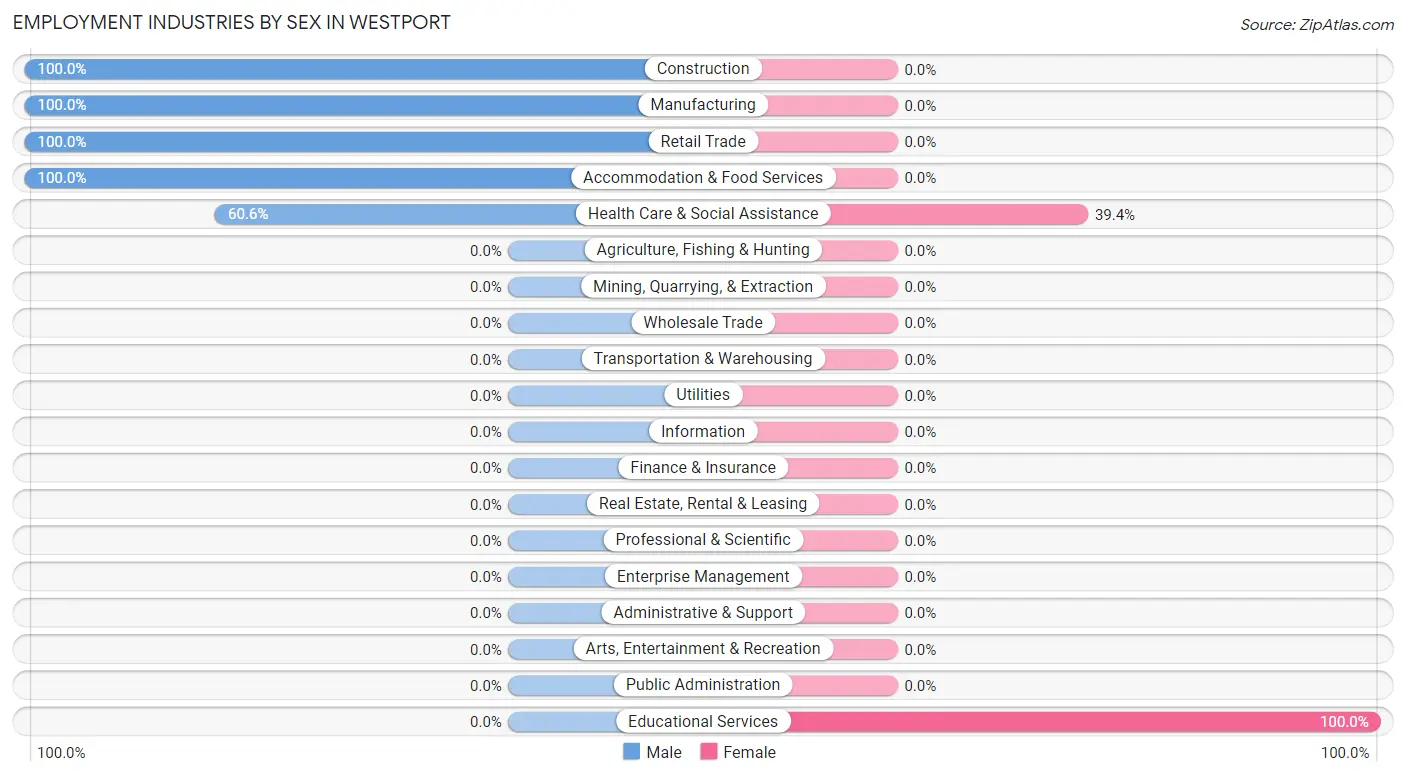
| Industry | Male | Female |
| Agriculture, Fishing & Hunting | 0 (0.0%) | 0 (0.0%) |
| Mining, Quarrying, & Extraction | 0 (0.0%) | 0 (0.0%) |
| Construction | 10 (100.0%) | 0 (0.0%) |
| Manufacturing | 29 (100.0%) | 0 (0.0%) |
| Wholesale Trade | 0 (0.0%) | 0 (0.0%) |
| Retail Trade | 49 (100.0%) | 0 (0.0%) |
| Transportation & Warehousing | 0 (0.0%) | 0 (0.0%) |
| Utilities | 0 (0.0%) | 0 (0.0%) |
| Information | 0 (0.0%) | 0 (0.0%) |
| Finance & Insurance | 0 (0.0%) | 0 (0.0%) |
| Real Estate, Rental & Leasing | 0 (0.0%) | 0 (0.0%) |
| Professional & Scientific | 0 (0.0%) | 0 (0.0%) |
| Enterprise Management | 0 (0.0%) | 0 (0.0%) |
| Administrative & Support | 0 (0.0%) | 0 (0.0%) |
| Educational Services | 0 (0.0%) | 9 (100.0%) |
| Health Care & Social Assistance | 43 (60.6%) | 28 (39.4%) |
| Arts, Entertainment & Recreation | 0 (0.0%) | 0 (0.0%) |
| Accommodation & Food Services | 19 (100.0%) | 0 (0.0%) |
| Public Administration | 0 (0.0%) | 0 (0.0%) |
| Total | 150 (80.2%) | 37 (19.8%) |
Education in Westport
School Enrollment in Westport
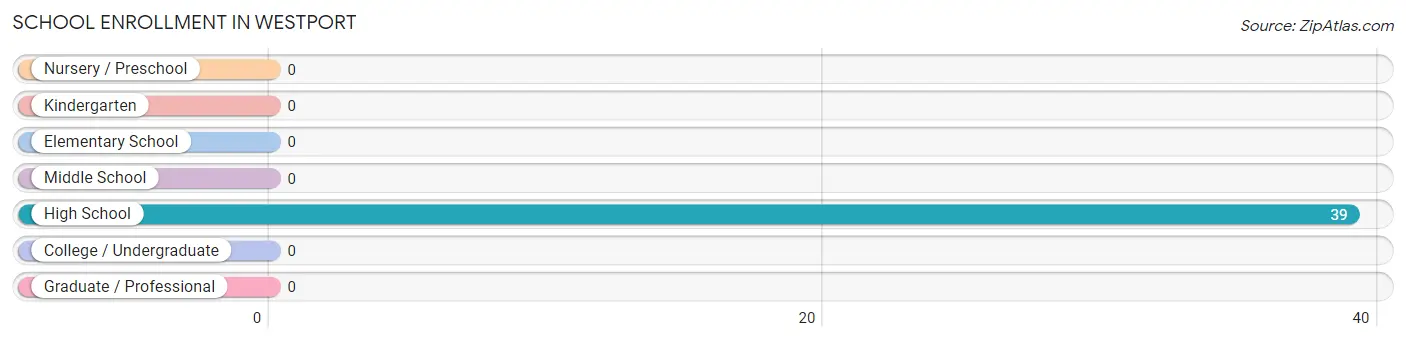
| School Level | # Students | % Students |
| Nursery / Preschool | 0 | 0.0% |
| Kindergarten | 0 | 0.0% |
| Elementary School | 0 | 0.0% |
| Middle School | 0 | 0.0% |
| High School | 39 | 100.0% |
| College / Undergraduate | 0 | 0.0% |
| Graduate / Professional | 0 | 0.0% |
| Total | 39 | 100.0% |
School Enrollment by Age by Funding Source in Westport
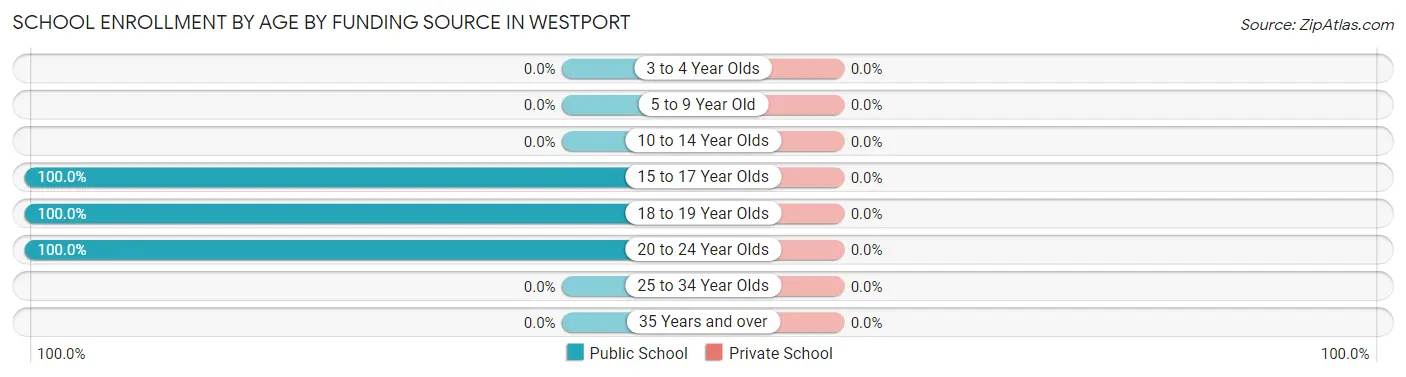
| Age Bracket | Public School | Private School |
| 3 to 4 Year Olds | 0 (0.0%) | 0 (0.0%) |
| 5 to 9 Year Old | 0 (0.0%) | 0 (0.0%) |
| 10 to 14 Year Olds | 0 (0.0%) | 0 (0.0%) |
| 15 to 17 Year Olds | 5 (100.0%) | 0 (0.0%) |
| 18 to 19 Year Olds | 15 (100.0%) | 0 (0.0%) |
| 20 to 24 Year Olds | 19 (100.0%) | 0 (0.0%) |
| 25 to 34 Year Olds | 0 (0.0%) | 0 (0.0%) |
| 35 Years and over | 0 (0.0%) | 0 (0.0%) |
| Total | 39 (100.0%) | 0 (0.0%) |
Educational Attainment by Field of Study in Westport
, and engineering (12 | 100.0%) are the most common fields of study among 12 individuals in Westport who have obtained a bachelor's degree or higher.
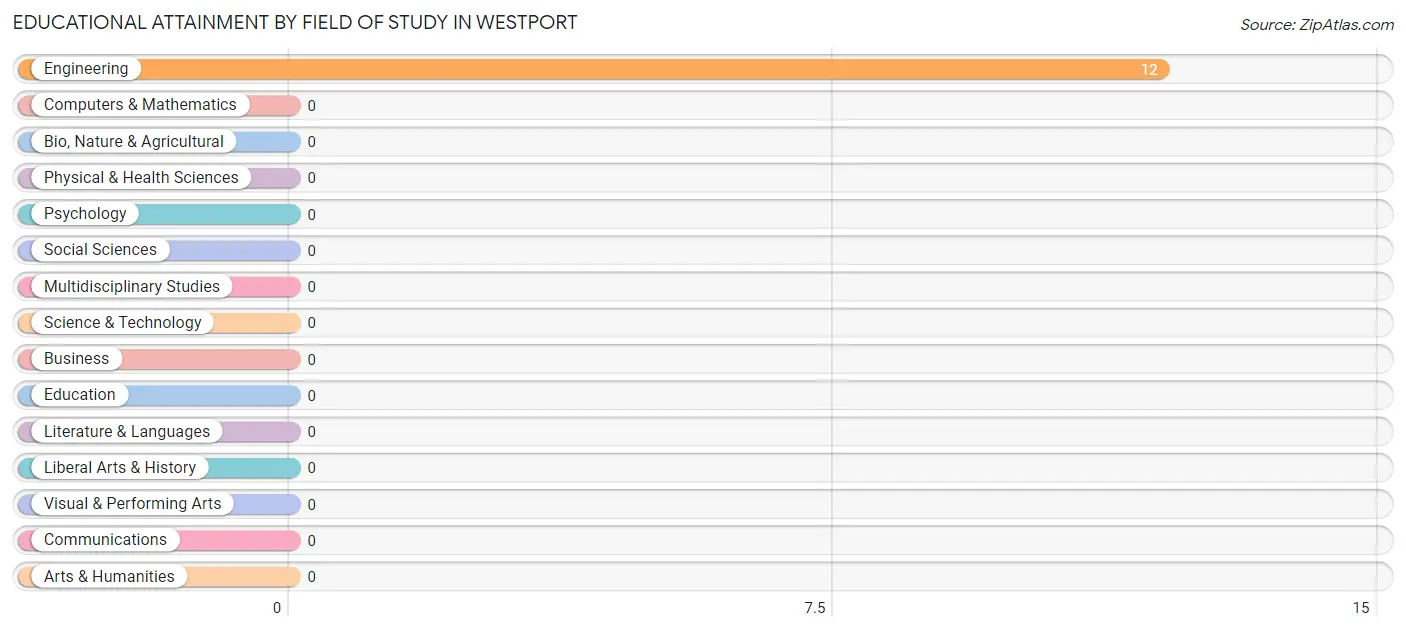
| Field of Study | # Graduates | % Graduates |
| Computers & Mathematics | 0 | 0.0% |
| Bio, Nature & Agricultural | 0 | 0.0% |
| Physical & Health Sciences | 0 | 0.0% |
| Psychology | 0 | 0.0% |
| Social Sciences | 0 | 0.0% |
| Engineering | 12 | 100.0% |
| Multidisciplinary Studies | 0 | 0.0% |
| Science & Technology | 0 | 0.0% |
| Business | 0 | 0.0% |
| Education | 0 | 0.0% |
| Literature & Languages | 0 | 0.0% |
| Liberal Arts & History | 0 | 0.0% |
| Visual & Performing Arts | 0 | 0.0% |
| Communications | 0 | 0.0% |
| Arts & Humanities | 0 | 0.0% |
| Total | 12 | 100.0% |
Transportation & Commute in Westport
Vehicle Availability by Sex in Westport
The most prevalent vehicle ownership categories in Westport are males with 4 vehicles (78, accounting for 52.0%) and females with 4 vehicles (0, making up 210.8%).
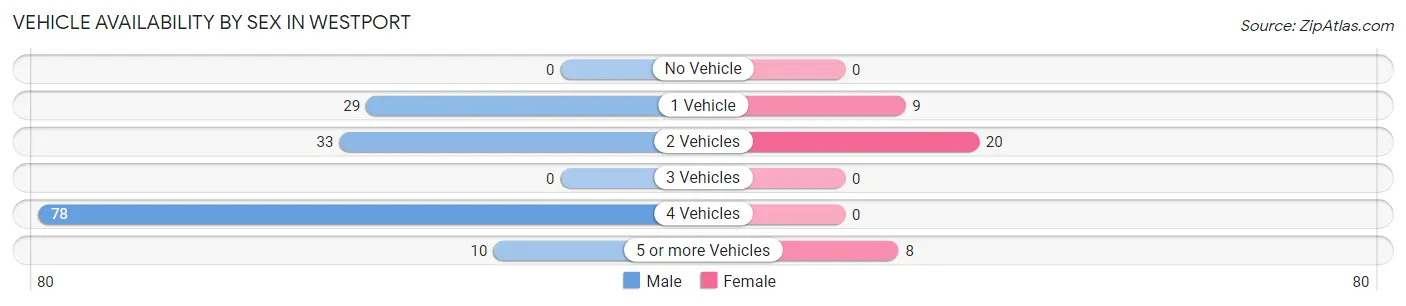
| Vehicles Available | Male | Female |
| No Vehicle | 0 (0.0%) | 0 (0.0%) |
| 1 Vehicle | 29 (19.3%) | 9 (24.3%) |
| 2 Vehicles | 33 (22.0%) | 20 (54.0%) |
| 3 Vehicles | 0 (0.0%) | 0 (0.0%) |
| 4 Vehicles | 78 (52.0%) | 0 (0.0%) |
| 5 or more Vehicles | 10 (6.7%) | 8 (21.6%) |
| Total | 150 (100.0%) | 37 (100.0%) |
Commute Time in Westport
The most frequently occuring commute durations in Westport are 40 to 44 minutes (49 commuters, 36.6%), 20 to 24 minutes (29 commuters, 21.6%), and 45 to 59 minutes (29 commuters, 21.6%).
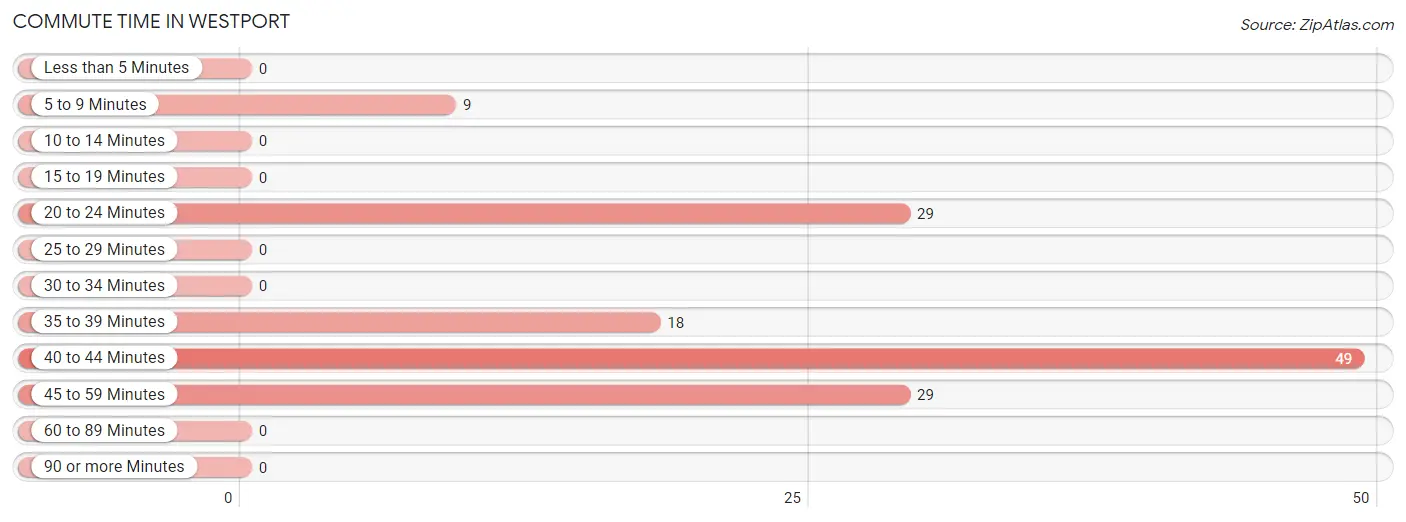
| Commute Time | # Commuters | % Commuters |
| Less than 5 Minutes | 0 | 0.0% |
| 5 to 9 Minutes | 9 | 6.7% |
| 10 to 14 Minutes | 0 | 0.0% |
| 15 to 19 Minutes | 0 | 0.0% |
| 20 to 24 Minutes | 29 | 21.6% |
| 25 to 29 Minutes | 0 | 0.0% |
| 30 to 34 Minutes | 0 | 0.0% |
| 35 to 39 Minutes | 18 | 13.4% |
| 40 to 44 Minutes | 49 | 36.6% |
| 45 to 59 Minutes | 29 | 21.6% |
| 60 to 89 Minutes | 0 | 0.0% |
| 90 or more Minutes | 0 | 0.0% |
Commute Time by Sex in Westport
The most common commute times in Westport are 40 to 44 minutes (49 commuters, 41.9%) for males and 5 to 9 minutes (9 commuters, 52.9%) for females.
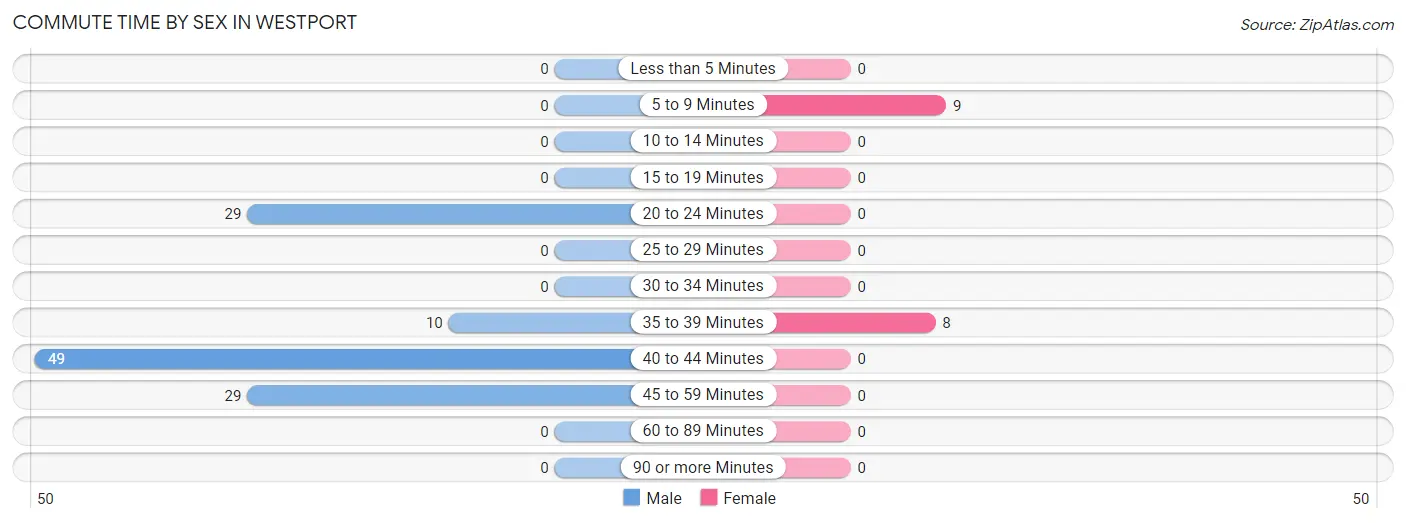
| Commute Time | Male | Female |
| Less than 5 Minutes | 0 (0.0%) | 0 (0.0%) |
| 5 to 9 Minutes | 0 (0.0%) | 9 (52.9%) |
| 10 to 14 Minutes | 0 (0.0%) | 0 (0.0%) |
| 15 to 19 Minutes | 0 (0.0%) | 0 (0.0%) |
| 20 to 24 Minutes | 29 (24.8%) | 0 (0.0%) |
| 25 to 29 Minutes | 0 (0.0%) | 0 (0.0%) |
| 30 to 34 Minutes | 0 (0.0%) | 0 (0.0%) |
| 35 to 39 Minutes | 10 (8.6%) | 8 (47.1%) |
| 40 to 44 Minutes | 49 (41.9%) | 0 (0.0%) |
| 45 to 59 Minutes | 29 (24.8%) | 0 (0.0%) |
| 60 to 89 Minutes | 0 (0.0%) | 0 (0.0%) |
| 90 or more Minutes | 0 (0.0%) | 0 (0.0%) |
Time of Departure to Work by Sex in Westport
The most frequent times of departure to work in Westport are 4:00 PM to 11:59 PM (58, 49.6%) for males and 8:30 AM to 8:59 AM (9, 52.9%) for females.
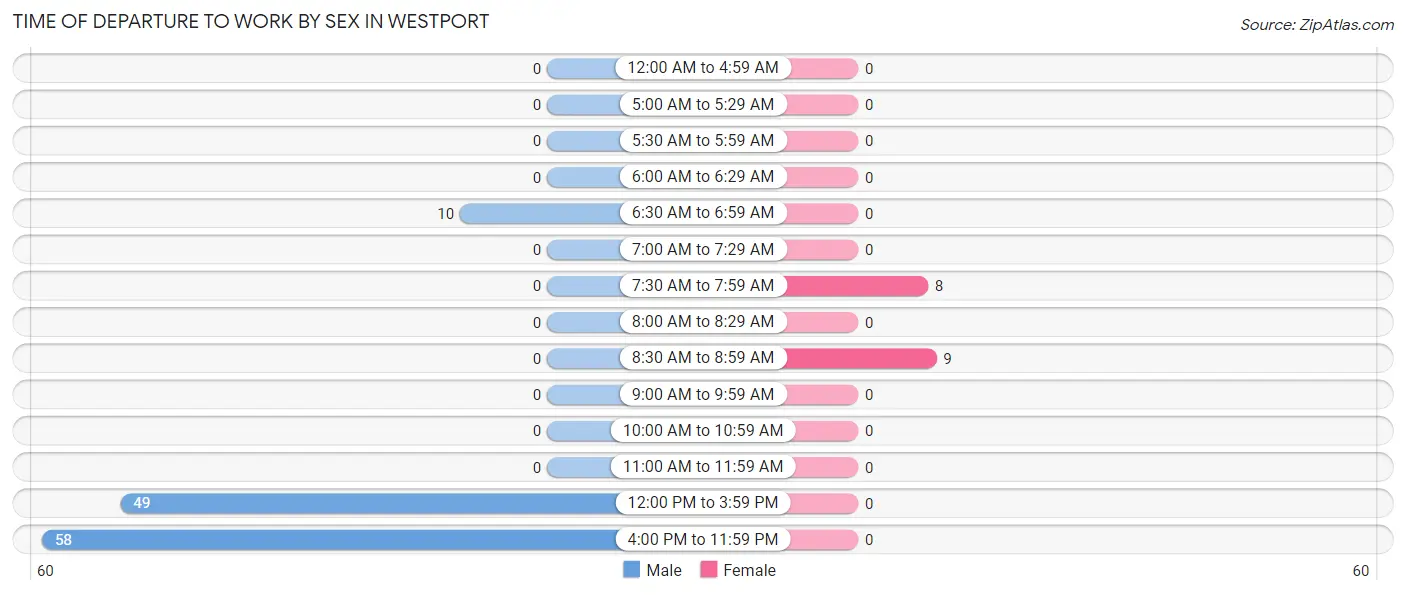
| Time of Departure | Male | Female |
| 12:00 AM to 4:59 AM | 0 (0.0%) | 0 (0.0%) |
| 5:00 AM to 5:29 AM | 0 (0.0%) | 0 (0.0%) |
| 5:30 AM to 5:59 AM | 0 (0.0%) | 0 (0.0%) |
| 6:00 AM to 6:29 AM | 0 (0.0%) | 0 (0.0%) |
| 6:30 AM to 6:59 AM | 10 (8.6%) | 0 (0.0%) |
| 7:00 AM to 7:29 AM | 0 (0.0%) | 0 (0.0%) |
| 7:30 AM to 7:59 AM | 0 (0.0%) | 8 (47.1%) |
| 8:00 AM to 8:29 AM | 0 (0.0%) | 0 (0.0%) |
| 8:30 AM to 8:59 AM | 0 (0.0%) | 9 (52.9%) |
| 9:00 AM to 9:59 AM | 0 (0.0%) | 0 (0.0%) |
| 10:00 AM to 10:59 AM | 0 (0.0%) | 0 (0.0%) |
| 11:00 AM to 11:59 AM | 0 (0.0%) | 0 (0.0%) |
| 12:00 PM to 3:59 PM | 49 (41.9%) | 0 (0.0%) |
| 4:00 PM to 11:59 PM | 58 (49.6%) | 0 (0.0%) |
| Total | 117 (100.0%) | 17 (100.0%) |
Housing Occupancy in Westport
Occupancy by Ownership in Westport
Of the total 138 dwellings in Westport, owner-occupied units account for 110 (79.7%), while renter-occupied units make up 28 (20.3%).
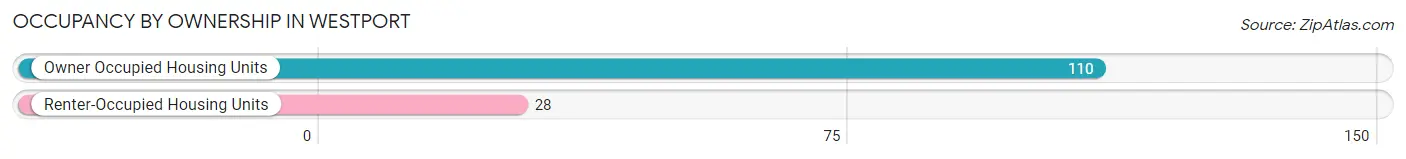
| Occupancy | # Housing Units | % Housing Units |
| Owner Occupied Housing Units | 110 | 79.7% |
| Renter-Occupied Housing Units | 28 | 20.3% |
| Total Occupied Housing Units | 138 | 100.0% |
Occupancy by Household Size in Westport
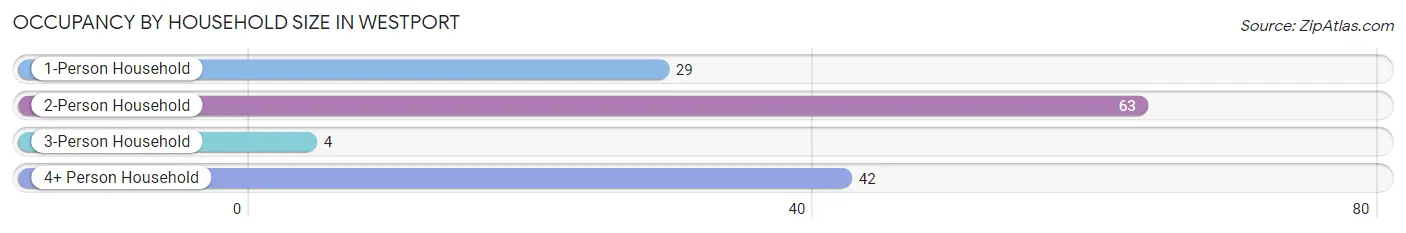
| Household Size | # Housing Units | % Housing Units |
| 1-Person Household | 29 | 21.0% |
| 2-Person Household | 63 | 45.7% |
| 3-Person Household | 4 | 2.9% |
| 4+ Person Household | 42 | 30.4% |
| Total Housing Units | 138 | 100.0% |
Occupancy by Ownership by Household Size in Westport
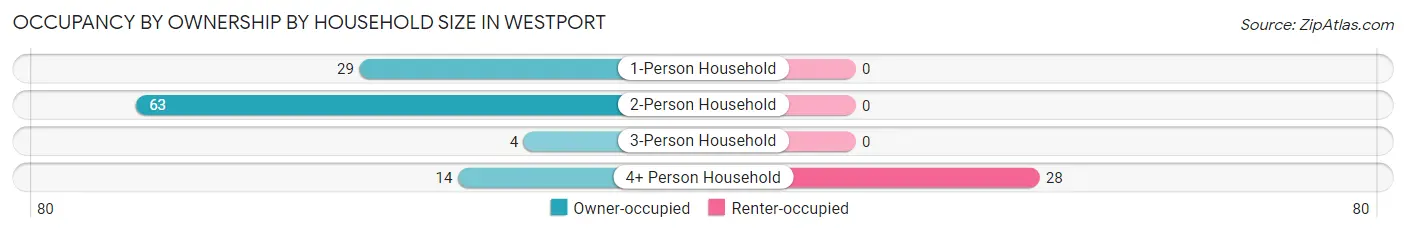
| Household Size | Owner-occupied | Renter-occupied |
| 1-Person Household | 29 (100.0%) | 0 (0.0%) |
| 2-Person Household | 63 (100.0%) | 0 (0.0%) |
| 3-Person Household | 4 (100.0%) | 0 (0.0%) |
| 4+ Person Household | 14 (33.3%) | 28 (66.7%) |
| Total Housing Units | 110 (79.7%) | 28 (20.3%) |
Occupancy by Educational Attainment in Westport
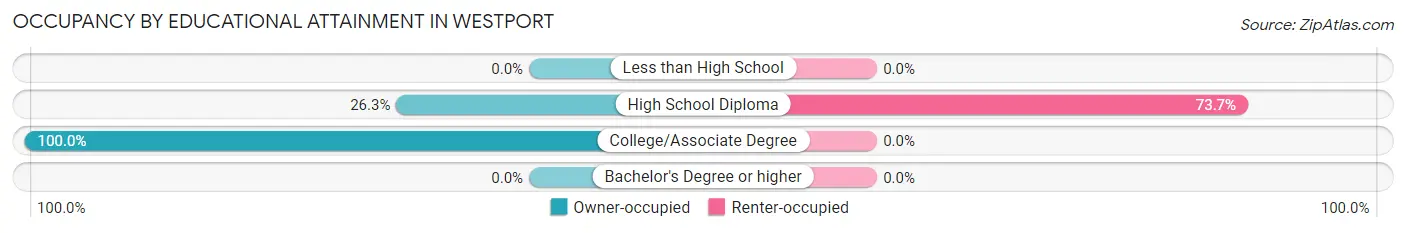
| Household Size | Owner-occupied | Renter-occupied |
| Less than High School | 0 (0.0%) | 0 (0.0%) |
| High School Diploma | 10 (26.3%) | 28 (73.7%) |
| College/Associate Degree | 100 (100.0%) | 0 (0.0%) |
| Bachelor's Degree or higher | 0 (0.0%) | 0 (0.0%) |
Occupancy by Age of Householder in Westport
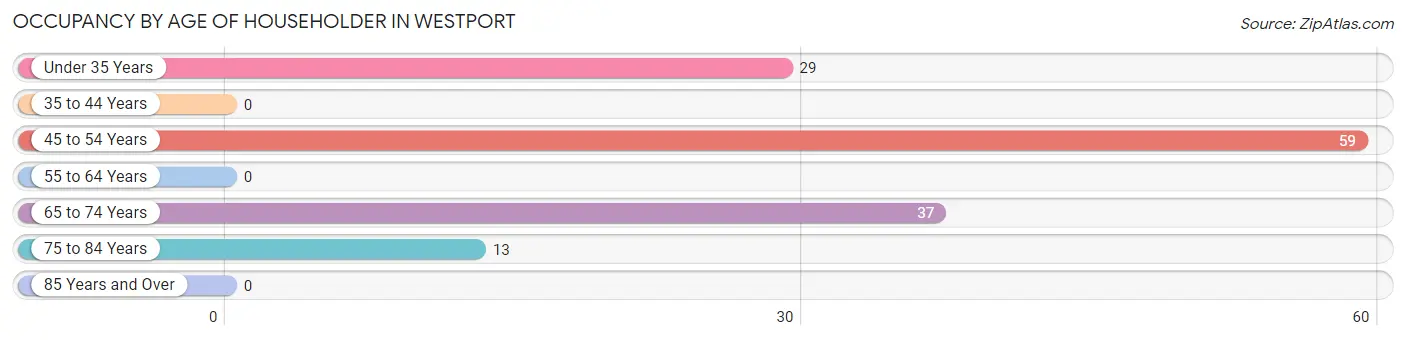
| Age Bracket | # Households | % Households |
| Under 35 Years | 29 | 21.0% |
| 35 to 44 Years | 0 | 0.0% |
| 45 to 54 Years | 59 | 42.7% |
| 55 to 64 Years | 0 | 0.0% |
| 65 to 74 Years | 37 | 26.8% |
| 75 to 84 Years | 13 | 9.4% |
| 85 Years and Over | 0 | 0.0% |
| Total | 138 | 100.0% |
Housing Finances in Westport
Median Income by Occupancy in Westport
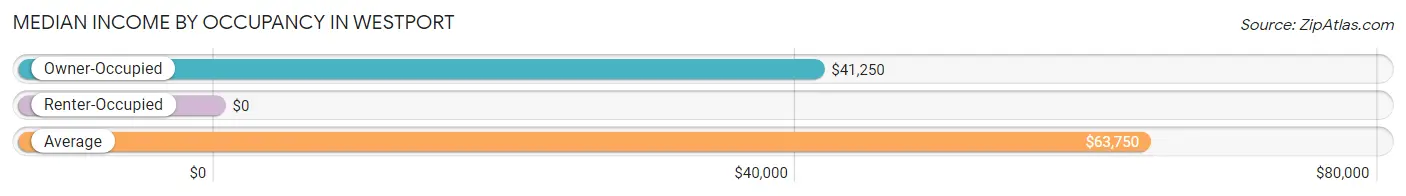
| Occupancy Type | # Households | Median Income |
| Owner-Occupied | 110 (79.7%) | $41,250 |
| Renter-Occupied | 28 (20.3%) | $0 |
| Average | 138 (100.0%) | $63,750 |
Occupancy by Householder Income Bracket in Westport
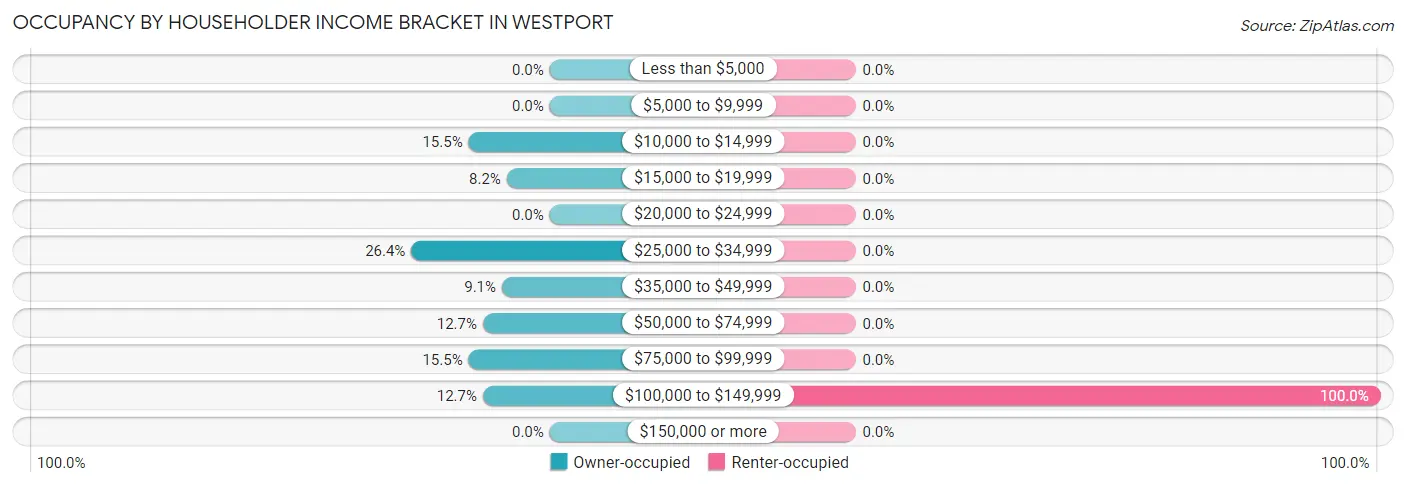
| Income Bracket | Owner-occupied | Renter-occupied |
| Less than $5,000 | 0 (0.0%) | 0 (0.0%) |
| $5,000 to $9,999 | 0 (0.0%) | 0 (0.0%) |
| $10,000 to $14,999 | 17 (15.4%) | 0 (0.0%) |
| $15,000 to $19,999 | 9 (8.2%) | 0 (0.0%) |
| $20,000 to $24,999 | 0 (0.0%) | 0 (0.0%) |
| $25,000 to $34,999 | 29 (26.4%) | 0 (0.0%) |
| $35,000 to $49,999 | 10 (9.1%) | 0 (0.0%) |
| $50,000 to $74,999 | 14 (12.7%) | 0 (0.0%) |
| $75,000 to $99,999 | 17 (15.4%) | 0 (0.0%) |
| $100,000 to $149,999 | 14 (12.7%) | 28 (100.0%) |
| $150,000 or more | 0 (0.0%) | 0 (0.0%) |
| Total | 110 (100.0%) | 28 (100.0%) |
Monthly Housing Cost Tiers in Westport
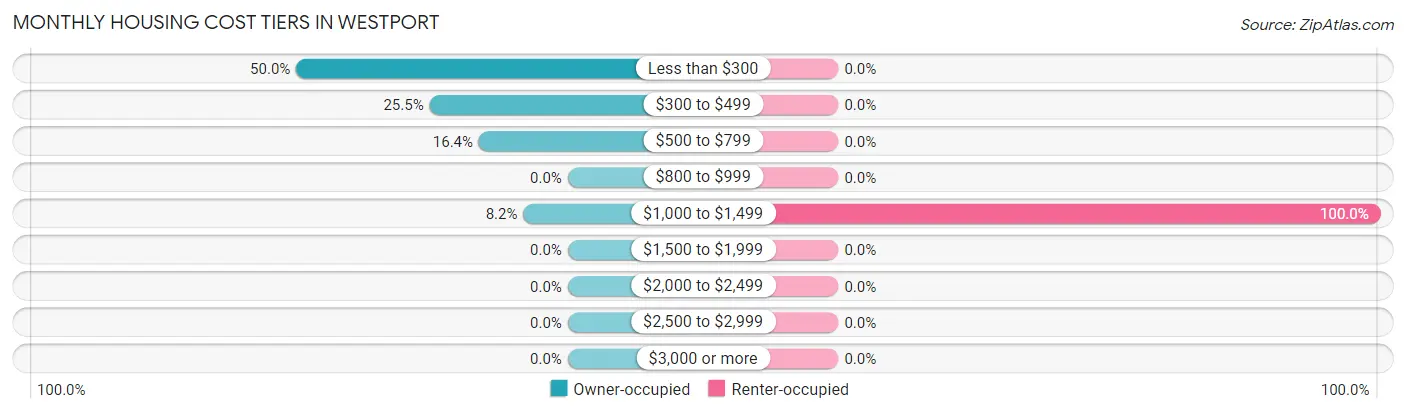
| Monthly Cost | Owner-occupied | Renter-occupied |
| Less than $300 | 55 (50.0%) | 0 (0.0%) |
| $300 to $499 | 28 (25.5%) | 0 (0.0%) |
| $500 to $799 | 18 (16.4%) | 0 (0.0%) |
| $800 to $999 | 0 (0.0%) | 0 (0.0%) |
| $1,000 to $1,499 | 9 (8.2%) | 28 (100.0%) |
| $1,500 to $1,999 | 0 (0.0%) | 0 (0.0%) |
| $2,000 to $2,499 | 0 (0.0%) | 0 (0.0%) |
| $2,500 to $2,999 | 0 (0.0%) | 0 (0.0%) |
| $3,000 or more | 0 (0.0%) | 0 (0.0%) |
| Total | 110 (100.0%) | 28 (100.0%) |
Physical Housing Characteristics in Westport
Housing Structures in Westport
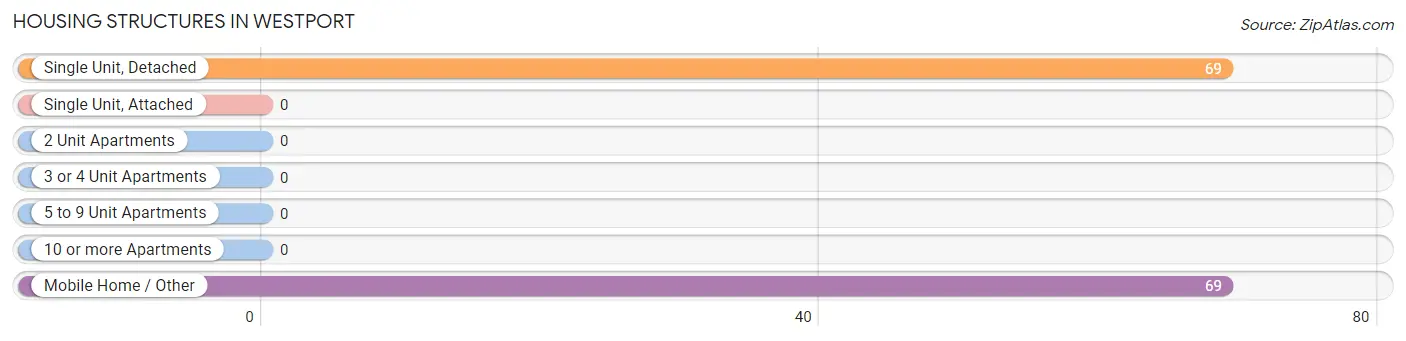
| Structure Type | # Housing Units | % Housing Units |
| Single Unit, Detached | 69 | 50.0% |
| Single Unit, Attached | 0 | 0.0% |
| 2 Unit Apartments | 0 | 0.0% |
| 3 or 4 Unit Apartments | 0 | 0.0% |
| 5 to 9 Unit Apartments | 0 | 0.0% |
| 10 or more Apartments | 0 | 0.0% |
| Mobile Home / Other | 69 | 50.0% |
| Total | 138 | 100.0% |
Housing Structures by Occupancy in Westport
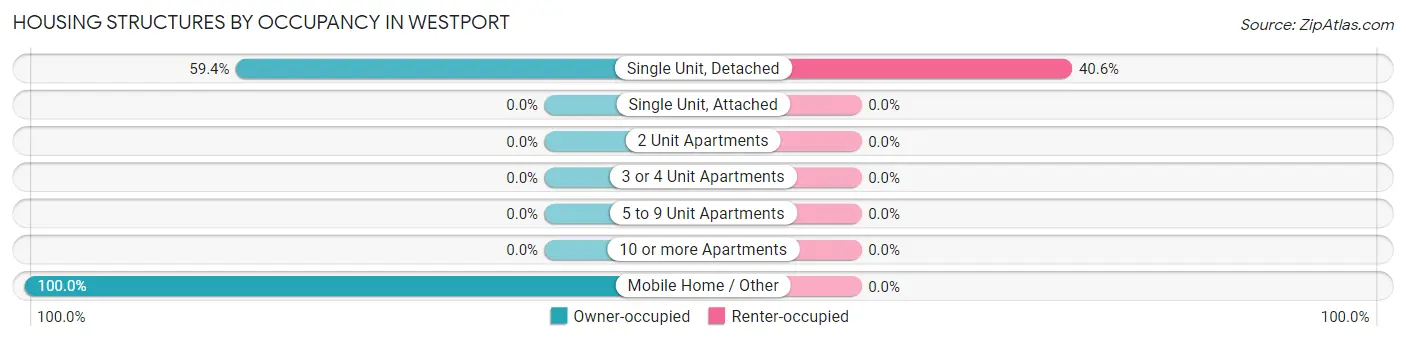
| Structure Type | Owner-occupied | Renter-occupied |
| Single Unit, Detached | 41 (59.4%) | 28 (40.6%) |
| Single Unit, Attached | 0 (0.0%) | 0 (0.0%) |
| 2 Unit Apartments | 0 (0.0%) | 0 (0.0%) |
| 3 or 4 Unit Apartments | 0 (0.0%) | 0 (0.0%) |
| 5 to 9 Unit Apartments | 0 (0.0%) | 0 (0.0%) |
| 10 or more Apartments | 0 (0.0%) | 0 (0.0%) |
| Mobile Home / Other | 69 (100.0%) | 0 (0.0%) |
| Total | 110 (79.7%) | 28 (20.3%) |
Housing Structures by Number of Rooms in Westport
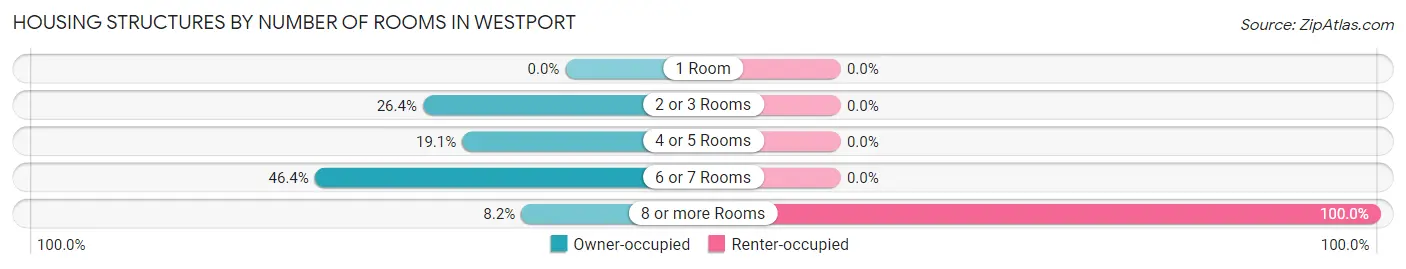
| Number of Rooms | Owner-occupied | Renter-occupied |
| 1 Room | 0 (0.0%) | 0 (0.0%) |
| 2 or 3 Rooms | 29 (26.4%) | 0 (0.0%) |
| 4 or 5 Rooms | 21 (19.1%) | 0 (0.0%) |
| 6 or 7 Rooms | 51 (46.4%) | 0 (0.0%) |
| 8 or more Rooms | 9 (8.2%) | 28 (100.0%) |
| Total | 110 (100.0%) | 28 (100.0%) |
Housing Structure by Heating Type in Westport
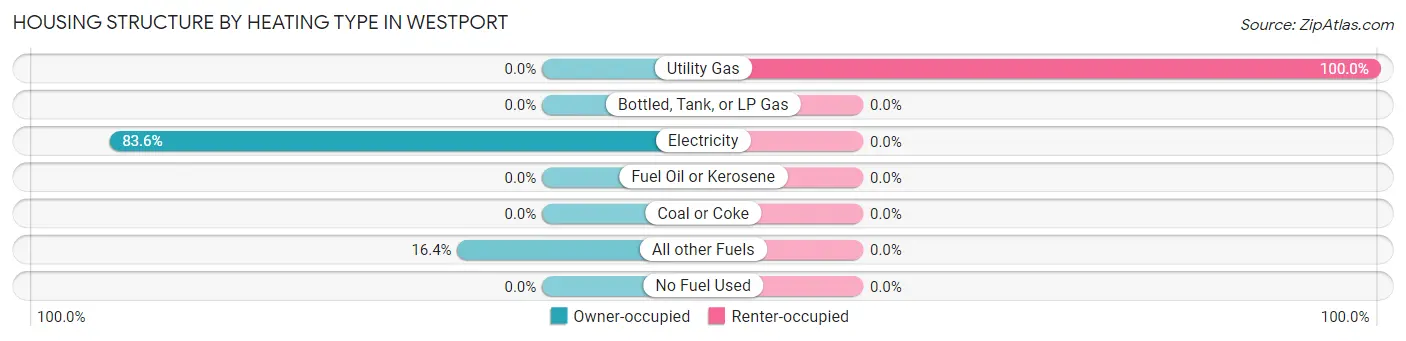
| Heating Type | Owner-occupied | Renter-occupied |
| Utility Gas | 0 (0.0%) | 28 (100.0%) |
| Bottled, Tank, or LP Gas | 0 (0.0%) | 0 (0.0%) |
| Electricity | 92 (83.6%) | 0 (0.0%) |
| Fuel Oil or Kerosene | 0 (0.0%) | 0 (0.0%) |
| Coal or Coke | 0 (0.0%) | 0 (0.0%) |
| All other Fuels | 18 (16.4%) | 0 (0.0%) |
| No Fuel Used | 0 (0.0%) | 0 (0.0%) |
| Total | 110 (100.0%) | 28 (100.0%) |
Household Vehicle Usage in Westport
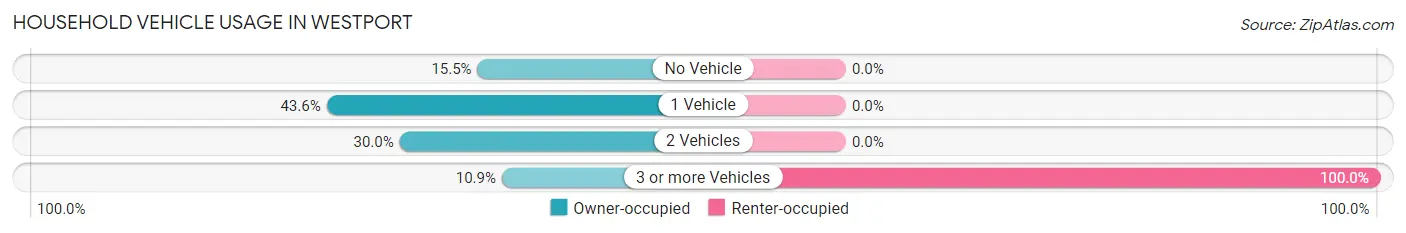
| Vehicles per Household | Owner-occupied | Renter-occupied |
| No Vehicle | 17 (15.4%) | 0 (0.0%) |
| 1 Vehicle | 48 (43.6%) | 0 (0.0%) |
| 2 Vehicles | 33 (30.0%) | 0 (0.0%) |
| 3 or more Vehicles | 12 (10.9%) | 28 (100.0%) |
| Total | 110 (100.0%) | 28 (100.0%) |
Real Estate & Mortgages in Westport
Real Estate and Mortgage Overview in Westport
| Characteristic | Without Mortgage | With Mortgage |
| Housing Units | 101 | 9 |
| Median Property Value | - | - |
| Median Household Income | $34,612 | $0 |
| Monthly Housing Costs | $287 | $0 |
| Real Estate Taxes | $481 | $0 |
Property Value by Mortgage Status in Westport
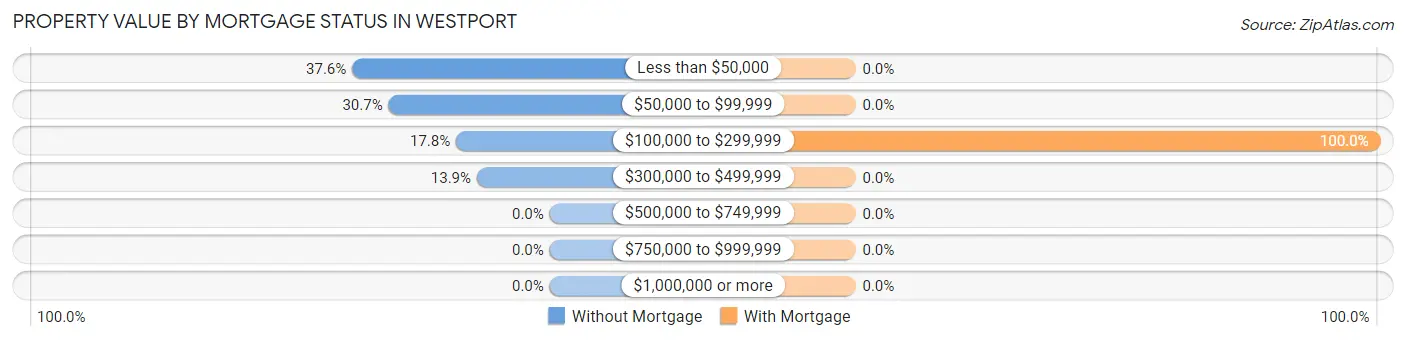
| Property Value | Without Mortgage | With Mortgage |
| Less than $50,000 | 38 (37.6%) | 0 (0.0%) |
| $50,000 to $99,999 | 31 (30.7%) | 0 (0.0%) |
| $100,000 to $299,999 | 18 (17.8%) | 9 (100.0%) |
| $300,000 to $499,999 | 14 (13.9%) | 0 (0.0%) |
| $500,000 to $749,999 | 0 (0.0%) | 0 (0.0%) |
| $750,000 to $999,999 | 0 (0.0%) | 0 (0.0%) |
| $1,000,000 or more | 0 (0.0%) | 0 (0.0%) |
| Total | 101 (100.0%) | 9 (100.0%) |
Household Income by Mortgage Status in Westport
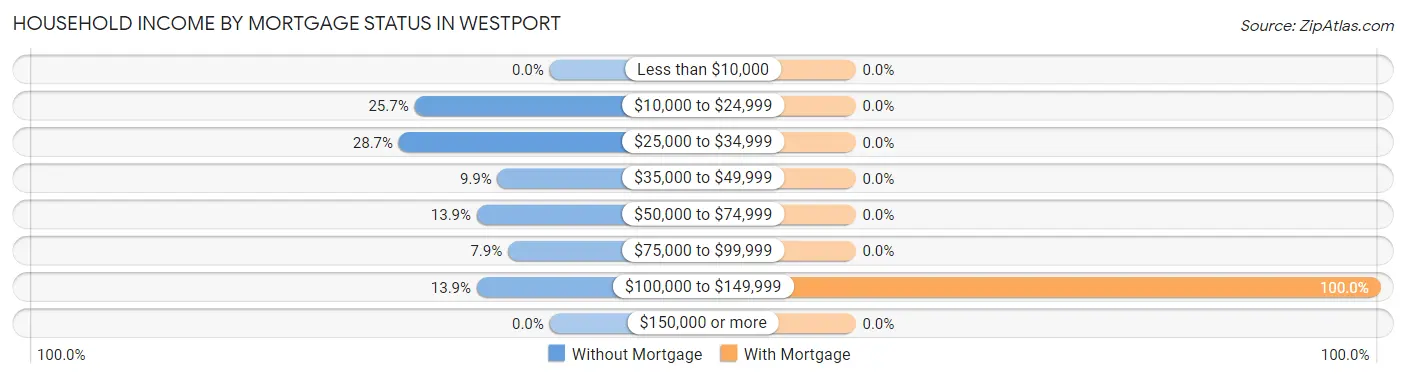
| Household Income | Without Mortgage | With Mortgage |
| Less than $10,000 | 0 (0.0%) | 0 (0.0%) |
| $10,000 to $24,999 | 26 (25.7%) | 0 (0.0%) |
| $25,000 to $34,999 | 29 (28.7%) | 0 (0.0%) |
| $35,000 to $49,999 | 10 (9.9%) | 0 (0.0%) |
| $50,000 to $74,999 | 14 (13.9%) | 0 (0.0%) |
| $75,000 to $99,999 | 8 (7.9%) | 0 (0.0%) |
| $100,000 to $149,999 | 14 (13.9%) | 9 (100.0%) |
| $150,000 or more | 0 (0.0%) | 0 (0.0%) |
| Total | 101 (100.0%) | 9 (100.0%) |
Property Value to Household Income Ratio in Westport
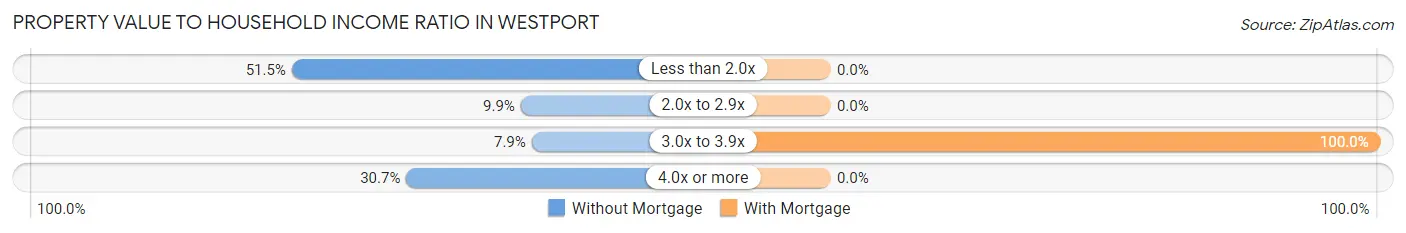
| Value-to-Income Ratio | Without Mortgage | With Mortgage |
| Less than 2.0x | 52 (51.5%) | 0 (0.0%) |
| 2.0x to 2.9x | 10 (9.9%) | 0 (0.0%) |
| 3.0x to 3.9x | 8 (7.9%) | 9 (100.0%) |
| 4.0x or more | 31 (30.7%) | 0 (0.0%) |
| Total | 101 (100.0%) | 9 (100.0%) |
Real Estate Taxes by Mortgage Status in Westport

| Property Taxes | Without Mortgage | With Mortgage |
| Less than $800 | 69 (68.3%) | 0 (0.0%) |
| $800 to $1,499 | 28 (27.7%) | 9 (100.0%) |
| $800 to $1,499 | 4 (4.0%) | 0 (0.0%) |
| Total | 101 (100.0%) | 9 (100.0%) |
Health & Disability in Westport
Health Insurance Coverage by Age in Westport
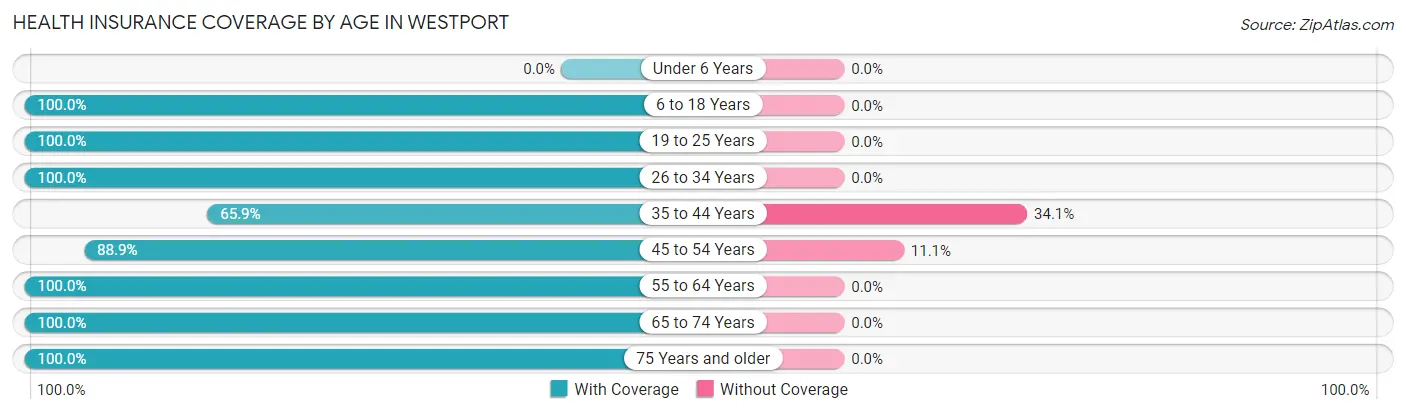
| Age Bracket | With Coverage | Without Coverage |
| Under 6 Years | 0 (0.0%) | 0 (0.0%) |
| 6 to 18 Years | 5 (100.0%) | 0 (0.0%) |
| 19 to 25 Years | 83 (100.0%) | 0 (0.0%) |
| 26 to 34 Years | 29 (100.0%) | 0 (0.0%) |
| 35 to 44 Years | 29 (65.9%) | 15 (34.1%) |
| 45 to 54 Years | 80 (88.9%) | 10 (11.1%) |
| 55 to 64 Years | 12 (100.0%) | 0 (0.0%) |
| 65 to 74 Years | 60 (100.0%) | 0 (0.0%) |
| 75 Years and older | 44 (100.0%) | 0 (0.0%) |
| Total | 342 (93.2%) | 25 (6.8%) |
Health Insurance Coverage by Citizenship Status in Westport

| Citizenship Status | With Coverage | Without Coverage |
| Native Born | 0 (0.0%) | 0 (0.0%) |
| Foreign Born, Citizen | 5 (100.0%) | 0 (0.0%) |
| Foreign Born, not a Citizen | 83 (100.0%) | 0 (0.0%) |
Health Insurance Coverage by Household Income in Westport
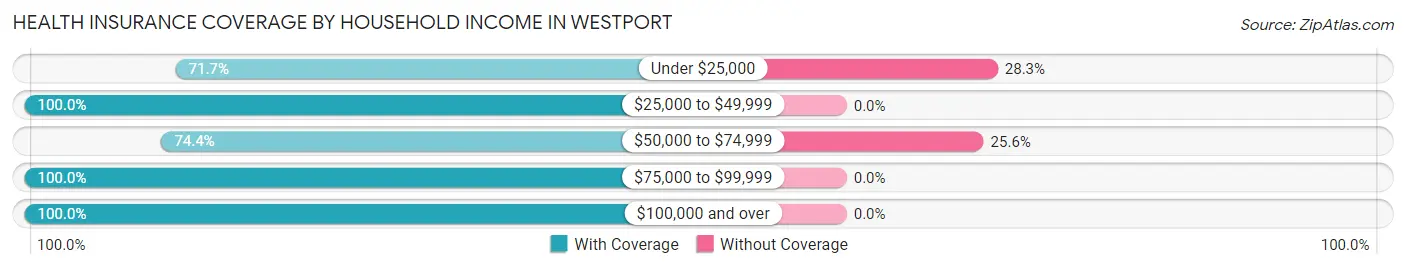
| Household Income | With Coverage | Without Coverage |
| Under $25,000 | 38 (71.7%) | 15 (28.3%) |
| $25,000 to $49,999 | 47 (100.0%) | 0 (0.0%) |
| $50,000 to $74,999 | 29 (74.4%) | 10 (25.6%) |
| $75,000 to $99,999 | 32 (100.0%) | 0 (0.0%) |
| $100,000 and over | 196 (100.0%) | 0 (0.0%) |
Public vs Private Health Insurance Coverage by Age in Westport
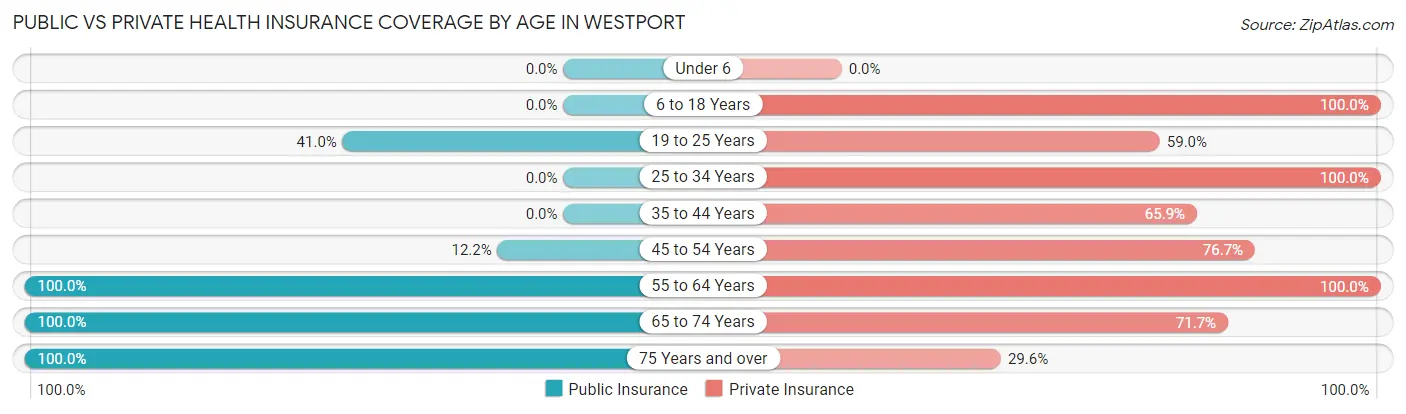
| Age Bracket | Public Insurance | Private Insurance |
| Under 6 | 0 (0.0%) | 0 (0.0%) |
| 6 to 18 Years | 0 (0.0%) | 5 (100.0%) |
| 19 to 25 Years | 34 (41.0%) | 49 (59.0%) |
| 25 to 34 Years | 0 (0.0%) | 29 (100.0%) |
| 35 to 44 Years | 0 (0.0%) | 29 (65.9%) |
| 45 to 54 Years | 11 (12.2%) | 69 (76.7%) |
| 55 to 64 Years | 12 (100.0%) | 12 (100.0%) |
| 65 to 74 Years | 60 (100.0%) | 43 (71.7%) |
| 75 Years and over | 44 (100.0%) | 13 (29.5%) |
| Total | 161 (43.9%) | 249 (67.8%) |
Disability Status by Sex by Age in Westport
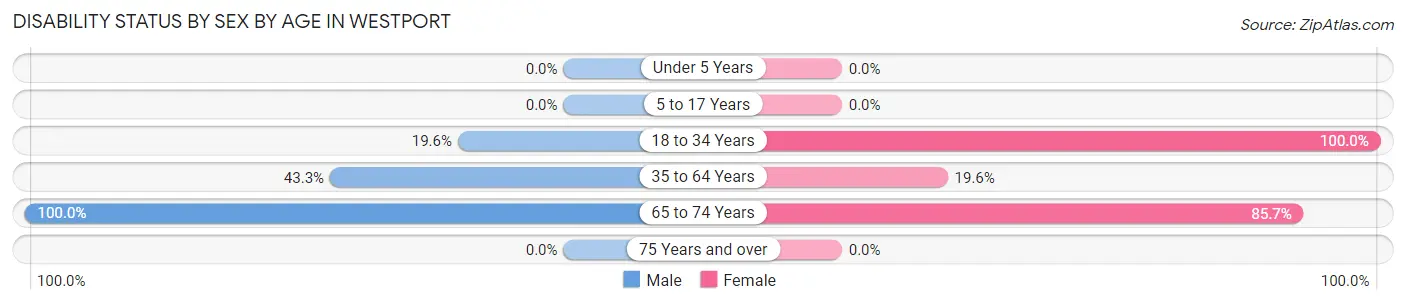
| Age Bracket | Male | Female |
| Under 5 Years | 0 (0.0%) | 0 (0.0%) |
| 5 to 17 Years | 0 (0.0%) | 0 (0.0%) |
| 18 to 34 Years | 19 (19.6%) | 15 (100.0%) |
| 35 to 64 Years | 39 (43.3%) | 11 (19.6%) |
| 65 to 74 Years | 18 (100.0%) | 36 (85.7%) |
| 75 Years and over | 0 (0.0%) | 0 (0.0%) |
Disability Class by Sex by Age in Westport
Disability Class: Hearing Difficulty
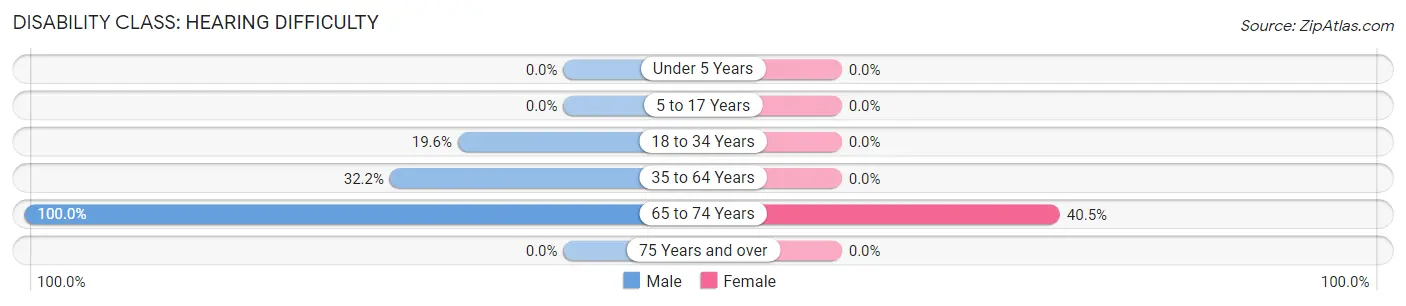
| Age Bracket | Male | Female |
| Under 5 Years | 0 (0.0%) | 0 (0.0%) |
| 5 to 17 Years | 0 (0.0%) | 0 (0.0%) |
| 18 to 34 Years | 19 (19.6%) | 0 (0.0%) |
| 35 to 64 Years | 29 (32.2%) | 0 (0.0%) |
| 65 to 74 Years | 18 (100.0%) | 17 (40.5%) |
| 75 Years and over | 0 (0.0%) | 0 (0.0%) |
Disability Class: Vision Difficulty
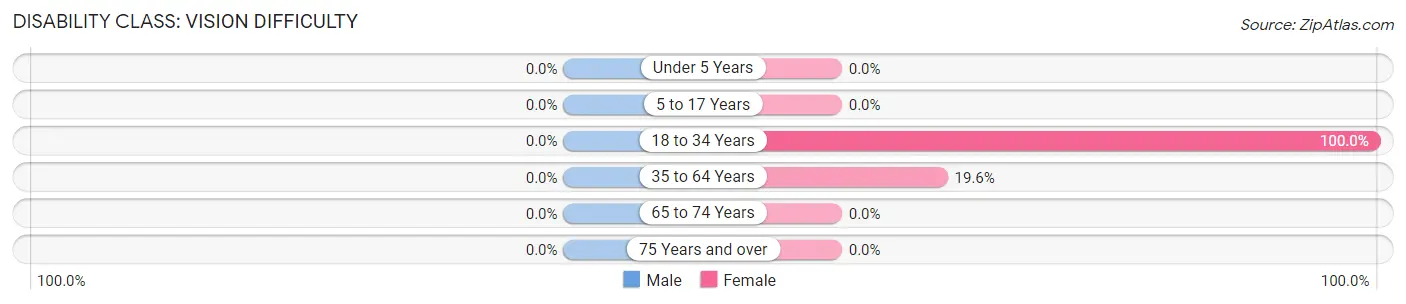
| Age Bracket | Male | Female |
| Under 5 Years | 0 (0.0%) | 0 (0.0%) |
| 5 to 17 Years | 0 (0.0%) | 0 (0.0%) |
| 18 to 34 Years | 0 (0.0%) | 15 (100.0%) |
| 35 to 64 Years | 0 (0.0%) | 11 (19.6%) |
| 65 to 74 Years | 0 (0.0%) | 0 (0.0%) |
| 75 Years and over | 0 (0.0%) | 0 (0.0%) |
Disability Class: Cognitive Difficulty

| Age Bracket | Male | Female |
| 5 to 17 Years | 0 (0.0%) | 0 (0.0%) |
| 18 to 34 Years | 19 (19.6%) | 15 (100.0%) |
| 35 to 64 Years | 10 (11.1%) | 11 (19.6%) |
| 65 to 74 Years | 0 (0.0%) | 0 (0.0%) |
| 75 Years and over | 0 (0.0%) | 0 (0.0%) |
Disability Class: Ambulatory Difficulty
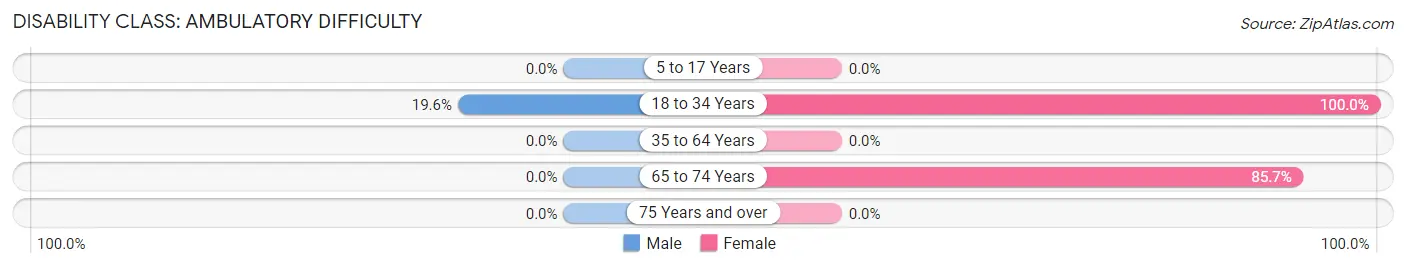
| Age Bracket | Male | Female |
| 5 to 17 Years | 0 (0.0%) | 0 (0.0%) |
| 18 to 34 Years | 19 (19.6%) | 15 (100.0%) |
| 35 to 64 Years | 0 (0.0%) | 0 (0.0%) |
| 65 to 74 Years | 0 (0.0%) | 36 (85.7%) |
| 75 Years and over | 0 (0.0%) | 0 (0.0%) |
Disability Class: Self-Care Difficulty

| Age Bracket | Male | Female |
| 5 to 17 Years | 0 (0.0%) | 0 (0.0%) |
| 18 to 34 Years | 19 (19.6%) | 15 (100.0%) |
| 35 to 64 Years | 0 (0.0%) | 0 (0.0%) |
| 65 to 74 Years | 0 (0.0%) | 17 (40.5%) |
| 75 Years and over | 0 (0.0%) | 0 (0.0%) |
Technology Access in Westport
Computing Device Access in Westport
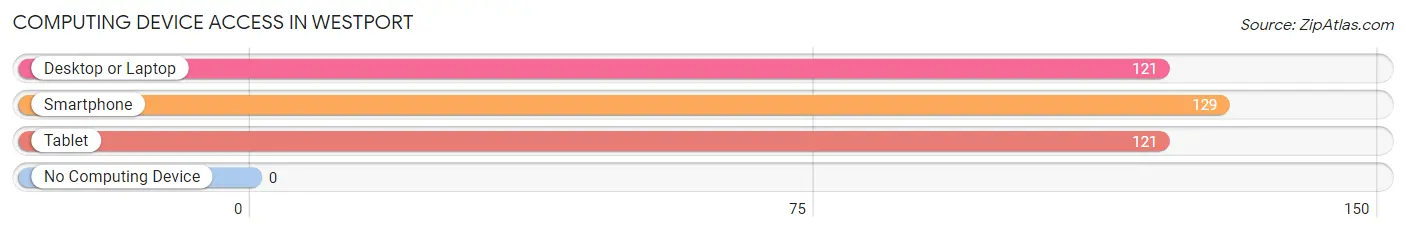
| Device Type | # Households | % Households |
| Desktop or Laptop | 121 | 87.7% |
| Smartphone | 129 | 93.5% |
| Tablet | 121 | 87.7% |
| No Computing Device | 0 | 0.0% |
| Total | 138 | 100.0% |
Internet Access in Westport
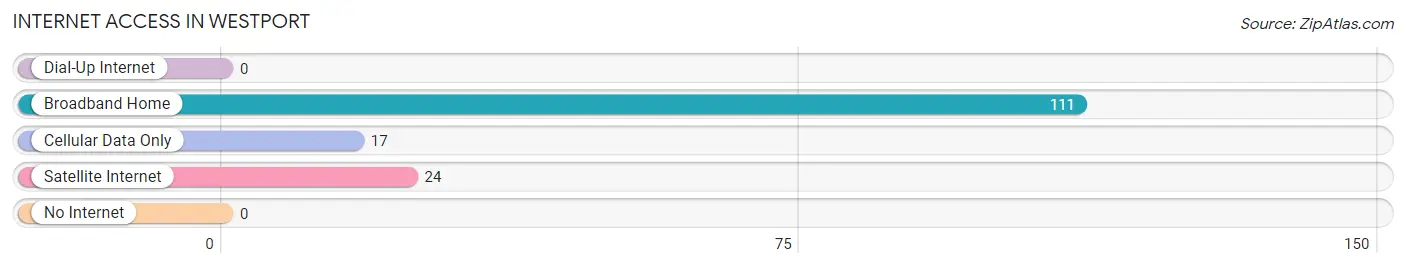
| Internet Type | # Households | % Households |
| Dial-Up Internet | 0 | 0.0% |
| Broadband Home | 111 | 80.4% |
| Cellular Data Only | 17 | 12.3% |
| Satellite Internet | 24 | 17.4% |
| No Internet | 0 | 0.0% |
| Total | 138 | 100.0% |
Westport Summary
Westport, Oregon is a small unincorporated community located in Lincoln County, Oregon. It is situated on the Oregon Coast, approximately 20 miles south of Newport and 40 miles north of Florence. The community is located on the Alsea Bay, which is part of the larger Yaquina Bay estuary. Westport is a popular destination for fishing, crabbing, and other recreational activities.
History
Westport was first settled in the late 1800s by a group of settlers from the Midwest. The settlers were attracted to the area due to its abundance of natural resources, including timber, fish, and wildlife. The first post office in Westport was established in 1891.
In the early 1900s, Westport was a thriving fishing and logging community. The town was home to several canneries, which processed fish and other seafood for export. The town also had a sawmill, which provided lumber for the local economy.
In the 1950s, Westport began to decline as the logging industry moved away from the area. The canneries also closed, leaving the town without a major industry. In the 1970s, Westport began to experience a resurgence as a tourist destination. The town is now home to several restaurants, shops, and other businesses catering to tourists.
Geography
Westport is located on the Oregon Coast, approximately 20 miles south of Newport and 40 miles north of Florence. The town is situated on the Alsea Bay, which is part of the larger Yaquina Bay estuary. The bay is home to a variety of wildlife, including seals, sea lions, and various species of fish.
The town is surrounded by forests and mountains, providing a scenic backdrop for visitors. The nearby Siletz River is a popular destination for fishing and other recreational activities.
Economy
Westport’s economy is largely based on tourism. The town is home to several restaurants, shops, and other businesses catering to visitors. The town is also home to several charter fishing companies, which offer guided fishing trips in the bay and nearby rivers.
Westport is also home to several commercial fishing operations, which harvest a variety of seafood, including crab, shrimp, and other species. The town is also home to several oyster farms, which produce oysters for local consumption and export.
Demographics
As of the 2010 census, Westport had a population of 1,093. The town is predominantly white, with approximately 90% of the population identifying as such. The median household income in Westport is $41,250, and the median home value is $179,000.
Westport is a small, close-knit community. The town is home to several churches, a library, and a community center. The town also hosts several annual events, including a Fourth of July parade and a crab festival.
Common Questions
What is Per Capita Income in Westport?
Per Capita income in Westport is $28,945.
What is the Median Family Income in Westport?
Median Family Income in Westport is $78,750.
What is the Median Household income in Westport?
Median Household Income in Westport is $63,750.
What is Inequality or Gini Index in Westport?
Inequality or Gini Index in Westport is 0.38.
What is the Total Population of Westport?
Total Population of Westport is 367.
What is the Total Male Population of Westport?
Total Male Population of Westport is 209.
What is the Total Female Population of Westport?
Total Female Population of Westport is 158.
What is the Ratio of Males per 100 Females in Westport?
There are 132.28 Males per 100 Females in Westport.
What is the Ratio of Females per 100 Males in Westport?
There are 75.60 Females per 100 Males in Westport.
What is the Median Population Age in Westport?
Median Population Age in Westport is 46.5 Years.
What is the Average Family Size in Westport
Average Family Size in Westport is 3.1 People.
What is the Average Household Size in Westport
Average Household Size in Westport is 2.7 People.
How Large is the Labor Force in Westport?
There are 187 People in the Labor Forcein in Westport.
What is the Percentage of People in the Labor Force in Westport?
51.0% of People are in the Labor Force in Westport.